Sistemas de Gobernanza y Vulnerabilidad Urbana en Ciudades Latinoamericanas
Congreso Mexicano de Investigación en Cambio climático
Patricia Romero-LankaoResilient and Sustainable Cities NCAR
México, Octubre 2011

Outline Mitigation & adaptation:
Entry points
Challenges
I. Research highlights from Resilient & Sustainable Cities
I. Processes of urban change
II. Socioeconomic drivers & mitigation
III. Determinants of vulnerability & adaptation
Valle Dorado y Chalco Sep. 2009 y 2010

Research highlights Resilient and Sustainable Cities
I. Processes of urban change
II. Socioeconomic drivers & mitigation
III. Determinants of vulnerability & adaptation
Valle Dorado y Chalco Sep. 2009 y 2010
Region Proportion of total population living in urban
areas (percent)
Urban population rate of change (percent change per
year)
2010 2020 2030 2010–2020
2020–2030
World total 50.5 54.4 59.0 1.81 1.6 North America 82.1 84.6 86.7 1.16 0.92 Sub-Saharan Africa 37.2 42.2 47.9 3.51 3.17 Asia/Pacific 41.4 46.5 52.3 2.2 1.88 Latin America and the Caribbean 79.6 82.6 84.9
1.29 0.94
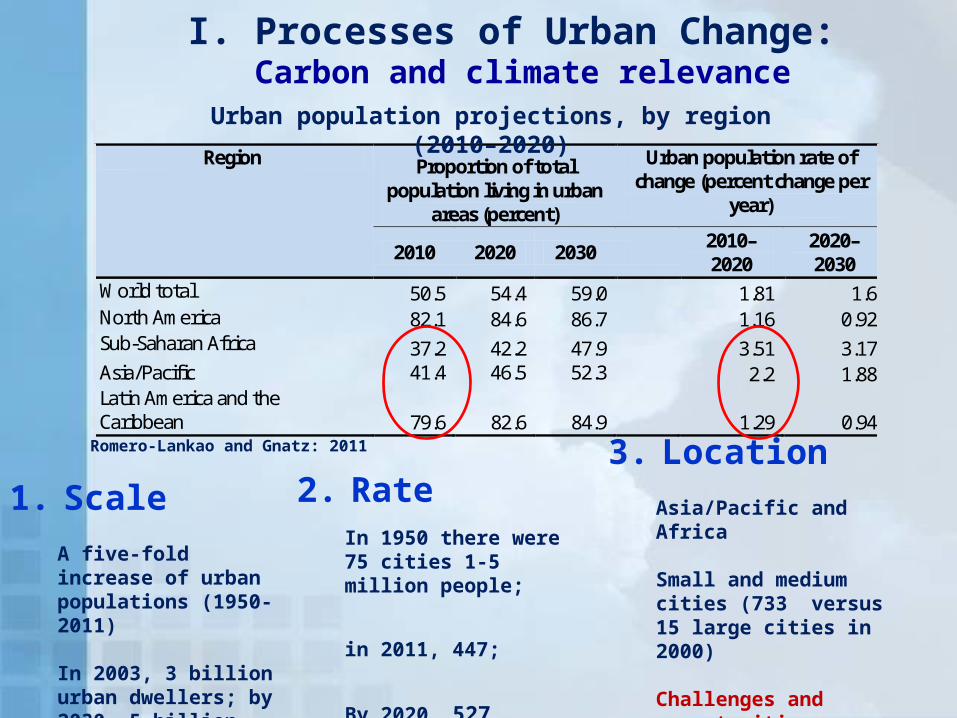
I. Processes of Urban Change: Carbon and climate relevance
1. ScaleA five-fold increase of urban populations (1950-2011)
In 2003, 3 billion urban dwellers; by 2030, 5 billion
2. RateIn 1950 there were 75 cities 1-5 million people;
in 2011, 447;
By 2020, 527
3. Location Asia/Pacific and Africa
Small and medium cities (733 versus 15 large cities in 2000)
Challenges and opportunities
Romero-Lankao and Gnatz: 2011
Urban population projections, by region (2010–2020)

Research highlights Resilient and Sustainable Cities
I. Processes of urban change
II. Socioeconomic drivers & mitigation
III. Determinants of vulnerability & adaptation
Valle Dorado y Chalco Sep. 2009 y 2010

The wealthiest/largest cities don't necessarily have the largest carbon
footprints. Why?
Source: Romero Lankao (2008)
Bag
uio
Chi
ang
Mai
Oxf
ord
Dha
ka
San
Die
go
N.
Man
dela
Kol
kata
Bar
celo
na
Dis
tric
t of
Col
umbi
a
Rio
de
Jane
iro
Aus
tin
Del
hi
São
Pau
lo
Dur
ban
Cap
e T
own
Joha
nnes
burg
Sto
khol
m
Tor
onto
Seo
ul
Lond
on
Mex
ico
City
Bei
jing
Sha
ngha
i
New
Yor
k C
ity
Tok
yo
Los
Ang
eles
0
50
100
150
200
250
Total carbon emissions by city
M of tonnes of CO2 e.
19.7 M. of people
10.8 M. of people
15.2 M. of people
18. M. of people

The wealthiest/largest cities don't necessarily have the largest carbon footprints. Why?
Baguio
Chia
ng M
ai
Kolk
ata
São P
aulo
Delh
i
Dhaka
Rio
de J
aneir
o
Barc
elo
na
Mexi
co C
ity
Seoul
Sto
kholm
N. M
andela
Tokyo
Johannesb
urg
Durb
an
London
Cape T
ow
n
Oxf
ord
Beijin
g
New
York
Cit
y
Shanghai
Toro
nto
San D
iego
Los
Angele
s D
istr
ict
of
Co-
lum
bia
Aust
in
0
5
10
15
20
25
Carbon emissions per capita
tonnes of CO2 equivalent

II. Multiple factors shape urban GHG emissions
• Poly-centric
• Mono-centric
Economic base and GDP per capita
Spatial structure (form) and population size/density (1% increase in urban density results in a 1.25% decrease in emissions)
Energy use intensity
Transportation mode share 1% increase in public transport results in a 0.15% decrease in emissions!
City’s latitude & energy endowments
Currently drafting a paper from a more ambitious effort: 225 cities
Multidisciplinary project
Database covering 84 cities
STIRPAT formula (instead of multiplicative IPAT)
Estimates elasticity of each driver
Tests four theories
Sources: Romero Lankao, Tribbia and Nychka (2009);
Bertaud (2009)

Climate Responses at the City Level
•Transport (56.8%)
•Waste (24.6%)
•Water (14.9%)
Mitigation(94.3%)
•Basin mgmt. (45.2%)
•Agriculture (30.5%)
•Monitoring (18.2%)
Adaptation(5.1%)
•Water culture
•Awareness raising
•Integrated waste mgmt.
Outreach(0.6%)
Example Climate Action Plan of DF (Budget 59,551.00 Millions of Mexican Pesos)
Many cities are already responding
Focus on mitigation
Climate related to local priorities (e.g., energy, air pollution)
A piecemeal approach
Inventory protocols (e.g., ICLEI)
limited information about
Individual and collective impact
Specially when responses go beyond
municipal buildings and infrastructure systems or
involve behavioural change Source: Romero-Lankao 2011 Journal of Urban European Planning (accepted)

Mitigation: four modes of governing at the urban level
•The most common
•Too much attention on the government itself may detract resources from the key emitters and broader mitigation challenges
Self-regulation
Enabling
• Provision of infrastructure and services holds a high potential where municipal governments owns or control infrastructure networks and where basic needs have been met
Provision
•Because of their targeted and enforceable nature, they can be very effective
•Yet these are also the least popular and therefore the most difficult to sustain politically
Regulation
Source: Romero-Lankao 2011 Journal of Urban European Planning (accepted)
• Relatively low upfront economic and political costs; transparency and legitimacy of urban governance• Restricted to those who are willing to participate, and cannot be enforced.

Research highlights Resilient and Sustainable Cities
I. Processes of urban change
II. Socioeconomic drivers & mitigation
III. Determinants of vulnerability & adaptation
Valle Dorado y Chalco Sep. 2009 y 2010

Source: A. de Sherbinin and Romero Lankao (2011).
The hazard risk of each city represents a cumulative score based on risk of cyclones, flooding, landslides and drought

Adaptation responses and urban vulnerability• Individuals, CBOs and authorities are
responding
• Yet, too few cities have developed coherent adaptation strategies, This is the result of
– International structure of incentives (focus on mitigation, e.g., CDM)
– local hindering factors: policy and governance frameworks; socio-environmental and cultural inertia
– Lack of detailed risk assessments
– Lack of understanding of how adaptation can be integrated into disaster risk reduction and development agenda (land use planning, water access, sanitation and housing)
Bogota and Mexico City
Source: Romero-Lankao 2011 Journal of Urban European Planning (accepted)

Mega-basin of Mexico City:Long term changes to climate-hydrological conditions
• Climate relevant to local hydrology
• Alternation of wet years/floods with drought episodes
• Water system induced • Profound transformation of
basins’ hydrological cycle
• High levels of energy consumption and GHG
• Negative impacts on livelihoods in basins providing and receiving water
Electricity used to pump water from Cutzamala equivalent to the energy consumed by city of Puebla (5 mill)Romero Lankao 2010;
Romero Lankao and Günther (2011 accepted)

Long term: State-centered system of water management and use
• Top-down decision making
• Fragmented institutional structures and participation
• Paradox: abundant water, yet “2nd order scarcity”
• Unequal access to/payment for services
• Negative health implications of pollution & poor quality water sanitation
• Subsidence
• Propensity to flood
Subsidence
Water for the wealthy; Water for the poor
65%6%
3%
6%
5%6%
8%
1%
0%
Flood
Frost
Heat-w ave
Storm
Rain
Hail-storm
Wild-f ire
Drought
Cold-w ave
Hydro-meteorological Events Resulting in Disasters (1980-2006)
Romero Lankao 2010; Romero Lankao and Günther (2011 accepted)

Precipitation and social vulnerabilityrain intensity (20+ mm/½ hr event), 1979-2003
Graizbord 2010
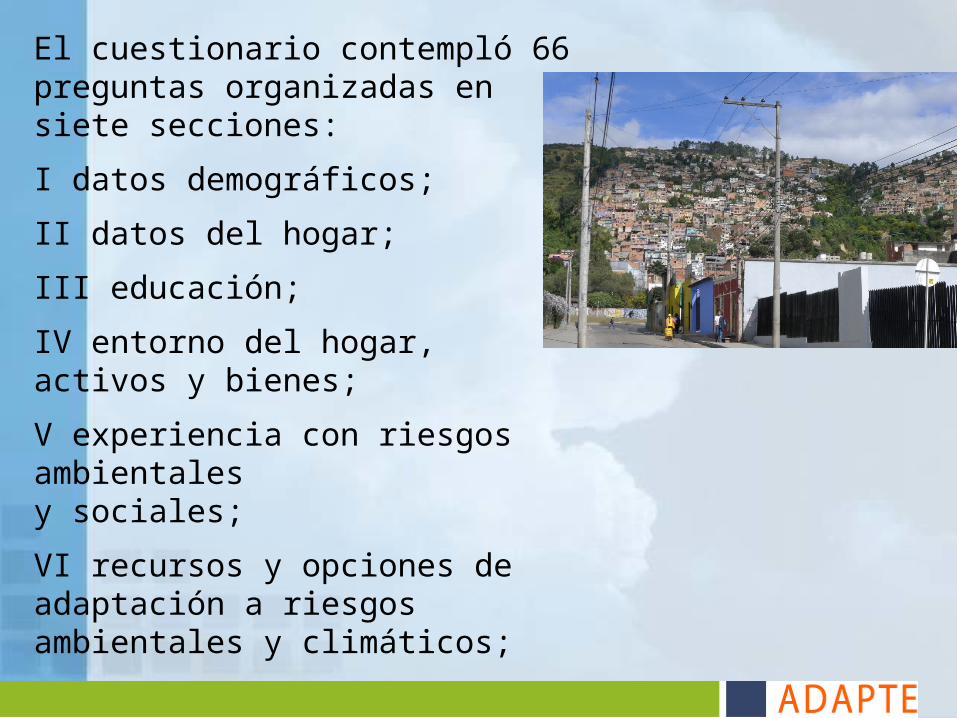
ADAPTE: segunda etapa
El cuestionario contempló 66 preguntas organizadas en siete secciones:
I datos demográficos;
II datos del hogar;
III educación;
IV entorno del hogar, activos y bienes;
V experiencia con riesgos ambientales y sociales;
VI recursos y opciones de adaptación a riesgos ambientales y climáticos;
VII estrategias para enfrentar amenazas, sección


Vulnerabilidad urbana: desde las ciudades
Fuente: ADAPTE 2011
Eventos ambientales más importantes en las cuatro ciudades
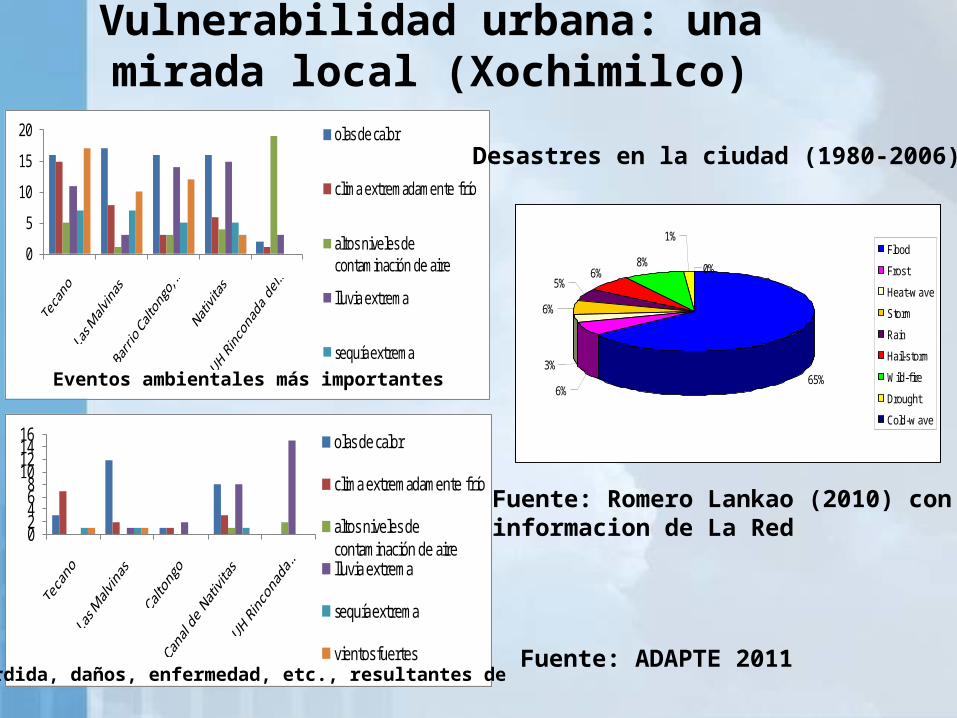
Vulnerabilidad urbana: una mirada local (Xochimilco)
0
5
10
15
20 olas de calor
clima extremadamente frío
altos niveles de contaminación de aire
lluvia extrema
sequía extremaEventos ambientales más importantes
02468
10121416 olas de calor
clima extremadamente frío
altos niveles de contaminación de airelluvia extrema
sequía extrema
vientos fuertesPérdida, daños, enfermedad, etc., resultantes de
Fuente: ADAPTE 2011
65%6%
3%
6%
5%6%
8%
1%
0%
Flood
Frost
Heat-w ave
Storm
Rain
Hail-storm
Wild-f ire
Drought
Cold-w ave
Desastres en la ciudad (1980-2006)
Fuente: Romero Lankao (2010) con informacion de La Red

0
5
10
15
20
25 olas de calor
clima extremadamente fríoaltos niveles de contaminación de airelluvia extrema
sequía extrema
vientos fuertes
ninguno
¿Para cuál de los siguientes eventos cuenta su barrio con
un sistema de respuesta temprana?
Fuente: ADAPTE 2011
02468
1012141618
periódico
TV
Internet
radio
vecinos o familiares
ninguno
¿Cuáles de los siguientes medios usa para
informarse sobre estas emergencias?

Three sets of options
• Develop communities’ capacities to anticipate and respond (e.g., emergency responses)
• Address the underlying processes of socio-environmental deterioration that reduce cities’ ability to attenuate hazard impacts
• Engage with the socioeconomic and institutional factors underlying poverty and social exclusion that contribute to differentiated capacities to adapt (e.g., access to land and housing)
Xochimilco from Mexico City’s South

Thank you!RS-Cities
Exploring key intersections between urban development and environment
http://www.ral.ucar.edu/csap/themes/rs-cities.php
Recommended