Simulation of Kanban-based scheduling for
Systems of Systems
By Alexey Tregubov, Jo Ann Lane
University of Southern California
Los Angeles, CA

Outline • Part I. Kanban-based scheduling in SoS
• SoS environments
• KSS principles
• Part II. Simulation model
• Organizational model
• Governance model
• Work items networks model
• Inputs and outputs
• Part III. Experiments and simulation results

Part I
System of Systems • Acknowledged and directed SoS:
• Three main organizational levels:
• Executive/Stakeholder management
• System Engineering team
• Product/Domain teams
Directed Acknowledged
System “a”
System “n”
System “b”
SoSE Team
System “a”
System “n”
System “b”
SoSE Team

Capabilities to products flow
C1 C2 C3 C4
R1 R2 R3 R4 R6R5
Network Team
Patient Management Team
Database Team
Cap
abili
tie
s R
eq
uir
em
en
ts
Wo
rk it
em
s
of
Pro
du
ct/D
om
ain
T
eam
s
T3 T4 T12 T2 T5
T7T9
T11T13 T1 T6 T8T10
Agg
rega
tio
n n
od
es
De
com
po
siti
on
leve
ls
C3: Telemetry Integration
C4: Performance Upgrade
R4: Performance upgrade in related systems
...R5: Integration with Patient Management Sys.
R6: Data migration
...
Database Team
T8: DB Bug-fix...
Patient Management Team
...T7: Integration Module
...
Overview In details

Health care SoS example

System of Systems’ observed issues
• Ineffective communication between different organizational levels
• Lack of visibility (status of SoS capabilities)
• Inefficient use of engineering resources
• Time wasted on context switching (multitasking overhead)
• Valuable capabilities are not delivered first or incomplete capabilities delivered:
• value delivery cadence is not satisfactory
• stakeholders cannot effectively update priorities when values change

Key measures for Kanban research
• Value delivered over time
• Schedule and effort
• Efficiency measures:
• Number of suspended/interrupted tasks
• Number of disruptive tasks
• E-factor = Uninterrupted hours / Hours present
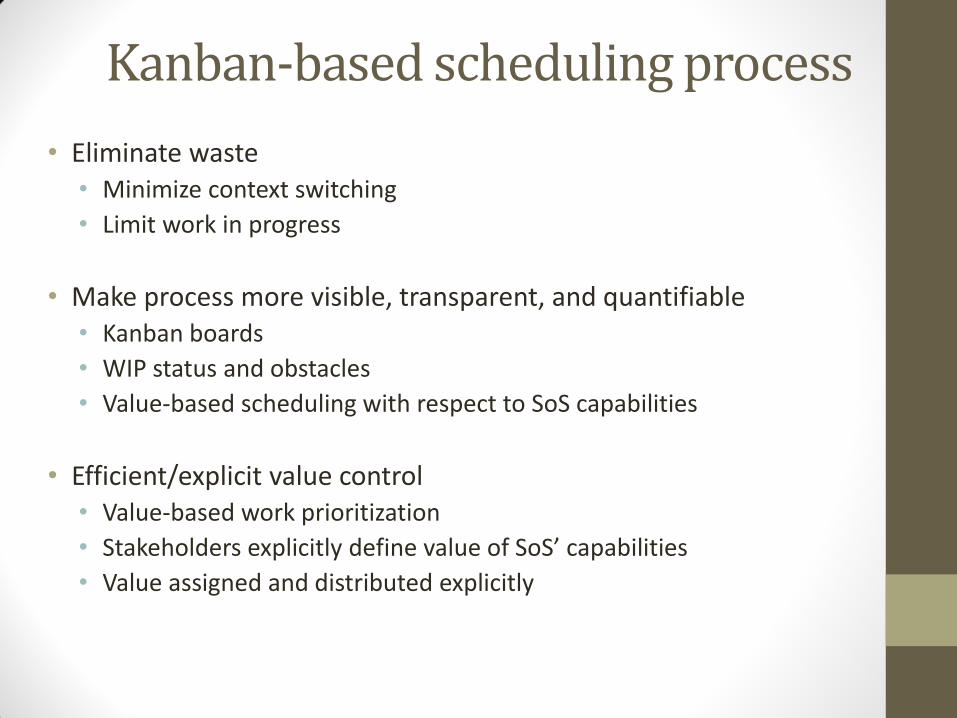
Kanban-based scheduling process
• Eliminate waste • Minimize context switching
• Limit work in progress
• Make process more visible, transparent, and quantifiable • Kanban boards
• WIP status and obstacles
• Value-based scheduling with respect to SoS capabilities
• Efficient/explicit value control • Value-based work prioritization
• Stakeholders explicitly define value of SoS’ capabilities
• Value assigned and distributed explicitly

Executive/Stakeholder Management
Strategic planningCapability prioritization
Kanban board
TO DO:©C3: Telemetry Integration ©C4: Perfms. upgrades
WIP:©C1: Database monitoring S/W©C2: Network diagnosing S/W
DONE:©C0:Diagnostics S/W
System EngineeringAnalyze needs and capabilities.Refine Capabilities Develop requirements Allocate requirements
Form cross organization / cross disciplinary teams.Cross product and specialty engineering
Kanban board
TO DO:©R4: ...©R5: …
WIP:©R2: ...©R3: ...©R6: ...
DONE:©R1: ...
Patient Management SystemProduct SE
Identify SW featuresDecompose requirements into features
Allocate features to SW development teamsFeatures integration
Product/Domain Engineering
Pro
du
ct team
User SupportCustomer relations
Initial triage
Kanban board
TO DO:©B6: Wrong data in DB©B7: IU bug in...
WIP:©B4:Wrong date reported©B3: ...©B2: ...
DONE:©B1: Wrong midnight time format
Do
main
team
Users
Kanban board
TO DO:©T4: ...©T5: …
WIP:©T2: ...©T3: ...©T6: ...
DONE:©T1: ...
SW Development Team
Kanban board
TO DO:©T6: ...©T7: ...
WIP:©T5: ...©T4: ...
DONE:©T1: …©T2: ...
SW task development
Do
main
team
s
Kanban board
TO DO:©T4: ...©T5: …
WIP:©T2: ...©T3: ...©T6: ...
DONE:©T1: ...
Database Domain
Network Domain Kanban board
TO DO:©T4: ...©T5: …
WIP:©T2: ...©T3: ...©T6: ...
DONE:©T1: ...
Work Flow

Part II
Simulation model • Agent based model
• Three aspects of the model:
• Organizational model – structure of product and domain teams, SE team, stakeholders, etc.
• Governance model – defines agents’ behavior:
• scheduling algorithms
• queues management
• resource multitasking
• WIs and resource outsourcing policies
• WI network model – all WI and their relationships, defines:
• Work decomposition
• Value flow

Inputs and outputs
• Inputs:
• Organizational structure
• Governance model configuration
• Event scenario – events that describe how WIs originate and evolve in the simulation model.
• Outputs:
• Value delivered over time
• Number of work items in progress
• Number of fully complete & delivered capabilities over time
• Inefficiently used effort (waste of effort):
• Effort spent on context switching between tasks / multitasking

Modeling context switching • Reimmersion time:
• Modeling the reimmersion time
• Constant time: 1 hour/ 1 timeframe
• Variable reimmersion time based on
• Task complexity
• Assignment to another resource
• Length of suspension

Part III
Experiments and results
• Experiment 1 • Scheduling algorithms: KSS, LIFO, value-neutral
• Compares • value delivered over time
• total schedule and effort
• Suspended/interrupted work
• Experiment 2 • Scheduling algorithms: KSS, LIFO, FIFO, value-neutral
• Compares • value delivered over time
• Capability completeness
• Experiment 3 • KSS scheduling
• Shows impact of multitasking and work interruptions

Experiment 1
• 10 constituent teams (20 members each)
• + SoS system engineering team
• 20 new capabilities at start
• Each capability unfolds into 30 requirements on average
• Each requirement unfolds into 9 tasks on average
• Each tasks takes 3-15 days

Results: experiment 1
0
10000
20000
30000
40000
50000
60000
0 2 4 6 8 10 12 14 16 18 20 22 24 26 28 30 32 34 36 38 40 42 44 46 48 50 52 54 56 58 60 62 64 66 68 70 72 74 76 78 80
Value
Time
KSS
Value-neutral (random selection)
LIFO

Results: experiment 1
0
5
10
15
20
25
30
35
0 2 4 6 8 10 12 14 16 18 20 22 24 26 28 30 32 34 36 38 40 42 44 46 48 50 52 54 56 58 60 62 64 66 68 70 72 74 76 78 80
Number of Suspended Tasks
Time
KSS
Value-neutral (randomselection)
LIFO

Results: experiment 1
61
62
63
64
65
66
67
68
69
70
71
KSS Value-neutral (random selection) LIFO
Total schedule (calendar days)

Results: experiment 1
440
460
480
500
520
540
560
580
600
KSS Value-neutral (random selection) LIFO
Total effort (person-days)
Effort required if there are no interruptions
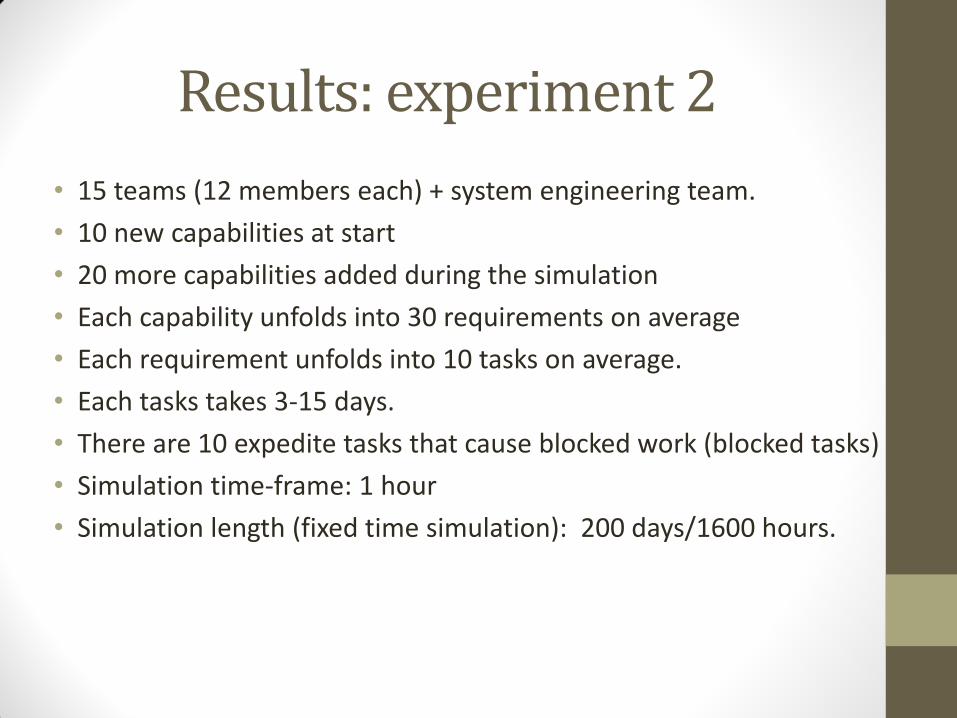
Results: experiment 2
• 15 teams (12 members each) + system engineering team.
• 10 new capabilities at start
• 20 more capabilities added during the simulation
• Each capability unfolds into 30 requirements on average
• Each requirement unfolds into 10 tasks on average.
• Each tasks takes 3-15 days.
• There are 10 expedite tasks that cause blocked work (blocked tasks)
• Simulation time-frame: 1 hour
• Simulation length (fixed time simulation): 200 days/1600 hours.
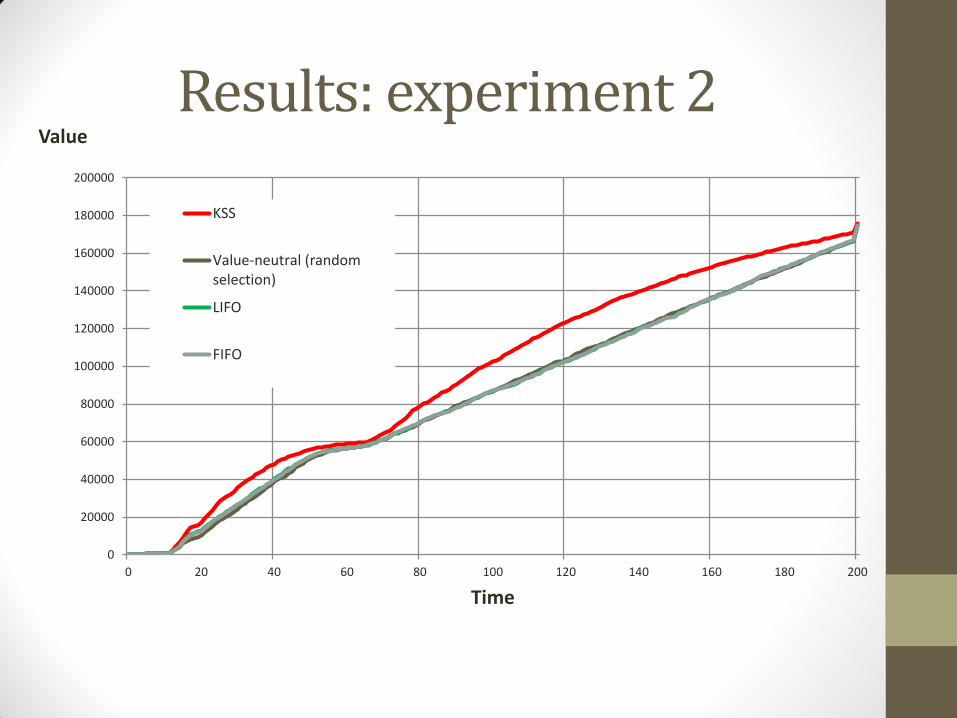
Results: experiment 2
0
20000
40000
60000
80000
100000
120000
140000
160000
180000
200000
0 20 40 60 80 100 120 140 160 180 200
Value
Time
KSS
Value-neutral (randomselection)
LIFO
FIFO

Results: experiment 2
0
5
10
15
20
25
30
KSS Value-neutral (randomselection)
LIFO FIFO
Number of 100% complete capabilities

Results: experiment 3
• We generated five groups of experiments with 100 experiments in each group. Each groups had a different number of WIs but the same organizational structure (5+1 teams). Each team had 15 resources.
• In the first group, we had 1000 WIs, in the second we had 2000 WIs, and so on.
• Nominal effort required for each WI was in interval 1-5 person-days.
• 100 disruptive WIs were introduced in the simulation.

Impact of interruptions in scale experiment 3
0
100
200
300
400
500
600
1000 WIs 2000 WIs 3000 WIs 4000 WIs 5000 WIs
Effort spent on context switching (person-days)

Conclusion and future work
Impact of Kanban process with respect to key measures
Measure
Value More value delivered over time
Effort and schedule
• Save effort on unnecessary multitasking (in simulation it reduces effort spent on context switching by 40%) • Improve capability delivery cadence
Efficiency • Reduce unnecessary interruptions and multitasking • Focus on completing capabilities (avoiding situations when everything is 90% complete and nothing delivered) • Reduce number of suspended/interrupted tasks (in simulation it reduces number of suspended tasks by 2-3 times) • Reduces the E-factor

Future work
Next steps:
• Pilot the Kanban scheduling with several organizations
• Fine-tune the simulation using empirical data and organizations’ feedback
For additional information and piloting the KSS contact:
• Alexey Tregubov [email protected]

Q&A
• Questions?

References
• Tregubov, A. and Lane, J.A., 2015. Simulation of Kanban-based Scheduling for Systems of Systems: Initial Results. Procedia Computer Science, 44, pp.224-233.
• DeMarco, T. and Lister, T., 2013. Peopleware: productive projects and teams. Addison-Wesley.
• Boehm, B. and Turner, R., 2003. Balancing Agility and Discipline: A Guide for the Perplexed, Portable Documents. Addison-Wesley Professional.
• Dzubak, C.M., 2008. Multitasking: The good, the bad, and the unknown. The Journal of the Association for the Tutoring Profession, 1(2), pp.1-12.
• Jett, Q.R. and George, J.M., 2003. Work interrupted: A closer look at the role of interruptions in organizational life. Academy of Management Review, 28(3), pp.494-507.

Contacts
• Alexey Tregubov:
• http://atregubov.com
Recommended