Presented by:
Justin Willette
Simulating System
Reliability using
Monte Carlo Simulation
15 October 2013
1
Table of Contents
• System Reliability
• Reliability Block Diagrams
• Structure Function
• Calculating System Reliability
• Simulating System Reliability
• Simulation Demonstration
2
• Systems are comprised of multiple components specifically arranged for a design.
• If component reliabilities are known, or reasonably estimated, the reliability of the system can be estimated with certain confidence.
• This estimate is based on the component configuration, laws of probability, and key assumptions.
System Reliability
3

• The first step in estimating the system reliability is to create a Reliability Block Diagram (RBD)
• A RBD is a graphical representation of the components of a system and how they are related to each other in the system
Reliability Block Diagrams
4
• Each complete RBD is unique to its design
• RBD’s can be in several different arrangements
- Series - Parallel -Complex
B
A
D
C
Reliability Block Diagrams
5
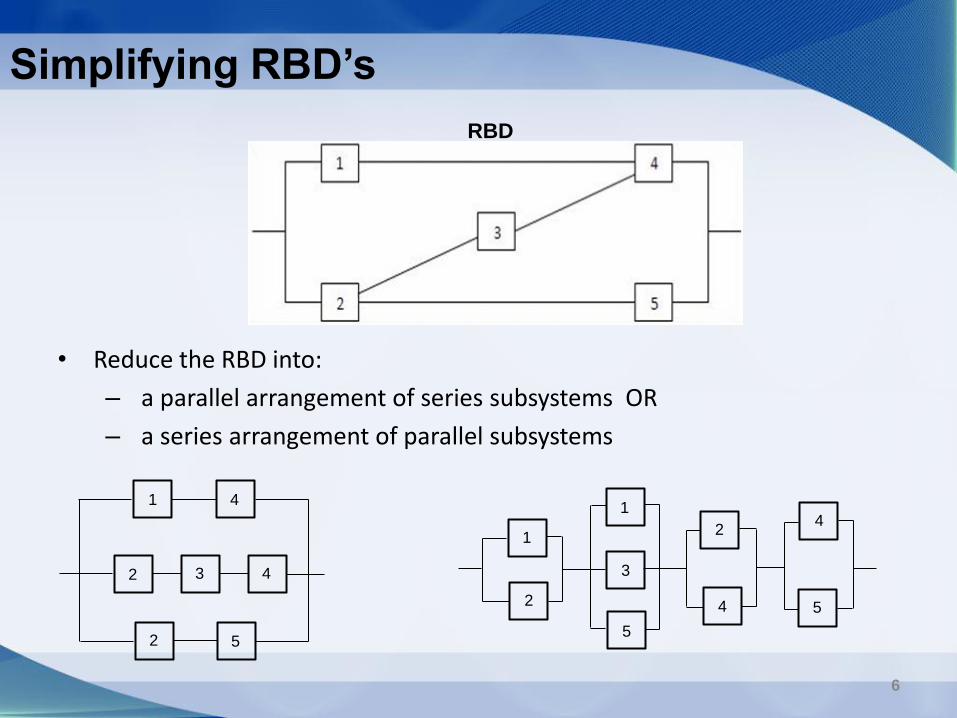
• Reduce the RBD into:
– a parallel arrangement of series subsystems OR
– a series arrangement of parallel subsystems
RBD
1
3
4
2
2 5
4
1
2
1
3
5
4
2 4
5
Simplifying RBD’s
6
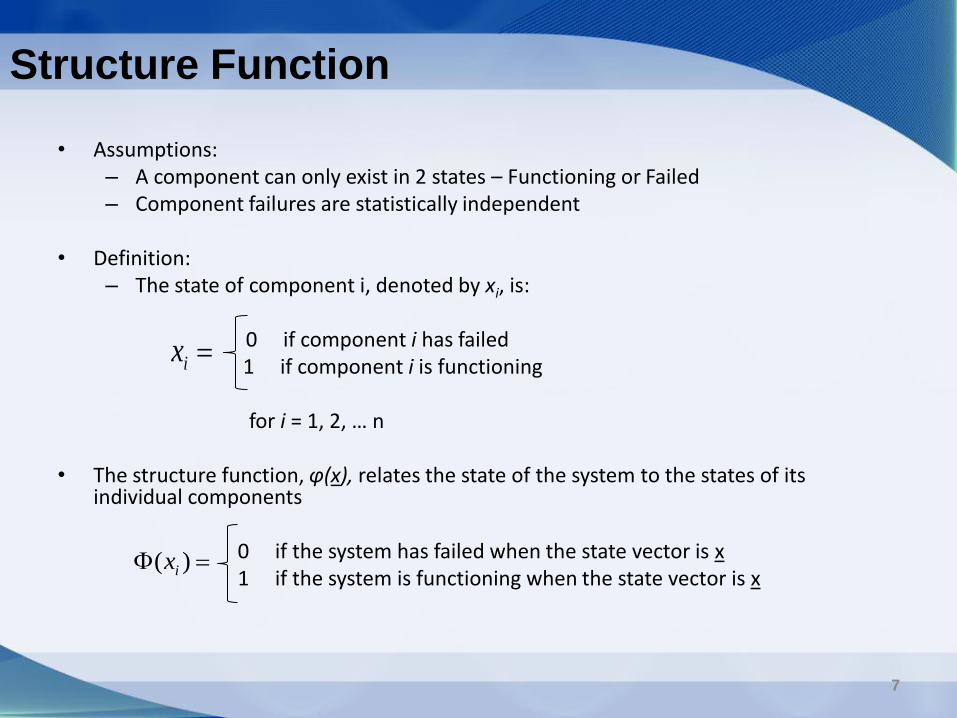
• Assumptions: – A component can only exist in 2 states – Functioning or Failed – Component failures are statistically independent
• Definition:
– The state of component i, denoted by xi, is:
0 if component i has failed 1 if component i is functioning for i = 1, 2, … n • The structure function, φ(x), relates the state of the system to the states of its
individual components
0 if the system has failed when the state vector is x 1 if the system is functioning when the state vector is x
ix
)( ix
Structure Function
7
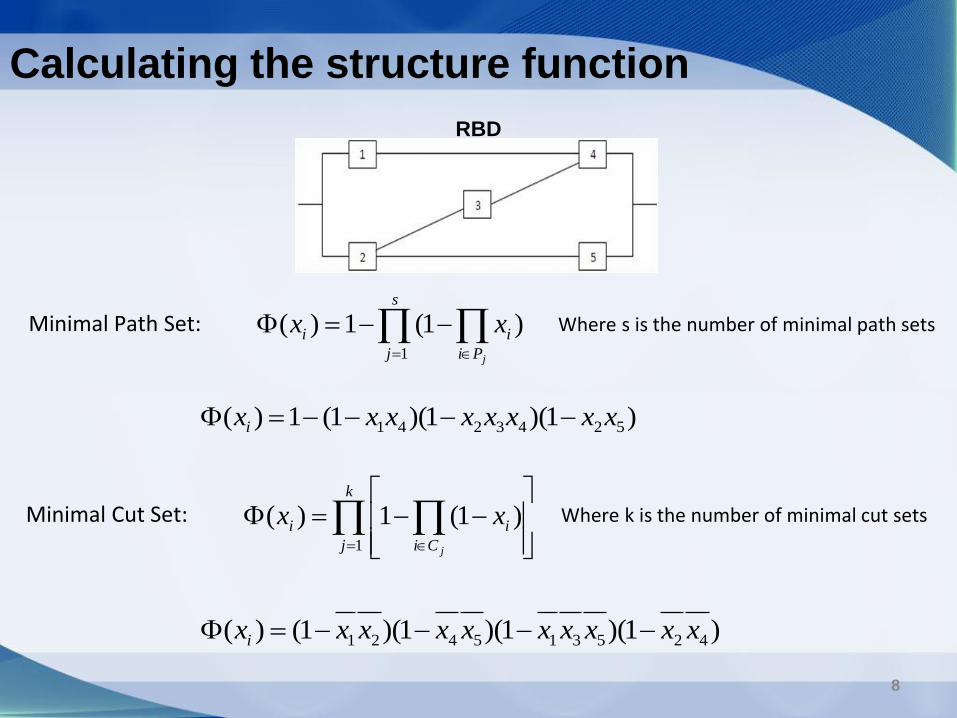
Minimal Path Set: Where s is the number of minimal path sets
)1(1)(1
s
j Pi
ii
j
xx
RBD
Minimal Cut Set: Where k is the number of minimal cut sets
k
j Ci
ii
j
xx1
)1(1)(
)1)(1)(1(1)( 5243241 xxxxxxxxi
)1)(1)(1)(1()( 425315421 xxxxxxxxxxi
Calculating the structure function
8
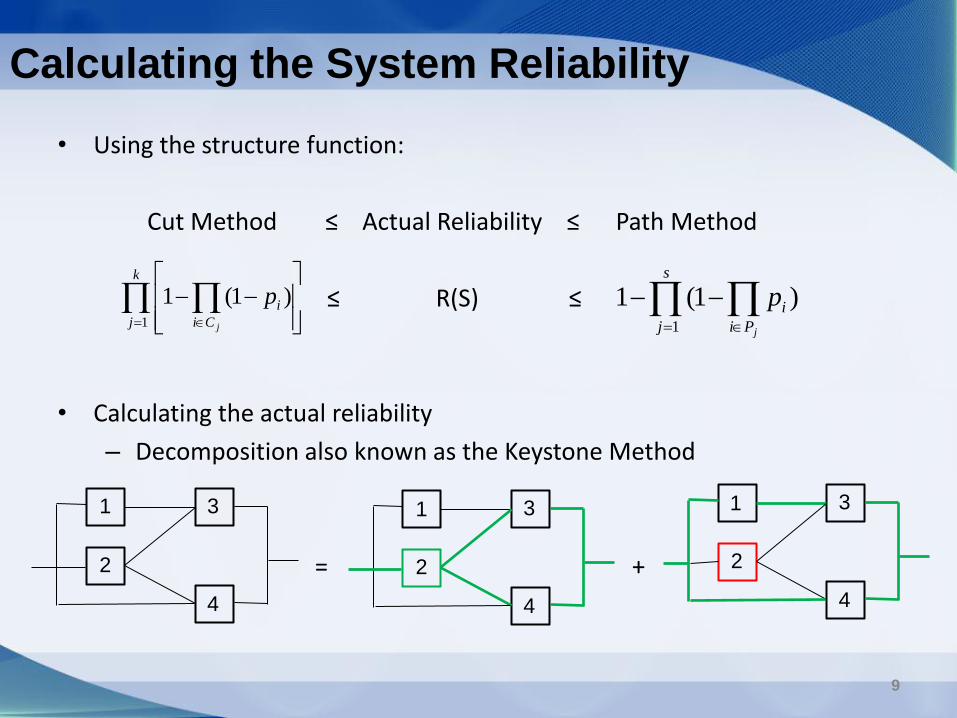
• Using the structure function:
Cut Method ≤ Actual Reliability ≤ Path Method
≤ R(S) ≤
• Calculating the actual reliability
– Decomposition also known as the Keystone Method
= +
k
j Ci
i
j
p1
)1(1 )1(11
s
j Pi
i
j
p
1
2
3
4
1
2
3
4
1
2
3
4
Calculating the System Reliability
9
• Software
– Standard Microsoft Excel
– VBA programming within Excel
– Reliasoft
– Raptor
Simulating System Reliability
10
• Benefits of using VBA code
– Reuse
– More precise calculations
– Less likelihood of errors
– Simple interface with user
– Ability to run a set number of iterations
– Ability to lock cells from the user
– Faster simulations
– Can run on any computer with Microsoft Office
Simulating System Reliability
11
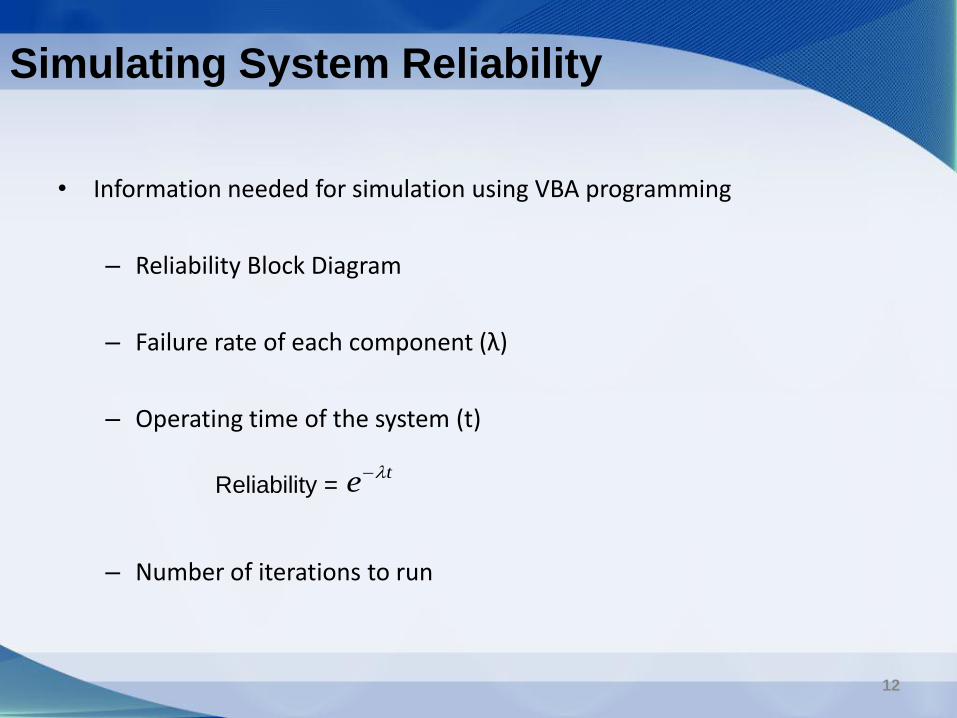
• Information needed for simulation using VBA programming
– Reliability Block Diagram
– Failure rate of each component (λ)
– Operating time of the system (t)
– Number of iterations to run
Reliability = te
Simulating System Reliability
12
Simulation demonstration in Excel
Simulating System Reliability
13
• VBA Programming reference
Helpful Reference
14
• Simulating reliability of a system is preferred to demonstrating reliability by testing
• Reliability Block Diagrams are specific to each system and must be considered in order to produce accurate reliability simulations
• Reliability estimates are based on the component configuration, laws of probability, and key assumptions
• Monte Carlo simulation in Excel is one way to predict a reasonable estimate of the system reliability
• Using VBA Code is an effective way to run simulations in Excel
Conclusion
15

Back-up Slides
16
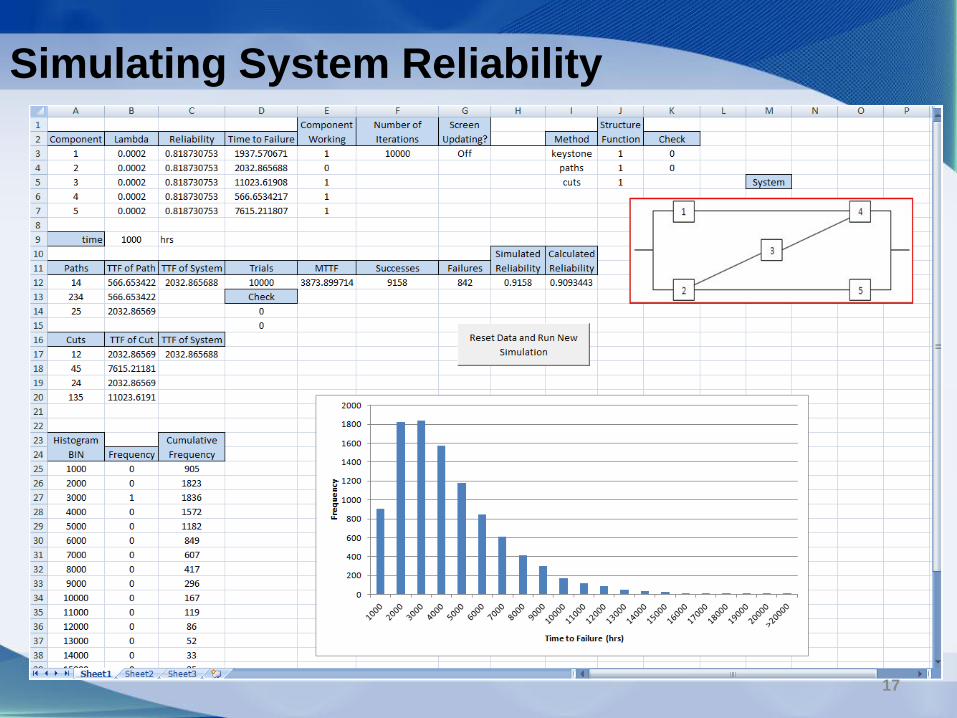
Simulating System Reliability
17

Start button
Simulating System Reliability
18
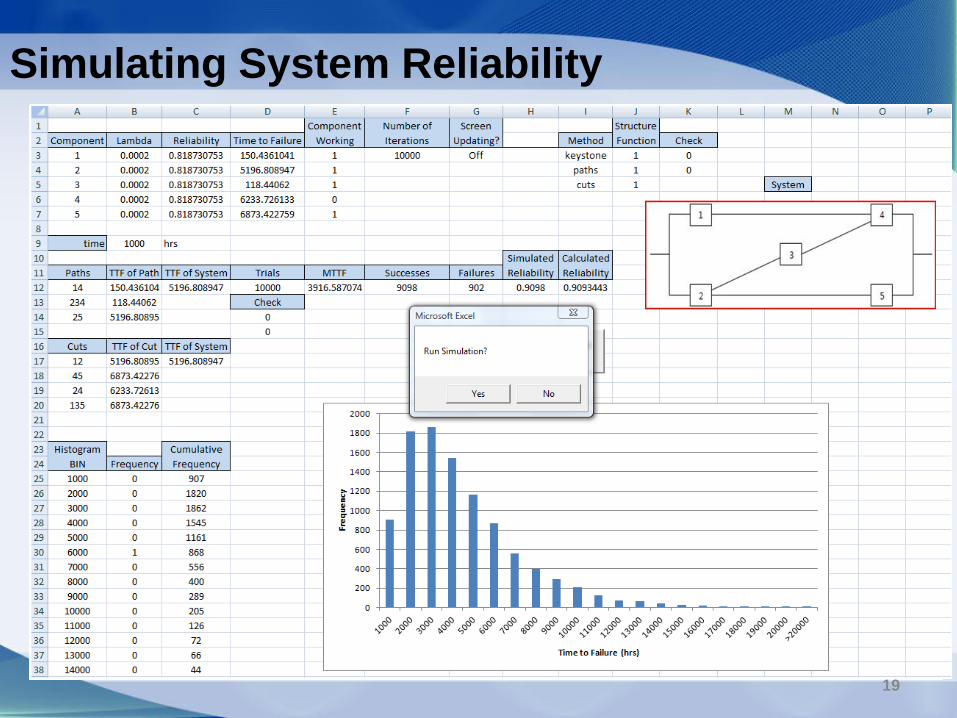
Simulating System Reliability
19
Simulating System Reliability
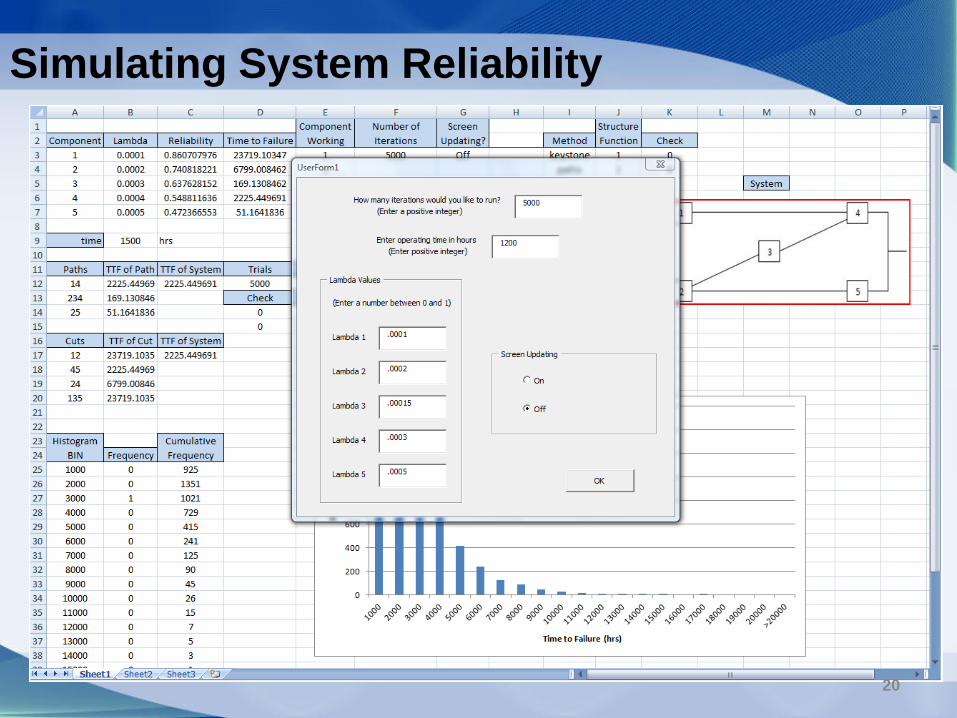
20
Simulating System Reliability
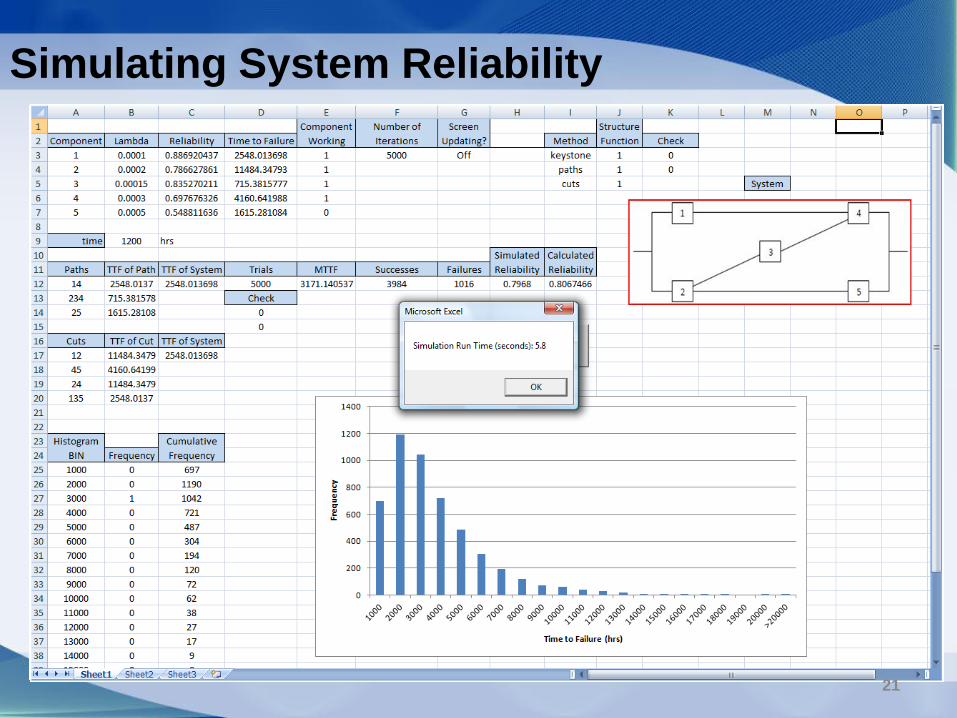
21
Simulating System Reliability
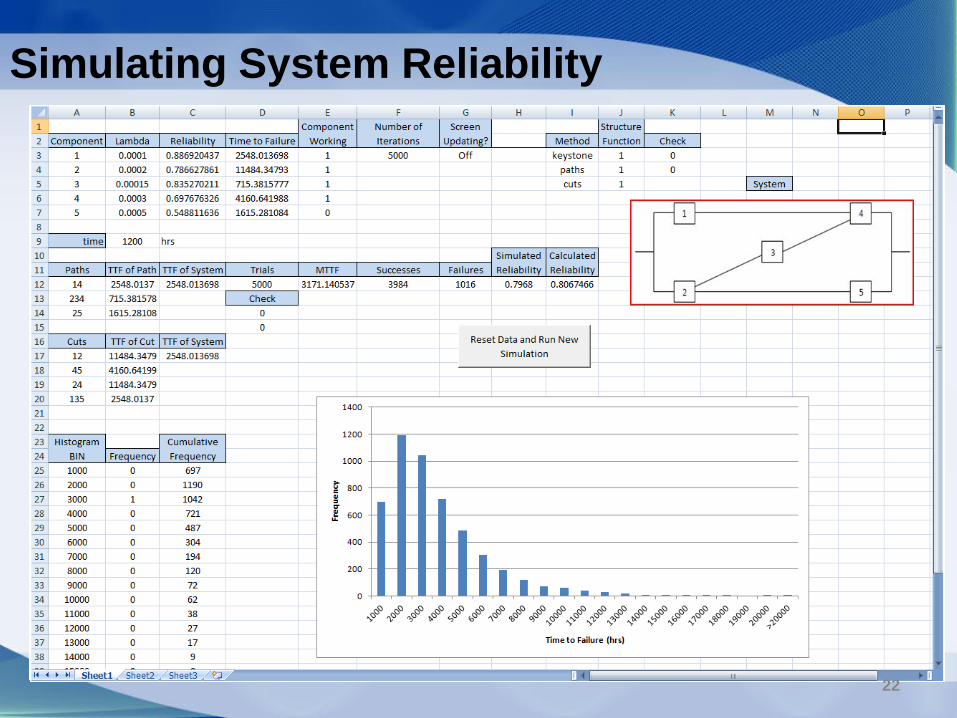
22
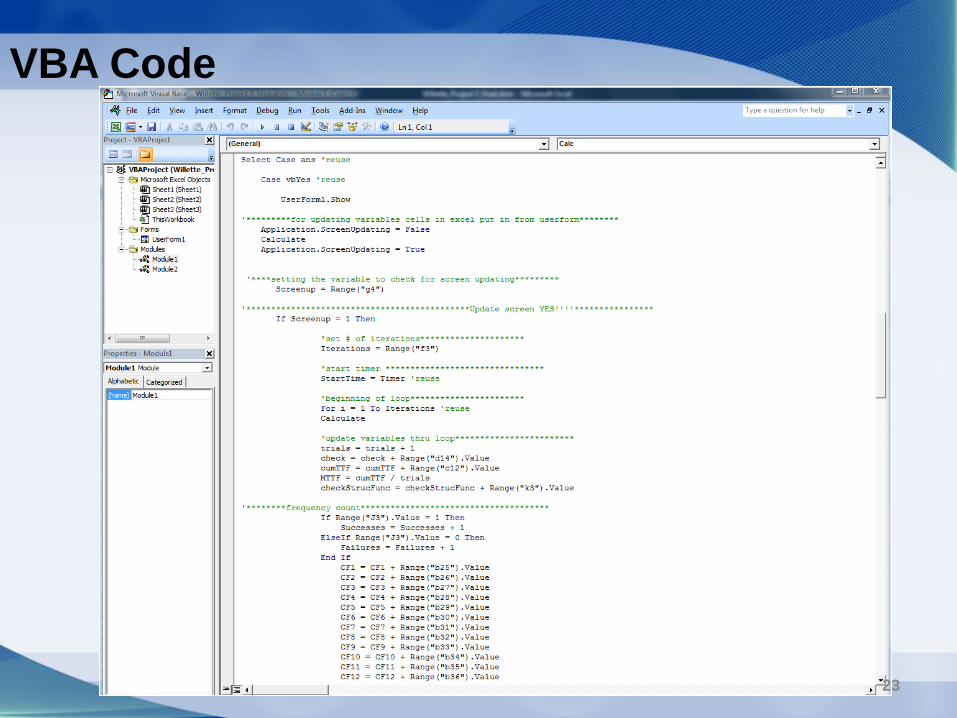
VBA Code
23
Recommended