HAL Id: hal-01829680https://hal.archives-ouvertes.fr/hal-01829680
Submitted on 28 Feb 2019
HAL is a multi-disciplinary open accessarchive for the deposit and dissemination of sci-entific research documents, whether they are pub-lished or not. The documents may come fromteaching and research institutions in France orabroad, or from public or private research centers.
L’archive ouverte pluridisciplinaire HAL, estdestinée au dépôt et à la diffusion de documentsscientifiques de niveau recherche, publiés ou non,émanant des établissements d’enseignement et derecherche français ou étrangers, des laboratoirespublics ou privés.
Simulated conservative tracer as a proxy forS-metolachlor concentration predictions compared to
POCIS measurements in Arcachon BayVincent Fauvelle, Angel Belles, Hélène Budzinski, Nicolas Mazzella, Martin
Plus
To cite this version:Vincent Fauvelle, Angel Belles, Hélène Budzinski, Nicolas Mazzella, Martin Plus. Simulatedconservative tracer as a proxy for S-metolachlor concentration predictions compared to POCISmeasurements in Arcachon Bay. Marine Pollution Bulletin, Elsevier, 2018, 133, pp.423 - 427.�10.1016/j.marpolbul.2018.06.005�. �hal-01829680�

1
Simulated conservative tracer as a proxy for S-metolachlor concentration 1
predictions compared to POCIS measurements in Arcachon Bay 2
Vincent Fauvellea,*, Angel Bellesb, Hélène Budzinskic, Nicolas Mazzellad, Martin Pluse 3
a Aix-Marseille Univ., Université de Toulon, CNRS, IRD, M I O, Marseille, France 4 b MINES ParisTech, PSL Research University, Geosciences – Centre for Geosciences and Geoengineering, 35 5 rue St. Honoré, Fontainebleau, France 6 c Univ. Bordeaux, UMR EPOC CNRS 5805, LPTC, Talence, France 7 d Irstea, UR EABX, 50 avenue de Verdun, Cestas, France 8 e Ifremer, Laboratoire d’écologie pélagique (DYNECO-PELAGOS), Plouzané, France 9
10
Abstract 11
The work presented here aims at comparing monitoring of S-metolachlor, the major pesticide 12
in use in the Arcachon Bay (South West of France, transitional coastal area), by chemical 13
analysis (monthly passive sampling) and contaminant dissipation modeling from sources 14
(Mars-2D model). The global strategy consisted in i) identifying the major sources of S-15
metolachlor to the Bay, ii) monitoring these sources for 12 months, and iii) comparing modeled 16
data in the Bay based on measured inputs, to chemical measurements made inside the Bay along 17
with the 12-month source monitoring. Results first showed that the major S-metolachlor surface 18
inputs to the Arcachon Bay are mainly from one single source. Modeled and measured data 19
were in good agreement at 5 sites in the Bay, both in terms of concentration range and seasonal 20
trends. Modeling thus offers a cost-effective solution for monitoring contaminants in 21
transitional waters, overcoming in addition the technical limitations for measuring pg L-1 or 22
lower levels in coastal waters. However, we highlighted that secondary sources may affect 23
accuracy at local level. 24
Keywords 25
Passive sampling, POCIS, Mars-2D, contaminant, monitoring, coastal area, pesticides, S-26
metolachlor 27

2
1. Introduction 28
The need for monitoring tools in natural water increases with regulation (Allan et al., 2006, 29
Poulier et al., 2014). However, monitoring networks are often expensive when they aim at 30
covering the entire area of interest. Among the targeted organic contaminants, pesticides are 31
largely represented in priority pollutant lists because of their toxicity and ubiquitous presence 32
(e.g., half of the Water Framework Directive, 2000/60/EC). Remarkably, herbicides exhibit the 33
highest sales volumes (e.g., glyphosate, S-metolachlor), and are thus quantified in surface 34
waters at higher levels than other pesticides (Comoretto et al., 2007). These substances may 35
reach coastal water from freshwater inputs and affect organisms that were not initially targeted. 36
For example, measurable biological effect of S-metolachlor on marine organisms vary between 37
levels higher than mg L-1 for microalgae growth, photosynthetic efficiency or lipid content 38
(Ebenezer et al., 2013; Coquillé et al., 2018), to environmentally realistic sub µg L-1 levels 39
causing spermio and embryotoxicity on Crassostrea gigas (Mai et al., 2013). Passive sampling 40
is increasingly developed for a wide range of contaminants, because it provides more accurate 41
data, e.g., time-weighted average concentrations, freely dissolved contamination fraction, high 42
preconcentration rates decreasing limits of detection (LD). It offers attractive advantages when 43
considering how challenging surface water (and coastal water more importantly) monitoring is, 44
due to high concentration variability over time and analytical difficulties inherent to trace level 45
measurements in complex matrices. The Polar Organic Chemical Integrative Sampler (POCIS) 46
was introduced by Alvarez et al. (2004) for the sampling of medium polar and polar organic 47
contaminants (e.g., pesticides, pharmaceuticals), and is therefore a sampler of choice for the 48
study of emerging pesticides, although recent developments tend to improve the quantitative 49
ability of such adsorption based passive samplers (Chen et al., 2013; Belles et al., 2017, 50
Fauvelle et al., 2017). 51

3
The work presented here aims at monitoring S-metolachlor with POCIS in the Arcachon Bay 52
and its main tributaries, in order to get a comprehensive overview of sources and transfer from 53
freshwater to seawater. Contamination modeling using Mars-2D (2-dimensions 54
Hydrodynamical Model for Applications at Regional Scale) adapted to Arcachon Bay (Plus et 55
al., 2009) is also assessed as a monitoring tool. The monitoring strategy we propose is based on 56
three consecutive steps, i) preliminary mapping for sources identification during 4 months 57
(03/22/2010 to 07/17/2010), ii) actual monitoring of the sources and the Bay by POCIS for the 58
consecutive 12 months (07/17/2010 to 07/21/2011), iii) comparing MARS-2D modeled data 59
from sources inside the Bay to the chemical measurements. 60
2. Methods 61
2.1. Sampling and chemical analysis 62
63
Figure 1. Localization of tributaries (right list) and sampling stations inside the Arcachon Bay 64 (left list). Map from French National Institute of Geographic and Forestry Information. 65
Arcachon Bay is a 180 km2 mesotidal lagoon on the South Atlantic coast of France (44°40’N, 66
1°10’W), connected to the Ocean by a large channel allowing important seawater exchanges 67
(average of 0.4 1012 L at each tide, i.e., 50 % of the total volume). Its maximum depth in 68
Canal des Etangs
Cirès
Lanton
Ponteils
Leyre
Canal des Landes
Comprian
Balise 9
Eyrac
Grand banc
Arguin
4
channels is 20 m. The area supports several activities in the Bay itself or its watershed (e.g., 69
oyster farming, agriculture, aquatic recreational activities) that present conflicts of practice, to 70
some extent related to the water contamination induced by any of these activities (Gamain et 71
al., 2017). Five sampling stations inside the Bay together with the six main tributaries were 72
selected for monthly sampling (Fig. 1). All analytical procedures are described by Belles et al. 73
(2014) for POCIS exposed inside the Bay, and by Fauvelle et al. (2012) for POCIS exposed in 74
the Bay tributaries. As S-metolachlor is exclusively used for agricultural purposes, we assumed 75
that sources were located only at freshwater input sites. Therefore, the six main tributaries were 76
selected in term of flowrate (Fig. 1, > 90 % total river inputs, Auby et al., 1994) and monitored 77
by POCIS immersed for four consecutive periods of 4 weeks from 03/22/2010 to 07/17/2010 78
for mapping the main sources of S-metolachlor to the Bay (Roubeix et al., 2012). Afterwards, 79
5 sampling stations inside the Bay (Fig. 1) together with the main sources previously identified 80
were monitored the same way from 07/17/2010 to 07/21/2011 to perform the modeling exercise. 81
2.2. MARS-2D model 82
MARS is a hydrodynamical model that solves fluid mechanics equations commonly known as 83
Navier- Stokes (Lazure and Dumas, 2008). This model has been previously applied to the 84
Arcachon Bay (Plus et al., 2009), assuming the horizontal current does not vary significantly 85
with depth and that the vertical current acceleration is negligible when compared to 86
gravitational acceleration. Indeed, in this bay the water column is well-mixed all along the year, 87
due to the strong tidal currents, the somewhat shallow depths and the low freshwater inputs 88
when compared to the oscillating volume (Plus et al., 2009). The model geographical extension 89
is 44°21 - 44°54 N and 0°57 – 1°27 W, horizontal resolution is 235 x 235m (squared cells), and 90
time step varies between 60 and 200 seconds. The model also accommodates with wet/dry 91
zones and has been validated against tide gauges, acoustic Doppler current profiler and salinity 92
measurements. The model used, at its open boundaries, a tide obtained from the Legos model 93

5
(FES2004, Lyard et al., 2006; decimetric precision close to the coasts) and a meteorological 94
forcing obtained from the ARPEGE model (meteo France, Déqué and Piedelievre, 1995). In 95
addition, the model incorporates pooled bathymetric data provided by L' Yavanc (L' Yavanc, 96
1995), the Gironde maritime navigation service and the Marine Hydrographic and 97
Oceanographic Service (SHOM). For our purpose, it was hypothesized that i) vertical 98
contaminant concentration heterogeneity is negligible, and ii) S-metolachlor is conservative (no 99
degradation, no export to other compartments such as sediment or biota) under the 100
environmental conditions of our study due to its high solubility and polarity (solubility 0.5 g L-101
1, log Kow = 3.1). The model goodness-of-fit (observed vs. predicted values) on the variable 102
‘Salinity’ gives a good idea on the capacity of the model to reproduce passive tracer 103
concentrations in the bay: the calculated root mean squared deviation of simulated salinity is 104
2.25, which corresponds to a 7.4% error on average (Plus et al., 2009). 105
3. Results and discussion 106
3.1. Identification and monitoring of sources 107
Table 1. S-metolachlor concentration (ng L-1) in the main tributaries of Arcachon Bay measured 108 by POCIS over the preliminary contamination mapping period (03/22/2010 to 07/17/2010). 109 Method relative standard deviation is 23 % and limit of detection (LD) is considered 1.5 ng L-110 1 for POCIS exposed for 1 month in freshwater (Lissalde et al., 2011). Tributaries flow data are 111 from Auby et al., 1994 over the 1989-1993 period 112
Sampler exposure period Unit Leyre Canal des Etangs
Canal des Landes Cirès Lanton Ponteils
03/22/2010 04/19/2010 ng L-1 44 7 19 43 63 < LD 04/19/2010 05/17/2010 ng L-1 51 < LD 16 97 148 < LD 05/17/2010 06/17/2010 ng L-1 139 < LD < LD < LD < LD < LD 06/17/2010 07/17/2010 ng L-1 27 < LD < LD 30 105 < LD
Stream flow / Leyre flow - 1.0 0.26 0.03 0.04 0.02 0.02 113
Leyre river was found to be the main provider of S-metolachlor to the Bay over the preliminary 114
concentration mapping step (03/22/2010 to 07/17/2010, Table 1). It had by far the highest flow 115

6
and was the most contaminated sites (Table 1). Thus, it was considered thereafter as the only 116
source of S-metolachlor to the Bay, i.e., only the Leyre river inputs were considered in MARS-117
2D model. S-metolachlor concentration in the Leyre river was then measured in the range of 118
10-80 ng L-1 during the actual modeling exercise (07/17/2010 to 07/21/2011, Fig. 2). The 119
maximum concentration in this tributary occurred together with the maximum stream flow, 120
resulting in an estimated massive flux of S-metolachlor towards the Bay during winter time (up 121
to an average of 200 g day-1 over the 11/30/2010-01/02/2011 period). This major flux was 122
grown by the unconventional rainfall behavior in 2010 (twice higher rainfall in November 123
compared to the seasonal norms). Linking this 200 g day-1 S-metolachlor flux to the total 124
volume (~ 0.8 1012 L) and the residence time of freshwater in the Bay (10 days for 120 m3 s-1 125
and 24 days for 10 m3 s-1 freshwater flow, De Wit et al., 2005, extrapolated to 22 days in our 126
case, with a maximum flow of 28 m3 s-1 in November 2010, Fig. 2), we can roughly estimate a 127
maximum averaged S-metolachlor concentration inside the Bay of 5 ng L-1. It is interesting to 128
note that the maximum stream concentration measured in winter does not match the S-129
metolachlor application period, generally occurring in April-May for maize cultivation in this 130
area. This finding suggests an unconventional fate of S-metolachlor from field application to 131
its transfer to the receptive river. Indeed, because of the permeability of the sandy soils of the 132
watershed surrounding the Arcachon Bay, the watercourses are more comparable to 133
groundwater drains than to receptacles of the runoff water (Rimmelin et al., 1998). Therefore, 134
the lag time observed in river contamination could be attributed to a temporary contaminant 135
storage in superficial groundwater prior to discharge in rivers when groundwater table level is 136
high enough to be drained by the neighboring river. 137

7
138
Figure 2. Concentration of S-metolachlor and flow of Leyre river over the modeling exercise 139 period (07/17/2010 to 07/21/2011). Method relative standard deviation is 23 % and LD is 140 considered 1.5 ng L-1 for POCIS exposed for 1 month in freshwater (Lissalde et al., 2011). 141
142
0
5
10
15
20
25
30
0.0
10.0
20.0
30.0
40.0
50.0
60.0
70.0
80.0
90.0
5/2/2010 8/10/2010 11/18/2010 2/26/2011 6/6/2011 9/14/2011
Flow
(m3
s-1)
Conc
entra
tion
(ng
L-1)
Leyre
Concentration
Flow
8
3.2. Modeled versus measured concentrations in the bay 143
144
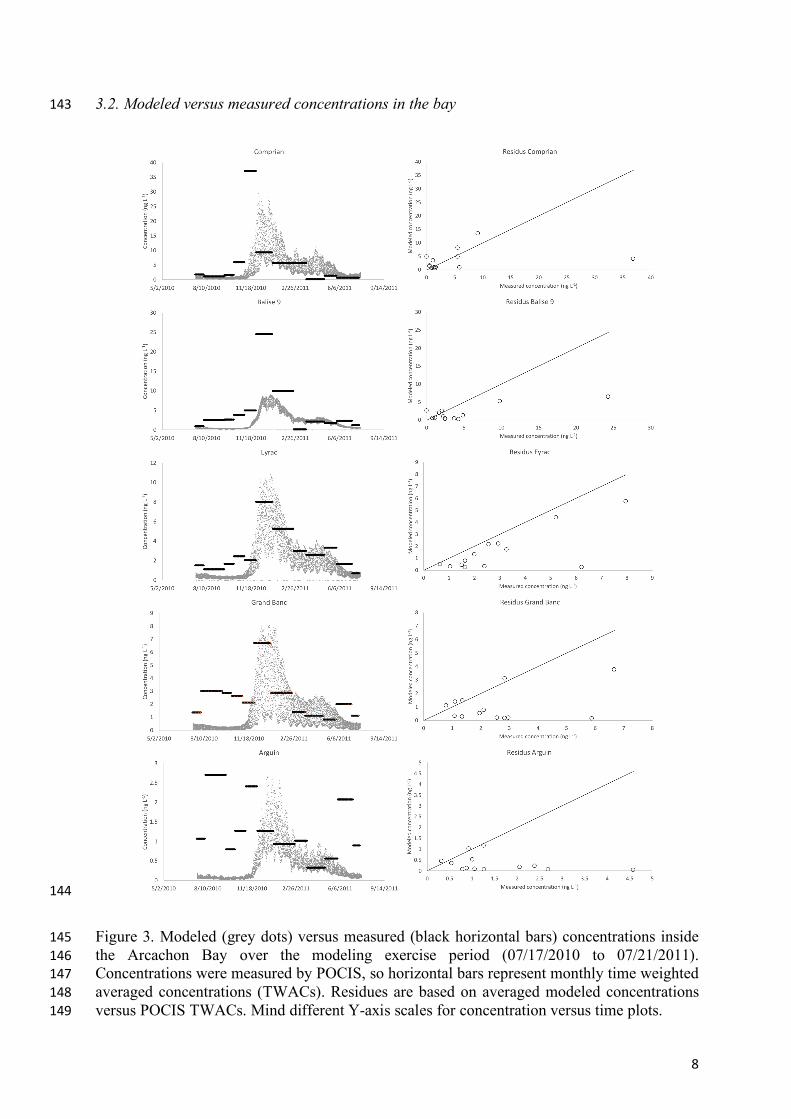
Figure 3. Modeled (grey dots) versus measured (black horizontal bars) concentrations inside 145 the Arcachon Bay over the modeling exercise period (07/17/2010 to 07/21/2011). 146 Concentrations were measured by POCIS, so horizontal bars represent monthly time weighted 147 averaged concentrations (TWACs). Residues are based on averaged modeled concentrations 148 versus POCIS TWACs. Mind different Y-axis scales for concentration versus time plots. 149
9
The modeled data inside the Bay at different points were in good agreement with measured 150
concentrations (Fig. 3) both in terms of concentration range and seasonal trend. The maximum 151
concentrations modeled at the 5 sites are also in the range of that estimated roughly in the 152
previous section (i.e., 5 ng L-1). The dilution gradient between the source (Leyre, Fig. 1) and 153
the open water (Arguin, Fig. 1) is also well represented by the modeled data at the various 154
sampling stations. Data measured at Arguin site suffer from high dispersion, in relation with 155
low levels quantified, close to LD. Although modeled and measured trends are roughly similar, 156
we obtained an almost systematic underestimation of data modeled compared to the one 157
measured. As highlighted in section 3.1, groundwater is probably a crucial compartment for 158
contaminants fate. Deborde et al. (2008) showed that groundwater inputs to the Bay are between 159
2.7 and 5.3 % of the rivers freshwater inputs, which could be negligible at the global scale, but 160
might be of importance at the local scale. Unfortunately, we don’t have any chemical 161
monitoring of groundwaters around the Bay to discuss this hypothesis in more details. 162
Moreover, the substantial underestimation observed at Balise 9 might highlight a secondary 163
source on the northern side of the Bay. Canal des Etangs has a significant flow (26 % that of 164
Leyre, Table 1) and might affect S-metolachlor concentration at Balise 9, but the concentrations 165
found at that site were < LD most of the time, with occasional detection at levels always below 166
7 ng L-1. Other issues could arise when trying to implement such an approach for more 167
hydrophobic contaminants, which might have higher affinity for suspended matter, and would 168
therefore not be detectable in the dissolved fraction of the water column. In light of a previous 169
study (Mai et al., 2013), implications of these results for the local economy of Arcachon Bay 170
could be of importance, since most of the oyster farms are located close to the Leyre river mouth 171
where S-metolachlor concentrations are the highest, eventually implying spermio and 172
embryotoxicity. 173

10
Thus, the model outputs have to be considered with caution despite their ability to predict 174
concentrations ranges and seasonal trends, in good agreement with measurements at different 175
points of the Bay. In fact, we speculate the need for more complexity in the behavior modeling 176
of the simulated tracer as well as for more accuracy in the estimation of sources. This type of 177
monitoring strategy would however be of interest given the drastic reduction of analytical costs 178
both in terms of number of samples required, and analytical challenges for quantifying low pg 179
L-1 levels. In addition, it offers the opportunity to get a comprehensive and high spatial 180
resolution overview of contaminants dispersion. 181

11
Acknowledgements 182
The authors are grateful to the Region Aquitaine (OSQUAR project), and FEDER (OSQUAR 183
project) and ANR Ripost for financial support. 184
References 185
Allan, I.J., Vrana, B., Greenwood, R., Mills, G.A., Roig, B., Gonzalez, C., 2006. A “toolbox” 186 for biological and chemical monitoring requirements for the European Union's Water 187 Framework Directive. Talanta 69, 302-22. 188
Alvarez, D.A., Petty, J.D., Huckins, J.N., Jones-Lepp, T.L., Getting, D.T., Goddard, J.P., 189 Manahan, S.E., 2004. Development of a passive, in situ, integrative sampler for hydrophilic 190 organic contaminants in aquatic environments. Environ. Toxicol. Chem. 23, 1640-1648. 191
Auby, I., Manaud, F., Maurer, D., Trut, G., 1994. Etude de la proliferation des algues vertes 192 dans le Bassin d'Arcachon. IFREMER internal report, Arcachon, p. 275. 193
Belles, A., Pardon, P., Budzinski, H., 2014. Development of an adapted version of polar organic 194 chemical integrative samplers (POCIS-Nylon). Anal. Bioanal. Chem. 406, 1099-1110. 195
Belles, A., Alary, C., Aminot, Y., Readman, J.W., Franke, C., 2017. Calibration and response 196 of an agarose gel based passive sampler to record short pulses of aquatic organic pollutants. 197 Talanta 165, 1-9. 198
Chen, C.-E., Zhang, H., Ying, G.-G., Jones, K.C., 2013. Evidence and recommendations to 199 support the use of a novel passive water sampler to quantify antibiotics in wastewaters. 200 Environ. Sci. Technol. 47, 13587-13593. 201
Comoretto, L., Arfib, B., Chiron, S., 2007. Pesticides in the Rhône river delta (France): basic 202 data for a field-based exposure assessment. Sci. Total Environ. 380, 124-132. 203
Coquillé, N., Ménard, D., Rouxel, J., Dupraz, V., Eon, M., Pardon, P., Budzinski, H., Morin, 204 S., Palranti, E., Stachowski-Haberkorn, S., 2018. The influence of natural dissolved organic 205 matter on herbicide toxicity to marine microalgae is species-dependent. Aqua. Toxicol. 198, 206 103-117. 207
De Wit, R., Leibreich, J., Vernier, F., Delmas, F., Beuffe, H., Maison, P., Chossat, J.-C., 208 Laplace-Treyture, C., Laplana, R., Clavé, V., Torre, M., Auby, I., Trut, G., Maurer, D., 209 Capdeville, P., 2005. Relationship between land-use in the agro-forestry system of les 210 Landes, nitrogen loading to and risk of macro-algal blooming in the Bassin d'Arcachon 211 coastal lagoon (SW France). Estuar. Coast. Shelf Sci. 62, 453-465. 212
Deborde, J., Anschutz, P., Auby, I., Glé, C., Commarieu, M. V., Maurer, D., Abril, G., 2008. 213 Role of tidal pumping on nutrient cycling in a temperate lagoon (Arcachon Bay, France). 214 Mar. Chem. 109, 98-114. 215
Déqué, M. and J. P. Piedelievre (1995). "High resolution climate simulation over Europe." 216 Climate Dynamics 11(6): 321-339. 217

12
Directive 2000/60/EC of the European Parliament and of the Council of 23 October 2000 218 establishing a framework for Community action in the field of water policy, Off. J. Eur. 219 Comm. L327 (2000) 1. 220
Ebenezer, V., Ki J.-S., 2013. Quantification of Toxic Effects of the Herbicide Metolachlor on 221 Marine Microalgae Ditylum brightwellii (Bacillariophyceae), Prorocentrum minimum 222 (Dinophyceae), and Tetraselmis suecica (Chlorophyceae). J. Microbiol. 51, 136-139. 223
Fauvelle, V., Mazzella, N., Delmas, F., Madarassou, K., Eon, M., Budzinski, H., 2012. Use of 224 mixed-mode ion exchange sorbent for the passive sampling of organic acids by polar organic 225 chemical integrative sampler (POCIS). Environ. Sci. Technol. 46, 13344-13353. 226
Fauvelle, V., Montero, N., Mueller, J.F., Banks, A., Mazzella, N., Kaserzon, S., 2017. 227 Glyphosate and AMPA passive sampling in freshwater using a microporous polyethylene 228 diffusion sampler. Chemosphere 188, 241-248. 229
Gamain, P., Feurtet-Mazel, A., Maury-Brachet, R., Auby, I., Pierron, F., Belles, A., Budzinski, 230 H., Daffe, G., Gonzalez, P., 2017. Can pesticides, copper and seasonal water temperature 231 explain the seagrass Zostera noltei decline in the Arcachon bay? Mar. Pollut. Bull. In press 232
L’Yavanc J., 1995. Evolutions bathymétrique et morphologique du bassin d’Arcachon. 233 http://archimer.ifremer.fr/doc/00080/19127/ 234
Lazure P., Dumas. F., 2008. An external-internal mode coupling for a 3D hydrodynamical 235 model for applications at Regional Scale (MARS). Advances in Water Resources 31, 233-236 250. 237
Lissalde, S., Mazzella, N., Fauvelle, V., Delmas, F., Mazellier, P., Legube, B., 2011. Liquid 238 chromatography coupled with tandem mass spectrometry method for thirty-three pesticides 239 in natural water and comparison of performance between classical solid phase extraction and 240 passive sampling approaches. J. Chromatogr. A 1218, 1492− 1502. 241
Lyard F., Lefevre F., Letellier T., Francis O., 2006. Modelling the global ocean tides: modern 242 insights from FES2004.Ocean Dynamics 56, 394-415. 243
Mai, H., Morin, B., Pardon, P., Gonzalez, P., Budzinski, H., & Cachot, J., 2013. Environmental 244 concentrations of irgarol, diuron and S-metolachlor induce deleterious effects on gametes and 245 embryos of the Pacific oyster, Crassostrea gigas. Mar. Environ. Res. 89, 1-8. 246
Plus, M., Dumas, F., Stanisière, J.-Y., Maurer, D., 2009. Hydrodynamic characterization of the 247 Arcachon Bay, using model-derived descriptors. Cont. Shelf Res. 29, 1008-1013. 248
Poulier, G., Lissalde, S., Charriau, A., Buzier, R., Delmas, F., Gery, K., Moreira, A., Guibaud, 249 G., Mazzella, N., 2014. Can POCIS be used in Water Framework Directive (2000/60/EC) 250 monitoring networks? A study focusing on pesticides in a French agricultural watershed. Sci. 251 Total Environ. 497−498, 282−292. 252
Rimmelin, P., Dumon, J. C., Maneux, E., Gonçalves, A., 1998. Study of annual and seasonal 253 dissolved inorganic nitrogen inputs into the Arcachon Lagoon, Atlantic Coast (France). 254 Estuar. Coast. Shelf Sci., 47, 649-659. 255
Roubeix, V., Fauvelle, V., Tison-Rosebery, J., Mazzella, N., Coste, M., Delmas, F., 2012. 256 Assessing the impact of chloroacetanilide herbicides and their metabolites on periphyton in 257 the Leyre River (SW France) via short term growth inhibition tests on autochthonous diatoms. 258 J. Environ. Monit. 14, 1655-1663. 259
Recommended