Shire of Quairading
Strategic Community Plan
2017 - 2027
Adopted 26 October 2017

CONTENTS
Foreword ............................................................................................................... 1
Introduction ........................................................................................................... 2
Economic and community profile ......................................................................... 7
Achievements since the last Plan ........................................................................ 15
Community engagement ..................................................................................... 16
Key issues facing the community ........................................................................ 21
Strategic direction ............................................................................................... 22
Capital works program ........................................................................................ 28
Long Term Financial Profile ................................................................................. 43
Strategic risk management .................................................................................. 50
How will we know if the plan is succeeding? ...................................................... 51

Shire of Quairading Strategic Community Plan
1 | P a g e
FOREWORD
I am pleased to sign this foreword as one of my earliest duties as
President of the Shire of Quairading. This Plan represents an amazing
effort by the Council, staff and community to grapple with the
opportunities and challenges of the coming decade.
I acknowledge that during this time, the Council was led by my
predecessor, Councillor Brian Caporn, who stood down at the election,
having presided over the preparation of this Plan to the point of being
ready for adoption.
The last stage, using the community’s thoughtful and meticulous feedback on the draft Strategic
Community Plan, has been for the Council to challenge itself rigorously on the priorities and strategies.
The Plan reflects the community’s vision for Quairading to be a place of welcome for all, where we work
together, with thriving industry creating jobs, a bright future for our young people, and a bustling town
in a beautiful and productive rural setting. It balances the community’s desire to look after the assets we
have; invest in our future; and keep rates increases to an affordable level.
This has been a difficult balancing act. We have prioritised the capital works program to provide a
balance of the most needed new investments, along with an increase in renewals with a focus on roads.
In keeping with this rigour, all proposed new capital projects and major operating projects will be fully
reviewed prior to any final decision to proceed. This is in order to ensure they are sustainable, viable and
affordable (including whole of life costs) for the Council and community. If grant funding is required for
a project, that funding must have been obtained in order for the project to proceed.
We heard the community loud and clear on the need for a healthy local economy that can sustain
employment and a high quality of life. The community wants a future for its young people in a thriving,
growing place, whilst retaining all the advantages of a small country town and rural surrounds.
The community’s vision doesn’t mean the Shire has to expand and take it all on our shoulders. Quite the
reverse. We can assist but only businesses with community support can actually grow the economy. We
need to work more closely with businesses and the community, to facilitate collaborative and effective
methods to bring more wealth into our economy and improve economic and social participation. To
that end, we are redirecting some operational savings towards economic development in a facilitation
role. The details of this approach will be determined as a first step.
This is a “whole of community” challenge. We believe that the Shire of Quairading district has a
community spirit and prospects for the future second to none. We look forward to working together to
implement this plan and bring the community’s vision to fruition.
Councillor Wayne Davies
President, Shire of Quairading

Shire of Quairading Strategic Community Plan
2 | P a g e
INTRODUCTION
Welcome to the Shire of Quairading’s Strategic Community Plan. The Strategic Community Plan is a
long-term planning document that sets out the community’s vision, aspirations for the future, and the
key strategies we will need to focus on to achieve our aspirations. It is part of our fulfilment of the
Integrated Planning and Reporting (IPR) Framework. All local governments in Western Australia are
required to implement IPR which enables robust decision-making.
The Plan will be used to:
Guide Council decision-making and priority setting
Engage local residents and ratepayers, local businesses, community groups, and other local
stakeholders that contribute to the future of our community
Inform decision-making with respect to other partners and agencies, including the Federal
and State Governments, regional bodies and other local governments in our region
Provide a clear avenue to pursue funding and grant opportunities by demonstrating how
projects align with the aspirations and strategic direction of our community and Council
Inform future partners of our key priorities, and the ways in which we seek to grow and develop
Provide a framework for monitoring progress against the community’s vision and aspirations
The Strategic Community Plan maps out the Council’s intentions for the next ten years but it is
important to note that circumstances can change over the period. Events beyond the Shire’s control,
such as major storms, or changes to State or Federal government policies may require the Council to
rethink the timing of projects, or to reallocate funding to address new issues. The formal corporate
planning processes (see below) allows for regular review and Council has the capacity to review
annual budgets. To the best of its ability however, this Strategic Community Plan and the
accompanying Corporate Business Plan set the direction for the Shire’s future and the Council’s
projects and programs.
The draft plan was adopted for community consultation on 31 August 2017, with final adoption on 26
October 2017. It will be reviewed by 30 June 2019 and every 2 years thereafter. The two-yearly cycles
will alternate between a mini strategic review and a major strategic review, as shown in the planning
cycle diagram below.

Shire of Quairading Strategic Community Plan
3 | P a g e
KEY POINTS OF THE PLAN
This plan outlines the objectives and strategies that will be followed over the coming years, including
a number of major projects. In particular, the plan will deliver the following strategic priorities.
Community Facil it ies
The Shire of Quairading is in a period of significant investment in high priority assets and facilities. The
plan provides for the realisation of a number of significant projects and further enhancements as
follows:
completion of community garden/park1
completion of three Caravan Park cottages2
being “investment ready”3 for Independent Living Units, light industrial lots, factory units
saving up for sport and recreation facilities’ replacement4
The Council will undertake due diligence on all major capital and operational projects prior to any final
decision to proceed. This will be done in order to ensure they are sustainable, viable and affordable
(including whole of life costs) for Council and the community.
Rural Roads
Asset renewals
The Shire needs to address an underlying gap in asset renewals, particularly for roads (see also Financial
Profile section below). It is vital to close this gap, to preserve the serviceability of our local road network
for our economy and community. The Plan sees a rates increase of between 1-3% above inflation to
enable this gap to be reduced.
Remediation of flood damaged roads
The Plan sees significant effort on remediation of flood damaged roads, which is fully funded
externally. Some of this remediation work will also help to reduce the renewals gap.
Rural roads maintenance
There will be an increase in rural roads maintenance.
Economic and Tourism Development
Economic and tourism development is a very high priority for the community. The Council recognises
the importance of thriving local businesses to provide jobs and investment opportunities for existing and
potential new residents. Equally, a thriving community is needed to provide the workforce and local
capital needed for business growth. Quairading has significant advantages (including location, liveability,
available workforce), but also a number of challenges.
1 The community will be invited to contribute to the design
2 The cottages are planned for 2017/18, to be funded by the Shire and a loan, but it may be possible to obtain
a grant to avoid the need for a loan. If successful this may push the project into 2018/19. 3 Funding for the Independent Living Units and light industrial lots is uncertain. These projects remain a high
priority for the Shire, but they will not proceed unless and until external funding is obtained. 4 A working group is considering options at the time of writing

Shire of Quairading Strategic Community Plan
4 | P a g e
Economic infrastructure
Economic infrastructure is a challenging area. For example, lack of land for light industry is a known
constraint. The focus on light industrial lots and factory units is a high priority for this reason (see
community facilities above).
Business-friendly
Alongside provision of infrastructure to support business growth, the Shire also has a role in ensuring it
conducts itself in a business-friendly manner. To this end, the Council has decided to adopt the “Small
Business Friendly Local Governments” program.
Economic potential of existing assets and facilities
The Council also understands that the community’s assets and facilities can be a source of economic
development opportunities if looked at creatively from that perspective. This will be pursued as part of
the Shire’s approach.
Leveraging Federal and State Government priorities and programs
The Federal and State Governments are supporting a number of economic development priorities and
programs. For example, all Development Commissions now have a focus on supporting regional
businesses to be able to compete for State Government contracts. The Shire will work with relevant
agencies on opportunities to leverage priorities and programs to benefit local businesses.
Facilitation of business and jobs growth
The Council will explore a facilitation approach to business and jobs growth. The real engine of growth in
the local economy is business itself. Only through the growth of existing or new businesses, especially
those that bring wealth in (e.g. tourism, agriculture, logistics and manufacturing for wider markets etc),
can employment and incomes rise. Local purchasing helps to keep those dollars from “leaking”.
It can be assumed that individual businesses are already focused on their commercial success, and
opportunities to further grow and prosper. If it is considered that growth in the local economy is
possible, then it generally has to be in areas that exceed the capacity of businesses acting alone.
Examples include joining forces for larger contracts, collaborating on workforce solutions, and pooling
resources for more effective marketing. Such an approach can only be successful if it is business-led,
expertly facilitated and well supported by relevant agencies.
Cultural Development
The Plan commits to progress on cultural development and initiatives in partnership with local
Noongar elders and family representatives through the Reconciliation Action Plan Committee.
Efficiency and Effectiveness
We will strive for continual improvement in efficiency and effectiveness, with an emphasis on:
Maintaining and developing partnerships to achieve the best outcomes for the community:
− working together locally (e.g. with Quairading CRC, Education, Business, Sport and
Recreation Council)
− regional and sub-regional collaboration
Improving customer service, communications and community engagement
Reviewing efficiency to make sure every dollar counts

Shire of Quairading Strategic Community Plan
5 | P a g e
Two major priorities early in the plan are:
an Organisation Review
a Community and Economic Services Review encompassing the Visitors’ Centre, Community
Development. Economic and Tourism Development, Youth Services, Noongar Reconciliation,
Grants Seeking and Management (for community services/projects)
Financial Profi le
As noted above, the Shire has an underlying gap in asset renewals, particularly for roads. Like many
rural Shires, asset renewals have been subject to historic underfunding. While this suppresses rates, it
leads to a decline in the serviceability of the assets. It is therefore vital to close this gap, particularly to
preserve the serviceability of our local road network for our economy and community. The capital
works program outlined in the Plan reflects that priority. It is also anticipated that post-flooding
remedial work will assist in narrowing the renewals gap.
The cost of this is reflected in rates increases of 1-3% above inflation, with the higher increases in the
early years. The long term financial profile assumes inflation at the rate of 2%. The increases are 1%
above inflation by year 4 (2021).
Prudent borrowing is used to spread the cost of major new assets over their life. The Shire will
actively pursue grants for priority projects, and will maximise revenue generation from activities such
as private works.
Due diligence will be applied to all proposed major capital and operational projects to ensure they are sustainable, viable and affordable.
There are moderate increases in operational costs to fund economic development initiatives, which
was a high priority to emerge from the community engagement. There are also some non-
discretionary items in areas such as town planning and workforce planning. These increases are offset
by a decrease in the operational costs for the waste and recycling plant.
The Building Reserve will be extended by earmarking net proceeds from rent and sale of land or
houses.
Despite strenuous effort to balance the community’s aspirations with affordability, the long term
financial profile shows that this is an ongoing challenge. There will need to further work on the next
version of the Long Term Financial Plan to eliminate projected deficits, whilst still making adequate
provision for renewals.

Shire of Quairading Strategic Community Plan
6 | P a g e
WESTERN AUSTRALIA LOCAL GOVERNMENT INTEGRATED PLANNING AND
REPORTING FRAMEWORK
The Integrated Planning and Reporting Framework is shown in the diagram below. The purpose is to
ensure that Council decisions deliver the best results for the community with the available resources.
The Strategic Community Plan sets the scene for the whole framework – it expresses the community’s
vision and priorities for the future and shows how the Council and community intend to make
progress over a ten-year period.
However, it is not fixed for ten years –
it would be long out of date by then.
Rather, it is a “rolling” plan which is
reviewed every two years. The two-
yearly reviews alternate between a
minor review (updating as needed)
and a major review (going through
all the steps again). The plan is
therefore continuously looking
ahead, so each review keeps a ten-
year horizon. This is to ensure that
the best decisions are made in the
short to medium term.
The Corporate Business Plan shows
detailed implementation for the
next four years.
The “Informing Strategies” –
particularly the Long Term Financial
Plan, Asset Management Plans and
Workforce Plan – show how the Plan
will be managed and resourced. The
Annual Budget relates to that year of
the Corporate Business Plan. Any
necessary adjustments are made
through the Annual Budget process.
Figure 1: The Planning Cycle

Shire of Quairading Strategic Community Plan
7 | P a g e
ECONOMIC AND COMMUNITY PROFILE
INTRODUCTION
The Shire of Quairading is located 167km east of Perth on the York-Quairading Road. Its main
localities are Quairading, Pantapin, Yoting, Badjaling, Dangin, South Caroling, Balkuling,
Doodenanning, and Wamenusking. Occupying a land area of approximately 2017 km2, the Shire
borders eight other LGAs consisting of the Shires of York, Cunderdin, Beverley, Bruce Rock,
Kellerberrin, Brookton, Corrigin, and Tammin (see table below).
Figure 2: Location of the Shire of Quairading
Source: http://mapbuilder.remplan.com.au/ Retrieved 13 February 2017
POPULATION
The 2016 Census recorded the Shire’s usually resident population at 1,019. There has been little
change over the past 10 years.5
Table 1 Total Population 2006 - 2016
2006 2011 2016
1020 1044 1019
Source: Australian Bureau of Statistics, Census of Population and
Housing 2006, 2011, 2016. Retrieved 18 July 2017.
5 It should be noted that the ABS adjusts data on a random basis to deal with small sample sizes and protect privacy. Therefore, totals may not always match detailed data in tables provided.

Shire of Quairading Strategic Community Plan
8 | P a g e
AGE DISTRIBUTION
The median age in the Shire of Quairading is 52 years, up 4 years from 2011. This is considerably older
than the median age for Western Australia as a whole which was 36 in the 2016 census (no change
from 2011). The age distribution for 2011 and 2016 can be seen in Table 2 and Figure 3.
Table 2: Age Distribution
Age Group 2011 2016
No. % No. %
0-4 67 6.4% 57 5.6%
5-9 69 6.6% 69 6.8%
10-14 67 6.4% 42 4.1%
15-19 22 2.1% 36 3.5%
20-29 69 6.6% 82 8.0%
30-39 102 9.8% 88 8.6%
40-49 159 15.2% 109 10.7%
50-59 202 19.3% 178 17.5%
60-69 128 12.3% 169 16.6%
70-79 106 10.2% 122 12.0%
80-89 41 3.9% 54 5.3%
90+ 12 1.1% 12 1.2%
Total 1,044 100% 1,019 100% Source: Australian Bureau of Statistics, Census of Population and Housing 2011, 2016. Retrieved 18
July 2017.
Figure 3: Age Distribution
Source: Australian Bureau of Statistics, Census of Population and Housing 2011, 2016. Retrieved 18 July 2017.
0
50
100
150
200
250
0-4 5-Sep Oct-14 15-19 20-29 30-39 40-49 50-59 60-69 70-79 80-89 90+
2011 2016

Shire of Quairading Strategic Community Plan
9 | P a g e
POPULATION FORECASTS
The WA Planning Commission’s August 20156 Medium Term Population Forecasts WA Tomorrow
series outlines the following population projections for the Shire of Quairading and its neighbouring
LGAs (Band C forecasts). Note these projections have yet to be updated since the 2016 census, but
are provided for reference in the meantime.
Table 3: Population Forecasts for Quairading and its Neighbouring Local Government
Areas
2016 2021 2026
Quairading 1060 990 920
York 3,350 3,470 3,560
Beverley 1,640 1,700 1,750
Cunderdin 1,280 1,210 1,130
Kellerberrin 1,170 1,120 1,040
Corrigin 1,150 1,130 1,100
Bruce Rock 940 850 760
Brookton 990 970 950
Tammin 400 370 330
Source: Australian Bureau of Statistics, Census of Population and Housing 2011, 2016. Retrieved 18 July 2017
ABORIGINAL/TORRES STRAIT ISLANDER STATUS
The 2016 Census records 82 people who are Aboriginal or Torres Strait Islander living in the Shire of
Quairading, representing 8% of the population which is relatively high, alongside Kellerberrin,
Brookton and Tammin. This compares with 152 in the 2011 Census. While this appears to be a
significant decrease, it may reflect difficulties with Census accuracy.
Table 4: 2016 Aboriginal/Torres Strait Islander Status
ABORIGINAL/TORRES STRAIT ISLANDER PERCENT NUMBER
Total Aboriginal or Torres Strait Islander 8% 82
Non-Indigenous 79% 808
Not Stated 13% 128
Total 100% 1,0187
Source: Australian Bureau of Statistics, Census of Population and Housing 2011, 2016. Retrieved 18 July 2017
6 Source: WA Planning Commission WA Tomorrow https://www.planning.wa.gov.au/publications/6194.aspx Retrieved 18 July 2017
7 This total differs from the total population figure provided in other tables, however it is in accordance with the data provided by the ABS which has been adjusted to protect privacy due to small population base.

Shire of Quairading Strategic Community Plan
10 | P a g e
COUNTRY OF BIRTH
The 2016 Census shows that there has been a slight increase in the proportion of residents that were
born outside of Australia (from 8% to 13%). Table 5 shows the countries of birth of the Shire’s
residents, based on the top 50 countries identified in the 2011 Census.
Table 5: 2016 Country of Birth of Residents in Shire of Quairading
COUNTRY OF BIRTH NUMBER
Australia 764
Country of Birth Not stated 141
England 38
New Zealand 19
Born elsewhere 10
South Korea 6
Philippines 5
India 4
Malaysia 4
Netherlands 4
Italy 3
Scotland 3
South Africa 3
Zimbabwe 3
Total 10048
Source: Austral ian Bureau of Stat istics , Census of Population and Housing 2011, 2016. Retrieved
18 July 2017
QUALIFICATIONS
Table 6 shows education qualifications for 2016. The percentage of the population with higher
qualifications is slightly below the Western Australian State average. Note that there has been a slight
increase in the percentage of the population that holds a higher qualification since 2011.
Table 6: Education Qualifications 2016
Quairading (persons)
Quairading (% of district
population)
Western Australia (% of State population)
Postgraduate Degree Level 6 1% 3%
Graduate Diploma/Graduate Certificate Level 11 1% 2%
Bachelor Degree Level 48 5% 12%
Advanced Diploma and Diploma Level 49 5% 7%
Certificate Level 137 13% 16%
Level of education inadequately described 6 1% 1%
Level of education not stated 152 15% 8%
Total 410 40% 49% Source: Australian Bureau of Statistics, Census of Population and Housing 2016. Retrieved 2 November 2017
8 This total differs from the total population figure provided in other tables, however it is in accordance with the data provided by the ABS which has been adjusted to protect privacy due to small population base.

Shire of Quairading Strategic Community Plan
11 | P a g e
SOCIO ECONOMIC INDEXES FOR AREAS (SEIFA) SCORES
SEIFA is a suite of indexes that have been created by the Australian Bureau of Statistics (ABS) from
social and economic Census information. A low SEIFA score indicates relatively greater disadvantage
in general. In 2011, the latest available, the SEIFA score for the Shire of Quairading was 930 a ranking
of 19 among LGAs in Western Australia (the lower the ranking number, the more disadvantaged the
LGA).
Quairading is the second most disadvantaged among its neighbours.
Table 7: 2011 SEIFA scores in Shire of Quairading and Neighbouring Local Government
Areas
SEIFA Score Rank within Western
Australia Rank within
neighbouring LGAs
Cunderdin 981 69 9
Tammin 980 67 8
Corrigin 976 61 7
York 975 60 6
Bruce Rock 965 44 5
Brookton 948 33 4
Beverley 936 24 3
Quairading 930 19 2
Kellerberrin 905 12 1
Source: Australian Bureau of Statistics, Census of Population and Housing 2011, 2016. Retrieved 18 July 2017
HOUSEHOLDS AND FAMILIES
In 2016, there were 393 households in the Shire of Quairading, a reduction from 420 in 2011. There
are 249 family households and 149 non-family households9. The largest family type is couple with no
children (137).
WORKFORCE
According to the 2016 Census, the District has a workforce of 396 or 44% of the total resident
population. Of these, 25 persons were unemployed but looking for full time or part time work.
The highest proportion of the District’s workforce is employed in the Agriculture, Forestry and Fishing
industry (40%), the Education and Training industry (10%) and Health Care and Social Assistance
(10%).
9 As noted above, the ABS adjusts data on a random basis to deal with small sample sizes and protect privacy. Therefore, totals do not always match detailed data in tables provided.

Shire of Quairading Strategic Community Plan
12 | P a g e
OCCUPATIONS
The largest employed group are Managers followed by Labourers and Community and Personal
Services Workers. Within this classification, the largest number of residents reported they worked as
Farmers or Farm Managers.
Comparisons with Western Australia show that the Shire has a higher proportion of Managers and a
significantly lower proportion of Professionals (9.2% compared with 20.5% for Western Australia).
Table 8: 2016 Occupations in the Shire of Quairading
Quairading Western Australia
No. % %
Managers 136 38.3% 12.0%
Labourers 37 10.4% 9.7%
Community and Personal Service Workers 37 10.4% 10.6%
Technicians and Trades Workers 33 9.2% 16.2%
Professionals 33 9.2% 20.5%
Clerical and Administrative Workers 32 9.0% 13.0%
Machinery Operators and Drivers 31 8.7% 7.5%
Sales Workers 20 5.6% 8.8%
Total 355 100% 100%
Source: Australian Bureau of Statistics, Census of Population and Housing 2011, 2016. Retrieved 18 July 2017. Please note this table is
based on Place of Work, which is a different basis than that used for the workforce data above.
At a lower occupational sub-category level, the following are the occupations which employ ten or more
people in the Shire of Quairading district. These account for 66% of the Shire’s employed workforce.
Farmers and Farm Managers (118 persons)
Carers and aides (26)
Sales assistants and sales persons (19)
Road and Rail Drivers (17)
Farm, Forestry and Garden Workers (16)
Education Professionals (15)
Health Professionals (13)
Construction Trades Workers (11)
The main industry of employment is in agriculture, forestry and farming. (See Table 9 below).

Shire of Quairading Strategic Community Plan
13 | P a g e
Table 9: 2016 Industry of Employment by Occupation
Source: Australian Bureau of Statistics, Census of Population and Housing 2011, 2016. Retrieved 4 November 2017. Please note this table is based on Place of Work , which is a different basis than that used for the workforce data above.
Managers Professionals
Technicians
and Trades
Workers
Community
and Personal
Services
Workers
Clerical/
Admin
Workers
Sales Workers
Machinery
Operators and
Drivers
Labourers Total
Agriculture, Forestry and
Fishing 117 3 7
4 6 15 154
Health Care and Social
Assistance 8
18 5
37
Public Administration and
Safety 3 4 6 3 7 9 3 29
Education and Training 3 15 8 3
3 26
Transport, Postal and
Warehousing 3 13
22
Construction 10 4 3 16
Retail Trade 3 13 3 14
Administrative and
Support Services 5 9
Other Services 4 7 3 9
Accommodation and Food
Services 5 8
Financial and Insurance
Services 7
Wholesale Trade 3 4 4
Inadequately
described/Not stated 3 3 12
Total 136 33 33 37 32 20 31 37 355

Shire of Quairading Strategic Community Plan
14 | P a g e
BUSINESS COUNTS
According to ABS 2015 estimates10, the latest available, there were 146 businesses operating in the
Shire of Quairading, a slight drop from 2014. The majority of these businesses were non-employing
businesses (88), while 47 had 1-4 employees, 8 had 5-19, and 3 employed 20 or more persons. Family
farms are a significant form of business in the Shire.
BUILDING APPROVALS
In 2016, the Shire of Quairading had building approvals to a total value of $4million in comparison
with $1million in 2014.
MEDIAN HOUSE SALE PRICE11
According to the Q4 2016 Real Estate Institute of Western Australia (REIWA) figures, median house
sale prices differed considerably between Quairading and its neighbours. The most expensive houses
were sold in York, at a median sale price of $300,000. The lowest median housing sales figures were
reported for Tammin, at $77,500.
Table 10: 2016 Median House Sale Prices for the Shire of Quairading and Neighbouring
Local Government Areas
Quaira-ding
York Corrigin Bruce Rock
Tammin Brookton Cunderdin Beverley Keller-berrin
$140,000 $300,000 $145,000 $81,750 $77,500 $175,000 $231,250 $285,000 $125,000
10
Source: National Regional Profiles, Australian Bureau of Statistics. 11
Source: REIWA http://reiwa.com.au/wa/cunderdin/6407/

Shire of Quairading Strategic Community Plan
15 | P a g e
ACHIEVEMENTS SINCE THE LAST PLAN
There have been significant achievements since the last Strategic Community Plan. Major investments
in infrastructure and community facilities, plus enhancements to services have substantially improved
the liveability and prospects of the Shire. Some key examples are listed below.
Infrastructure
Roads to Recovery program
Improved quality of roads, footpaths and kerbs in Town
Major arterial and Shire road upgrades
Solar panels and street lights
Depot (in progress) and plant replacement
Facil it ies
Swimming pool
Gym
Women’s Change Rooms at Greater Sports Ground
Caravan Park
Quairading CRC and Arts Centre
New house for Police
Shire Hall upgrades (various)
ANZAC War Memorial upgrade
Childcare Centre
Active Youth Centre
Enhanced Services
Tidy town – clean and green
Contracted Medical Service
New website, Facebook and newsletter
Quairading Reconciliation Action Plan (partnership with Noongar elders and family
representatives)
Electrical Service (available to the Shire and community)
Private works (revenue generating)

Shire of Quairading Strategic Community Plan
16 | P a g e
COMMUNITY ENGAGEMENT
The Shire of Quairading included extensive community engagement as part of its major strategic
review. The results12 provided vital input to the Council when making decisions on priorities and
plans.
The first engagement was a “30 under 30” project with youth aged 12 to 27, comprising an online
survey and face to face youth forum in June 2016. There was also a forum/sundowner with
businesses held in October 2016.
Next there was a series of community engagement activities with the residents of the Shire of
Quairading in February and March 2017. One component was a Community Survey administered
mostly online. Some paper forms were completed where participants preferred hard copy. In
addition, three drop-in, two-hour sessions were held with members of the community, supplemented
by further prioritisation boards being completed subsequently.
Separate engagement with the Noongar community was also undertaken.
The total number of participants (approximately 160) exceeds the Department of Local Government
and Communities’ minimum community engagement threshold of 10% of the population.
SUMMARY OF KEY FINDINGS
There was clear community interest in economic development as a key priority in both the
Community Survey and the community planning drop-in sessions, as well as among businesses, “30
under 30” participants, and Noongar elders (focus on tourism in the latter case). The community
wants to see thriving businesses that provide employment to existing residents, retain young people
in the Shire, and attract new residents.
There was also strong interest in improving medical facilities/services in the Shire, particularly full-
time doctors who remain in the Shire over the weekend.
Residents were mostly satisfied or very satisfied with the Shire’s overall performance in delivering its
services (71% in the online survey). Areas for improvement centred mostly on improved roads,
particularly rural road maintenance, drainage, economic development, and medical services. These
are all areas where there is a significant gap in the rating of the Shire’s current performance
compared with the importance awarded by residents to each of these service areas. Additional areas
for improvement include services for youth (36% satisfied/very satisfied) and consulting with the
community about key issues (52% satisfied/very satisfied). Furthermore, although a large proportion
of residents were unable to answer this question (29% don’t know), only 38% said they were
satisfied/very satisfied with services available for Noongar in the Shire. The level of “don’t know”
responses to this question is possibly revealing in itself.
Residents were generally supportive of continuing collaboration with the neighbouring Shires of
Tammin and Cunderdin (66% support/strongly support).
12
The detailed community engagement results can be accessed here http://www.quairading.wa.gov.au/Profiles/quairading/Assets/ClientData/Document-Centre/Community_Engagement_Report_June_2017.pdf

Shire of Quairading Strategic Community Plan
17 | P a g e
The community consultation drop-in session closely mirrored the findings of the Community Survey.
Participants’ vision for the Quairading of 2027 focused mostly on a strong and prosperous economy, a
vibrant community, a thriving, full school and good infrastructure with appealing streetscapes
attractive to residents, tourists and visitors. Participants were willing to invest in making Quairading a
better place, choosing to prioritise additional spending on economic development activities, health
and medical services, and roads/infrastructure.
The “30 under 30” participants also rated Shire services and highlighted performance gaps. The
young people were generally happy with most Shire services and felt they were important and the
service was great as is. However, the Golf Club, the Youth Centre, and the Community building had
the highest proportions of respondents to the youth survey who stated that the service/facility is
important and that it needs improvement.
Summary of Community Priorities
Quairading residents see economic development as a top priority for the Shire, along with improved
and well-maintained roads, and greater availability of health/medical services. Economic development
activities that would attract new business to the Shire, would also achieve the community interest in
keeping young people in the Shire, another key priority. The survey gave residents the opportunity to
choose the single most important priority. Of those who answered this question, the highest number
of residents mentioned roads (8) followed by health and medical (5) and youth (5). Youth and cultural
identity/awareness were the top Noongar priorities.
Businesses were more specific in their interest in economic development, namely in light industrial
area development, as well as wanting improved signage and WiFi. Furthermore, young people were
very interested in being involved in the development of the light industrial area. They also called for
improvements in facilities for youth, such as sporting facilities and a youth centre as well as a
better/bigger library, and were interested in festivals/events and activities for young people to keep
them in Quairading and eliminate the perception of “nothing to do in town”. Improved sporting and
recreation facilities was also a high priority for the community at large.

Shire of Quairading Strategic Community Plan
18 | P a g e
The table below summarises the top five community priorities identified in the various community engagement activities. Note that the survey contained
three ways to identify priorities (unprompted, prompted, and the single most important priority).
Table 11: Summary of Community’s Highest Priorities
Community Survey Community Drop in
Sessions
“30 under 30”
Youth Forum Business Forum
Noongar “Have Your Say” Workshop
Unprompted:
top priorities over next 3 years
Prompted:
top priorities over next 3 years
Unprompted:
most important improvement
Prompted:
where would you spend more?
Unprompted:
make Quairading more attractive to young people
Unprompted:
highest priorities
Unprompted:
highest priorities
Economic Development Initiatives
Roads, Footpaths and Drainage
Health and Medical Services
Parks, Playgrounds, Ovals and Reserves
Attracting and Retaining Youth
Improving road maintenance
Attracting new business into the Shire
Keeping young people in the Shire
Improved health services
Attracting new residents into the Shire
Roads
Health Care
Youth
Community consultation
Customer service
Economic Development Initiatives
Health and Medical Services
Roads, Footpaths and Drainage
Recreation and Community Centres
Parks, Playgrounds, Ovals and Reserves
Industry and employment strategy
Community playground/All year-round park
Ski Lake
Public Transport/ Taxi service
Festivals and events that appeal to locals and visitors
Large community noticeboard
Notes:
(i) a small community noticeboard has since been installed under the town clock
(ii) see also the youth survey results pp. 31/32
Light industrial area development
Main highway signage
WiFi in the Shopping Precinct/Caravan Park
Childcare five days a week
Professional business training
Youth
Cemetery
Badjaling
Groves Reserve
Housing
Tourism
Schools
Doctors/Health

Shire of Quairading Strategic Community Plan
19 | P a g e
FEEDBACK ON THE DRAFT STRATEGIC COMMUNITY PLAN
Seven submissions were received, raising 41 points, some of which were raised by more than one
submitter. The submissions were received with appreciation and have significantly enhanced both the
Strategic Community Plan and the Corporate Business Plan. The main points and the responses are
summarised as follows.
Table 12: Main Points of Submissions and Council ’s Responses
Main Points of Submissions Council’s Responses
Consultation and engagement
A number of ideas were suggested to
increase participation in the two-yearly
Community Survey and wider
community engagement processes.
The Council has identified this as an area for improvement
and will incorporate a number of the suggestions into the
next round of community engagement.
Monitoring
Several submitters sought more
detailed targets to be used to measure
Council performance.
The Council has adopted this approach and has
incorporated specific targets into the Strategic
Community Plan and the Corporate Business Plan.
Reallocation of capital funding
Some submitters were keen to see the
Independent Living Units (ILUs) and
the Light industrial lots progressed
with the Council shifting expenditure
from other projects to these areas, or
from the ILUs to an increased
expenditure on Caravan Park cottages.
External funding is uncertain for the ILUs and light
industrial units. However, the Council has retained them
in the program to signal the importance to the community
and will continue to pursue funding. The Council has
made the decision to retain its contribution to the ILUs in
the reserves fund at this stage. No additional reallocation
has been made.
Clarity about funding sources
A number of submitters felt Council
funding for some projects was too high
and sought reallocation.
The Council is funding only a portion of these projects and
realises that clarity on this aspect was needed. This
information has now been included in the SCP and the CBP.
Data
Queries about reliability and/or
accuracy of data.
Corrections have been made as required. In other cases,
the ABS approach to other data has been clarified.
Economic development
Sought clarification of timing of the
Business and Jobs Growth Action Plan.
The Council has decided to undertake further work on the
approach and timing to economic and tourism
development as a next step in this area.
Town Square
Seeking consideration of a Town
Square on old car yard land
The working group is still considering options. The old car
yard site may have contamination issues, so an
investigation of this will be commissioned in 17/18.

Shire of Quairading Strategic Community Plan
20 | P a g e
Main Points of Submissions Council’s Responses
Rural Roads
Need to emphasise the importance of
rural roads.
This is a key driver of the Plan and the headings have been
revised to better reflect this.
Sustainable Environment
Wishes to see sustainability and the
environment as a strategic theme
Sustainability and environmental regeneration isn't a
strategic priority in the Strategic Community Plan as the
community and Council identified issues of higher
importance for increased attention over the coming
decade. However, the natural environment is a strategic
objective with two outcomes and four strategies, and it
remains an important area of Shire activity.
Swimming pool
Suggestion that the pool should have a
longer season and ideas for warming
the pool put forward.
The Council will not consider a hydro-pool at this stage
due to cost constraints. For reference, note that the
Corrigin hydro pool cost approximately $500,000 for the
bowl, pumps and filtration unit (no external grants
funding is available). However, there may be ways to
better retain heat and prevent water evaporation and this
will be explored further. This will be targeted towards
increase patronage, rather than extending hours or the
season, given potential impacts on operating costs.
Various editing comments Adjustments have been made to the text in response to
the feedback.

Shire of Quairading Strategic Community Plan
21 | P a g e
KEY ISSUES FACING THE COMMUNITY
The top three issues facing the community over the coming decade are considered to be:
INDUSTRY DEVELOPMENT/ATTRACTION
There is strong community feeling that the local economy is not strong or sustainable enough for
desirable incomes, jobs (both now and for the future), and avoiding the “vicious circle” of population,
services and growth. The community also cares passionately about social and environmental
outcomes, but recognises that a thriving local economy is a vital underpinning of quality of life.
ATTRACTING/RETAINING YOUNGER POPULATION
This issue is closely related to the first. The community is concerned that without realistic prospects of
successful businesses or good jobs and incomes, the Shire will lose and fail to attract younger people. This
issue includes the ease with which young people can transition from school to further education or work.
MAINTENANCE AND RENEWAL OF ASSETS (ROADS, BUILDINGS, PARKS ETC.)
The community is not just focused on new or improved infrastructure and facilities. It sees the
maintenance and renewal of the Shire’s assets as a significant challenge that must be addressed for the life
of this Plan and beyond.

Shire of Quairading Strategic Community Plan
22 | P a g e
STRATEGIC DIRECTION
OUR VISION
“Our Shire is a place of welcome for all, where we work together, with thriving industry creating jobs,
a bright future for our young people, and a bustling town in a beautiful and productive rural setting.”
STRATEGIC PRIORITIES
The Shire of Quairading is in a period of significant investment in high priority assets and facilities. The
Council will undertake due diligence on all major capital and operational projects prior to any final
decision to proceed. This will be done in order to ensure they are sustainable, viable and affordable
(including whole of life costs) for Council and the community.
Community Facil it ies
The plan provides for the realisation of a number of significant projects and further enhancements as
follows:
completion of community garden/park13
completion of three Caravan Park cottages14
being “investment ready”15 for Independent Living Units, light industrial lots, factory units
saving up for sport and recreation facilities’ replacement16
Rural Roads
Asset renewals
The Shire needs to address an underlying gap in asset renewals, particularly for roads (see also Financial
Profile section below). It is vital to close this gap, to preserve the serviceability of our local road network
for our economy and community. The Plan sees a rates increase of between 1-3% above inflation to
enable this gap to be reduced.
Remediation of flood damaged roads
The Plan sees significant effort on remediation of flood damaged roads, which is fully funded
externally. Some of this remediation work will also help to reduce the renewals gap.
Rural roads maintenance
There will be an increase in rural roads maintenance.
13
The community will be invited to contribute to the design 14
The cottages are planned for 2017/18, to be funded by the Shire and a loan, but it may be possible to obtain a grant to avoid the need for a loan. If successful this may push the project into 2018/19.
15 Funding for the Independent Living Units and light industrial lots is uncertain. These projects remain a high
priority for the Shire, but they will not proceed unless and until external funding is obtained. 16
A working group is considering options at the time of writing

Shire of Quairading Strategic Community Plan
23 | P a g e
Economic and Tourism Development
Economic and tourism development is a very high priority for the community. The Council recognises
the importance of thriving local businesses to provide jobs and investment opportunities for existing and
potential new residents. Equally, a thriving community is needed to provide the workforce and local
capital needed for business growth. Quairading has significant advantages (including location, liveability,
available workforce), but also a number of challenges.
Economic infrastructure
Economic infrastructure is a challenging area. For example, lack of land for light industry is a known
constraint. The focus on light industrial lots and factory units is a high priority for this reason (see
community facilities above).
Business-friendly
Alongside provision of infrastructure to support business growth, the Shire also has a role in ensuring it
conducts itself in a business-friendly manner. To this end, the Council has decided to adopt the “Small
Business Friendly Local Governments” program.
Economic potential of existing assets and facilities
The Council also understands that the community’s assets and facilities can be a source of economic
development opportunities if looked at creatively from that perspective. This will be pursued as part of
the Shire’s approach.
Leveraging Federal and State Government priorities and programs
The Federal and State Governments are supporting a number of economic development priorities and
programs. For example, all Development Commissions now have a focus on supporting regional
businesses to be able to compete for State Government contracts. The Shire will work with relevant
agencies on opportunities to leverage priorities and programs to benefit local businesses.
Facilitation of business and jobs growth
The Council will explore a facilitation approach to business and jobs growth. The real engine of growth in
the local economy is business itself. Only through the growth of existing or new businesses, especially
those that bring wealth in (e.g. tourism, agriculture, logistics and manufacturing for wider markets etc),
can employment and incomes rise. Local purchasing helps to keep those dollars from “leaking” out.
It can be assumed that individual businesses are already focused on their commercial success, and
opportunities to further grow and prosper. If it is considered that growth in the local economy is
possible, then it generally has to be in areas that exceed the capacity of businesses acting alone.
Examples include joining forces for larger contracts, collaborating on workforce solutions, and pooling
resources for more effective marketing. Such an approach can only be successful if it is business-led,
expertly facilitated and well supported by relevant agencies.
Cultural Development
The Plan commits to progress on cultural development and initiatives in partnership with local
Noongar elders and family representatives through the Reconciliation Action Plan Committee.
Shire of Quairading Strategic Community Plan
24 | P a g e
Efficiency and Effectiveness
We will strive for continual improvement in efficiency and effectiveness, with an emphasis on:
Maintaining and developing partnerships to achieve the best outcomes for the community:
− working together locally (e.g. with Quairading CRC, Education, Business, Sport and
Recreation Council)
− regional and sub-regional collaboration
Improving customer service, communications and community engagement
Reviewing efficiency to make sure every dollar counts
Two major priorities early in the plan are:
an Organisation Review
a Community and Economic Services Review encompassing the Visitors’ Centre, Community
Development. Economic and Tourism Development, Youth Services, Noongar Reconciliation,
Grants (for community services/projects)
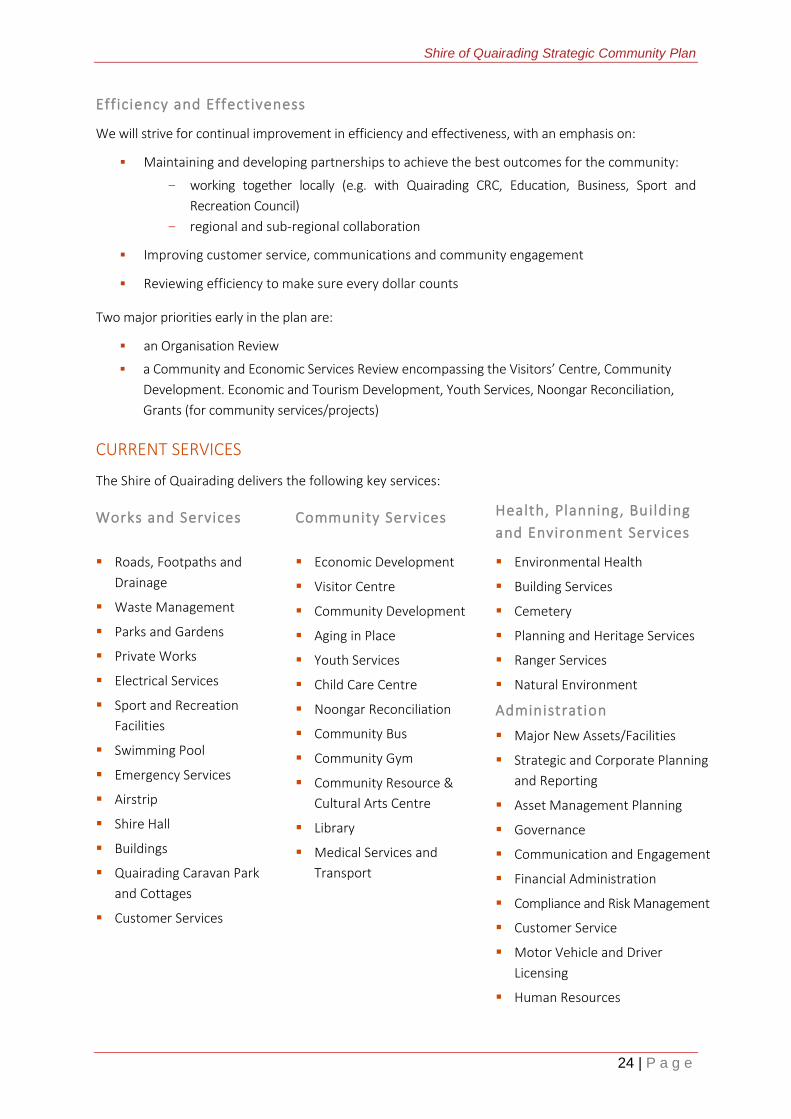
CURRENT SERVICES
The Shire of Quairading delivers the following key services:
Works and Services Community Services Health, Planning, Building
and Environment Services
Roads, Footpaths and
Drainage
Waste Management
Parks and Gardens
Private Works
Electrical Services
Sport and Recreation
Facilities
Swimming Pool
Emergency Services
Airstrip
Shire Hall
Buildings
Quairading Caravan Park
and Cottages
Customer Services
Economic Development
Visitor Centre
Community Development
Aging in Place
Youth Services
Child Care Centre
Noongar Reconciliation
Community Bus
Community Gym
Community Resource &
Cultural Arts Centre
Library
Medical Services and
Transport
Environmental Health
Building Services
Cemetery
Planning and Heritage Services
Ranger Services
Natural Environment
Administration
Major New Assets/Facilities
Strategic and Corporate Planning
and Reporting
Asset Management Planning
Governance
Communication and Engagement
Financial Administration
Compliance and Risk Management
Customer Service
Motor Vehicle and Driver
Licensing
Human Resources

Shire of Quairading Strategic Community Plan
25 | P a g e
OBJECTIVES, OUTCOMES AND STRATEGIES
The Shire has five major objectives as listed below. The tables that follow outlined the strategies that
will contribute to the objectives.
Economic Growing economy and employment opportunities
Social Active, healthy, safe and inclusive community
Built Environment Planning and infrastructure to meet the needs of the community
Natural Environment Sustained natural environment
Governance Strong governance and community engagement
Economic Objective: Growing economy and employment opportunities
ITEM OUTCOMES AND STRATEGIES WORKING WITH
ED1 Economic diversity and resilience
ED1.1 Economic and tourism development, including:
adopt “Small Business Friendly Local Governments” program
review potential of the community’s existing assets and
facilities to drive improved economic outcomes
leverage Federal and State Government priorities and
programs (e.g. building the capacity of local industry to
undertake Local and State Government contracts)
work with stakeholders to determine facilitation approach
to business and jobs growth
Wheatbelt Development
Commission (WDC),
Regional Development
Australia (RDA)
Wheatbelt, Wheatbelt
Business Network (WBN),
Quairading CRC, local
businesses, other
stakeholders as identified
ED2 Tourism facilities and services
ED2.1 Contribute to readily accessible visitor information and services,
including good quality, affordable visitor accommodation
Quairading CRC, Other
businesses, Tidy Towns,
accommodation providers
Social Objective: Active, healthy, safe and inclusive community
ITEM OUTCOMES AND STRATEGIES WORKING WITH
S1 Active community
S1.1 Provide facilities and support participation in sport and
recreational activities, facilities and clubs
Quairading CRC, sports
clubs
S1.2 Promote increased participation in the social and cultural life of
the community
Quairading CRC,
community groups
S2 Healthy community
S2.1 Advocate on behalf of the community for improved access to
health Health advocacy groups

Shire of Quairading Strategic Community Plan
26 | P a g e
ITEM OUTCOMES AND STRATEGIES WORKING WITH
S2.2 Promote public health WA Country Health
Service (WACHS) and
Aboriginal Health Services
S3 Safe community
S3.1 Support emergency services planning, risk mitigation, response
and recovery
Emergency Service
Agencies
S3.2 Provide animal control and various enforcement services to
maintain public safety -
S4 Inclusive community
S4.1 Facilitate the Noongar Reconciliation and Cultural Awareness
Process
Reconciliation Action
Planning Committee
(RAPC)
S4.2 Actively support youth development School and other youth
organisations
S4.3 Support economic participation through child care provision -
S4.4 Actively support ‘Ageing in Place’ services, housing and
infrastructure
Cunderdin and Tammin
with support from WDC
and/or RDA (housing)
WA Country Health
Service (WACHS)
S4.5 Actively support the access and inclusion of people with
disability, their families and carers
Sports, social and
community
organisations
Built Environment Objective: Planning and infrastructure to meet the needs of the
community
ITEM OUTCOMES AND STRATEGIES WORKING WITH
B1 Responsive Land Use Planning
B1.1 Ensure land use planning services are responsive to community
aspirations including increased availability of industrial,
commercial and residential land.
Community and other
stakeholders (review of
Local Planning Strategy &
Town Planning Scheme)
B2 Enhanced and Sustainably Managed Assets and Infrastructure
B2.1 Ensure the provision of roads, footpaths and drainage takes into
account the needs of the community, including the needs of the
agriculture industry
-
B2.2 Ensure the provision of community facilities and other built
assets takes into account the needs of the community -

Shire of Quairading Strategic Community Plan
27 | P a g e
Natural Environment Objective: To preserve and sustain our natural environment
ITEM OUTCOMES AND STRATEGIES WORKING WITH
NE1 Demonstrated Sustainable Practices
NE1.1 Continue efficient use of water and energy -
NE1.2 Provide sustainable waste management -
NE2 Protected and valued natural areas
NE2.1 Manage regulation of vegetation clearing Landowners, State
agencies
NE2.2 Ensure nature reserves and reserves are well managed to meet
the needs of the community to enjoy natural areas
Land Conservation
District Committee
(LCDC) and Friends of the
Nature Reserves
Governance Objective: Strong governance and community engagement
ITEM OUTCOMES AND STRATEGIES WORKING WITH
G1 Robust Integrated Planning and Reporting (IPR)
G1.1 Continual improvement in IPR, transparency and accountability -
G2 Strengthened Advocacy and Partnerships
G2.1 Partnerships with and advocacy to Federal and State
Government to strengthen service provision within the Shire Relevant agencies
G2.3 Regional and sub-regional partnerships to achieve better
outcomes for the community
WDC, Cunderdin,
Tammin
G3 Community Engagement
G3.1 Provide appealing opportunities for the community to
participate in decisions that affect them -
G3.2 Collaborate with the community to achieve desired outcomes RAPC, Quairading CRC,
Sport and Recreation
Council (SRC), Heritage
Advisory Working Group,
Centenary Park Working
Group, Quairading Ski
Club, Multi-Purpose
Precinct Working Group
G4 Sound Organisation
G4.1 Maintain sustainability ratios at or above basic level -
G4.2 Increase non-rates revenue generation -
G4.3 Ensure optimum organisational capacity and efficiency -

Shire of Quairading Strategic Community Plan
28 | P a g e
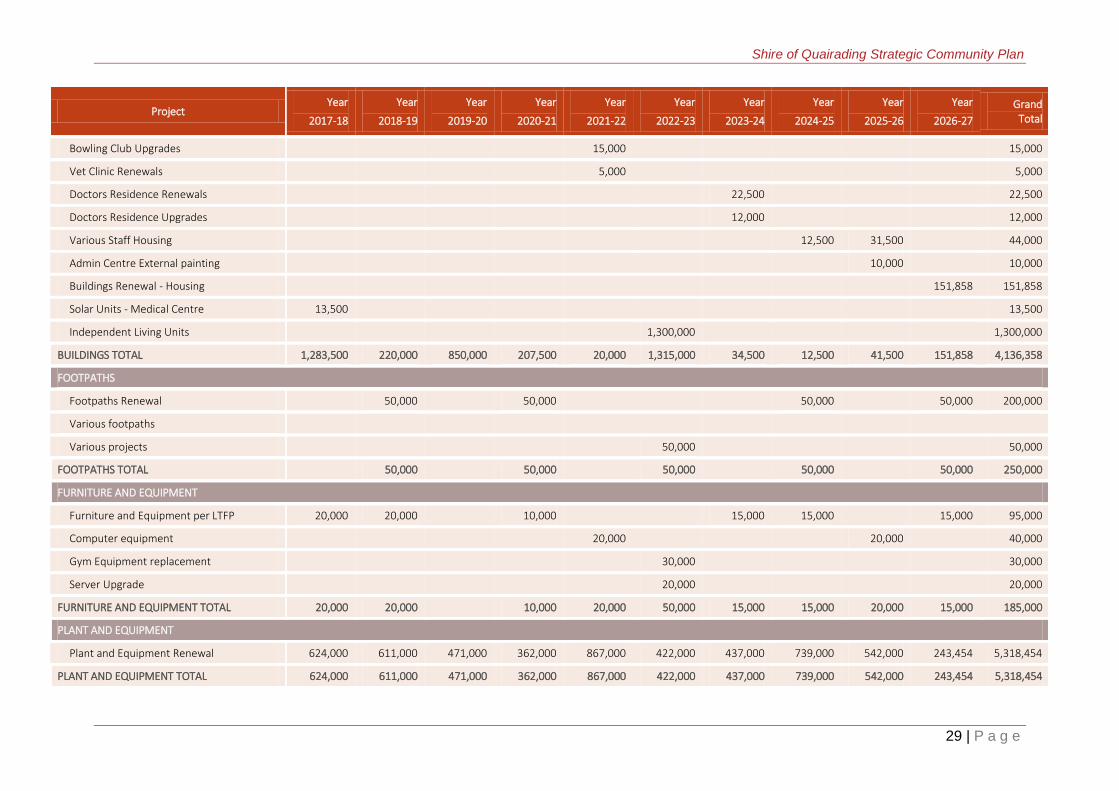
CAPITAL WORKS PROGRAM
The capital works program is shown in the table below. In addition to a substantial program of asset renewals and flood remediation work, the Plan envisages
a number of major new projects, which are aligned to the strategic priorities of the Plan to enhance the liveability and economic prospects of the district.
Many of the major new projects are dependent on grant funding. The later years of the Plan will see substantial investment in sport and recreation. This will
be preceded by a period of engagement and planning. The Council will undertake due diligence on all major capital and operational projects prior to any final
decision to proceed. This will be done in order to ensure they are sustainable, viable and affordable (including whole of life costs) for Council and the
community.
CAPITAL WORKS PROGRAM - OVERVIEW
The projected capital works program reflects the priorities of the plan.
Project Year
2017-18
Year
2018-19
Year
2019-20
Year
2020-21
Year
2021-22
Year
2022-23
Year
2023-24
Year
2024-25
Year
2025-26
Year
2026-27
Grand Total
BUILDINGS
Depot 900,000
900,000
Caravan Park Cottages 370,000
370,000
Buildings Renewal
35,000
35,000
Administration Centre External Paint
10,000
10,000
Medical Centre Building Compliance
75,000
15,000
90,000
Quairading Hall Rendering and Painting
50,000
50,000
Quairading Hall Roofing
50,000
50,000
Administration Centre Compliance
100,000
100,000
Light Industrial Lots developed
750,000
750,000
19 Gillet Street Upgrades
12,500
12,500
Bowling Club Renew Synthetic surface
165,000
165,000
Community Resource centre Int/Ext Painting
30,000
30,000
Shire of Quairading Strategic Community Plan
29 | P a g e
Project Year
2017-18
Year
2018-19
Year
2019-20
Year
2020-21
Year
2021-22
Year
2022-23
Year
2023-24
Year
2024-25
Year
2025-26
Year
2026-27
Grand Total
Bowling Club Upgrades
15,000
15,000
Vet Clinic Renewals
5,000
5,000
Doctors Residence Renewals
22,500
22,500
Doctors Residence Upgrades
12,000
12,000
Various Staff Housing
12,500 31,500
44,000
Admin Centre External painting
10,000
10,000
Buildings Renewal - Housing
151,858 151,858
Solar Units - Medical Centre 13,500
13,500
Independent Living Units
1,300,000
1,300,000
BUILDINGS TOTAL 1,283,500 220,000 850,000 207,500 20,000 1,315,000 34,500 12,500 41,500 151,858 4,136,358
FOOTPATHS
Footpaths Renewal
50,000
50,000
50,000
50,000 200,000
Various footpaths
Various projects
50,000
50,000
FOOTPATHS TOTAL
50,000
50,000
50,000
50,000
50,000 250,000
FURNITURE AND EQUIPMENT
Furniture and Equipment per LTFP 20,000 20,000
10,000
15,000 15,000
15,000 95,000
Computer equipment
20,000
20,000
40,000
Gym Equipment replacement
30,000
30,000
Server Upgrade
20,000
20,000
FURNITURE AND EQUIPMENT TOTAL 20,000 20,000 10,000 20,000 50,000 15,000 15,000 20,000 15,000 185,000
PLANT AND EQUIPMENT
Plant and Equipment Renewal 624,000 611,000 471,000 362,000 867,000 422,000 437,000 739,000 542,000 243,454 5,318,454
PLANT AND EQUIPMENT TOTAL 624,000 611,000 471,000 362,000 867,000 422,000 437,000 739,000 542,000 243,454 5,318,454

Shire of Quairading Strategic Community Plan
30 | P a g e
Project Year
2017-18
Year
2018-19
Year
2019-20
Year
2020-21
Year
2021-22
Year
2022-23
Year
2023-24
Year
2024-25
Year
2025-26
Year
2026-27
Grand Total
LAND
Land sale costs 20,000 10,000 10,000 10,000 10,000 10,000 10,000 10,000 10,000 10,000 110,000
LAND TOTAL 20,000 10,000 10,000 10,000 10,000 10,000 10,000 10,000 10,000 10,000 110,000
DRAINAGE
Drainage Renewals 462,173 393,189 405,382 1,260,744
DRAINAGE TOTAL 462,173 393,189 405,382 1,260,744
ROADS
Roads Renewal RRG R2R
910,631 910,631
RRG Projects (Dangin Mears Yr 1) 450,000 450,000 450,000 450,000 450,000 450,000 450,000 450,000 450,000
4,050,000
Various projects R2R 258,630 258,630 258,630 258,630 258,630 258,630 258,630 258,630 258,630
2,357,670
Various road projects 400,000 150,000 440,000 460,000 480,000 500,000 520,000 540,000 560,000
4,050,000
ROADS TOTAL 1,108,630 858,630 1,148,630 1,168,630 1,188,630 1,208,630 1,228,630 1,248,630 1,268,630 910,631 11,338,301
OTHER COMMUNITY & RECREATION FACILITIES
Other Community & Recreation Facilities Renewal
Centenary park - Development Park and new playground
225,000
225,000
Kevill's Lake Water ski area
200,000
200,000
Sports oval renewal of Football scoreboards
20,000
20,000
Hall Precinct Car Park
325,000
325,000
Memorial Park Play equipment
30,000
30,000
Air field Bitumen Apron
30,000
30,000
Memorial Park - Reticulation
5,000
5,000
Airfield Runway Lighting
100,000
100,000

Shire of Quairading Strategic Community Plan
31 | P a g e
Project Year
2017-18
Year
2018-19
Year
2019-20
Year
2020-21
Year
2021-22
Year
2022-23
Year
2023-24
Year
2024-25
Year
2025-26
Year
2026-27
Grand Total
Community Building / Rec Facilities Phase 1
2,000,000
2,000,000
Bowling club - Floodlights
35,000
35,000
Community Building / Rec Facilities Phase 2
Community Building / Rec Facilities Phase 3
OTHER COMMUNITY & RECREATION FACILITIES TOTAL 750,000 30,000 30,000 5,000 20,000 100,000
2,035,000
2,970,000
BRIDGES
Bridges Renewal 290,270 387,630 405,942 335,891 1,419,733
BRIDGES TOTAL 290,270 387,630 405,942 335,891 1,419,733
GRAND TOTAL 3,518,303 2,519,630 2,902,819 2,128,400 2,498,260 3,481,572 2,230,512 2,075,130 4,253,021 1,380,943 26,988,590

Shire of Quairading Strategic Community Plan
32 | P a g e
CAPITAL WORKS PROGRAM – FUNDING SOURCES
The funding profile for capital projects is shown in the table below.
Capital Expenditure Source of Funding Total
Funding
Renewal Expenditure
New Service Expenditure
Upgrade Expenditure
Total Capital Expenditure
Shire Funding
Reserve Funding
Borrowings Grant
Funding Developer
Contributions Proceeds on
disposal
2017-18
BUILDINGS
Depot 900,000
900,000 200,000 200,000 500,000
900,000
Caravan Park Cottages
370,000
370,000 90,000 120,000 160,000
370,000
Solar Units - Medical Centre
13,500
13,500 13,500
13,500
Footpaths
Footpaths Renewal
Furniture and Equipment
Furniture and Equipment per LTFP
20,000
20,000 10,000 10,000
20,000
Plant and Equipment
Plant and Equipment Renewal 624,000
624,000
334,000
290,000 624,000
LAND
Land sale costs
20,000
20,000 20,000
20,000
DRAINAGE
Drainage Renewals 462,173
462,173 212,173
250,000
462,173
ROADS
Dangin Mears 450,000
450,000 150,000
300,000
450,000
Various projects r2r 258,630
258,630
258,630
258,630
Various road projects 400,000
400,000 400,000
400,000

Shire of Quairading Strategic Community Plan
33 | P a g e
Capital Expenditure Source of Funding Total
Funding
Renewal Expenditure
New Service Expenditure
Upgrade Expenditure
Total Capital Expenditure
Shire Funding
Reserve Funding
Borrowings Grant
Funding Developer
Contributions Proceeds on
disposal
BRIDGES
Bridges Renewal
2017-18 TOTAL 3,114,803 403,500 3,518,303 1,095,673 664,000 660,000 808,630 290,000 3,518,303
2018-19
BUILDINGS
Buildings Renewal 35,000
35,000 35,000
35,000
Administration Centre External Paint
10,000
10,000 10,000
10,000
Medical Centre Building Compliance
75,000 75,000 75,000
75,000
Quairading Hall Painting 50,000
50,000 50,000
50,000
Quairading Hall Roofing 50,000
50,000 50,000
50,000
FOOTPATHS
Footpaths Renewal 50,000
50,000 50,000
50,000
FURNITURE AND EQUIPMENT
Furniture and Equipment per LTFP
20,000
20,000 20,000
20,000
PLANT AND EQUIPMENT
Plant and Equipment Renewal 611,000
611,000 63,000 244,000
304,000 611,000
LAND
Land sale costs
10,000
10,000 10,000
10,000
DRAINAGE
Drainage Renewals

Shire of Quairading Strategic Community Plan
34 | P a g e
Capital Expenditure Source of Funding Total
Funding
Renewal Expenditure
New Service Expenditure
Upgrade Expenditure
Total Capital Expenditure
Shire Funding
Reserve Funding
Borrowings Grant
Funding Developer
Contributions Proceeds on
disposal
ROADS
Various projects r2r 258,630
258,630
258,630
258,630
Various road projects 150,000
150,000 150,000
150,000
Various Projects RRG 450,000
450,000 150,000
300,000
450,000
OTHER COMMUNITY & RECREATION FACILITIES
Centenary park - Development Park and new playground
225,000
225,000 75,000
75,000 75,000
225,000
Kevill's Lake Water ski area
200,000
200,000
150,000
50,000
200,000
Hall Precinct Car Park 325,000
325,000 75,000
250,000
325,000
BRIDGES
Bridges Renewal
2018-19 TOTAL 2,009,630 435,000 75,000 2,519,630 813,000 394,000 883,630 125,000 304,000 2,519,630
2019-20
BUILDINGS
Administration Centre Compliance
100,000 100,000 50,000
50,000
100,000
Light Industrial Lots developed
750,000
750,000
750,000
750,000
FOOTPATHS
Various footpaths
PLANT AND EQUIPMENT
Plant and Equipment Renewal 471,000
471,000 7,000 237,000
227,000 471,000
LAND
Land sale costs
10,000
10,000 10,000
10,000

Shire of Quairading Strategic Community Plan
35 | P a g e
Capital Expenditure Source of Funding Total
Funding
Renewal Expenditure
New Service Expenditure
Upgrade Expenditure
Total Capital Expenditure
Shire Funding
Reserve Funding
Borrowings Grant
Funding Developer
Contributions Proceeds on
disposal
DRAINAGE
Drainage Renewals 393,189
393,189
393,189
393,189
ROADS
Various Projects RRG 450,000
450,000 150,000
300,000
450,000
Roads Renewal R2R 258,630
258,630
258,630
258,630
Various projects Roads 440,000
440,000 440,000
440,000
OTHER COMMUNITY & RECREATION FACILITIES
Memorial Park Play equipment 30,000
30,000 10,000
20,000
30,000
BRIDGES
Bridges Renewal
0
2019-20 TOTAL 2,042,819 760,000 100,000 2,902,819 667,000 630,189 1,378,630 227,000 2,902,819
2020-21
BUILDINGS
19 Gillet Street Upgrades
12,500 12,500 12,500
12,500
Bowling Club Renew Synthetic surface
165,000
165,000
165,000
165,000
CRC Int/Ext Painting 30,000
30,000 30,000
30,000
FOOTPATHS
Footpaths Renewal
50,000 50,000 50,000
50,000
FURNITURE AND EQUIPMENT
Furniture and Equipment per LTFP
10,000
10,000 10,000
10,000
PLANT AND EQUIPMENT
Plant and Equipment Renewal 362,000
362,000 68,000 149,000
145,000 362,000

Shire of Quairading Strategic Community Plan
36 | P a g e
Capital Expenditure Source of Funding Total
Funding
Renewal Expenditure
New Service Expenditure
Upgrade Expenditure
Total Capital Expenditure
Shire Funding
Reserve Funding
Borrowings Grant
Funding Developer
Contributions Proceeds on
disposal
LAND
Land sale costs
10,000
10,000 10,000
10,000
DRAINAGE
Drainage Renewals
ROADS
Various road projects 460,000
460,000 460,000
460,000
Various Projects RRG 450,000
450,000 150,000
300,000
450,000
Roads Renewal R2R 258,630
258,630
258,630
258,630
OTHER COMMUNITY & RECREATION FACILITIES
Air field Bitumen Apron 30,000
30,000
30,000
30,000
BRIDGES
Bridges Renewal 290,270
290,270 290,270
290,270
2020-21 TOTAL 2,055,900 10,000 62,500 2,128,400 1,080,770 149,000 165,000 588,630 145,000 2,128,400
2021-22
BUILDINGS
Bowling Club Upgrades
15,000 15,000 15,000
15,000
Vet Clinic Renewals 5,000
5,000 5,000
5,000
FOOTPATHS
Footpaths Renewal
FURNITURE AND EQUIPMENT
Computer equipment 20,000
20,000 20,000
20,000
PLANT AND EQUIPMENT
Plant and Equipment Renewal 867,000
867,000 37,000 412,000
418,000 867,000

Shire of Quairading Strategic Community Plan
37 | P a g e
Capital Expenditure Source of Funding Total
Funding
Renewal Expenditure
New Service Expenditure
Upgrade Expenditure
Total Capital Expenditure
Shire Funding
Reserve Funding
Borrowings Grant
Funding Developer
Contributions Proceeds on
disposal
LAND
Land sale costs
10,000
10,000 10,000
10,000
DRAINAGE
Drainage Renewals
ROADS
Various road projects 480,000
480,000 480,000
480,000
Various Projects RRG 450,000
450,000 150,000
300,000
450,000
Roads Renewal R2R 258,630
258,630
258,630
258,630
OTHER COMMUNITY & RECREATION FACILITIES
Memorial Park - Reticulation 5,000
5,000 5,000
5,000
BRIDGES
Bridges Renewal 387,630
387,630 387,630
387,630
2021-22 TOTAL 2,473,260 10,000 15,000 2,498,260 1,109,630 412,000 558,630 418,000 2,498,260
2022-23
BUILDINGS
Medical Centre Building Compliance
15,000 15,000 15,000
15,000
Independent Living Units
1,300,000
1,300,000 350,000
950,000
1,300,000
FOOTPATHS
Various projects
50,000 50,000 50,000
50,000
FURNITURE AND EQUIPMENT
Gym Equipment replacement 30,000
30,000 30,000
30,000
Server Upgrade 20,000
20,000 20,000
20,000

Shire of Quairading Strategic Community Plan
38 | P a g e
Capital Expenditure Source of Funding Total
Funding
Renewal Expenditure
New Service Expenditure
Upgrade Expenditure
Total Capital Expenditure
Shire Funding
Reserve Funding
Borrowings Grant
Funding Developer
Contributions Proceeds on
disposal
PLANT AND EQUIPMENT
Plant and Equipment Renewal 422,000
422,000 6,000 234,000
182,000 422,000
LAND
Land sale costs
10,000
10,000 10,000
10,000
DRAINAGE
Drainage Renewals
ROADS
Various road projects 500,000
500,000 500,000
500,000
Various Projects RRG 450,000
450,000 150,000
300,000
450,000
Roads Renewal R2R 258,630
258,630
258,630
258,630
OTHER COMMUNITY & RECREATION FACILITIES
Other Community & Recreation Facilities Renewal
Sports oval renewal of Football scoreboards
20,000
20,000 20,000
20,000
BRIDGES
Bridges Renewal 405,942
405,942 242,090 163,852
405,942
2022-23 TOTAL 2,106,572 1,310,000 65,000 3,481,572 1,393,090 397,852 1,508,630 182,000 3,481,572
2023-24
BUILDINGS
Doctors Residence Renewals 22,500
22,500 22,500
22,500
Doctors Residence Upgrades
12,000 12,000 12,000
12,000
FOOTPATHS
Footpaths Renewal

Shire of Quairading Strategic Community Plan
39 | P a g e
Capital Expenditure Source of Funding Total
Funding
Renewal Expenditure
New Service Expenditure
Upgrade Expenditure
Total Capital Expenditure
Shire Funding
Reserve Funding
Borrowings Grant
Funding Developer
Contributions Proceeds on
disposal
FURNITURE AND EQUIPMENT
Furniture and Equipment per LTFP
15,000
15,000 15,000
15,000
PLANT AND EQUIPMENT
Plant and Equipment Renewal 437,000
437,000
199,000
238,000 437,000
LAND
Land sale costs
10,000
10,000 10,000
10,000
DRAINAGE
Drainage Renewals 405,382
405,382 405,382
405,382
ROADS
Various road projects 520,000
520,000 520,000
520,000
Various Projects RRG 450,000
450,000 150,000
300,000
450,000
Roads Renewal R2R 258,630
258,630
258,630
258,630
Other Community & Recreation Facilities
Airfield Runway Lighting 100,000
100,000
100,000
100,000
BRIDGES
Bridges Renewal
2023-24 TOTAL 2,208,512 10,000 12,000 2,230,512 1,134,882 199,000 658,630 238,000 2,230,512
2024-25
BUILDINGS
Various Staff Housing 12,500
12,500 12,500
12,500
FOOTPATHS
Footpaths Renewal
50,000 50,000 50,000
50,000
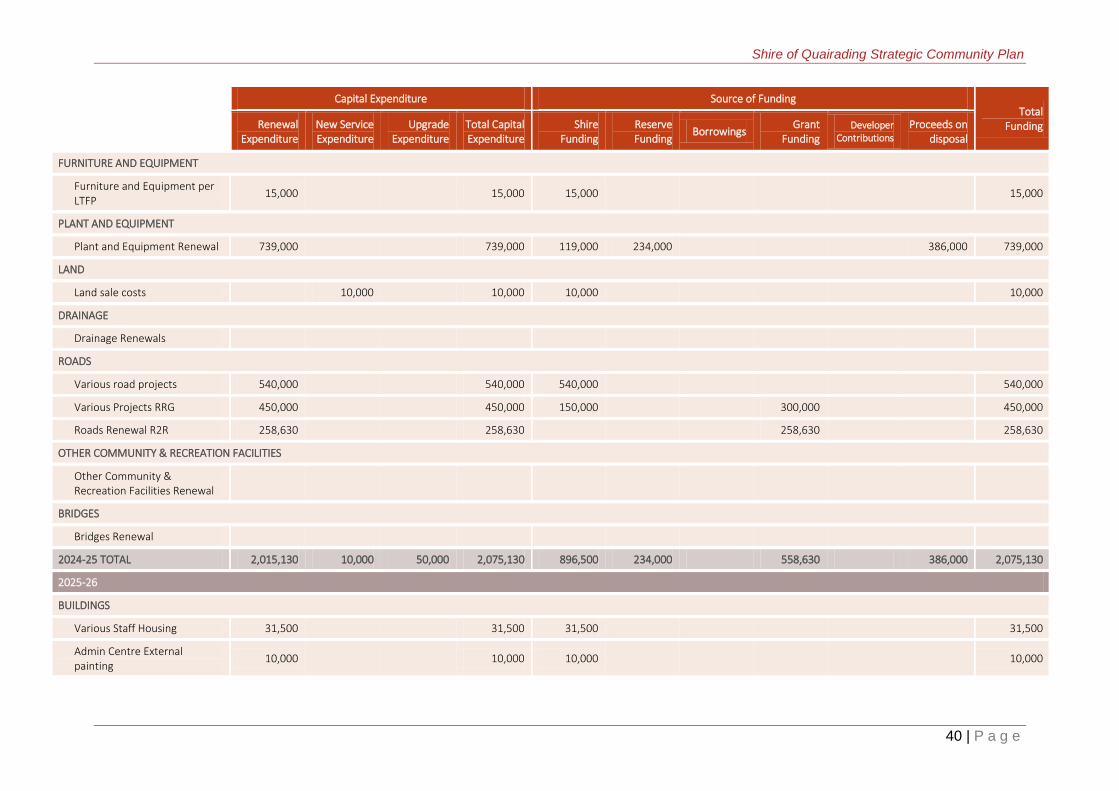
Shire of Quairading Strategic Community Plan
40 | P a g e
Capital Expenditure Source of Funding Total
Funding
Renewal Expenditure
New Service Expenditure
Upgrade Expenditure
Total Capital Expenditure
Shire Funding
Reserve Funding
Borrowings Grant
Funding Developer
Contributions Proceeds on
disposal
FURNITURE AND EQUIPMENT
Furniture and Equipment per LTFP
15,000
15,000 15,000
15,000
PLANT AND EQUIPMENT
Plant and Equipment Renewal 739,000
739,000 119,000 234,000
386,000 739,000
LAND
Land sale costs
10,000
10,000 10,000
10,000
DRAINAGE
Drainage Renewals
ROADS
Various road projects 540,000
540,000 540,000
540,000
Various Projects RRG 450,000
450,000 150,000
300,000
450,000
Roads Renewal R2R 258,630
258,630
258,630
258,630
OTHER COMMUNITY & RECREATION FACILITIES
Other Community & Recreation Facilities Renewal
BRIDGES
Bridges Renewal
2024-25 TOTAL 2,015,130 10,000 50,000 2,075,130 896,500 234,000 558,630 386,000 2,075,130
2025-26
BUILDINGS
Various Staff Housing 31,500
31,500 31,500
31,500
Admin Centre External painting
10,000
10,000 10,000
10,000

Shire of Quairading Strategic Community Plan
41 | P a g e
Capital Expenditure Source of Funding Total
Funding
Renewal Expenditure
New Service Expenditure
Upgrade Expenditure
Total Capital Expenditure
Shire Funding
Reserve Funding
Borrowings Grant
Funding Developer
Contributions Proceeds on
disposal
FOOTPATHS
Footpaths Renewal
FURNITURE AND EQUIPMENT
Computer equipment 20,000
20,000 20,000
20,000
PLANT AND EQUIPMENT
Plant and Equipment Renewal 542,000
542,000 10,320 238,680
293,000 542,000
LAND
Land sale costs
10,000
10,000 10,000
10,000
DRAINAGE
Drainage Renewals
ROADS
Various road projects 560,000
560,000 560,000
560,000
Various Projects RRG 450,000
450,000 150,000
300,000
450,000
Roads Renewal R2R 258,630
258,630
258,630
258,630
OTHER COMMUNITY & RECREATION FACILITIES
Community Building / Rec Facilities Phase 1
2,000,000
2,000,000 250,000 500,000 500,000 750,000
2,000,000
Bowling club - Floodlights 35,000
35,000
35,000
35,000
BRIDGES
Bridges Renewal 335,891
335,891 335,891
335,891
2025-26 TOTAL 4,243,021 10,000 4,253,021 1,377,711 738,680 500,000 1,343,630 293,000 4,253,021
2026-27
BUILDINGS
Buildings Renewal - Housing 151,858
151,858 151,858
151,858

Shire of Quairading Strategic Community Plan
42 | P a g e
Capital Expenditure Source of Funding Total
Funding
Renewal Expenditure
New Service Expenditure
Upgrade Expenditure
Total Capital Expenditure
Shire Funding
Reserve Funding
Borrowings Grant
Funding Developer
Contributions Proceeds on
disposal
FOOTPATHS
Footpaths Renewal 50,000
50,000
50,000
50,000
FURNITURE AND EQUIPMENT
Furniture and Equipment per LTFP
15,000
15,000 15,000
15,000
PLANT AND EQUIPMENT
Plant and Equipment Renewal 243,454
243,454
243,454
243,454
LAND
Land sale costs
10,000
10,000 10,000
10,000
DRAINAGE
Drainage Renewals
ROADS
Roads Renewal RRG R2R 910,631
910,631
217,333
693,298
910,631
Other Community & Recreation Facilities
Other Community & Recreation Facilities Renewal
BRIDGES
Bridges Renewal
2026-27 TOTAL 1,370,943 10,000 1,380,943 176,858 510,787 693,298 1,380,943

Shire of Quairading Strategic Community Plan
43 | P a g e
LONG TERM FINANCIAL PROFILE
The tables below provide key information regarding the cost and funding of the Plan. The Shire has an underlying gap in asset renewals, particularly for roads.
Like many rural Shires, asset renewals have been subject to historic underfunding. While this suppresses rates, it leads to a decline in the serviceability of the
assets. It is therefore vital to close this gap, particularly to preserve the serviceability of our local road network for our economy and community. The capital
works program outlined above reflects that priority.
The cost of this is reflected in rates increases of 1-3% above inflation, with the higher increases in the early years. The long term financial profile assumes
inflation at the rate of 2%. The increases are 1% above inflation by year 4 (2021). This is detailed in the assumptions table below.
Prudent borrowing is used to spread the cost of major new assets over their life. The Shire will actively pursue grants for priority projects, and will maximise
revenue generation from activities such as private works.
Due diligence will be applied to all proposed major capital and operational projects to ensure they are sustainable, viable and affordable.
There are moderate increases in operational costs to fund economic development initiatives, which was a high priority to emerge from the community
engagement. There are also some non-discretionary items in areas such as town planning and workforce planning. These increases are offset by a decrease in
the operational costs for the waste and recycling plant.
The Building Reserve will be extended by earmarking net proceeds from rent and sale of land or houses.
Despite strenuous effort to balance the community’s aspirations with affordability, the long term financial profile shows that this is an ongoing challenge.
Further work is needed on the next version of the Long Term Financial Plan to eliminate projected deficits, whilst still making adequate provision for
renewals, including “lumpy” items like drainage.
Testing of the long term financial profile using the prescribed financial and asset sustainability ratios reinforces the challenge of asset renewals. Both the
operating surplus ratio and the asset sustainability ratio reflect this challenge. This operating surplus ratio gap is a function of the cost of depreciation, again
particularly for roads. As is the case for most rural Shires, there is insufficient operating revenue to cover the cost of the depreciation (which is theoretically
the amount needed to be spent/set aside for renewals). As is typically the way, this issue is mirrored in the asset sustainability ratio, which is improving but
still under the optimal level. The Shire will also attend to improving its “working capital” situation to address the shortcoming in the current ratio.
The following tables provide the detailed projections: abridged forecast statement of funding 2017-27; financial profile assumptions 2017-27; forecast
statement of capital funding 2017-27; and ratio analysis 2017-27 averages.

Shire of Quairading Strategic Community Plan
44 | P a g e
ABRIDGED FORECAST STATEMENT OF FUNDING 2017 – 2027
2017-18
$
2018-19
$
2019-20
$
2020-21
$
2021-22
$
2022-23
$
2023-24
$
2024-25
$
2025-26
$
2026-27
$
FUNDING FROM OPERATIONAL ACTIVITIES
REVENUES
Rates 2,157,125 2,243,410 2,333,146 2,403,140 2,475,234 2,549,491 2,625,975 2,704,754 2,785,896 2,869,473
All other operating revenue 3,535,045 3,586,041 3,657,383 3,729,312 3,808,031 3,880,085 3,949,173 4,029,895 4,117,448 4,187,581
TOTAL REVENUE 5,692,170 5,829,451 5,990,529 6,132,452 6,283,265 6,429,576 6,575,148 6,734,649 6,903,344 7,057,054
EXPENSES
Cash operating expenditure (4,509,776) (4,627,191) (4,739,104) (4,844,255) (4,944,221) (5,043,464) (5,139,754) (5,237,896) (5,350,371) (5,463,892)
Net Funding available from operational activities 1,182,394 1,202,260 1,251,425 1,288,197 1,339,044 1,386,112 1,435,394 1,496,753 1,552,973 1,593,162
Net Capital Program (excluding carry over projects)
(2,338,073) (1,123,768) (1,212,292) (1,308,175) (1,433,303) (1,700,848) (1,241,986) (1,036,766) (2,520,782) (590,124)
Net Borrowings 665,000 (58,045) (60,774) 266,359 (66,650) (69,813) (73,136) (76,628) 400,128 (97,514)
Net Reserve Transfers 382,594 120,247 (34,349) (123,038) 137,504 (37,747) (323,501) (294,971) 203,809 (455,378)
Opening Surplus/(Deficit) July 1 0 0 0 0 0 0 0 0 0 0
ESTIMATED SURPLUS/(DEFICIT) FOR THE YEAR ENDED 30 JUNE
(108,085) 140,694 (55,990) 123,343 (23,405) (422,296) (203,229) 88,388 (363,872) 450,146

Shire of Quairading Strategic Community Plan
45 | P a g e
FINANCIAL PROFILE ASSUMPTIONS 2017 - 2027
2017-18
$
2018-19
$
2019-20
$
2020-21
$
2021-22
$
2022-23
$
2023-24
$
2024-25
$
2025-26
$
2026-27
$
OPERATING
REVENUES
Rates 5.00% 4.00% 4.00% 3.00% 3.00% 3.00% 3.00% 3.00% 3.00% 3.00%
Operating grants, subsidies, contributions 2.00% 2.00% 2.00% 2.00% 2.00% 2.00% 2.00% 2.00% 2.00% 2.00%
Non-Operating grants, subsidies, contributions (73.63%) 22.65% (34.04%) (53.86%) (4.19%) 147.11% (53.05%) (13.08%) 120.62% (45.05%)
Fees and charges 2.00% 2.00% 2.00% 2.00% 2.00% 2.00% 2.00% 2.00% 2.00% 2.00%
Service charges - - - - - - - - - -
Interest earnings (56.96%) (42.96%) 0.29% (3.08%) 18.81% (12.37%) (31.82%) 11.78% 37.77% (44.17%)
Other revenue 2.00% 2.02% 2.05% 2.05% 2.04% 2.04% 2.04% 2.04% 2.04% 2.05%
TOTAL REVENUE 2.03% 2.41% 2.76% 2.37% 2.46% 2.33% 2.26% 2.43% 2.50% 2.23%
EXPENSES
Employee costs 2.00% 2.00% 2.00% 2.00% 2.00% 2.00% 2.00% 2.00% 2.00% 2.00%
Materials and contracts 2.00% 2.00% 3.35% 2.63% 2.25% 2.25% 2.00% 2.00% 2.00% 2.00%
Utility charges e.g. electricity, gas, water 2.00% 2.00% 2.00% 2.00% 2.00% 2.00% 2.00% 2.00% 2.00% 2.00%
Depreciation on non-current assets (4.78%) 2.97% 2.93% 2.52% 2.77% 3.12% 2.33% 2.57% 2.40% 2.44%
Interest Expense (26.32%) 314.67% (13.60%) 3.22% (4.34%) (14.07%) (16.50%) (20.48%) 48.84% 28.52%
Insurance expense 2.00% 2.00% 2.00% 2.00% 2.00% 2.00% 2.00% 2.00% 2.00% 2.00%
Other expenditure 2.00% 2.00% 2.00% 2.00% 2.00% 2.00% 2.00% 2.00% 2.00% 2.00%
TOTAL EXPENSES (1.06%) 2.76% 2.64% 2.35% 2.37% 2.49% 2.09% 2.20% 2.26% 2.26%
NET OPERATIONS (8.22%) 3.66% 2.32% 2.29% 2.14% 2.90% 1.66% 1.62% 1.62% 2.35%

Shire of Quairading Strategic Community Plan
46 | P a g e
2017-18
$
2018-19
$
2019-20
$
2020-21
$
2021-22
$
2022-23
$
2023-24
$
2024-25
$
2025-26
$
2026-27
$
CAPITAL
BORROWINGS
Total Long Term Liabilities ($) 1,285,244 1,192,627 1,096,044 1,153,815 1,062,815 977,129 889,194 797,018 1,180,811 1,066,135
Movement in Total Long Term Liabilities (7.21%) (7.12%) (8.10%) 5.27% (7.89%) (8.06%) (9.00%) (10.37%) 48.15% (9.71%)
Movement in Total Long Term Liabilities ($) 632,476 (92,617) (96,583) 57,771 (91,000) (85,686) (87,935) (92,176) 383,793 (114,676)
RESERVES
Total Cash Backed Reserves ($) 1,187,244 1,067,451 1,101,800 1,224,838 1,087,334 1,125,081 1,448,582 1,743,553 1,539,744 1,995,122
Movement in Total Cash Backed Reserves (10.12%) (10.12%) 3.21% 11.17% (11.23%) 3.47% 28.75% 20.36% (11.69%) 29.57%
Movement in Total Cash Backed Reserves ($) (382,594) (120,247) 34,349 123,038 (137,504) 37,747 323,501 294,971 (203,809) 455,378
PROPERTY, PLANT AND EQUIPMENT
Total WDV. Property, Plant and Equipment ($) 25,526,561 25,822,973 26,626,703 26,755,182 26,890,565 28,090,510 27,925,402 27,844,840 27,658, 406 27,534,824
Movement in WDV. Property, Plant and Equipment
1.16% 1.16% 3.11% 0.48% 0.51% 4.46% (0.59%) (0.29%) (0.67%) (0.45%)
Movement in WDV. Property, Plant and Equipment ($)
1,324,703 296,412 803,730 128,479 135,383 1,199,945 (165,108) (80,562) (186,434) (123,582)
INFRASTRUCTURE
Total WDV. Infrastructure ($) 119,395,514 120,674,184 121,836,258 122,931,359 124,033,112 125,200,616 126,380,955 127,087,532 130,086,740 130,403,399
Movement in WDV. Infrastructure (0.50%) 1.07% 0.96% 0.90% 0.90% 0.94% 0.94% 0.56% 2.36% 0.24%
Movement in WDV. Infrastructure ($) (601,622) 1,278,670 1,162,074 1,095,101 1,101,753 1,167,504 1,180,339 706,577 2,999,208 316,659
Movement in WDV. Property, Plant and Equipment
1.16% 2.32% 5.43% 5.92% 6.42% 10.89% 10.30% 10.01% 9.34% 8.89%
Movement in WDV. Infrastructure (0.50%) 0.57% 1.53% 2.43% 3.33% 4.27% 5.21% 5.77% 8.13% 8.37%
Note that the long term financial profile assumes inflation at a rate of 2%.

Shire of Quairading Strategic Community Plan
47 | P a g e
FORECAST STATEMENT OF CAPITAL FUNDING 2017-27
2017-18
$
2018-19
$
2019-20
$
2020-21
$
2021-22
$
2022-23
$
2023-24
$
2024-25
$
2025-26
$
2026-27
$
CAPITAL EXPENDITURE
Roads 1,108,630 858,630 1,148,630 1,168,630 1,188,630 1,208,630 1,228,630 1,248,630 1,268,630 910,631
Footpaths 0 50,000 0 50,000 0 50,000 0 50,000 0 50,000
Drainage 462,173 0 393,189 0 0 0 405,382 0 0 0
Bridges 0 0 0 290,270 387,630 405,942 0 0 335,891 0
Other Community & Recreation Facilities 0 750,000 30,000 30,000 5,000 20,000 100,000 0 2,035,000 0
Land 20,000 10,000 10,000 10,000 10,000 10,000 10,000 10,000 10,000 10,000
Buildings 1,283,500 220,000 850,000 207,500 20,000 1,315,000 34,500 12,500 41,500 151,858
Furniture and Equipment 20,000 20,000 0 10,000 20,000 50,000 15,000 15,000 20,000 15,000
Plant and Equipment 624,000 611,000 471,000 362,000 867,000 422,000 437,000 739,000 542,000 243,454
TOTAL - CAPITAL EXPENDITURE 3,518,303 2,519,630 2,902,819 2,128,400 2,498,260 3,481,572 2,230,512 2,075,130 4,253,021 1,380,943
FUNDED BY:
CAPITAL GRANTS & CONTRIBUTIONS
Roads 558,630 558,630 558,630 558,630 558,630 558,630 558,630 558,630 558,630 693,298
Drainage 250,000 0 0 0 0 0 0 0 0 0
Other Community & Recreation Facilities 0 450,000 20,000 30,000 0 0 100,000 0 785,000 0
Buildings 0 0 800,000 0 0 950,000 0 0 0 0
TOTAL - CAPITAL GRANTS & CONTRIBUTIONS 808,630 1,008,630 1,378,630 588,630 558,630 1,508,630 658,630 558,630 1,343,630 693,298
OWN SOURCE FUNDING
Roads 550,000 300,000 590,000 610,000 630,000 650,000 670,000 690,000 710,000 217,333
Footpaths 0 50,000 0 50,000 0 50,000 0 50,000 0 50,000
Drainage 212,173 0 393,189 0 0 0 405,382 0 0 0
Bridges 0 0 0 290,270 387,630 405,942 0 0 335,891 0

Shire of Quairading Strategic Community Plan
48 | P a g e
2017-18
$
2018-19
$
2019-20
$
2020-21
$
2021-22
$
2022-23
$
2023-24
$
2024-25
$
2025-26
$
2026-27
$
Other Community & Recreation Facilities 0 300,000 10,000 0 5,000 20,000 0 0 750,000 0
Land 20,000 10,000 10,000 10,000 10,000 10,000 10,000 10,000 10,000 10,000
Buildings 623,500 220,000 50,000 42,500 20,000 365,000 34,500 12,500 41,500 151,858
Furniture and Equipment 20,000 20,000 0 10,000 20,000 50,000 15,000 15,000 20,000 15,000
Plant and Equipment 334,000 307,000 244,000 217,000 449,000 240,000 199,000 353,000 249,000 243,454
TOTAL - OWN SOURCE FUNDING 1,759,673 1,207,000 1,297,189 1,229,770 1,521,630 1,790,942 1,333,882 1,130,500 2,116,391 687,645
BORROWINGS
Other Community & Recreation Facilities 0 0 0 0 0 0 0 0 500,000 0
Buildings 660,000 0 0 165,000 0 0 0 0 0 0
TOTAL - BORROWINGS 660,000 0 0 165,000 0 0 0 0 500,000 0
Other (Disposals & C/Fwd)
Plant and Equipment 290,000 304,000 227,000 145,000 418,000 182,000 238,000 386,000 293,000 0
TOTAL - OTHER (DISPOSALS & C/FWD) 290,000 304,000 227,000 145,000 418,000 182,000 238,000 386,000 293,000 0
TOTAL CAPITAL FUNDING 3,518,303 2,519,630 2,902,819 2,128,400 2,498,260 3,481,572 2,230,512 2,075,130 4,253,021 1,380,943
Unfunded - Capital Works
Total - Unfunded - Capital Works 0 0 0 0 0 0 0 0 0 0

Shire of Quairading Strategic Community Plan
49 | P a g e
RATIO ANALYSIS
Ratios TARGET
RANGE
10 year
Average Comment
LIQUIDITY RATIOS
Current Ratio
A measure of a local government’s liquidity and its ability to meet its short term financial obligations from unrestricted current assets.
1+ 1.2 On track
OPERATING RATIOS
Operating Surplus Ratio
An indicator of the extent to which revenue raised not only covers operational expenses, but also provides for capital funding
0%-15% (61%) Needs attention
Own Source Revenue Coverage Ratio
An indicator of a local government’s ability to cover its costs through its own revenue efforts.
40%-90% 45% On track
BORROWINGS RATIO
Debt Service Cover Ratio
An indicator of a local government’s ability to generate sufficient cash to cover its debt payments.
2+ 12 On track
FIXED ASSET RATIOS
Asset Sustainability Ratio
An indicator of the extent to which assets managed by a local government are being renewed or replaced as they reach the end of their useful lives.
90%+ 58% Needs attention
Asset Consumption Ratio
This ratio highlights the aged condition of a local government’s physical assets.
50%+ 66% On track
Asset Renewal Funding Ratio
Indicates whether the local government has the financial capacity to fund asset renewal at existing revenue and service levels.
75%-95% 75% On track
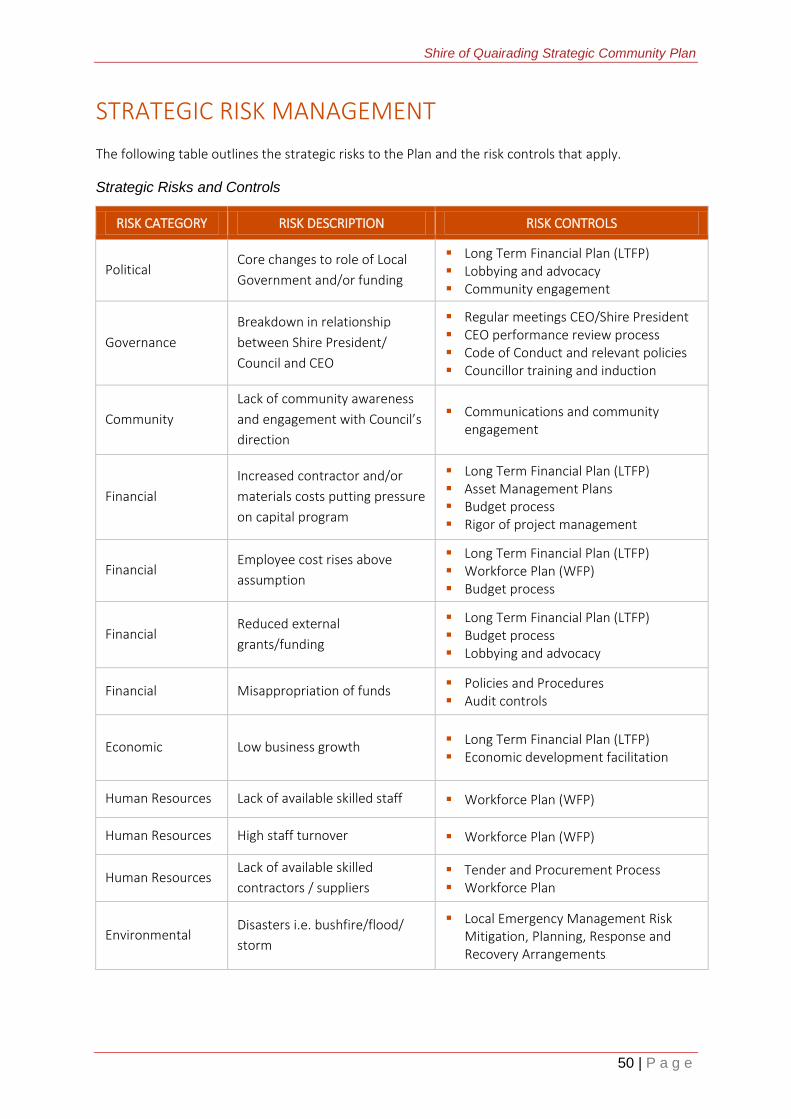
Shire of Quairading Strategic Community Plan
50 | P a g e
STRATEGIC RISK MANAGEMENT
The following table outlines the strategic risks to the Plan and the risk controls that apply.
Strategic Risks and Controls
RISK CATEGORY RISK DESCRIPTION RISK CONTROLS
Political Core changes to role of Local
Government and/or funding
Long Term Financial Plan (LTFP) Lobbying and advocacy Community engagement
Governance
Breakdown in relationship
between Shire President/
Council and CEO
Regular meetings CEO/Shire President CEO performance review process Code of Conduct and relevant policies Councillor training and induction
Community
Lack of community awareness
and engagement with Council’s
direction
Communications and community engagement
Financial
Increased contractor and/or
materials costs putting pressure
on capital program
Long Term Financial Plan (LTFP) Asset Management Plans Budget process Rigor of project management
Financial Employee cost rises above
assumption
Long Term Financial Plan (LTFP) Workforce Plan (WFP) Budget process
Financial Reduced external
grants/funding
Long Term Financial Plan (LTFP) Budget process Lobbying and advocacy
Financial Misappropriation of funds Policies and Procedures Audit controls
Economic Low business growth Long Term Financial Plan (LTFP) Economic development facilitation
Human Resources Lack of available skilled staff Workforce Plan (WFP)
Human Resources High staff turnover Workforce Plan (WFP)
Human Resources Lack of available skilled
contractors / suppliers Tender and Procurement Process Workforce Plan
Environmental Disasters i.e. bushfire/flood/
storm
Local Emergency Management Risk Mitigation, Planning, Response and Recovery Arrangements

Shire of Quairading Strategic Community Plan
51 | P a g e
HOW WILL WE KNOW IF THE PLAN IS SUCCEEDING?
The following table outlines the measures, sources of data and targeted direction for the Plan, with a focus on the strategic priorities.
Measures of Success
Objective Measures Source Target
Economic Objective: Growing economy and
employment opportunities Number of businesses ABS Business Counts
Establish baseline and target
2017/18.
Caravan Park nights booked Caravan Park Data Establish baseline and target
2017/18.
Social Objective: Active, healthy, safe and
inclusive community Usage of Shire facilities Shire Usage Data
Establish baseline and target
2017/18.
Satisfaction with the programs and facilities
available for Noongar in the Shire
Two-yearly Community
Survey
Percentage satisfied or very
satisfied increased from 38% to 50%
Built Environment Objective: Planning and
infrastructure to meet the needs of the
community
Gap between importance and satisfaction
with rural roads maintenance17
Two-yearly Community
Survey
Gap reduction -3.3 to -2.0 by
2020/21. Reset at that time.
Natural Environment Objective: Sustained
natural environment
Waste diverted from landfill per capita Shire Recycling Data Year on year increase
Waste diverted from landfill as a percentage
of total waste stream
Shire Recycling Data and
Residual Waste Data
Establish baseline and target
2017/18.
17 The performance gap is derived from comparing the level of importance to the community and the level of satisfaction expressed in the two-yearly
Community Survey. Rural road maintenance was one of the areas where the gap was the largest.

Shire of Quairading Strategic Community Plan
52 | P a g e
Objective Measures Source Target
Governance Objective: Strong governance
and community engagement Overall satisfaction with Shire
performance18
Two-yearly Community
Survey
71% satisfied 2017/18 to 80%
satisfied by 2020/21. Reset at that
time.
Gap between importance and satisfaction
with customer service19
Two-yearly Community
Survey
Gap reduction -2.3 to -1.5 by
2020/21. Reset at that time.
Satisfaction with community engagement20 Two-yearly Community
Survey
Establish baseline and target in
2019 Community Survey.
Financial and Asset Ratios Annual Report Target Range (see ratio analysis
above)
Staff satisfaction Staff survey
Establish baseline and target in
2017/18 as part of organisation
review.
18
Community satisfaction with overall performance is measured as the percentage of residents and businesses considering performance is satisfactory or better. See the community engagement report April 2017 for details.
19 The performance gap is derived from comparing the level of importance to the community and the level of satisfaction expressed in the two-yearly Community Survey.
Customer service was one of the areas where the gap was the largest. 20
Community engagement has been included given that the Council has identified this for improvement. A baseline is yet to be established and will be developed as input into the next IPR cycle.
Recommended