Shifting Gears! Using the CCSS, PARCC and Educator
Evaluation to Drive Student Achievement
Breakout Session for Principals and Supervisors

Essential Questions How can you use what you’ve learned
about the CCSS, PARCC and the SGO process to improve student achievement?
What supports can you provide to help teachers address the work?
What must you know and be able to do to realize the potential of this opportunity?
What resources are available to help you address the work ?
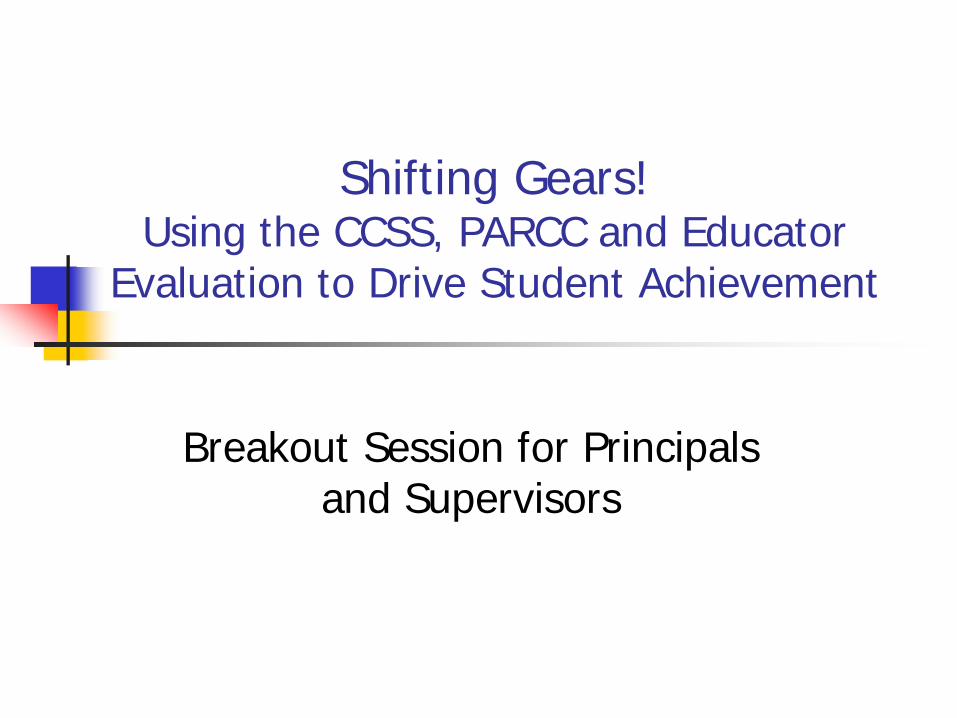
Obstacles and Opportunities
Obstacles Opportunities Culture Capacity Coherence Courage

Understanding Assessment
Can the same assessment be both formative and summative?

For example: Given a fraction, decimal or percent,
explain how can you find the other two? What causes the seasons? What is the difference between war and
revolution?

Understanding Assessment Summative - Assessment of Learning When? At the end of a unit or year Why? To determine a grade or proficiency Formative – Assessment for Learning When? Beginning, middle or end of a unit Why? To identify strengths & weaknesses in students’ understanding

Types of Summative Assessments
Classroom summative assessments Given by an individual teacher at the
end of a unit of instruction Common summative assessments Given by a team of teachers at the end
of a unit, quarter, semester or course Results may be used for future students.
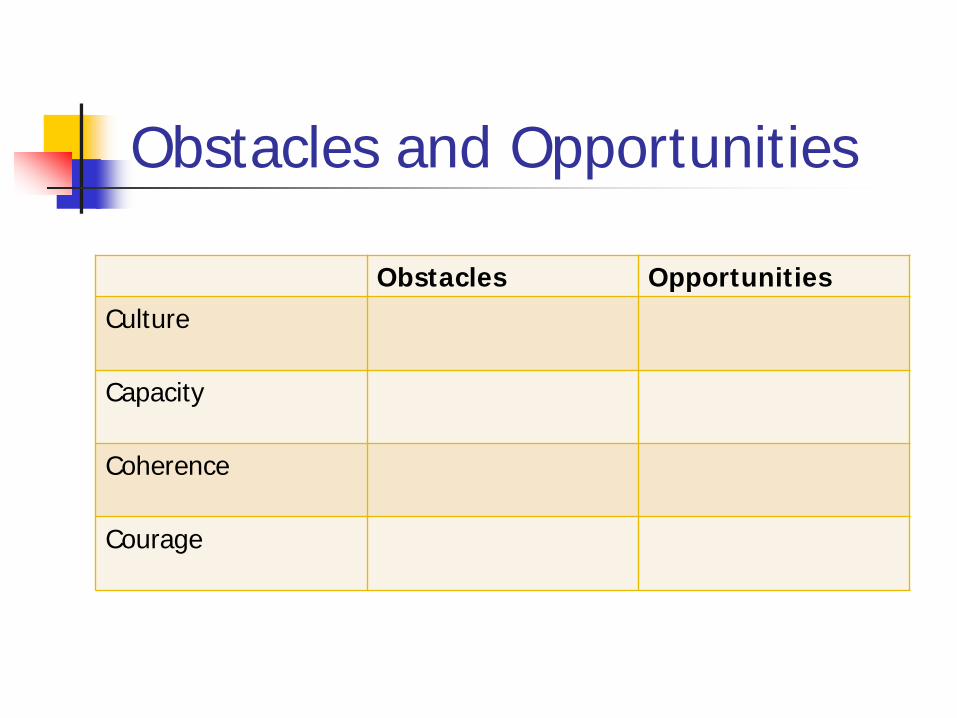
Types of Formative Assessments
Classroom formative assessments – Developed by an individual teacher to
monitor selected class outcomes Common formative assessments – Developed by a team or department to
monitor agreed upon curricular goals. Results are used with current students.

What is the value of using common assessments?

Why use formative assessment?
In Visible Learning (2009), John Hattie identified 138 factors that influence student achievement. What rank is: Teacher-student relationships? Providing formative evaluation? Home environment? Ability grouping?

Reflection and discussion In the new accountability model Performance = Achievement + Growth How does “growth” change the equation?

The role of formative assessment in educator evaluation
How is the evaluation of teachers and administrators changing?
Teacher evaluation: 55% teacher practice (inputs) 45% student achievement (inputs) 35% SGPs + 15% SGOs

How does this apply to you? Principal eval = 50% student achievement 40% effective practice 10% retention of effective teachers

Don’t have time? The research is clear!
Less teaching + more feedback = higher achievement

What’s wrong with how it’s done now?
In elementary school, 80% of feedback students receive is from peers. And 80% of this student-provided feedback is incorrect!
Feedback needs to be Timely Specific Constructive Correct!

The value behind the mandate “The frequent use of formative assessment,
the data that it generates, and the feedback that it provides for students, teachers and administrators is the most important change that can be made in school practice.”
- Tracey Severns
Feedback for the teacher
Assessment feedback should be oriented towards the teacher and about: which students are moving toward the
success criteria and what was/was not taught well

How can teachers use formative assessment? Results can be used to identify: 1. Standards/skills that require attention 2. Question types that require practice 3. Students who need remediation or
enrichment. 4. Programmatic strengths/weaknesses 5. Strengths/gaps in teaching

Using assessments to improve learning
Determine: what to assess how to assess when to assess what to do for students didn’t learn what to do for students who did learn

Assessing the assessments Does it measure what matters?
Is it aligned to standards?
What does it require students to do? Is it designed to elicit evidence of mastery?
What is the level of difficulty associated with the demonstrations of learning? Is it rigorous enough to yield meaningful
data?
Assessing the Assessments Two criteria for assessing assessments: 1. Is it educationally sound? 2. Is it technically sound?

Educationally sound assessments:
Support our aims Offer worthy and authentic challenges Provide helpful feedback and
opportunities to use it

The Role of Rigor Rigor reflects the cognitive demand and
technical difficulty of the question. “Far too many teachers mimic the
format of multiple choice tests without the rigor of those tests” (Wiggins)

Time for a Test Create a question to assess mastery of
the following standard: SWBAT understand and use percents.

SWBAT understand and use % 1. 50% of 40 2. 34% of 67 3. 26 is 40% of what number? 4. In a town election, 5985 people voted.
This is 63% of the town’s registered voters. How many people are registered to vote?

SWBAT understand and use % 5. You deposit $1200 into a savings
account that earns 3% interest compounded annually. Find the balance of the account after 2 years.
6. Describe how to find your percent increase in height from last year to this year. Show how to find this percent using a proportion.

Rigor and Mastery “The level of mastery that will be reached is determined entirely by what sort of questions students are expected to answer.” - from Bambrick-Santoyo, Driven by Data

Technically Sound Valid – measures the intended goal (not
what is easy to see or count) with sufficient rigor.
Reliable – provides sufficient data that is consistent across assessors and performances.

Test for Validity Assess your assessment
Could a student do well without having achieved the desired outcomes?
Could a student do poorly, but have still have achieved the desired outcomes?
Example Goal: Understand the causes of the Civil War Task: Create a poster of an important battle with oral presentation of poster Criteria: Polished poster and speech; accurate information

Does it pass the validity test? Could the poster and speech be done
well without understanding the Civil War?
Could the poster and speech be poor, but the student understand the Civil War?

Beware! Just because they… Nodded when you gave the answer, doesn’t
mean they get it. Gave the right answer doesn’t mean they
understand why it is the right answer. Were highly engaged in their projects doesn’t
mean they understand the ideas behind them. Said interesting things about the text doesn’t
mean they understood and can act on it.

Revisiting Reliability Do we have enough evidence to be
confident student’s level of achievement?

Reliability Error is minimized by:
Multiple assessments Varied assessments Different judges Trained judges

Establishing sound targets How should the shift from AYP to
Performance Targets influence goal setting?

Adequate Yearly Progress Starting
Point 2003
2005
2008
2011
2014 Language Arts/Literacy
Grade 3/4/5
68
75
59 (73)
86
100
Grade 6/7/8
58
66
72
86
100
High School
73
79
85
92
100
Math Grade 3/4/5
53
62
66 (69)
84
100
Grade 6/7/8
39
49
61
80
100
High School
55
64
74
86
100
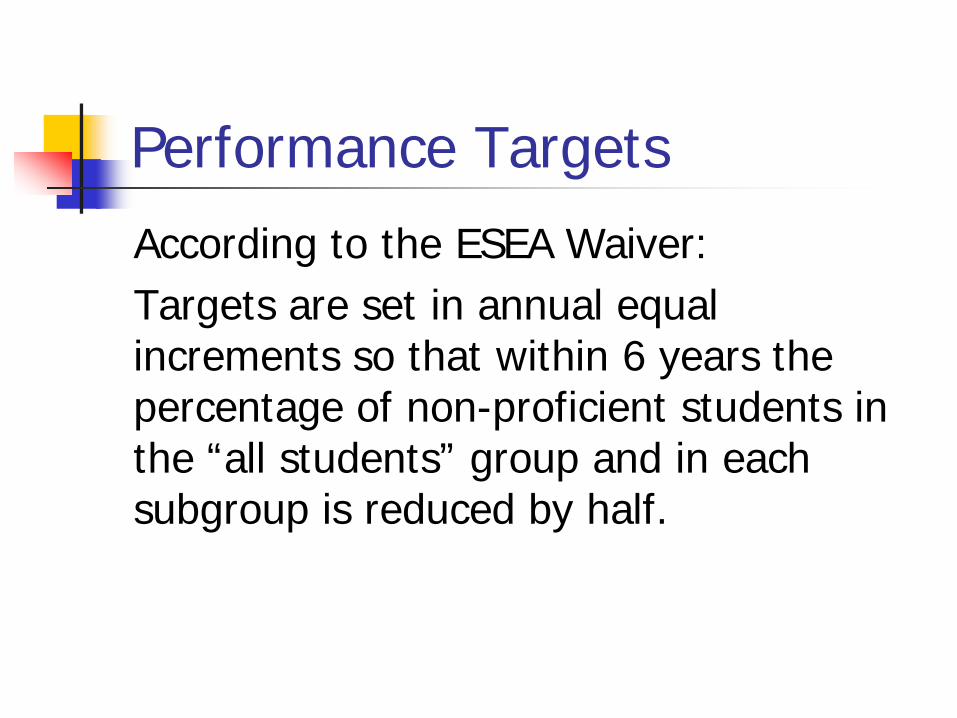
Performance Targets According to the ESEA Waiver: Targets are set in annual equal increments so that within 6 years the percentage of non-proficient students in the “all students” group and in each subgroup is reduced by half.
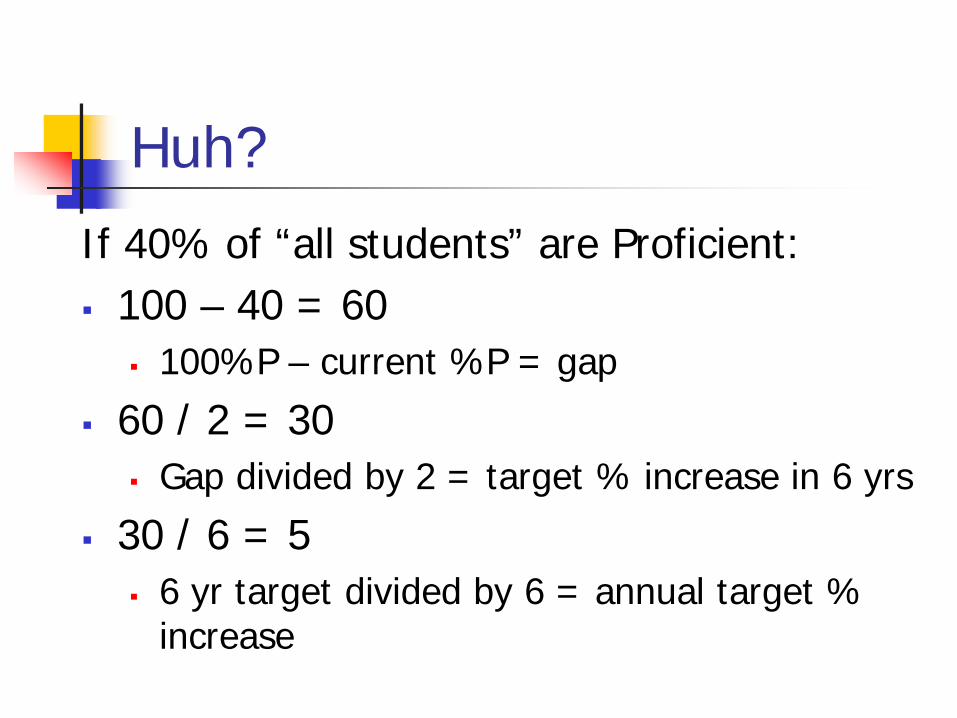
Huh? If 40% of “all students” are Proficient: 100 – 40 = 60
100%P – current %P = gap
60 / 2 = 30 Gap divided by 2 = target % increase in 6 yrs
30 / 6 = 5 6 yr target divided by 6 = annual target %
increase
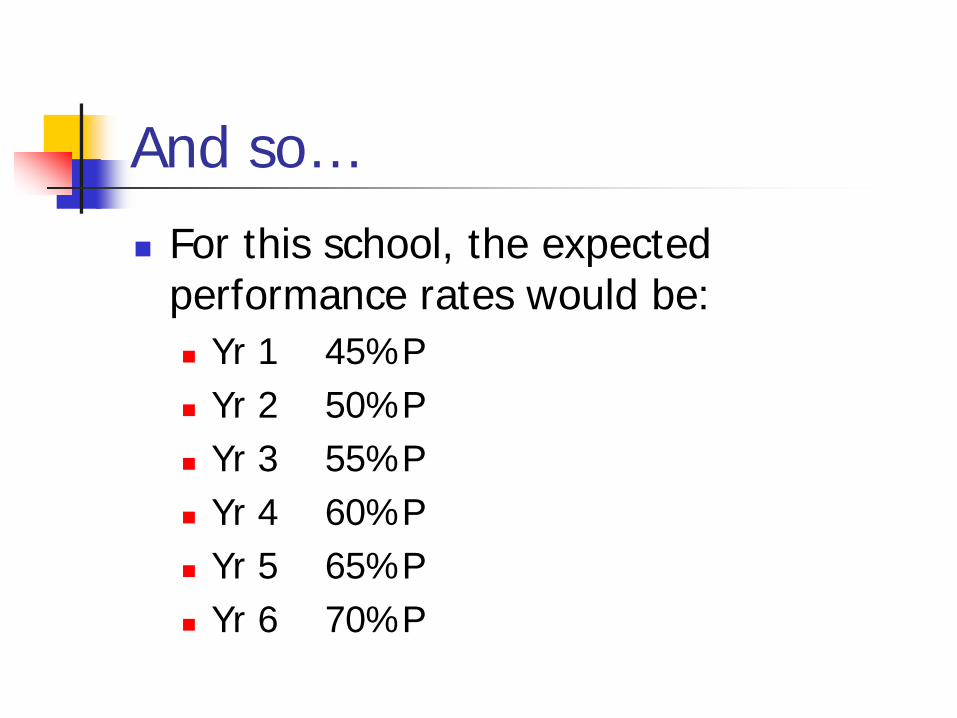
And so… For this school, the expected
performance rates would be: Yr 1 45%P Yr 2 50%P Yr 3 55%P Yr 4 60%P Yr 5 65%P Yr 6 70%P
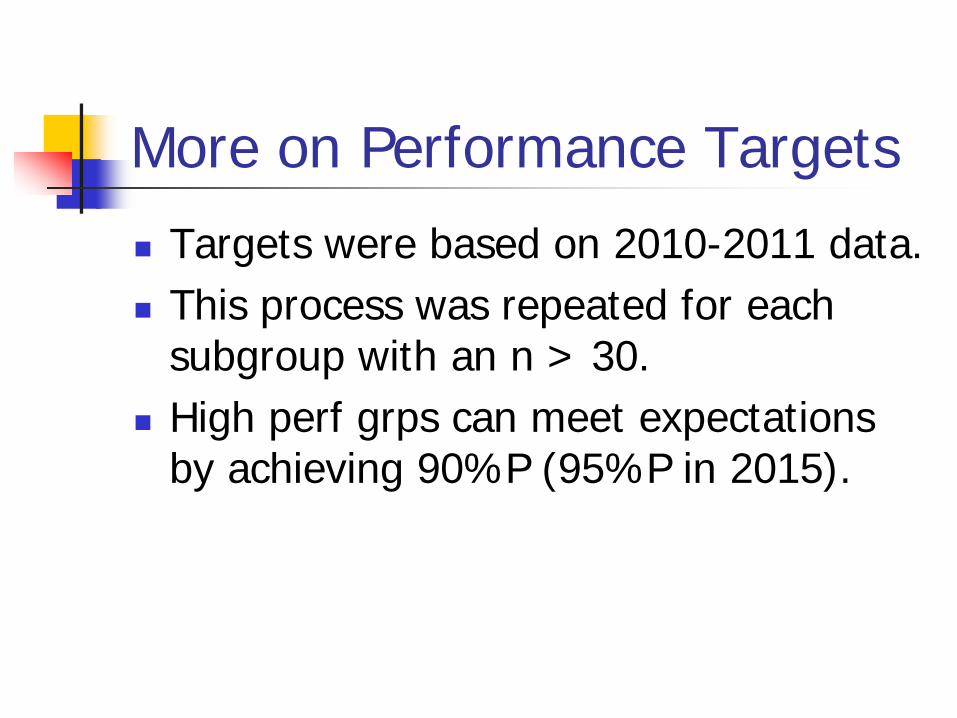
More on Performance Targets Targets were based on 2010-2011 data. This process was repeated for each
subgroup with an n > 30. High perf grps can meet expectations
by achieving 90%P (95%P in 2015).

Question Does this process effect every subgroup equally? Calculate the progress targets: Subgroup 1 80% Partially Proficient Subgroup 2 30% Partially Proficient What do you notice?

What does this mean? Subgroups that are further “behind” (a
higher %PP), must make greater annual gains.
How might this influence how you evaluate teachers’ SGOs?
Deciding when to assess At what points in the instructional
period will assessment be important?

Establish Data Checkpoints Imagine that it is the end of the first
marking period. What data would help you monitor
student progress and performance?
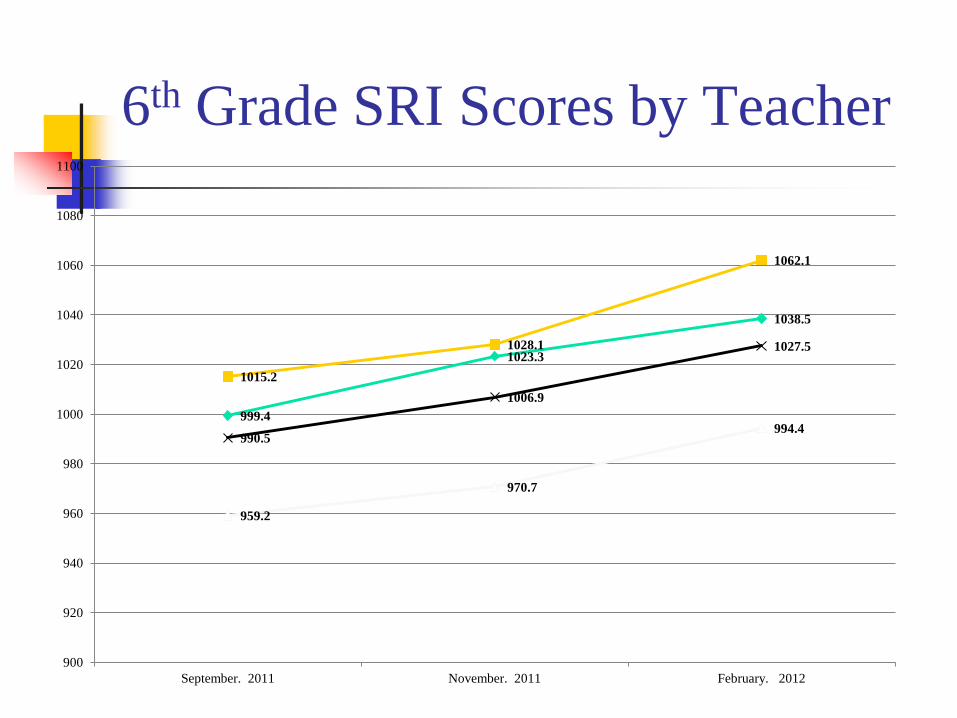
999.4
1023.3
1038.5
1015.2
1028.1
1062.1
959.2
970.7
994.4 990.5
1006.9
1027.5
900
920
940
960
980
1000
1020
1040
1060
1080
1100
September. 2011 November. 2011 February. 2012
6th Grade SRI Scores by Teacher

7th Grade SRI Scores by Teacher
1095.1
1104.8
1115.6
1079.4
1091.8
1106.5
1046.3
1064.2 1069.2
1073.3
1086.8
1096.7
1000
1020
1040
1060
1080
1100
1120
1140
September. 2011 November. 2011 February. 2012

2.66 2.65 2.65
2.65
2.71 2.68
2
2.1
2.2
2.3
2.4
2.5
2.6
2.7
2.8
2.9
3
Sept Oct Nov
Walk Through Data – 2011-2012, MP 1
Engagemt
Meaning

Analyzing the Results 1. Chart and quantify the data – Which
students missed which questions? 2. Identify strengths and weaknesses 3. Look for patterns by question type (selected vs. constructed response) 4. Do an error analysis – Why were the
wrong answer choices selected?
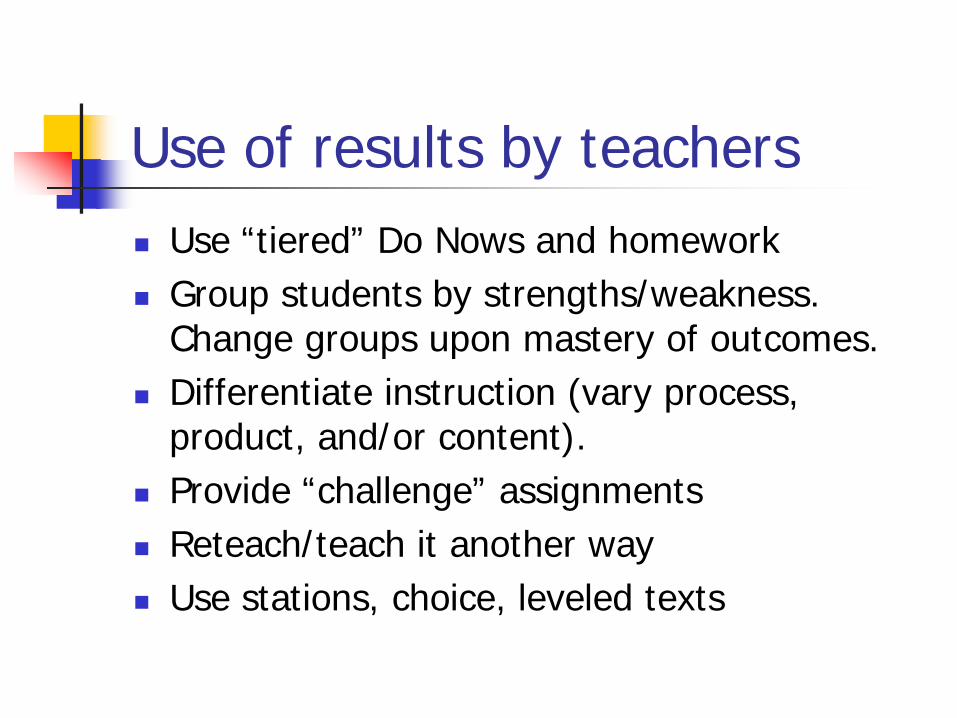
Use of results by teachers Use “tiered” Do Nows and homework Group students by strengths/weakness.
Change groups upon mastery of outcomes. Differentiate instruction (vary process,
product, and/or content). Provide “challenge” assignments Reteach/teach it another way Use stations, choice, leveled texts

Why differentiate? When a teacher tries to teach something
to the entire class at the same time, “chances are, one-third of the kids already know it; one-third will get it; and the remaining third won’t. So two-thirds of the children are wasting their time.”
- Lillian Katz

Use of results by students “Self-assessment is the process by which
students reflect on the quality of their work, based on clearly articulated goals or criteria, and improve their work.”
- Andrade (2008)

Findings from our Targeted Learning Lab
“The reading program didn’t work until I
started to have the kids graph their progress.” - Lorelei Russo (teacher)

Use of student self-assessments
Journaling/blogging Self-assessments attached to summative
assessments (What aspect of your work was most/least effective?)
Portfolios Graphing their own progress Goal setting/creating a learning plan Writing “I can” statements for learning targets (I can balance chemical equations)

Use of results by leaders Ensure that teachers have the skills and
opportunity to focus on what matters.
Remember! “What gets measured gets managed!”
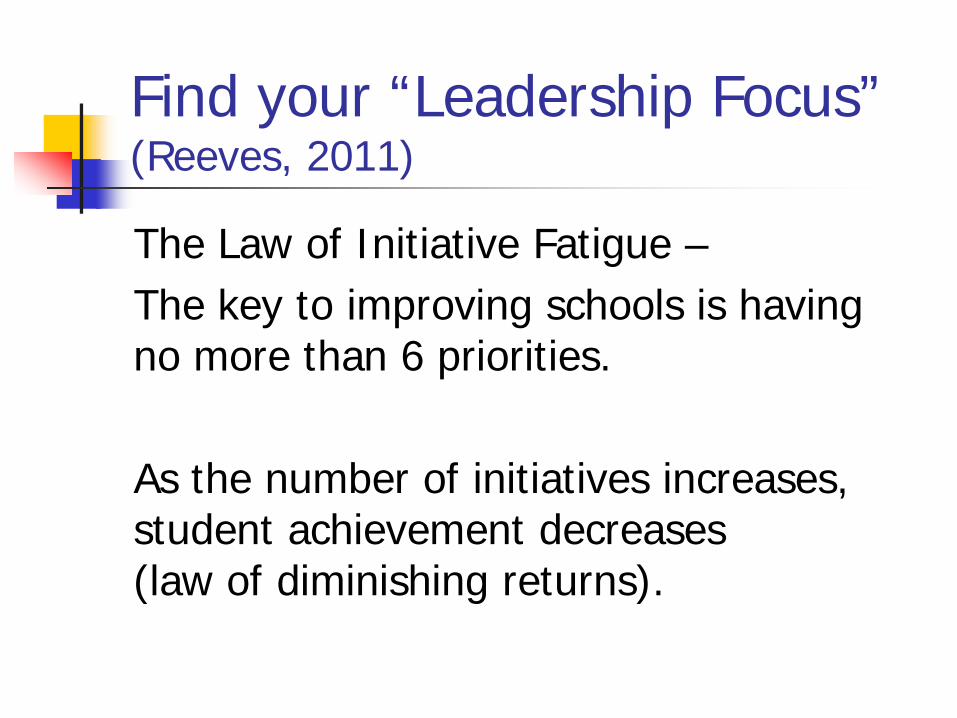
Find your “Leadership Focus” (Reeves, 2011)
The Law of Initiative Fatigue – The key to improving schools is having no more than 6 priorities. As the number of initiatives increases, student achievement decreases (law of diminishing returns).

Prioritize and pick 3! It is practices, not programs that change schools. Focus on practices that have: Impact – the potential to exert a
significant effect Leverage – the potential to effect
multiple outcomes Refer to Visible Learning (Hattie, 2009) for the effect size of various factors that effect learning.

Remember the 90/90/90 schools.
A laser-like focus on student achievement Clear curriculum choices – spend more
time on reading, writing and mathematics Frequent assessment and multiple
opportunities for improvement An emphasis on nonfiction writing Collaborative scoring of student work - Doug Reeves

FOCUS! (Mike Schmoker style)
On the three highest priorities: 1. Ensure that a coherent curriculum with
standards selected by a team of teachers is actually taught and tested with common assessments.
2. Ensure that teaching consistently employs the elements of structurally sound lessons.

Elements of an effective lesson
Clear learning objectives Teaching/Modeling/Demonstrating Guided Practice Checks for Understanding/Assessment
“Effective teaching could eliminate the achievement gap in about five years” (Schmoker, 2006).

And the third priority is 3. Authentic Literacy “Intensive amounts of reading and writing are the soul of learning.” (Schmoker, 2011) • Close reading/underlining/annotating of text • Discussion of text • Writing about the text in response to good,
text-based questions

“On Their Own” “Students can, without significant scaffolding, comprehend and evaluate complex texts across a range of types of disciplines, and they can construct effective arguments and convey intricate or multifaceted information. Likewise, students are able independently to discern a speaker’s key points, request clarification, and ask relevant questions.” - Common Core ELA Standards

Therefore, we need to Add the phrase “on their own” to all goal
statements to ensure that we design valid assessments of independent performance.
Have a plan for developing independence over the year on recurring tasks.

Use a Degree of Independence Rubric
1. Did with no teacher assistance. 2. Required only 1 – 2 quick reminders. 3. Required some direction, hints, prompts. 4. Required significant teacher assistance:
scaffolded prompting, directions, reminders.
5. Even with considerable teacher assistance, could not complete the task.
- Grant Wiggins

Strategies for Success Develop a plan!
Write a clear and specific goal. What is it you want to happen?
Articulate a series of action steps. What must be done to achieve the goal?
Assign an “owner” for each step. Who will ensure that each task is completed?
Establish a completion date for each step. Identify indicators/evidence of completion. Include an open column to record outcomes.
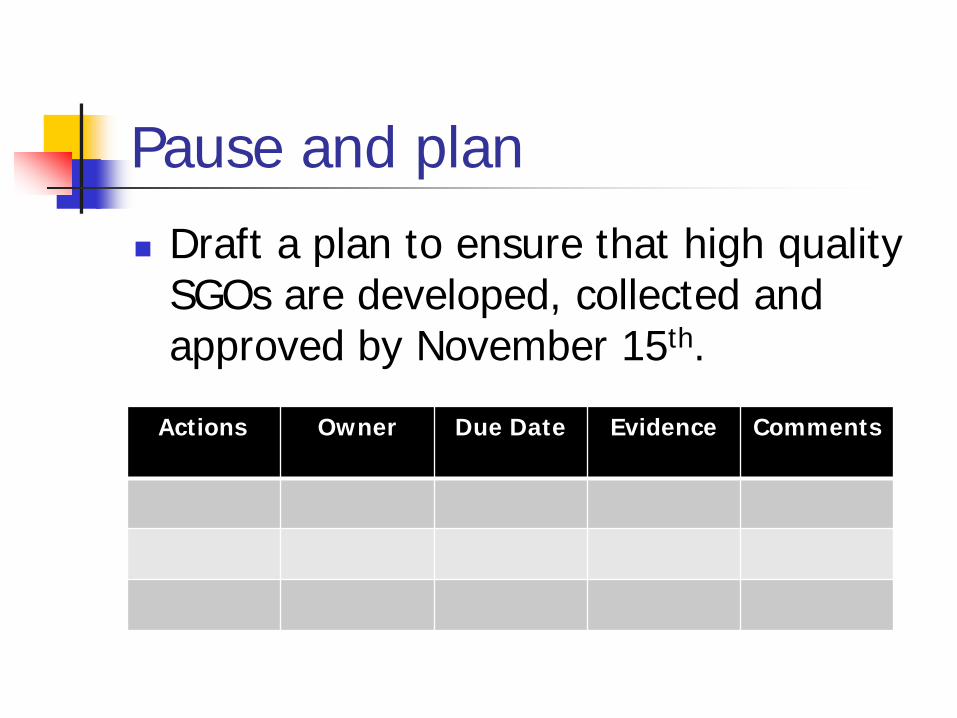
Pause and plan Draft a plan to ensure that high quality
SGOs are developed, collected and approved by November 15th.
Actions Owner Due Date Evidence Comments

Strategies for Success Standardize and focus forms/templates for:
PLC meeting minutes Team/department/grade level minutes Meeting agendas Data analysis Walk-through feedback Unit plans (include pre and post assessments) Lesson plans (include a space for teachers to
record formative assessments)

Consider and create Create a meeting agenda template that
could be used to ensure that time is spent on the right “stuff.”
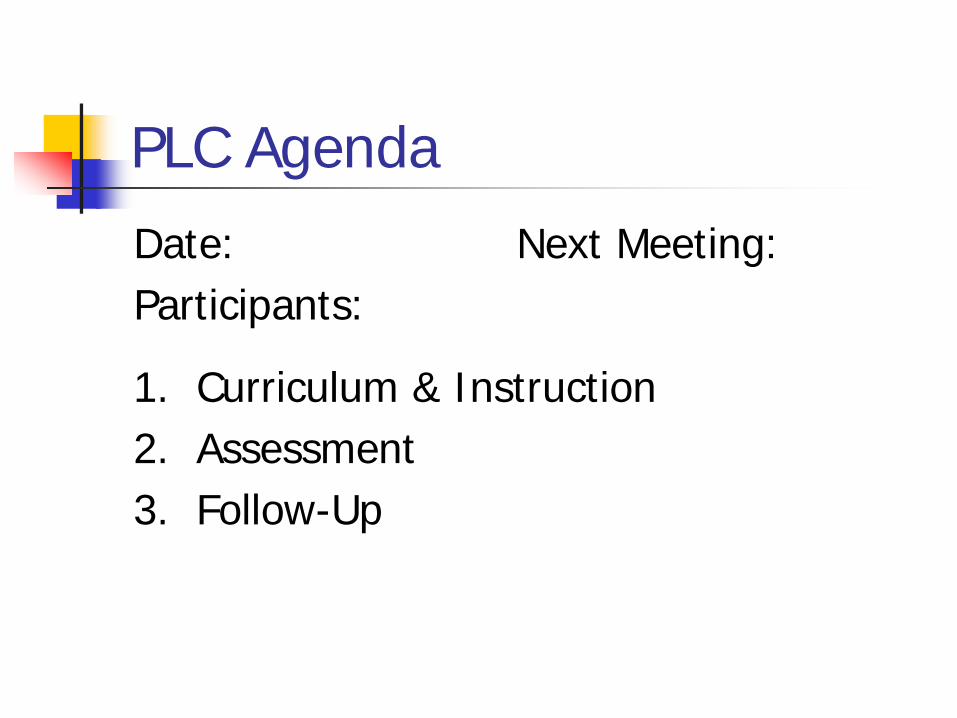
PLC Agenda Date: Next Meeting: Participants:
1. Curriculum & Instruction 2. Assessment 3. Follow-Up

Team Meeting Agenda Team: Date: Participants:
1. Discussion Items (topics, outcomes and next steps) 2. Actions in support of SMART goal(s) 3. Notes/Reflections

Strategies for Success Create systems and feedback loops.
“Calendarize” all due dates. Track and record all submissions. Provide feedback on the content and
timeliness of submissions. Acknowledge prompt submissions. Address tardy submissions. Comment on the content, copy and return the
form to the author(s) for review of your notes.

Develop a form that could be used to track each stage of the SGO process.
Contemplate and Compose

Tracking the SGO Process
Name Assmnt Submitted
Assmnt Feedback
Assmnt Approved
SGO Submitted
SGO Feedback
SGO Approved
Tom Collins
Mary Contrary
Al Einstein
Pete Moss
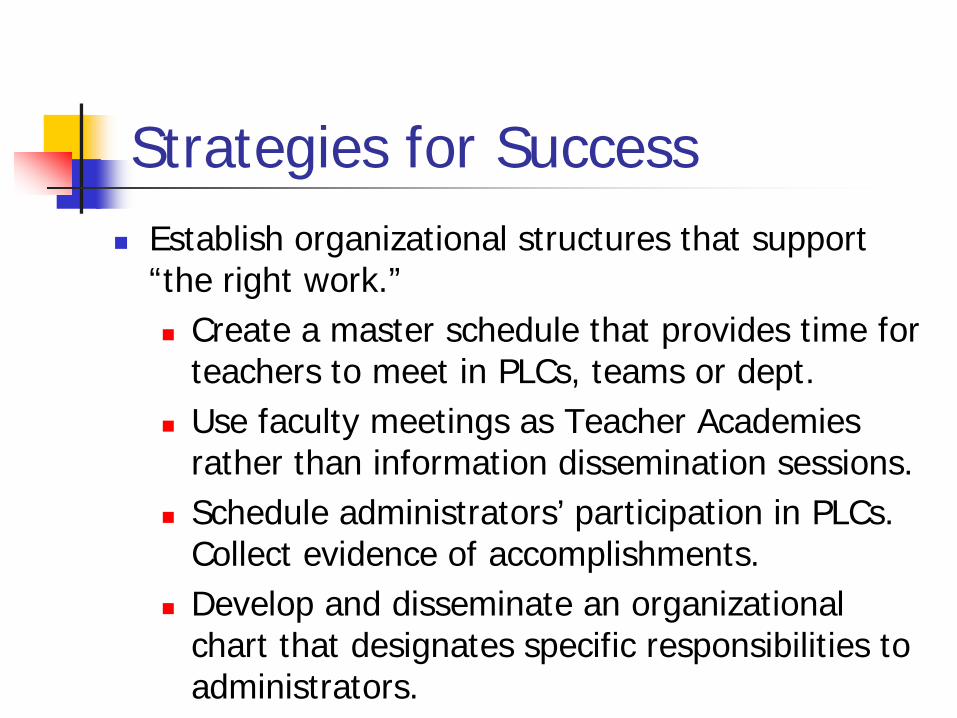
Strategies for Success Establish organizational structures that support
“the right work.” Create a master schedule that provides time for
teachers to meet in PLCs, teams or dept. Use faculty meetings as Teacher Academies
rather than information dissemination sessions. Schedule administrators’ participation in PLCs.
Collect evidence of accomplishments. Develop and disseminate an organizational
chart that designates specific responsibilities to administrators.

Reflect and Revise Identify one “way of doing things”
(use of time, space, personnel, meetings etc.) that could be changed to improve focus on the “right work.”

Strategies for Success Focus! Unify efforts around a common purpose.
Teach teachers how to use assessment to improve learning.
Encourage teachers to create SGOs that target areas of weakness identified in the data.
Encourage teachers to work in teams to create common SGOs.
Require the collection of data and artifacts that provide evidence of SGO goal implementation.

Fancy and Formulate List two strategies you could use to
unify efforts around common goals.

Strategies for Success Build capacity
Provide PD that addresses essential skills. Use the data to identify and share teaching
strategies, activities and assessments that promote high levels of learning.
Collect, analyze and share the data. Develop and guide systems of prevention
and intervention.
Determine and Develop Name two PD priorities that would
elevate the capacity of faculty to engage in this work.

Strategies for Success Follow-up and follow through.
Establish clear expectations and accountabilities. “Trust and verify” – collect evidence of agreements. Monitor student progress and require action plans
for struggling students. Monitor teacher practice through frequent “walk
throughs.” Check lesson plans in the room! Provide timely and constructive feedback to
teachers regarding “input” and “output” data.

Examine and Engage Identify two actions that would improve
your ability to provide consistent follow through.
Strategies for Success Lead with the head, the heart and the
hand. Stay abreast of “best practices.” Read! Provide exemplars of high quality work. Model what you want others to do. Nurture the culture while elevating capacity. Confront resistors. Guide and grow the work.

Cogitate and Commit Promise to do one thing to improve
your ability to be the leader your school needs to inform and inspire the work.

Obstacles and Opportunities
Obstacles Opportunities Culture Capacity Coherence Courage

Wrap up and Reflections How will I use what I learned to improve
my school and increase student achievement?
What are my next action steps?
Appendices
Activities to Promote Understanding of the CCSS
Review the CCSS ELA anchor standards. Examine the K-12 development of a single anchor
standard for math and ELA. Study the CCSS math practices and use the grade
level overviews when visiting classes. Review the Appendices (Appendix B: Text
Exemplars and Student Performance Tasks; Appendix C: Samples of Student Writing)
Analyze the Model Curriculum SLOs and Unit Assessments.

Resources NJSMART – NJ’s statewide longitudinal
data system that provides student level data on all state assessments given since 1999.
Most useful features include: Ed Analyzer District Reports

Ed Analyzer allows you to: Plot and graph assessment results for
multiple years to find gains/losses. Disaggregate performance across
student and program characteristics. View a student’s complete performance
history in a student profile. Find correlations between multiple
measures to identify predictors of success.

District Reports include: Grade Level Profile – provides characteristics
and performance of students across grade levels.
Helps answer questions such as: What was the distribution of scores for the
students in 7th grade on the NJASK? What are the demographic characteristics
of the students at each grade level?

District Reports include: Cohort Performance Profile – provides
characteristics of students who improved, stayed the same, or declined on state tests over a period of 2 years.
Helps answer questions such as: What are the characteristics of students
who improved/declined? How did the same group of students do
from one year to the next?
Recommended