Shareholder Meeting
May 2016

Disclaimer
Matters discussed in this presentation and during our 2016 Annual Meeting of Stockholders, whether written or oral, relating to future events or our future performance, including any discussion, expressed or implied, regarding our anticipated growth, operating results, plans, objectives, future earnings per share, and the impact of our investments in sales-building initiatives and operational capabilities on future sales and earnings, contain forward-looking statements within the meaning of Section 27A of the Securities Act of 1933, as amended, and Section 21E of the Securities Exchange Act of 1934, as amended. These statements are often identified by the words “believe,” “positioned,” "estimate,” “project,” “target,” “plan,” “goal,” “assumption,” “continue,” “intend,” “expect,” “future,” “anticipate,” and other similar expressions, whether in the negative or the affirmative, that are not statements of historical fact. These forward-looking statements are not guarantees of future performance and involve certain risks, uncertainties, and assumptions that are difficult to predict, and you should not place undue reliance on our forward-looking statements. Our actual results and timing of certain events could differ materially from those anticipated in these forward-looking statements as a result of certain factors, including, but not limited to, those discussed from time to time in our reports filed with the Securities and Exchange Commission, including our annual report on Form 10-K for the fiscal year ended December 29, 2015 and our quarterly reports on Form 10-Q. All forward-looking statements and the internal projections and beliefs upon which we base our expectations included in this presentation or during our 2016 Annual Meeting of Shareholders are made only as of the date of this presentation and may change. While we may elect to update forward-looking statements at some point in the future, we expressly disclaim any obligation to update any forward-looking statements, whether as a result of new information, future events, or otherwise.
2

Panera Today
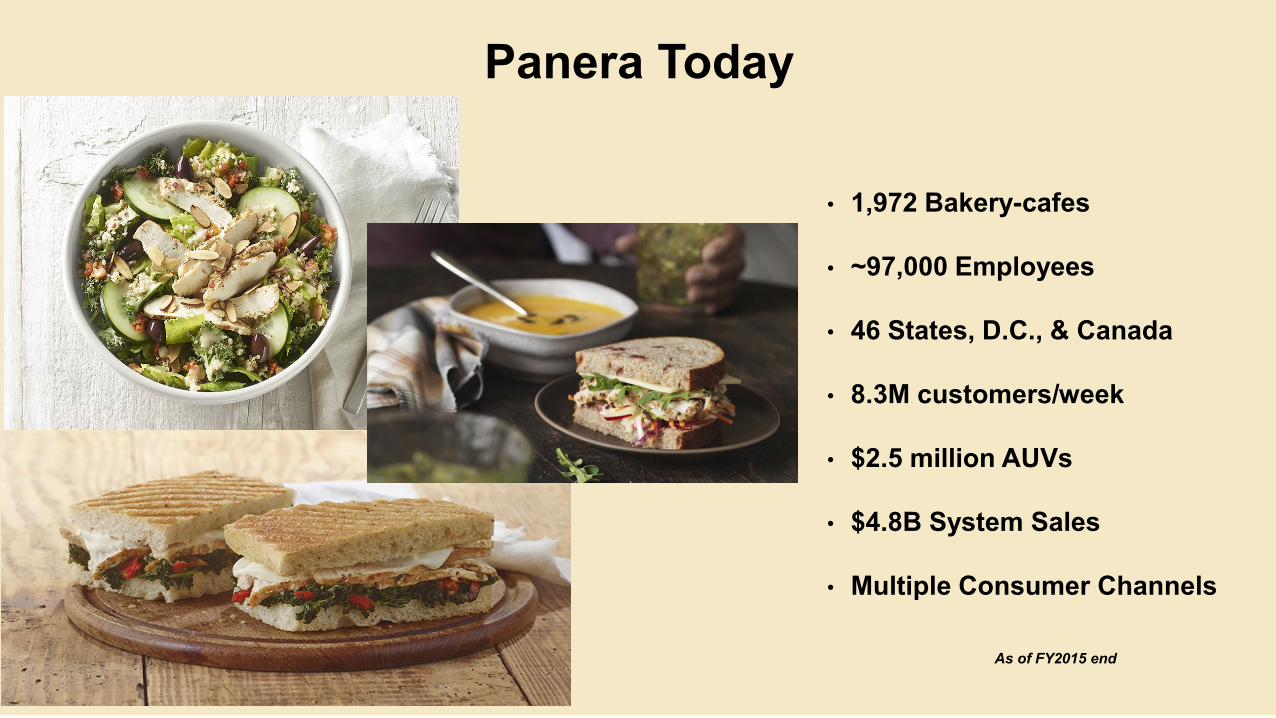
Panera Today
• 1,972 Bakery-cafes
• ~97,000 Employees
• 46 States, D.C., & Canada
• 8.3M customers/week
• $2.5 million AUVs
• $4.8B System Sales
• Multiple Consumer Channels
As of FY2015 end

How We Compete
Craveable Wellness – Elevated Experience
• We own the “better” soup, salad and sandwich category, serving food that
is good and good for you that people trust and crave.
• We are an authority in fresh-baked bread, which drives differentiation in
our food.
• Our bakery-cafes provide an everyday oasis, where guests feel welcome
to eat, talk, study or relax.
• We offer multiple consumer solutions for diverse needs, spanning
dayparts and available through different points of access.

Panera…A Track Record of Success

Historically High Average Weekly Sales
38,318 39,150 38,668 39,239 39,926 42,852 44,313
46,676 47,403 47,655 48,357
2005 2006 2007 2008 2009 2010 2011 2012 2013 2014 2015
System-Wide Average Weekly Sales
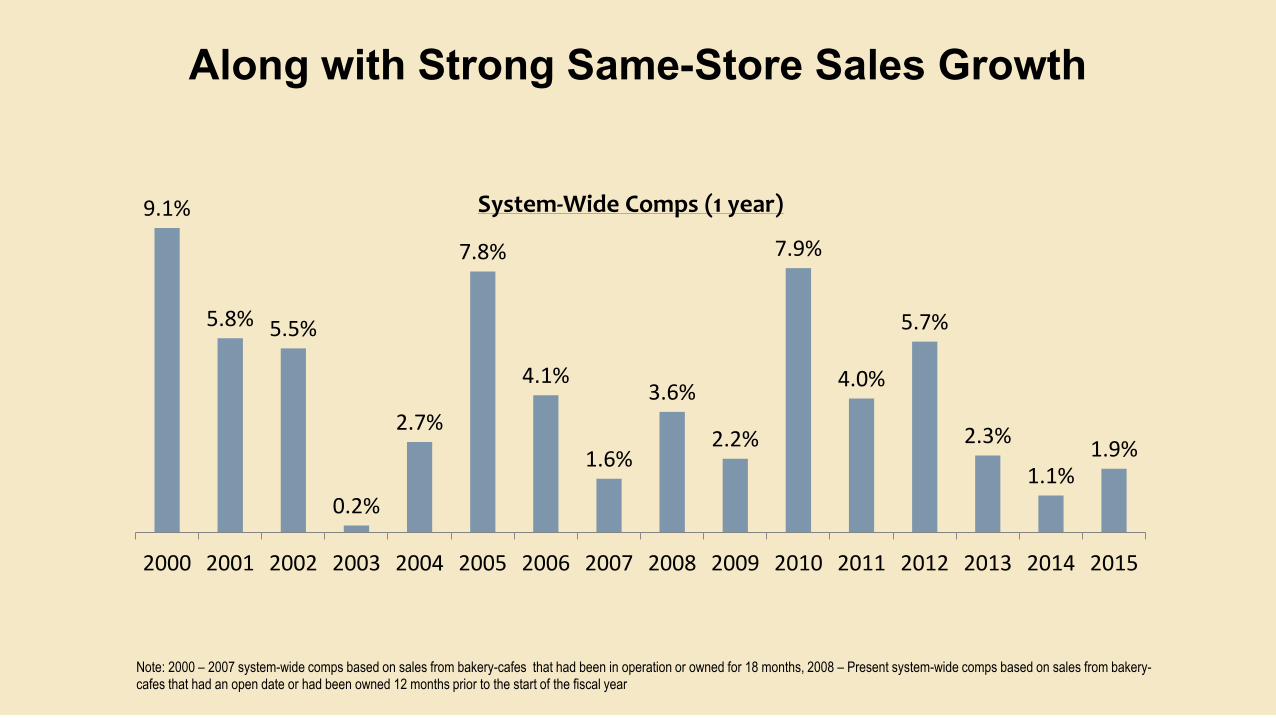
Along with Strong Same-Store Sales Growth
Note: 2000 – 2007 system-wide comps based on sales from bakery-cafes that had been in operation or owned for 18 months, 2008 – Present system-wide comps based on sales from bakery-cafes that had an open date or had been owned 12 months prior to the start of the fiscal year
9.1%
5.8% 5.5%
0.2%
2.7%
7.8%
4.1%
1.6%
3.6%
2.2%
7.9%
4.0%
5.7%
2.3%
1.1% 1.9%
2000 2001 2002 2003 2004 2005 2006 2007 2008 2009 2010 2011 2012 2013 2014 2015
System-Wide Comps (1 year)

High sales drive significant unit-level returns
(In Millions)
Mature Store Base
Average Returns (a) (b)
New Store Approval
Framework - 2nd Year
Return
Avg Net Sales/Unit $2.6 $2.5
Unit EBITDA $0.4 $0.4
Unit Margin 16.7% 15.4%
Invested Capital
Investment before OH $0.9 $1.4
Capitalized OH $0.1 $0.1
Investment including OH $1.0 $1.5
Cash-on-cash ROI (c)
Mid-point Corporate ROI (before OH) 49.1% 19.5%
Mid-point IRR 23.0%(a) FY15 results based off 743 company-owned Panera cafes opened before fiscal year end 2013 (excluding closed cafes)
(b) Avg investment cost for 595 company-owned Panera cafes opened prior to fiscal year end 2015 (excluding closed cafes and acquisitions)
(c) Cash-on-cash ROI for New Store Approval Framework is net of any cannibalization impact
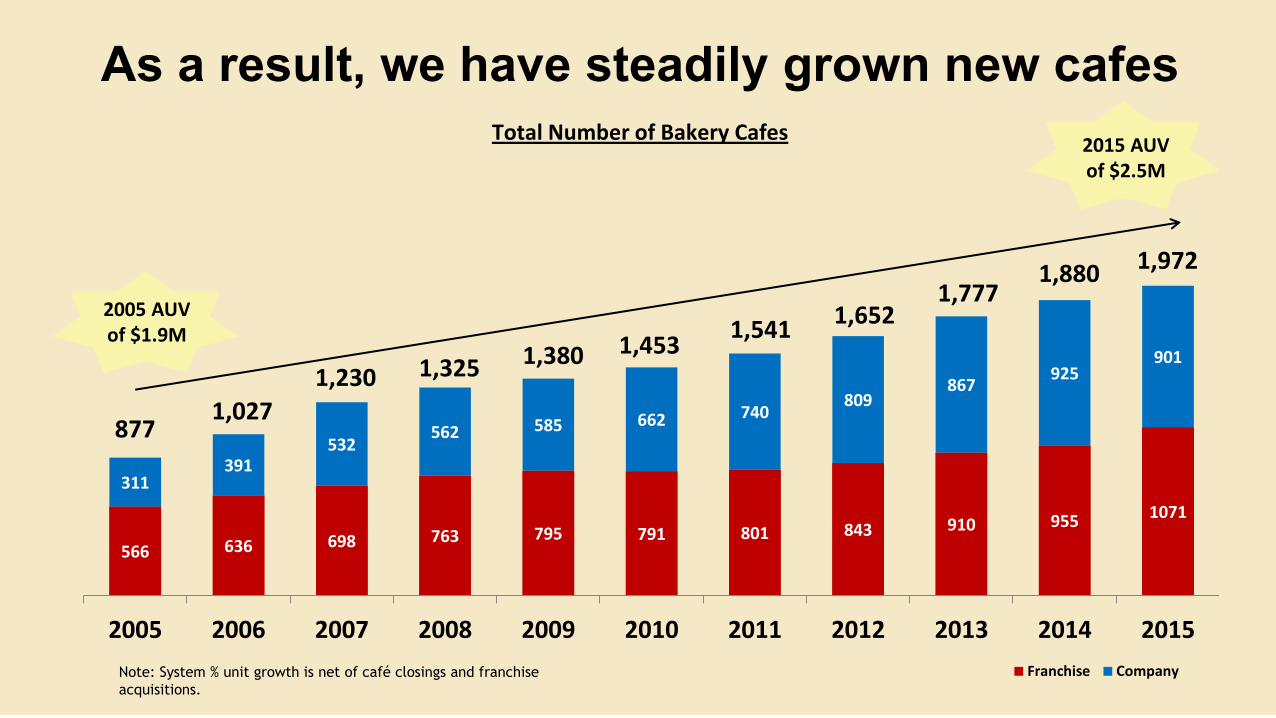
566 636 698 763 795 791 801 843 910 955 1071
311 391
532 562 585 662 740
809 867
925 901
2005 2006 2007 2008 2009 2010 2011 2012 2013 2014 2015
Franchise Company
Total Number of Bakery Cafes 2015 AUV of $2.5M
1,972
As a result, we have steadily grown new cafes
1,325 1,380 1,453 1,541
1,652
1,880
Note: System % unit growth is net of café closings and franchise
acquisitions.
1,777 2005 AUV of $1.9M
1,230
1,027 877
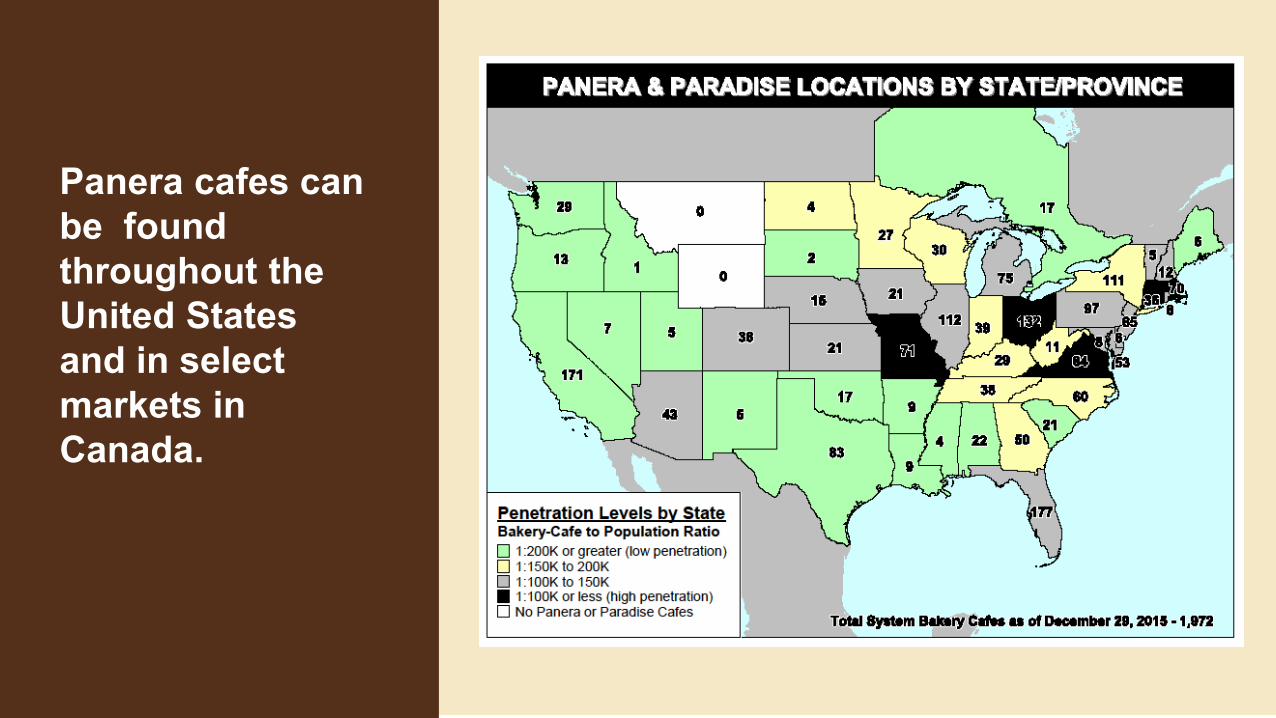
Panera cafes can
be found
throughout the
United States
and in select
markets in
Canada.
Panera…A Track Record of Creating Value for
Shareholders

0
500
1,000
1,500
2,000
2,500
3,000
3,500
4,000
4,500
5,000
1996 1997 1998 1999 2000 2001 2002 2003 2004 2005 2006 2007 2008 2009 2010 2011 2012 2013 2014 2015 2016
Over the last 20 years, our stock performance has led the
industry.
PNRA
BWLD
CMG
SBUX
DRI
EAT
S&P 500
Source: FactSet. Relative stock price performance indexed from 5/16/96 to 5/16/16
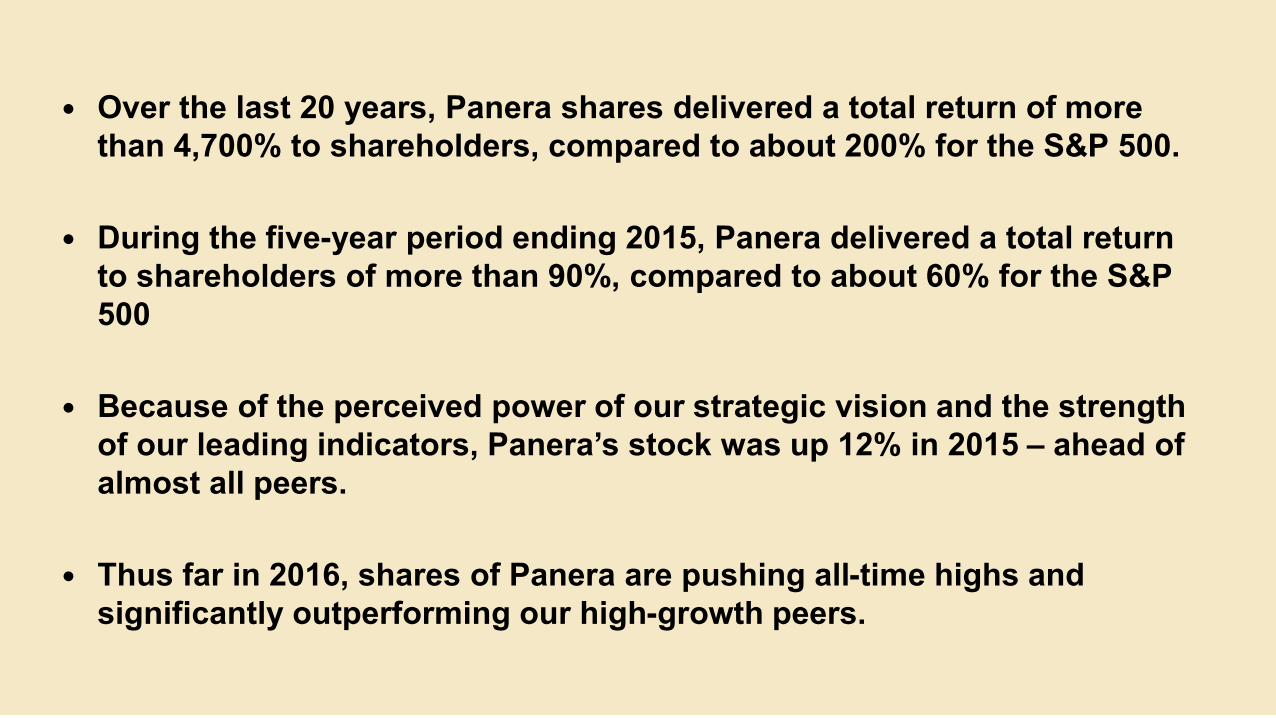
Over the last 20 years, Panera shares delivered a total return of more
than 4,700% to shareholders, compared to about 200% for the S&P 500.
During the five-year period ending 2015, Panera delivered a total return
to shareholders of more than 90%, compared to about 60% for the S&P
500
Because of the perceived power of our strategic vision and the strength
of our leading indicators, Panera’s stock was up 12% in 2015 – ahead of
almost all peers.
Thus far in 2016, shares of Panera are pushing all-time highs and
significantly outperforming our high-growth peers.
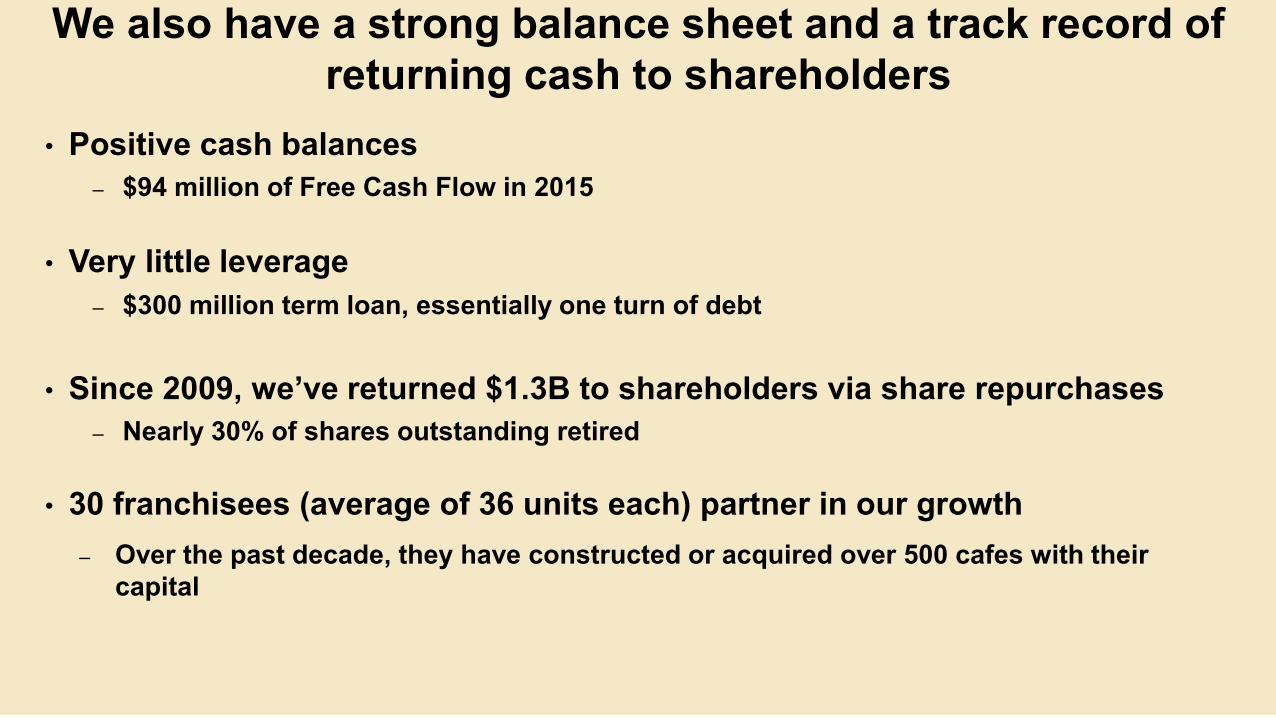
We also have a strong balance sheet and a track record of
returning cash to shareholders
• Positive cash balances
– $94 million of Free Cash Flow in 2015
• Very little leverage
– $300 million term loan, essentially one turn of debt
• Since 2009, we’ve returned $1.3B to shareholders via share repurchases
– Nearly 30% of shares outstanding retired
• 30 franchisees (average of 36 units each) partner in our growth
– Over the past decade, they have constructed or acquired over 500 cafes with their
capital

Setting Panera Up for an Even Stronger Future

We’ve been working to transform Panera so we
can once again set ourselves on a path of
industry-leading performance…

…while providing opportunities for expanded
high-ROI growth in several adjacent
$1B+ channels.
18

HOW OUR PLAN HAS EVOLVED….
• Panera 2.0 prototyped
(Operational Integrity and
digital access)
DEFINED AN IMPROVED
GUEST EXPERIENCE THAT
REDUCES FRICTION
2012
19

HOW OUR PLAN HAS EVOLVED….
• Delivery, catering hubs,
Panera at Home prototyped
• eCommerce and technology
capabilities built
IMAGINED RUNWAYS FOR
EXPANDED GROWTH
2013
20

HOW OUR PLAN HAS EVOLVED….
• Concept Essence redefined,
giving us a powerful North
Star to guide all of our
innovations
• Craveable wellness and an
elevated experience
REFINED VISION FOR HOW
THE PANERA CAFÉ DRIVES
DESIRE
2014
21

HOW OUR PLAN HAS EVOLVED….
• Panera 2.0 scaled
• Innovation in Ops, Food and
Marketing
• Clean food initiative
announced with “No No List”
• “Food as it should be”
campaign launched
BASED ON CONCEPT
ESSENCE, WE ACTIVATED
INNOVATION IN
OPERATIONS, FOOD &
BAKERY, MARKETING &
STORE DESIGN
2015
22

Today, our 5-year vision has taken form and
we can more clearly see our future.

OUR 5-YEAR VISION
Café that is a Better Competitive Alternative
(Less Friction / Greater Desire)
ENDS
2.0 (Operational Integrity + Digital Access) Concept Essence activating Innovation in: Food/bakery, Marketing, Operations, Design, Sourcing
Runways for expanded growth: “Hoovering”
(Take Share in Adjacent $1B+ Markets)
MEANS (INITIATIVES)
Delivery
High-ROI Unit Growth (traditional, new formats)
Panera at Home
Catering
BYPRODUCT: SUSTAINED DOUBLE-DIGIT EARNINGS GROWTH
Strengthen Capabilities to Execute KIs
(“Get the Job Done”)
Resources to Invest
(Deliver Profit For Shareholders)
Human Capabilities in Place
Ecommerce Strategy/IT Execution
Comp growth ahead of industry
Intensive margin improvement effort
Return cash to shareholders
B-2-25-16 24
What’s more, the themes that are central to our
5-year vision are now being validated by others
as themes for success in the restaurant industry
going forward.
25
“We continue to view Panera as the only stock under our
coverage to fit both of our investment themes of using
guest-facing technology as a competitive advantage as well
as transparent food sourcing that we believe will be sales
drivers for years to come.”
- Andrew M. Charles, Cowen and Company
Our results indicate that our strategy to be a
better competitive alternative with runways for
expanded growth is working.

Q1 Comps Strongest in Over Three Years
3.3%
4.1%
1.7% 1.7%
-0.4%
1.0%
1.8%
3.5%
1.9%
2.6%
3.8% 3.4%
6.2%
-1.0%
0.0%
1.0%
2.0%
3.0%
4.0%
5.0%
6.0%
7.0%
Q1
20
13
Q2
20
13
Q3
20
13
Q4
20
13
Q1
20
14
*
Q2
20
14
*
Q3
20
14
Q4
20
14
Q1
20
15
Q2
20
15
Q3
20
15
Q4
20
15
Q1
20
16
^
Comps % Change vs Prior Year
*Adjusted for Easter timing ^Reported
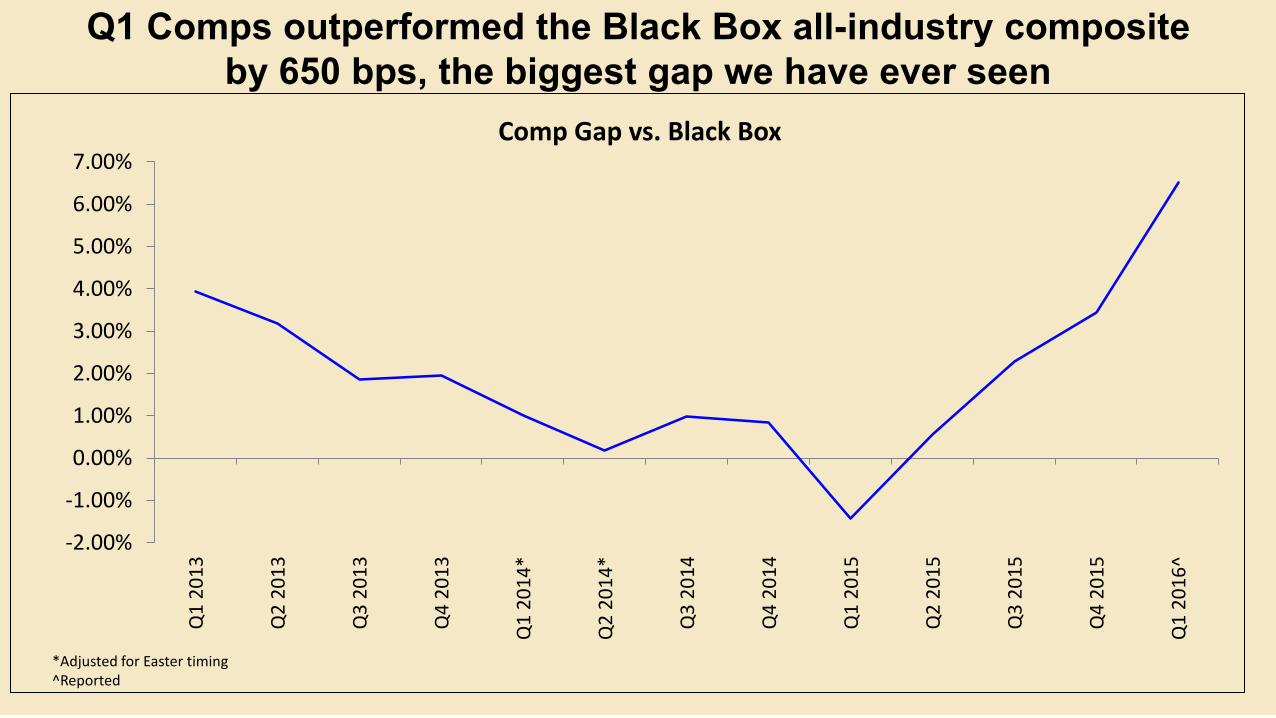
Q1 Comps outperformed the Black Box all-industry composite
by 650 bps, the biggest gap we have ever seen
-2.00%
-1.00%
0.00%
1.00%
2.00%
3.00%
4.00%
5.00%
6.00%
7.00%
Q1
20
13
Q2
20
13
Q3
20
13
Q4
20
13
Q1
20
14
*
Q2
20
14
*
Q3
20
14
Q4
20
14
Q1
20
15
Q2
20
15
Q3
20
15
Q4
20
15
Q1
20
16
^
Comp Gap vs. Black Box
*Adjusted for Easter timing ^Reported

Eight consecutive quarters of transaction growth
-2.4%
-0.5%
-1.0% -0.8%
-3.3%
0.8%
1.4% 1.3%
0.3%
1.0% 0.9% 1.1%
2.9%
-4.0%
-3.0%
-2.0%
-1.0%
0.0%
1.0%
2.0%
3.0%
4.0%
Transactions % Chg vs Prior Year & Gap vs Black Box
Transactions*Adjusted for Easter timing ^Post-refranchising net internal comps
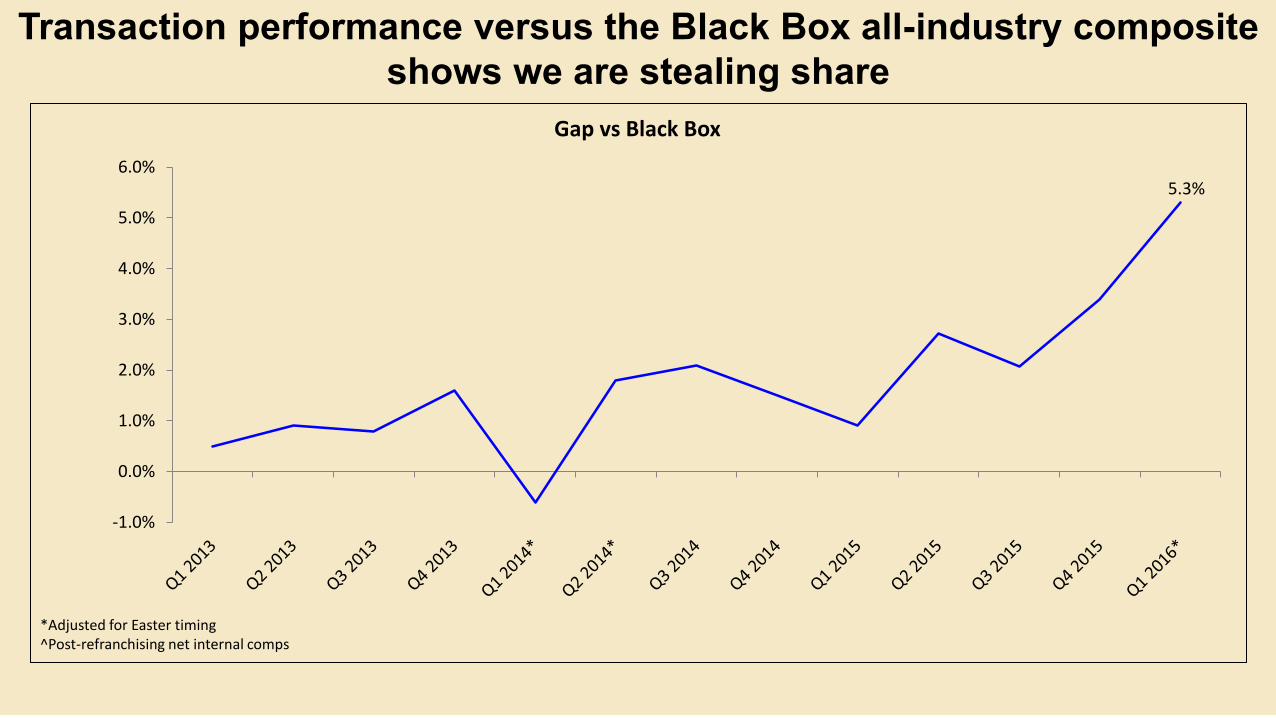
Transaction performance versus the Black Box all-industry composite
shows we are stealing share
5.3%
-1.0%
0.0%
1.0%
2.0%
3.0%
4.0%
5.0%
6.0%
Gap vs Black Box
*Adjusted for Easter timing ^Post-refranchising net internal comps

And we are building on our momentum.

• Comps growing faster in
Panera 2.0 cafes
• 452 company Panera 2.0 cafes
operating at the end of Q1
• Approximately 200 company
cafes will be converted to
Panera 2.0 in 2016
• 75% of franchise groups are
expected to begin 2.0
conversions in 2016, for a
total of 100 franchised 2.0
cafes by year-end
PANERA 2.0
33
WE ARE REDUCING FRICTION
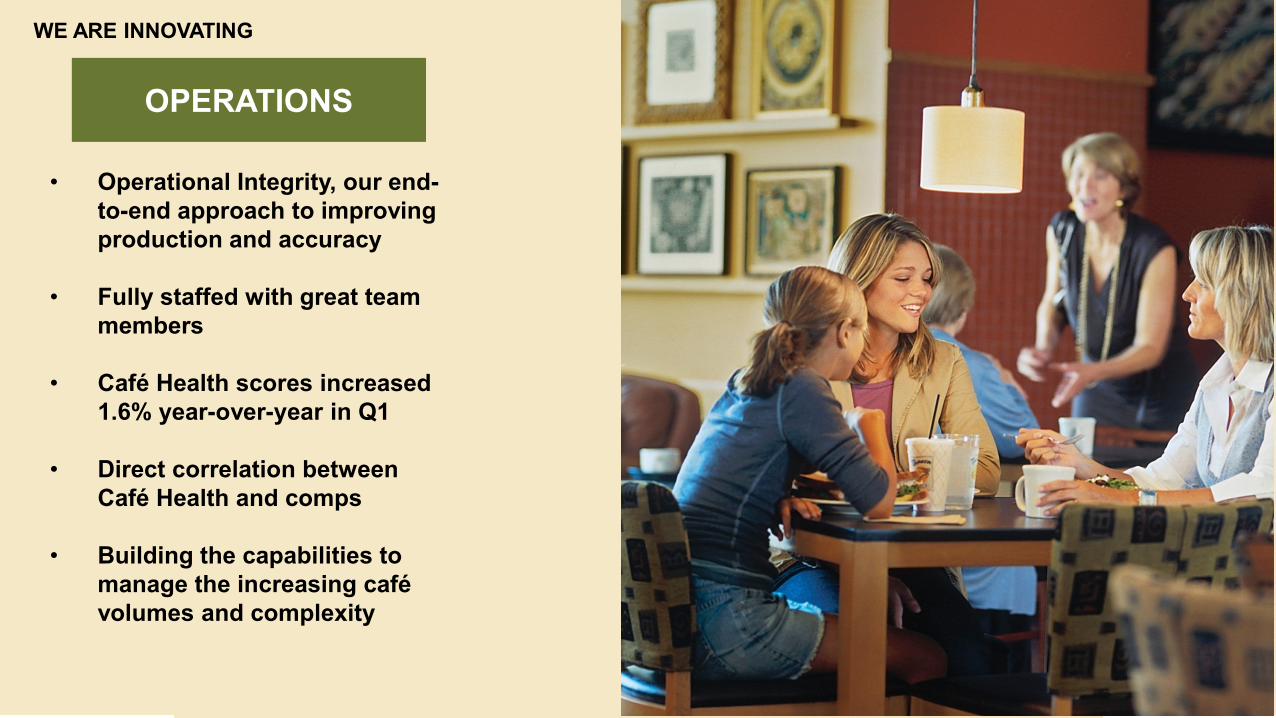
• Operational Integrity, our end-
to-end approach to improving
production and accuracy
• Fully staffed with great team
members
• Café Health scores increased
1.6% year-over-year in Q1
• Direct correlation between
Café Health and comps
• Building the capabilities to
manage the increasing café
volumes and complexity
OPERATIONS
34 DM
WE ARE INNOVATING
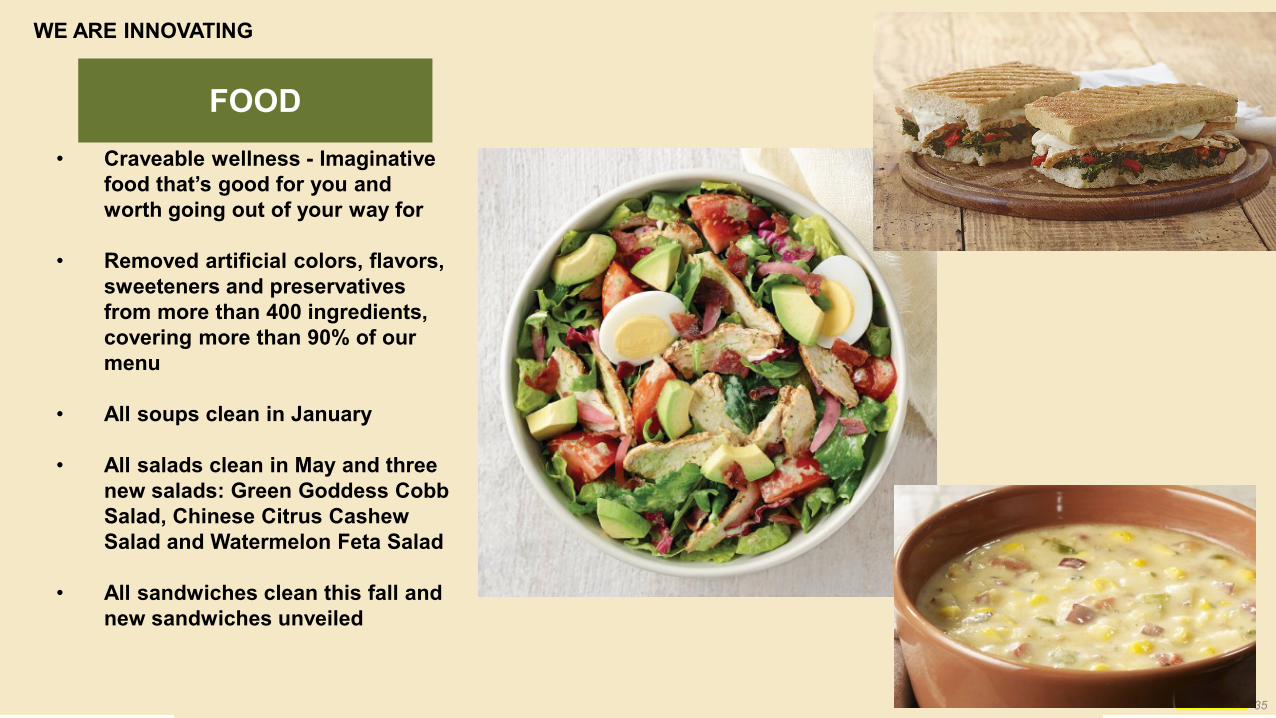
• Craveable wellness - Imaginative
food that’s good for you and
worth going out of your way for
• Removed artificial colors, flavors,
sweeteners and preservatives
from more than 400 ingredients,
covering more than 90% of our
menu
• All soups clean in January
• All salads clean in May and three
new salads: Green Goddess Cobb
Salad, Chinese Citrus Cashew
Salad and Watermelon Feta Salad
• All sandwiches clean this fall and
new sandwiches unveiled
FOOD
35 DM
WE ARE INNOVATING

• “Food As It Should Be” continues
to be a powerful communications
platform that is helping to further
strengthen our brand reputation
and build relevance with our
target customers.
• We continue to build our
reputation with influencers
through earned media.
• MyPanera, with more than 22
million members and representing
about 50% of company
transactions, is a powerful way to
grow specific dayparts, products
and channels
MARKETING
36 DM
WE ARE INNOVATING

• Test cafes saw strong sales
• 70 bakery cafes offering
delivery in 6 markets at end of
Q1
• We plan to roll out delivery to
more than 10% of our system
in 2016, including both
company and franchise cafes
DELIVERY
37
WE ARE EXPANDING RUNWAYS FOR GROWTH
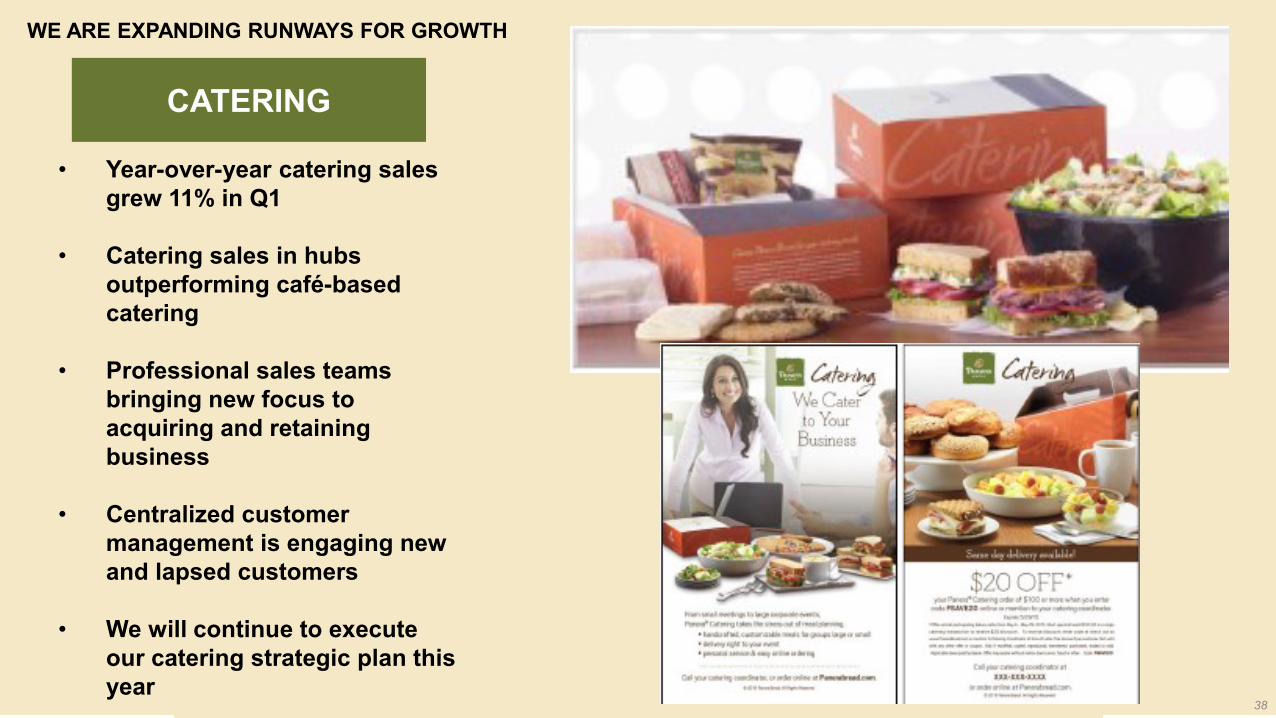
• Year-over-year catering sales
grew 11% in Q1
• Catering sales in hubs
outperforming café-based
catering
• Professional sales teams
bringing new focus to
acquiring and retaining
business
• Centralized customer
management is engaging new
and lapsed customers
• We will continue to execute
our catering strategic plan this
year
CATERING
38
WE ARE EXPANDING RUNWAYS FOR GROWTH

• A $150M business at retail in 2015,
with sales growth of more than 15%
in the past year
• We are currently in 6 categories:
soup, mac n cheese, salad
dressing, coffee, frozen bread and
sliced bread
• We are beginning to transition
categories within our Panera at
Home portfolio from a licensed
model to a co-pack model in which
we manage the customer
PANERA AT HOME
39 DM
WE ARE EXPANDING RUNWAYS FOR GROWTH
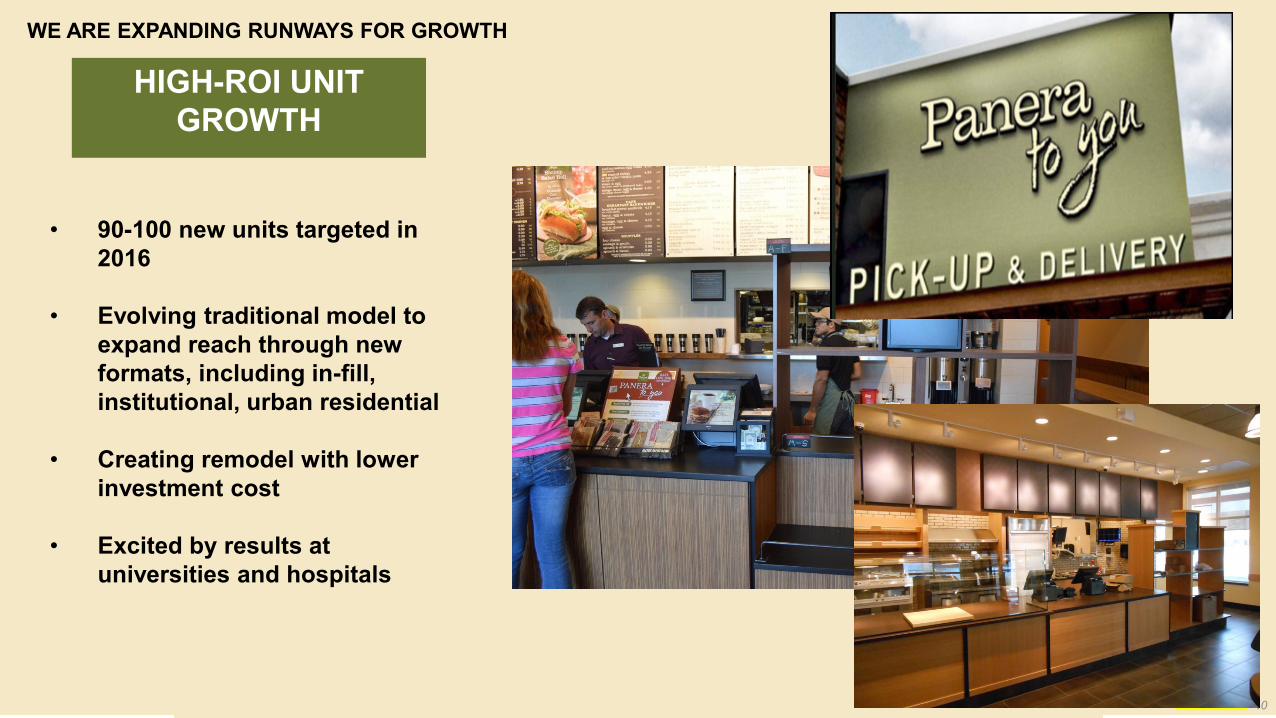
• 90-100 new units targeted in
2016
• Evolving traditional model to
expand reach through new
formats, including in-fill,
institutional, urban residential
• Creating remodel with lower
investment cost
• Excited by results at
universities and hospitals
HIGH-ROI UNIT
GROWTH
40 DM
WE ARE EXPANDING RUNWAYS FOR GROWTH
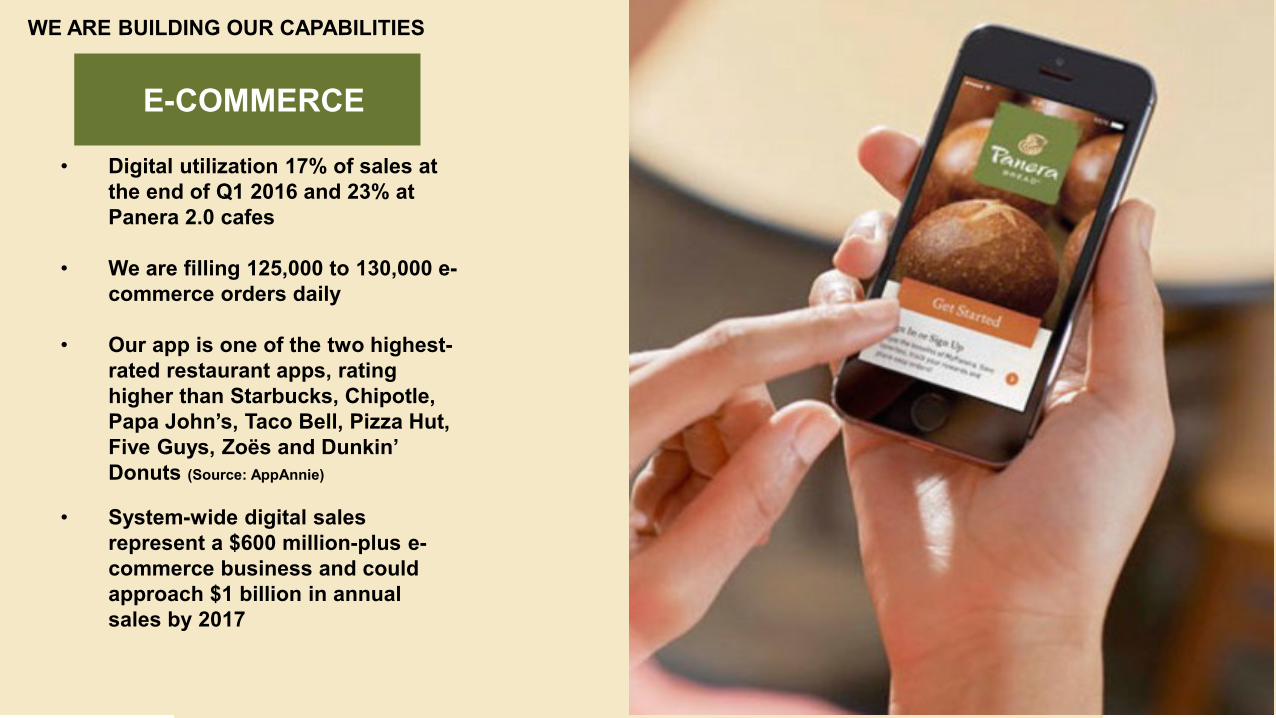
• Digital utilization 17% of sales at
the end of Q1 2016 and 23% at
Panera 2.0 cafes
• We are filling 125,000 to 130,000 e-
commerce orders daily
• Our app is one of the two highest-
rated restaurant apps, rating
higher than Starbucks, Chipotle,
Papa John’s, Taco Bell, Pizza Hut,
Five Guys, Zoёs and Dunkin’
Donuts (Source: AppAnnie)
• System-wide digital sales
represent a $600 million-plus e-
commerce business and could
approach $1 billion in annual
sales by 2017
E-COMMERCE
41
DM
WE ARE BUILDING OUR CAPABILITIES

Imagine our sales and profit potential as we
strengthen our competitive position and access
the additional channels for growth we have
available to us.

We can now see the mountaintop,
although we still have work to do.


Closing Thoughts
45
We are committed to winning this race and
delivering the long-term shareholder value
that has been Panera’s hallmark for more
than 20 years.
THANK YOU
46
Recommended