THEODOR COJOIANU
MENGHONS PROJECT REPORT HSP 2427
Shale Gas and Hydraulic Fracturing:
Risk and Opportunity Analysis
for Oil and Gas Companies, Investors and
the Future Energy Sector – Lessons from the US
14thJanuary 2014
Shale Gas and Hydraulic Fracturing:
Risk and Opportunity Analysis for
Oil and Gas Companies, Investors and
The Future Energy Sector-Lessons from the US
Student: Theodor Cojoianu, The University of Edinburgh
University Supervisors: Prof. Anthony Walton, The University of Edinburgh Dr. Peter Ewen, The University of Edinburgh
Thesis Examiner: Prof. Ian Underwood, The University of Edinburgh
Industrial Supervisors: Eric Moen, Executive Director, MSCI ESG Research
Dana Sasarean, Senior Analyst, MSCI ESG Research
14th January 2014
i
Theodor Cojoianu, The University of Edinburgh
MEng Thesis
Table of Contents
Table of Contents ......................................................................... i MEng Project Mission Statement...................................................... v
Declaration of Originality ................................................................. vii
Abstract ............................................................................................. viii
1 MEng Thesis Project Background ......................................... 9
1.1 Introduction ............................................................................. 9
1.2 Indication of Research Impacts ............................................. 9
1.3 QuantumGIS Analysis Tool .................................................. 10
1.4 MEng Thesis Outlook ........................................................... 11
2 Literature Review and Shale Gas Research Trends ........... 12
2.1 Introduction ........................................................................... 12
2.2 Shale Gas and Hydraulic Fracturing Research Trends ...... 12
2.3 Shale Gas and Hydraulic Fracturing Literature Review .... 15
2.4 Conclusions ............................................................................ 21
3 Pennsylvania Unconventional Gas Development Case Study ......................................................................................... 22
3.1 Introduction and Chapter Outlook ...................................... 22
3.2 Pennsylvania Shale Development Datasets ...................... 22
3.3 Pennsylvania Conventional and Unconventional Production ......................................................................................... 23
3.4 Wastewater Management Analysis in Pennsylvania (2000 – 2013) .................................................................................... 32
3.5 Pennsylvania Unconventional Oil and Gas Violations ...... 39
3.6 Pennsylvania Shale Gas Production, Wastewater Management and Violations Conclusions ..................................... 43
4 Quantifying Company Risk in Pennsylvania Shale Gas Development ........................................................................... 44
4.1 Introduction ........................................................................... 44
4.2 Top Level Risk Methodology ................................................ 44
ii
Theodor Cojoianu, The University of Edinburgh
MEng Thesis
4.3 MSCI ESG Research Intangible Value Assessment (IVA) Methodology ..................................................................................... 46
5 US Wide Hydraulic Fracturing Case Study .......................... 53
5.1 Introduction ........................................................................... 53
5.2 FracFocus National Registry ................................................ 53
5.3 Conclusions and Critical Assessment .................................. 62
6 World Shale Gas Outlook .................................................... 63
6.1 Introduction ........................................................................... 63
6.2 Shale Gas Estimates Definitions .......................................... 63
6.3 Review of World Shale Gas Assessments ........................... 64
6.4 Regional Shale Gas Development Outlook and Challenges .......................................................................................... 65
6.5 Conclusions ............................................................................ 67
7 Conclusions .......................................................................... 68
8 Statement of Achievement ................................................. 70
Appendix A.1 - Shale Gas Production per Well H1 2013 (PA) ........................................................................................... 79
Appendix A.2 – Cumulative Shale Gas Production in PA by Company .................................................................................. 80
Appendix A.3 – Fracturing Fluid Chemical and Volumetric Composition ............................................................................. 81
Appendix A.4- Number of Violations per Inspected Well ...... 82
Appendix A.5 – Gas Production to Wastewater Ratio (PA Shale Operators) ...................................................................... 83
Appendix A.6 MSCI Intangible Value Assessment Hierarchy Model ....................................................................................... 84
Appendix A.7 – FracFocus Web Crawler C# Code .................. 85
Appendix A.8 – Google Trends Crawler C# Code ................... 86
Appendix A.9 – EIA / ARI Assessment of World Shale Formations ............................................................................... 87
Appendix A.10 – FracFocus Sample Report ............................ 89
FIGURE 1: SCOPUS ANALYSIS ON TOTAL NUMBER OF HYDRAULIC FRACTURING AND SHALE GAS RELATED
PUBLICATIONS (1996 - OCT 2013). DATASET: SCOPUS 2013 ................................................................. 13
iii
Theodor Cojoianu, The University of Edinburgh
MEng Thesis
FIGURE 2: HYDRAULIC FRACTURING TECHNOLOGICAL MILESTONES (1900 - 2007). SOURCE: DEPARTMENT OF ENVIRONMENTAL CONSERVATION (GENERIC ENVIRONMENTAL IMPACT SUPPLEMENT), NEW YORK STATE. ........................................................................................................................................................ 13
FIGURE 3: US DEPARTMENT OF ENERGY NATURAL GAS FUNDING HISTORY. SOURCE: DEPARTMENT OF ENERGY OFFICE OF FOSSIL ENERGY. MIT 2011. .................................................................................... 14
FIGURE 4: US TOP 7 STATES IN SHALE GAS CUMULATIVE PRODUCTION. SOURCE: THEODOR COJOIANU, EIA, QUANTUM GIS. .......................................................................................................................................... 16
FIGURE 5: TOTAL US NATURAL GAS PRODUCTION AND CONSUMPTION IN TRILLION CUBIC FEET (TCF), 1990 - 2040 (LEFT) AND BREAKDOWN OF PRODUCED NATURAL GAS (TCF) BY TYPE 1990 - 2040 (RIGHT). SOURCE: EIA ANNUAL ENERGY OUTLOOK ............................................................................................... 17
FIGURE 6: SOURCE: HOWARTH, ROBERT, RENEE SANTORO, AND ANTHONY INGRAFFEA. ‘METHANE AND THE GREENHOUSE-GAS FOOTPRINT OF NATURAL GAS FROM SHALE FORMATIONS’. CLIMATIC CHANGE 106, NO. 4 (2011): 679–690. ............................................................................................................................ 19
FIGURE 7: SHALE DEVELOPMENT LITIGATION CASES FILLED IN DIFFERENT US STATES. SOURCE: NAVIGANT CONSULTING 2013..................................................................................................................................... 20
FIGURE 8: SHALE DEVELOPMENT LITIGATION CASES FILLED BY THEME. SOURCE: NAVIGANT CONSULTING 2013 ........................................................................................................................................................... 20
FIGURE 9: NUMBER OF NEW PERMITS ISSUED IN PA (2000 - NOV 2013). DATASET: PA DEPARTMENT OF ENVIRONMENTAL PROTECTION. ................................................................................................................ 24
FIGURE 10: NUMBER OF NEW WELL PERMITS IN PENNSYLVANIA BY FUEL TYPE (2000 - NOV 2013). DATASET: PA DEPARTMENT OF ENVIRONMENTAL PROTECTION ............................................................................... 25
FIGURE 11: NUMBER OF ACTIVE SHALE GAS PRODUCING WELLS AND SHALE GAS PRODUCTION VOLUMES IN PENNSYLVANIA (2000 -2013). DATASET: PA DEP .................................................................................. 26
FIGURE 12: AVERAGE SHALE GAS PRODUCTION PER ACTIVE WELL IN H1 2013 IN PENNSYLVANIA. TOP 11 COMPANIES. DATASET: PA DEP .............................................................................................................. 27
FIGURE 13: CUMULATIVE SHALE GAS PRODUCTION IN PENNSYLVANIA BY OPERATOR (2004 - H1 2013). ..... 28 FIGURE 14: PENNSYLVANIA CUMULATIVE SHALE GAS PRODUCTION MAP. THEODOR COJOIANU: QUANTUM
GIS ANALYSIS. ........................................................................................................................................... 30 FIGURE 15: PENNSYLVANIA CONVENTIONAL AND UNCONVENTIONAL DRILLED WELLS (2000 - H1 2013).
THEODOR COJOIANU, QUANTUM GIS ANALYSIS. ..................................................................................... 31 FIGURE 16: TOTAL OIL AND GAS WASTEWATER VOLUME IN PENNSYLVANIA (2004 - 2013). DATASET: PA
DEP ........................................................................................................................................................... 33 FIGURE 17: CUMULATIVE SHALE GAS TO WASTEWATER RATIO (MCF / BBL) FOR SHALE GAS OPERATOR IN PA
(2004 - H1 2013). DATASET: PA DEP ..................................................................................................... 35 FIGURE 18: WASTEWATER DISPOSAL TYPE AND WASTEWATER VOLUMES IN PA UNCONVENTIONAL SHALE
GAS. ........................................................................................................................................................... 36 FIGURE 19: PENNSYLVANIA CONVENTIONAL AND UNCONVENTIONAL DRILLED WELLS AND WASTEWATER AND
DISPOSAL FACILITIES. THEODOR COJOIANU, QUATUM GIS. ................................................................... 38 FIGURE 20: NUMBER OF FINES, VIOLATIONS AND ASSOCIATED FINE AMOUNT FOR PENNSYLVANIA SHALE GAS
OPERATORS (2004 - H1 2013). ................................................................................................................ 40 FIGURE 21: COMPANY VIOLATIONS IN PENNSYLVANIA SHALE GAS DEVELOPMENT (2004 - JUL 2013). ......... 42 FIGURE 22: SHALE GAS OPERATOR RISK AGGREGATION MODEL ..................................................................... 47 FIGURE 23: AGGREGATE COMPANY RISK EXPOSURE TO SHALE GAS OPERATIONS ........................................ 49 FIGURE 24: AGGREGATE COMPANY RISK EXPOSURE TO SHALE GAS DEVELOPMENT IN PENNSYLVANIA AND
OVERALL COMPANY OPERATIONS ............................................................................................................. 50 FIGURE 25: NUMBER OF REPORTED US WIDE WELLS HYDRAULICALLY FRACTURED (2011 - MAY 2013)
FRACFOCUS REGISTRY ............................................................................................................................. 55 FIGURE 26: US WIDE HYDRAULICALLY FRACTURED WELLS ESTIMATION. THEODOR COJOIANU, QUANTUM
GIS. ............................................................................................................................................................ 56 FIGURE 27: AVERAGE WATER VOLUME PER WELL BY STATE USED IN HYDRAULIC FRACTURING OPERATIONS
AND NUMBER OF FRACTURED WELLS (2011 - MAY 2013) ...................................................................... 57 FIGURE 28: TOTAL OIL AND GAS WASTEWATER VOLUME (GALLONS) ESTIMATION .......................................... 58 FIGURE 29: US SHALE OIL AND GAS OPERATORS RISK EXPOSURE. DATASET: MSCI ESG RESEARCH ........ 61 FIGURE 30: SHALE GAS GLOBAL RESERVE ESTIMATIONS (ROGNER 1997[78], LAHERRERE 2004[79], ARI
2011[81], MCGLADE ET AL. 2013[80] AND EIA/ARI 2013[80]) .............................................................. 64 FIGURE 31: EIA / ARI 2013 TOP 10 COUNTRIES WITH SHALE GAS TECHNICALLY RECOVERABLE RESERVES65

iv
Theodor Cojoianu, The University of Edinburgh
MEng Thesis
FIGURE 32: VOLUMETRIC COMPOSITION OF A FRACTURE FLUID. SOURCE: GROUND WATER PROTECTION COUNCIL AND ALL CONSULTING "MODERN SHALE GAS DEVELOPMENT IN THE UNITED STATES" A PRIMER (2009). BASED ON DATA FROM A FRACTURE OPERATION IN THE FAYETTEVILLE SHALE 2008. . 81
v
Theodor Cojoianu, The University of Edinburgh
MEng Thesis
MEng Project Mission Statement Shale Gas and Hydraulic Fracturing:
Risk and Opportunity Analysis for Oil and Gas
Companies, Investors and the Future Energy Sector -
Lessons from the US
Student: Theodor Cojoianu
Supervisor: Dr. Peter Ewen
Project Background:
The project will explain how shale gas is now accessible for extraction due to technological innovations in horizontal drilling and hydraulic fracturing. The transformative effect of shale gas on the US Energy sector and the consequences worldwide will be described and the debate placed in the context of the transition to a low carbon economy, industry best practices, hydraulic fracturing technology risks, water stress, biodiversity and land use, and community impact. In the light of the US Energy Information Administration (EIA) study of the “137 shale formations in 41 Countries Outside the United States” [1]there is a real potential for other countries to pursue shale gas exploration and production as part of their quest for energy security and independence.
In this respect, one important goal of the project will be to identify the risks associated with shale gas exploration and production as well as the deployment of hydraulic fracturing technology. The thesis will also focus on finding the risk exposure and opportunities of integrated Oil and Gas companies involved in shale gas production in the US, as well as exploring which are the companies best positioned to benefit from the shale gas industry in other countries given their experience in the US context.
vi
Theodor Cojoianu, The University of Edinburgh
MEng Thesis
Project Aims:
To provide a literature review of all the academic literature on risks and opportunities of hydraulic fracturing within the shale gas context. The literature review process will track the themes of reviewed publications in order to identify under-researched areas and propose further questions for academic research.
To assess the risks and opportunities for integrated Oil and Gas companies involved in shale gas extraction and hydraulic fracturing in the US. The assessment will include carbon exposure, water stress, community impact, land and natural resource use as well as company management approaches to mitigating shale development impacts.
To identify the leaders and laggards in industry best practices by relative benchmarking of Oil and Gas companies. The relative benchmarking exercise will be conducted in alignment with the MSCI ESG Research Intangible Value Assessment Methodology and Company Scores.
To provide a top level comparison between US and other countries which are considering whether to pursue the dash for gas as a road for energy security and independence.
To identify the companies best positioned to benefit from shale gas developments in other countries.
Resources Required:
Microsoft Office Suite
Matlab- Tool for Optimizing Portfolios of Companies
MSCI ESG Research Internal Databases and Research Tools
End Note X5 – Software for managing the references and bibliographies for the literature review.
The supervisor and student are satisfied that this project is suitable for performance and assessment in accordance with the guidelines of the course documentation.
Signed:
Theodor Cojoianu…………………………….
Dr. Peter Ewen………………………………..
vii
Theodor Cojoianu, The University of Edinburgh
MEng Thesis
Declaration of Originality I declare that this thesis is my own work except where stated.
…………………………………………………………………....
Theodor Cojoianu, The University of Edinburgh
viii
Theodor Cojoianu, The University of Edinburgh
MEng Thesis
Abstract The present Masters (MEng) thesis aims to analyse both qualitatively and quantitatively, the risks
and opportunities arising from shale gas development in the US. The thesis draws upon multiple
studies in order to identify the most prominent shale development impacts and most pressing risks.
Through the literature review and Scopus database analysis, the thesis illustrates both the
exponential rise in shale gas related research in the past few years and the fact that academic
research has yet to catch up with the numerous challenges this industry poses.
Next, risks are quantified at the company level, regional level and US wide level. A case study on
shale gas development in Pennsylvania (PA) is illustrated through production, wastewater and shale
operator violations statistics. The study further shows that the number of unconventional well
permits has surpassed those awarded for conventional oil and gas development and in addition,
shale gas production volumes are 7 times higher than conventional gas production volumes. On the
other hand, the cumulative unconventional wastewater volumes in PA have been 6 times larger than
wastewater coming from conventional oil and gas activities. On average, the wastewater per gas
produced ratio in unconventional wells is lower than conventional ones.
Shale gas production and water risk statistics are extrapolated at the US wide level based on industry
datasets and the case study built on Pennsylvania. Shale gas operator risks are quantified using
production, wastewater and violations metrics, together with company ESG scores. Last but not
least, the thesis presents an outlook of shale gas development around the world together with
different global shale gas estimation approaches.
9
Theodor Cojoianu, The University of Edinburgh
MEng Thesis
1 MEng Thesis Project Background
1.1 Introduction This MEng Placement project is being undertaken within the London office of MSCI ESG Research, an
integrated business unit of MSCI (formerly known as Morgan Stanley Capital International), during
the employment period 17th June 2013 – 20th December 2013. The present submission represents
the MEng thesis deliverable in accordance with the University of Edinburgh guidelines[2].
I am currently working as an Energy and Business Performance Analyst within MSCI ESG Research,
focusing on researching the risk exposure of shale gas operators in the United States both
qualitatively and quantitatively. Part of my 6 month placement I have participated in shale gas and
energy finance conferences, I have participated in analyst calls with an MSCI client and presented
the initial findings of the present research and participated in several other MSCI projects which are
presented in more detail in the Statement of Achievement.
1.2 Indication of Research Impacts Initial findings of the thesis were discussed at the Shale Gas Impacts Conference in October 2013,
organised by SGH Martineau, a law firm specialised in UK energy and electricity markets among
several other areas. Input regarding the thesis was gathered from energy and environmental experts
from SGH Martineau and JP Morgan Asset Management.
As a result of the conference, contacts have been established with the Environmental and Social Risk
Division of JP Morgan, with whom an initial exchange of findings has been shared during a
conference call. The lending arm of JP Morgan, who is a major investor in US shale gas, is directly
interested in shale gas operator company risk, for both listed and unlisted companies.
I participated directly in MSCI ESG Research’s RFP for the Hydraulic Fracturing Research Disclosure,
which aimed to assess the disclosure practices of c. 50 global shale operators. The research was
awarded to a different company, who presented the findings in late November. The outputs of the
research are accounted for in the thesis, having participated in the presentation webinar[3, 4].
The thesis tackles among other topics, the quantification of risk for shale gas operators resulting
from shale development operations. The topic was approached conceptually by just several
studies[3, 5, 6], and out of the publically available studies, MSCI ESG Research makes an attempt to
quantify company risk[5]. In this respect, the thesis is one of the first studies to explore company risk
management approaches and performance related to shale gas development.
10
Theodor Cojoianu, The University of Edinburgh
MEng Thesis
The present research is of direct interest to shale gas operators,oil and gas government and state
departments in the US and worldwide, energy consultants, energy and carbon finance professionals,
policy makers, economists, lending arms of banks and investors, communities leasing land for shale
gas production, academics and last but not least, it is of direct interest to decision makers
considering shale gas development risks and opportunities.
1.3 QuantumGIS Analysis Tool Most datasets leveraged for the thesis contained information regarding the geo-location of
conventional and unconventional wells (in Pennsylvania and US wide) and wastewater and disposal
facilities (Pennsylvania only) used in by the shale gas industry. For the thesis purposes, the Quantum
GIS software (version 1.8 Lisboa) was leveraged to improve the robustness of the datasets, perform
data quality checks, analyse special datasets and provide high resolution data visualisations.
QuantumGIS or QGIS is an open source Geographic Information System (GIS) which is used to create,
visualise and analyse geospacial information. The required training and tutorials in order to use the
software at its full capabilities were undertaken during the placement at MSCI ESG Research[7].
11
Theodor Cojoianu, The University of Edinburgh
MEng Thesis
1.4 MEng Thesis Outlook
Chapter 2 sets out by presenting the historical number of publications and uptake in research
related to shale gas development and hydraulic fracturing risks. Next, the findings resulting from
comprehensive literature review are presented. The findings enhance the insights presented in the
Phase I submission, and focus on economic impacts of shale gas, water usage, wastewater and water
contamination risks, air and carbon emissions and finally litigation and reputational risks of shale gas
operators.
Chapter 3 represents a compelling case study on shale gas development in Pennsylvania from a
production, wastewater management and company violations perspective. Shale gas production,
waste and violations datasets, records and reports from the Pennsylvania Department of
Environmental Protection (PA DEP) are analysed extensively to provide both a top level overview of
shale gas in Pennsylvania and a disaggregate shale gas operator risk and opportunity perspective.
Several metrics for analysing company shale risk exposure are established based on the datasets and
an initial company benchmarking discussion takes place.
In Chapter 4, the focus shifts entirely on quantifying shale gas operator risk based on the
performance metrics described in Chapter 3 and company environmental, social and governance
(ESG) scores provided by MSCI ESG Research. A risk methodology is proposed, based on the
Intangible Value Assessment methodology used by the energy team within MSCI ESG Research.
Finally, the companies which have benefited mostly from shale gas development while having
minimal environmental impacts are indentified together with industry laggards.
Chapter 5 is an extension of Chapter 3 at an US wide level. Datasets from the FracFocus National
Chemical Registry, together with Pennsylvania datasets are merged in order to provide a US country
case study on shale gas development. MSCI ESG Research company scores are further leveraged to
provide an assessment of the environmental and social risk performance of US shale gas operators,
and to identify the best and worst performing operators across the country.
Finally, Chapter 6 provides a literature review of the different studies estimating shale reserves at a
global level. Based on the literature review, the most robust global estimations are chosen to
support the discussion regarding the state of shale gas development across the globe.
12
Theodor Cojoianu, The University of Edinburgh
MEng Thesis
2 Literature Review and Shale Gas Research Trends
2.1 Introduction The aim of this chapter is to both provide a comprehensive literature review related to shale gas
development risks and to illustrate general trends in shale development and hydraulic fracturing
related research. The Scopus Database [8]has been leveraged in order to download approximately
12,000 + titles abstracts and citation statistics of publications that have as central or partial themes:
hydraulic fracturing and shale gas.
The database has been the enabler for effectively determining how the research output on shale gas
evolved across the years and for further enhancement of the academic literature review on shale gas
development risks which has been presented in the Phase I research piece[9].
2.2 Shale Gas and Hydraulic Fracturing Research Trends Scopus is the world largest database of citations and abstracts of peer-reviewed literature which
provides a very comprehensive overview of the research output around the world in the fields of
science, technology and social sciences among others[8].Since shale gas development has gained
worldwide interest and since it requires an interdisciplinary approach to unveiling both its merits
and risks[10], Scopus represents one of the best sources to leverage for both our literature review
and the identification of research gaps in the field. The database contains more than 50 million
records; from 20,000 peer-reviewed journals and 5000+ publishers.
In order to put together the abstracts and citation data of our topic of interest, a query has been
designed to capture the majority of publications linked to shale gas development and hydraulic
fracturing. The query contained all the publications written in English which contained or referred to
the terms: “hydraulic fracturing”, “fracking”, “fracing”,“fraccing”or“shale gas”. The query contains
the different spellings for the hydraulic fracturing procedure as they have appeared in different
academic publications or the media[11].The search for studies has then been limited to the following
subject areas: Energy, Engineering, Environmental Science, Business Management and Accounting,
Social Sciences, Multidisciplinary and Economics, Econometrics and Finance (8,213 publications in
total as outputted by Scopus).A further constraint in our query was to look for publications in the
following categories: conference papers, articles, business articles, reviews and conference reviews,
letters, books, reports and abstract reports and book chapters. Hence, Scopus outputs 7,374
13
Theodor Cojoianu, The University of Edinburgh
MEng Thesis
publications and their abstracts, citation data and index keywords. The query has been made as of
18/10/2013 and hence, not all studies published in 2013 are included.
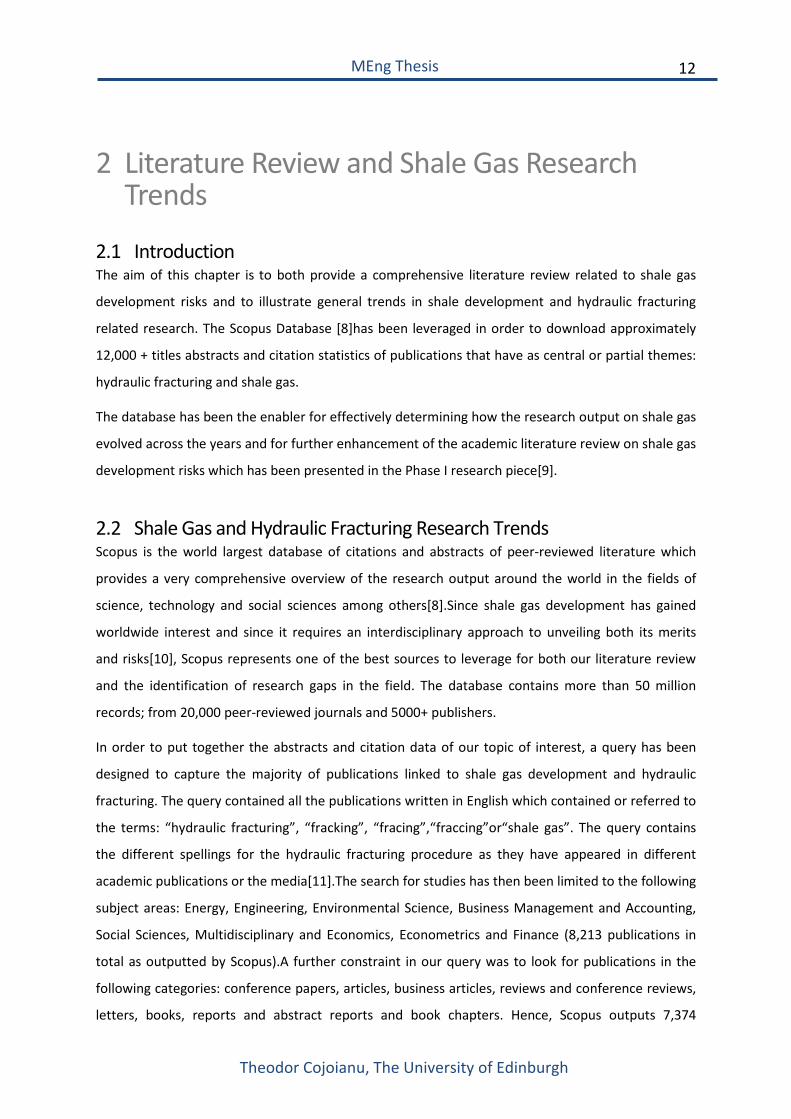
The insight drawn from analysing the collection of studies is that the number of hydraulic fracturing
and shale gas related studies has risen exponentially in the past 10 years (Figure 1).The regulators,
academia and state and US federal law have yet to catch up with the implications of the scale at
which shale gas is developed[12].
Figure 1: Scopus Analysis on Total Number of Hydraulic Fracturing and Shale Gas related publications
(1996 - Oct 2013). Dataset: Scopus 2013
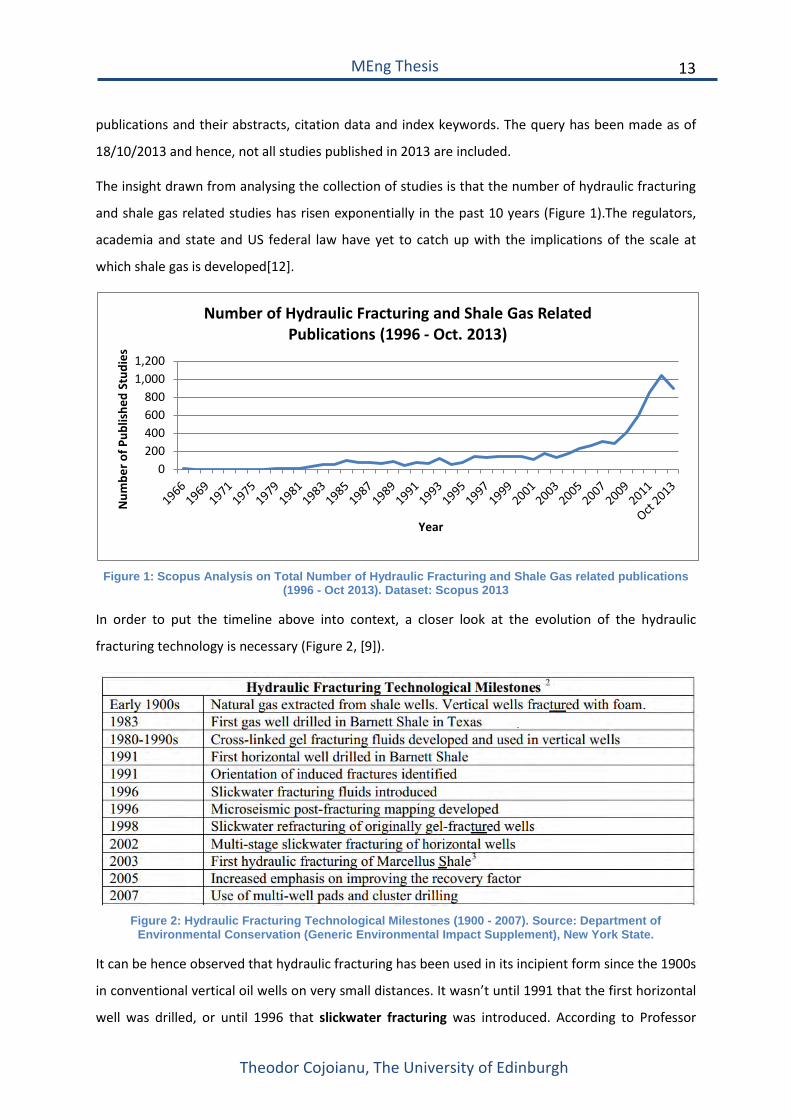
In order to put the timeline above into context, a closer look at the evolution of the hydraulic
fracturing technology is necessary (Figure 2, [9]).
Figure 2: Hydraulic Fracturing Technological Milestones (1900 - 2007). Source: Department of
Environmental Conservation (Generic Environmental Impact Supplement), New York State.
It can be hence observed that hydraulic fracturing has been used in its incipient form since the 1900s
in conventional vertical oil wells on very small distances. It wasn’t until 1991 that the first horizontal
well was drilled, or until 1996 that slickwater fracturing was introduced. According to Professor
0200400600800
1,0001,200
Num
ber o
f Pub
lishe
d St
udie
s
Year
Number of Hydraulic Fracturing and Shale Gas Related Publications (1996 - Oct. 2013)
14
Theodor Cojoianu, The University of Edinburgh
MEng Thesis
Anthony Ingraffea from Cornell University, shale oil and gas development poses significantly higher
risks than conventional oil and gas development due to the fact that it requires several technologies
recently combined (after 2007) to make unconventional gas economically recoverable[11].
These technologies are: directional drilling, the usage of high fracturing fluid volumes and the use of
multi-well pads and cluster drilling. It wasn’t then until after 2007 when shale gas development has
emerged in the form that we know it today and for which the full range of risks associated with it are
yet to be understood[13]. The uptake in research on this topic is highlighted in Figure 1, where the
period 2007-2008 is a trigger for an exponential increase in research undertaken in the area.
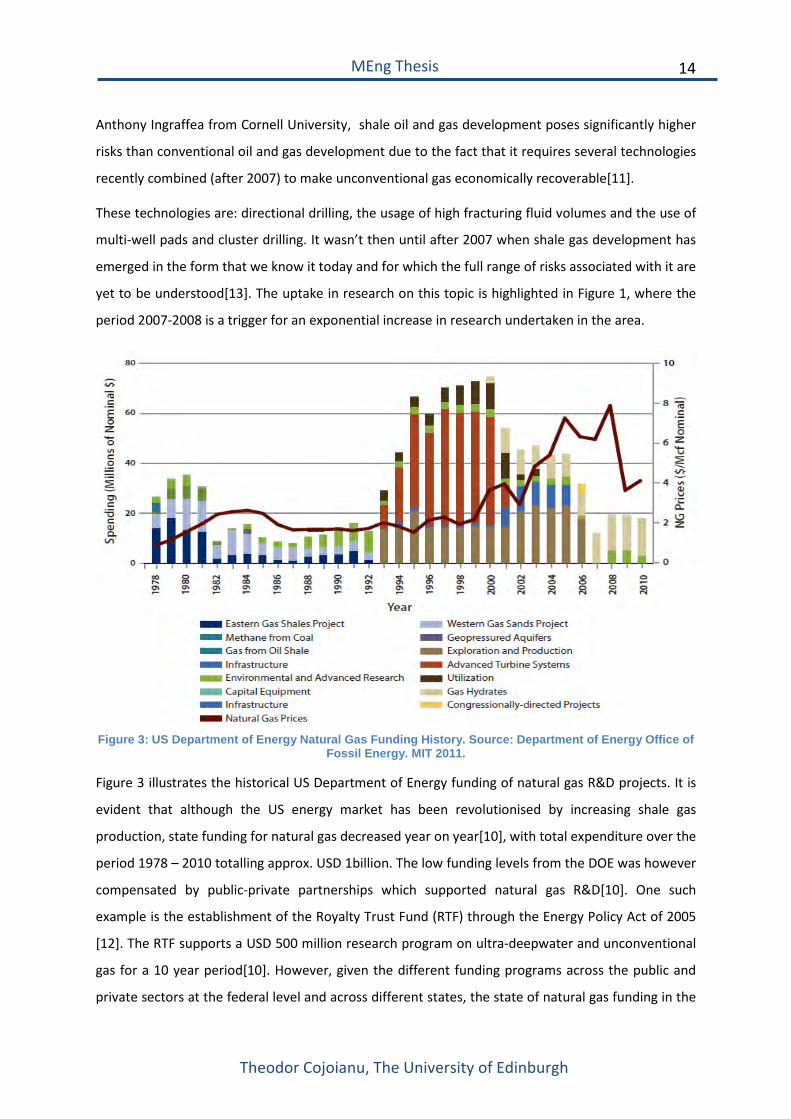
Figure 3: US Department of Energy Natural Gas Funding History. Source: Department of Energy Office of
Fossil Energy. MIT 2011.
Figure 3 illustrates the historical US Department of Energy funding of natural gas R&D projects. It is
evident that although the US energy market has been revolutionised by increasing shale gas
production, state funding for natural gas decreased year on year[10], with total expenditure over the
period 1978 – 2010 totalling approx. USD 1billion. The low funding levels from the DOE was however
compensated by public-private partnerships which supported natural gas R&D[10]. One such
example is the establishment of the Royalty Trust Fund (RTF) through the Energy Policy Act of 2005
[12]. The RTF supports a USD 500 million research program on ultra-deepwater and unconventional
gas for a 10 year period[10]. However, given the different funding programs across the public and
private sectors at the federal level and across different states, the state of natural gas funding in the
15
Theodor Cojoianu, The University of Edinburgh
MEng Thesis
US is challenging to assess given that the highest US energy policy reinforcement institution, the US
DOE, has brought natural gas funding to historical lows in the last decade.
2.3 Shale Gas and Hydraulic Fracturing Literature Review Based on the index keywords and abstracts from the compiled Scopus database, publications
referring to shale gas development impacts and hydraulic fracturing risks are shortlisted to form the
core of the comprehensive literature review presented below. In addition, a compilation of c. 40
studies made by the FracTracker Alliance[14] is included in the consultation process, together with
multiple industry reports, MSCI ESG Research industry and company reports. The literature review is
concentrated in 4 major themes: shale development economic impacts, water usage and
wastewater management and chemical risks, air emissions risks, litigation and reputational risks. A
further literature review is presented for the global estimations of shale gas resources in Chapter 6.
A comprehensive review of the stages of shale gas development (from drilling to well completion)
was presented in Phase I[9], and hence it will not be dwelled directly upon it in this chapter.
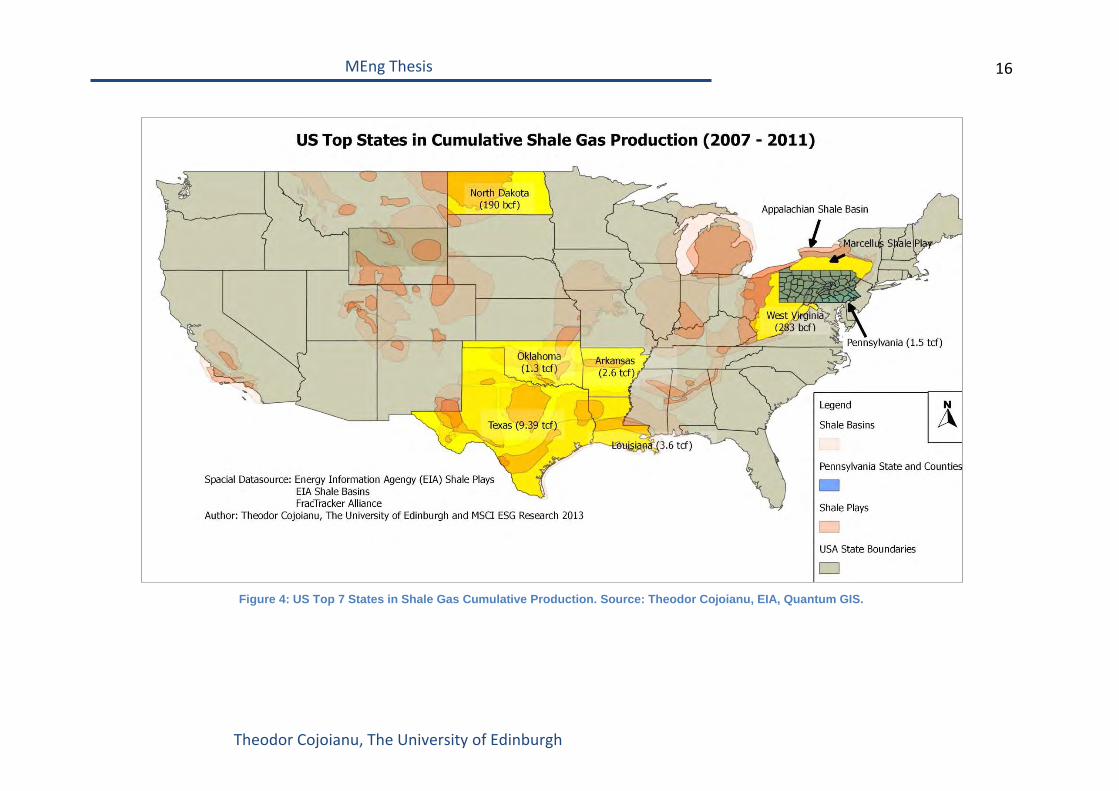
2.3.1 Shale Development Economic Impacts According to the EIA[15],the US has produced a total cumulative 19.8 trillion cubic feet of gas out of
shale formations during the period 2007 – 2011. Texas is a leading state in total shale gas production
with 9.39 trillion cubic feet of gas in the same period, followed by Louisiana (3.6 tcf), Arkansas (2.6
tcf) and Pennsylvania (1.5 tcf). The position of the states, their associated shale plays and basins as
well as cumulative shale gas production can be observed in Figure 4.The map has been prepared
using Quantum GIS and geographical and production datasets from the Energy Information
Administration (EIA).
16
Theodor Cojoianu, The University of Edinburgh
MEng Thesis
Figure 4: US Top 7 States in Shale Gas Cumulative Production. Source: Theodor Cojoianu, EIA, Quantum GIS.
17
Theodor Cojoianu, The University of Edinburgh
MEng Thesis
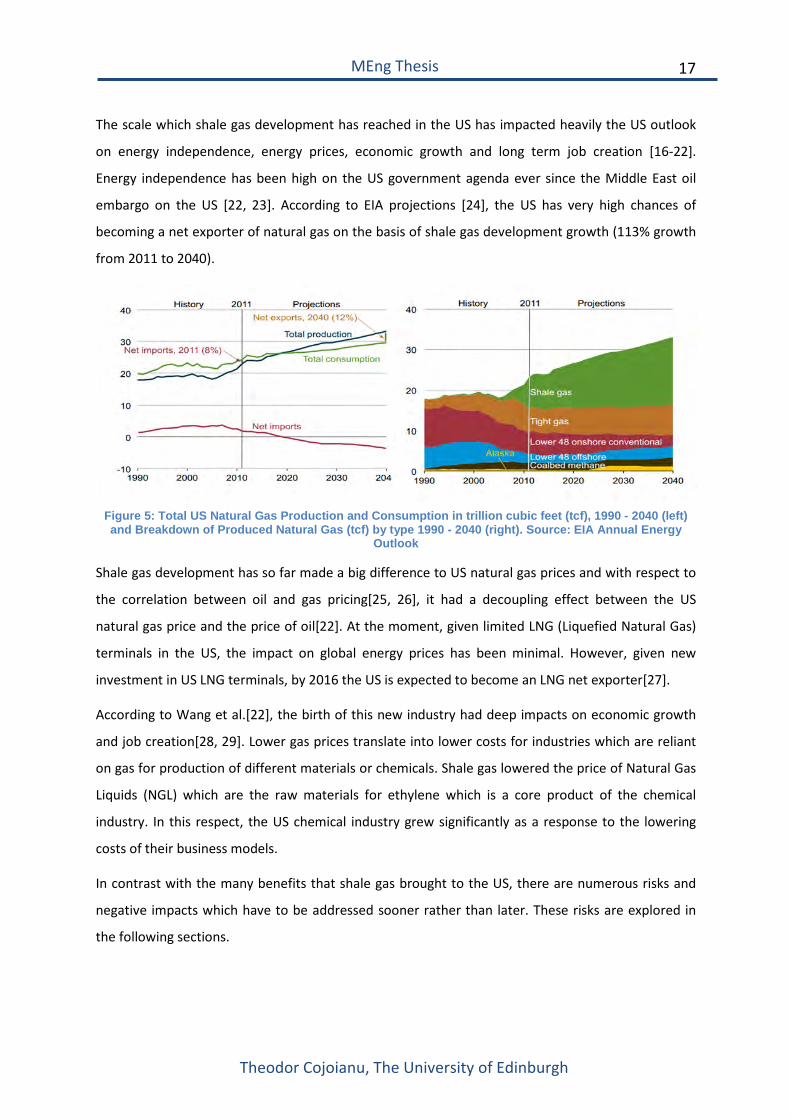
The scale which shale gas development has reached in the US has impacted heavily the US outlook
on energy independence, energy prices, economic growth and long term job creation [16-22].
Energy independence has been high on the US government agenda ever since the Middle East oil
embargo on the US [22, 23]. According to EIA projections [24], the US has very high chances of
becoming a net exporter of natural gas on the basis of shale gas development growth (113% growth
from 2011 to 2040).
Figure 5: Total US Natural Gas Production and Consumption in trillion cubic feet (tcf), 1990 - 2040 (left) and Breakdown of Produced Natural Gas (tcf) by type 1990 - 2040 (right). Source: EIA Annual Energy
Outlook
Shale gas development has so far made a big difference to US natural gas prices and with respect to
the correlation between oil and gas pricing[25, 26], it had a decoupling effect between the US
natural gas price and the price of oil[22]. At the moment, given limited LNG (Liquefied Natural Gas)
terminals in the US, the impact on global energy prices has been minimal. However, given new
investment in US LNG terminals, by 2016 the US is expected to become an LNG net exporter[27].
According to Wang et al.[22], the birth of this new industry had deep impacts on economic growth
and job creation[28, 29]. Lower gas prices translate into lower costs for industries which are reliant
on gas for production of different materials or chemicals. Shale gas lowered the price of Natural Gas
Liquids (NGL) which are the raw materials for ethylene which is a core product of the chemical
industry. In this respect, the US chemical industry grew significantly as a response to the lowering
costs of their business models.
In contrast with the many benefits that shale gas brought to the US, there are numerous risks and
negative impacts which have to be addressed sooner rather than later. These risks are explored in
the following sections.
18
Theodor Cojoianu, The University of Edinburgh
MEng Thesis
2.3.2 Water Usage and Withdrawal and Wastewater Management Risks Shale oil and gas development became recently economically feasible through the use of hydraulic
fracturing and other technology improvements[11, 30]. The majority of opposition to shale gas
development is mainly related to water related risks [31-38].
Water is employed in several stages of unconventional oil and gas development, however it is the
drilling stage and the hydraulic fracturing stage that are the most water intensive processes[36, 39],
with between 1 and 9 million gallons per well[40]. This poses a great stress on the regions which are
water scarce and where several water intensive industries might compete for water resources[41].
Furthermore, wastewater management is a general issue, given the fact that between 10% and
300% of the injected water, hydraulic fracturing volume and dissolved solids return to the surface
over the lifetime of the well[36]. This poses significant challenges for regions where wastewater
infrastructure could not adapt to the new volumes required to be treated from unconventional gas
development, but even more, to the high concentration of chemicals, TDS (total dissolved solids) and
NORMs (Naturally Occurring Radioactive Materials) contained in unconventional wastewater[35].
Mismanagement of wastewater can result in significant impact for the environment, particularly
marine environments. Groundwater contamination from fracturing fluid migration has been given a
very low probability of occurring [34, 40] although much of the debate has been centred on
fracturing fluid migration. However, water contamination is most likely to occur from spills of
unconventional wastewater into marine environments or from inadequate waste water treatment
[35, 42]. Another water contaminant is methane. This results from improper well casing and
methane migration, which has been confirmed many times in the inspection reports of shale wells,
as reported by the Pennsylvania Department of Environmental Protection (PA DEP)[43].
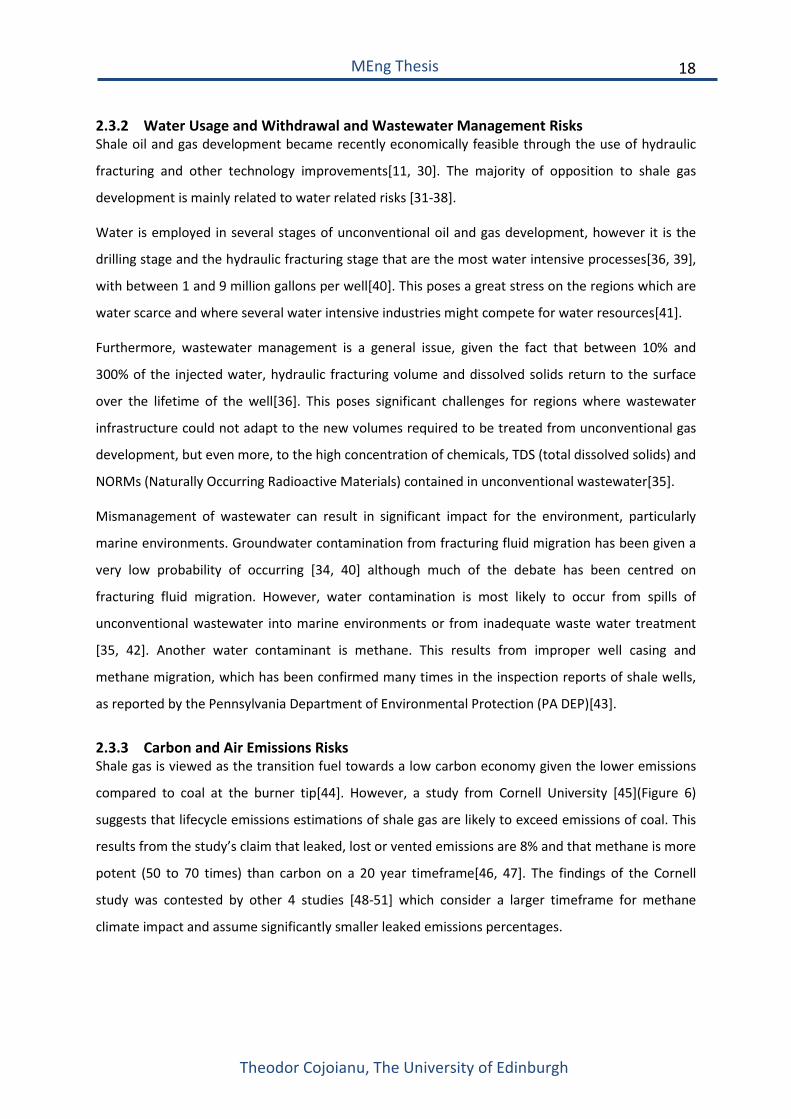
2.3.3 Carbon and Air Emissions Risks Shale gas is viewed as the transition fuel towards a low carbon economy given the lower emissions
compared to coal at the burner tip[44]. However, a study from Cornell University [45](Figure 6)
suggests that lifecycle emissions estimations of shale gas are likely to exceed emissions of coal. This
results from the study’s claim that leaked, lost or vented emissions are 8% and that methane is more
potent (50 to 70 times) than carbon on a 20 year timeframe[46, 47]. The findings of the Cornell
study was contested by other 4 studies [48-51] which consider a larger timeframe for methane
climate impact and assume significantly smaller leaked emissions percentages.
19
Theodor Cojoianu, The University of Edinburgh
MEng Thesis
Figure 6: Source: Howarth, Robert, Renee Santoro, and Anthony Ingraffea. ‘Methane and the
Greenhouse-gas Footprint of Natural Gas from Shale Formations’. Climatic Change 106, no. 4 (2011): 679–690.
A recent study by PWC[52] shows that at the present carbon emission rates, this century’s global
carbon budget left to avoid the dangerous effects of climate change will be spent by 2034[53]. In this
context, Santoro et al. is right to consider the shortest (20 year) period of methane effects given the
urgency needed to tackle world climate change.
In the face of more stringent carbon and emissions regulation across the world, oil and gas
companies are likely to not be able to develop all the fossil fuel reserves they currently hold on their
books, if the global carbon budget to avoid the worst impact of climate change is to be implemented
at a global scale[54].
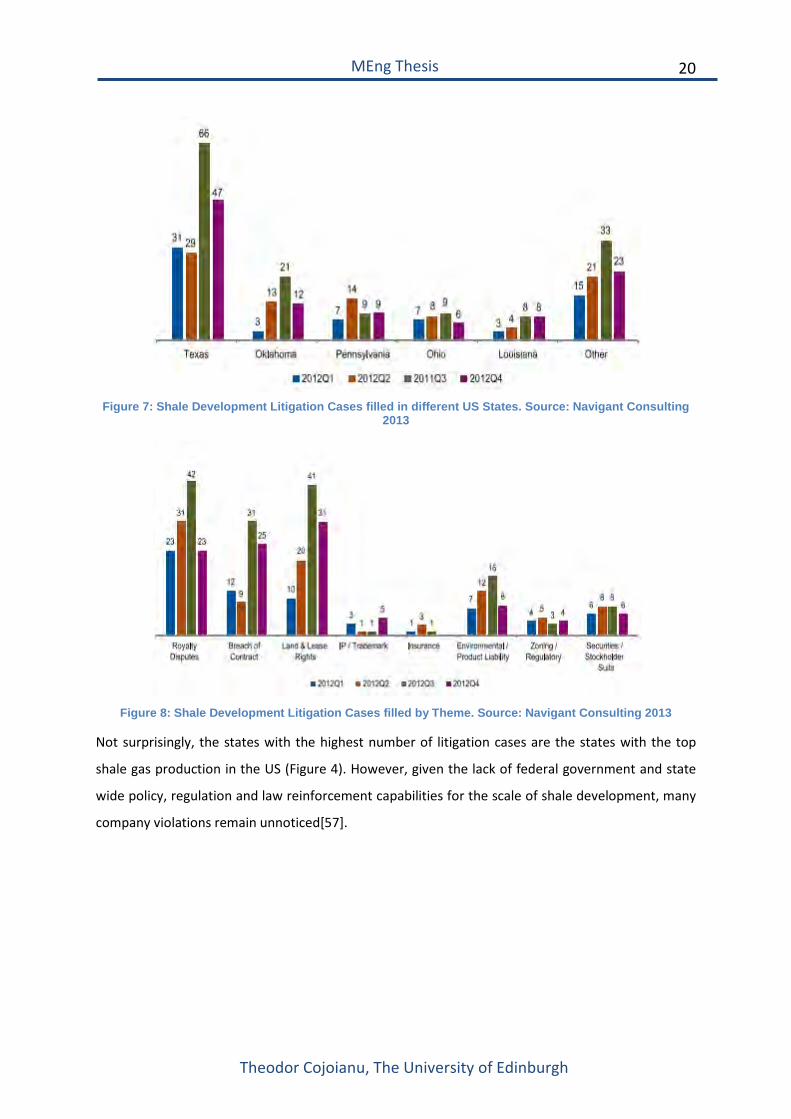
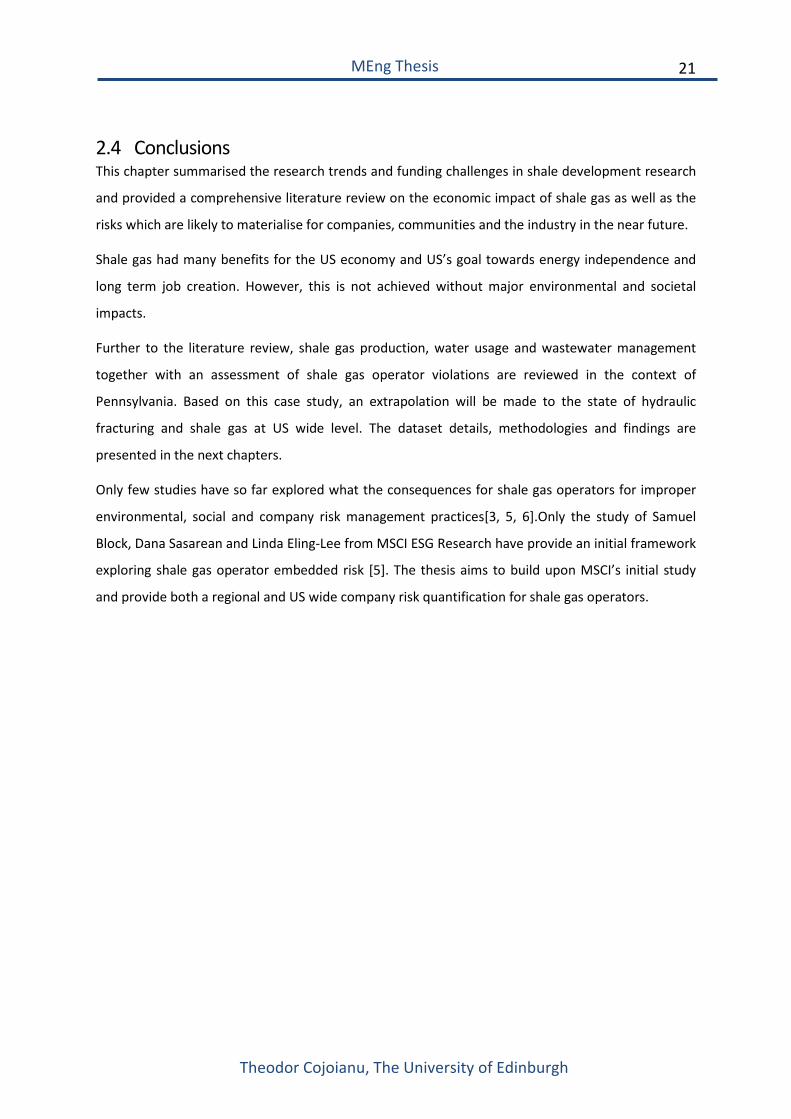
2.3.4 Company Litigation and Reputational Risks The number of lawsuits related to shale gas development is increasing year on year[55] and are
mainly related to royalty disputes, breach of contract, land and lease rights and environmental
management[56](Figure 8).
20
Theodor Cojoianu, The University of Edinburgh
MEng Thesis
Figure 7: Shale Development Litigation Cases filled in different US States. Source: Navigant Consulting
2013
Figure 8: Shale Development Litigation Cases filled by Theme. Source: Navigant Consulting 2013
Not surprisingly, the states with the highest number of litigation cases are the states with the top
shale gas production in the US (Figure 4). However, given the lack of federal government and state
wide policy, regulation and law reinforcement capabilities for the scale of shale development, many
company violations remain unnoticed[57].
21
Theodor Cojoianu, The University of Edinburgh
MEng Thesis
2.4 Conclusions This chapter summarised the research trends and funding challenges in shale development research
and provided a comprehensive literature review on the economic impact of shale gas as well as the
risks which are likely to materialise for companies, communities and the industry in the near future.
Shale gas had many benefits for the US economy and US’s goal towards energy independence and
long term job creation. However, this is not achieved without major environmental and societal
impacts.
Further to the literature review, shale gas production, water usage and wastewater management
together with an assessment of shale gas operator violations are reviewed in the context of
Pennsylvania. Based on this case study, an extrapolation will be made to the state of hydraulic
fracturing and shale gas at US wide level. The dataset details, methodologies and findings are
presented in the next chapters.
Only few studies have so far explored what the consequences for shale gas operators for improper
environmental, social and company risk management practices[3, 5, 6].Only the study of Samuel
Block, Dana Sasarean and Linda Eling-Lee from MSCI ESG Research have provide an initial framework
exploring shale gas operator embedded risk [5]. The thesis aims to build upon MSCI’s initial study
and provide both a regional and US wide company risk quantification for shale gas operators.
22
Theodor Cojoianu, The University of Edinburgh
MEng Thesis
3 Pennsylvania Unconventional Gas Development Case Study
3.1 Introduction and Chapter Outlook The present chapter focuses on providing a comprehensive case study of shale gas development in
Pennsylvania from a production, wastewater management and company violations perspective. The
most robust datasets have been used for this exercise and further enhanced through the use of
Quantum GIS.
First the Pennsylvania state wide shale gas development statistics are presented. Afterwards, a
benchmarking exercise will be carried out between the operating companies in Pennsylvania. This
will be done from both a gas production opportunity perspective as well as an environmental risk
perspective for the period 2004 – June 2013. In this way, the added value of this chapter consists in
updating the academic paper of Lutz et. al[35],who analysed shale gas wastewater management in
Pennsylvania till 2011, by considering extra data from 2012 and the first half of 2013. Secondly
production data and violations datasets are further leveraged which will indicate the extent of the
rewards as well as the litigation and regulation risks arising from shale gas development.
From this analysis several lessons will emerge from Pennsylvania shale gas development, which will
be put into context when looking at the US wide case study and when providing an outlook of shale
gas in other countries.
3.2 Pennsylvania Shale Development Datasets The datasets that have been leveraged for building a case study on Pennsylvania unconventional oil
and gas production, wastewater and violations were downloaded from the Pennsylvania DEP
website[58]which is managed by the Bureau of Oil and Gas Management.
Lutz et al. and Clark[34] acknowledge that these are the most robust datasets that are available to
the public and academic community for analysis. These are currently used in EPA’s enquiry into
hydraulic fracturing impacts[40] which aims to inform state and federal policy and regulation. The
data comprised in the datasets is self reported according to the Pennsylvania DEP law and guidance
and hence, the datasets are still considered to be incomplete to a certain degree, but the best
available across the US[35]. The Oil and Gas Act in Pennsylvania does require all companies to report
timely and accurately on their gas production and wastewater practices, however the DEP disclaims
any liability for errors or omissions in the datasets.
23
Theodor Cojoianu, The University of Edinburgh
MEng Thesis
3.3 Pennsylvania Conventional and Unconventional Production
3.3.1 Production Dataset Introduction According to Pennsylvania’s Oil and Gas Act, unconventional well operators are required to produce
and submit production reports biannually. The 15th of August is the date when reports are submitted
for the first half of the current year (1st of January – 30th of June) and the 15th of February is the date
of submission of the statistics of the second half of the previous year (1st of July – 31st of December).
All the other operators have to submit production reports once per year on the 15th of February.
Hence the available production data for Pennsylvania ranges from 1st of January 2000 to 30th of June
2013, with the year 2013 containing data only on unconventional oil and gas wells.
First, the production data across all the available years is aggregated (2000 up to the first half of
2013).During the data aggregation process, several corrections have been carried out. The data
management system for unconventional oil and gas wells reporting has changed for Pennsylvania in
2010. This has resulted in having the unconventional wells data for the first half of 2010 containing
some duplicate values from the second half of 2009. This has been confirmed by a private
communication between R. Deitz (Pennsylvania DEP) and Brian Lutz (December 19, 2011)[35].Lutz
confirms that according to the same private communication, no duplicates are found in the
wastewater dataset which will be explored later.
The following correction is applied to the dataset containing unconventional wells with aggregated
data for both the second half of 2009 and first half of 2010: if the production days reported are less
than 183, the production data is allocated to the 2010 dataset; if the production days number is
higher than 183, the gas production amount is divided by the production days to obtain a daily
figure, is then multiplied by 183. This is then allocated to the 2010 dataset. The remaining
production amount remains unallocated since it is considered that the amount is already accounted
for in the 2009 dataset. This approach is similar to that of Lutz; however it differs in the fact that the
remaining production amount is not aggregated to the 2009 dataset which is considered robust.
3.3.2 Pennsylvania Oil and Gas Production Statistics For this part of the dataset analysis, the Pennsylvania DEP Production data (1st January 2000 – 30th
June 2013) and the Pennsylvania Oil and Gas Well Permits database are explored (1st January 2000 –
6th November 2013).
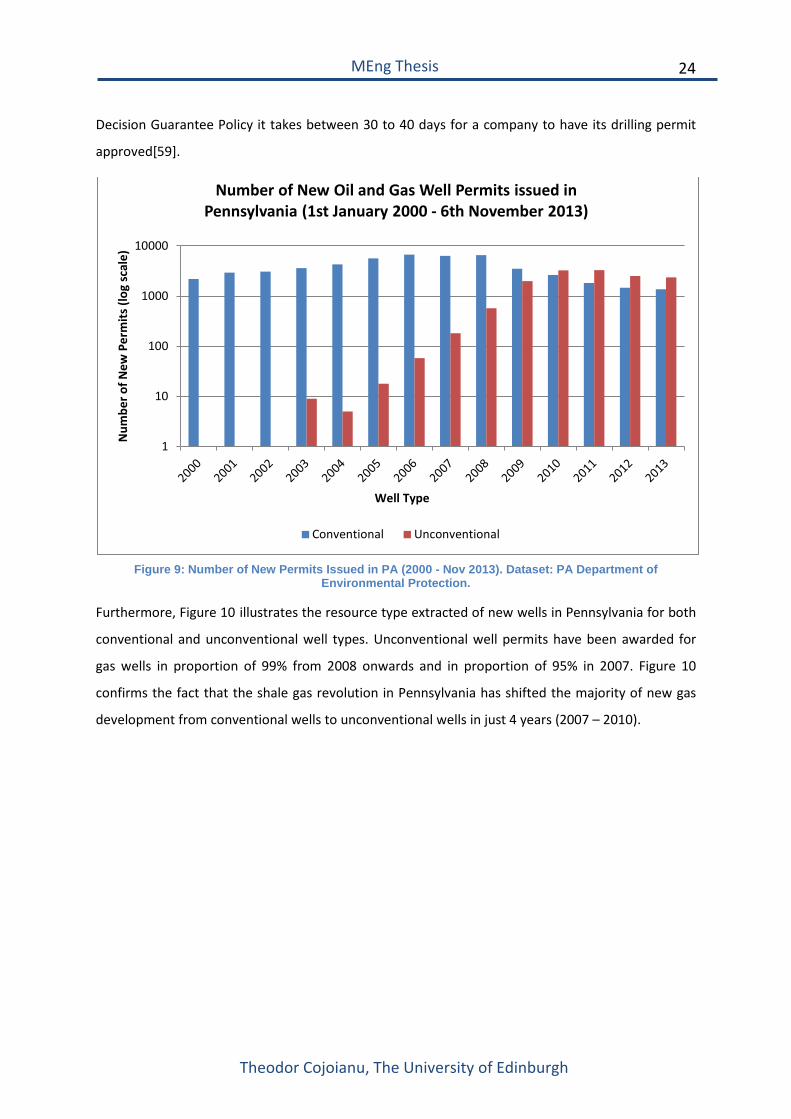
As illustrated in Figure 9, the number of new unconventional well permits in Pennsylvania has risen
exponentially since 2004 to surpass the number of new conventional well permits in 2010. In 2013
alone (1 January – 6 November), there were 2368 unconventional well permits issued as opposed to
1371 conventional well permits. According to the DEP Permit for Review Process and Permit
24
Theodor Cojoianu, The University of Edinburgh
MEng Thesis
Decision Guarantee Policy it takes between 30 to 40 days for a company to have its drilling permit
approved[59].
Figure 9: Number of New Permits Issued in PA (2000 - Nov 2013). Dataset: PA Department of
Environmental Protection.
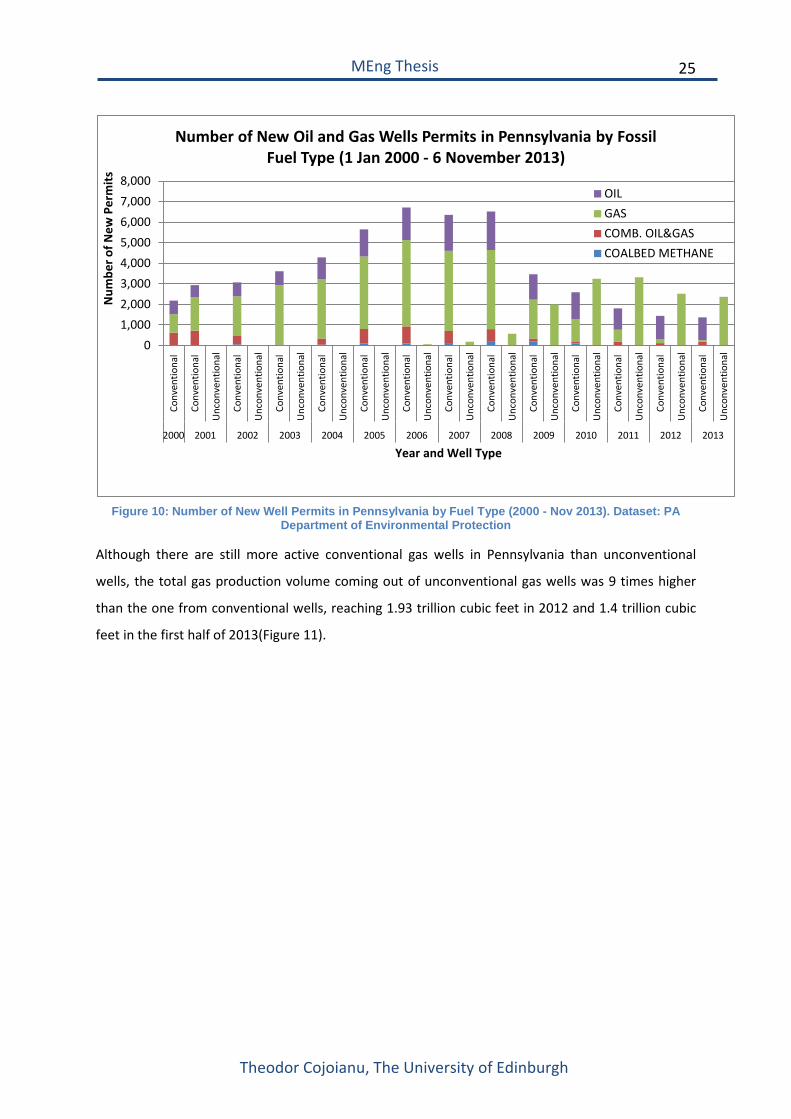
Furthermore, Figure 10 illustrates the resource type extracted of new wells in Pennsylvania for both
conventional and unconventional well types. Unconventional well permits have been awarded for
gas wells in proportion of 99% from 2008 onwards and in proportion of 95% in 2007. Figure 10 confirms the fact that the shale gas revolution in Pennsylvania has shifted the majority of new gas
development from conventional wells to unconventional wells in just 4 years (2007 – 2010).
1
10
100
1000
10000
Num
ber o
f New
Per
mits
(log
sca
le)
Well Type
Number of New Oil and Gas Well Permits issued in Pennsylvania (1st January 2000 - 6th November 2013)
Conventional Unconventional
25
Theodor Cojoianu, The University of Edinburgh
MEng Thesis
Figure 10: Number of New Well Permits in Pennsylvania by Fuel Type (2000 - Nov 2013). Dataset: PA
Department of Environmental Protection
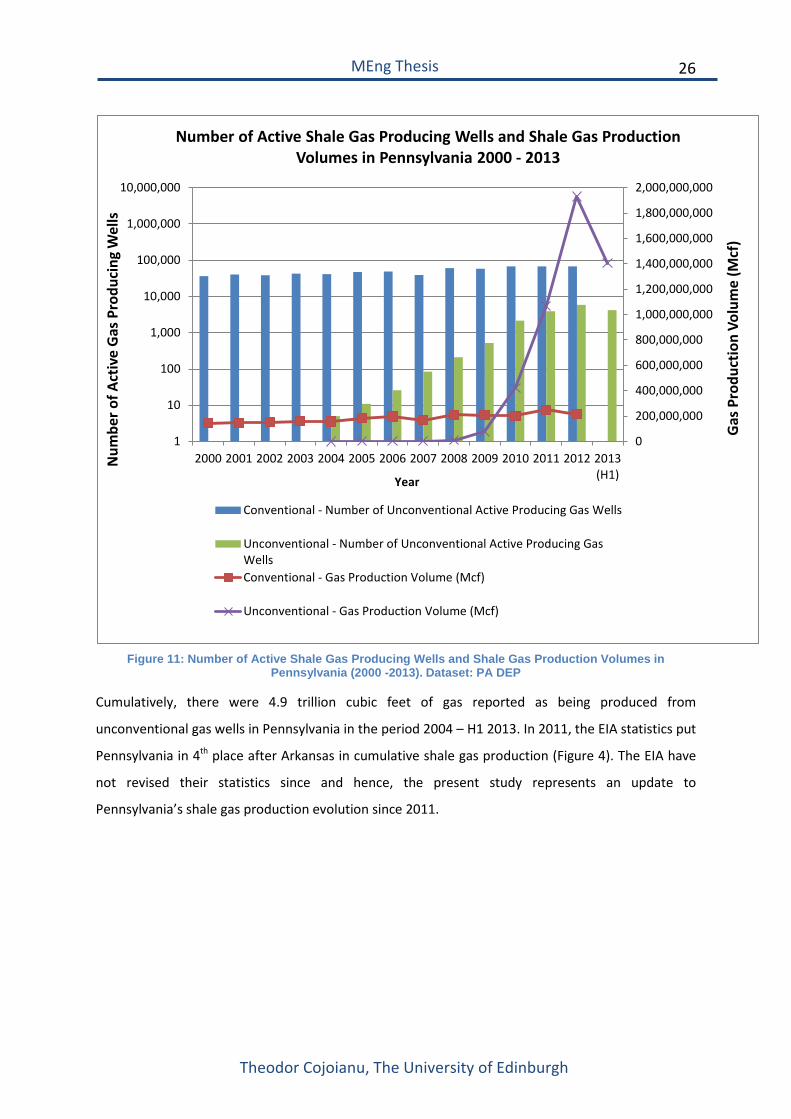
Although there are still more active conventional gas wells in Pennsylvania than unconventional
wells, the total gas production volume coming out of unconventional gas wells was 9 times higher
than the one from conventional wells, reaching 1.93 trillion cubic feet in 2012 and 1.4 trillion cubic
feet in the first half of 2013(Figure 11).
01,0002,0003,0004,0005,0006,0007,0008,000
Conv
entio
nal
Conv
entio
nal
Unc
onve
ntio
nal
Conv
entio
nal
Unc
onve
ntio
nal
Conv
entio
nal
Unc
onve
ntio
nal
Conv
entio
nal
Unc
onve
ntio
nal
Conv
entio
nal
Unc
onve
ntio
nal
Conv
entio
nal
Unc
onve
ntio
nal
Conv
entio
nal
Unc
onve
ntio
nal
Conv
entio
nal
Unc
onve
ntio
nal
Conv
entio
nal
Unc
onve
ntio
nal
Conv
entio
nal
Unc
onve
ntio
nal
Conv
entio
nal
Unc
onve
ntio
nal
Conv
entio
nal
Unc
onve
ntio
nal
Conv
entio
nal
Unc
onve
ntio
nal
2000 2001 2002 2003 2004 2005 2006 2007 2008 2009 2010 2011 2012 2013
Num
ber o
f New
Per
mits
Year and Well Type
Number of New Oil and Gas Wells Permits in Pennsylvania by Fossil Fuel Type (1 Jan 2000 - 6 November 2013)
OILGASCOMB. OIL&GASCOALBED METHANE
26
Theodor Cojoianu, The University of Edinburgh
MEng Thesis
Figure 11: Number of Active Shale Gas Producing Wells and Shale Gas Production Volumes in
Pennsylvania (2000 -2013). Dataset: PA DEP
Cumulatively, there were 4.9 trillion cubic feet of gas reported as being produced from
unconventional gas wells in Pennsylvania in the period 2004 – H1 2013. In 2011, the EIA statistics put
Pennsylvania in 4th place after Arkansas in cumulative shale gas production (Figure 4). The EIA have
not revised their statistics since and hence, the present study represents an update to
Pennsylvania’s shale gas production evolution since 2011.
0
200,000,000
400,000,000
600,000,000
800,000,000
1,000,000,000
1,200,000,000
1,400,000,000
1,600,000,000
1,800,000,000
2,000,000,000
1
10
100
1,000
10,000
100,000
1,000,000
10,000,000
2000 2001 2002 2003 2004 2005 2006 2007 2008 2009 2010 2011 2012 2013(H1)
Gas
Pro
duct
ion
Volu
me
(Mcf
)
Num
ber o
f Act
ive
Gas
Pro
duci
ng W
ells
Year
Number of Active Shale Gas Producing Wells and Shale Gas Production Volumes in Pennsylvania 2000 - 2013
Conventional - Number of Unconventional Active Producing Gas Wells
Unconventional - Number of Unconventional Active Producing GasWellsConventional - Gas Production Volume (Mcf)
Unconventional - Gas Production Volume (Mcf)
27
Theodor Cojoianu, The University of Edinburgh
MEng Thesis
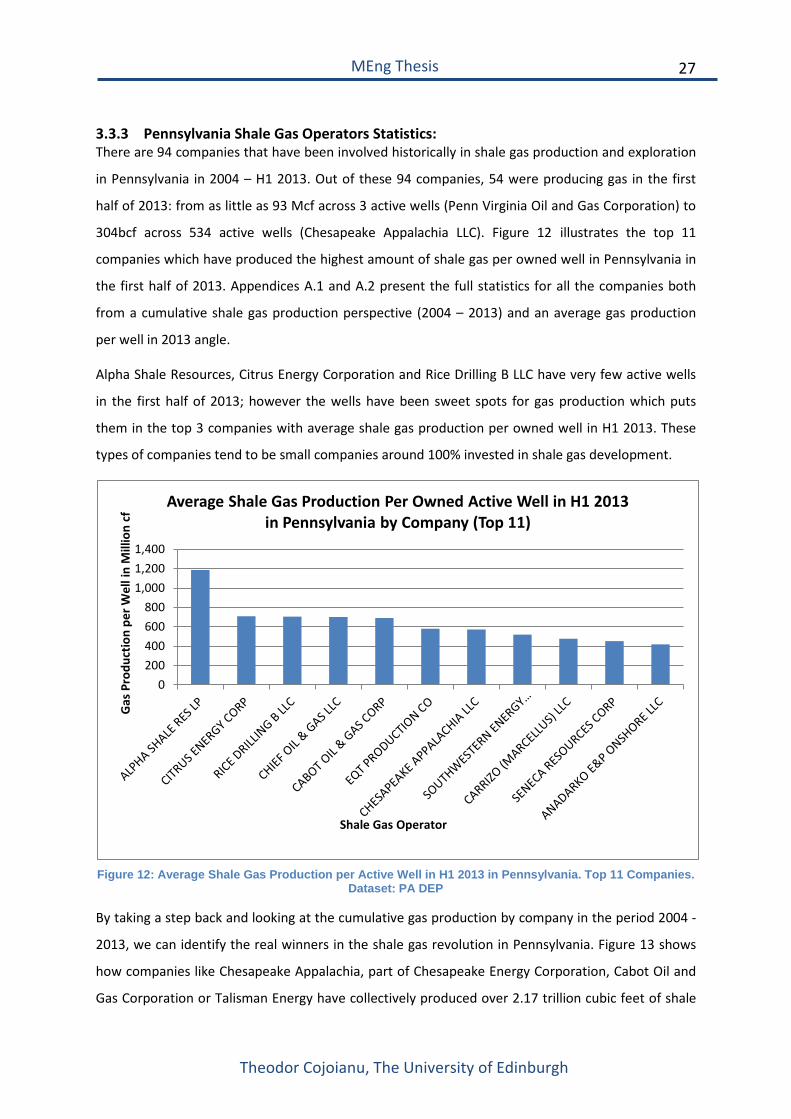
3.3.3 Pennsylvania Shale Gas Operators Statistics: There are 94 companies that have been involved historically in shale gas production and exploration
in Pennsylvania in 2004 – H1 2013. Out of these 94 companies, 54 were producing gas in the first
half of 2013: from as little as 93 Mcf across 3 active wells (Penn Virginia Oil and Gas Corporation) to
304bcf across 534 active wells (Chesapeake Appalachia LLC). Figure 12 illustrates the top 11
companies which have produced the highest amount of shale gas per owned well in Pennsylvania in
the first half of 2013. Appendices A.1 and A.2 present the full statistics for all the companies both
from a cumulative shale gas production perspective (2004 – 2013) and an average gas production
per well in 2013 angle.
Alpha Shale Resources, Citrus Energy Corporation and Rice Drilling B LLC have very few active wells
in the first half of 2013; however the wells have been sweet spots for gas production which puts
them in the top 3 companies with average shale gas production per owned well in H1 2013. These
types of companies tend to be small companies around 100% invested in shale gas development.
Figure 12: Average Shale Gas Production per Active Well in H1 2013 in Pennsylvania. Top 11 Companies.
Dataset: PA DEP
By taking a step back and looking at the cumulative gas production by company in the period 2004 -
2013, we can identify the real winners in the shale gas revolution in Pennsylvania. Figure 13 shows
how companies like Chesapeake Appalachia, part of Chesapeake Energy Corporation, Cabot Oil and
Gas Corporation or Talisman Energy have collectively produced over 2.17 trillion cubic feet of shale
0200400600800
1,0001,2001,400
Gas
Pro
duct
ion
per W
ell i
n M
illio
n cf
Shale Gas Operator
Average Shale Gas Production Per Owned Active Well in H1 2013 in Pennsylvania by Company (Top 11)
28
Theodor Cojoianu, The University of Edinburgh
MEng Thesis
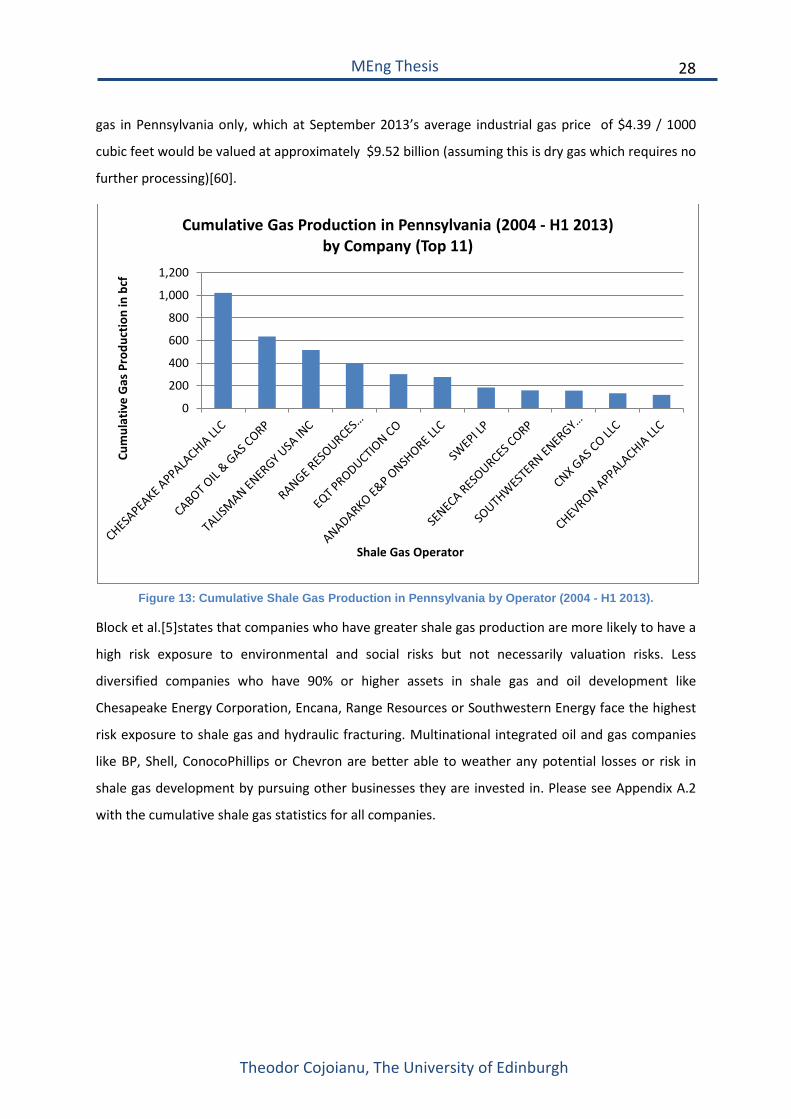
gas in Pennsylvania only, which at September 2013’s average industrial gas price of $4.39 / 1000
cubic feet would be valued at approximately $9.52 billion (assuming this is dry gas which requires no
further processing)[60].
Figure 13: Cumulative Shale Gas Production in Pennsylvania by Operator (2004 - H1 2013).
Block et al.[5]states that companies who have greater shale gas production are more likely to have a
high risk exposure to environmental and social risks but not necessarily valuation risks. Less
diversified companies who have 90% or higher assets in shale gas and oil development like
Chesapeake Energy Corporation, Encana, Range Resources or Southwestern Energy face the highest
risk exposure to shale gas and hydraulic fracturing. Multinational integrated oil and gas companies
like BP, Shell, ConocoPhillips or Chevron are better able to weather any potential losses or risk in
shale gas development by pursuing other businesses they are invested in. Please see Appendix A.2
with the cumulative shale gas statistics for all companies.
0
200
400
600
800
1,000
1,200
Cum
ulat
ive
Gas
Pro
duct
ion
in b
cf
Shale Gas Operator
Cumulative Gas Production in Pennsylvania (2004 - H1 2013) by Company (Top 11)
29
Theodor Cojoianu, The University of Edinburgh
MEng Thesis
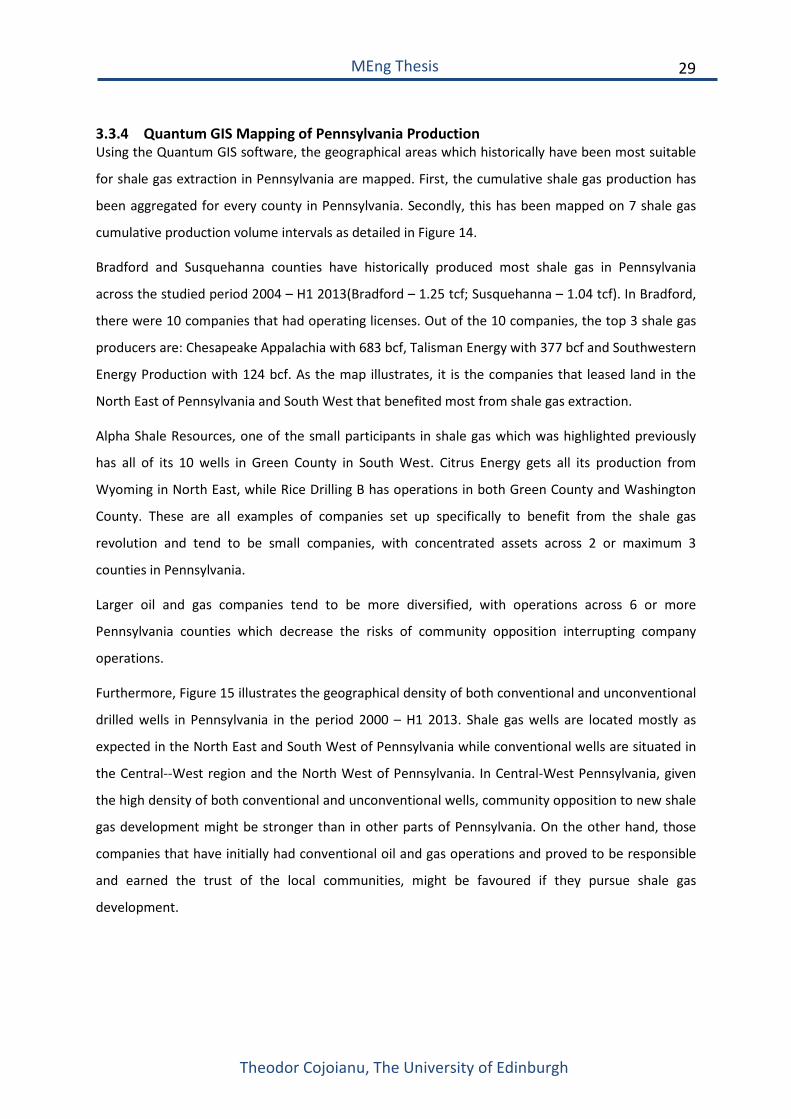
3.3.4 Quantum GIS Mapping of Pennsylvania Production Using the Quantum GIS software, the geographical areas which historically have been most suitable
for shale gas extraction in Pennsylvania are mapped. First, the cumulative shale gas production has
been aggregated for every county in Pennsylvania. Secondly, this has been mapped on 7 shale gas
cumulative production volume intervals as detailed in Figure 14.
Bradford and Susquehanna counties have historically produced most shale gas in Pennsylvania
across the studied period 2004 – H1 2013(Bradford – 1.25 tcf; Susquehanna – 1.04 tcf). In Bradford,
there were 10 companies that had operating licenses. Out of the 10 companies, the top 3 shale gas
producers are: Chesapeake Appalachia with 683 bcf, Talisman Energy with 377 bcf and Southwestern
Energy Production with 124 bcf. As the map illustrates, it is the companies that leased land in the
North East of Pennsylvania and South West that benefited most from shale gas extraction.
Alpha Shale Resources, one of the small participants in shale gas which was highlighted previously
has all of its 10 wells in Green County in South West. Citrus Energy gets all its production from
Wyoming in North East, while Rice Drilling B has operations in both Green County and Washington
County. These are all examples of companies set up specifically to benefit from the shale gas
revolution and tend to be small companies, with concentrated assets across 2 or maximum 3
counties in Pennsylvania.
Larger oil and gas companies tend to be more diversified, with operations across 6 or more
Pennsylvania counties which decrease the risks of community opposition interrupting company
operations.
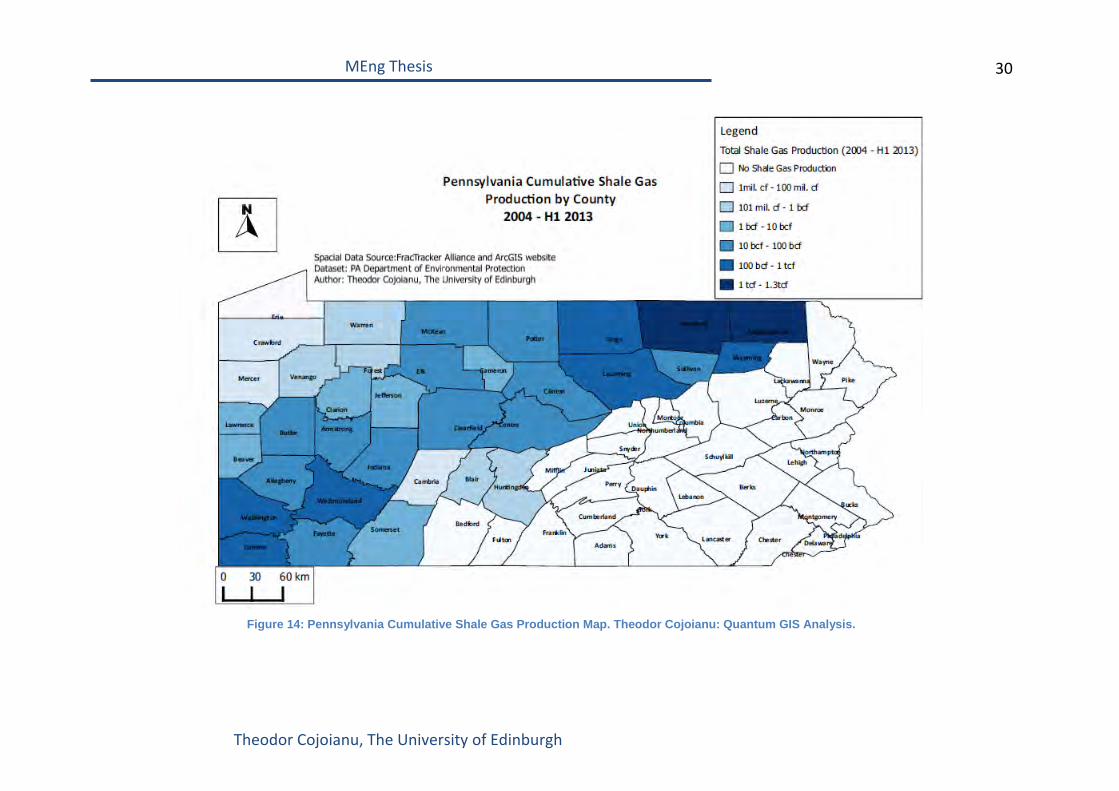
Furthermore, Figure 15 illustrates the geographical density of both conventional and unconventional
drilled wells in Pennsylvania in the period 2000 – H1 2013. Shale gas wells are located mostly as
expected in the North East and South West of Pennsylvania while conventional wells are situated in
the Central--West region and the North West of Pennsylvania. In Central-West Pennsylvania, given
the high density of both conventional and unconventional wells, community opposition to new shale
gas development might be stronger than in other parts of Pennsylvania. On the other hand, those
companies that have initially had conventional oil and gas operations and proved to be responsible
and earned the trust of the local communities, might be favoured if they pursue shale gas
development.
30
Theodor Cojoianu, The University of Edinburgh
MEng Thesis
Figure 14: Pennsylvania Cumulative Shale Gas Production Map. Theodor Cojoianu: Quantum GIS Analysis.
31
Theodor Cojoianu, The University of Edinburgh
MEng Thesis
Figure 15: Pennsylvania Conventional and Unconventional Drilled Wells (2000 - H1 2013). Theodor Cojoianu, Quantum GIS Analysis.
32
Theodor Cojoianu, The University of Edinburgh
MEng Thesis
3.4 Wastewater Management Analysis in Pennsylvania (2000 – 2013)
3.4.1 Pennsylvania Waste Dataset Introduction The Pennsylvania wastewater management datasets have been aggregated in a similar manner to
the production datasets from the PA DEP website. The wastewater management datasets do not
require corrections for the new data management system which the DEP put in place in 2009/2010
since according to R. Deitz (private communication with Lutz)[35]there are no duplicates.
However, there were several identical wastewater volumes during a particular year and marked as
going to different waste treatment facilities. In this respect, the yearly wastewater coming from a
well was reported as a total for the year rather than the wastewater which every treatment facility
would receive from a given well. Hence, the assumption used for these entries was that each
industrial facility would receive an equal amount of wastewater from a given well. Lutz[35] confirms
that by applying this kind of correction, an overestimation of wastewater volumes of up to 45% is
avoided. Finally, given the fact that the PA DEP had an unrecoverable data loss, no waste records are
available for the year 2007.
3.4.2 Pennsylvania Wastewater Volumes (2004 – H1 2013) Wastewater in oil and gas development is produced throughout the lifetime of a well, during most
important development stages: drilling, hydraulic fracturing and production[35].The composition of
the waste will vary according to the different stages of the production process. The DEP reports 6
types of waste fluids and solids: brine, drilling fluid, fracking fluid, basic sediment, spent lubricant
and servicing fluid.
The drilling fluid, also called drilling mud, is used during the drilling process to control the pressure
in the well and lubricate the drilling end [30]. According to Pennsylvania regulation, the distance
from the surface to 50 feet under the fresh groundwater source has to be drilled with air, freshwater
or drilling fluid based on freshwater. Below this depth, any type of drilling fluid can be used. Drilling
fluid quantity used in conventional wells grew from 129,000 barrels in 2004 to approximately
329,000 barrels in 2010 to fall approx. 100,000 barrels in 2012. For unconventional wells, from 2,080
barrels in 2004 drilling fluid usage increased to 1.83 million barrels in 2012. This trend can be
explained through the number of new well permits (conventional and unconventional) as presented
in previously, which shifted towards unconventional gas development in the 2007 – 2012 period.
The composition of the typical hydraulic fracturing fluid can be observed in Appendix A.3. The
fracturing fluid which is recovered from the hydraulic fracturing process is called flowback
fluid[61]or as it is reported at in the PA DEP database: fracking fluid. Fracking fluid is generally
33
Theodor Cojoianu, The University of Edinburgh
MEng Thesis
recovered in a 2 to 8 week interval after the hydraulic fracturing process has occurred[30], however
it is up to the well operator to distinguish the separation between the fracking fluid and a fluid that
is recovered over the lifetime of the well called brine[62].
Brine usually originates from the oil or gas formation for conventional wells and is produced during
the lifetime of a well [62]. During unconventional oil and gas development, brine is a mix of naturally
occurring liquid and fracking fluid and has high salinity levels. Basic sediments, spent lubricants and
servicing fluids are excluded from our analysis since they represent a small percentage out of the
total wastewater amount (less than 0.04%).
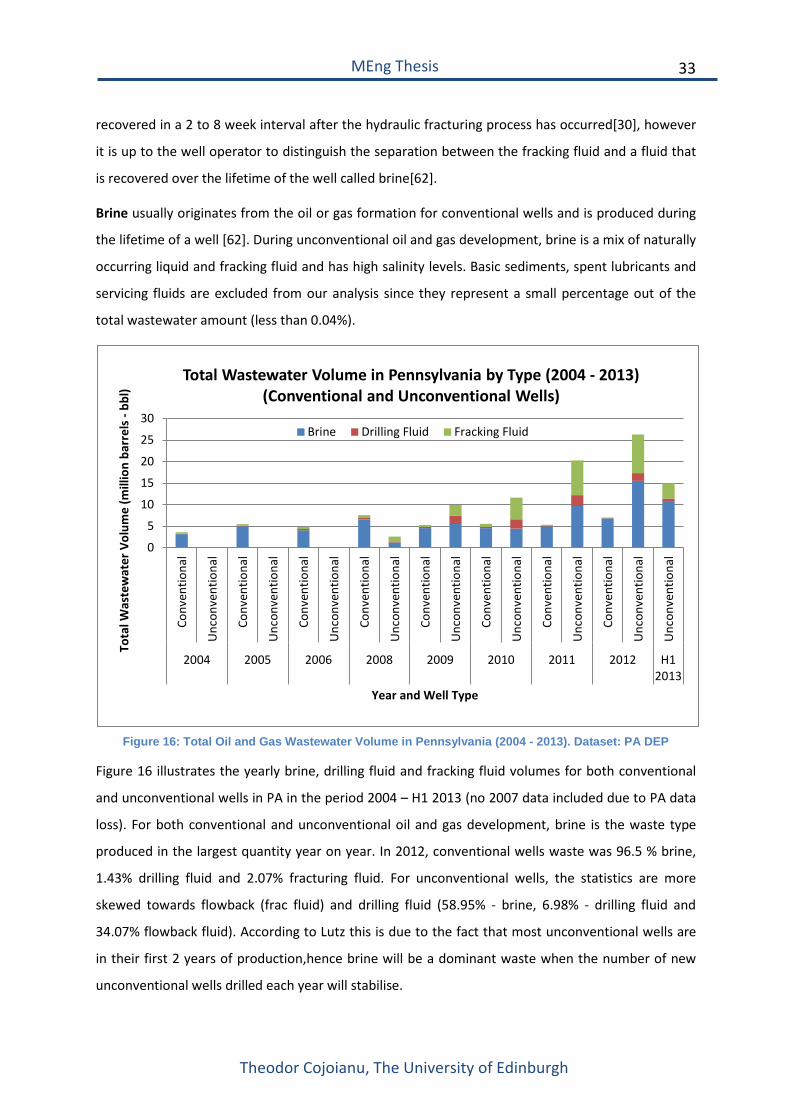
Figure 16: Total Oil and Gas Wastewater Volume in Pennsylvania (2004 - 2013). Dataset: PA DEP
Figure 16 illustrates the yearly brine, drilling fluid and fracking fluid volumes for both conventional
and unconventional wells in PA in the period 2004 – H1 2013 (no 2007 data included due to PA data
loss). For both conventional and unconventional oil and gas development, brine is the waste type
produced in the largest quantity year on year. In 2012, conventional wells waste was 96.5 % brine,
1.43% drilling fluid and 2.07% fracturing fluid. For unconventional wells, the statistics are more
skewed towards flowback (frac fluid) and drilling fluid (58.95% - brine, 6.98% - drilling fluid and
34.07% flowback fluid). According to Lutz this is due to the fact that most unconventional wells are
in their first 2 years of production,hence brine will be a dominant waste when the number of new
unconventional wells drilled each year will stabilise.
0
5
10
15
20
25
30
Conv
entio
nal
Unc
onve
ntio
nal
Conv
entio
nal
Unc
onve
ntio
nal
Conv
entio
nal
Unc
onve
ntio
nal
Conv
entio
nal
Unc
onve
ntio
nal
Conv
entio
nal
Unc
onve
ntio
nal
Conv
entio
nal
Unc
onve
ntio
nal
Conv
entio
nal
Unc
onve
ntio
nal
Conv
entio
nal
Unc
onve
ntio
nal
Unc
onve
ntio
nal
2004 2005 2006 2008 2009 2010 2011 2012 H12013
Tota
l Was
tew
ater
Vol
ume
(mill
ion
barr
els -
bbl
)
Year and Well Type
Total Wastewater Volume in Pennsylvania by Type (2004 - 2013) (Conventional and Unconventional Wells)
Brine Drilling Fluid Fracking Fluid
34
Theodor Cojoianu, The University of Edinburgh
MEng Thesis
There has been a 10 fold increase in total wastewater (aggregate conventional and unconventional
wells) in the period 2004 – 2014, which, as it will be noted in a subsequent section, has posed a
huge stress on both Pennsylvania’s water treatment capacity and the environment.
3.4.3 Company Waste to Gas Ratio Analysis For this part of the analysis, a gas production to waste generated ratio has been calculated for each
company which had active wells in Pennsylvania in the period 2004 – 2013 H1. The cumulative gas
production for each company has been divided by the companies’ cumulative waste production. A
high gas to waste ratio of a company relative to peers indicates that the company has historically
benefited from shale gas production while having very efficient environmental and wastewater
management systems. This metric is built on the assumption that the 2 datasets: Pennsylvania
historical shale gas production and associated wastewater figures are robust.
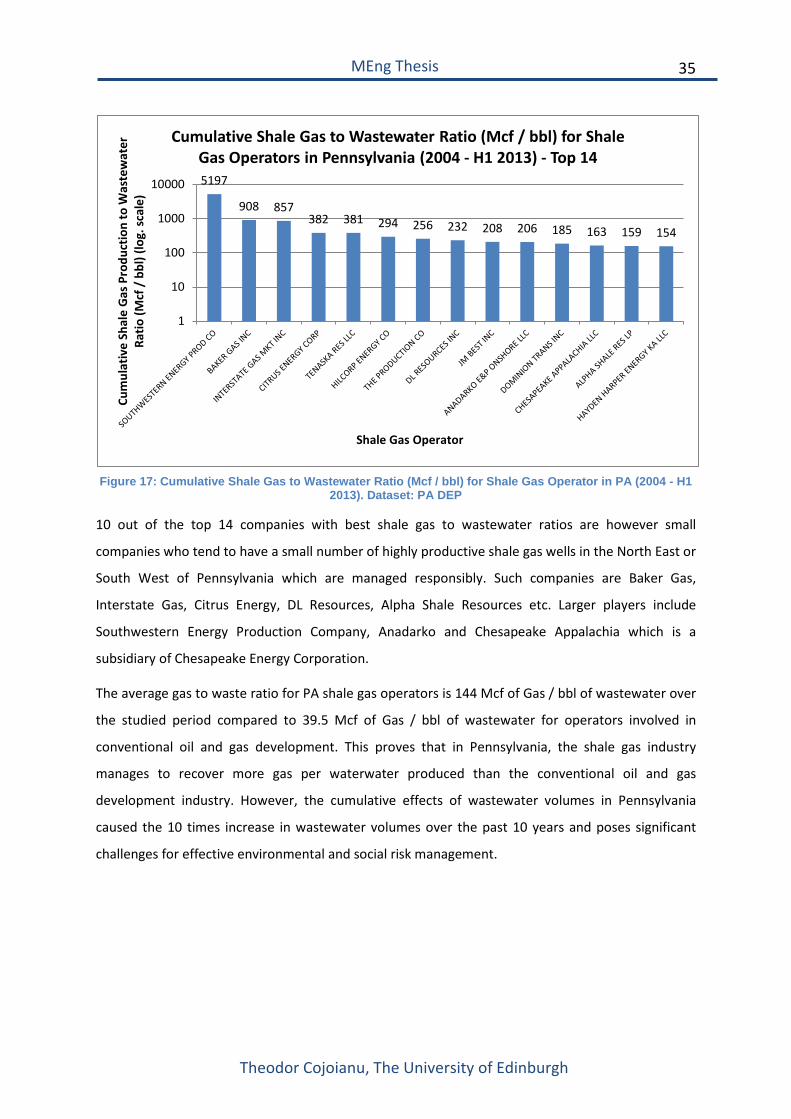
Figure 17 illustrates the companies which benefited mostly from shale gas production while having a
small environmental and wastewater footprint, as well as a distribution of the gas to wastewater
ratio across all operators. Please see Appendix A.5, for the associated statistics for all operators.
The company with by far the best shale gas production to wastewater in Pennsylvania is
Southwestern Energy Production, who is the fifth largest natural gas producer in the US and the 9th
shale gas producer in the state of Pennsylvania. Given its 80 year track record in oil and gas
exploration and production, Southwestern has the advantage of having the right infrastructure in
place, the geological and technical knowhow and the community buy-in to support the 158 bcf of
shale gas produced in Pennsylvania in the 2004 – H1 2013 period while having a relatively small
environmental footprint.
35
Theodor Cojoianu, The University of Edinburgh
MEng Thesis
Figure 17: Cumulative Shale Gas to Wastewater Ratio (Mcf / bbl) for Shale Gas Operator in PA (2004 - H1
2013). Dataset: PA DEP
10 out of the top 14 companies with best shale gas to wastewater ratios are however small
companies who tend to have a small number of highly productive shale gas wells in the North East or
South West of Pennsylvania which are managed responsibly. Such companies are Baker Gas,
Interstate Gas, Citrus Energy, DL Resources, Alpha Shale Resources etc. Larger players include
Southwestern Energy Production Company, Anadarko and Chesapeake Appalachia which is a
subsidiary of Chesapeake Energy Corporation.
The average gas to waste ratio for PA shale gas operators is 144 Mcf of Gas / bbl of wastewater over
the studied period compared to 39.5 Mcf of Gas / bbl of wastewater for operators involved in
conventional oil and gas development. This proves that in Pennsylvania, the shale gas industry
manages to recover more gas per waterwater produced than the conventional oil and gas
development industry. However, the cumulative effects of wastewater volumes in Pennsylvania
caused the 10 times increase in wastewater volumes over the past 10 years and poses significant
challenges for effective environmental and social risk management.
5197
908 857 382 381 294 256 232 208 206 185 163 159 154
1
10
100
1000
10000
Cum
ulat
ive
Shal
e G
as P
rodu
ctio
n to
Was
tew
ater
Ra
tio (M
cf /
bbl
) (lo
g. s
cale
)
Shale Gas Operator
Cumulative Shale Gas to Wastewater Ratio (Mcf / bbl) for Shale Gas Operators in Pennsylvania (2004 - H1 2013) - Top 14
36
Theodor Cojoianu, The University of Edinburgh
MEng Thesis
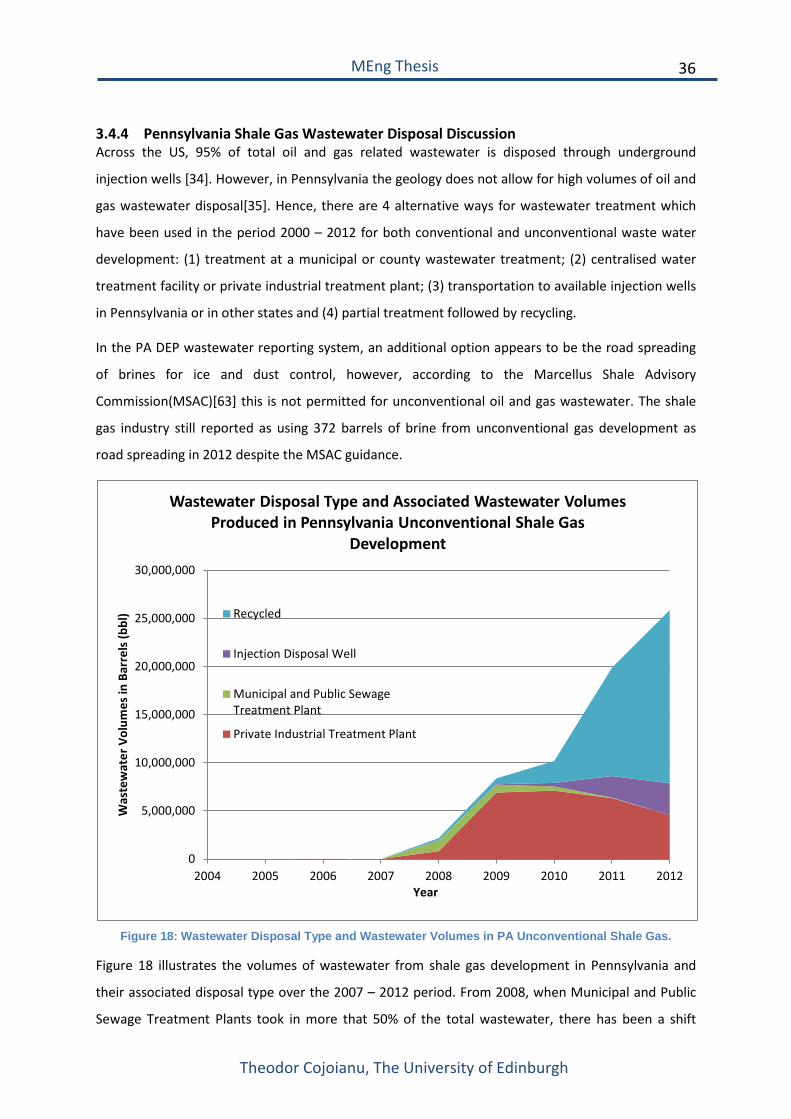
3.4.4 Pennsylvania Shale Gas Wastewater Disposal Discussion Across the US, 95% of total oil and gas related wastewater is disposed through underground
injection wells [34]. However, in Pennsylvania the geology does not allow for high volumes of oil and
gas wastewater disposal[35]. Hence, there are 4 alternative ways for wastewater treatment which
have been used in the period 2000 – 2012 for both conventional and unconventional waste water
development: (1) treatment at a municipal or county wastewater treatment; (2) centralised water
treatment facility or private industrial treatment plant; (3) transportation to available injection wells
in Pennsylvania or in other states and (4) partial treatment followed by recycling.
In the PA DEP wastewater reporting system, an additional option appears to be the road spreading
of brines for ice and dust control, however, according to the Marcellus Shale Advisory
Commission(MSAC)[63] this is not permitted for unconventional oil and gas wastewater. The shale
gas industry still reported as using 372 barrels of brine from unconventional gas development as
road spreading in 2012 despite the MSAC guidance.
Figure 18: Wastewater Disposal Type and Wastewater Volumes in PA Unconventional Shale Gas.
Figure 18 illustrates the volumes of wastewater from shale gas development in Pennsylvania and
their associated disposal type over the 2007 – 2012 period. From 2008, when Municipal and Public
Sewage Treatment Plants took in more that 50% of the total wastewater, there has been a shift
0
5,000,000
10,000,000
15,000,000
20,000,000
25,000,000
30,000,000
2004 2005 2006 2007 2008 2009 2010 2011 2012
Was
tew
ater
Vol
umes
in B
arre
ls (b
bl)
Year
Wastewater Disposal Type and Associated Wastewater Volumes Produced in Pennsylvania Unconventional Shale Gas
Development
Recycled
Injection Disposal Well
Municipal and Public SewageTreatment Plant
Private Industrial Treatment Plant
37
Theodor Cojoianu, The University of Edinburgh
MEng Thesis
towards disposing wastewater to Private Industrial Treatment Plants and recycling. According to the
EPA, wastewater is disposed as non-hazardous waste, although there are situations when these
contain hazardous material and are damaging to humans. This is a consequence of the fact that the
US Congress exempted wastewater coming from oil and gas development from being classified as
hazardous in the Solid Waste Disposal Act Amendments. The reason there was a sudden shift in
disposal from Municipal Treatment facilities to Industrial facilities after 2008, is that the PA DEP
limited Municipal treatment facilities intake of oil and gas wastewater to 1%, after received
numerous reports regarding the increase in Total Dissolved Solids (TDS) concentration in the
Monogahela River in PA, which appeared to be caused by wastewater from shale gas
development[64].
Soon afterwards, it seemed that most Industrial facilities were incapable of treating oil and gas
wastewater with TDS concentration above 500mg/L when new regulation has been put in place to
limit wastewater intake to Industrial facilities as well. Eventually, this led to an effort of the whole
shale gas industry to recycle and reuse a higher proportion of its wastewater. Before being reused in
other hydraulic fracturing operations, fracturing fluid has to be treated for high salt concentration,
chemicals and metals, which prevent the effectiveness of hydraulic fracturing chemicals [65].
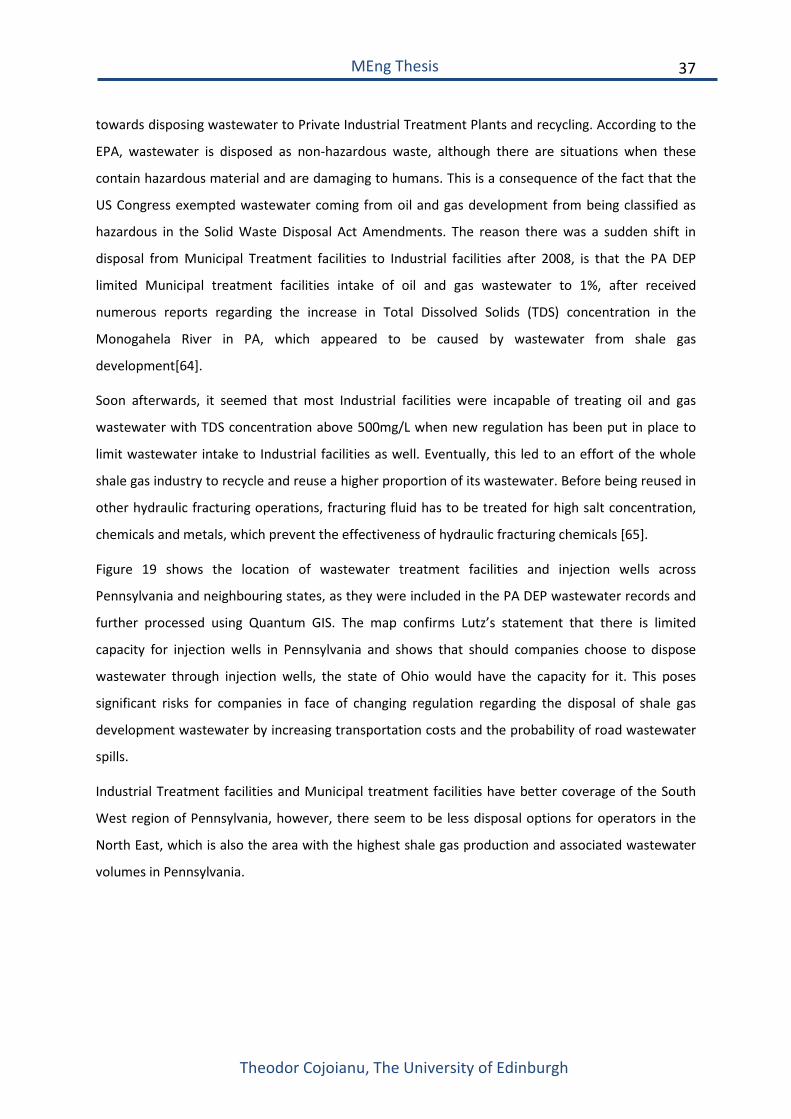
Figure 19 shows the location of wastewater treatment facilities and injection wells across
Pennsylvania and neighbouring states, as they were included in the PA DEP wastewater records and
further processed using Quantum GIS. The map confirms Lutz’s statement that there is limited
capacity for injection wells in Pennsylvania and shows that should companies choose to dispose
wastewater through injection wells, the state of Ohio would have the capacity for it. This poses
significant risks for companies in face of changing regulation regarding the disposal of shale gas
development wastewater by increasing transportation costs and the probability of road wastewater
spills.
Industrial Treatment facilities and Municipal treatment facilities have better coverage of the South
West region of Pennsylvania, however, there seem to be less disposal options for operators in the
North East, which is also the area with the highest shale gas production and associated wastewater
volumes in Pennsylvania.
38
Theodor Cojoianu, The University of Edinburgh
MEng Thesis
Figure 19: Pennsylvania Conventional and Unconventional Drilled Wells and Wastewater and Disposal Facilities. Theodor Cojoianu, Quatum GIS.
39
Theodor Cojoianu, The University of Edinburgh
MEng Thesis
3.5 Pennsylvania Unconventional Oil and Gas Violations
3.5.1 Pennsylvania Violations Introduction This particular dataset has been made available through the FracTracker Alliance and contains data
with respect to the violations of shale gas development operators in Pennsylvania in the interval 1st
January 2004 – 29th July 2013.
3.5.2 Pennsylvania Violations Analysis In the above mentioned period, there have been a total of 202 fines given by the Pennsylvania DEP
to unconventional well operators which totalled USD 4,522,345. Each fine is an aggregate amount
for several violations of an operator. Historically, the total amount of shale gas extracted from
Pennsylvania was 4.91 trillion cubic feet, which at September 2013 industrial gas prices would have
an approximate value of USD 19.27 billion. This means that for every USD 1,000 in revenue for the
shale gas industry in Pennsylvania, USD 0.2 was paid in fines to the DEP, which is an insignificant
price to be paid for environmental, health and safety and compliance related violations. The
database does not include any litigation expenses which arise from company wrongdoings such as
the case of Cabot Oil and Gas who paid USD 4.1 million to settle the litigation for groundwater
contamination in Dimock, PA[55]– it is solely limited to the inspections of the PA DEP to the well
sites and their subsequent decision whether the operator has committed any violations or not.
Although shale gas production began in Pennsylvania as early as 2004, the first fine was given to
Phillips Exploration Inc. (USD 11,028) in September 2006 for improperly casing a well to protect fresh
groundwater contamination in Butler County. The highest fine historically given by the PA DEP was in
2010 to EOG Resources Inc (USD 353,419). According to the incident report, the operator failed to
install safety devices, the blowout prevention equipment has failed, an uncontrolled discharge of
natural gas and flowback fluids occurred and the operator lost control of the well.
By analyzing qualitatively and quantitatively the notes associated with unconventional shale gas
development violations in Pennsylvania, we find that from the total of 5176 violations in the period
2004 – July 2013, the most common violations are:
Inadequate or missing Environmental and Health & Safety Plan (9.3% of cases)
Failure to properly store, transport or dispose of residual waste (7.9%)
Discharge of polluting material to waters of Commonwealth (4.6%)
Failure to adopt pollution prevention measures required or prescribed by the DEP (4.5%)
40
Theodor Cojoianu, The University of Edinburgh
MEng Thesis
Pit and tanks are not constructed with sufficient capacity to contain hazardous substances
(4.1%)
Failure to report defective, insufficient or improperly cemented casing within 24 hours or
failure to submit plan to correct within 30 days (3.1%)
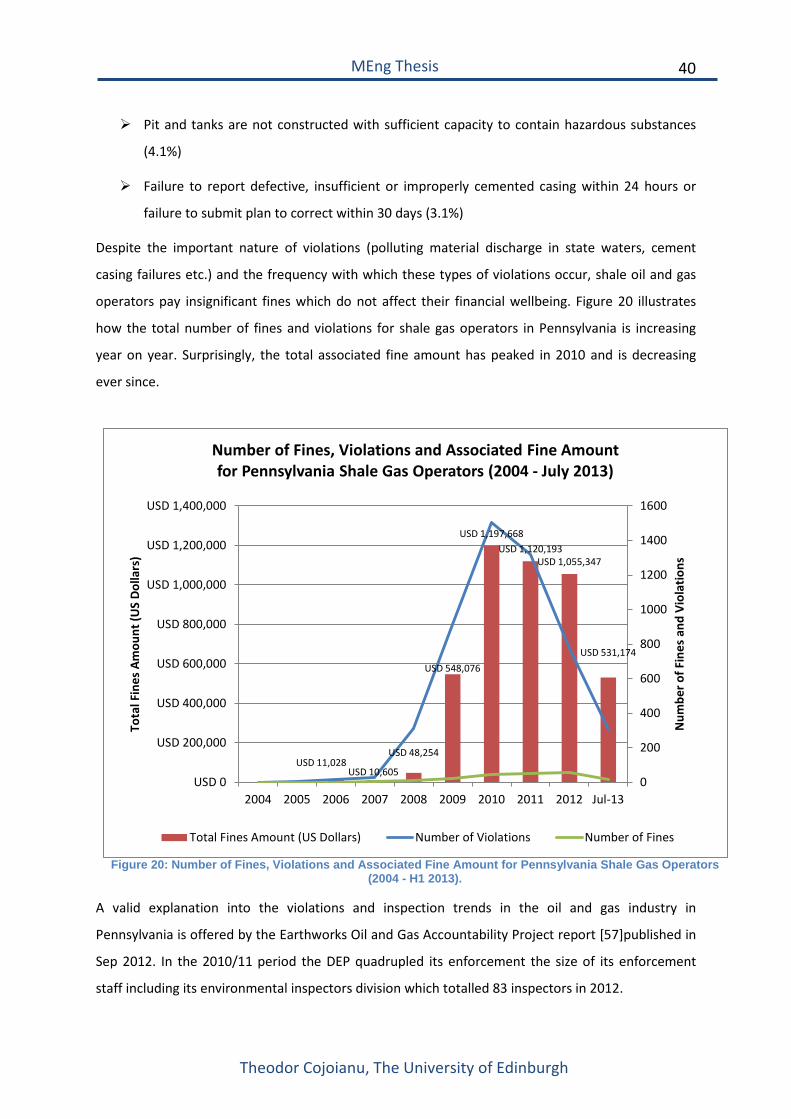
Despite the important nature of violations (polluting material discharge in state waters, cement
casing failures etc.) and the frequency with which these types of violations occur, shale oil and gas
operators pay insignificant fines which do not affect their financial wellbeing. Figure 20 illustrates
how the total number of fines and violations for shale gas operators in Pennsylvania is increasing
year on year. Surprisingly, the total associated fine amount has peaked in 2010 and is decreasing
ever since.
Figure 20: Number of Fines, Violations and Associated Fine Amount for Pennsylvania Shale Gas Operators
(2004 - H1 2013).
A valid explanation into the violations and inspection trends in the oil and gas industry in
Pennsylvania is offered by the Earthworks Oil and Gas Accountability Project report [57]published in
Sep 2012. In the 2010/11 period the DEP quadrupled its enforcement the size of its enforcement
staff including its environmental inspectors division which totalled 83 inspectors in 2012.
USD 11,028 USD 10,605
USD 48,254
USD 548,076
USD 1,197,668 USD 1,120,193
USD 1,055,347
USD 531,174
0
200
400
600
800
1000
1200
1400
1600
USD 0
USD 200,000
USD 400,000
USD 600,000
USD 800,000
USD 1,000,000
USD 1,200,000
USD 1,400,000
2004 2005 2006 2007 2008 2009 2010 2011 2012 Jul-13
Num
ber o
f Fin
es a
nd V
iola
tions
Tota
l Fin
es A
mou
nt (U
S Do
llars
)
Number of Fines, Violations and Associated Fine Amount for Pennsylvania Shale Gas Operators (2004 - July 2013)
Total Fines Amount (US Dollars) Number of Violations Number of Fines
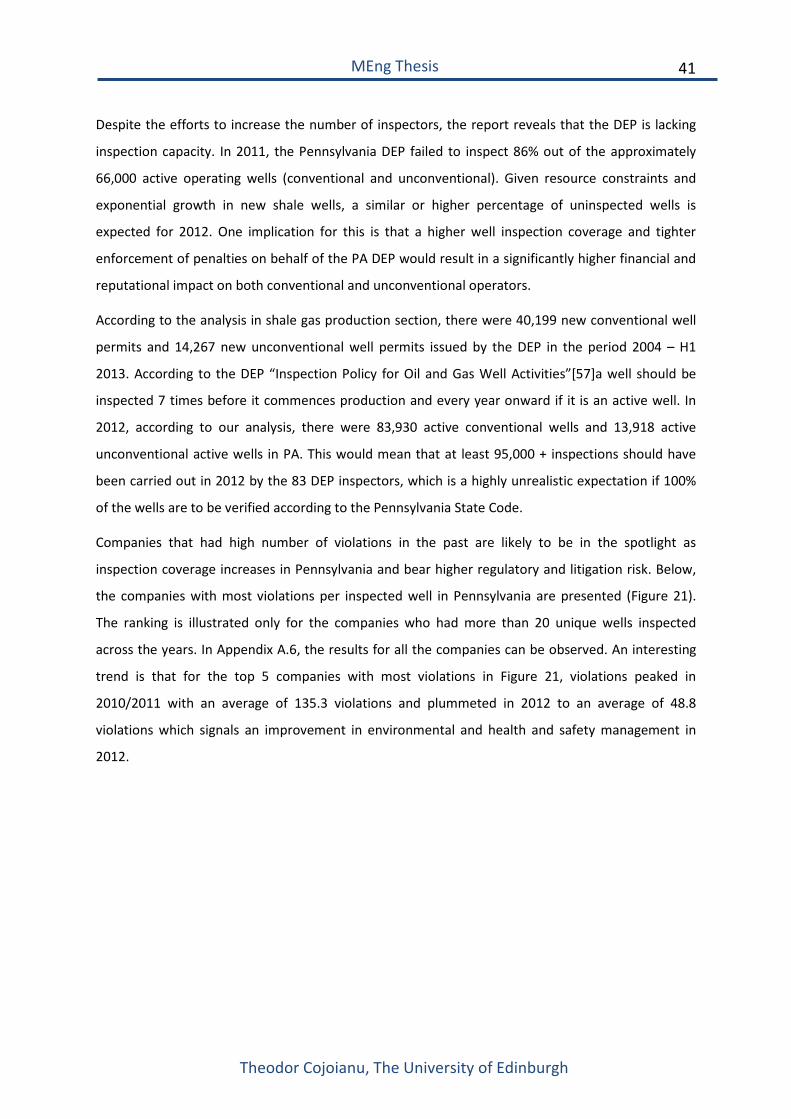
41
Theodor Cojoianu, The University of Edinburgh
MEng Thesis
Despite the efforts to increase the number of inspectors, the report reveals that the DEP is lacking
inspection capacity. In 2011, the Pennsylvania DEP failed to inspect 86% out of the approximately
66,000 active operating wells (conventional and unconventional). Given resource constraints and
exponential growth in new shale wells, a similar or higher percentage of uninspected wells is
expected for 2012. One implication for this is that a higher well inspection coverage and tighter
enforcement of penalties on behalf of the PA DEP would result in a significantly higher financial and
reputational impact on both conventional and unconventional operators.
According to the analysis in shale gas production section, there were 40,199 new conventional well
permits and 14,267 new unconventional well permits issued by the DEP in the period 2004 – H1
2013. According to the DEP “Inspection Policy for Oil and Gas Well Activities”[57]a well should be
inspected 7 times before it commences production and every year onward if it is an active well. In
2012, according to our analysis, there were 83,930 active conventional wells and 13,918 active
unconventional active wells in PA. This would mean that at least 95,000 + inspections should have
been carried out in 2012 by the 83 DEP inspectors, which is a highly unrealistic expectation if 100%
of the wells are to be verified according to the Pennsylvania State Code.
Companies that had high number of violations in the past are likely to be in the spotlight as
inspection coverage increases in Pennsylvania and bear higher regulatory and litigation risk. Below,
the companies with most violations per inspected well in Pennsylvania are presented (Figure 21).
The ranking is illustrated only for the companies who had more than 20 unique wells inspected
across the years. In Appendix A.6, the results for all the companies can be observed. An interesting
trend is that for the top 5 companies with most violations in Figure 21, violations peaked in
2010/2011 with an average of 135.3 violations and plummeted in 2012 to an average of 48.8
violations which signals an improvement in environmental and health and safety management in
2012.
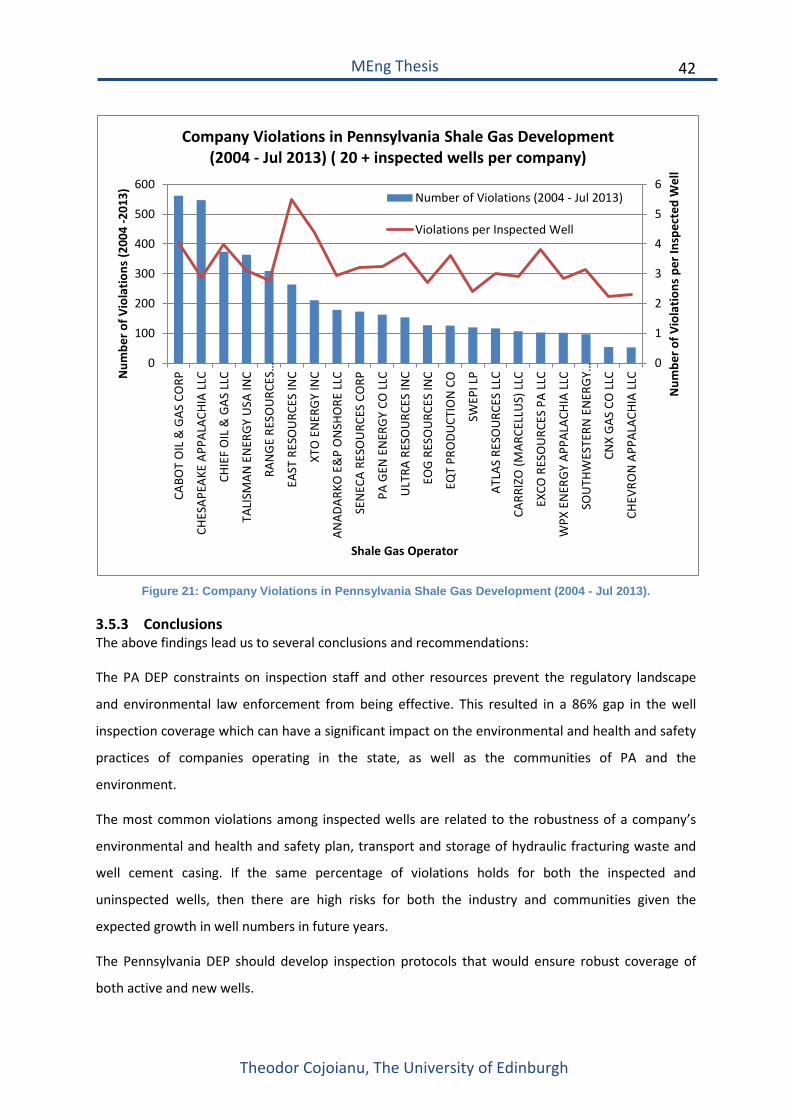
42
Theodor Cojoianu, The University of Edinburgh
MEng Thesis
Figure 21: Company Violations in Pennsylvania Shale Gas Development (2004 - Jul 2013).
3.5.3 Conclusions The above findings lead us to several conclusions and recommendations:
The PA DEP constraints on inspection staff and other resources prevent the regulatory landscape
and environmental law enforcement from being effective. This resulted in a 86% gap in the well
inspection coverage which can have a significant impact on the environmental and health and safety
practices of companies operating in the state, as well as the communities of PA and the
environment.
The most common violations among inspected wells are related to the robustness of a company’s
environmental and health and safety plan, transport and storage of hydraulic fracturing waste and
well cement casing. If the same percentage of violations holds for both the inspected and
uninspected wells, then there are high risks for both the industry and communities given the
expected growth in well numbers in future years.
The Pennsylvania DEP should develop inspection protocols that would ensure robust coverage of
both active and new wells.
0
1
2
3
4
5
6
0
100
200
300
400
500
600CA
BOT
OIL
& G
AS C
ORP
CHES
APEA
KE A
PPAL
ACHI
A LL
C
CHIE
F O
IL &
GAS
LLC
TALI
SMAN
EN
ERGY
USA
INC
RAN
GE
RESO
URC
ES…
EAST
RES
OU
RCES
INC
XTO
EN
ERG
Y IN
C
ANAD
ARKO
E&
P O
NSH
ORE
LLC
SEN
ECA
RESO
URC
ES C
ORP
PA G
EN E
NER
GY
CO L
LC
ULT
RA R
ESO
URC
ES IN
C
EOG
RESO
URC
ES IN
C
EQT
PRO
DUCT
ION
CO
SWEP
I LP
ATLA
S RE
SOU
RCES
LLC
CARR
IZO
(MAR
CELL
US)
LLC
EXCO
RES
OU
RCES
PA
LLC
WPX
EN
ERGY
APP
ALAC
HIA
LLC
SOU
THW
ESTE
RN E
NER
GY…
CNX
GAS
CO
LLC
CHEV
RON
APP
ALAC
HIA
LLC
Num
ber o
f Vio
latio
ns p
er In
spec
ted
Wel
l
Num
ber o
f Vio
latio
ns (2
004
-201
3)
Shale Gas Operator
Company Violations in Pennsylvania Shale Gas Development (2004 - Jul 2013) ( 20 + inspected wells per company)
Number of Violations (2004 - Jul 2013)
Violations per Inspected Well
43
Theodor Cojoianu, The University of Edinburgh
MEng Thesis
The penalties associated with environmental, health and safety and compliance violations are
insignificant and hence it appears that from a financial standpoint it is more costly to comply rather
than paying the fine associated with not complying with the DEP.
3.6 Pennsylvania Shale Gas Production, Wastewater Management and Violations Conclusions
This chapter is a comprehensive case study on shale gas production, unconventional wastewater
management and company violations related in shale operations in Pennsylvania.
Pennsylvania is the 5th shale gas producing state in the US by cumulative estimations between 2004
and 2013. The number of permits awarded for unconventional wells has recently surpassed those
for conventional wells; however the number of active producing unconventional wells in
Pennsylvania is still well behind conventional ones. Companies which benefitted mostly from shale
gas development have been identified. These vary by size and by county of operation in
Pennsylvania.
A similar analysis was performed on the wastewater and company violations dataset which unveiled
interesting findings. The cumulative unconventional wastewater volumes in PA have been 6 times
larger than wastewater coming from conventional oil and gas activities. This has deep implications
for the PA DEP’s ability to effectively manage wastewater and adapt to this fast increasing industry
which is shale gas development.
Given the constraints that the PA DEP is facing in terms of staffing numbers, it is challenging to have
good inspection coverage of both conventional and unconventional wells. Hence, over 80% of active
wells remain uninspected during the year, which can potentially have major impacts on the
environment. The number of fines awarded for company wrongdoings are insignificant and do not
affect the financial wellbeing of the operators. Hence, companies would pay rather than comply with
Pennsylvania environmental regulation.
44
Theodor Cojoianu, The University of Edinburgh
MEng Thesis
4 Quantifying Company Risk in Pennsylvania Shale Gas Development
4.1 Introduction In previous sections several statistics on shale gas operators in Pennsylvania were presented: shale
gas production, wastewater volumes, shale gas produced to wastewater volumes ratio and company
violations per inspected shale gas well.
In this section, a methodology to quantify aggregate company risk relative to peers is presented
together with the aggregate statistics for each company. In addition to aggregating the risk for
companies arising from wastewater management and violations, the MSCI ESG Research database
with company environmental, social and governance risk scores is leveraged to add a further layer
which helps differentiate between the leaders and the laggards in shale gas development[66].
First, the top level risk methodology is shown. The methodology illustrates how the total risk score
for a shale gas operator is calculated from the following metrics: wastewater volume to shale gas
ratio, company violations per inspected well and MSCI ESG Research Intangible Value Assessment
(IVA) score. Afterwards the focus will be shifted towards the data manipulation techniques used and
the IVA score methodology which will provide a better understanding of the top level risk
methodology used. Finally, the shale gas operator risk benchmarking analysis is presented where we
identify the leaders and the laggards in the industry and discuss their business models and industry
best practices.
4.2 Top Level Risk Methodology
4.2.1 Introduction In order to provide a holistic picture of the risk exposure of shale gas operators, operators are
relatively benchmarked with respect to peers on 3 indicators. The percentages are then aggregated
for each indicator to form the aggregate risk score or percentage. The 3 indicators are: wastewater
volume to produced shale gas ratio, company violations per inspected shale gas well and MSCI ESG
Research IVA ESG scores. The MSCI ESG Research IVA ESG Company score is based on the research
of the 90+ analysts at MSCI who rank companies’ on their overall environmental, social and
governance practices. This score will help put the company in the wider oil and gas industry context
and includes an assessment of a company’s global operations and business segments. The other 2
indicators are shale gas specific only. The aggregation of these particular indicators provides a
45
Theodor Cojoianu, The University of Edinburgh
MEng Thesis
holistic picture of both shale gas and global operations, and represents a robust measure of the
environmental, social and governance risk management of shale gas operators in Pennsylvania.
4.2.2 Wastewater to Gas Ratio and Company Violations Indicators For both the wastewater to gas ratio indicator and the company violations per inspected shale gas
well indicator, a 0% risk threshold is set to the best performing company, 50% threshold to the
average company score for the respective indicator and 100% to the worst performing company.
If the company score for a given indicator is less than the industry average, then a linear
interpolation is carried out between 0% (best performing company) and 50% (industry average) to
find the risk exposure for the respective company. Alternatively, if the company score is higher than
the industry average, then a linear interpolation is calculated between 50% (industry average) and
100% (worst performing company). When calculating the industry average, outliers which might
skew the result heavily are excluded. For example, for the wastewater to shale gas ratio (bbl/cf) the
industry average calculation excludes any company with the ratio >300, since 90% of the companies
have ratio values between 0 – 300, and the rest of 8 companies (c. 10%) are outliers with extremely
high ratios (between 1000 – 5162). To such outliers 100% risk exposure is given for the particular
indicator.
In the Pennsylvania wastewater management section, the performance of companies with respect
to the shale gas production to wastewater ratio was analysed. This illustrated the opportunity of
companies to develop shale gas with a minimal environmental footprint. If the ratio is inverted, the
risk profile of a company can be interpreted as follows: companies with high wastewater volumes
per unit of shale gas produced are at higher risk than those who manage to develop shale gas
resources with a smaller wastewater footprint.
In the case of the company violations per inspected shale as well statistic, there are 71 companies
which are comprised in the dataset, with an average of 3.25 violations per well. The outliers here are
the companies who have a violation per well ratio greater than 11 (3 in total) which skew the
average and to which 100% risk exposure was awarded.
46
Theodor Cojoianu, The University of Edinburgh
MEng Thesis
4.3 MSCI ESG Research Intangible Value Assessment (IVA) Methodology The MSCI methodology was briefly presented during Phase I of the MEng project. In this section, a
more in depth explanation will be provided as to how MSCI ESG Research analysts rate companies
involved in oil and gas development as well as how the MSCI scores can be incorporated in the top
level shale gas risk methodology.
The IVA research methodology is looking to assess environmental, social and governance (ESG) risks
and opportunities of companies in a medium to long term. The model hierarchy on which the
assessment is based can be observed in Appendix A.6. ESG issues are contextual depending on the
industry assessed [67] and hence, not all the issues in the IVA model hierarchy feed into the ESG risk
and opportunity of a company.
It is then a select number of key issues on which companies are ranked and based on which the
benchmarking exercise is carried out. The key issues are selected for each of the 154 GICS (Global
Industry Classification Standard[68]) sub-industries and are limited to between 4 to 7 issues for each
sub-industry. One of the key issues is Corporate Governance which is included in the rating of every
company. The other key issues from the hierarchy model (Appendix A.6) are selected based on their
high potential impact on the business model of companies within a sub industry.
For the Oil & Gas (O&G) Drilling companies, O&G Equipment and Services companies, Integrated
O&G companies, O&G Exploration and Production, O&G Refining and Marketing, Storage and
Transportation companies, the key issues are: carbon emissions, biodiversity and land use, toxic
emissions and waste, health and safety, corruption and instability and corporate governance.
The final ESG score for each company is obtained by applying a weighted average across the key
issue scores and it is a number between 0 and 10, where a score closer to 0 means that company has
a poor ESG rating and a score closer to 10 means that the company has a good ESG performance.
In order to incorporate the ESG scores into the risk methodology, the complement score percentage
is used (Complement Score Percentage = (10 – ESG Score) x 10). In this way, a company with a low
complement percentage is a best performer (a company which faces less risk) and a company with a
high complement percentage is a poor ESG performer.
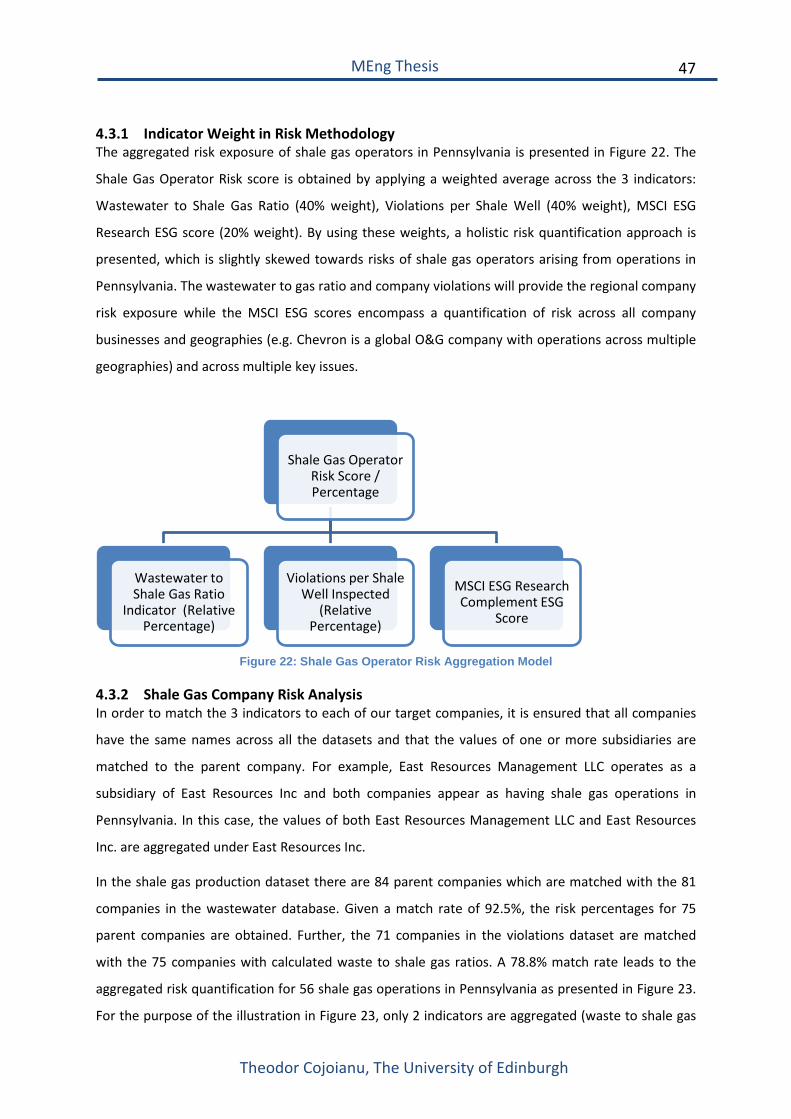
47
Theodor Cojoianu, The University of Edinburgh
MEng Thesis
4.3.1 Indicator Weight in Risk Methodology The aggregated risk exposure of shale gas operators in Pennsylvania is presented in Figure 22. The
Shale Gas Operator Risk score is obtained by applying a weighted average across the 3 indicators:
Wastewater to Shale Gas Ratio (40% weight), Violations per Shale Well (40% weight), MSCI ESG
Research ESG score (20% weight). By using these weights, a holistic risk quantification approach is
presented, which is slightly skewed towards risks of shale gas operators arising from operations in
Pennsylvania. The wastewater to gas ratio and company violations will provide the regional company
risk exposure while the MSCI ESG scores encompass a quantification of risk across all company
businesses and geographies (e.g. Chevron is a global O&G company with operations across multiple
geographies) and across multiple key issues.
Figure 22: Shale Gas Operator Risk Aggregation Model
4.3.2 Shale Gas Company Risk Analysis In order to match the 3 indicators to each of our target companies, it is ensured that all companies
have the same names across all the datasets and that the values of one or more subsidiaries are
matched to the parent company. For example, East Resources Management LLC operates as a
subsidiary of East Resources Inc and both companies appear as having shale gas operations in
Pennsylvania. In this case, the values of both East Resources Management LLC and East Resources
Inc. are aggregated under East Resources Inc.
In the shale gas production dataset there are 84 parent companies which are matched with the 81
companies in the wastewater database. Given a match rate of 92.5%, the risk percentages for 75
parent companies are obtained. Further, the 71 companies in the violations dataset are matched
with the 75 companies with calculated waste to shale gas ratios. A 78.8% match rate leads to the
aggregated risk quantification for 56 shale gas operations in Pennsylvania as presented in Figure 23.
For the purpose of the illustration in Figure 23, only 2 indicators are aggregated (waste to shale gas
Shale Gas Operator Risk Score / Percentage
Wastewater to Shale Gas Ratio
Indicator (Relative Percentage)
Violations per Shale Well Inspected
(Relative Percentage)
MSCI ESG Research Complement ESG
Score

48
Theodor Cojoianu, The University of Edinburgh
MEng Thesis
ratio risk percentage and violations per well ratio risk percentage with 0.5 weights each). When
further adding the MSCI ESG Research scores layer, the company number for which total risk is
quantified, drops to 18 (Figure 24).
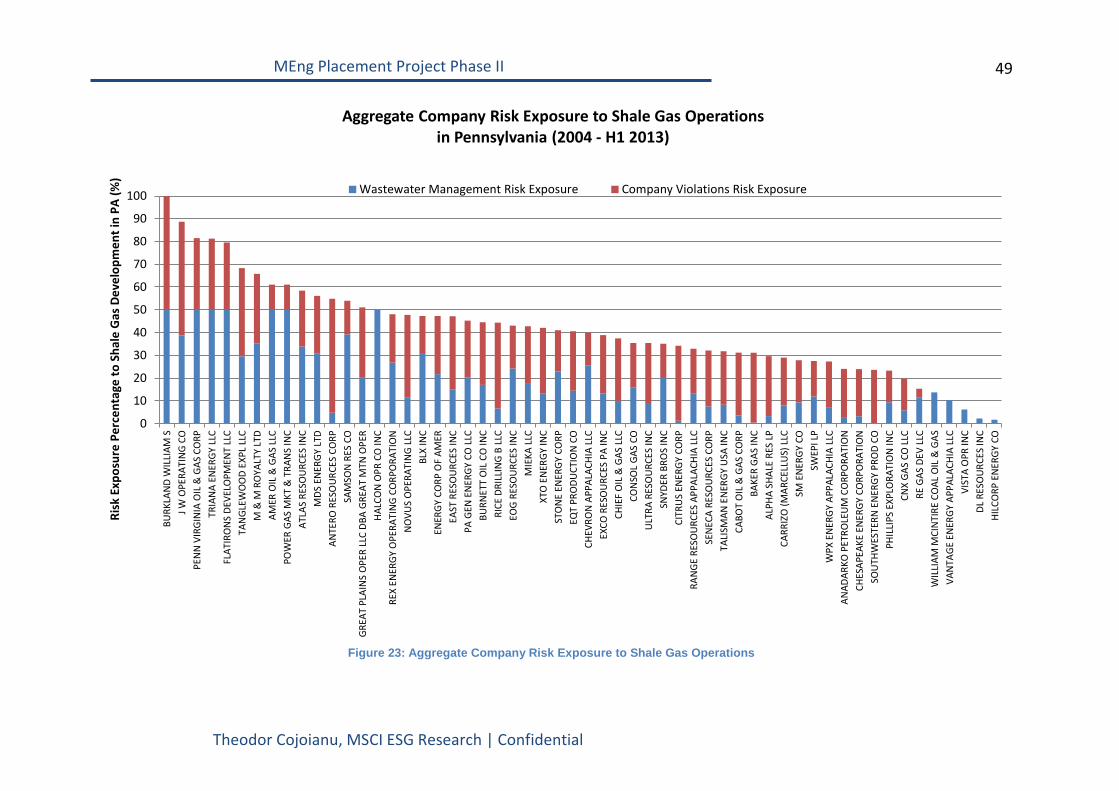
49
MEng Placement Project Phase II
Theodor Cojoianu, MSCI ESG Research | Confidential
Figure 23: Aggregate Company Risk Exposure to Shale Gas Operations
0
10
20
30
40
50
60
70
80
90
100
BURK
LAN
D W
ILLI
AM S
J W O
PERA
TIN
G CO
PEN
N V
IRGI
NIA
OIL
& G
AS C
ORP
TRIA
NA
ENER
GY L
LCFL
ATIR
ON
S DE
VELO
PMEN
T LL
CTA
NGL
EWO
OD
EXPL
LLC
M &
M R
OYA
LTY
LTD
AMER
OIL
& G
AS L
LCPO
WER
GAS
MKT
& T
RAN
S IN
CAT
LAS
RESO
URC
ES IN
CM
DS E
NER
GY L
TDAN
TERO
RES
OUR
CES
CORP
SAM
SON
RES
CO
GREA
T PL
AIN
S O
PER
LLC
DBA
GREA
T M
TN O
PER
HALC
ON
OPR
CO
INC
REX
ENER
GY O
PERA
TIN
G CO
RPO
RATI
ON
NO
VUS
OPE
RATI
NG
LLC
BLX
INC
ENER
GY C
ORP
OF
AMER
EAST
RES
OU
RCES
INC
PA G
EN E
NER
GY C
O L
LCBU
RNET
T O
IL C
O IN
CRI
CE D
RILL
ING
B LL
CEO
G RE
SOU
RCES
INC
MIE
KA L
LCXT
O E
NER
GY IN
CST
ON
E EN
ERGY
CO
RPEQ
T PR
ODU
CTIO
N C
OCH
EVRO
N A
PPAL
ACHI
A LL
CEX
CO R
ESO
URC
ES P
A IN
CCH
IEF
OIL
& G
AS L
LCCO
NSO
L GA
S CO
ULT
RA R
ESO
URC
ES IN
CSN
YDER
BRO
S IN
CCI
TRU
S EN
ERGY
CO
RPRA
NGE
RES
OU
RCES
APP
ALAC
HIA
LLC
SEN
ECA
RESO
URC
ES C
ORP
TALI
SMAN
EN
ERGY
USA
INC
CABO
T O
IL &
GAS
CO
RPBA
KER
GAS
INC
ALPH
A SH
ALE
RES
LPCA
RRIZ
O (M
ARCE
LLU
S) L
LCSM
EN
ERGY
CO
SWEP
I LP
WPX
EN
ERGY
APP
ALAC
HIA
LLC
ANAD
ARKO
PET
ROLE
UM
CO
RPO
RATI
ON
CHES
APEA
KE E
NER
GY C
ORP
ORA
TIO
NSO
UTH
WES
TERN
EN
ERGY
PRO
D CO
PHIL
LIPS
EXP
LORA
TIO
N IN
CCN
X GA
S CO
LLC
RE G
AS D
EV L
LCW
ILLI
AM M
CIN
TIRE
CO
AL O
IL &
GAS
VAN
TAGE
EN
ERGY
APP
ALAC
HIA
LLC
VIST
A O
PR IN
CDL
RES
OUR
CES
INC
HILC
ORP
EN
ERGY
CO
Risk
Exp
osur
e Pe
rcen
tage
to S
hale
Gas
Dev
elop
men
t in
PA (%
) Aggregate Company Risk Exposure to Shale Gas Operations
in Pennsylvania (2004 - H1 2013)
Wastewater Management Risk Exposure Company Violations Risk Exposure
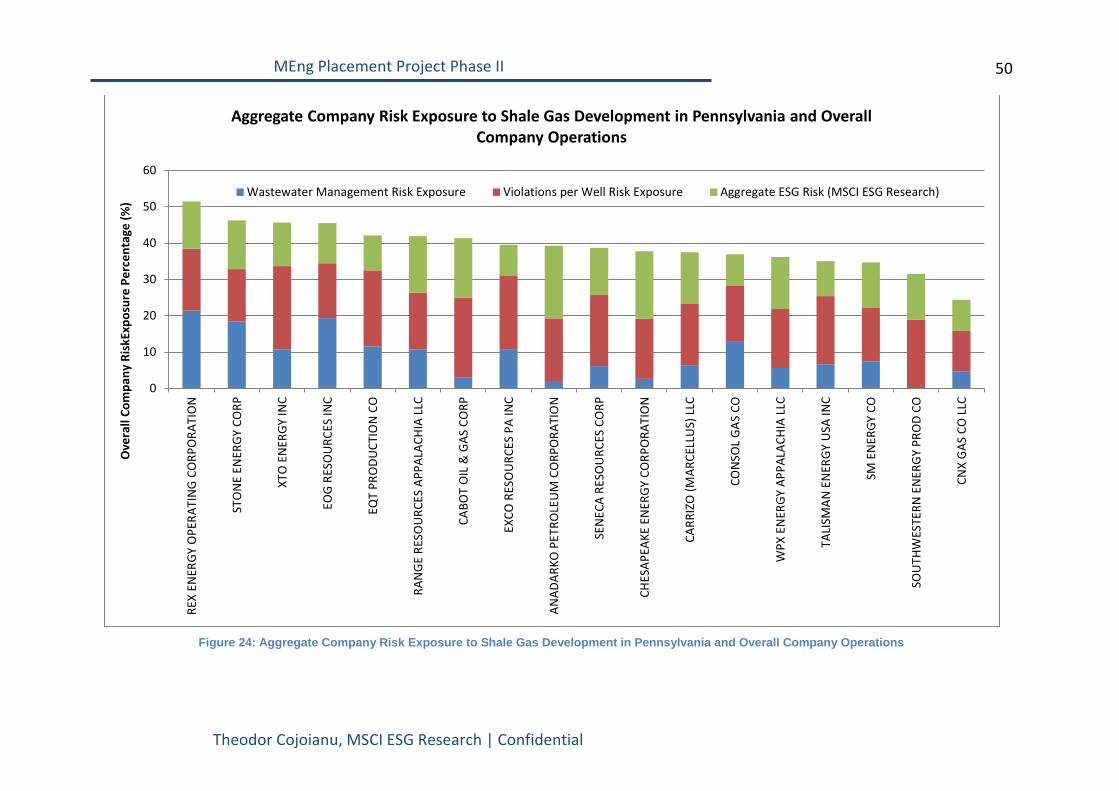
50
MEng Placement Project Phase II
Theodor Cojoianu, MSCI ESG Research | Confidential
Figure 24: Aggregate Company Risk Exposure to Shale Gas Development in Pennsylvania and Overall Company Operations
0
10
20
30
40
50
60RE
X EN
ERGY
OPE
RATI
NG
CO
RPO
RATI
ON
STO
NE
ENER
GY C
ORP
XTO
EN
ERG
Y IN
C
EOG
RESO
URC
ES IN
C
EQT
PRO
DUCT
ION
CO
RAN
GE
RESO
URC
ES A
PPAL
ACHI
A LL
C
CABO
T O
IL &
GAS
CO
RP
EXCO
RES
OU
RCES
PA
INC
ANAD
ARKO
PET
ROLE
UM
CO
RPO
RATI
ON
SEN
ECA
RESO
URC
ES C
ORP
CHES
APEA
KE E
NER
GY C
ORP
ORA
TIO
N
CARR
IZO
(MAR
CELL
US)
LLC
CON
SOL
GAS
CO
WPX
EN
ERGY
APP
ALAC
HIA
LLC
TALI
SMAN
EN
ERGY
USA
INC
SM E
NER
GY C
O
SOU
THW
ESTE
RN E
NER
GY
PRO
D CO
CNX
GAS
CO
LLC
Ove
rall
Com
pany
Ris
kExp
osur
e Pe
rcen
tage
(%)
Aggregate Company Risk Exposure to Shale Gas Development in Pennsylvania and Overall Company Operations
Wastewater Management Risk Exposure Violations per Well Risk Exposure Aggregate ESG Risk (MSCI ESG Research)
51
MEng Placement Project Phase II
Theodor Cojoianu, MSCI ESG Research | Confidential
Figure 23 also illustrates the fact that companies with higher risk exposure in Pennsylvania shale gas
development tend to have a poorer wastewater to gas production ratio which leads to higher
wastewater management costs and also indicates a small gas production rate which translate into
fewer financial rewards in the short to medium term. Furthermore, small companies who are 100%
invested in shale gas operations tend to have less experience into managing risks and face the
highest risk exposure, while large integrated oil and gas producers are able to diversify their
operations across different counties in Pennsylvania, where historically there have been sweet spots
for gas production and suitable wastewater infrastructure.
In Figure 24, the extra ESG risk layer is added, as calculated based on the MSCI ESG Research IVA
score. The ESG risk exposure is a result of the aggregation of a specific company risk with respect to
carbon emissions, biodiversity and land use, health and safety practices, toxic emissions and waste
and corporate governance. Given the fact that MSCI covers only mid and large cap listed companies,
unlisted companies and small listed companies involved in shale gas development are not covered
by standard ESG research. Hence the company set is narrowed to 18 companies. In this respect,
Figure 23 is a useful insight which reveals the risk of both listed and unlisted companies on 2
important and material metrics.
Given the fact that the aggregate risk can be quantified for 18 companies, which tend to be large
integrated oil and gas companies or have diversified businesses across the oil and gas industry and
operate across multiple counties in Pennsylvania, it is expected that a moderate difference between
the best performing and worst performing company from and environmental and social risk
perspective. This is confirmed by Figure 24, where the difference in risk exposure between the worst
performing company (Rex Energy Operating Corporation) and the best performing company (CNX
Gas – recently acquired by ConsolEnergy) is 27%. Most companies perform well on wastewater risk
exposure; however they tend to have a higher violation rate per shale gas well inspected. While
most companies have a comparable MSCI ESG Research risk exposure score, there are some poor
ESG performers on which several observations are presented below based on MSCI ESG Research
company reports, annual reports and company website research.
Anadarko Petroleum Corporation, who is a former partner of BP, owned 25% non-operating interest
in the BP Macondo well[69] and still faces reputational and financial risks in relation to the
Deepwater Horizon explosion. Anadarko has a presence in geographic regions where H&S
performance is poor, which combined with a H&S management strategy and poor performance,
places the company behind most peer companies. The company’s oil and gas reserves are 90%
booked in the US[70]where federal greenhouse gas (GHG) regulations are targeting a 17% reduction
52
MEng Placement Project Phase II
Theodor Cojoianu, MSCI ESG Research | Confidential
by 2020 from 2005 levels. The oil and gas reserve split (46% oil and 54% gas) does not provide a
competitive advantage for the company in a carbon-restricted economy[54].
Chesapeake Energy Corporation has benefited most from shale gas development in Pennsylvania in
the period (2004 – H1 2013) through its subsidiary Chesapeake Appalachia LLC . However, the recent
controversies it has been involved in, together with poor company performance on managing
biodiversity and land use and health and safety risks, make Chesapeake one of the least responsible
companies in oil and gas development according to MSCI’s scoring methodology[71].
53
MEng Placement Project Phase II
Theodor Cojoianu, MSCI ESG Research | Confidential
5 US Wide Hydraulic Fracturing Case Study
5.1 Introduction In order to provide a top level analysis of the state of hydraulic fracturing usage across the United
States, the FracFocus Chemical Registry Database[72] has been leveraged. The case study explores
the distribution of hydraulic fractured in the US, the amount of water employed in the hydraulic
fracturing process (where reported) and provide estimations of shale gas development associated
wastewater and violations by extrapolating the results from the Pennsylvania case study. Finally,
having identified the operators who employ hydraulic fracturing processes as part of the
development of their oil and gas wells, an ESG risk assessment is presented based on the MSCI ESG
Research proprietary ESG scores database.
5.2 FracFocus National Registry The registry has been launched in 2011 by the Ground Water Protection Council (GWPC) and the
Interstate Oil and Gas Compact Commission and it is an online repository of information regarding
the chemical composition of fracturing fluids, together with the geo-location, operator details and
fracturing fluid volumes of hydraulically fractured oil and gas wells[40].
On 1st of January 2011, FracFocus began as a voluntary program. As of 9th of July 2012, 10 states
required 3 different fracturing fluid disclosure types in FracFocus:(1) frac fluid volume disclosure:
New Mexico, Ohio, Oklahoma, Maryland, Michigan; (2) concentration disclosure: Wyoming; (3)
volume and concentration: Arkansas, Louisiana, Montana and Pennsylvania.
5.2.1 FracFocus Data According to the Ground Water Protection Council data in FracFocus are entered by oil and gas
operators and service companies. The registry does not hold itself accountable for any inaccuracy in
the dataset. Hence, several quality assurance checks were performed on the dataset. These are
presented in the next section.
The data in FracFocus can be downloaded only in individual PDF formats per well (Appendix A.10).
Since downloads are possible only for single well disclosure records, a web crawler has been
designed in C# programming language to automatically parse the website and download the
associated data. However, according to a private communication with Sam Malone, Officer at the
FrackTracker Alliance[73], FracFocus has restricted the use of crawlers and automatic download
programmes on its website as of May 2013. This was the cause for which the C# program was
54
MEng Placement Project Phase II
Theodor Cojoianu, MSCI ESG Research | Confidential
unsuccessful on the FracFocus site. The C# program was tested on a website with a similar
architecture (Google Trends / Google Insights for search) on which the program was successful. The
code for both attempts is presented in Appendix A.7.
The data download was made possible with the help of SkyTruth [74], an NGO that uses software
engineering, remote sensing and digital mapping to create insights that expose the risks to
ecosystems posed by mining and oil and gas development activities. SkyTruth designed a web
crawler with the same purpose and managed to download the data from the FracFocus website
before May 2013, when the FracFocus website design changed. SkyTruth kindly shared the
downloaded dataset, which now is also available to the wider public.
5.2.2 Quality Assurance, Data Corrections and Data Visualisation The quality of the FracFocus dataset has been assessed through manual and automated methods
and the necessary adjustments have been performed in order to obtain a more robust dataset.
Duplicate records and well fracture date records outside the interval 1st Jan 2011 – 1st May 2013
have been excluded. Companies were allowed to submit hydraulic fracturing records from previous
years which explains why the database contained entries from as early as 2008, however given the
fact that this was a voluntary submission, it is considered that data from years before the target
period is not reliable or robust.
The location of the wells has been validated by using the Quantum GIS software and the well
latitude and longitude coordinates as reported in the individual well reports. State location, shale
basin and shale play location information has been used to spatially validate the well location. Since
the reporting framework does not distinguish between conventional and unconventional hydraulic
fractured wells, a further data correction has been applied in order to be able to estimate the water
amount that is used in shale gas and oil development across the US. The correction consists in
eliminating any wells which are located outside the boundaries of shale basins across the US, since
shale oil and gas are unlikely to be found outside the boundaries of a shale basin[1].
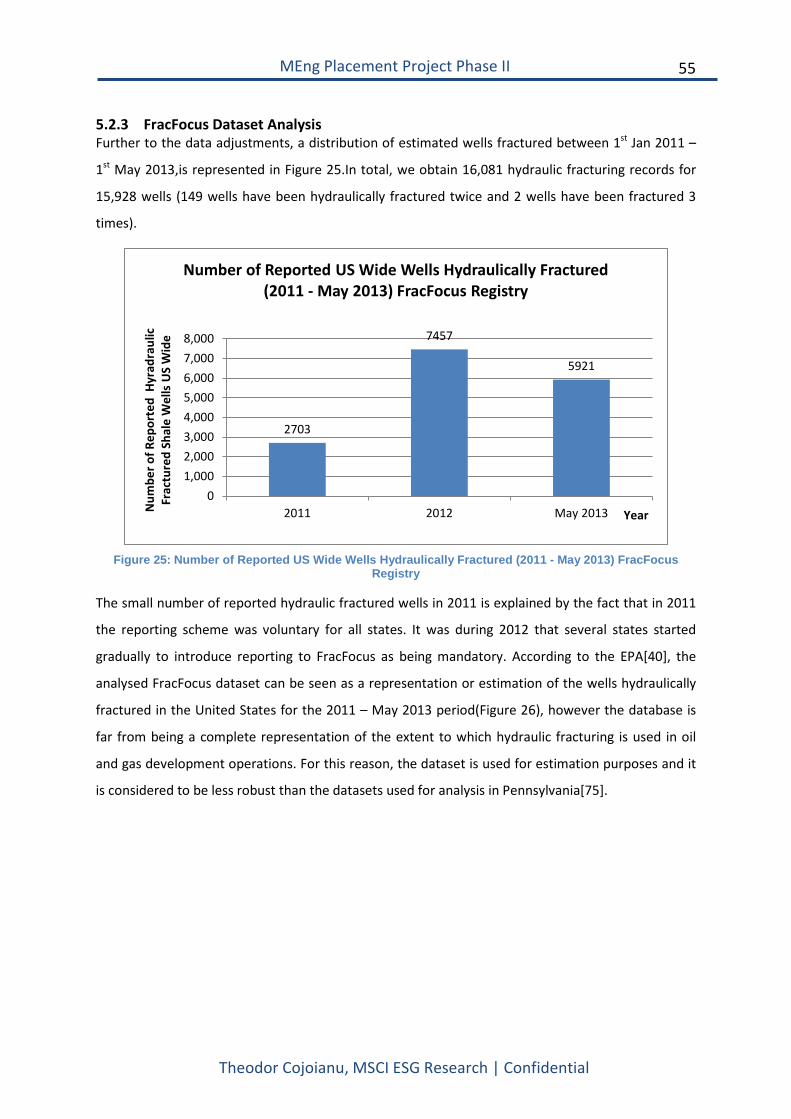
55
MEng Placement Project Phase II
Theodor Cojoianu, MSCI ESG Research | Confidential
5.2.3 FracFocus Dataset Analysis Further to the data adjustments, a distribution of estimated wells fractured between 1st Jan 2011 –
1st May 2013,is represented in Figure 25.In total, we obtain 16,081 hydraulic fracturing records for
15,928 wells (149 wells have been hydraulically fractured twice and 2 wells have been fractured 3
times).
Figure 25: Number of Reported US Wide Wells Hydraulically Fractured (2011 - May 2013) FracFocus
Registry
The small number of reported hydraulic fractured wells in 2011 is explained by the fact that in 2011
the reporting scheme was voluntary for all states. It was during 2012 that several states started
gradually to introduce reporting to FracFocus as being mandatory. According to the EPA[40], the
analysed FracFocus dataset can be seen as a representation or estimation of the wells hydraulically
fractured in the United States for the 2011 – May 2013 period(Figure 26), however the database is
far from being a complete representation of the extent to which hydraulic fracturing is used in oil
and gas development operations. For this reason, the dataset is used for estimation purposes and it
is considered to be less robust than the datasets used for analysis in Pennsylvania[75].
2703
7457
5921
01,0002,0003,0004,0005,0006,0007,0008,000
2011 2012 May 2013Num
ber o
f Rep
orte
d H
yrad
raul
ic
Frac
ture
d Sh
ale
Wel
ls U
S W
ide
Year
Number of Reported US Wide Wells Hydraulically Fractured (2011 - May 2013) FracFocus Registry
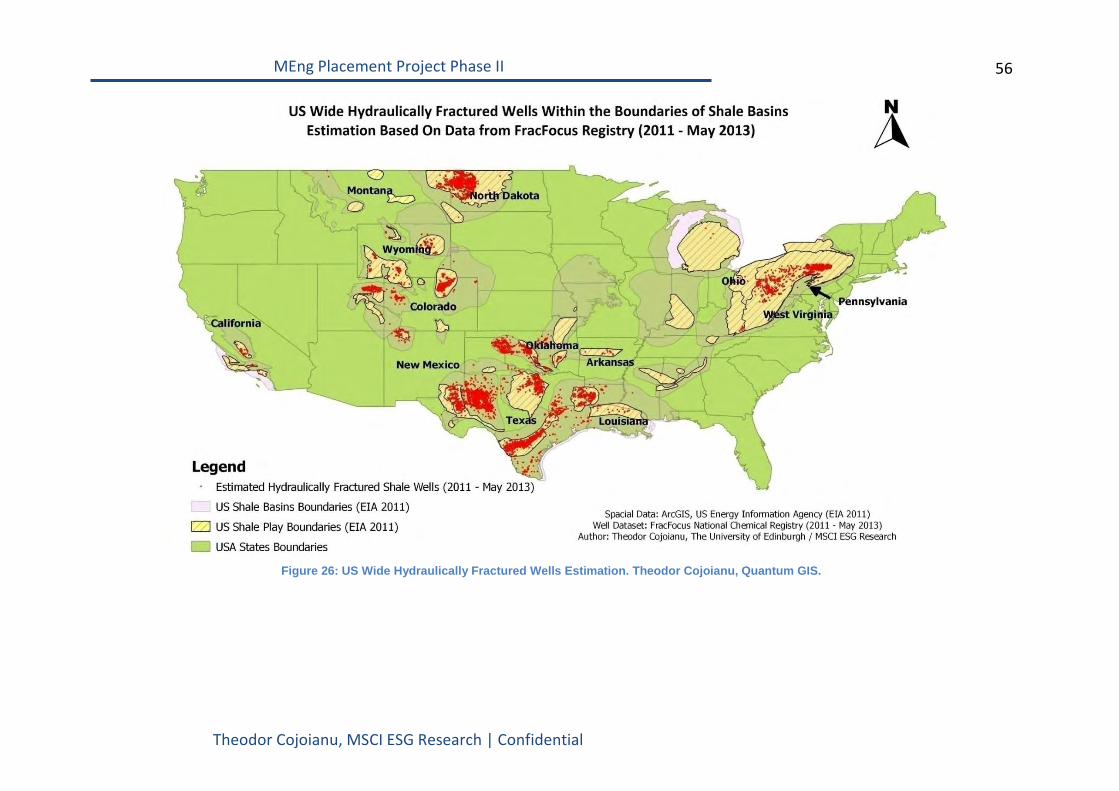
56
MEng Placement Project Phase II
Theodor Cojoianu, MSCI ESG Research | Confidential
Figure 26: US Wide Hydraulically Fractured Wells Estimation. Theodor Cojoianu, Quantum GIS.
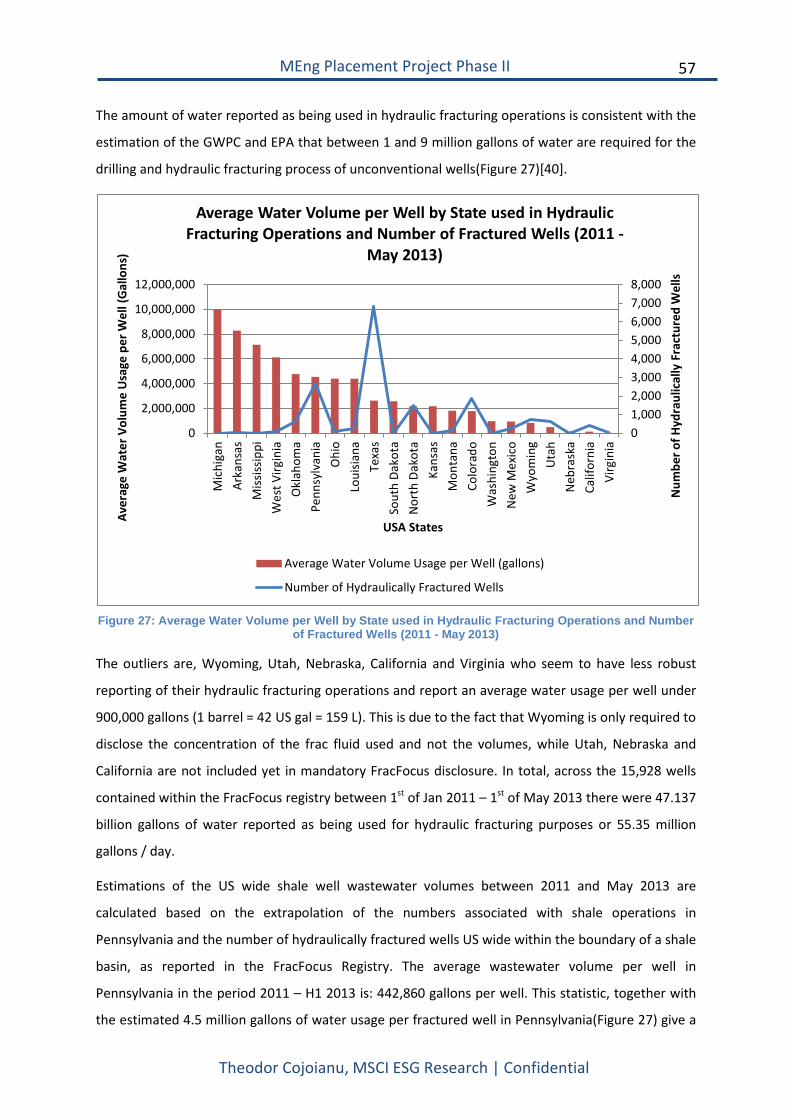
57
MEng Placement Project Phase II
Theodor Cojoianu, MSCI ESG Research | Confidential
The amount of water reported as being used in hydraulic fracturing operations is consistent with the
estimation of the GWPC and EPA that between 1 and 9 million gallons of water are required for the
drilling and hydraulic fracturing process of unconventional wells(Figure 27)[40].
Figure 27: Average Water Volume per Well by State used in Hydraulic Fracturing Operations and Number
of Fractured Wells (2011 - May 2013)
The outliers are, Wyoming, Utah, Nebraska, California and Virginia who seem to have less robust
reporting of their hydraulic fracturing operations and report an average water usage per well under
900,000 gallons (1 barrel = 42 US gal = 159 L). This is due to the fact that Wyoming is only required to
disclose the concentration of the frac fluid used and not the volumes, while Utah, Nebraska and
California are not included yet in mandatory FracFocus disclosure. In total, across the 15,928 wells
contained within the FracFocus registry between 1st of Jan 2011 – 1st of May 2013 there were 47.137
billion gallons of water reported as being used for hydraulic fracturing purposes or 55.35 million
gallons / day.
Estimations of the US wide shale well wastewater volumes between 2011 and May 2013 are
calculated based on the extrapolation of the numbers associated with shale operations in
Pennsylvania and the number of hydraulically fractured wells US wide within the boundary of a shale
basin, as reported in the FracFocus Registry. The average wastewater volume per well in
Pennsylvania in the period 2011 – H1 2013 is: 442,860 gallons per well. This statistic, together with
the estimated 4.5 million gallons of water usage per fractured well in Pennsylvania(Figure 27) give a
01,0002,0003,0004,0005,0006,0007,0008,000
0
2,000,000
4,000,000
6,000,000
8,000,000
10,000,000
12,000,000
Mic
higa
nAr
kans
asM
ississ
ippi
Wes
t Virg
inia
Okl
ahom
aPe
nnsy
lvan
iaO
hio
Loui
siana
Texa
sSo
uth
Dako
taN
orth
Dak
ota
Kans
asM
onta
naCo
lora
doW
ashi
ngto
nN
ew M
exic
oW
yom
ing
Uta
hN
ebra
ska
Calif
orni
aVi
rgin
ia
Num
ber o
f Hyd
raul
ical
ly F
ract
ured
Wel
ls
Aver
age
Wat
er V
olum
e U
sage
per
Wel
l (G
allo
ns)
USA States
Average Water Volume per Well by State used in Hydraulic Fracturing Operations and Number of Fractured Wells (2011 -
May 2013)
Average Water Volume Usage per Well (gallons)
Number of Hydraulically Fractured Wells
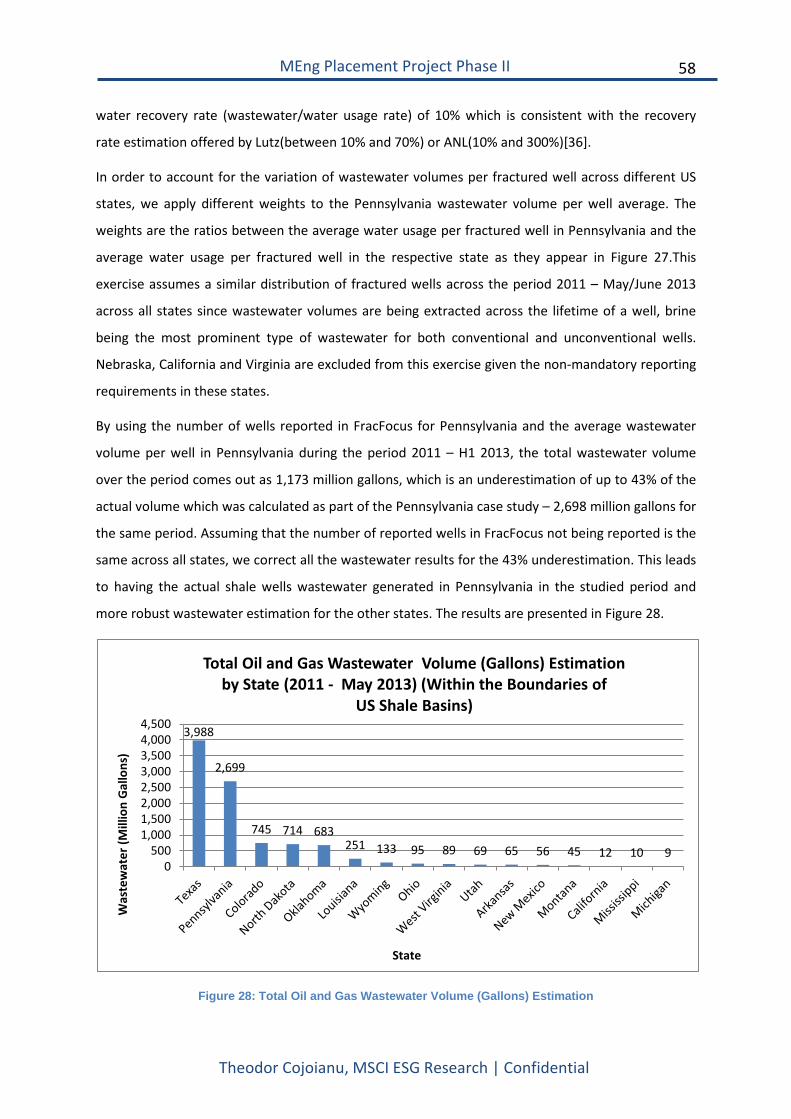
58
MEng Placement Project Phase II
Theodor Cojoianu, MSCI ESG Research | Confidential
water recovery rate (wastewater/water usage rate) of 10% which is consistent with the recovery
rate estimation offered by Lutz(between 10% and 70%) or ANL(10% and 300%)[36].
In order to account for the variation of wastewater volumes per fractured well across different US
states, we apply different weights to the Pennsylvania wastewater volume per well average. The
weights are the ratios between the average water usage per fractured well in Pennsylvania and the
average water usage per fractured well in the respective state as they appear in Figure 27.This
exercise assumes a similar distribution of fractured wells across the period 2011 – May/June 2013
across all states since wastewater volumes are being extracted across the lifetime of a well, brine
being the most prominent type of wastewater for both conventional and unconventional wells.
Nebraska, California and Virginia are excluded from this exercise given the non-mandatory reporting
requirements in these states.
By using the number of wells reported in FracFocus for Pennsylvania and the average wastewater
volume per well in Pennsylvania during the period 2011 – H1 2013, the total wastewater volume
over the period comes out as 1,173 million gallons, which is an underestimation of up to 43% of the
actual volume which was calculated as part of the Pennsylvania case study – 2,698 million gallons for
the same period. Assuming that the number of reported wells in FracFocus not being reported is the
same across all states, we correct all the wastewater results for the 43% underestimation. This leads
to having the actual shale wells wastewater generated in Pennsylvania in the studied period and
more robust wastewater estimation for the other states. The results are presented in Figure 28.
Figure 28: Total Oil and Gas Wastewater Volume (Gallons) Estimation
3,988
2,699
745 714 683 251 133 95 89 69 65 56 45 12 10 9
0500
1,0001,5002,0002,5003,0003,5004,0004,500
Was
tew
ater
(Mill
ion
Gal
lons
)
State
Total Oil and Gas Wastewater Volume (Gallons) Estimation by State (2011 - May 2013) (Within the Boundaries of
US Shale Basins)
59
MEng Placement Project Phase II
Theodor Cojoianu, MSCI ESG Research | Confidential
Texas, having the highest shale gas production historically, appears as having the highest value for
wastewater generated which was expected. Pennsylvania is the runner-up which indicates the
exponential increase in new shale wells in the state post 2011. North Dakota is mostly known for its
shale oil production in the Bakken Shale Play, whose associated wastewater brings North Dakota in
the spotlight. Arkansas and Michigan, states which historically have high shale gas production (top 5
across the US) have very low estimations due to the fact that very few wells have been reported to
FracFocus, which poises concerns over the reporting reinforcement that should be in place for a
registry like FracFocus[75].
5.2.4 US Wide Shale Gas Operator Risk Analysis The water usage in hydraulic fracturing operations per operator are more challenging to quantify
given the fact that companies have operations across multiple states with different reporting
requirements. Hence, an operator that has operations mostly in Wyoming, where only fluid chemical
composition is mandatory, will appear as having a better water usage performance than other
operators who have to mandatory disclose the water volume and concentration in a state like
Pennsylvania. In addition to this, the FracFocus dataset is indicative of the aggregate hydraulic
fracturing trends but not robust enough to ensure a comprehensive comparison across operators.
Hence, as a proxy for water, carbon, health and safety and toxic emissions related company risks,
the MSCI ESG Research disaggregated score database is leveraged. The disaggregated
environmental, social and governance scores are used to illustrate a top level risk exposure of oil and
gas companies involved in shale gas development.
This is achieved by combining a list of shale operators from both the FracFocus (US wide) dataset
and the Pennsylvania dataset. The list of shale operators is then matched with the MSCI ESG
Research company list and key issue scores, which leads to the classification in Figure 29 for 60 shale
gas operators. The MSCI ESG disaggregated scores have been inverted by using the Complement
Score Percentage (CSP = (10 – ESG Score) x10).An equal weight has been given to all disaggregated
scores and then aggregated for each company.
The companies with the best risk exposure across the 7 key issues analysed are Seneca Resources,
Statoil, Hess Corporation and BHP Billiton, while the high risk companies are Plains Exploration and
Production, Approach Resources, Bill Barret Corporation and Carrizo Oil and Gas. The same
observation from the Pennsylvania case study is valid here: companies which have the bulk of their
assets in shale resource development (Carrizo) are at higher risk than diversified oil and gas
companies like Statoil.
60
MEng Placement Project Phase II
Theodor Cojoianu, MSCI ESG Research | Confidential
A closer look at the disaggregated scores unveils the fact that carbon emission and corporate
governance risks are the major differentiators between companies at risk and the ones the ones
with lower risk exposure. High risk companies have poor environmental management systems and
no emission reduction targets although they operate in industries and geographical areas which are
highly likely to be impacted by carbon regulation[76]. Industry leaders have energy efficiency and
flaring reduction targets which apply to both the upstream and refining operations. Flaring reduction
is particularly important for companies since large amounts of methane are flared during oil and gas
operations (mainly to maintain the pressure of an oil and gas well) which accounts for 10 % to 25%
of a company’s overall GHG emissions[76]. Another aspect worth mentioning is that the oil and gas
sector is best positioned to benefit from carbon capture and storage (CCS) given the drilling
experience of the industry and availability of depleted reservoirs. Statoil is one of the companies
with strong CCS programs and R&D development related to CCS.
Corporate governance risks in the oil and gas industry are related to several aspects: company
systems and policies to deal with corruption and political instability, company ethics as well as the
responsibilities of the board of directors, compensation and shareholder rights[66]. Poor performers
in this area tend to lack evidence of anti-corruption and risk controls and often lack reinforcement of
the company code of ethics. Executive compensation should be aligned with long term company
performance and other intangible non-financial metrics such as: health and safety (number of
fatalities per year) and environmental performance.
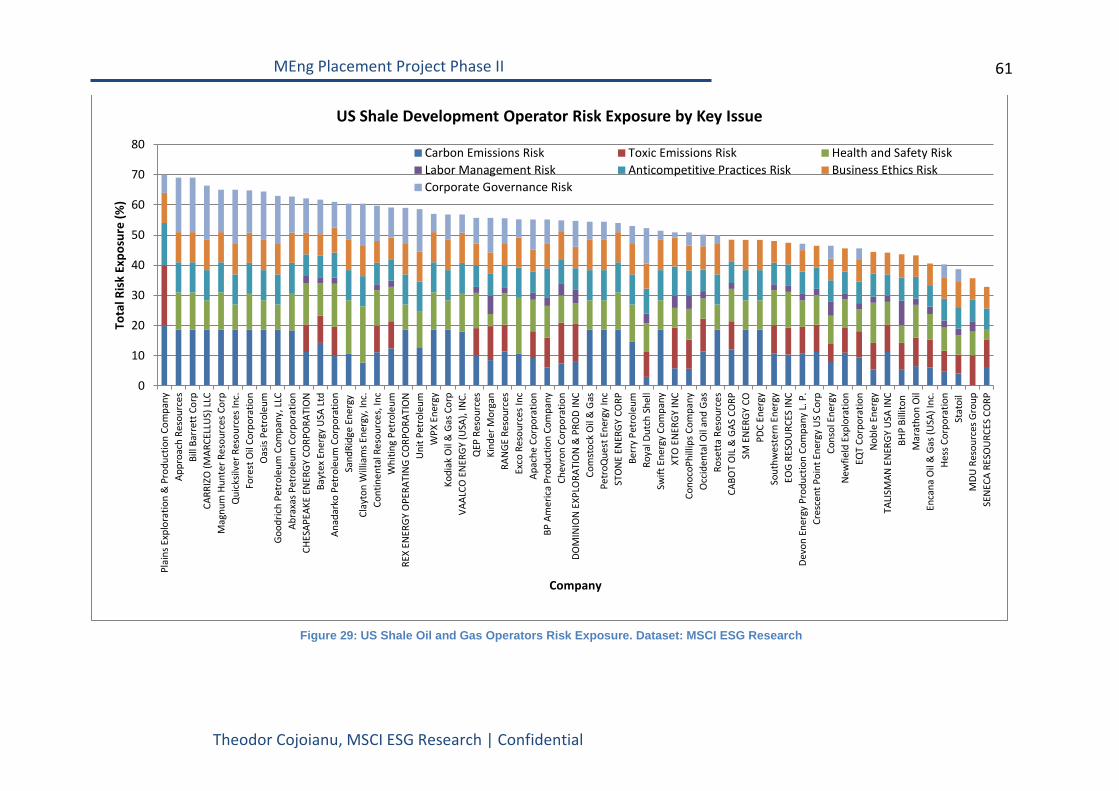
61
MEng Placement Project Phase II
Theodor Cojoianu, MSCI ESG Research | Confidential
Figure 29: US Shale Oil and Gas Operators Risk Exposure. Dataset: MSCI ESG Research
0
10
20
30
40
50
60
70
80Pl
ains
Exp
lora
tion
& P
rodu
ctio
n Co
mpa
nyAp
proa
ch R
esou
rces
Bill
Barr
ett C
orp
CARR
IZO
(MAR
CELL
US)
LLC
Mag
num
Hun
ter R
esou
rces
Cor
pQ
uick
silve
r Res
ourc
es In
c.Fo
rest
Oil
Corp
orat
ion
Oas
is Pe
trol
eum
Good
rich
Petr
oleu
m C
ompa
ny, L
LCAb
raxa
s Pet
role
um C
orpo
ratio
nCH
ESAP
EAKE
EN
ERGY
CO
RPO
RATI
ON
Bayt
ex E
nerg
y U
SA L
tdAn
adar
ko P
etro
leum
Cor
pora
tion
Sand
Ridg
e En
ergy
Clay
ton
Will
iam
s Ene
rgy,
Inc.
Cont
inen
tal R
esou
rces
, Inc
Whi
ting
Petr
oleu
mRE
X EN
ERGY
OPE
RATI
NG
CORP
ORA
TIO
NU
nit P
etro
leum
WPX
Ene
rgy
Kodi
ak O
il &
Gas
Cor
pVA
ALCO
EN
ERGY
(USA
), IN
C.Q
EP R
esou
rces
Kind
er M
orga
nRA
NGE
Res
ourc
esEx
co R
esou
rces
Inc
Apac
he C
orpo
ratio
nBP
Am
eric
a Pr
oduc
tion
Com
pany
Chev
ron
Corp
orat
ion
DOM
INIO
N E
XPLO
RATI
ON
& P
ROD
INC
Com
stoc
k O
il &
Gas
Petr
oQue
st E
nerg
y In
cST
ON
E EN
ERGY
CO
RPBe
rry
Petr
oleu
mRo
yal D
utch
She
llSw
ift E
nerg
y Co
mpa
nyXT
O E
NER
GY IN
CCo
noco
Phill
ips C
ompa
nyO
ccid
enta
l Oil
and
Gas
Rose
tta
Reso
urce
sCA
BOT
OIL
& G
AS C
ORP
SM E
NER
GY C
OPD
C En
ergy
Sout
hwes
tern
Ene
rgy
EOG
RESO
URC
ES IN
CDe
von
Ener
gy P
rodu
ctio
n Co
mpa
ny L
. P.
Cres
cent
Poi
nt E
nerg
y U
S Co
rpCo
nsol
Ene
rgy
New
field
Exp
lora
tion
EQT
Corp
orat
ion
Nob
le E
nerg
yTA
LISM
AN E
NER
GY U
SA IN
CBH
P Bi
llito
nM
arat
hon
Oil
Enca
na O
il &
Gas
(USA
) Inc
.He
ss C
orpo
ratio
nSt
atoi
lM
DU R
esou
rces
Gro
upSE
NEC
A RE
SOU
RCES
CO
RP
Tota
l Ris
k Ex
posu
re (%
)
Company
US Shale Development Operator Risk Exposure by Key Issue
Carbon Emissions Risk Toxic Emissions Risk Health and Safety RiskLabor Management Risk Anticompetitive Practices Risk Business Ethics RiskCorporate Governance Risk
62
MEng Placement Project Phase II
Theodor Cojoianu, MSCI ESG Research | Confidential
5.3 Conclusions and Critical Assessment In this chapter, an analysis was performed on the FracFocus National Chemical Registry database in
order to provide an overview of the extent to which hydraulic fracturing is employed in oil and gas
operations across the US. Furthermore, estimations on the water usage and wastewater volumes
from oil and gas wells within the boundaries of shale basins are provided and further enhanced by
robust wastewater figures from the case study on Pennsylvania. Finally, a risk exposure analysis is
performed on all shale oil and gas operators which are covered by MSCI ESG Research.
FracFocus started as an NGO led voluntary reporting platform in 2011 and become a mandatory
reporting platform for several states across the 2011 – 2013 period. The available dataset is hence a
result of mandatory and voluntary reporting patterns across different states which make the
FracFocus registry less effective and the analysed dataset less robust. However, the EPA uses the
dataset into its own study on hydraulic fracturing risks and mentions it is suitable for offering state
wide trends of hydraulic fracturing.
Using the geo-location of wells and Quantum GIS, a visual representation of the distribution of
hydraulically fractured wells is illustrated. Based on the well number and water usage estimations,
together with wastewater figures from Pennsylvania, wastewater volume estimations by state are
performed. Texas is by far the state with the largest wastewater management risks followed closely
by Pennsylvania. Arkansas and Michigan consistently underreport hydraulic fracturing volumes,
although historically have produced large amounts of shale gas relative to peers and FracFocus is a
mandatory disclosure platform for hydraulic fracturing volumes.
Last but not least, a shale operator benchmarking assessment was carried out by using MSCI ESG
Research proprietary data, and revealed the fact that the risk profile of shale operators is heavily
influenced by the environmental and carbon management practices and systems. Company
corporate governance practices, policies related to corruption, code of conduct reinforcements and
anti-competitive practices are all of high importance in the oil and gas sector. The lack of appropriate
corporate governance reinforcement systems puts companies at risk of operating irresponsibly,
negatively impacting the communities they are operating in or losing the chance to establish long
term relationships with industry partners.
63
MEng Placement Project Phase II
Theodor Cojoianu, MSCI ESG Research | Confidential
6 World Shale Gas Outlook
6.1 Introduction In this chapter, an overview of the global shale gas resource estimates is provided by comparing and
contrasting 5 studies[1, 14, 77-80] which provide different estimates for shale gas resources across
different regions. McGlade et al.’s methodology[79] is used to distinguish between the different
types of resource estimates and to provide a common ground for meaningful comparison. Finally,
the chapter presents the challenges countries excluding the US face in developing shale resources.
6.2 Shale Gas Estimates Definitions According to McGlade et al.[79] there are many inconsistencies in the methodologies which
aggregate unconventional gas resources, partly due to the inappropriate use of terminologies, which
were formerly used for conventional gas development. There are 5 main terminologies which are
currently used to define different estimates of unconventional gas resources: original gas in place
(OGIP), ultimately recoverable resources (URR), technically recoverable resources (TRR),
economically recoverable resources (ERR) and reserves. The latter term is further split into 3 types of
reserves depending on the probability of the estimation being exceeded by the actual value: proved
reserves (1P – 90% confidence interval), proved and probable reserves (2P – 50% confidence
interval) and probable and possible reserves (3P – 10%)[79, 81].
Original gas in place (OGIP) is quantified as the total volume estimated to be in a given play or
basin[79, 82] prior to development. A metric which characterises this estimate is the recovery factor,
which indicates the amount of OGIP which can be technically recovered. The recovery factor varies
by geography, geology and with technology improvement.
Ultimately recoverable reserves (URR) represent the aggregated sum of gas which is expected to be
produced from a region for a given timeframe, excluding technological or economical impediments.
Technically recoverable resources (TRR) is the term which refers to the gas which can be produced
using current technology but ignoring any economical constraints. TRR is the term that will be used
throughout this chapter when discussing regional and global estimations. Economically recoverable
reserves are a subset of TRR and are more sensitive to economical considerations but also more
speculative and less robust[79].
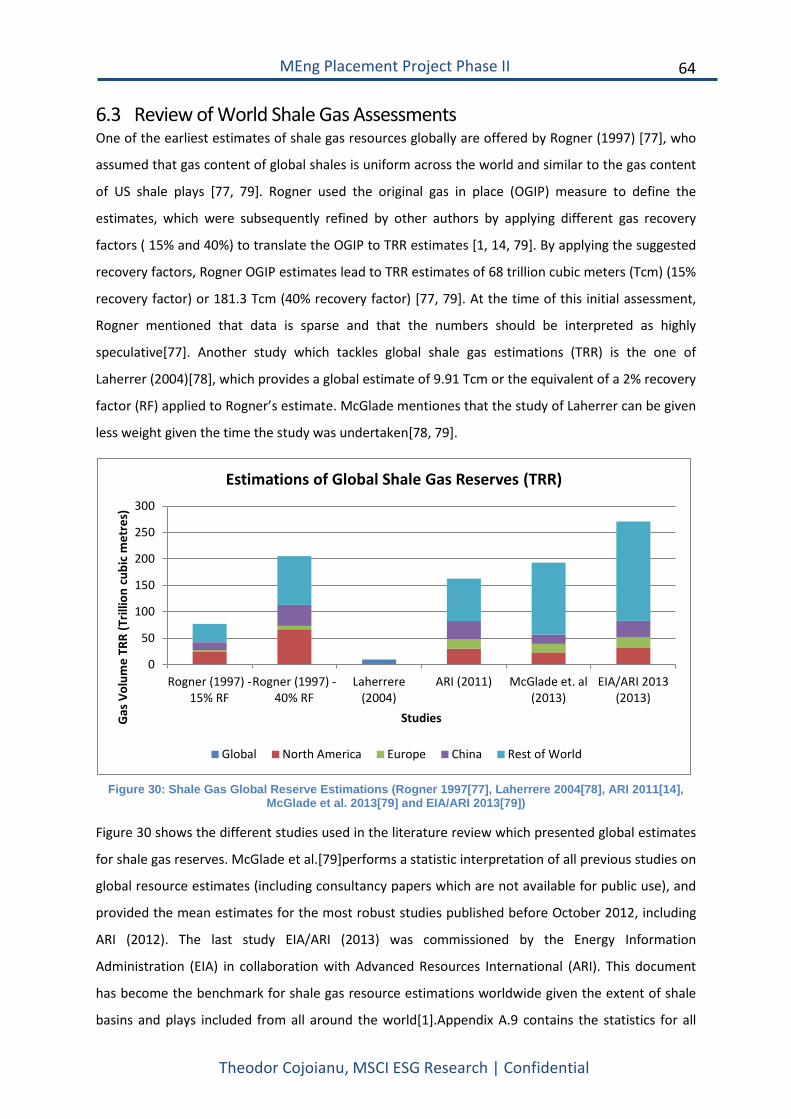
64
MEng Placement Project Phase II
Theodor Cojoianu, MSCI ESG Research | Confidential
6.3 Review of World Shale Gas Assessments One of the earliest estimates of shale gas resources globally are offered by Rogner (1997) [77], who
assumed that gas content of global shales is uniform across the world and similar to the gas content
of US shale plays [77, 79]. Rogner used the original gas in place (OGIP) measure to define the
estimates, which were subsequently refined by other authors by applying different gas recovery
factors ( 15% and 40%) to translate the OGIP to TRR estimates [1, 14, 79]. By applying the suggested
recovery factors, Rogner OGIP estimates lead to TRR estimates of 68 trillion cubic meters (Tcm) (15%
recovery factor) or 181.3 Tcm (40% recovery factor) [77, 79]. At the time of this initial assessment,
Rogner mentioned that data is sparse and that the numbers should be interpreted as highly
speculative[77]. Another study which tackles global shale gas estimations (TRR) is the one of
Laherrer (2004)[78], which provides a global estimate of 9.91 Tcm or the equivalent of a 2% recovery
factor (RF) applied to Rogner’s estimate. McGlade mentiones that the study of Laherrer can be given
less weight given the time the study was undertaken[78, 79].
Figure 30: Shale Gas Global Reserve Estimations (Rogner 1997[77], Laherrere 2004[78], ARI 2011[14],
McGlade et al. 2013[79] and EIA/ARI 2013[79])
Figure 30 shows the different studies used in the literature review which presented global estimates
for shale gas reserves. McGlade et al.[79]performs a statistic interpretation of all previous studies on
global resource estimates (including consultancy papers which are not available for public use), and
provided the mean estimates for the most robust studies published before October 2012, including
ARI (2012). The last study EIA/ARI (2013) was commissioned by the Energy Information
Administration (EIA) in collaboration with Advanced Resources International (ARI). This document
has become the benchmark for shale gas resource estimations worldwide given the extent of shale
basins and plays included from all around the world[1].Appendix A.9 contains the statistics for all
0
50
100
150
200
250
300
Rogner (1997) -15% RF
Rogner (1997) -40% RF
Laherrere(2004)
ARI (2011) McGlade et. al(2013)
EIA/ARI 2013(2013)
Gas
Vol
ume
TRR
(Tril
lion
cubi
c m
etre
s)
Studies
Estimations of Global Shale Gas Reserves (TRR)
Global North America Europe China Rest of World
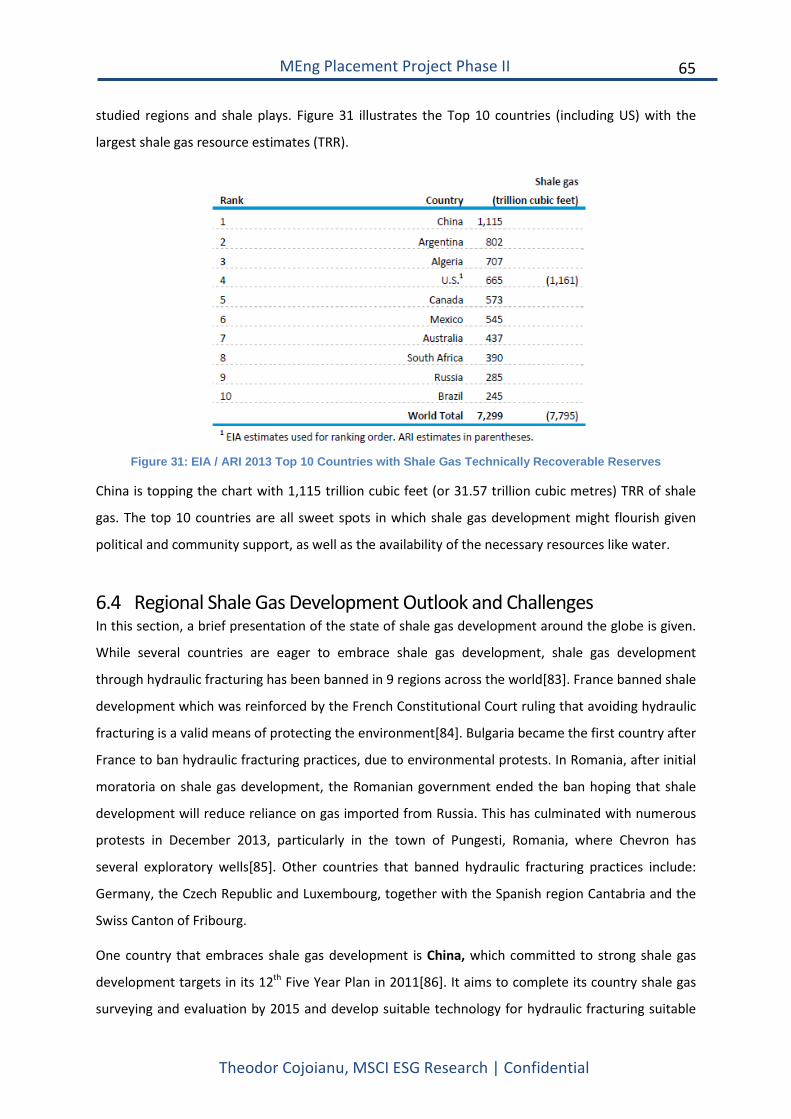
65
MEng Placement Project Phase II
Theodor Cojoianu, MSCI ESG Research | Confidential
studied regions and shale plays. Figure 31 illustrates the Top 10 countries (including US) with the
largest shale gas resource estimates (TRR).
Figure 31: EIA / ARI 2013 Top 10 Countries with Shale Gas Technically Recoverable Reserves
China is topping the chart with 1,115 trillion cubic feet (or 31.57 trillion cubic metres) TRR of shale
gas. The top 10 countries are all sweet spots in which shale gas development might flourish given
political and community support, as well as the availability of the necessary resources like water.
6.4 Regional Shale Gas Development Outlook and Challenges In this section, a brief presentation of the state of shale gas development around the globe is given.
While several countries are eager to embrace shale gas development, shale gas development
through hydraulic fracturing has been banned in 9 regions across the world[83]. France banned shale
development which was reinforced by the French Constitutional Court ruling that avoiding hydraulic
fracturing is a valid means of protecting the environment[84]. Bulgaria became the first country after
France to ban hydraulic fracturing practices, due to environmental protests. In Romania, after initial
moratoria on shale gas development, the Romanian government ended the ban hoping that shale
development will reduce reliance on gas imported from Russia. This has culminated with numerous
protests in December 2013, particularly in the town of Pungesti, Romania, where Chevron has
several exploratory wells[85]. Other countries that banned hydraulic fracturing practices include:
Germany, the Czech Republic and Luxembourg, together with the Spanish region Cantabria and the
Swiss Canton of Fribourg.
One country that embraces shale gas development is China, which committed to strong shale gas
development targets in its 12th Five Year Plan in 2011[86]. It aims to complete its country shale gas
surveying and evaluation by 2015 and develop suitable technology for hydraulic fracturing suitable
66
MEng Placement Project Phase II
Theodor Cojoianu, MSCI ESG Research | Confidential
for China’s geology. According to Bloomberg[87], the Chinese Ministry of Land and Resources
declared that shale gas production in China surged from 60 million cubic meters in 2012 to 200
million cubic meters in 2013. According to research from MSCI ESG Research[88], PetroChina and
Sinopec, 2 state owned oil and gas companies, are most likely to benefit by shale gas development in
China, however, given their track record of multiple environmental and corruption related
allegations, their operations are likely to have a big environmental and social impact.
In the UK(26 tcf TRR shale gas - Appendix A.9.), 97 Petroleum Exploration and Development licences
were awarded for shale gas exploration in the UK. A further licensing round is due in the summer of
2014, where companies like Total, GDF Suez and Centrica are interested to take part in[89]. So far,
Cuadrilla, a UK shale gas exploration and production company, was in the spotlight particularly after
the seismic events caused by its hydraulic fracturing operations in the Bowland Basin in
Lancashire[90]. In Wales, drilling permission was given to Coastal Oil and Gas Ltd., but not for
hydraulic fracturing. In Scotland, the Scottish Environment Protection Agency (SEPA) has detailed
how the regulatory process regarding shale gas and coal bed methane is handled jointly by SEPA and
DECC, however hydraulic fracturing is yet to be employed in Scotland[91]. For environmentally
sound shale development practices, the Royal Academy of Engineering recommended that
Environmental Risk Assessments (ERA) should involve local communities and should be mandatory
for shale operations, considering the entire lifecycle of shale development. This would enhance the
public consultation process in environmental decision making which helps make better decisions and
avoid community opposition at a later stage[89, 92].
South Africa plans to issue its first shale gas exploration permits in the first quarter of 2014, after
having previously banned for a year any hydraulic fracturing operations[93]. The major challenges in
South Africa are related to water availability risks and conflict among water intensive industries like
mining, agriculture or shale gas development[41]. Shell, among other operators, has applied for
exploration permits in South Africa. The companies ESG risk exposure can be observed in Figure 29,
where the risk exposure of US operators is illustrated. Shell has a moderate risk exposure, however
it’s relatively high corporate governance risk indicates possible improper incentive structures and
board oversight which could lead to irresponsible company behaviour in the medium term.
67
MEng Placement Project Phase II
Theodor Cojoianu, MSCI ESG Research | Confidential
6.5 Conclusions In this chapter, a literature review on global shale gas estimates was presented. This has led to
choosing the best framework to present world shale gas development opportunities.
The most robust studies providing global shale estimations identified are the ones of McGlade et
al.[79] and the world shale resource estimate from Advanced Resource International and the US
Energy Information Administration[1, 14]. The ARI/EIA 2013 study is the most comprehensive study
to date and hence, it was chosen to provide the background statistics for discussion.
China is the country with the highest shale gas reserves (1,115 tcf) and it is looking to effective
deveplop its resources over the coming years. On the other hand, several countries like France and
Bulgaria banned shale development through hydraulic fracturing over environmental concerns.
These decisions were made before any major inquiry of the French or Bulgarian governments into
the particularities of hydraulic fracturing risks into their countries were undertaken.
In the UK, both DECC and the EPA, as well as other regulatory bodies, take a precautionary approach
to shale wells permitting. Several shale sites across the UK are currently permitted, however no
major uptake in production is noticed, given the wide public perception that hydraulic fracturing
cannot be developed responsibly[90].
Companies who are likely to benefit from shale gas development across multiple countries are large
integrated oil and gas companies, who have the experience of shale development in the United
States, who have a global presence and who have strong community relations programs[5].
68
MEng Placement Project Phase II
Theodor Cojoianu, MSCI ESG Research | Confidential
7 Conclusions In Chapter 2, a comprehensive literature review together with an insight into shale gas research
trends and funding were discussed. The literature review focused on 4 key areas: economic impact
of shale development, water and wastewater risks and impacts, air and carbon risks and company
litigation and reputational risks.
Shale gas had a big impact on US natural gas prices which have fallen to a historical low. The shale
gas industry has profound effects on other industries such as the chemical industry, as well as US
economic growth. The scale at which the industry is developing emphasises the potential for long
term job creation that benefits society. Global gas prices are yet to be affected given the fact that
the global gas market is more fragmented.
Most shale gas controversies are related to water usage and wastewater management. Carbon
emissions are also important given the threat of climate change. In this respect, shale gas has a big
water footprint and according to Cornell University, it should not be considered a transition fuel
towards a low carbon economy given its estimated carbon footprint which surpasses coal.
Companies are facing high operational risks due to community opposition, litigation and large
environmental footprint.
The Pennsylvania case study comprised in Chapter 3 exposed shale gas industry production,
wastewater management and company violations statistics. The number of unconventional well
permits has surpassed those awarded for conventional oil and gas development and in addition,
shale gas production volumes are 7 times higher than conventional gas production volumes. On the
other hand, the cumulative unconventional wastewater volumes in PA have been 6 times larger than
wastewater coming from conventional oil and gas activities. On average, the wastewater per gas
produced ratio in unconventional wells is lower than conventional ones.
Given the constraints that the PA DEP is facing in terms of staffing numbers, it is challenging to have
good inspection coverage of both conventional and unconventional wells. Hence, over 80% of active
wells remain uninspected during the year, which can potentially have major impacts on the
environment. The number of fines awarded for company wrongdoings are insignificant and do not
affect the financial wellbeing of the operators.
To continue with, the risk methodology in Chapter 4 has effectively highlighted the leaders and
laggards in Pennsylvania shale gas development together with insights on the company risk profile.
Companies with higher risk exposure in Pennsylvania shale gas development tend to have a poorer
69
MEng Placement Project Phase II
Theodor Cojoianu, MSCI ESG Research | Confidential
wastewater to gas production ratio which leads to higher wastewater management costs
Furthermore, small companies who are 100% invested in shale gas operations tend to have less
experience into managing risks and face the highest risk exposure, while large integrated oil and gas
producers are able to diversify their operations across different counties in Pennsylvania, where
historically there have been sweet spots for gas production and suitable wastewater infrastructure.
In Chapter 5, an analysis was performed on the FracFocus National Chemical Registry database in
order to provide an overview of the extent to which hydraulic fracturing is employed in oil and gas
operations across the US. Furthermore, estimations on the water usage and wastewater volumes
from oil and gas wells within the boundaries of shale basins were provided and further enhanced by
robust wastewater figures from the case study on Pennsylvania. Finally, data from MSCI ESG
Research was used to provide a risk exposure assessment of US shale operators. Company
environmental management together with corporate governance systems come out as the main
differentiators in shale gas risk exposure.
Chapter 6 provides a framework for global shale gas resource estimation which supports the
discussion regarding the outlook of shale gas in shale plays outside the US. While hydraulic fracturing
has been banned in several countries like France and Bulgaria, China prepares to embrace the shale
gas revolution and hopes to replicate the shale gas production success from the US.
To conclude with, the MEng thesis has successfully reached its core aims: to provide a compelling
literature review on shale gas development risks and opportunities, to assess both company and
shale industry risk exposure (water risks and industry violations) and opportunity (production), to
identify leaders and laggards based on specific metrics and scores and finally, to provide a top level
discussion on shale gas development in other countries.
70
MEng Placement Project Phase II
Theodor Cojoianu, MSCI ESG Research | Confidential
8 Statement of Achievement The overall placement at MSCI ESG Research has been highly rewarding and has allowed me to make
a great contribution towards both the thesis research and other company projects. Below, a more
detailed account of my achievements and working projects is provided:
Undertook the thesis work on shale gas development and hydraulic fracturing which
involved doing extensive research, database analysis, learning and becoming proficient in
Quantum GIS Analysis as well as improving Excel analysis and modelling tools.
Designed and implemented a risk assessment company methodology.
Designed and published comprehensive maps
Participated in a MSCI client call and presented the initial research insights
Participated in shale gas and energy finance conferences
Liaised with different industry bodies for datasets: FracTracker Alliance, Ground Water
Protection Council, Advanced Resources International.
Established valuable industry contacts: MSCI ESG Research team, SGH Martineau, Ricardo
AEA, Royal HaskoningDHV, JP Morgan Asset Management, Climate Change Capital.
Assisted with a MSCI wide client engagement project which was presented to the CEO Henry
Fernandez.
Created a dashboard which analyses MSCI webinar and seminar participation statistics
Co-led the design and implementation of the way Request for Proposals (RFPs) are dealt
with in the MSCI ESG Research business unit.
71
MEng Placement Project Phase II
Theodor Cojoianu, MSCI ESG Research | Confidential
References
[1] EIA, "Technically Recoverable Shale Oil and Shale Gas Resources: An Assessment of 137 Shale Formations in 41 Countries Outside the United States," ed. http://www.eia.gov/analysis/studies/worldshalegas/pdf/fullreport.pdf?zscb=90018584: US Energy Information Administration, 2013.
[2] Handbook. (2013, 10 August 2013). MEng 4th Year Handbook, The University of Edinburgh. Available: https://www.eng.ed.ac.uk/drupal/sites/default/files/Electrical%204th%20Year%202012-13%20FINAL(1).pdf
[3] UNPRI, "Collaborative Engagement on Fracking," www.unpri.org (provided upon request)2013.
[4] UNPRI, "Collaborative Engagement on Fracking - Research Findings ", Global WebinarNovember 2013. [5] S. L. Block, Linda E.; Sasarean, Dana, "Shale Gas and Hydraulic Fracturing
in the US: Opportunity or Underestimated Risk?," MSCI ESG Research, http://www.msci.com/resources/pdfs/Unconventional%20Oil%20%20Gas_Article_October%202011.pdf2011.
[6] Sustainalytics, "Fracking Under Pressure:The Environmental, Social Impacts and Risks of Shale Gas Development," http://www.sustainalytics.com/sites/default/files/unconventional-fossil-fuel-shalegas_final.pdf2011.
[7] QuantumGIS 1.8 Lisboa. (2013). Open Source Geographical Information System Software.
[8] Elsevier. (2013, December 2013). Scopus Database. [9] T. F. Cojoianu, "Shale Gas and Hydraulic Fracturing: Risk and Opportunity
Analysis for Oil and Gas Companies, Investors and the Future Energy Sector - Lessons from the US," MEng Project Phase I Thesis, vol. School of Engineering, The University of Edinburgh, 13 August 2013 2013.
[10] MIT, "The Future of Natural Gas," The Massachusetts Institute of Technology, http://mitei.mit.edu/publications/reports-studies/future-natural-gas6 June 2011 2011.
[11] A. GDAC; Ingraffea, "Facts on Fracking. Presentation hosted by the Gas Drilling Awareness Coalition (GDAC)," ed, 2011.
[12] M. Finkel, J. Hays, and A. Law, "The Shale Gas Boom and the Need for Rational Policy," American Journal of Public Health, vol. 103, pp. 1161-1163, 2013.
[13] H. J. Wiseman, "RISK AND RESPONSE IN FRACTURING POLICY," University of Colorado Law Review, vol. 84, p. 729, Summer2013 2013.
72
MEng Placement Project Phase II
Theodor Cojoianu, MSCI ESG Research | Confidential
[14] Advanced Resources International, "World Shale Gas Resources: An Initial Assessment of 14 Regions Outside the United States ", http://www.adv-res.com/pdf/ARI%20EIA%20Intl%20Gas%20Shale%20APR%202011.pdf2011.
[15] R. A. Alvarez, S. W. Pacala, J. J. Winebrake, W. L. Chameides, and S. P. Hamburg, "Greater focus needed on methane leakage from natural gas infrastructure," Proceedings of the National Academy of Sciences, vol. 109, pp. 6435-6440, April 24, 2012 2012.
[16] A. M. Jaffe, "HOW Shale Gas IS GOING TO Rock the World," Wall Street Journal - Eastern Edition, vol. 255, pp. R1-R3, 2010.
[17] R. A. Kerr, "Natural Gas From Shale Bursts Onto the Scene," Science, vol. 328, pp. 1624-1626, 2010.
[18] P. L. Joskow, "Natural Gas: From Shortages to Abundance in the United States," American Economic Review, vol. 103, pp. 338-343, 2013.
[19] J. Deutch, "The Good News About Gas," Foreign Affairs, vol. 90, pp. 82-93, 2011.
[20] G. Rachman, "Shale gas will change the world," ed, 2010, p. 11. [21] R. Dobbs, J. Oppenheim, and F. Thompson. (2012) Mobilizing for a
resource revolution. 28. Available: http://ezproxy.lib.ed.ac.uk/login?url=https://search.ebscohost.com/login.aspx?direct=true&db=edsggo&AN=edsgcl.350706558&site=eds-live
[22] Q. Wang, X. Chen, A. N. Jha, and H. Rogers, "Natural gas from shale formation – The evolution, evidences and challenges of shale gas revolution in United States," Renewable and Sustainable Energy Reviews, vol. 30, pp. 1-28, 2014.
[23] J. L. Roeder, "What We Learned From the Oil Crisis of 1973: A 30-Year Retrospective," Bulletin of Science, Technology & Society, vol. 25, pp. 166-169, 2005.
[24] EIA, "Annual Energy Outlook," ed. http://www.eia.gov/forecasts/aeo/pdf/0383(2013).pdf: US Energy Information Administration, 2013.
[25] F. Asche, A. Oglend, and P. Osmundsen, "Gas versus oil prices the impact of shale gas," Energy Policy, vol. 47, pp. 117-124, 2012.
[26] R. De Bock and J. Gijón, Will natural gas prices decouple from oil prices across the pond?: Washington, DC, 2011.
[27] Energy information Administration (EIA), "Annual Energy Outlook," http://www.eia.gov/forecasts/aeo/pdf/0383(2012).pdf2012.
73
MEng Placement Project Phase II
Theodor Cojoianu, MSCI ESG Research | Confidential
[28] J. G. Weber, "The effects of a natural gas boom on employment and income in Colorado, Texas, and Wyoming," Energy Economics, p. 1580, 2012.
[29] IHS-CERA, "The Economic and Employment Contributions of Shale Gas in the United States," http://www.ihs.com/info/ecc/a/shale-gas-jobs-report.aspx2011.
[30] NYDEC, "Generic Environmental Impact Supplement to the Oil and Gas Regulatory Framework," D. o. E. Conservation, Ed., ed. http://www.dec.ny.gov/data/dmn/rdsgeisfull0911.pdf, 2011.
[31] T. Saba and M. Orzechowski, "Lack of data to support a relationship between methane contamination of drinking water wells and hydraulic fracturing," Proceedings Of The National Academy Of Sciences Of The United States Of America, vol. 108, p. E663, 2011.
[32] S. G. Osborn, A. Vengosh, N. R. Warner, and R. B. Jackson, "Methane contamination of drinking water accompanying gas-well drilling and hydraulic fracturing," Proceedings Of The National Academy Of Sciences Of The United States Of America, vol. 108, pp. 8172-8176, 2011.
[33] B. Rahm and S. Riha, "Toward strategic management of shale gas development: Regional, collective impacts on water resources," Environmental Science and Policy, vol. 17, pp. 12-23, 2012.
[34] C. E. Clark, A. J. Burnham, C. B. Harto, and R. M. Horner, "INTRODUCTION: The Technology and Policy of Hydraulic Fracturing and Potential Environmental Impacts of Shale Gas Development," Environmental Practice, vol. 14, pp. 249-261, 2012.
[35] B. D. Lutz, A. N. Lewis, and M. W. Doyle, "Generation, transport, and disposal of wastewater associated with Marcellus Shale gas development," Water Resources Research, vol. 49, pp. 647-656, 2013.
[36] ANL, "Hydraulic Fracturing and Shale Gas Production: Technology, Impacts, and Regulations " Argonne National Laboratory, http://www.afdc.energy.gov/uploads/publication/anl_hydraulic_fracturing.pdf2013.
[37] J. A. Veil and D. Environmental Science, "Water management technologies used by Marcellus Shale Gas Producers," ed, 2010.
[38] EC, "European Commission: Support to the identification of potential risks for the environment and human health arising from hydrocarbons operations involving hydraulic fracturing in Europe," ed. http://ec.europa.eu/environment/integration/energy/pdf/fracking%20study.pdf, 2012.
[39] A. Burnham, J. Han, C. E. Clark, M. Wang, J. B. Dunn, and I. Palou-Rivera, "Life-cycle greenhouse gas emissions of shale gas, natural gas, coal, and
74
MEng Placement Project Phase II
Theodor Cojoianu, MSCI ESG Research | Confidential
petroleum," Environmental Science & Technology, vol. 46, pp. 619-627, 2012.
[40] EPA, "Study of the Potential Impacts of Hydraulic Fracturing on Drinking Water Resources: Progress Report," US Environmental Protection Agency, http://www2.epa.gov/hfstudy2012.
[41] MSCI ESG Research, "Upstream and Downstream Impacts from a Well Running Dry," MSCI2013.
[42] N. R. Warner, R. B. Jackson, T. H. Darrah, S. G. Osborn, A. Down, K. Zhao, A. White, and A. Vengosh, "Geochemical evidence for possible natural migration of Marcellus Formation brine to shallow aquifers in Pennsylvania.(ENVIRONMENTAL SCIENCES)(Author abstract)(Report)," Proceedings of the National Academy of Sciences of the United States, p. 11961, 2012.
[43] Pennsylvania Department of Environmental Protection, "Shale Well Inspection Reports," PA DEP, http://www.portal.state.pa.us/portal/server.pt/community/marcellus_shale/202962013.
[44] US Environmental Protection Agency. (2013). Natural Gas Environmental Impacts.
[45] R. Howarth, R. Santoro, and A. Ingraffea, "Methane and the greenhouse-gas footprint of natural gas from shale formations," Climatic Change, vol. 106, pp. 679-690, 2011/06/01 2011.
[46] G. King, "Hydraulic Fracturing 101: What every Representative, Environmentalist, Regulator, Reporter, Investor, University Researcher, Neighbor and Engineer Should Know About Estimating Frac Risk and Improving Frac Performance in Unconventional Gas and Oil Wells.," Society of Petroleum Engineers, Apache Corporation, http://fracfocus.org/sites/default/files/publications/hydraulic_fracturing_101.pdf2012.
[47] C. Mackenzie, "SHALE GAS: A REVOLUTION FOR US ENERGY USERS," Scottish Widows Investment Partnership, http://www.swip.com/documents/sustainability-the-view-from-swip-may-2012/2012.
[48] T. J. Skone, "Life Cycle Greenhouse Gas Analysis of Natural Gas Extraction & Delivery in the United States," http://www.netl.doe.gov/energy-analyses/pubs/NG_LC_GHG_PRES_12MAY11.pdf2011.
[49] M. Fulton, "Comparing Lifecycle Greenhouse Gas Emissions from Natural Gas and Coal,"
75
MEng Placement Project Phase II
Theodor Cojoianu, MSCI ESG Research | Confidential
http://www.worldwatch.org/system/files/pdf/Natural_Gas_LCA_Update_082511.pdf , World Watch Institute, Deutsche Bank.2011.
[50] M. Jiang, W. M. Griffin, C. Hendrickson, P. Jaramillo, J. VanBriesen, and A. Venkatesh, "Life cycle greenhouse gas emissions of Marcellus shale gas," ENVIRONMENTAL RESEARCH LETTERS, vol. 6, p. 034014, 2011.
[51] IHS, "Mismeasuring Methane Report," http://www.ihs.com/products/cera/energy-report.aspx?id=10659316042011.
[52] PriceWaterhouseCoopers(PWC), "Low Carbon Economy Index: Carbon Budget gone by 2034?," http://www.pwc.co.uk/assets/pdf/low-carbon-economy-index-2013.pdf2013.
[53] IPCC - Intergovernmental Panel on Climate Change, "Climate Change 2013: The Physical Science Basis; Summary for Policy Makers," http://www.climatechange2013.org/images/uploads/WGI_AR5_SPM_brochure.pdf2013.
[54] Carbon Tracker, "Unburnable Carbon – Are the world’s financial markets carrying a carbon bubble?," http://www.carbontracker.org/wp-content/uploads/downloads/2011/07/Unburnable-Carbon-Full-rev2.pdf2012.
[55] E. L. Hagström and J. M. Adams, "Hydraulic Fracturing: Identifying and Managing the Risks," Environmental Claims Journal, vol. 24, pp. 93-115, 2012.
[56] Navigant Consulting, "Unconventional Oil and Gas Litigation Trends Report," http://www.navigant.com/~/media/WWW/Site/Insights/Energy/May%202013%20Unconventional%20Oil%20Gal%20Lit%20Trends%20Report.ashx2013.
[57] Earth Works Action, "Pennsylvania Oil and Gas Enforcement Inspections," http://www.earthworksaction.org/issues/detail/pennsylvania_oil_gas_enforcement_inspections#.UtQpPp5_u2E2012.
[58] Pennsylvania Department of Environmental Protection. (2013). Conventional and Unconventional Oila and Gas Production and Wastewater Datasets.
[59] Pennsylvania Department of Environmental Protection, "Policy for Implementing the Department of Environmental Protection (Department) Permit Review Process and Permit Decision Guarantee," http://files.dep.state.pa.us/ProgramIntegration/PermitDecisionGuaranteePortalFiles/021-2100-001_PRP_and_PDG_Policy.pdf2012.
76
MEng Placement Project Phase II
Theodor Cojoianu, MSCI ESG Research | Confidential
[60] Energy Information Administration (EIA), "Historical Energy Prices," http://www.eia.gov/dnav/ng/hist/n3035us3m.htm2013.
[61] American Petroleum Institute, "Hydraulic Fracturing Operations— Well Construction and Integrity Guidelines," http://www.api.org/~/media/Files/Policy/Exploration/API_HF1.ashx2009.
[62] M. E. Blauch, R. R. Myers, T. R. Moore, B. A. Lipinski, and N. A. Houston, "Marcellus shale post-frac flowback waters - Where is all the salt coming from and what are the implications?," 2009, pp. 221-240.
[63] Marcellus Shale Advisory Commision, "Governor’s Marcellus Shale Advisory Commission," http://www.mde.state.md.us/programs/Land/mining/marcellus/Documents/MSAC_Final_Report.pdf2011.
[64] D. Hopey, "DEP Seeks Cause of River Pollution," http://www.uppermon.org/news/Pgh-Alleg/PG-DEP_seeks-22Oct08.htm2008.
[65] J. W. Bryant, Thomas; Haggstrom, Johanna;, "Will flowback or produced water do?," http://www.epmag.com/Technology-Completion/Will-flowback-produced-water-do_658182010.
[66] MSCI, "MSCI ESG Research Intangible Value Assessment Methodology," MSCI ESG Manager - Available to MSCI clients and team members. 2013.
[67] A. Hoepner, "ESG Investments – a breath of fresh air for the portfolio," https://www.db.com/cr/en/concrete-esg-investments-a-breath-of-fresh-air-for-the-portfolio.htm2013.
[68] MSCI, "Global Industry Classification Standard (GICS)," http://www.msci.com/resources/factsheets/MSCI_Global_Industry_Classification_Standard.pdf2013.
[69] MSCI ESG REsearch, "Anadarko Petroleum Corporation Intangible Value Assessment Report," MSCI Proprietary Database2013.
[70] Anadarko Petroleum Corporation, "Anadarko Annual Report," http://www.anadarko.com/SiteCollectionDocuments/PDF/SEC%20Filings/Anadarko%2010-K.pdf2013.
[71] MSCI ESG Research, "Chesapeake Energy Corporation Intangible Value Assessment Report," MSCI Proprietary Database2013.
[72] FracFocus National Chemical Registry. (2013). [73] T. F. Cojoianu, "Private Communication with Sam Malone, officer at the
FracTracker Alliance.," ed, September 2013. [74] SkyTruth, "FracFocus Chemical Database 2010 - May 2013,"
http://skytruth.org/2013.
77
MEng Placement Project Phase II
Theodor Cojoianu, MSCI ESG Research | Confidential
[75] Harvard Law School, "Legal Fractures in Chemical Disclosures," http://blogs.law.harvard.edu/environmentallawprogram/files/2013/04/4-23-2013-LEGAL-FRACTURES.pdf2013.
[76] MSCI, "MSCI ESG Research Integrated Oil and Gas Industry Report," ESG Manager Platform - Avalaible to MSCI ESG Research clients and team members.2012.
[77] H.-H. Rogner, "AN ASSESSMENT OF WORLD HYDROCARBON RESOURCES," Annual Review of Energy and the Environment, vol. 22, pp. 217-262, 1997.
[78] J. Laherrer, "Natural Gas Future Supply," IIASSA -IEW; Paris, http://citeseerx.ist.psu.edu/viewdoc/download?doi=10.1.1.163.8630&rep=rep1&type=pdf2004.
[79] C. McGlade, J. Speirs, and S. Sorrell, "Unconventional gas – A review of regional and global resource estimates," Energy, vol. 55, pp. 571-584, 2013.
[80] World Energy Council, "Survey of Energy Resources: Focus on Shale Gas " World Energy Council Regency House 1-4 Warwick Street London W1B 5LT United Kingdom http://www.worldenergy.org/documents/shalegasreport.pdf2010.
[81] Society of Petroleum Engineers, "Petroleum Reserves Definitions," Society of Petroleum Engineers, http://www.spe.org/industry/docs/Petroleum_Reserves_Definitions_1997.pdf2013.
[82] Schlumberger, "Basin to Basin: Plate Tectonics in Exploration," Oilfield Review, vol. 24, 2012.
[83] Oil Patch Asia Editorial Team, "Nine countries or regions that ban fracking," in Oil Patch Asia ed. http://oilpatchasia.com/2013/10/9-countries-or-regions-that-ban-fracking/, 2013.
[84] T. Patel, "France’s Fracking Ban ‘Absolute’ After Court Upholds Law," in Bloomberg, October 2013 ed. http://www.bloomberg.com/news/2013-10-11/fracking-ban-upheld-by-french-court-as-constitutional.html, 2013.
[85] I. Savu, "Romania Ends Moratorium on Shale Gas Exploration, Premier Says," in Bloomberg vol. March 2013, ed. http://www.bloomberg.com/news/2013-03-19/romania-ends-moratorium-on-shale-gas-exploration-premier-says.html: Bloomberg, 2013.
[86] B. C. o. Commerce, "China 12th Five Year Plan (FYP) - English Version," http://www.britishchamber.cn/content/chinas-twelfth-five-year-plan-2011-2015-full-english-version2011.
78
MEng Placement Project Phase II
Theodor Cojoianu, MSCI ESG Research | Confidential
[87] J. Yang, "China’s 2013 Shale Gas Output Rises to 200 Million Cubic Meters," in Bloomberg, ed. http://www.bloomberg.com/news/2014-01-08/china-s-2013-shale-gas-output-rises-to-200-million-cubic-meters.html: Bloomberg, 2014.
[88] MSCI ESG Research, Sasarean Dana,, "Integrated Oil and Gas Report," MSCI.Inc, MSCI ESG Research Proprietary Report Database2012.
[89] RAENG. (2012, 5 August 2013). Royal Academy of Engineering: Shale gas extraction in the UK: a review of hydraulic fracturing.
[90] Cuadrilla Resources. (2011). Geomechanical Study Press Release. Available: http://www.cuadrillaresources.com/news/cuadrilla-news/article/press-release-geomechanical-study/
[91] Scottish Environmental Protection Agency (SEPA), "Unconventional Gas Guidance," SEPA, http://www.sepa.org.uk/system_pages/quicklinks_2/unconventional_gas_guidance.aspx2011.
[92] P. Stern, "Understanding Risk: Informing Decision Making in a Democratic Society," http://www.nap.edu/openbook.php?isbn=030905396X1996.
[93] K. Crowley, "South Africa to Issue Shale-Gas Permits in First Quarter of 2014," in Bloomberg, ed. http://www.bloomberg.com/news/2013-10-23/south-africa-to-issue-shale-gas-permits-in-first-quarter-of-2014.html: Bloomberg, 2013.
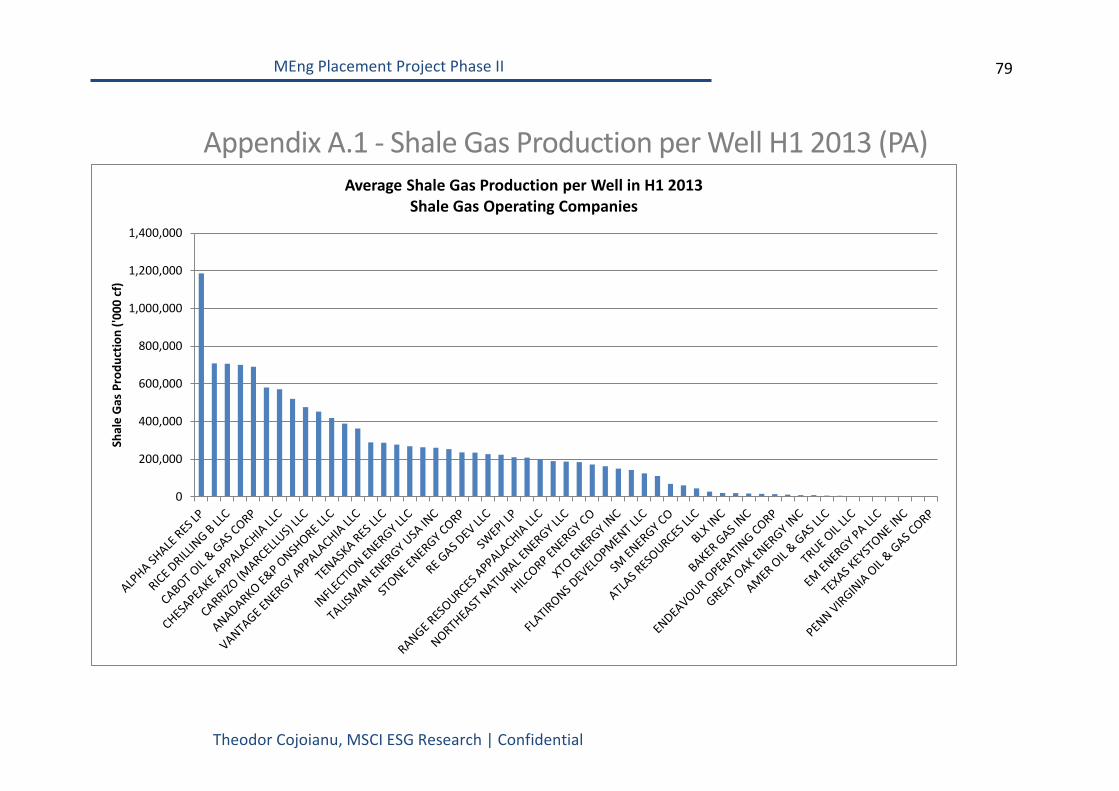
79
MEng Placement Project Phase II
Theodor Cojoianu, MSCI ESG Research | Confidential
Appendix A.1 - Shale Gas Production per Well H1 2013 (PA)
0
200,000
400,000
600,000
800,000
1,000,000
1,200,000
1,400,000
Shal
e G
as P
rodu
ctio
n ('0
00 c
f)
Average Shale Gas Production per Well in H1 2013 Shale Gas Operating Companies
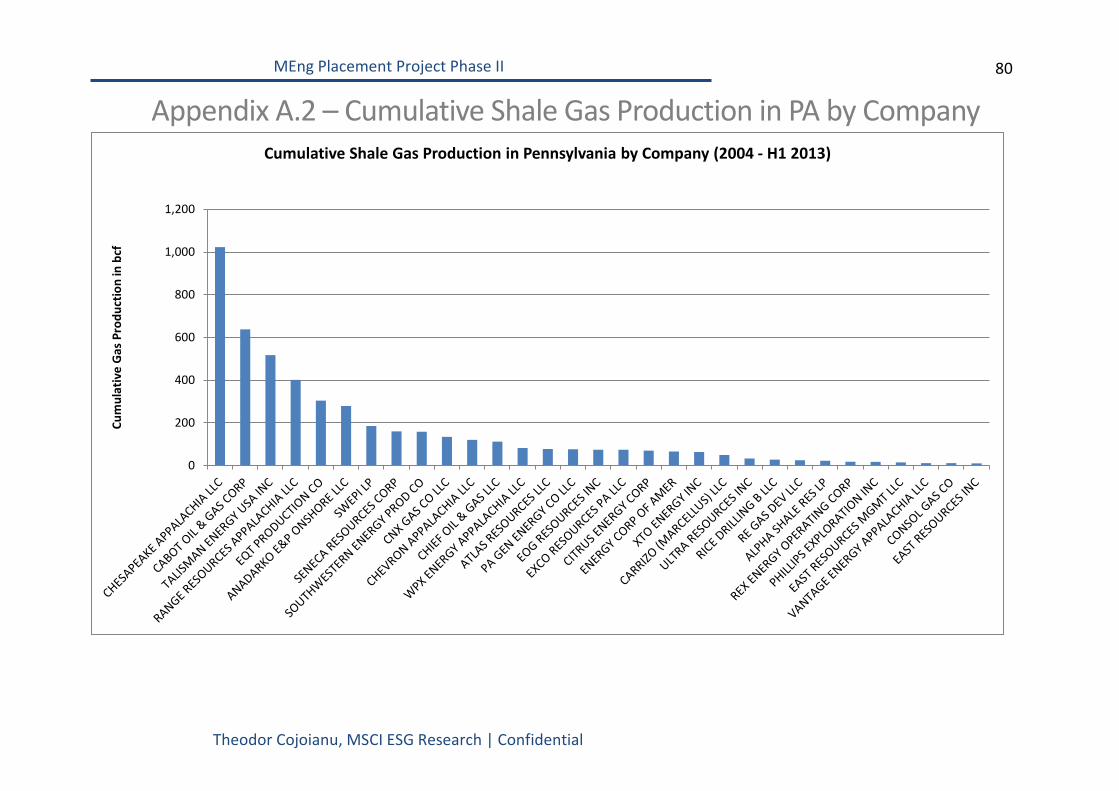
80
MEng Placement Project Phase II
Theodor Cojoianu, MSCI ESG Research | Confidential
Appendix A.2 – Cumulative Shale Gas Production in PA by Company
0
200
400
600
800
1,000
1,200
Cum
ulat
ive
Gas
Pro
duct
ion
in b
cf
Cumulative Shale Gas Production in Pennsylvania by Company (2004 - H1 2013)
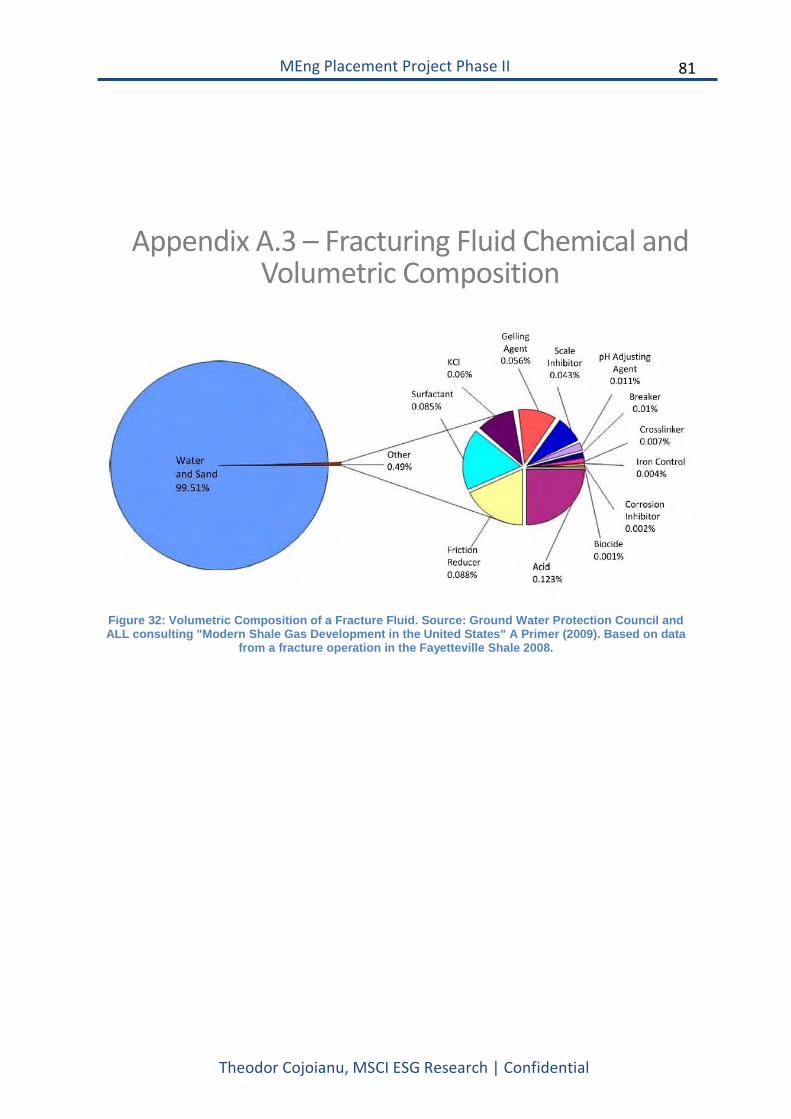
81
MEng Placement Project Phase II
Theodor Cojoianu, MSCI ESG Research | Confidential
Appendix A.3 – Fracturing Fluid Chemical and Volumetric Composition
Figure 32: Volumetric Composition of a Fracture Fluid. Source: Ground Water Protection Council and ALL consulting "Modern Shale Gas Development in the United States" A Primer (2009). Based on data
from a fracture operation in the Fayetteville Shale 2008.
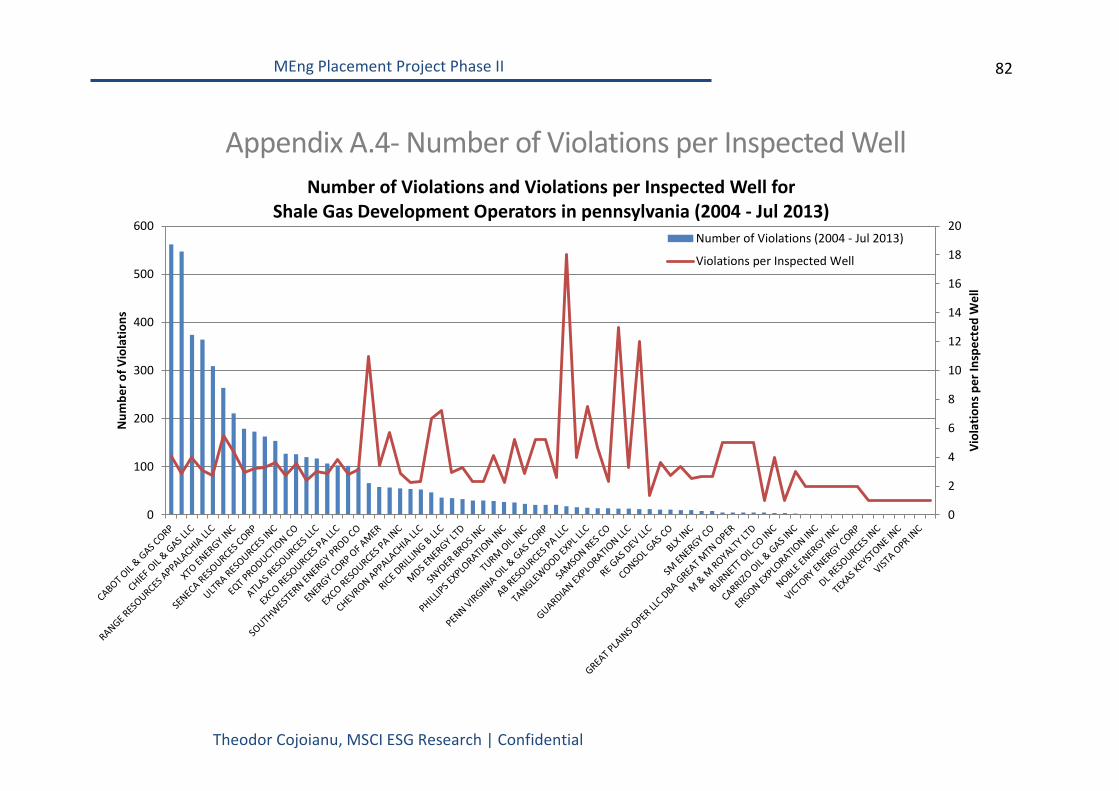
82
MEng Placement Project Phase II
Theodor Cojoianu, MSCI ESG Research | Confidential
Appendix A.4- Number of Violations per Inspected Well
0
2
4
6
8
10
12
14
16
18
20
0
100
200
300
400
500
600
Viol
atio
ns p
er In
spec
ted
Wel
l
Num
ber o
f Vio
latio
ns
Number of Violations and Violations per Inspected Well for Shale Gas Development Operators in pennsylvania (2004 - Jul 2013)
Number of Violations (2004 - Jul 2013)
Violations per Inspected Well
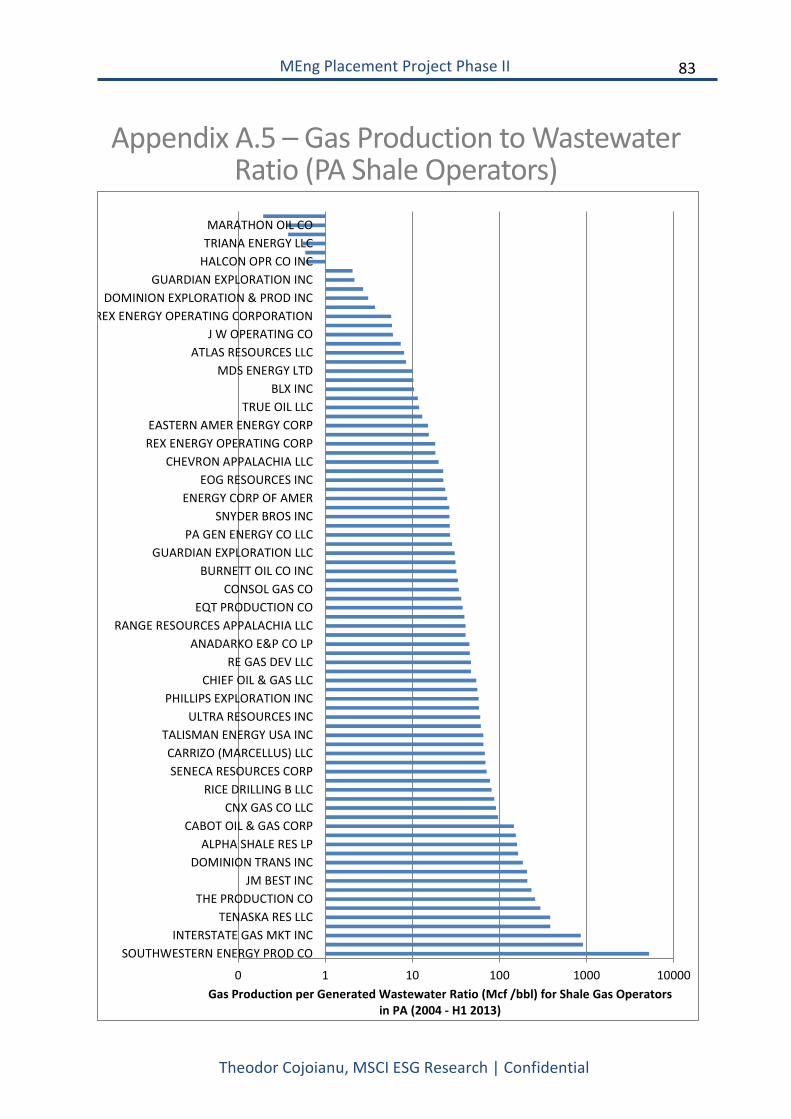
83
MEng Placement Project Phase II
Theodor Cojoianu, MSCI ESG Research | Confidential
Appendix A.5 – Gas Production to Wastewater Ratio (PA Shale Operators)
0 1 10 100 1000 10000
SOUTHWESTERN ENERGY PROD COINTERSTATE GAS MKT INC
TENASKA RES LLCTHE PRODUCTION CO
JM BEST INCDOMINION TRANS INC
ALPHA SHALE RES LPCABOT OIL & GAS CORP
CNX GAS CO LLCRICE DRILLING B LLC
SENECA RESOURCES CORPCARRIZO (MARCELLUS) LLC
TALISMAN ENERGY USA INCULTRA RESOURCES INC
PHILLIPS EXPLORATION INCCHIEF OIL & GAS LLC
RE GAS DEV LLCANADARKO E&P CO LP
RANGE RESOURCES APPALACHIA LLCEQT PRODUCTION CO
CONSOL GAS COBURNETT OIL CO INC
GUARDIAN EXPLORATION LLCPA GEN ENERGY CO LLC
SNYDER BROS INCENERGY CORP OF AMER
EOG RESOURCES INCCHEVRON APPALACHIA LLC
REX ENERGY OPERATING CORPEASTERN AMER ENERGY CORP
TRUE OIL LLCBLX INC
MDS ENERGY LTDATLAS RESOURCES LLC
J W OPERATING COREX ENERGY OPERATING CORPORATION
DOMINION EXPLORATION & PROD INCGUARDIAN EXPLORATION INC
HALCON OPR CO INCTRIANA ENERGY LLCMARATHON OIL CO
Gas Production per Generated Wastewater Ratio (Mcf /bbl) for Shale Gas Operators in PA (2004 - H1 2013)
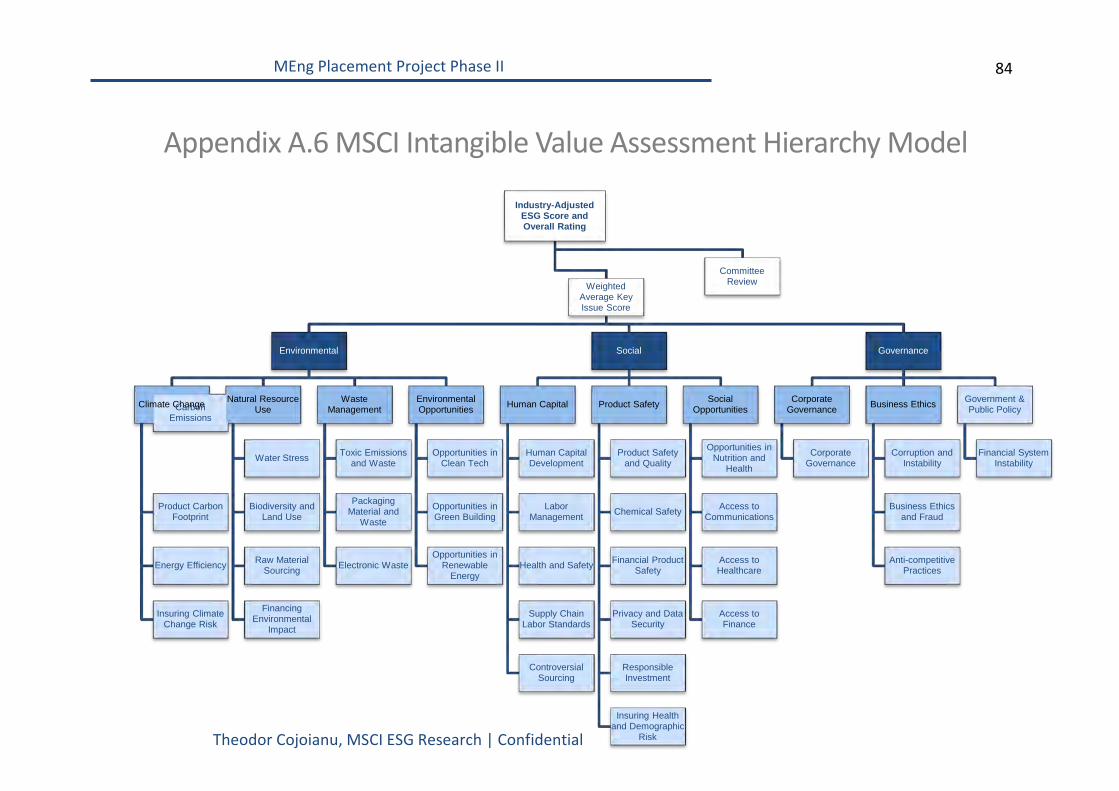
84
MEng Placement Project Phase II
Theodor Cojoianu, MSCI ESG Research | Confidential
Appendix A.6 MSCI Intangible Value Assessment Hierarchy Model
Industry-Adjusted ESG Score and Overall Rating
Committee Review Weighted
Average Key Issue Score
Environmental
Climate Change Carbon Emissions
Product Carbon Footprint
Energy Efficiency
Insuring Climate Change Risk
Natural Resource Use
Water Stress
Biodiversity and Land Use
Raw Material Sourcing
Financing Environmental
Impact
Waste Management
Toxic Emissions and Waste
Packaging Material and
Waste
Electronic Waste
Environmental Opportunities
Opportunities in Clean Tech
Opportunities in Green Building
Opportunities in Renewable
Energy
Social
Human Capital
Human Capital Development
Labor Management
Health and Safety
Supply Chain Labor Standards
Controversial Sourcing
Product Safety
Product Safety and Quality
Chemical Safety
Financial Product Safety
Privacy and Data Security
Responsible Investment
Insuring Health and Demographic
Risk
Social Opportunities
Opportunities in Nutrition and
Health
Access to Communications
Access to Healthcare
Access to Finance
Governance
Corporate Governance
Corporate Governance
Business Ethics
Corruption and Instability
Business Ethics and Fraud
Anti-competitive Practices
Government & Public Policy
Financial System Instability
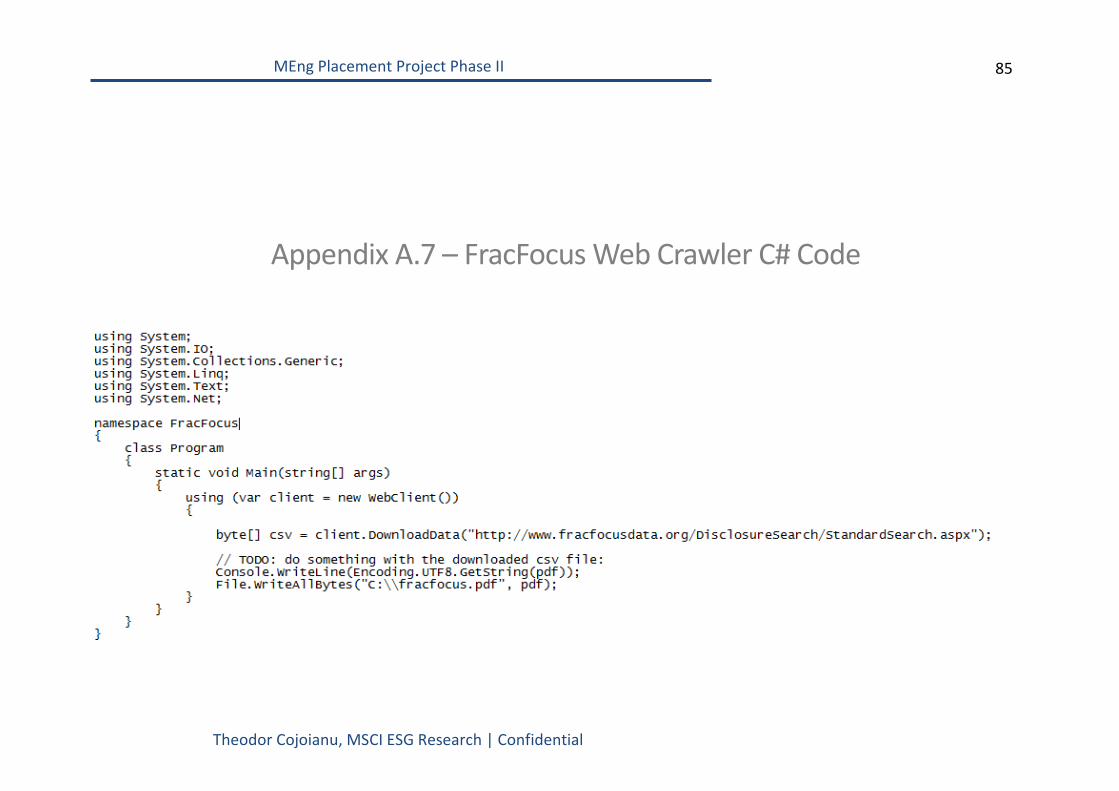
85
MEng Placement Project Phase II
Theodor Cojoianu, MSCI ESG Research | Confidential
Appendix A.7 – FracFocus Web Crawler C# Code
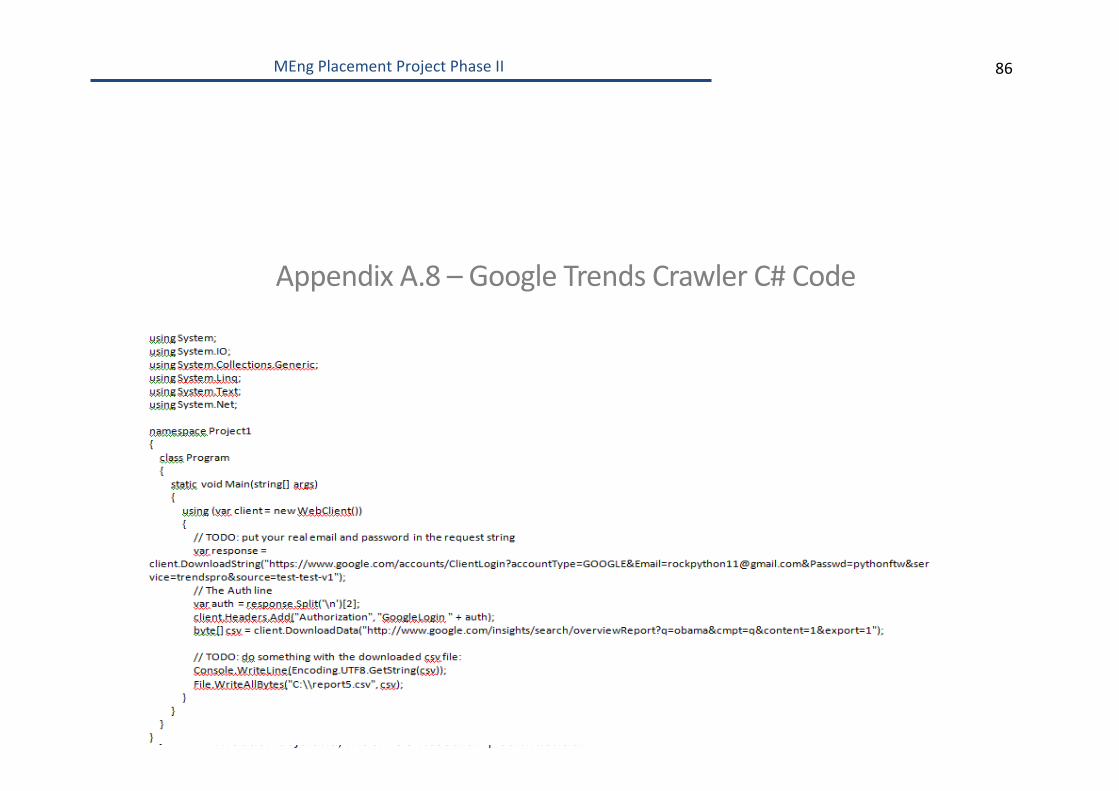
86
MEng Placement Project Phase II
Theodor Cojoianu, MSCI ESG Research | Confidential
Appendix A.8 – Google Trends Crawler C# Code
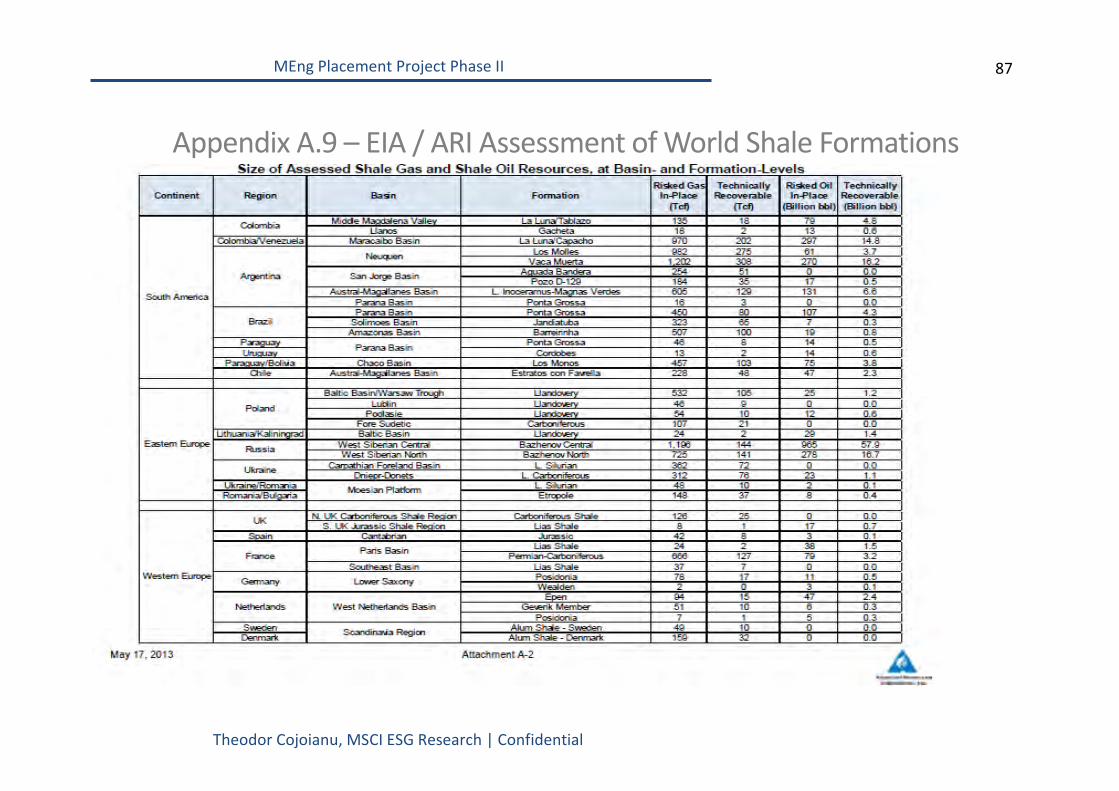
87
MEng Placement Project Phase II
Theodor Cojoianu, MSCI ESG Research | Confidential
Appendix A.9 – EIA / ARI Assessment of World Shale Formations
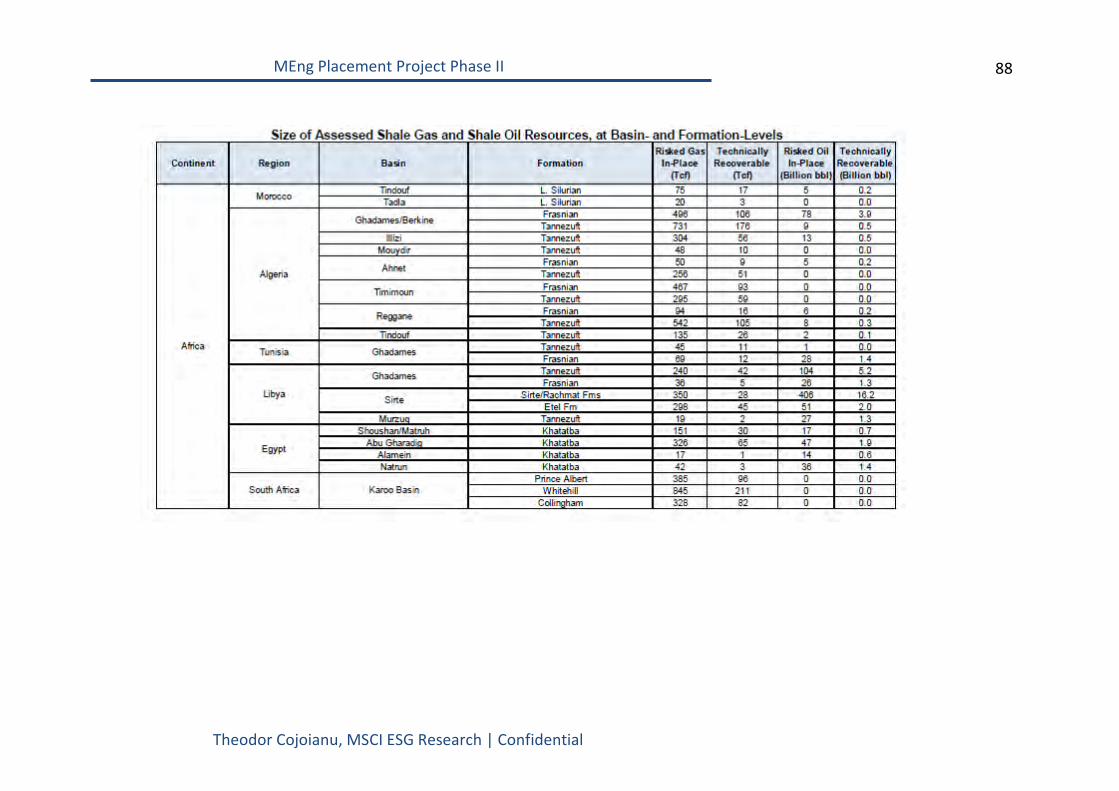
88
MEng Placement Project Phase II
Theodor Cojoianu, MSCI ESG Research | Confidential
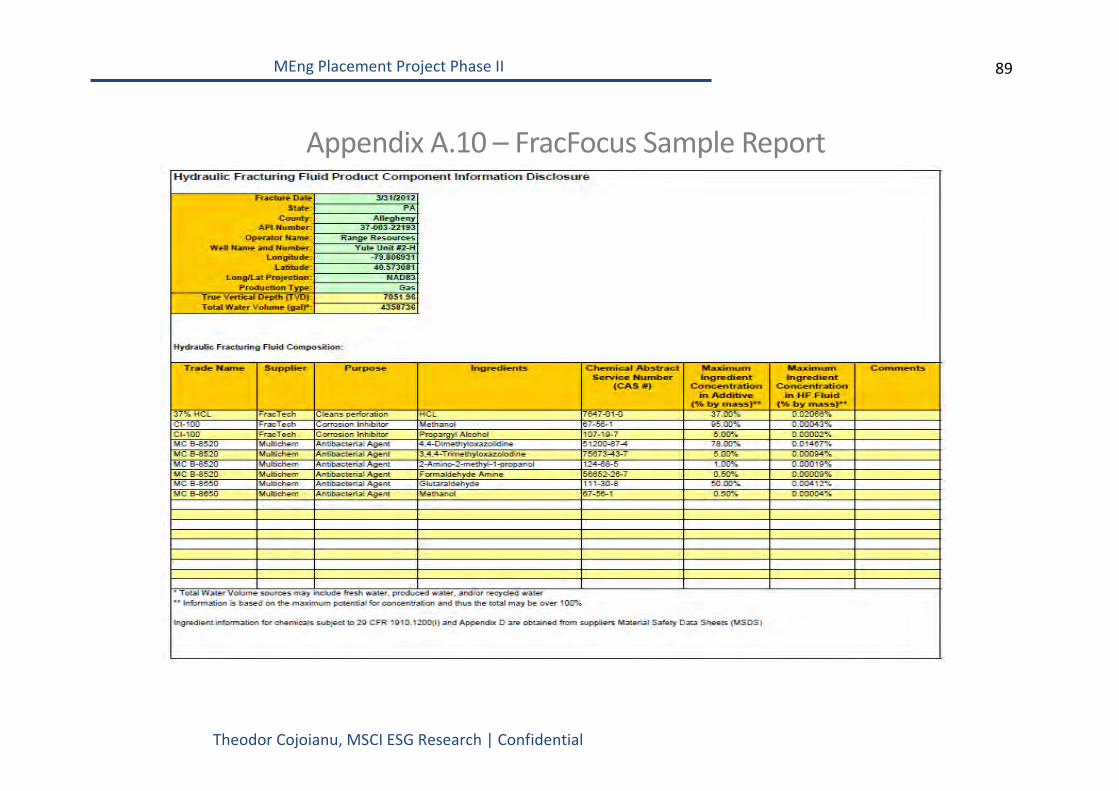
89
MEng Placement Project Phase II
Theodor Cojoianu, MSCI ESG Research | Confidential
Appendix A.10 – FracFocus Sample Report
Recommended