R Dhinesh kumar,M.E/AP/EEE Page 1
SEMBODAI RUKMANI VARATHARAJAN ENGINEERING COLLEGE,
SEMBODAI, NAGAPATTINAM.
DEPARTMENT OF ELECTRICAL AND ELECTRONICS ENGINEERING
III- Semester – B.E (EEE)
EE6511 CONTROL AND INSTRUMENTATION LABORATORY
Prepared by,
Mr.R.Dhinesh kumar M.E., AP/EEE
www.Vidyarthiplus.com
www.Vidyarthiplus.com
R Dhinesh kumar,M.E/AP/EEE Page 2
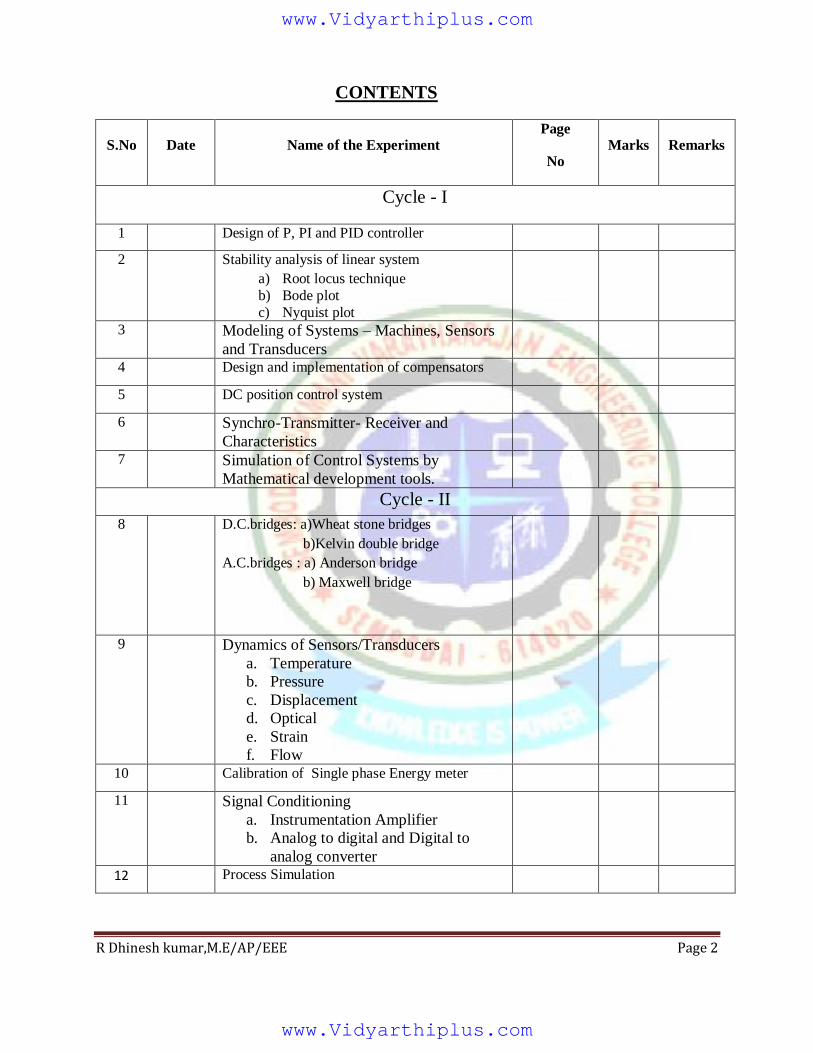
CONTENTS
S.No Date Name of the Experiment Page
No Marks Remarks
Cycle - I
1 Design of P, PI and PID controller
2 Stability analysis of linear system
a) Root locus technique
b) Bode plot
c) Nyquist plot
3 Modeling of Systems – Machines, Sensors
and Transducers
4 Design and implementation of compensators
5 DC position control system
6 Synchro-Transmitter- Receiver and
Characteristics
7 Simulation of Control Systems by
Mathematical development tools.
Cycle - II
8 D.C.bridges: a)Wheat stone bridges
b)Kelvin double bridge
A.C.bridges : a) Anderson bridge
b) Maxwell bridge
9 Dynamics of Sensors/Transducers
a. Temperature
b. Pressure
c. Displacement
d. Optical
e. Strain
f. Flow
10 Calibration of Single phase Energy meter
11 Signal Conditioning
a. Instrumentation Amplifier
b. Analog to digital and Digital to
analog converter
12 Process Simulation
www.Vidyarthiplus.com
www.Vidyarthiplus.com
R Dhinesh kumar,M.E/AP/EEE Page 3
INSTRUCTIONS TO THE STUDENTS
1. Candidates should come to the lab with proper uniform and good quality
leather shoes.
2. Punctuality and strict Discipline should be maintained.
3. Study and prepare well before entering into the lab.
4. Complete the observation after completion of the experiment in the lab
itself.
5. Be alert till the experiment is completed.
6. Make sure that the supply is OFF before touching any terminals.
7. Use proper rating equipments carefully, for which you are duly responsible.
8. Handle the equipments carefully, for which you are duly responsible.
9. Return all the components and make sure that nothing is left on the
worktable.
10. In case of any wrong observations you have to switch off the power supply
related with it.
11. Make series circuit connections before the parallel circuit like voltmeter
connections.
12. Don‟t use meter terminals as junctions and place them to read conveniently.
13. Check the rheostat positions and connections whether they have been
connected properly or not.
www.Vidyarthiplus.com
www.Vidyarthiplus.com
R Dhinesh kumar,M.E/AP/EEE Page 4
EX.NO.:
DATE:
DC BRIDGES
(A) WHEATSTONE BRIDGE
AIM:
To determine the value of unknown resistance using Wheatstone bridge.
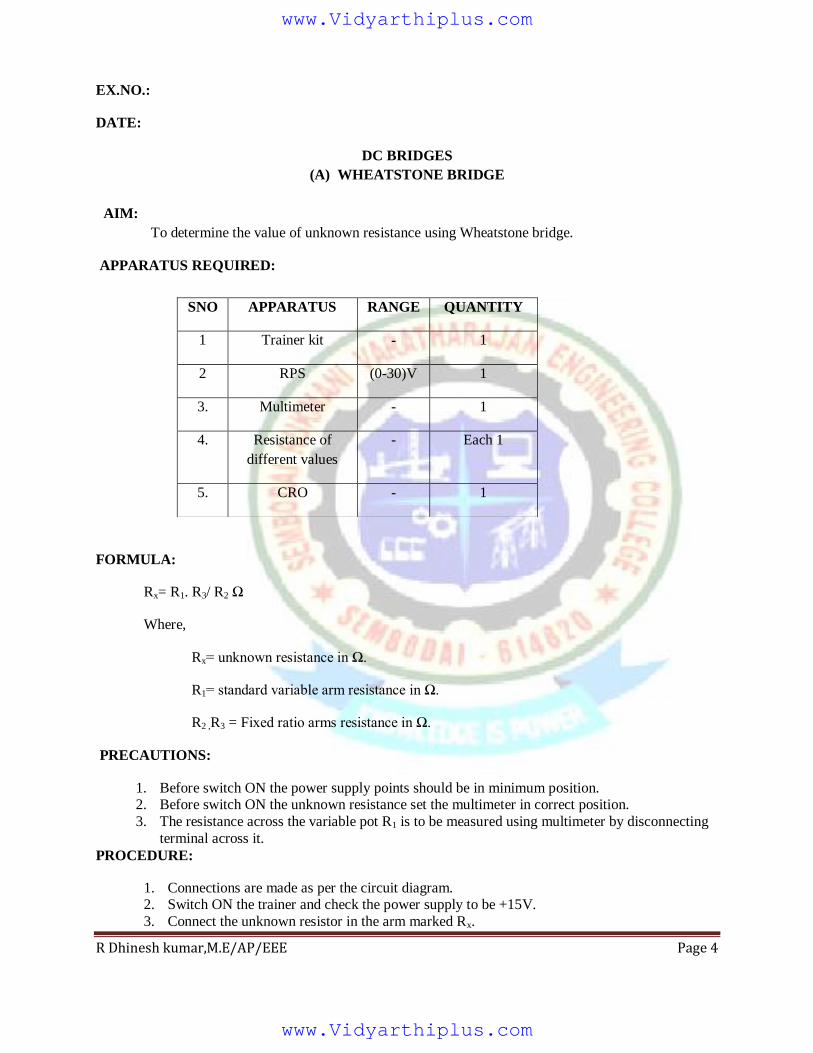
APPARATUS REQUIRED:
FORMULA:
Rx= R1. R3/ R2 Ω
Where,
Rx= unknown resistance in Ω.
R1= standard variable arm resistance in Ω.
R2 ,R3 = Fixed ratio arms resistance in Ω.
PRECAUTIONS:
1. Before switch ON the power supply points should be in minimum position. 2. Before switch ON the unknown resistance set the multimeter in correct position.
3. The resistance across the variable pot R1 is to be measured using multimeter by disconnecting
terminal across it.
PROCEDURE:
1. Connections are made as per the circuit diagram. 2. Switch ON the trainer and check the power supply to be +15V.
3. Connect the unknown resistor in the arm marked Rx.
SNO APPARATUS RANGE QUANTITY
1 Trainer kit - 1
2 RPS (0-30)V 1
3. Multimeter - 1
4. Resistance of
different values
- Each 1
5. CRO - 1
www.Vidyarthiplus.com
www.Vidyarthiplus.com
R Dhinesh kumar,M.E/AP/EEE Page 5
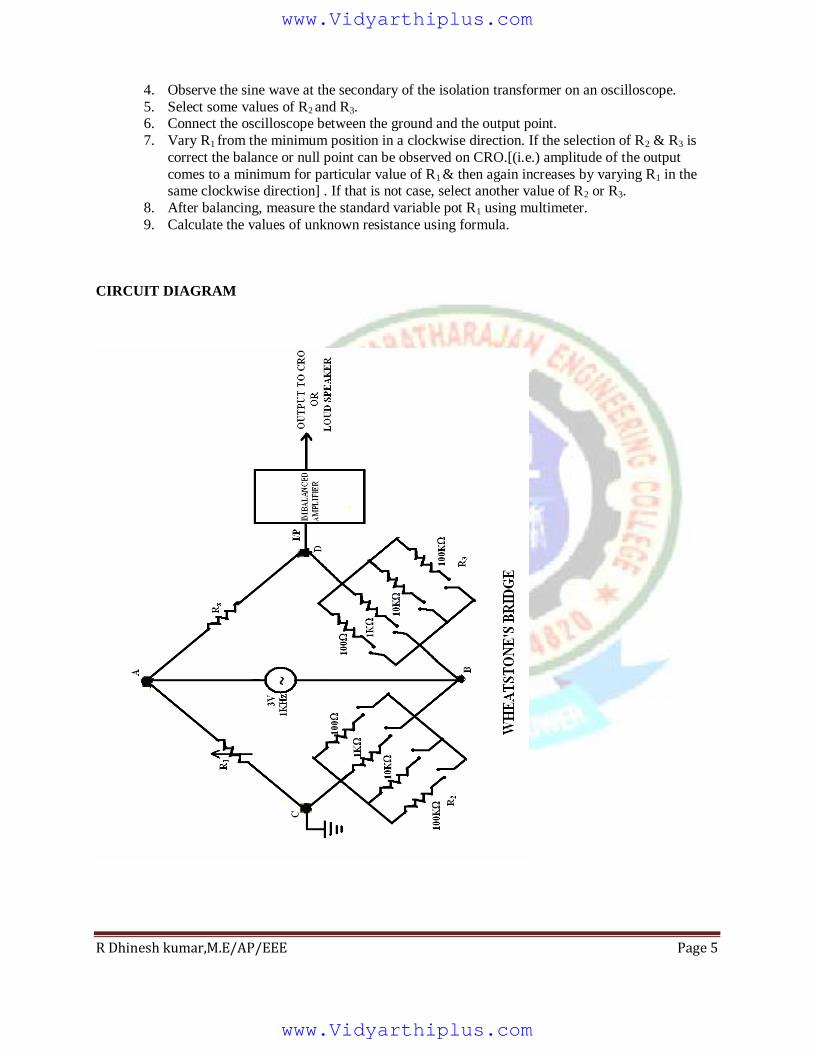
4. Observe the sine wave at the secondary of the isolation transformer on an oscilloscope.
5. Select some values of R2 and R3. 6. Connect the oscilloscope between the ground and the output point.
7. Vary R1 from the minimum position in a clockwise direction. If the selection of R2 & R3 is
correct the balance or null point can be observed on CRO.[(i.e.) amplitude of the output
comes to a minimum for particular value of R1 & then again increases by varying R1 in the same clockwise direction] . If that is not case, select another value of R2 or R3.
8. After balancing, measure the standard variable pot R1 using multimeter.
9. Calculate the values of unknown resistance using formula.
CIRCUIT DIAGRAM
www.Vidyarthiplus.com
www.Vidyarthiplus.com
R Dhinesh kumar,M.E/AP/EEE Page 6
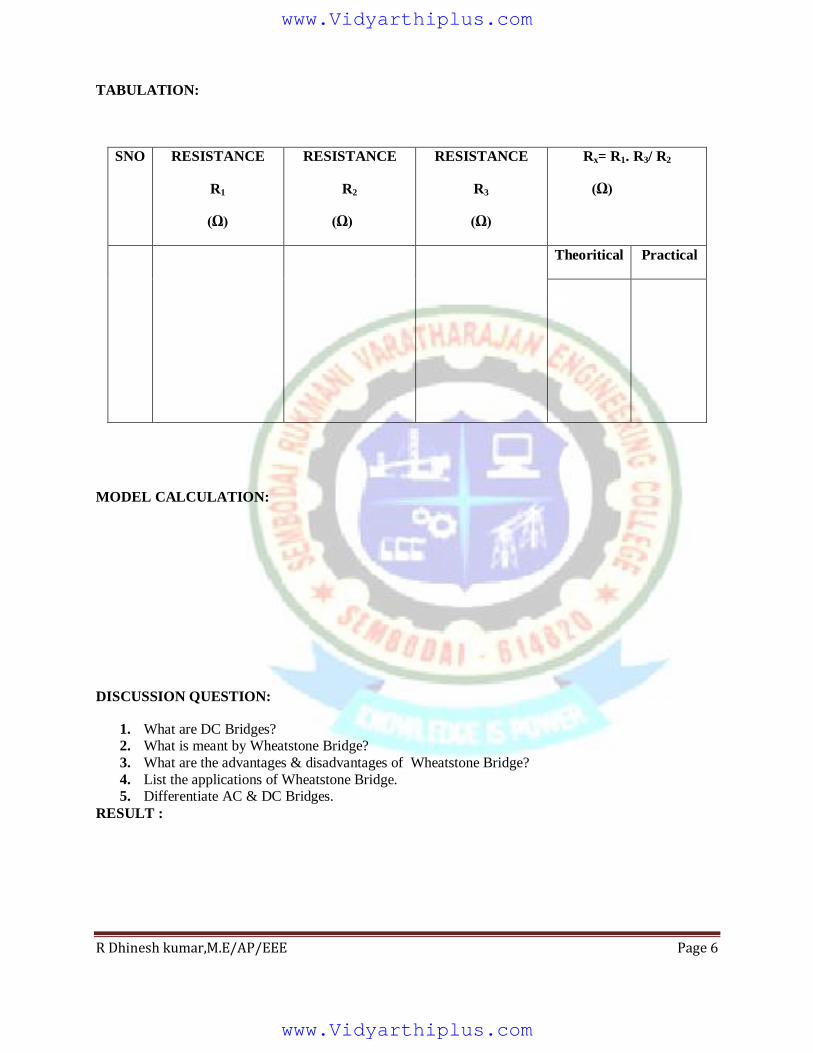
TABULATION:
SNO RESISTANCE
R1
(Ω)
RESISTANCE
R2
(Ω)
RESISTANCE
R3
(Ω)
Rx= R1. R3/ R2
(Ω)
Theoritical Practical
MODEL CALCULATION:
DISCUSSION QUESTION:
1. What are DC Bridges?
2. What is meant by Wheatstone Bridge?
3. What are the advantages & disadvantages of Wheatstone Bridge?
4. List the applications of Wheatstone Bridge. 5. Differentiate AC & DC Bridges.
RESULT :
www.Vidyarthiplus.com
www.Vidyarthiplus.com
R Dhinesh kumar,M.E/AP/EEE Page 7
EX.NO.:
DATE:
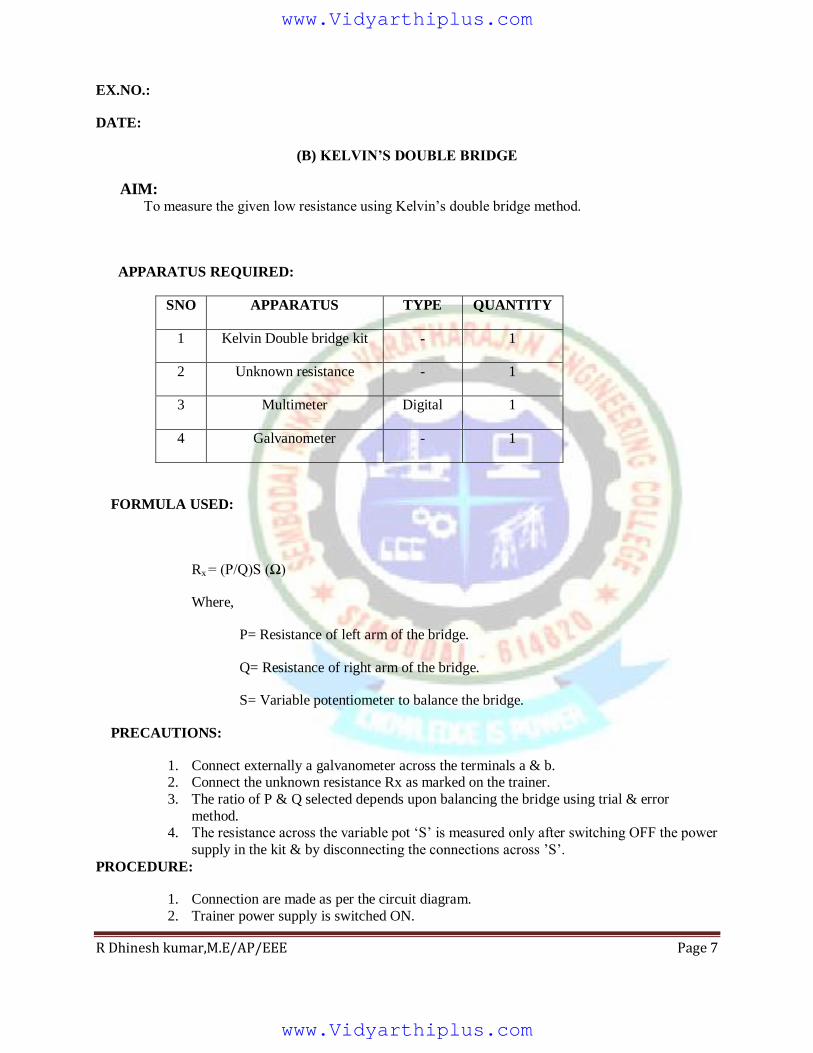
(B) KELVIN’S DOUBLE BRIDGE
AIM: To measure the given low resistance using Kelvin‟s double bridge method.
APPARATUS REQUIRED:
SNO APPARATUS TYPE QUANTITY
1 Kelvin Double bridge kit - 1
2 Unknown resistance - 1
3 Multimeter Digital 1
4 Galvanometer - 1
FORMULA USED:
Rx = (P/Q)S (Ω)
Where,
P= Resistance of left arm of the bridge.
Q= Resistance of right arm of the bridge.
S= Variable potentiometer to balance the bridge.
PRECAUTIONS:
1. Connect externally a galvanometer across the terminals a & b. 2. Connect the unknown resistance Rx as marked on the trainer.
3. The ratio of P & Q selected depends upon balancing the bridge using trial & error
method. 4. The resistance across the variable pot „S‟ is measured only after switching OFF the power
supply in the kit & by disconnecting the connections across ‟S‟.
PROCEDURE:
1. Connection are made as per the circuit diagram.
2. Trainer power supply is switched ON.
www.Vidyarthiplus.com
www.Vidyarthiplus.com
R Dhinesh kumar,M.E/AP/EEE Page 8
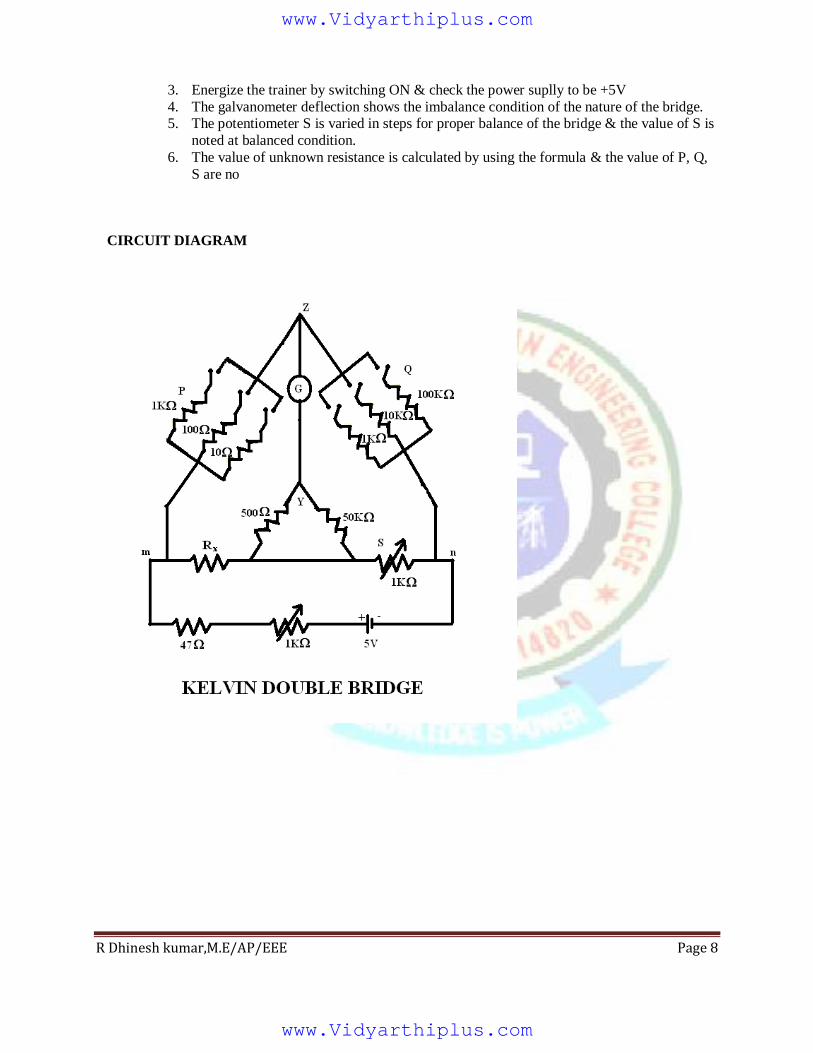
3. Energize the trainer by switching ON & check the power suplly to be +5V
4. The galvanometer deflection shows the imbalance condition of the nature of the bridge. 5. The potentiometer S is varied in steps for proper balance of the bridge & the value of S is
noted at balanced condition.
6. The value of unknown resistance is calculated by using the formula & the value of P, Q,
S are no
CIRCUIT DIAGRAM
www.Vidyarthiplus.com
www.Vidyarthiplus.com
R Dhinesh kumar,M.E/AP/EEE Page 9
TABULATION:
SL.NO. P
(Ω)
Q
(Ω)
S
(Ω)
Rx = (P/Q)S
(Ω)
MODEL CALCULATION:
www.Vidyarthiplus.com
www.Vidyarthiplus.com
R Dhinesh kumar,M.E/AP/EEE Page 10
DISCUSSION QUESTION:
1. What is meant by Kelvin double bridge?
2. List the advantages & disadvantages of Kelvin double bridge.
3. What are applications of Kelvin double bridge? 4. Differentiate Wheatstone bridge & Kelvin double bridge.
RESULT:
www.Vidyarthiplus.com
www.Vidyarthiplus.com
R Dhinesh kumar,M.E/AP/EEE Page 11
EX.NO.:
DATE:
AC BRIDGES
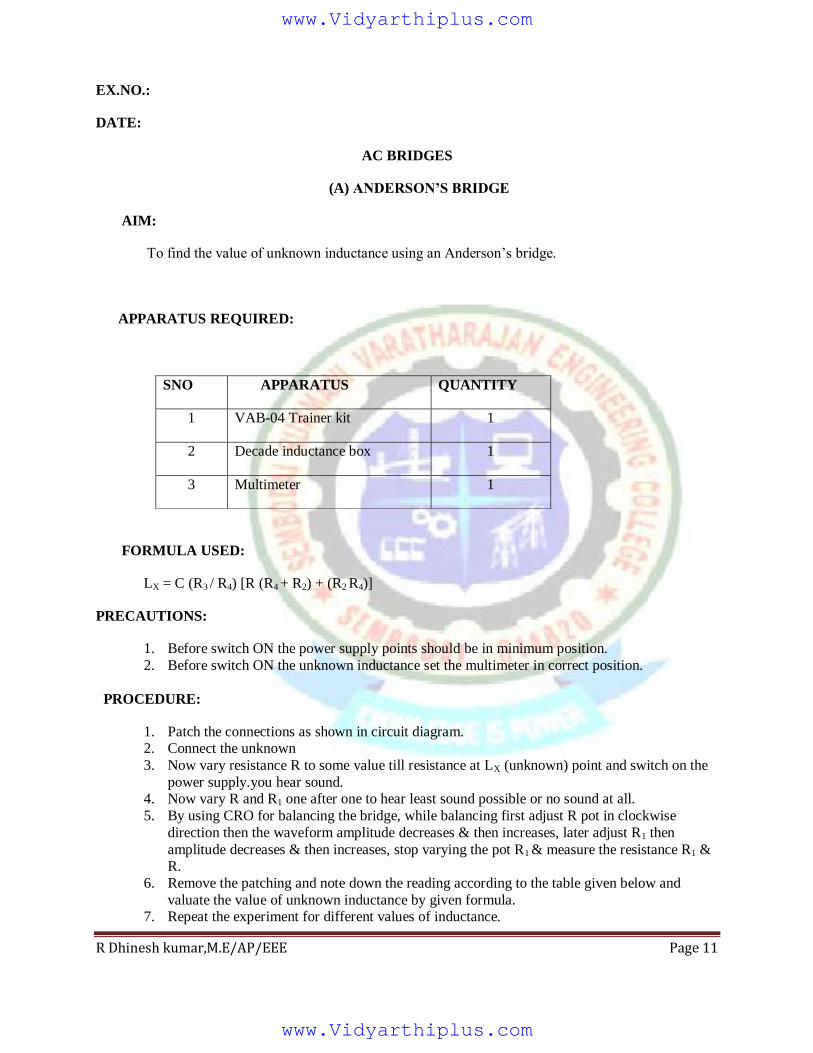
(A) ANDERSON’S BRIDGE
AIM:
To find the value of unknown inductance using an Anderson‟s bridge.
APPARATUS REQUIRED:
FORMULA USED:
LX = C (R3 / R4) [R (R4 + R2) + (R2 R4)]
PRECAUTIONS:
1. Before switch ON the power supply points should be in minimum position.
2. Before switch ON the unknown inductance set the multimeter in correct position.
PROCEDURE:
1. Patch the connections as shown in circuit diagram. 2. Connect the unknown
3. Now vary resistance R to some value till resistance at LX (unknown) point and switch on the
power supply.you hear sound. 4. Now vary R and R1 one after one to hear least sound possible or no sound at all.
5. By using CRO for balancing the bridge, while balancing first adjust R pot in clockwise
direction then the waveform amplitude decreases & then increases, later adjust R1 then
amplitude decreases & then increases, stop varying the pot R1 & measure the resistance R1 & R.
6. Remove the patching and note down the reading according to the table given below and
valuate the value of unknown inductance by given formula. 7. Repeat the experiment for different values of inductance.
SNO APPARATUS QUANTITY
1 VAB-04 Trainer kit 1
2 Decade inductance box 1
3 Multimeter 1
www.Vidyarthiplus.com
www.Vidyarthiplus.com
R Dhinesh kumar,M.E/AP/EEE Page 12
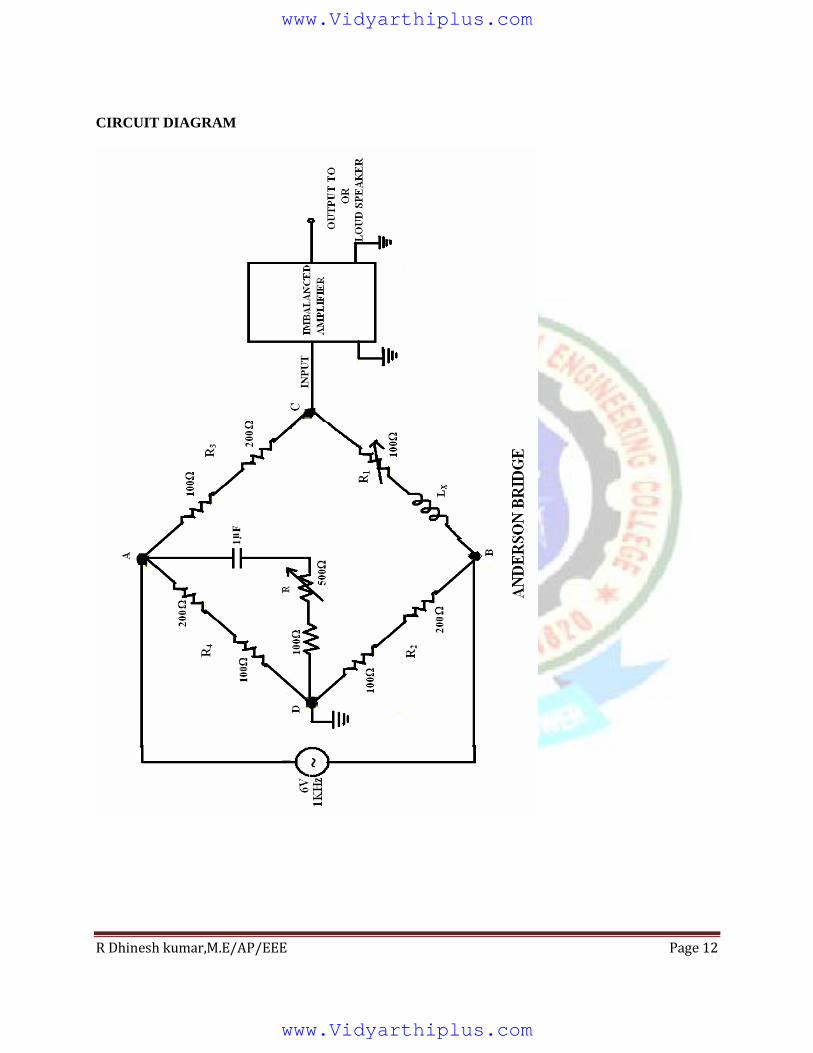
CIRCUIT DIAGRAM
www.Vidyarthiplus.com
www.Vidyarthiplus.com
R Dhinesh kumar,M.E/AP/EEE Page 13
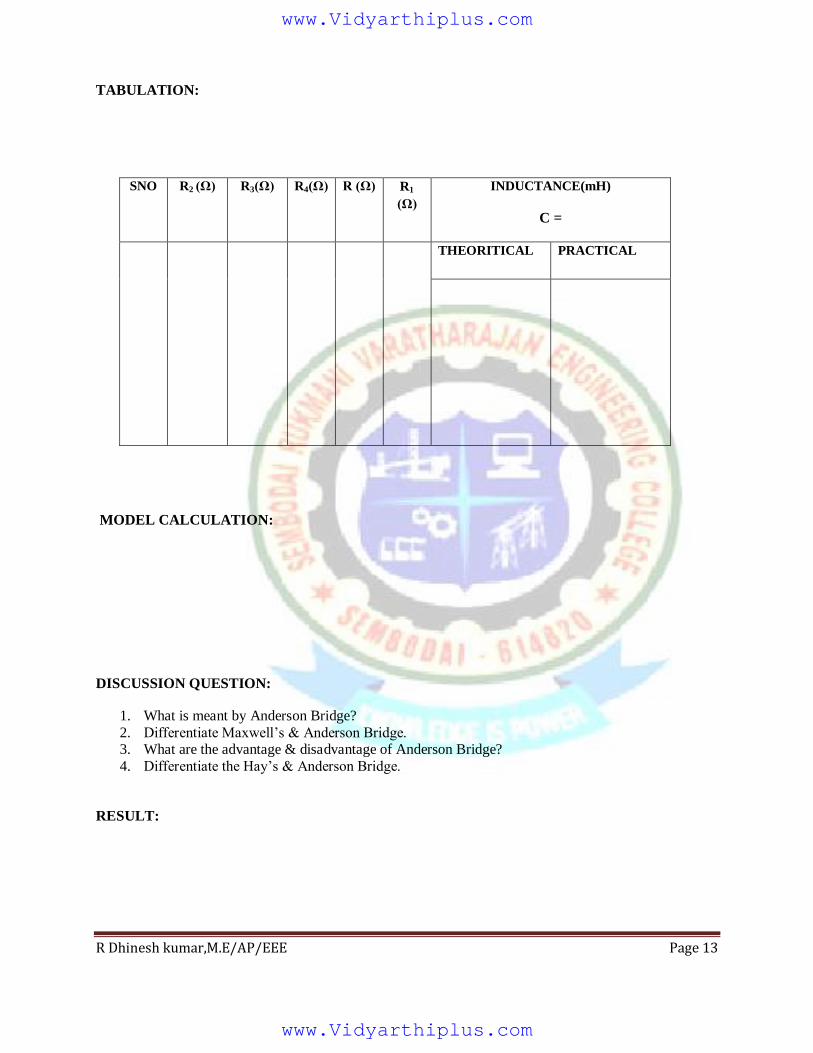
TABULATION:
SNO R2 (Ω) R3(Ω) R4(Ω) R (Ω) R1
(Ω)
INDUCTANCE(mH)
C =
THEORITICAL PRACTICAL
MODEL CALCULATION:
DISCUSSION QUESTION:
1. What is meant by Anderson Bridge?
2. Differentiate Maxwell‟s & Anderson Bridge. 3. What are the advantage & disadvantage of Anderson Bridge?
4. Differentiate the Hay‟s & Anderson Bridge.
RESULT:
www.Vidyarthiplus.com
www.Vidyarthiplus.com
R Dhinesh kumar,M.E/AP/EEE Page 14
EXP NO:
DATE:
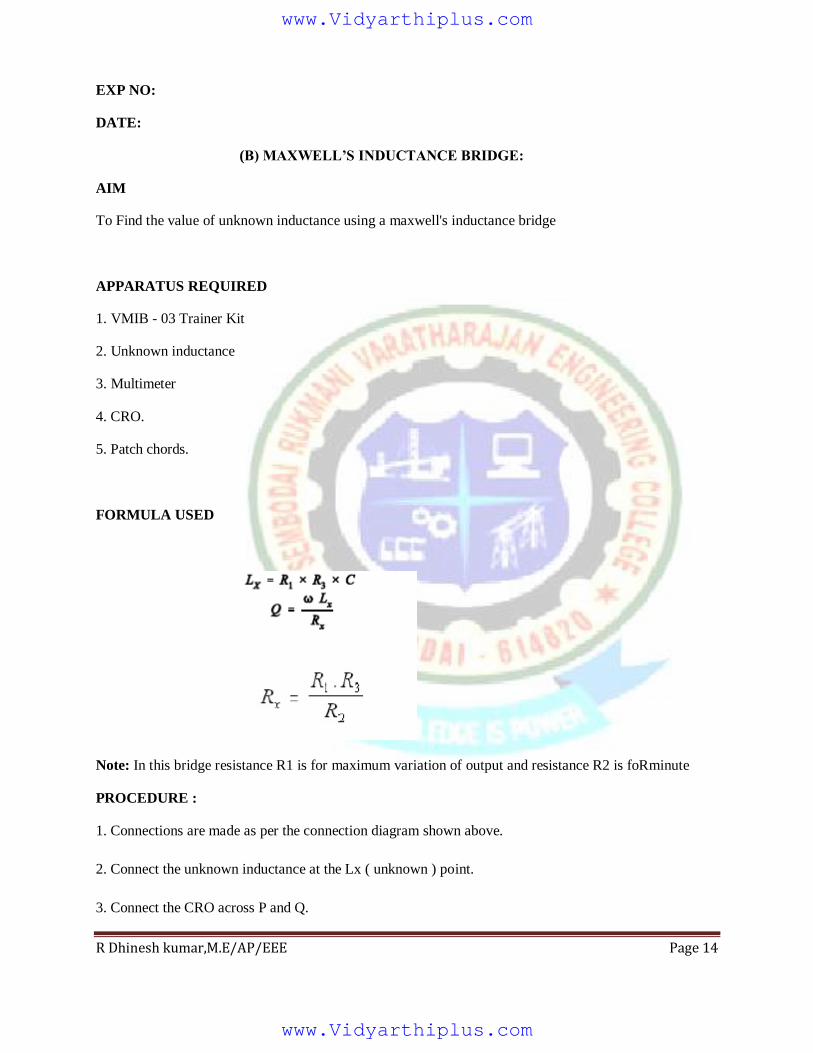
(B) MAXWELL’S INDUCTANCE BRIDGE:
AIM
To Find the value of unknown inductance using a maxwell's inductance bridge
APPARATUS REQUIRED
1. VMIB - 03 Trainer Kit
2. Unknown inductance
3. Multimeter
4. CRO.
5. Patch chords.
FORMULA USED
Note: In this bridge resistance R1 is for maximum variation of output and resistance R2 is foRminute
PROCEDURE :
1. Connections are made as per the connection diagram shown above.
2. Connect the unknown inductance at the Lx ( unknown ) point.
3. Connect the CRO across P and Q.
www.Vidyarthiplus.com
www.Vidyarthiplus.com
R Dhinesh kumar,M.E/AP/EEE Page 15
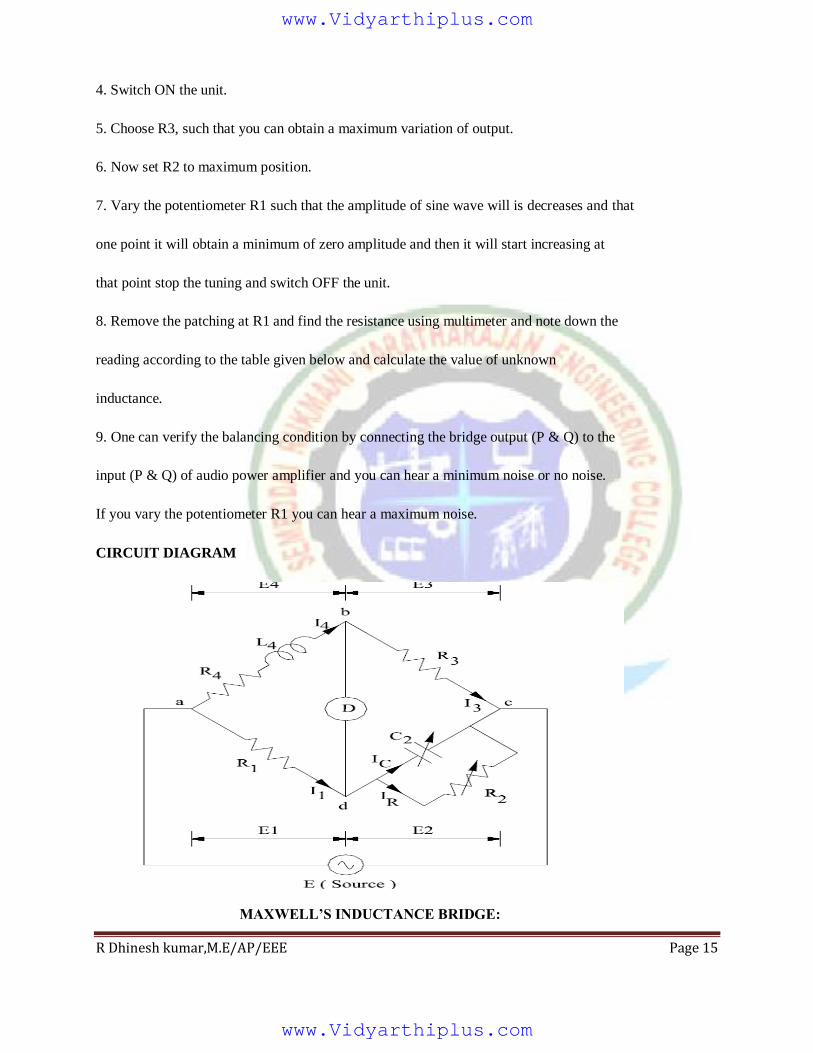
4. Switch ON the unit.
5. Choose R3, such that you can obtain a maximum variation of output.
6. Now set R2 to maximum position.
7. Vary the potentiometer R1 such that the amplitude of sine wave will is decreases and that
one point it will obtain a minimum of zero amplitude and then it will start increasing at
that point stop the tuning and switch OFF the unit.
8. Remove the patching at R1 and find the resistance using multimeter and note down the
reading according to the table given below and calculate the value of unknown
inductance.
9. One can verify the balancing condition by connecting the bridge output (P & Q) to the
input (P & Q) of audio power amplifier and you can hear a minimum noise or no noise.
If you vary the potentiometer R1 you can hear a maximum noise.
CIRCUIT DIAGRAM
MAXWELL’S INDUCTANCE BRIDGE:
www.Vidyarthiplus.com
www.Vidyarthiplus.com
R Dhinesh kumar,M.E/AP/EEE Page 16
\
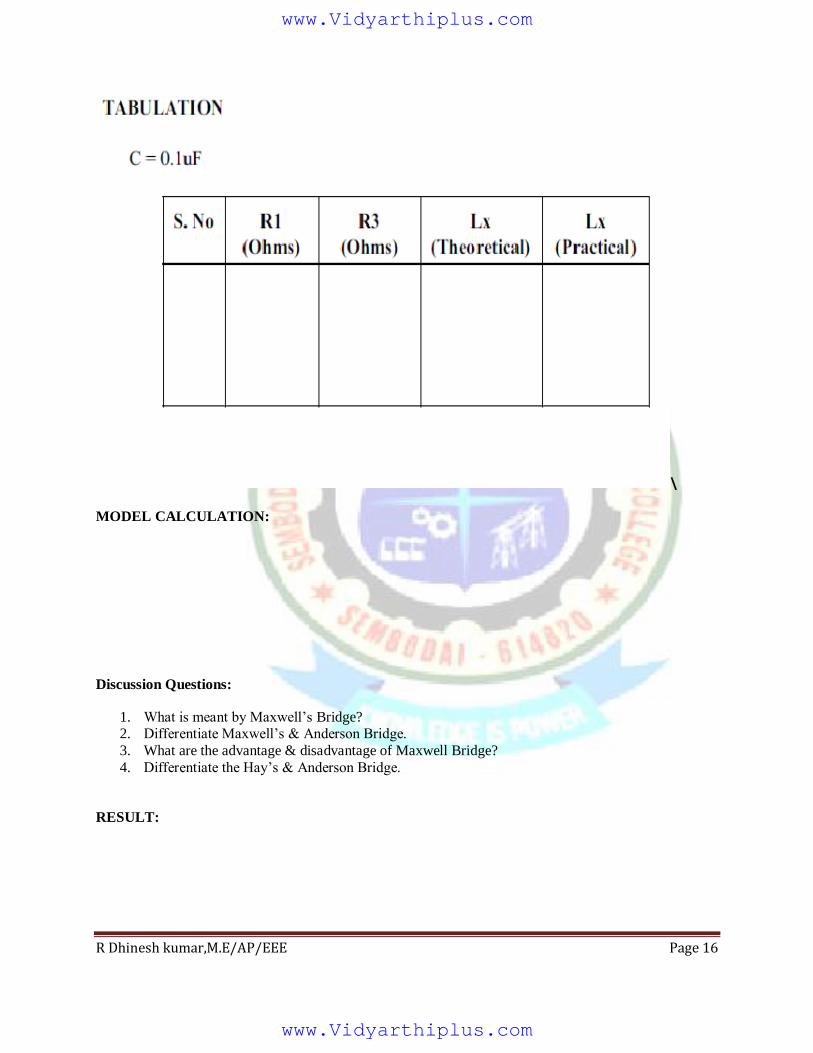
MODEL CALCULATION:
Discussion Questions:
1. What is meant by Maxwell‟s Bridge? 2. Differentiate Maxwell‟s & Anderson Bridge.
3. What are the advantage & disadvantage of Maxwell Bridge?
4. Differentiate the Hay‟s & Anderson Bridge.
RESULT:
www.Vidyarthiplus.com
www.Vidyarthiplus.com
R Dhinesh kumar,M.E/AP/EEE Page 17
EX.NO.
DATE:
DYNAMICS OF SENSORS/TRANSDUCERS
(A) MEASUREMENT OF DISPLACEMENT USING LVDT
AIM:
To measure the displacement using LVDT.
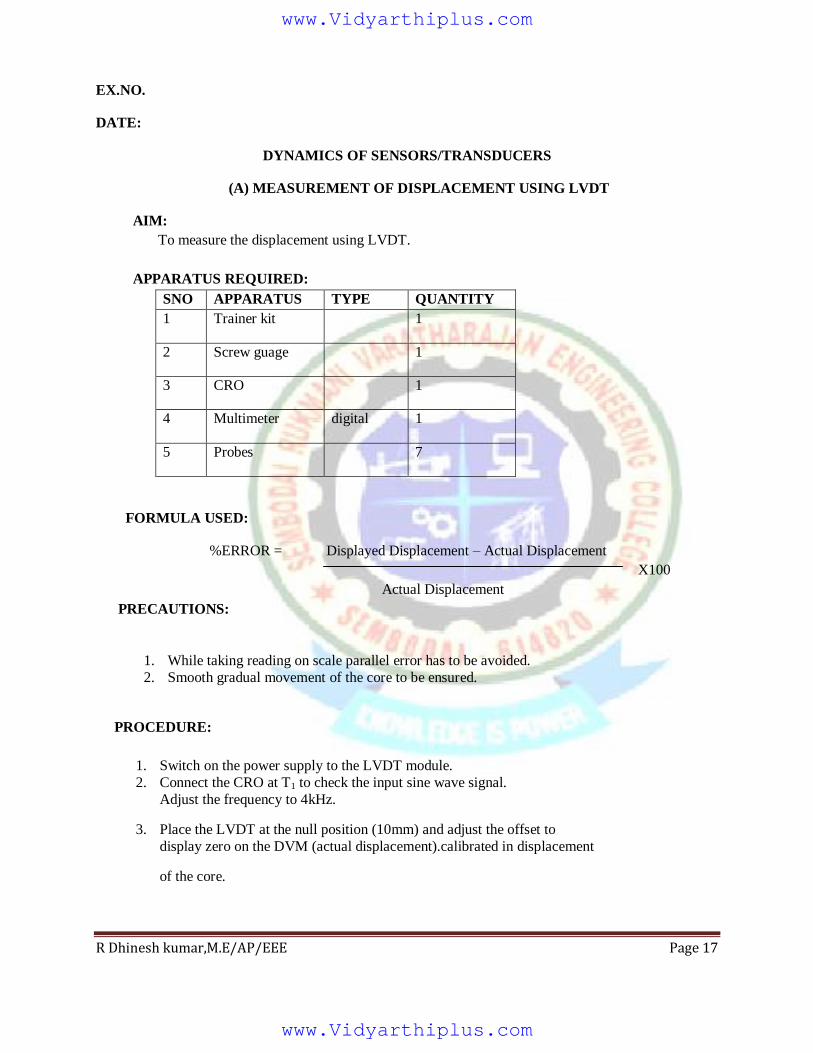
APPARATUS REQUIRED:
SNO APPARATUS TYPE QUANTITY
1 Trainer kit 1
2 Screw guage 1
3 CRO 1
4 Multimeter digital 1
5 Probes 7
FORMULA USED:
%ERROR = Displayed Displacement – Actual Displacement
X100
Actual Displacement
PRECAUTIONS:
1. While taking reading on scale parallel error has to be avoided.
2. Smooth gradual movement of the core to be ensured.
PROCEDURE:
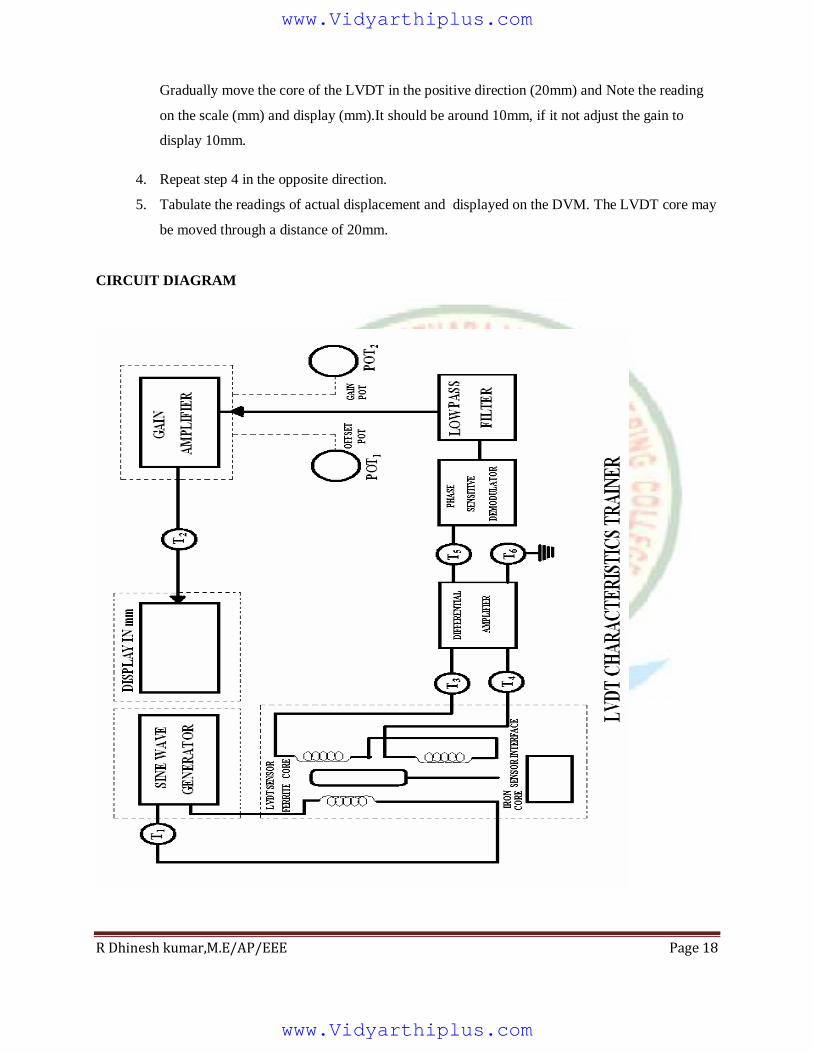
1. Switch on the power supply to the LVDT module.
2. Connect the CRO at T1 to check the input sine wave signal.
Adjust the frequency to 4kHz.
3. Place the LVDT at the null position (10mm) and adjust the offset to
display zero on the DVM (actual displacement).calibrated in displacement
of the core.
www.Vidyarthiplus.com
www.Vidyarthiplus.com
R Dhinesh kumar,M.E/AP/EEE Page 18
Gradually move the core of the LVDT in the positive direction (20mm) and Note the reading
on the scale (mm) and display (mm).It should be around 10mm, if it not adjust the gain to
display 10mm.
4. Repeat step 4 in the opposite direction.
5. Tabulate the readings of actual displacement and displayed on the DVM. The LVDT core may
be moved through a distance of 20mm.
CIRCUIT DIAGRAM
www.Vidyarthiplus.com
www.Vidyarthiplus.com
R Dhinesh kumar,M.E/AP/EEE Page 19
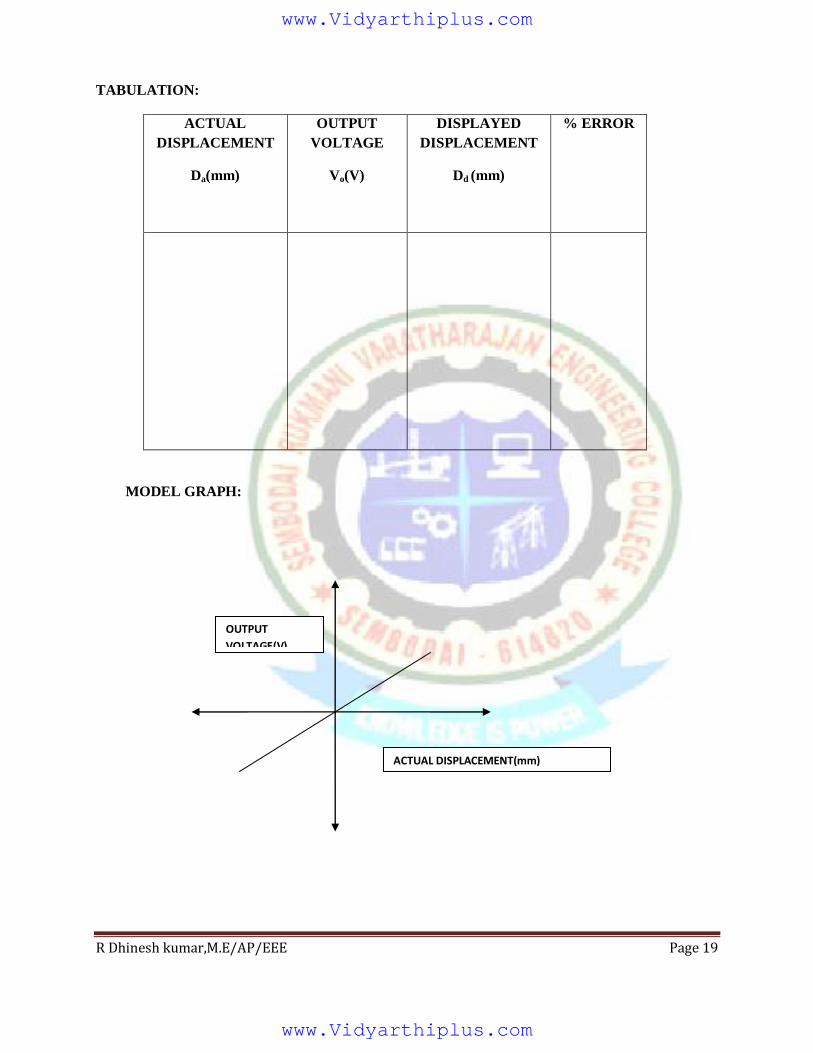
TABULATION:
ACTUAL
DISPLACEMENT
Da(mm)
OUTPUT
VOLTAGE
Vo(V)
DISPLAYED
DISPLACEMENT
Dd (mm)
% ERROR
MODEL GRAPH:
ACTUAL DISPLACEMENT(mm)
OUTPUT
VOLTAGE(V)
www.Vidyarthiplus.com
www.Vidyarthiplus.com
R Dhinesh kumar,M.E/AP/EEE Page 20
DISCUSSION QUESTION:
1. What is meant by Transducer?
2. What is meant by LVDT?
3. List the advantages of LVDT. 4. List the disadvantages of LVDT.
5. What are the applications of LVDT?
RESULT:
www.Vidyarthiplus.com
www.Vidyarthiplus.com
R Dhinesh kumar,M.E/AP/EEE Page 21
EX.NO
DATE
(B) MEASUREMENT OF PRESSURE USING TRANSDUCER KIT
AIM
To measure the pressure using pressure transducer with respect to signal conditioned output voltage.
APPARATUS REQUIRED
i. ITB-16-CE Trainer ii.
Multimeter (V).
FORMULA TO BE USED
PROCEDURE
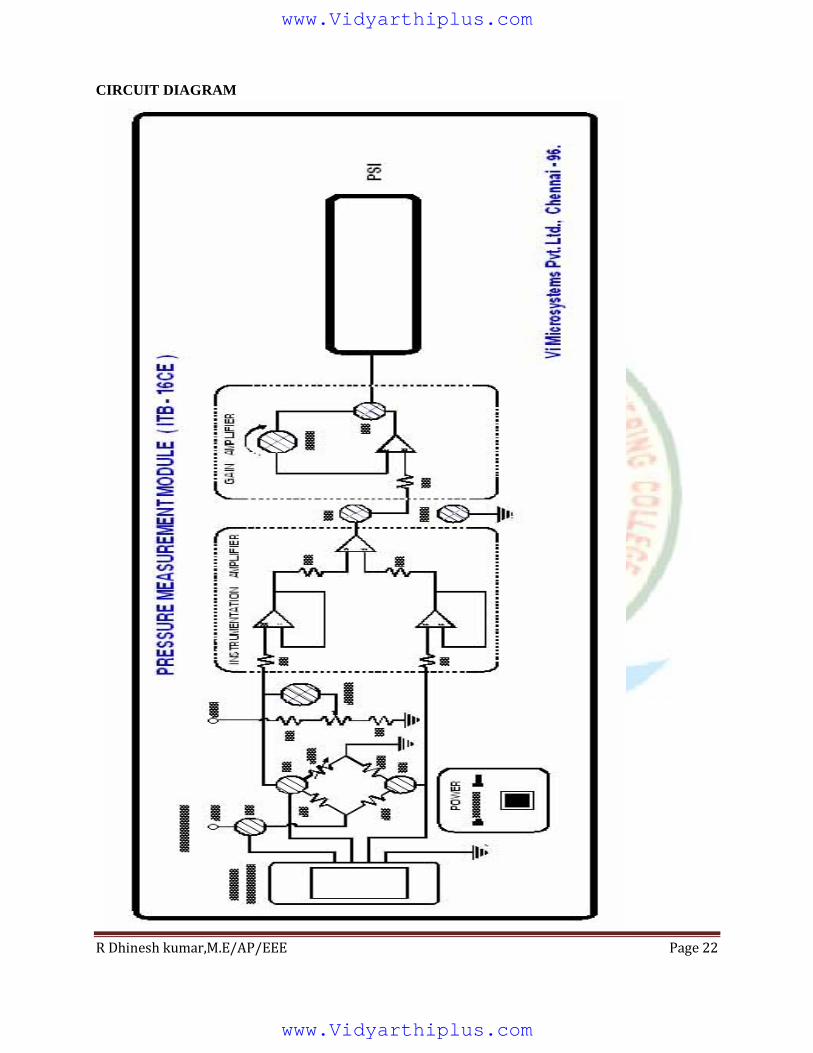
1. Install the sensor setup and interface the 9 pin D connector with ITB-16-CE kit
2. Connect the multimeter in Volt mode across T5 and GND for the signal
conditioned voltage measurement.
3. Switch "ON" the module.
4. Initially, open the air release valve and exhaust the tank inlet air and nullify the signal
conditioned output voltage by using zero adjustment POT.
5. Now, close the opened air release valve and apply the pressure of 50 Psig to the cylinder
and adjust the display to 50 Psig by using gain adjustment POT.
6. After the gain calibration, open the air release valve and exhaust the tank inlet air.
7. Again, close the opened air release valve. By pressing the pump piston, the pump sucks
the air from atmosphere and supply it to the cylinder. Then, the pressure will be
developed in the cylinder and measure the signal conditioned output voltage (V)
across T5 and GND.
8. Gradually increase the pressure the pump piston and note down the signal
conditioned output voltage (V) for corresponding gauge pressure.
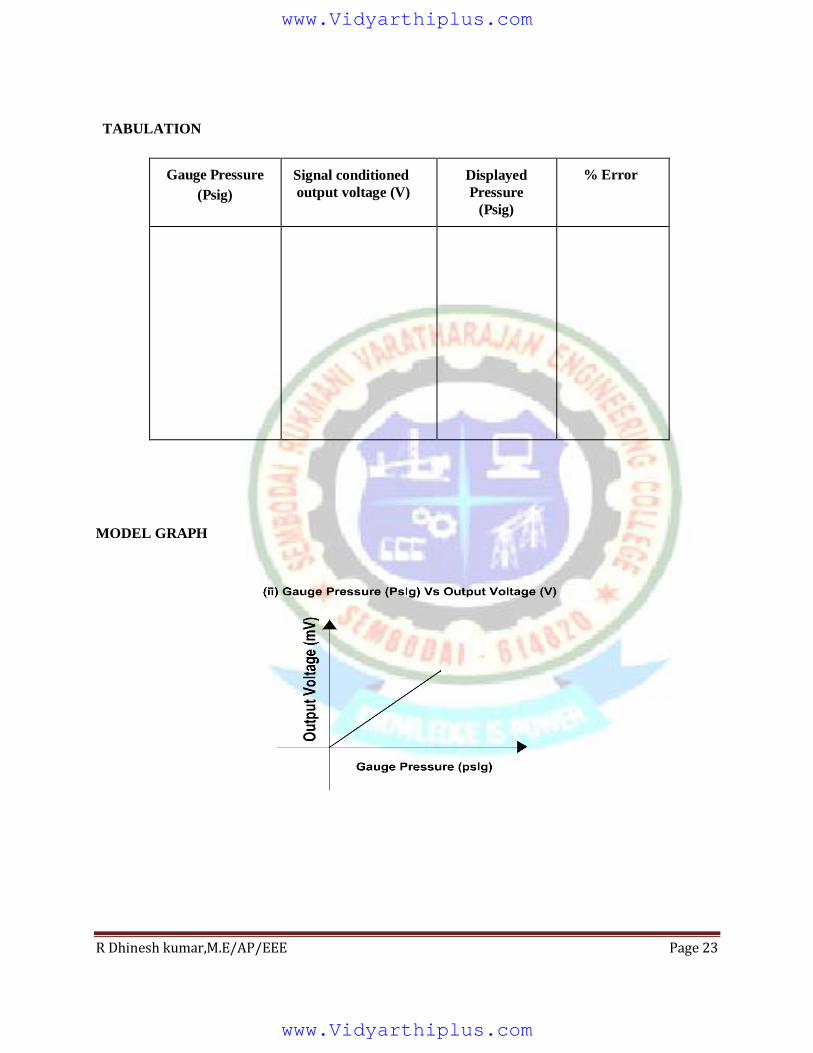
9. Tabulate the readings and plot a graph between gauge pressure and signal
conditioned output voltage (V).
www.Vidyarthiplus.com
www.Vidyarthiplus.com
R Dhinesh kumar,M.E/AP/EEE Page 22
CIRCUIT DIAGRAM
www.Vidyarthiplus.com
www.Vidyarthiplus.com
R Dhinesh kumar,M.E/AP/EEE Page 23
TABULATION
Gauge Pressure
(Psig)
Signal conditioned
output voltage (V)
Displayed
Pressure
(Psig)
% Error
MODEL GRAPH
www.Vidyarthiplus.com
www.Vidyarthiplus.com
R Dhinesh kumar,M.E/AP/EEE Page 24
DISCUSSION QUESTIONS:
1. What is a Pressure Transducer?
2. Define Transducer?
3. Compare Pressure & LVDT Transducer.
RESULT:
www.Vidyarthiplus.com
www.Vidyarthiplus.com
R Dhinesh kumar,M.E/AP/EEE Page 25
EX.NO.:
DATE:
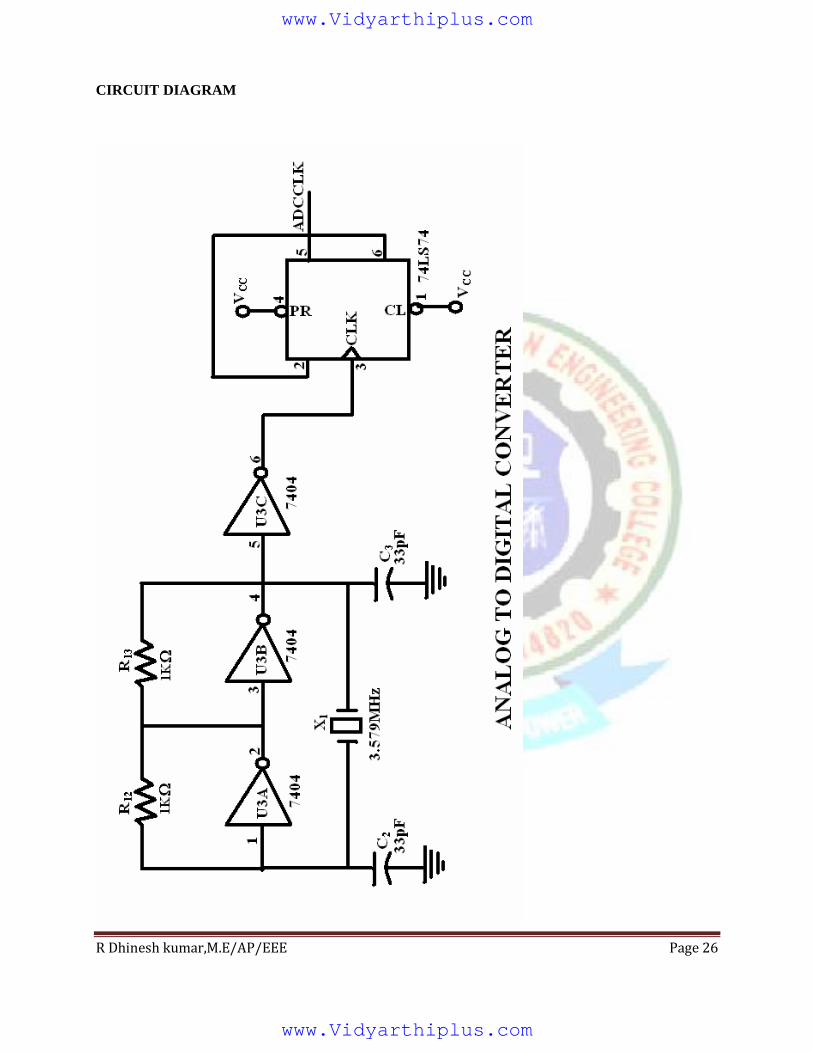
SIGNAL CONDITIONING
(A) ANALOG TO DIGITAL CONVERTER
AIM:
To draw the linearity curve of an analog to digital converter.
APPARATUS REQUIRED:
FORMULA USED:
Output Voltage VO = VREF (bo2 +b12 +……..+bn-12 )
PROCEDURE:
1. Power supply is switched ON.
2. The channel 3 is selected by the selection channel switch position SW1 through SW3 on
follows.
3. The analog input voltage is fed to the channel by connecting variable
terminal in the potentiometer. This potentiometer has the range of -5V to 5V.
4. The digital data corresponding to analog input is displayed on the LEDs and
the digital data value is noted.
5. Now, the potentiometer is varied and the analog input is measured using CRO.
6. Now, the position of the potentiometer corresponding digital data is noted. 7. The graph drawn between analog input values and the corresponding digital data displayed
on the LEDs. From the curve the linearity between the input and output is observed.
SNO APPARATUS RANGE QUANTITY
1 A/D Trainer kit - 1
2 Multimeter Digital 1
SW1 SW2 SW3
0 1 1
www.Vidyarthiplus.com
www.Vidyarthiplus.com
R Dhinesh kumar,M.E/AP/EEE Page 26
CIRCUIT DIAGRAM
www.Vidyarthiplus.com
www.Vidyarthiplus.com
R Dhinesh kumar,M.E/AP/EEE Page 27
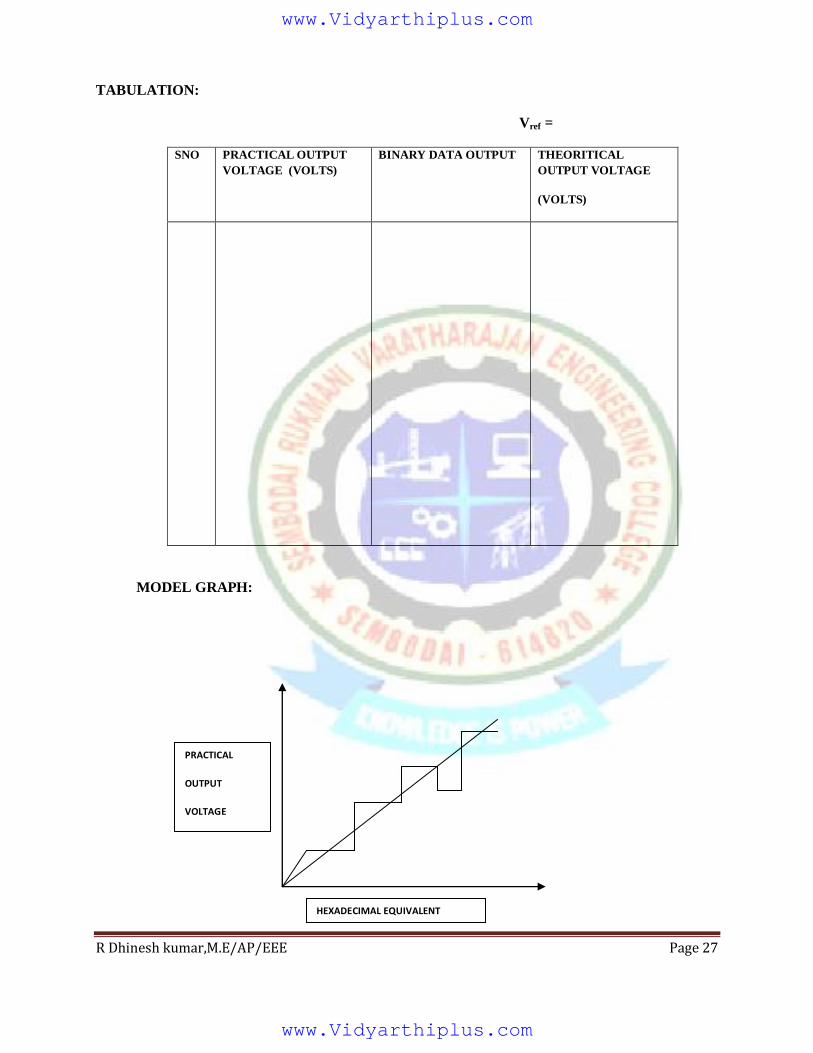
TABULATION:
Vref =
SNO PRACTICAL OUTPUT
VOLTAGE (VOLTS)
BINARY DATA OUTPUT THEORITICAL
OUTPUT VOLTAGE
(VOLTS)
MODEL GRAPH:
HEXADECIMAL EQUIVALENT
PRACTICAL
OUTPUT
VOLTAGE
(VOLTS)
www.Vidyarthiplus.com
www.Vidyarthiplus.com
R Dhinesh kumar,M.E/AP/EEE Page 28
MODEL CALCULATION:
DISCUSSION QUESTION:
1. Explain about the ADC. 2. Why is an A/D Converter usually considered an encoder?
3. What are the applications of ADC?
4. What is meant by Digital Transducer?
5. What are the types of ADC?
RESULT:
www.Vidyarthiplus.com
www.Vidyarthiplus.com
R Dhinesh kumar,M.E/AP/EEE Page 29
EX.NO.:
DATE:
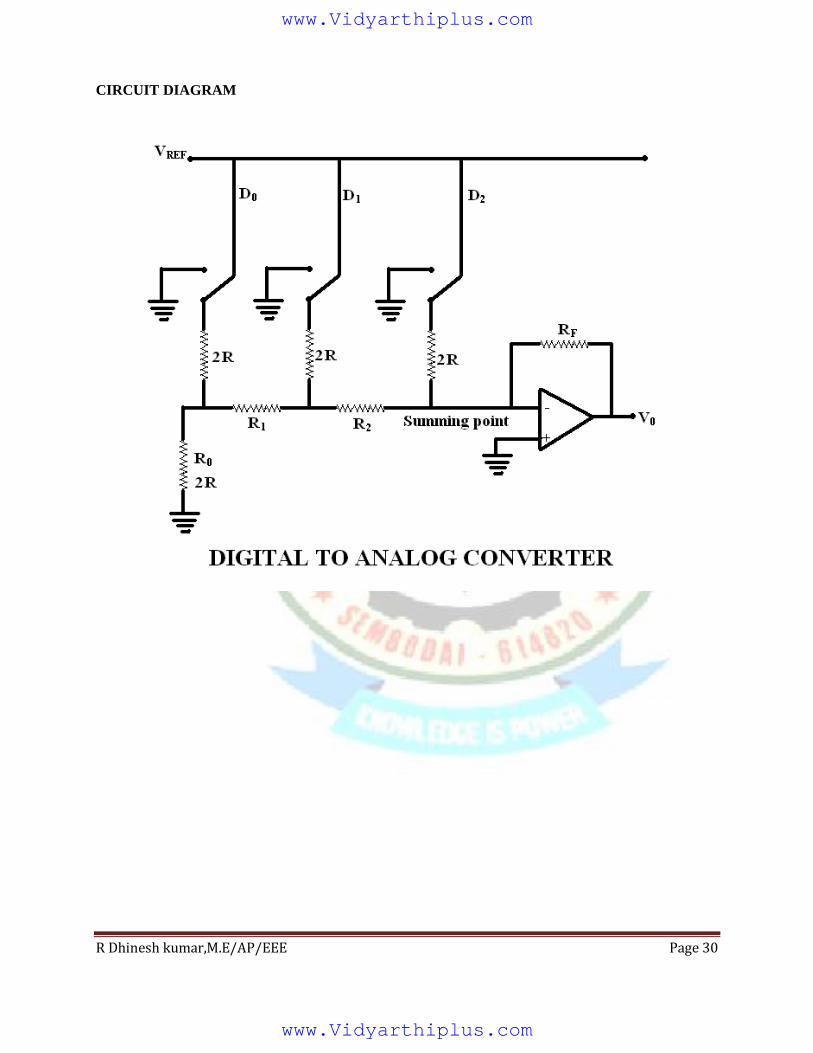
(B) DIGITAL TO ANALOG CONVERTER
AIM:
To obtain the corresponding analog output for a given digital input.
APPARATUS REQUIRED:
FORMULA USED:
4 BIT WEIGHTED RESISTOR DAC:
Output voltage VO = IO RF
(RF =R)
VO = VR (RF/R) (d12 +d22 +……. + dn2 )
R-2R LADDER NETWORK DAC:
VO = IO RF
VO = (VR/2) (d12 +d22 +……..+ dn2 )
PROCEDURE:
1. The power supply is switched ON.
2. The jumpers J9 through J16 should be in s/w(right) position.
3. The switches SW1 through SW8 are placed appropriately to represent the desired input.
4. The output voltage can be observed by using a CRO/multimeter at the terminal pin 2.
SNO APPARATUS RANGE QUANTITY
1 VSTH-002
Trainer Kit
IC741 1
2 RPS (0-30)V,fixed 1
3 Multimeter Digital 1
4 CRO - 1
www.Vidyarthiplus.com
www.Vidyarthiplus.com
R Dhinesh kumar,M.E/AP/EEE Page 30
CIRCUIT DIAGRAM
www.Vidyarthiplus.com
www.Vidyarthiplus.com
R Dhinesh kumar,M.E/AP/EEE Page 31
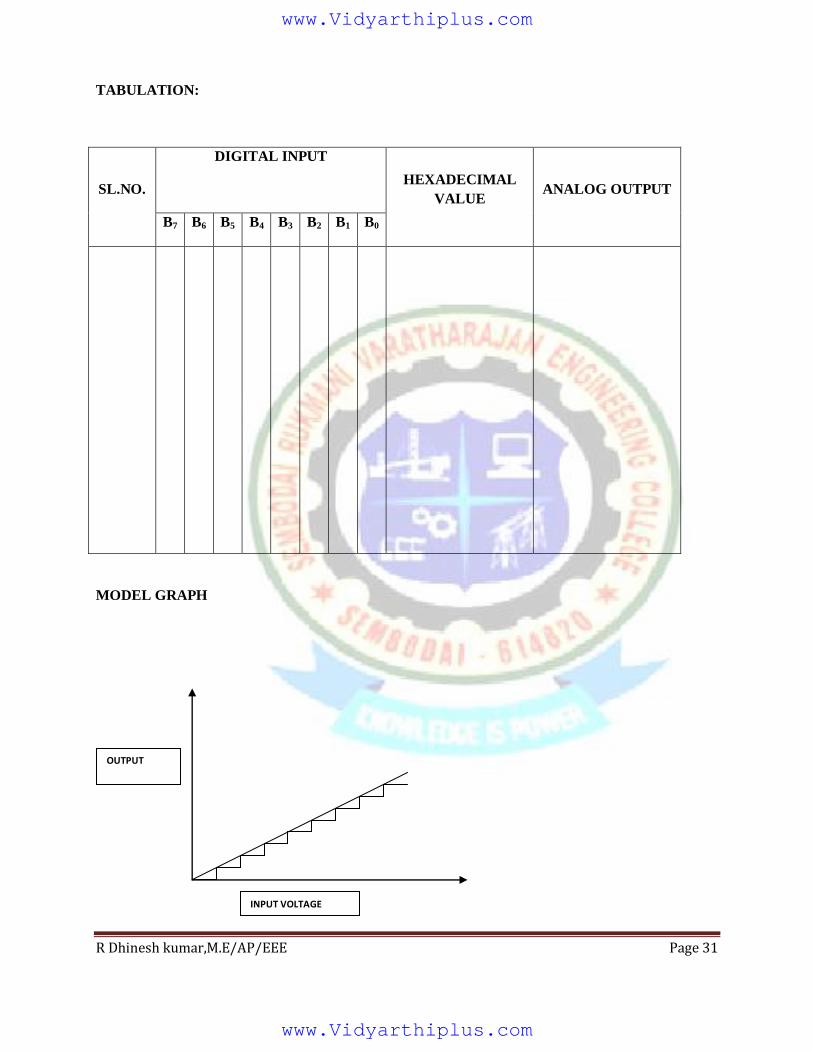
TABULATION:
SL.NO.
DIGITAL INPUT
HEXADECIMAL
VALUE ANALOG OUTPUT
B7 B6 B5 B4 B3 B2 B1 B0
MODEL GRAPH
INPUT VOLTAGE
OUTPUT
VOLTAGE
www.Vidyarthiplus.com
www.Vidyarthiplus.com
R Dhinesh kumar,M.E/AP/EEE Page 32
MODEL CALCULATIONS:
DISCUSSION QUESTION:
1. Explain about the DAC. 2. Why is an D/A Converter usually considered an decoder?
3. Define Monotonicity.
4. What are the applications of DAC?
5. What are types of DAC?
RESULT:
www.Vidyarthiplus.com
www.Vidyarthiplus.com
R Dhinesh kumar,M.E/AP/EEE Page 33
EXP NO:
DATE:
(C) INSTRUMENTATION AMPLIFIER
AIM
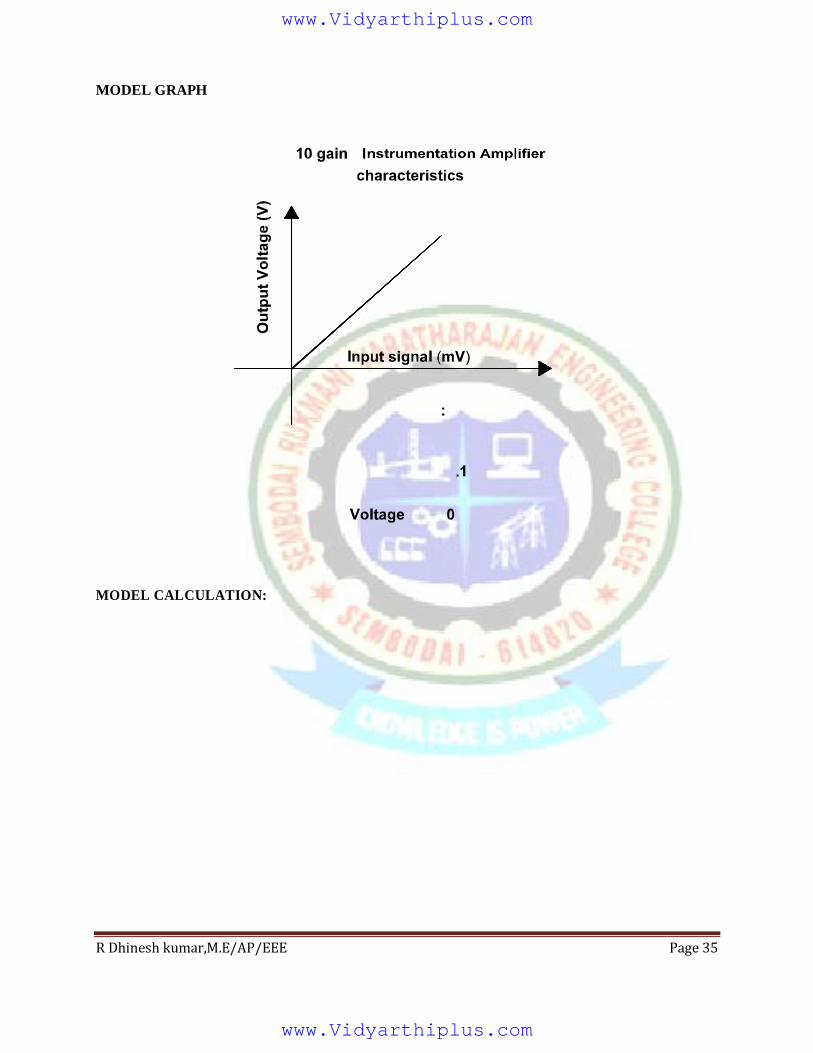
To study the characteristics of 10 gain instrumentation amplifier using the gain of 10.
REQUIREMENT
1. ITB-09 TRAINER KIT
2. Multimeter.
3. External millivolt source
PROCEDURE
1. Switch ON the ITB-09 unit. Switch SW1 should be in Internal mode.
2. Select the gain of 10 ie Switch SW2 should be in R1 mode.
3. Connect the multimeter in millivolt mode across the T1 and T2.
4. Calibrate the unit by using the mV source POT and zero adjustment POT.
5. When input is zero, display voltage also bring to zero by varying the zero adjustment POT.
6. After completion of the calibration, starts the experiment.
7. Set the input(say 40mV) by varying the mV source POT.
8. Measure the output voltage across T5 and GND or from the display.
9. Analyse the output for various input signal.
www.Vidyarthiplus.com
www.Vidyarthiplus.com
R Dhinesh kumar,M.E/AP/EEE Page 34
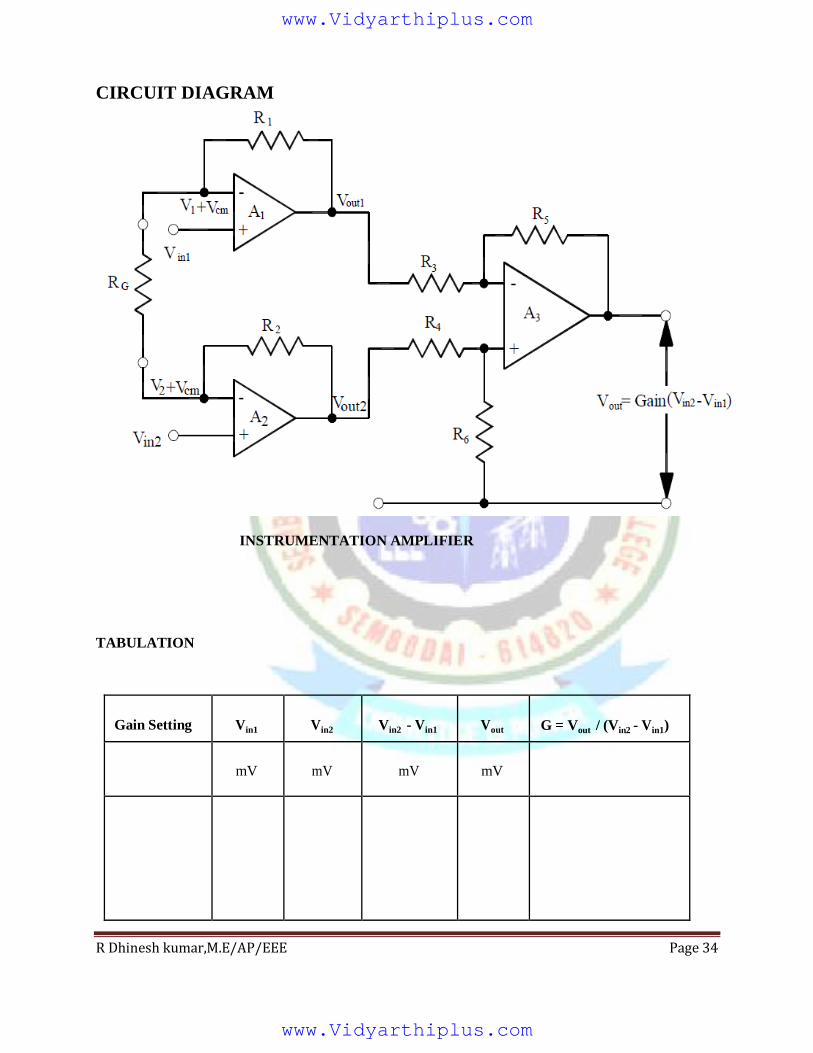
CIRCUIT DIAGRAM
INSTRUMENTATION AMPLIFIER
TABULATION
Gain Setting
Vin1
Vin2
Vin2 - Vin1
Vout
G = Vout / (Vin2 - Vin1)
mV
mV
mV
mV
www.Vidyarthiplus.com
www.Vidyarthiplus.com
R Dhinesh kumar,M.E/AP/EEE Page 35
MODEL GRAPH
MODEL CALCULATION:
www.Vidyarthiplus.com
www.Vidyarthiplus.com
R Dhinesh kumar,M.E/AP/EEE Page 36
Discussion questions:
1. What is the need for an instrumentation amplifier?
2. What are the advantages of instrumentation amplifier?
3. What is an Op-Amp?
4. What are the characteristics of an ideal Op-Amp?
5. What are the applications of instrumentation amplifier?
6. What is CMRR?
RESULT:
www.Vidyarthiplus.com
www.Vidyarthiplus.com
R Dhinesh kumar,M.E/AP/EEE Page 37
EX.NO.:
DATE:
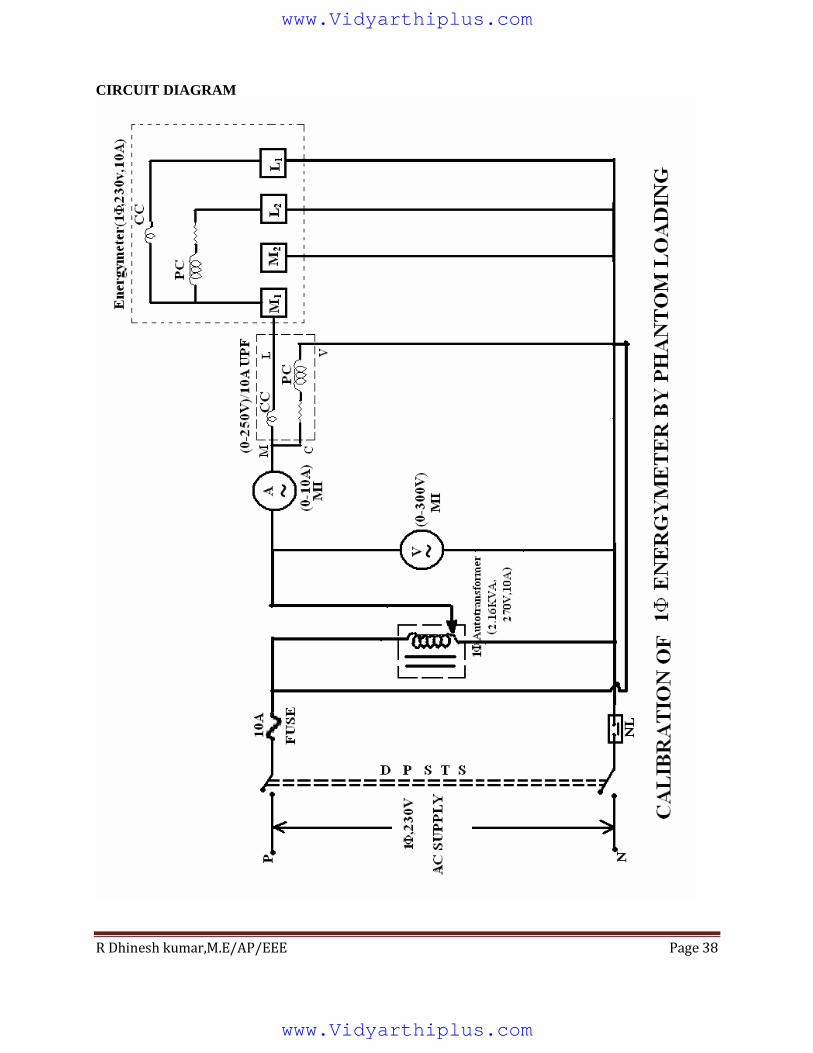
CALIBRATION OF SINGLE PHASE ENERGY METER
AIM:
To Calibrate the given single phase energy meter by direct loading and to draw the graph between
Load current and percentage error.
APPARATUS REQUIRED:
SNO APPARATUS TYPE RANGE QUANTITY
1 Voltmeter MI (0-300)V 1
2 Ammeter MI (0-10)A 1
3 Wattmeter UPF 300V/10A 1
4 Energy meter - - 1
5 Stopwatch - - 1
FORMULA USED:
Actual energy = Wattmeter reading x time taken for 10 rev
3600 x1000
Energy recorded = Number of revolutions
Energy meter constant
% Error = Energy recorded - Actual energy
X 100
Actual energy
PRECAUTIONS:
1. Ensure that the meters are in null position. 2. Ensure that the Variac in the minimum position.
PROCEDURE:
1. The circuit connections are given as per the circuit diagram.
2. Keeping the variac in minimum position & switch on the supply 3. Adjust the variac to get different reading in ammeter.
4. Note the times taken for 10 revolutions of energy meter disc & obtain the voltmeter,
ammeter & wattmeter reading.
5. The readings are tabulated and required graphs are drawn.
www.Vidyarthiplus.com
www.Vidyarthiplus.com
R Dhinesh kumar,M.E/AP/EEE Page 38
CIRCUIT DIAGRAM
www.Vidyarthiplus.com
www.Vidyarthiplus.com
R Dhinesh kumar,M.E/AP/EEE Page 39
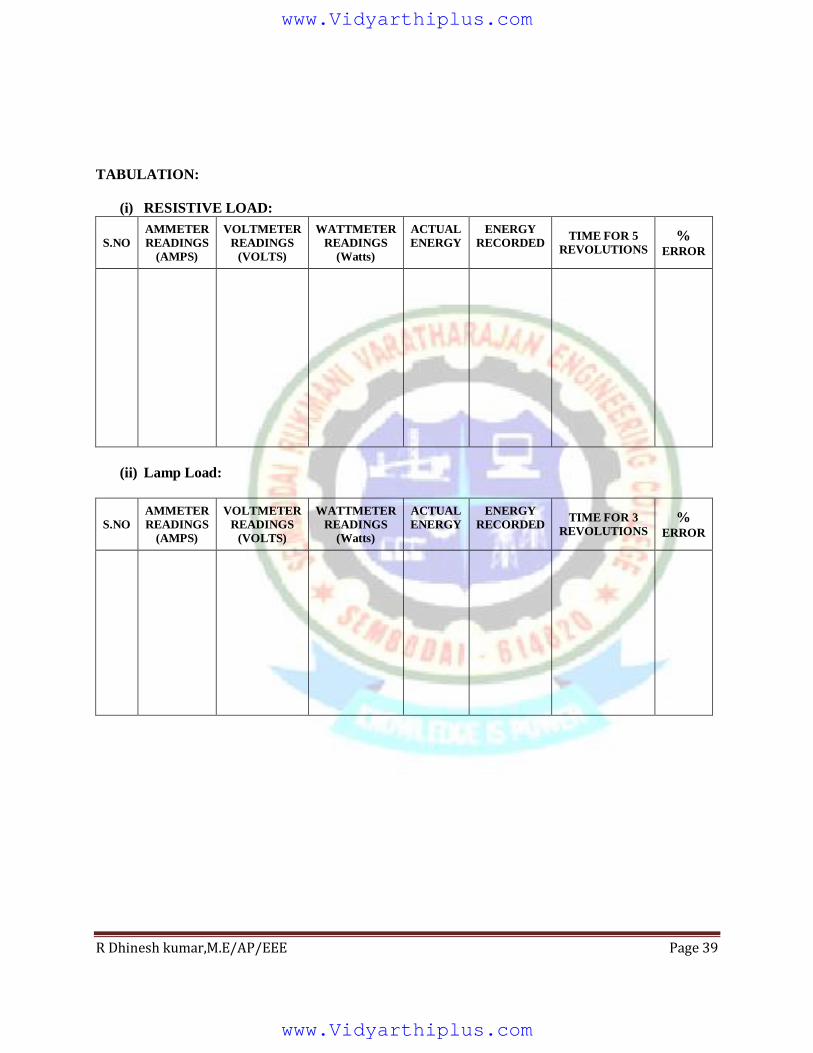
TABULATION:
(i) RESISTIVE LOAD:
S.NO
AMMETER
READINGS
(AMPS)
VOLTMETER
READINGS
(VOLTS)
WATTMETER
READINGS
(Watts)
ACTUAL
ENERGY
ENERGY
RECORDED
TIME FOR 5
REVOLUTIONS %
ERROR
(ii) Lamp Load:
S.NO
AMMETER
READINGS
(AMPS)
VOLTMETER
READINGS
(VOLTS)
WATTMETER
READINGS
(Watts)
ACTUAL
ENERGY
ENERGY
RECORDED
TIME FOR 3
REVOLUTIONS %
ERROR
www.Vidyarthiplus.com
www.Vidyarthiplus.com
R Dhinesh kumar,M.E/AP/EEE Page 40
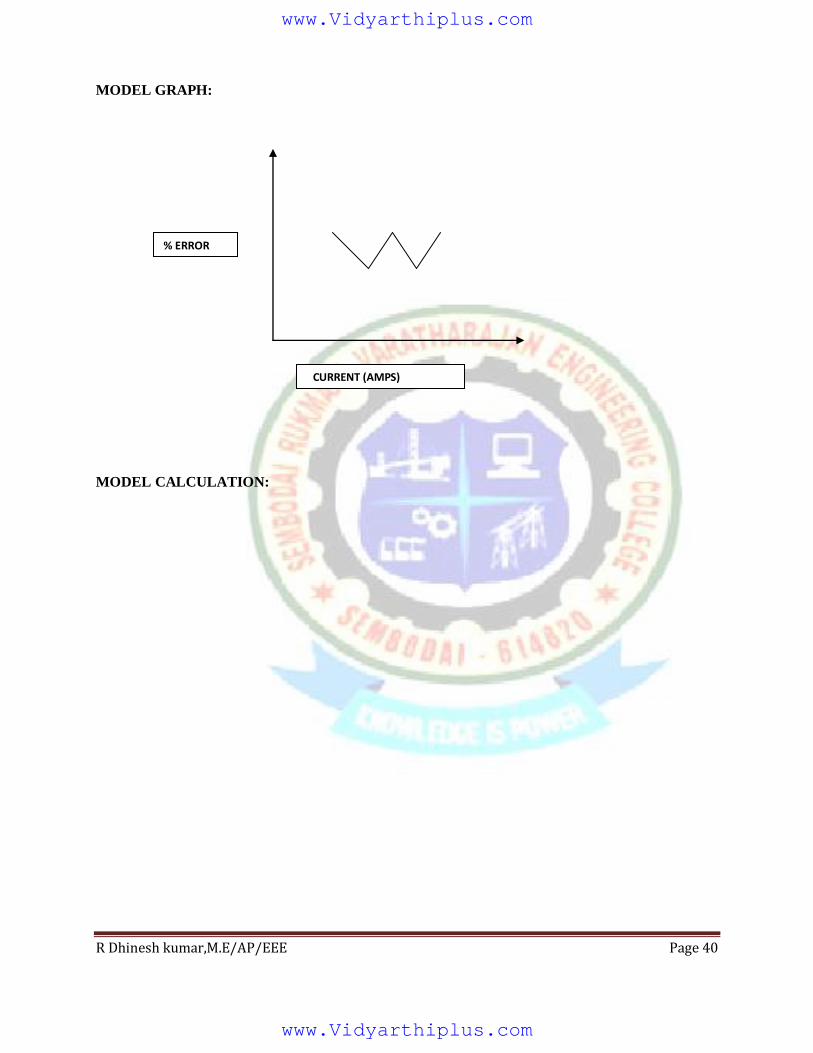
MODEL GRAPH:
MODEL CALCULATION:
CURRENT (AMPS)
% ERROR
www.Vidyarthiplus.com
www.Vidyarthiplus.com
R Dhinesh kumar,M.E/AP/EEE Page 41
DISCUSSION QUESTION:
1. Explain about the working Principle of 1Φ Energymeter.
2. List the advantage & disadvantage of 1Φ Energymeter.
3. What are the adjustments made in Energymeter? 4. Differentiate the 1Φ Energymeter & 3Φ Energymeter.
5. Differentiate direct loading & phantom loading.
RESULT:
www.Vidyarthiplus.com
www.Vidyarthiplus.com
R Dhinesh kumar,M.E/AP/EEE Page 42
EXP.NO.:
DATE:
STABILITY ANALYSIS OF LINEAR SYSTEM
AIM:
To analyse the stability of linear system using MAT LAB.
APPARATUS REQUIRED:
1. Computer system with MATLAB software.
2. Power supply.
THEORY:
“MATLAB” is a software package for high performance numerical Computerization&
visualization. It provides an interacting environment with hundred of built in function.
“MATLAB” is a matrix based system for mathematical & engineering calculation. Each
variable is treated as a matrix which the only data type handled by it.
“MATLAB” can be used as an application development because of graphical user
interference tools. The typical in the field of mathematics & computation development of
algorithm, modeling simulation & its prototype, data analysis, scientific & engineering problems.
Tool box is a group of MATLAB function which are pre-defined that can be used for
obtaining solution in the different applications (control systems, fuzzy logic,digital signal
processing).
PROCEDURE:
1. Switch on the main supply.
2. Open the MATLAB command window.
3. Create a new file „M‟ file that is containing MATLAB language carries are called M file.
4. Type the program & check the error.
5. After saving the program, debug & run to see the output.
6. Verify the output waveform obtained through “MATLAB” with theoretical output.
PROGRAM:
BODE:
Num = [ 0 0 15 75];
Den = [ 1 16 100 0];
Bode = ( num,den);
www.Vidyarthiplus.com
www.Vidyarthiplus.com
R Dhinesh kumar,M.E/AP/EEE Page 43
Margin ( num, den);
grid
NYQUIST:
Num = [0 0 0 4 1];
Den = [2 3 1 0 0];
Nyquist (num, den);
grid
ROOT LOCUS:
Num = [0 0 1 9];
Den = [ 1 4 11 0];
rlocus (num, den);
grid
DISCUSSION QUESTION:
1. Define stable system.
2. How should be poles in s-plane for a stable system?
3. When will you say the system as marginally stable?
RESULT:
www.Vidyarthiplus.com
www.Vidyarthiplus.com
R Dhinesh kumar,M.E/AP/EEE Page 44
EXP.NO:
DATE:
DC SERVO MOTOR POSITION CONTROL SYSTEM
Aim:
To control the position of DC servo motor by using various controllers
Apparatus Required:
Position controller Kit
DC Servomotor.
Patch chords.
Procedure:
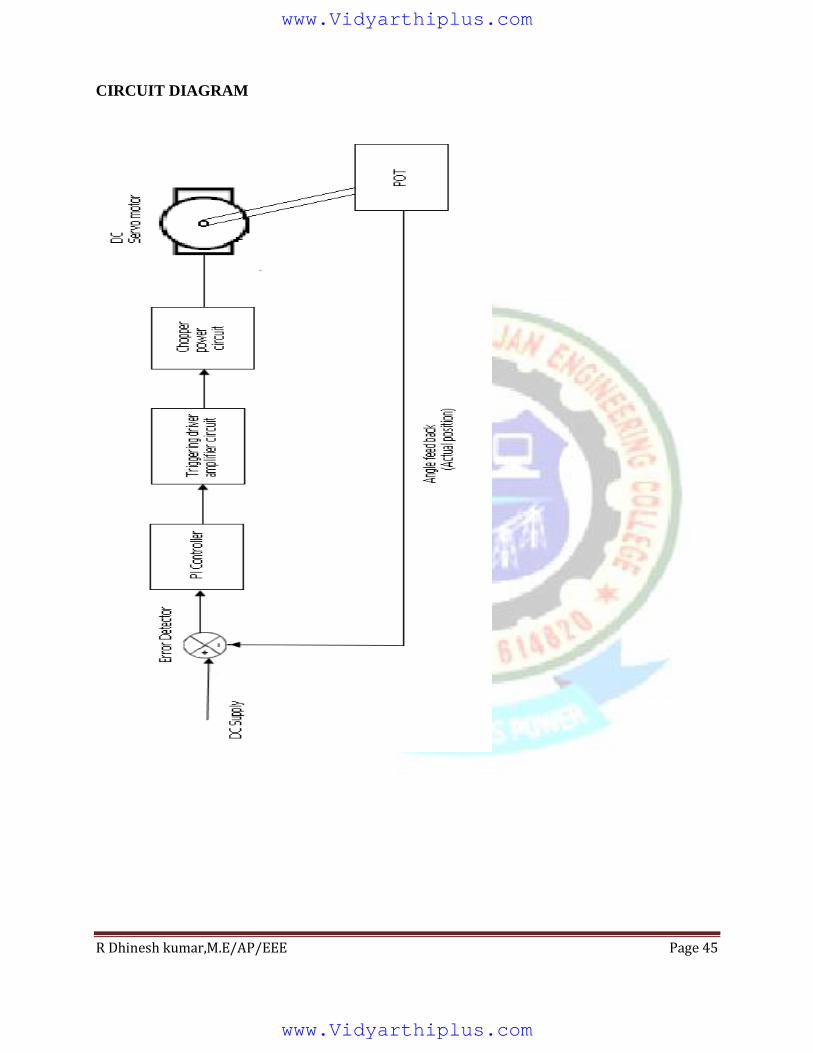
i. Make the connection as per the circuit diagram.
ii. Connect the chopper power output to the permanent magnet DC servomotor.
iii. Set the pulse relese switch in OFF position.
iv. Switch ON the power supply and switch On the power of the Kit.
v. Vary the set position knob and set the motor at any position.
vi. Tabulate the input and output position from the display unit for various controllers.
www.Vidyarthiplus.com
www.Vidyarthiplus.com
R Dhinesh kumar,M.E/AP/EEE Page 45
CIRCUIT DIAGRAM
www.Vidyarthiplus.com
www.Vidyarthiplus.com
R Dhinesh kumar,M.E/AP/EEE Page 46
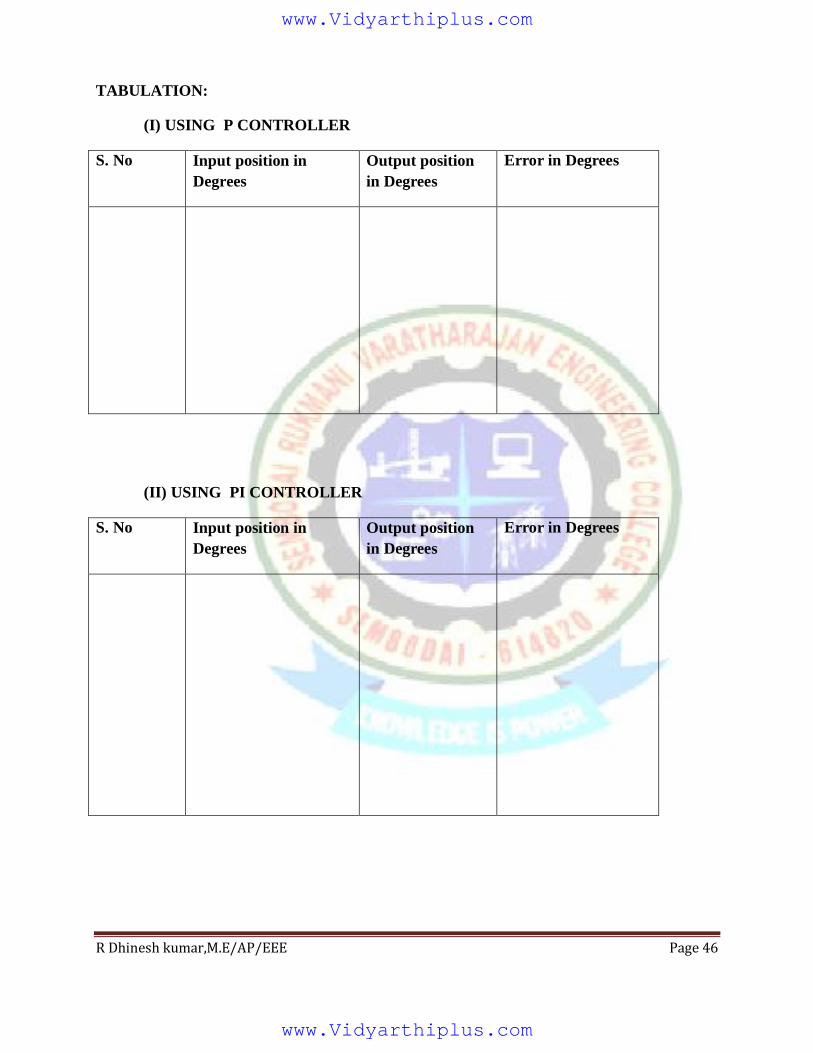
TABULATION:
(I) USING P CONTROLLER
S. No Input position in
Degrees
Output position
in Degrees
Error in Degrees
(II) USING PI CONTROLLER
S. No Input position in
Degrees
Output position
in Degrees
Error in Degrees
www.Vidyarthiplus.com
www.Vidyarthiplus.com
R Dhinesh kumar,M.E/AP/EEE Page 47
DISCUSSION QUESTIONS:
1. What is DC Servo motor?
2. What is the function of Error Detector?
3. What are the various function in control system?
4. Why controllers are used in control system?
5. What is the difference between P, PI and PID controllers?
RESULT:
www.Vidyarthiplus.com
www.Vidyarthiplus.com
R Dhinesh kumar,M.E/AP/EEE Page 48
EXP.NO.:
DATE:
AC SERVO MOTOR POSITION CONTROL SYSTEM
Aim:
To study the operation of AC servomotor position control using PI controller
Apparatus Required:
Trainer Module
AC servomotor
Patch chords.
Precaution:
Check whether power ON/OFF is in OFF condition
Check whether 230V AC ON/OFF switch OFF condition.
Connection Procedure:
i. Connect terminal P7 (pulse input-1) to P3(pulse output) and P10 (pulse input-2) to
P4(pulse output)
ii. Connect gate terminal P8 to P19 and P11 to P21.
iii. Connect MT1(1) terminal P9 to P20 and MT1(2) terminal P12 to P22.
iv. Connect terminal P23 to P24,P25 to P26 and P27 to P28.
v. Connect terminal P15 to P17 and P16 to P18.
vi. Connect terminal P1to P13 and Connect terminal P2 to P14.
vii. Connect servomotor to P31 by using serial cable.
viii. Connect the main winding of motor to 230V Ac supply through a power chord.
Experimental Procedure:
i. Check whether the connections are made as per the connection procedure.
ii. Switch ON the trainer power & input AC supply to the servomotor.
iii. Vary the set position knob and set the motor at any position.
iv. Note down the input and output position from the display unit. And tabulate the values
for various positions
www.Vidyarthiplus.com
www.Vidyarthiplus.com
R Dhinesh kumar,M.E/AP/EEE Page 49
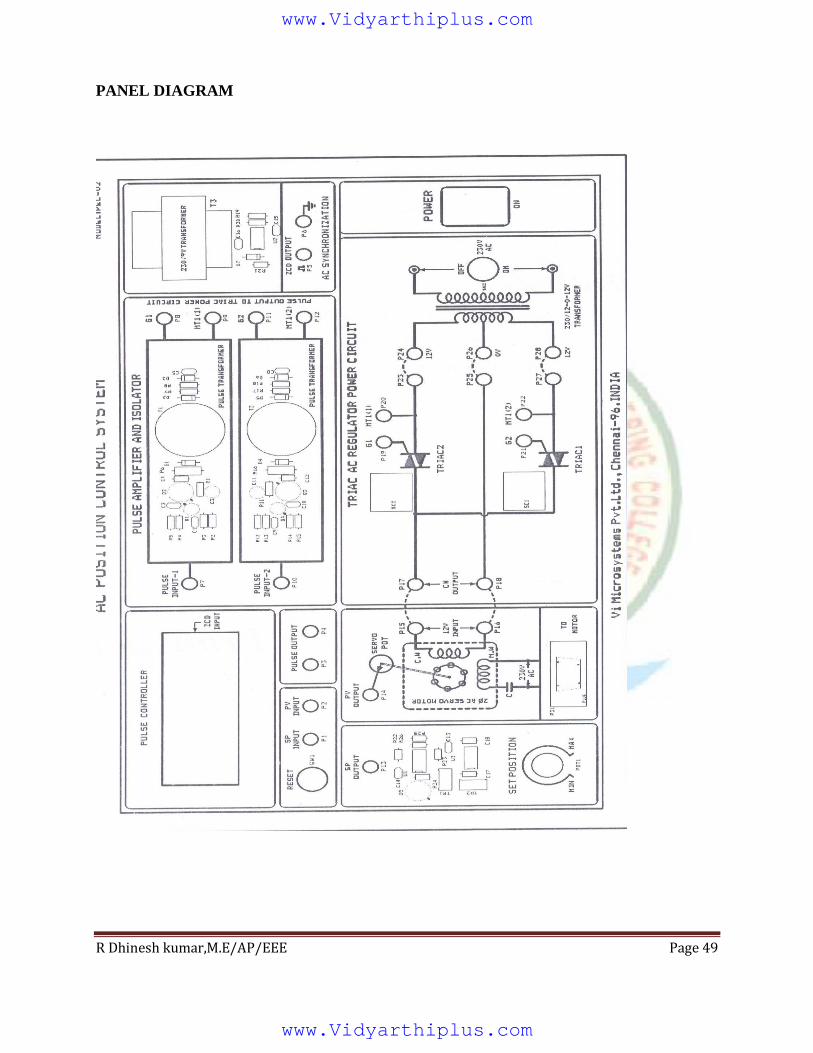
PANEL DIAGRAM
www.Vidyarthiplus.com
www.Vidyarthiplus.com
R Dhinesh kumar,M.E/AP/EEE Page 50
Tabulation:
S.No
Set position
in deg
Actual position
in deg
www.Vidyarthiplus.com
www.Vidyarthiplus.com
R Dhinesh kumar,M.E/AP/EEE Page 51
DISCUSSION QUESTIONS:
1. What is AC Servo motor?
2. What is the function of Error Detector?
3. What are the various function in control system?
4. Why controllers are used in control system?
5. What is the difference between P, PI and PID controllers?
RESULT:
www.Vidyarthiplus.com
www.Vidyarthiplus.com
Recommended