1
SELF ASSESSMENT REPORT (SAR) FORMAT
UNDERGRADUATE ENGINEERING PROGRAMS (TIER-II)
FIRST TIME ACCREDITATION
(Applicable for all the programs, except those granted full accreditation for 5 years as per Jan 2013 Manual)
NBCC Place, 4th Floor East Tower, Bhisham Pitamah Marg,
Pragati Vihar New Delhi 110003
P: +91(11)24360620-22, 24360654
Fax: +91(11) 24360682
E-mail: [email protected]
Website: www.nbaind.org
(June, 2015)
2
SAR Contents
Serial Code & Link to the Item
Item Page No.
PART A Institutional Information 3
PART B Criteria Summary 7
Program Level Criteria
1 Vision, Mission and Program Educational Objectives 8
2 Program Curriculum and Teaching – Learning Processes 9
3 Course Outcomes and Program Outcomes 11
4 Students’ Performance 17
5 Faculty Information and Contributions 24
6 Facilities and Technical Support 30
7 Continuous Improvement 31
Institute Level Criteria
8 First Year Academics 35
9 Student Support Systems 39
10 Governance, Institutional Support and Financial Resources 40
PART C Declaration by the Institution 45
Annexure-I Program Outcomes(POs) & Program Specific Outcomes(PSOs)
46
3
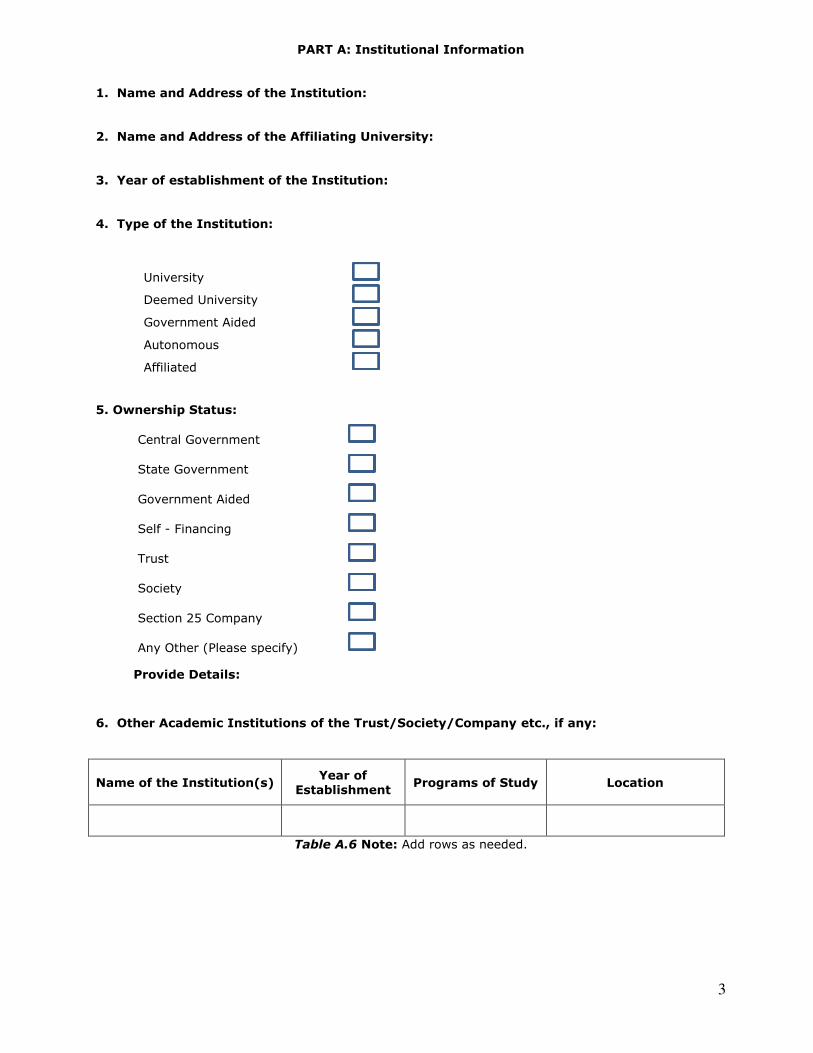
PART A: Institutional Information
1. Name and Address of the Institution:
2. Name and Address of the Affiliating University:
3. Year of establishment of the Institution:
4. Type of the Institution:
University
Deemed University
Government Aided
Autonomous
Affiliated
5. Ownership Status:
Central Government
State Government
Government Aided
Self - Financing
Trust
Society
Section 25 Company
Any Other (Please specify)
Provide Details:
6. Other Academic Institutions of the Trust/Society/Company etc., if any:
Name of the Institution(s) Year of
Establishment Programs of Study Location
Table A.6 Note: Add rows as needed.
4
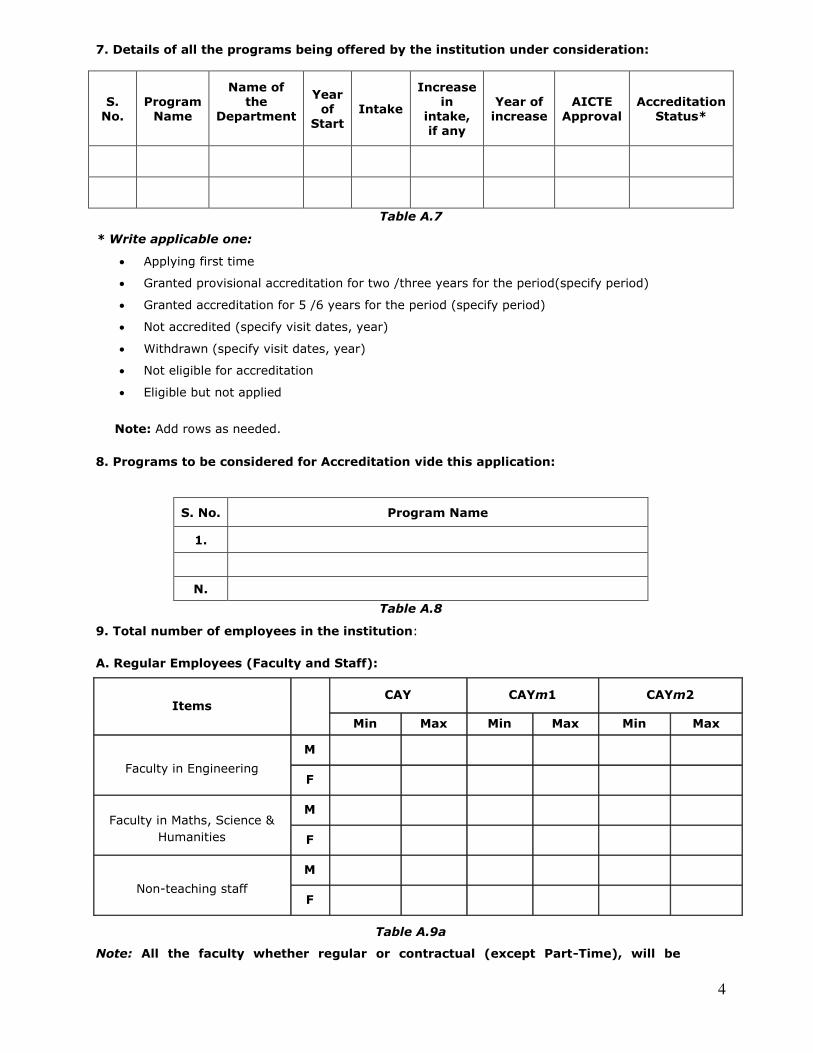
7. Details of all the programs being offered by the institution under consideration:
S.
No.
Program
Name
Name of the
Department
Year
of Start
Intake
Increase in
intake, if any
Year of
increase
AICTE
Approval
Accreditation
Status*
Table A.7
* Write applicable one:
Applying first time
Granted provisional accreditation for two /three years for the period(specify period)
Granted accreditation for 5 /6 years for the period (specify period)
Not accredited (specify visit dates, year)
Withdrawn (specify visit dates, year)
Not eligible for accreditation
Eligible but not applied
Note: Add rows as needed.
8. Programs to be considered for Accreditation vide this application:
S. No. Program Name
1.
N.
Table A.8
9. Total number of employees in the institution:
A. Regular Employees (Faculty and Staff):
Items CAY CAYm1 CAYm2
Min Max Min Max Min Max
Faculty in Engineering
M
F
Faculty in Maths, Science &
Humanities
M
F
Non-teaching staff
M
F
Table A.9a
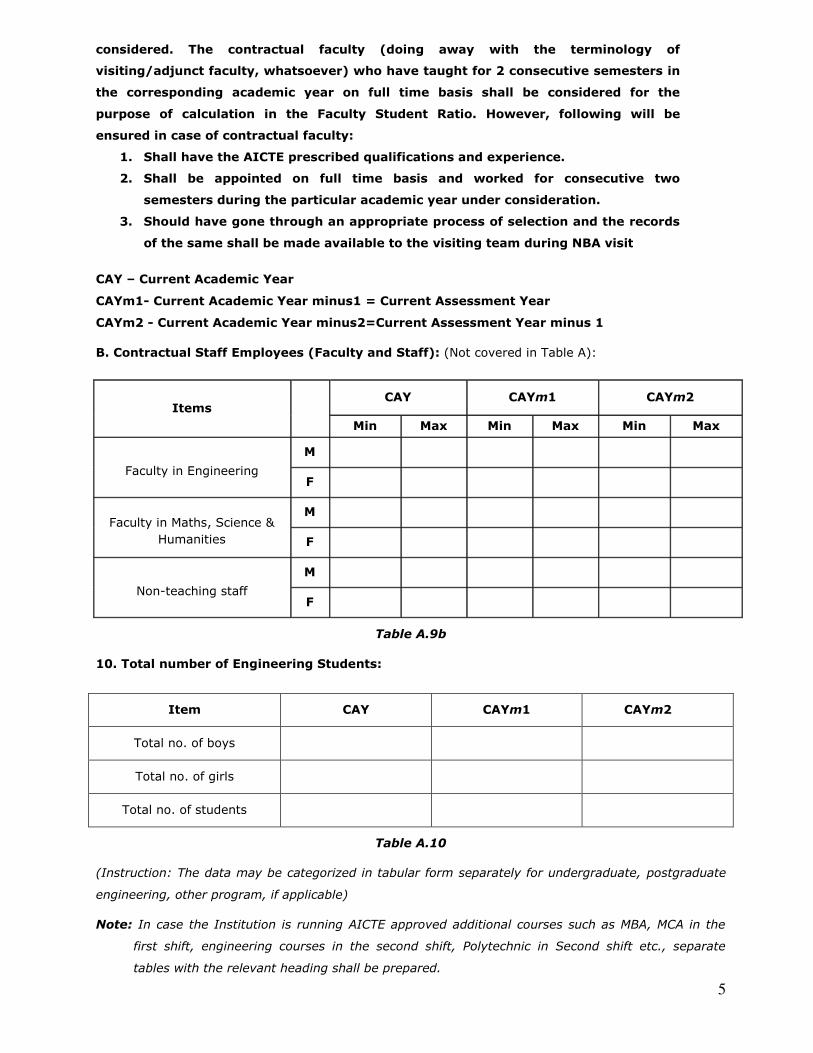
Note: All the faculty whether regular or contractual (except Part-Time), will be
5
considered. The contractual faculty (doing away with the terminology of
visiting/adjunct faculty, whatsoever) who have taught for 2 consecutive semesters in
the corresponding academic year on full time basis shall be considered for the
purpose of calculation in the Faculty Student Ratio. However, following will be
ensured in case of contractual faculty:
1. Shall have the AICTE prescribed qualifications and experience.
2. Shall be appointed on full time basis and worked for consecutive two
semesters during the particular academic year under consideration.
3. Should have gone through an appropriate process of selection and the records
of the same shall be made available to the visiting team during NBA visit
CAY – Current Academic Year
CAYm1- Current Academic Year minus1 = Current Assessment Year
CAYm2 - Current Academic Year minus2=Current Assessment Year minus 1
B. Contractual Staff Employees (Faculty and Staff): (Not covered in Table A):
Items CAY CAYm1 CAYm2
Min Max Min Max Min Max
Faculty in Engineering
M
F
Faculty in Maths, Science &
Humanities
M
F
Non-teaching staff
M
F
Table A.9b
10. Total number of Engineering Students:
Item CAY CAYm1 CAYm2
Total no. of boys
Total no. of girls
Total no. of students
Table A.10
(Instruction: The data may be categorized in tabular form separately for undergraduate, postgraduate
engineering, other program, if applicable)
Note: In case the Institution is running AICTE approved additional courses such as MBA, MCA in the
first shift, engineering courses in the second shift, Polytechnic in Second shift etc., separate
tables with the relevant heading shall be prepared.

6
11. Vision of the Institution:
12. Mission of the Institution:
13. Contact Information of the Head of the Institution and NBA coordinator, if designated:
i. Name:
Designation:
Mobile No:
Email id:
ii. NBA coordinator, if designated:
Name:
Designation:
Mobile No:
Email id:
7
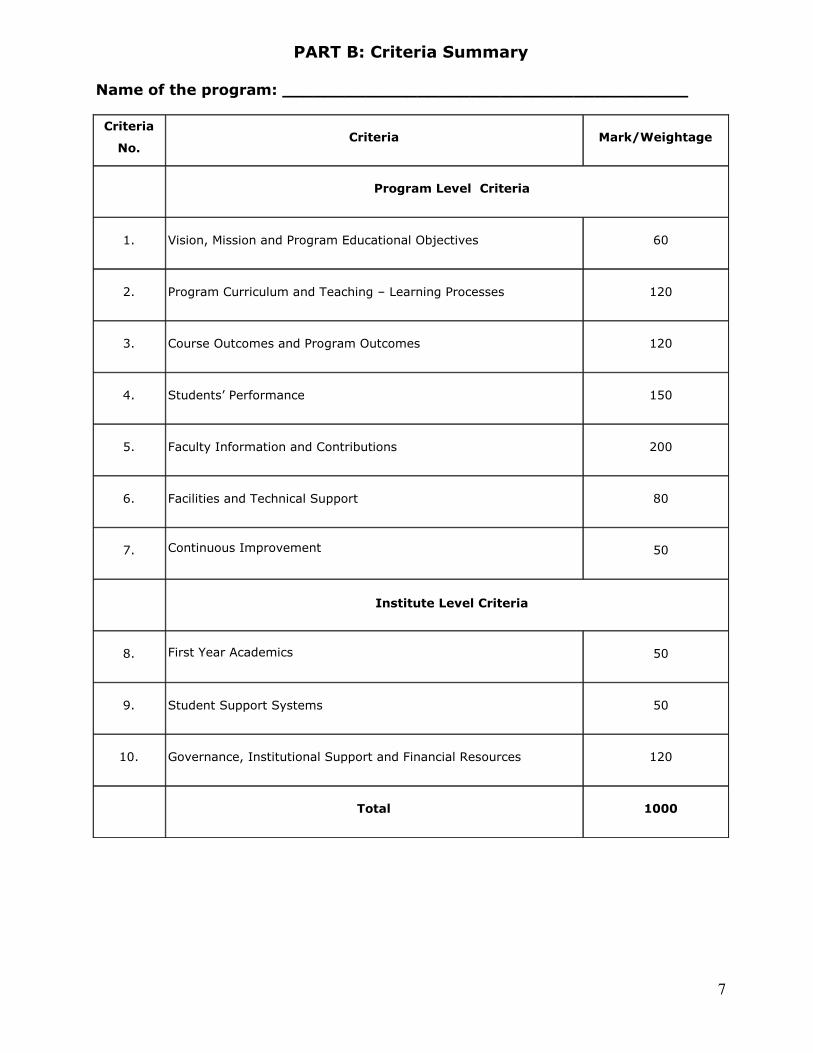
PART B: Criteria Summary
Name of the program: _______________________________________
Criteria
No. Criteria Mark/Weightage
Program Level Criteria
1. Vision, Mission and Program Educational Objectives 60
2. Program Curriculum and Teaching – Learning Processes 120
3. Course Outcomes and Program Outcomes 120
4. Students’ Performance 150
5. Faculty Information and Contributions 200
6. Facilities and Technical Support 80
7. Continuous Improvement
50
Institute Level Criteria
8.
First Year Academics
50
9. Student Support Systems 50
10. Governance, Institutional Support and Financial Resources 120
Total 1000
8
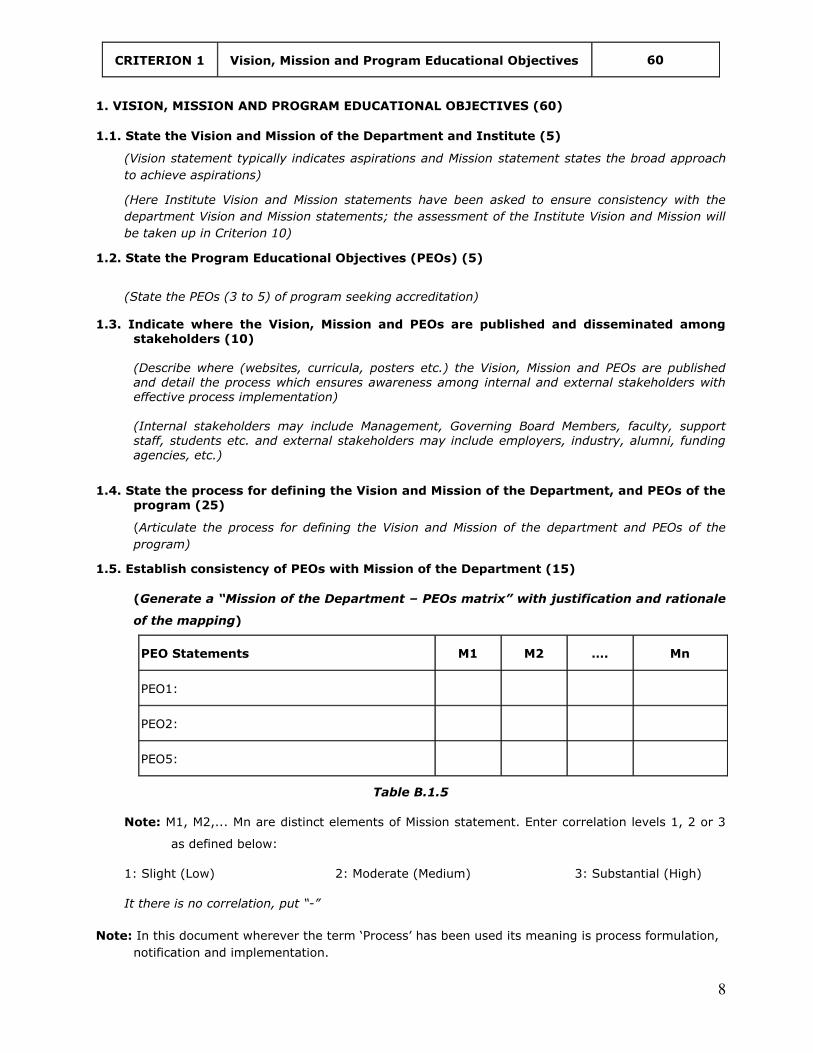
CRITERION 1 Vision, Mission and Program Educational Objectives 60
1. VISION, MISSION AND PROGRAM EDUCATIONAL OBJECTIVES (60)
1.1. State the Vision and Mission of the Department and Institute (5)
(Vision statement typically indicates aspirations and Mission statement states the broad approach
to achieve aspirations)
(Here Institute Vision and Mission statements have been asked to ensure consistency with the
department Vision and Mission statements; the assessment of the Institute Vision and Mission will
be taken up in Criterion 10)
1.2. State the Program Educational Objectives (PEOs) (5)
(State the PEOs (3 to 5) of program seeking accreditation)
1.3. Indicate where the Vision, Mission and PEOs are published and disseminated among
stakeholders (10)
(Describe where (websites, curricula, posters etc.) the Vision, Mission and PEOs are published
and detail the process which ensures awareness among internal and external stakeholders with
effective process implementation)
(Internal stakeholders may include Management, Governing Board Members, faculty, support
staff, students etc. and external stakeholders may include employers, industry, alumni, funding
agencies, etc.)
1.4. State the process for defining the Vision and Mission of the Department, and PEOs of the program (25)
(Articulate the process for defining the Vision and Mission of the department and PEOs of the
program)
1.5. Establish consistency of PEOs with Mission of the Department (15)
(Generate a “Mission of the Department – PEOs matrix” with justification and rationale
of the mapping)
PEO Statements M1 M2 …. Mn
PEO1:
PEO2:
PEO5:
Table B.1.5
Note: M1, M2,... Mn are distinct elements of Mission statement. Enter correlation levels 1, 2 or 3
as defined below:
1: Slight (Low) 2: Moderate (Medium) 3: Substantial (High)
It there is no correlation, put “-”
Note: In this document wherever the term ‘Process’ has been used its meaning is process formulation,
notification and implementation.
9
CRITERION 2 Program Curriculum and Teaching – Learning Processes 120
2. PROGRAM CURRICULUM AND TEACHING - LEARNING PROCESSES (120)
2.1. Program Curriculum (20)
2.1.1. State the process used to identify extent of compliance of the University curriculum for
attaining the Program Outcomes and Program Specific Outcomes as mentioned in
Annexure I. Also mention the identified curricular gaps, if any (10)
(State the process details; also mention identified curricular gaps).
Note: In case all POs are being demonstrably met through University Curriculum then 2.1.2
will not be applicable and the weightage of 2.1.1 will be 20.
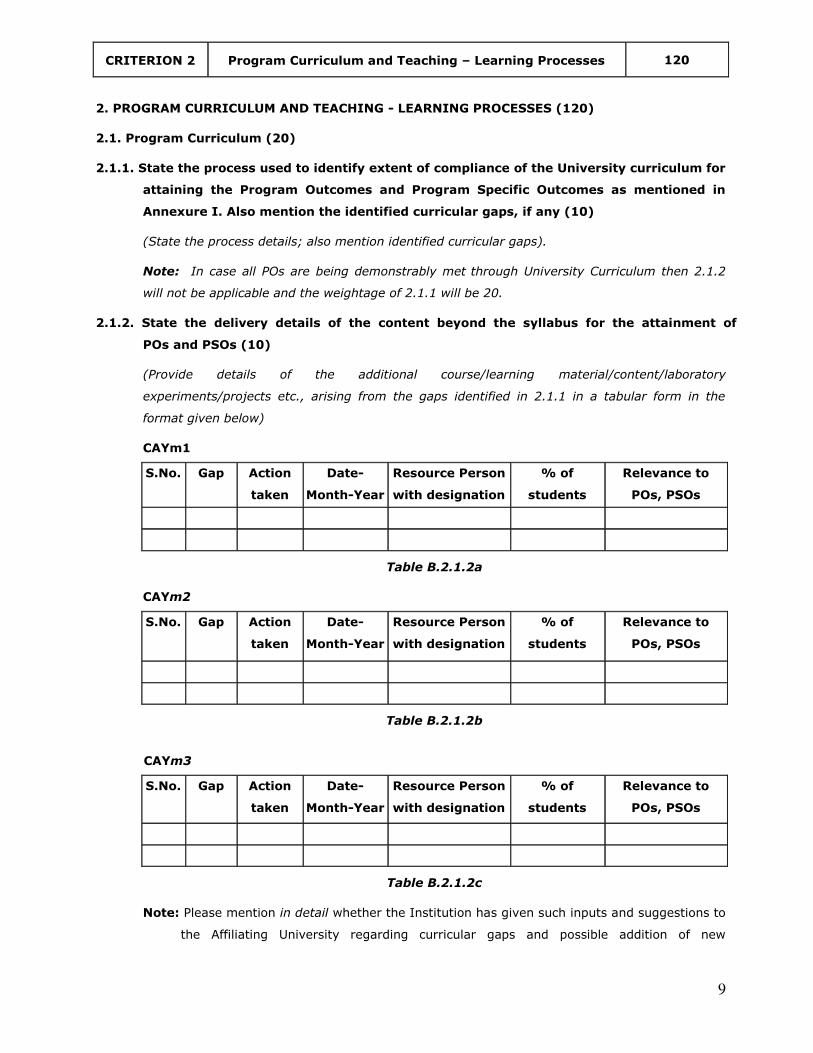
2.1.2. State the delivery details of the content beyond the syllabus for the attainment of
POs and PSOs (10)
(Provide details of the additional course/learning material/content/laboratory
experiments/projects etc., arising from the gaps identified in 2.1.1 in a tabular form in the
format given below)
CAYm1
S.No. Gap Action
taken
Date-
Month-Year
Resource Person
with designation
% of
students
Relevance to
POs, PSOs
Table B.2.1.2a
CAYm2
S.No. Gap Action
taken
Date-
Month-Year
Resource Person
with designation
% of
students
present
Relevance to
POs, PSOs
Table B.2.1.2b
CAYm3
S.No. Gap Action
taken
Date-
Month-Year
Resource Person
with designation
% of
students
Relevance to
POs, PSOs
Table B.2.1.2c
Note: Please mention in detail whether the Institution has given such inputs and suggestions to
the Affiliating University regarding curricular gaps and possible addition of new
10
content/add-on courses in the curriculum, to bridge the gap and to better attain program
outcome(s).
2.2. Teaching - Learning Processes (100)
2.2.1. Describe Processes followed to improve quality of Teaching & Learning (25)
(Processes may include adherence to academic calendar and improving instruction
methods using pedagogical initiatives such as real world examples, collaborative learning,
quality of laboratory experience with regard to conducting experiments, recording
observations, analysis of data etc. encouraging bright students, assisting weak students
etc. The implementation details and impact analysis need to be documented)
2.2.2. Quality of internal semester Question papers, Assignments and Evaluation (20)
(Mention the initiatives, implementation details and analysis of learning levels related to
quality of semester question papers, assignments and evaluation)
2.2.3. Quality of student projects (25)
(Quality of the project is measured in terms of consideration to factors including, but not
limited to, environment, safety, ethics, cost, type (application, product, research, review
etc.) and standards. Processes related to project identification, allotment, continuous
monitoring, evaluation including demonstration of working prototypes and enhancing the
relevance of projects. Mention Implementation details including details of POs and PSOs
addressed through the projects with justification)
2.2.4. Initiatives related to industry interaction (15)
(Give details of the industry involvement in the program such as industry-attached
laboratories, partial delivery of appropriate courses by industry experts etc. Mention the
initiatives, implementation details and impact analysis)
2.2.5. Initiatives related to industry internship/summer training (15)
(Mention the initiatives, implementation details and impact analysis)
11
CRITERION 3 Course Outcomes and Program Outcomes 120
3. COURSE OUTCOMES AND PROGRAM OUTCOMES (120)
3.1. Establish the correlation between the courses and the Program Outcomes (POs) and
Program Specific Outcomes (PSOs) (20)
(Program Outcomes as mentioned in Annexure I and Program Specific Outcomes as defined by the
Program)
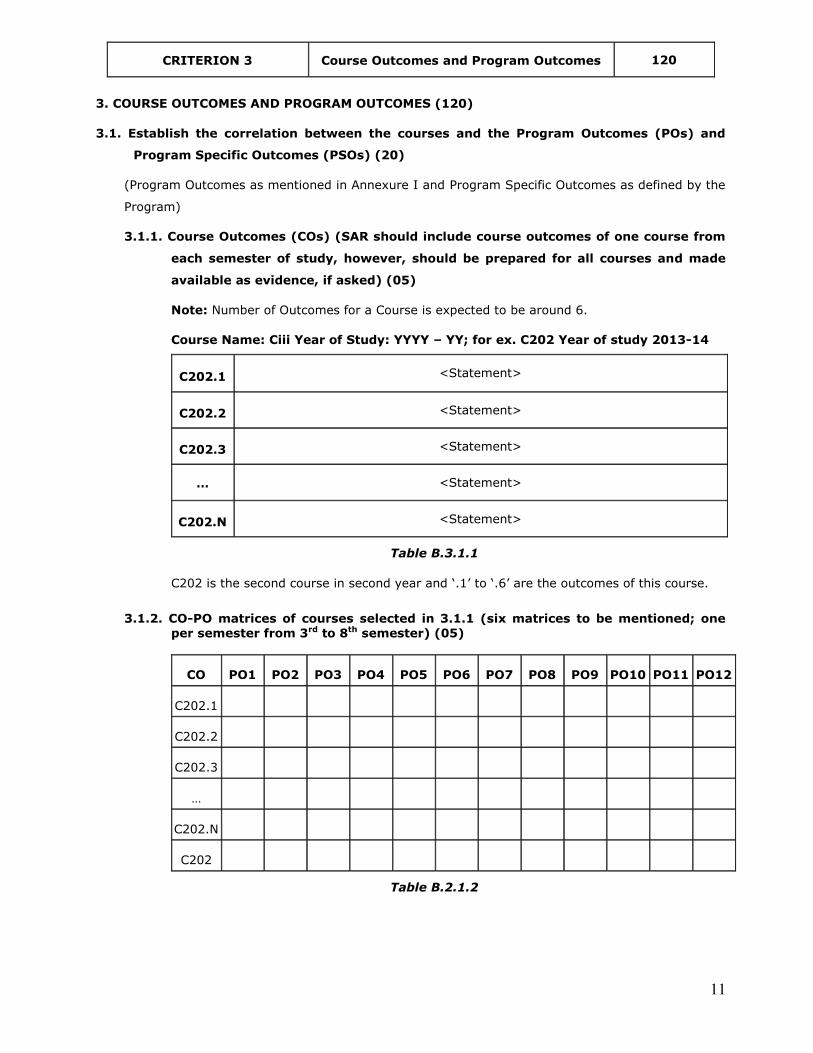
3.1.1. Course Outcomes (COs) (SAR should include course outcomes of one course from
each semester of study, however, should be prepared for all courses and made
available as evidence, if asked) (05)
Note: Number of Outcomes for a Course is expected to be around 6.
Course Name: Ciii Year of Study: YYYY – YY; for ex. C202 Year of study 2013-14
C202.1 <Statement>
C202.2 <Statement>
C202.3 <Statement>
… <Statement>
C202.N <Statement>
Table B.3.1.1
C202 is the second course in second year and ‘.1’ to ‘.6’ are the outcomes of this course.
3.1.2. CO-PO matrices of courses selected in 3.1.1 (six matrices to be mentioned; one
per semester from 3rd to 8th semester) (05)
CO PO1 PO2 PO3 PO4 PO5 PO6 PO7 PO8 PO9 PO10 PO11 PO12
C202.1
C202.2
C202.3
…
C202.N
C202
Table B.2.1.2
12
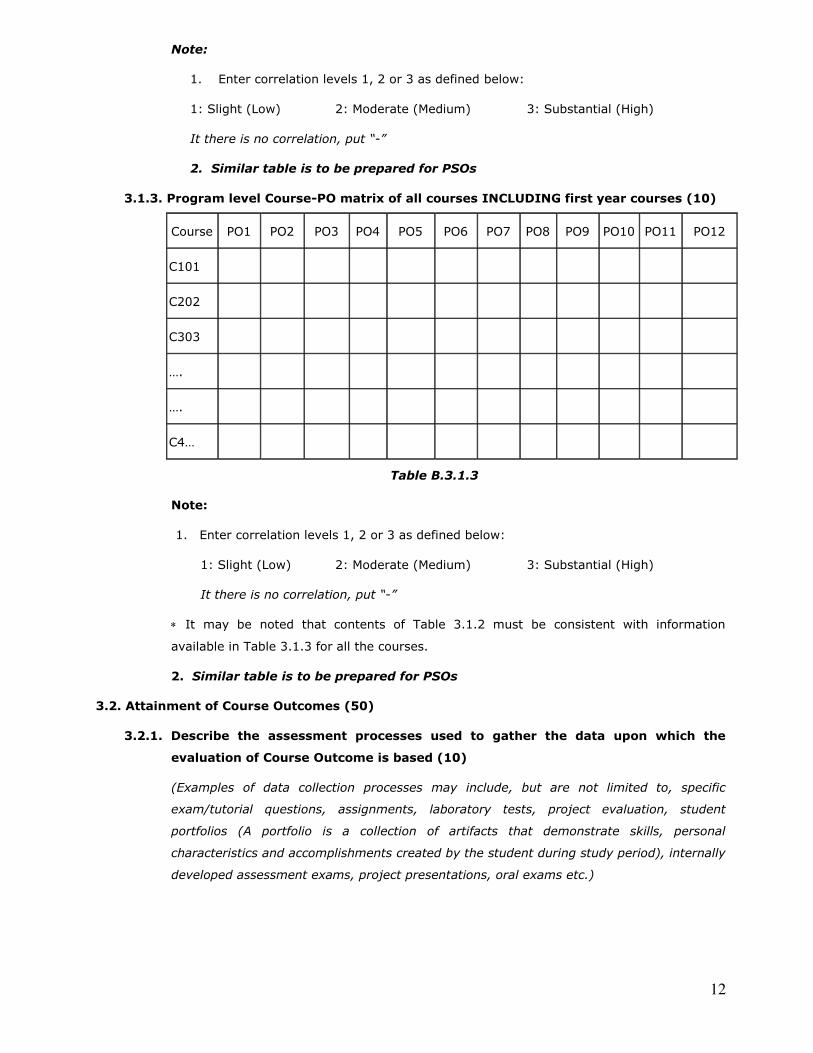
Note:
1. Enter correlation levels 1, 2 or 3 as defined below:
1: Slight (Low) 2: Moderate (Medium) 3: Substantial (High)
It there is no correlation, put “-”
2. Similar table is to be prepared for PSOs
3.1.3. Program level Course-PO matrix of all courses INCLUDING first year courses (10)
Course PO1 PO2 PO3 PO4 PO5 PO6 PO7 PO8 PO9 PO10 PO11 PO12
C101
C202
C303
….
….
C4…
Table B.3.1.3
Note:
1. Enter correlation levels 1, 2 or 3 as defined below:
1: Slight (Low) 2: Moderate (Medium) 3: Substantial (High)
It there is no correlation, put “-”
It may be noted that contents of Table 3.1.2 must be consistent with information
available in Table 3.1.3 for all the courses.
2. Similar table is to be prepared for PSOs
3.2. Attainment of Course Outcomes (50)
3.2.1. Describe the assessment processes used to gather the data upon which the
evaluation of Course Outcome is based (10)
(Examples of data collection processes may include, but are not limited to, specific
exam/tutorial questions, assignments, laboratory tests, project evaluation, student
portfolios (A portfolio is a collection of artifacts that demonstrate skills, personal
characteristics and accomplishments created by the student during study period), internally
developed assessment exams, project presentations, oral exams etc.)
13
3.2.2. Record the attainment of Course Outcomes of all courses with respect to set
attainment levels (40)
Program shall have set Course Outcome attainment levels for all courses.
(The attainment levels shall be set considering average performance levels in the university
examination or any higher value set as target for the assessment years. Attainment level
is to be measured in terms of student performance in internal assessments with respect to
the Course Outcomes of a course in addition to the performance in the University
examination)
Measuring Course Outcomes attained through University Examinations
Target may be stated in terms of percentage of students getting more than the university
average marks or more as selected by the Program in the final examination. For cases
where the university does not provide useful indicators like average or median marks etc.,
the program may choose an attainment level on its own with justification.
Example related to attainment levels Vs. targets: (The examples indicated are for
reference only. Program may appropriately define levels)
Attainment Level 1: 60% students scoring more than University average percentage
marks or set attainment level in the final examination.
Attainment Level 2: 70% students scoring more than University average percentage
marks or set attainment level in the final examination.
Attainment Level 3: 80% students scoring more than University average percentage
marks or set attainment level in the final examination.
Attainment is measured in terms of actual percentage of students getting set
percentage of marks.
If targets are achieved then all the course outcomes are attained for that year.
Program is expected to set higher targets for the following years as a part of
continuous improvement.
If targets are not achieved the program should put in place an action plan to attain
the target in subsequent years.
Measuring CO attainment through Internal Assessments: (The examples
indicated are for reference only. Program may appropriately define levels)
Target may be stated in terms of percentage of students getting more than class average
marks or set by the program in each of the associated COs in the assessment instruments
(midterm tests, assignments, mini projects, reports and presentations etc. as mapped with
the COs)
Example
Mid-term test 1 addresses C202.1 and C202.2. Out of the maximum 20 marks for this test
12 marks are associated with C202.1 and 8 marks are associated with C202.2.
14
Examples related to attainment levels Vs. targets:
Attainment Level 1: 60% students scoring more than 60% marks out of the relevant
maximum marks.
Attainment Level 2: 70% students scoring more than 60% marks out of the relevant
maximum marks.
Attainment Level 3: 80% students scoring more than 60% marks out of the relevant
maximum marks.
Attainment is measured in terms of actual percentage of students getting set
percentage of marks.
If targets are achieved then the C202.1 and C202.2 are attained for that year.
Program is expected to set higher targets for the following years as a part of
continuous improvement.
If targets are not achieved the program should put in place an action plan to attain
the target in subsequent years.
Similar targets and achievement are to be stated for the other midterm tests/internal
assessment instruments
Course Outcome Attainment:
For example:
Attainment through University Examination: Substantial i.e. 3
Attainment through Internal Assessment: Moderate i.e. 2
Assuming 80% weightage to University examination and 20% weightage to Internal
assessment, the attainment calculations will be (80% of University level) + (20% of
Internal level ) i.e. 80% of 3 + 20% of 2 = 2.4 + 0.4 = 2.8
Note: Weightage of 80% to University exams is only an example. Programs may decide
weightages appropriately for University exams and internal assessment with due
justification.
3.3. Attainment of Program Outcomes and Program Specific Outcomes (50)
3.3.1. Describe assessment tools and processes used for measuring the attainment of
each of the Program Outcomes and Program Specific Outcomes (10)
(Describe the assessment tools and processes used to gather the data upon which the
evaluation of each of the Program Outcomes and Program Specific Outcomes is based
indicating the frequency with which these processes are carried out. Describe the
assessment processes that demonstrate the degree to which the Program Outcomes and
Program Specific Outcomes are attained and document the attainment levels)
15
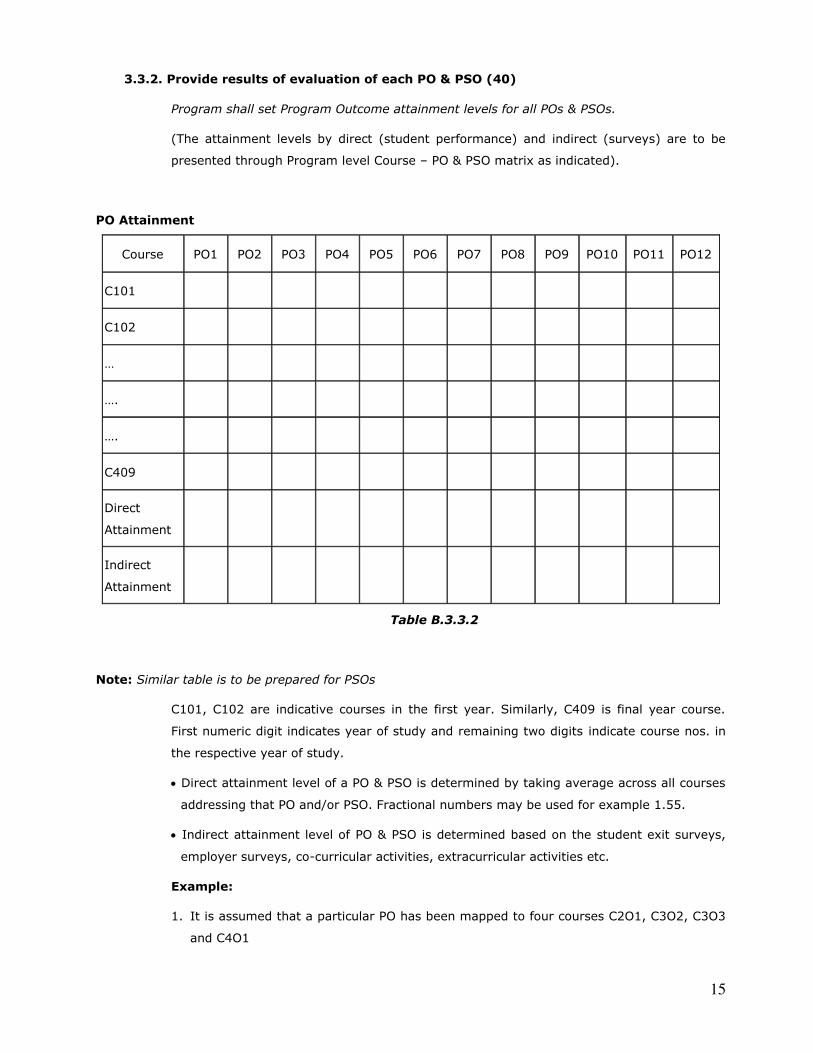
3.3.2. Provide results of evaluation of each PO & PSO (40)
Program shall set Program Outcome attainment levels for all POs & PSOs.
(The attainment levels by direct (student performance) and indirect (surveys) are to be
presented through Program level Course – PO & PSO matrix as indicated).
PO Attainment
Course PO1 PO2 PO3 PO4 PO5 PO6 PO7 PO8 PO9 PO10 PO11 PO12
C101
C102
…
….
….
C409
Direct
Attainment
Indirect
Attainment
Table B.3.3.2
Note: Similar table is to be prepared for PSOs
C101, C102 are indicative courses in the first year. Similarly, C409 is final year course.
First numeric digit indicates year of study and remaining two digits indicate course nos. in
the respective year of study.
Direct attainment level of a PO & PSO is determined by taking average across all courses
addressing that PO and/or PSO. Fractional numbers may be used for example 1.55.
Indirect attainment level of PO & PSO is determined based on the student exit surveys,
employer surveys, co-curricular activities, extracurricular activities etc.
Example:
1. It is assumed that a particular PO has been mapped to four courses C2O1, C3O2, C3O3
and C4O1
16
2. The attainment level for each of the four courses will be as per the examples shown in
3.2.2
3. PO attainment level will be based on attainment levels of direct assessment and indirect
assessment
4. For affiliated, non-autonomous colleges, it is assumed that while deciding on overall
attainment level 80% weightage may be given to direct assessment and 20% weightage
to indirect assessment through surveys from students(largely), employers (to some
extent). Program may have different weightages with appropriate justification.
5. Assuming following actual attainment levels:
Direct Assessment
C201 –High (3)
C302 – Medium (2)
C303 – Low (1)
C401 – High (3)
Attainment level will be summation of levels divided by no. of courses 3+2+1+3/4=
9/4=2.25
Indirect Assessment
Surveys, Analysis, customized to an average value as per levels 1, 2 & 3.
Assumed level - 2
6. PO Attainment level will be 80% of direct assessment + 20% of indirect assessment i.e.
1.8 + 0.4 = 2.2.
Note: Similarly for PSOs
17
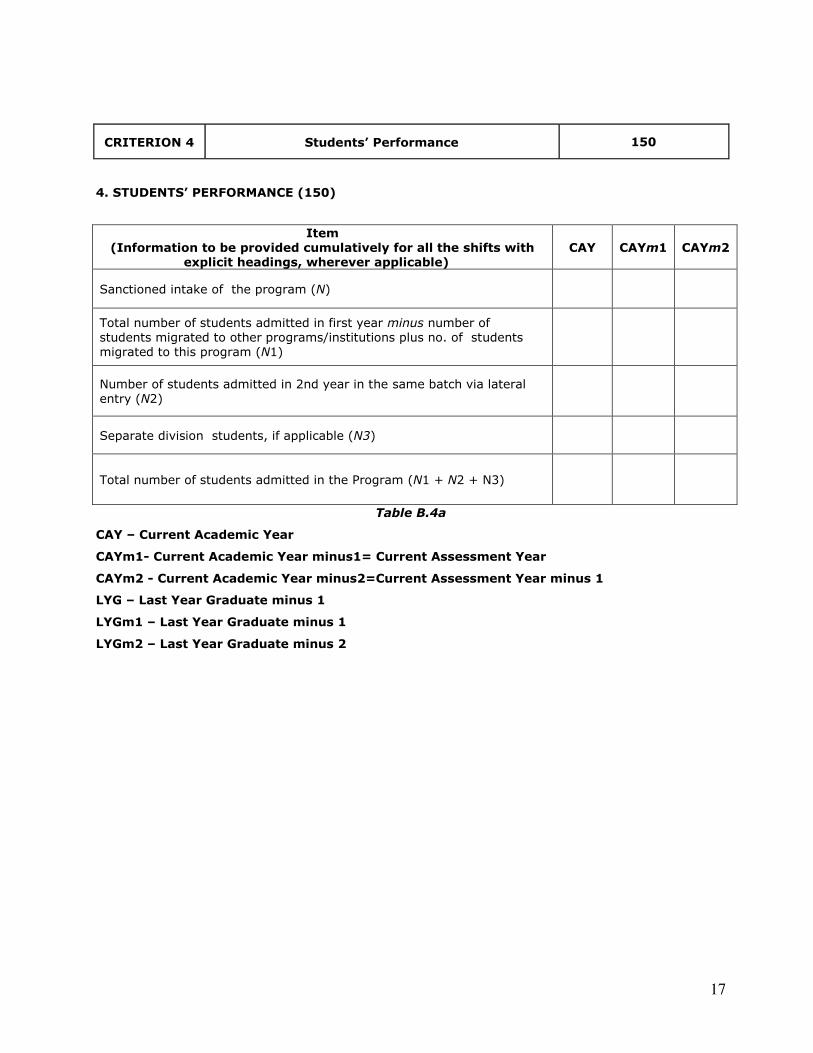
CRITERION 4 Students’ Performance 150
4. STUDENTS’ PERFORMANCE (150)
Table B.4a
CAY – Current Academic Year
CAYm1- Current Academic Year minus1= Current Assessment Year
CAYm2 - Current Academic Year minus2=Current Assessment Year minus 1
LYG – Last Year Graduate minus 1
LYGm1 – Last Year Graduate minus 1
LYGm2 – Last Year Graduate minus 2
Item (Information to be provided cumulatively for all the shifts with
explicit headings, wherever applicable) CAY CAYm1 CAYm2
Sanctioned intake of the program (N)
Total number of students admitted in first year minus number of
students migrated to other programs/institutions plus no. of students
migrated to this program (N1)
Number of students admitted in 2nd year in the same batch via lateral
entry (N2)
Separate division students, if applicable (N3)
Total number of students admitted in the Program (N1 + N2 + N3)
18
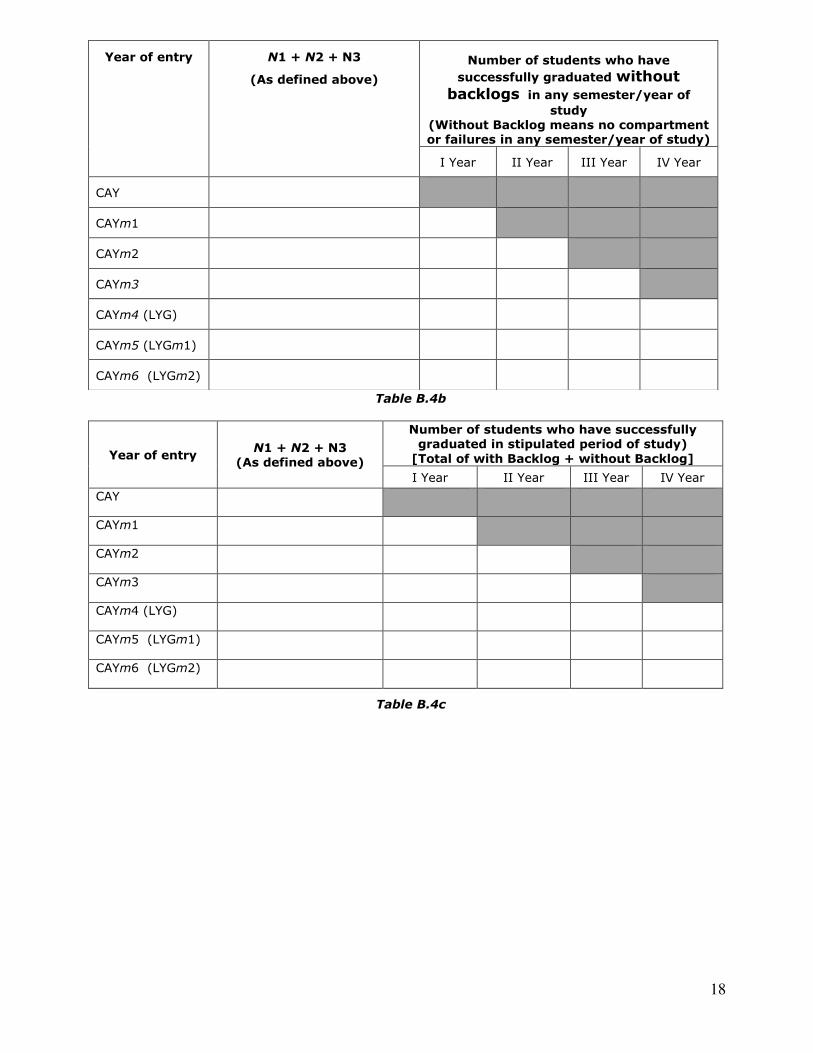
Table B.4b
Year of entry N1 + N2 + N3
(As defined above)
Number of students who have successfully graduated in stipulated period of study)
[Total of with Backlog + without Backlog]
I Year II Year III Year IV Year
CAY
CAYm1
CAYm2
CAYm3
CAYm4 (LYG)
CAYm5 (LYGm1)
CAYm6 (LYGm2)
Table B.4c
Year of entry N1 + N2 + N3
(As defined above)
Number of students who have
successfully graduated without backlogs in any semester/year of
study (Without Backlog means no compartment or failures in any semester/year of study)
I Year II Year III Year IV Year
CAY
CAYm1
CAYm2
CAYm3
CAYm4 (LYG)
CAYm5 (LYGm1)
CAYm6 (LYGm2)
19
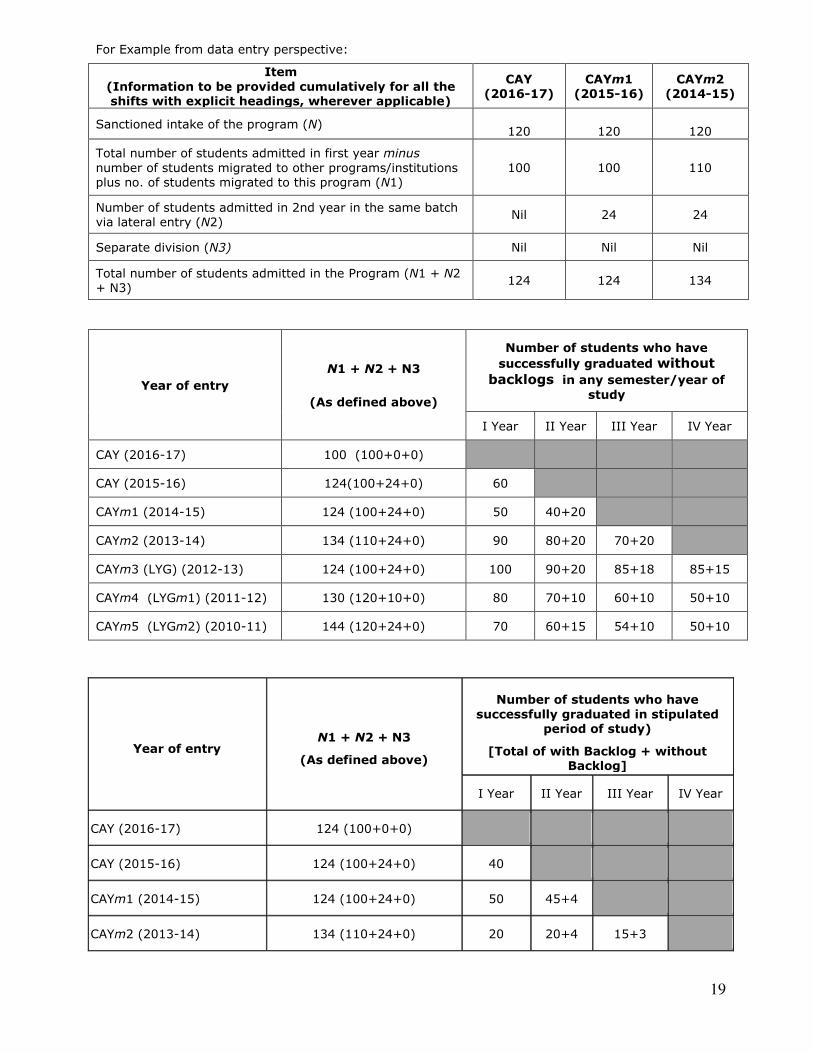
For Example from data entry perspective:
Item
(Information to be provided cumulatively for all the shifts with explicit headings, wherever applicable)
CAY (2016-17)
CAYm1 (2015-16)
CAYm2 (2014-15)
Sanctioned intake of the program (N)
120
120
120
Total number of students admitted in first year minus
number of students migrated to other programs/institutions
plus no. of students migrated to this program (N1)
100 100 110
Number of students admitted in 2nd year in the same batch
via lateral entry (N2) Nil 24 24
Separate division (N3) Nil Nil Nil
Total number of students admitted in the Program (N1 + N2
+ N3) 124 124 134
Year of entry
N1 + N2 + N3
(As defined above)
Number of students who have
successfully graduated without
backlogs in any semester/year of
study
I Year II Year III Year IV Year
CAY (2016-17) 100 (100+0+0)
CAY (2015-16) 124(100+24+0) 60
CAYm1 (2014-15) 124 (100+24+0) 50 40+20
CAYm2 (2013-14) 134 (110+24+0) 90 80+20 70+20
CAYm3 (LYG) (2012-13) 124 (100+24+0) 100 90+20 85+18 85+15
CAYm4 (LYGm1) (2011-12) 130 (120+10+0) 80 70+10 60+10 50+10
CAYm5 (LYGm2) (2010-11) 144 (120+24+0) 70 60+15 54+10 50+10
Year of entry N1 + N2 + N3
(As defined above)
Number of students who have
successfully graduated in stipulated period of study)
[Total of with Backlog + without Backlog]
I Year II Year III Year IV Year
CAY (2016-17) 124 (100+0+0)
CAY (2015-16) 124 (100+24+0) 40
CAYm1 (2014-15) 124 (100+24+0) 50 45+4
CAYm2 (2013-14) 134 (110+24+0) 20 20+4 15+3
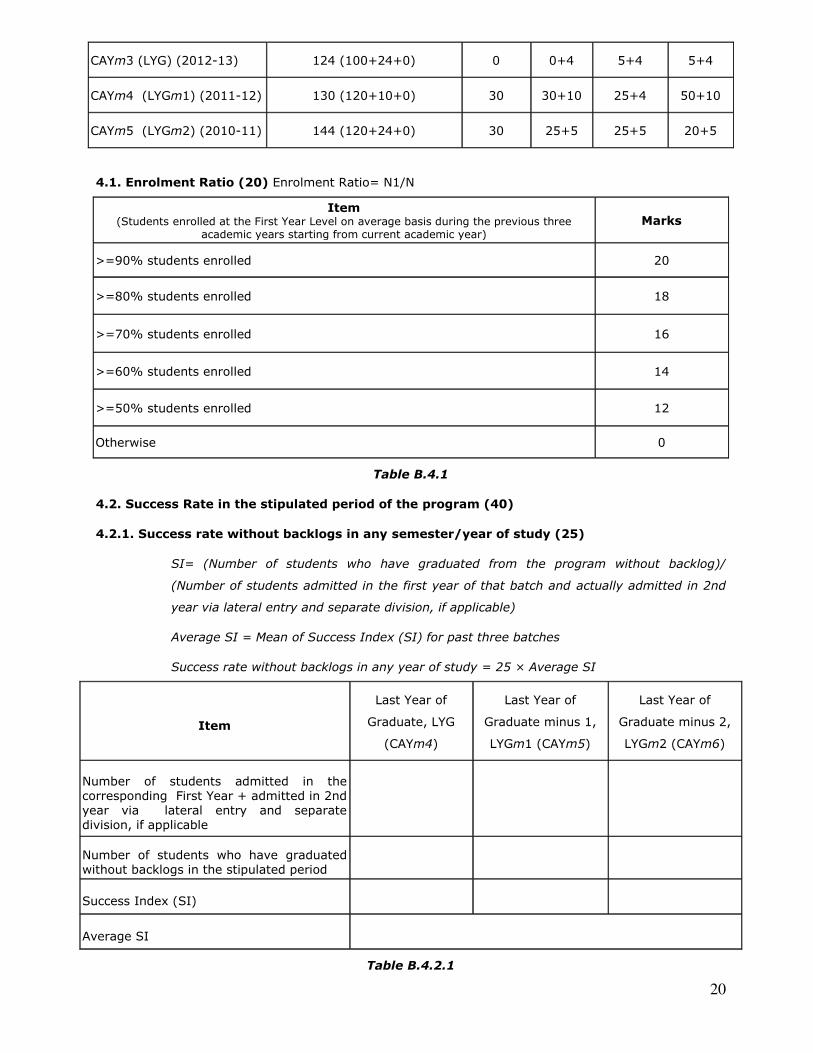
20
CAYm3 (LYG) (2012-13) 124 (100+24+0) 0 0+4 5+4 5+4
CAYm4 (LYGm1) (2011-12) 130 (120+10+0) 30 30+10 25+4 50+10
CAYm5 (LYGm2) (2010-11) 144 (120+24+0) 30 25+5 25+5 20+5
4.1. Enrolment Ratio (20) Enrolment Ratio= N1/N
Item (Students enrolled at the First Year Level on average basis during the previous three
academic years starting from current academic year) Marks
>=90% students enrolled 20
>=80% students enrolled 18
>=70% students enrolled 16
>=60% students enrolled 14
>=50% students enrolled 12
Otherwise 0
Table B.4.1
4.2. Success Rate in the stipulated period of the program (40)
4.2.1. Success rate without backlogs in any semester/year of study (25)
SI= (Number of students who have graduated from the program without backlog)/
(Number of students admitted in the first year of that batch and actually admitted in 2nd
year via lateral entry and separate division, if applicable)
Average SI = Mean of Success Index (SI) for past three batches
Success rate without backlogs in any year of study = 25 × Average SI
Item
Last Year of
Graduate, LYG
(CAYm4)
Last Year of
Graduate minus 1,
LYGm1 (CAYm5)
Last Year of
Graduate minus 2,
LYGm2 (CAYm6)
Number of students admitted in the
corresponding First Year + admitted in 2nd
year via lateral entry and separate
division, if applicable
Number of students who have graduated
without backlogs in the stipulated period
Success Index (SI)
Average SI
Table B.4.2.1
21
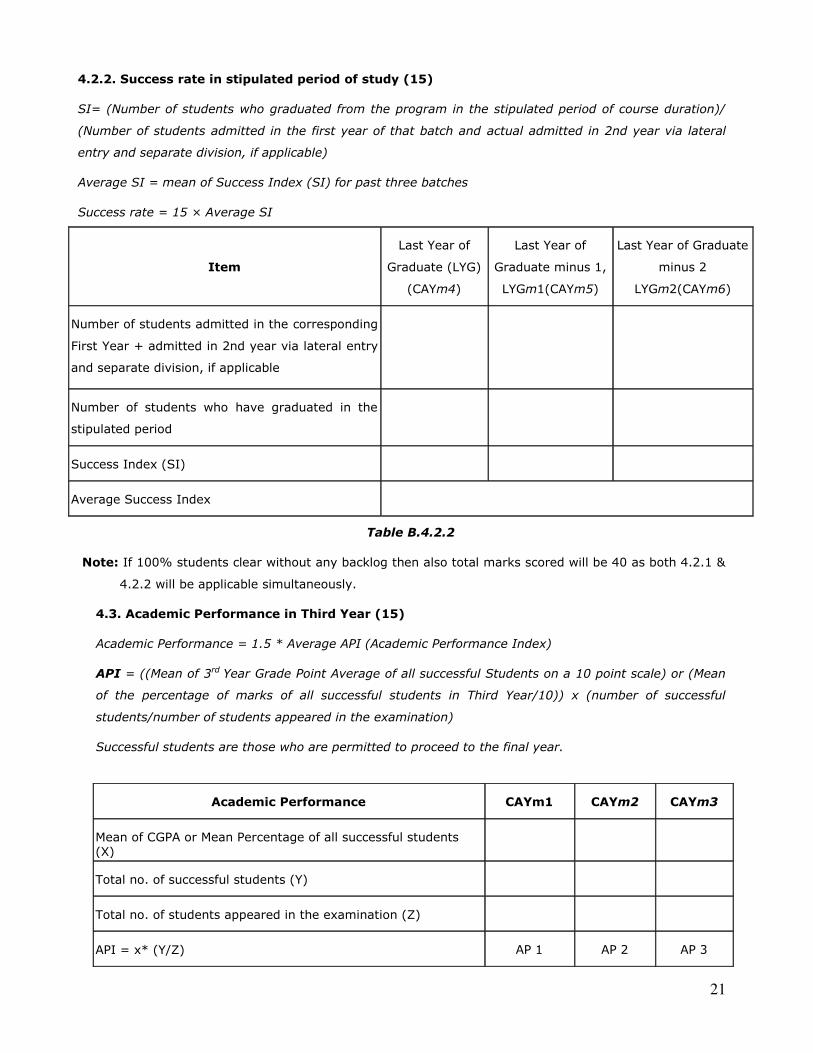
4.2.2. Success rate in stipulated period of study (15)
SI= (Number of students who graduated from the program in the stipulated period of course duration)/
(Number of students admitted in the first year of that batch and actual admitted in 2nd year via lateral
entry and separate division, if applicable)
Average SI = mean of Success Index (SI) for past three batches
Success rate = 15 × Average SI
Item
Last Year of
Graduate (LYG)
(CAYm4)
Last Year of
Graduate minus 1,
LYGm1(CAYm5)
Last Year of Graduate
minus 2
LYGm2(CAYm6)
Number of students admitted in the corresponding
First Year + admitted in 2nd year via lateral entry
and separate division, if applicable
Number of students who have graduated in the
stipulated period
Success Index (SI)
Average Success Index
Table B.4.2.2
Note: If 100% students clear without any backlog then also total marks scored will be 40 as both 4.2.1 &
4.2.2 will be applicable simultaneously.
4.3. Academic Performance in Third Year (15)
Academic Performance = 1.5 * Average API (Academic Performance Index)
API = ((Mean of 3rd Year Grade Point Average of all successful Students on a 10 point scale) or (Mean
of the percentage of marks of all successful students in Third Year/10)) x (number of successful
students/number of students appeared in the examination)
Successful students are those who are permitted to proceed to the final year.
Academic Performance CAYm1 CAYm2 CAYm3
Mean of CGPA or Mean Percentage of all successful students
(X)
Total no. of successful students (Y)
Total no. of students appeared in the examination (Z)
API = x* (Y/Z) AP 1 AP 2 AP 3
22
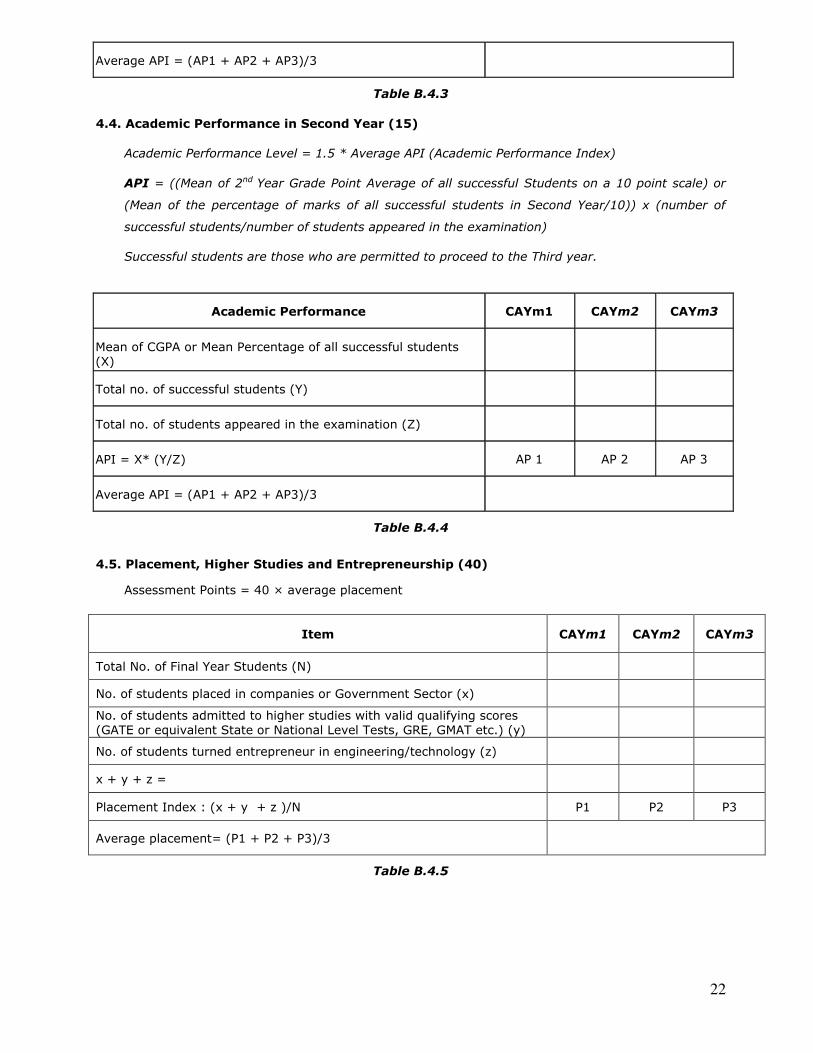
Table B.4.3
4.4. Academic Performance in Second Year (15)
Academic Performance Level = 1.5 * Average API (Academic Performance Index)
API = ((Mean of 2nd Year Grade Point Average of all successful Students on a 10 point scale) or
(Mean of the percentage of marks of all successful students in Second Year/10)) x (number of
successful students/number of students appeared in the examination)
Successful students are those who are permitted to proceed to the Third year.
Table B.4.4
4.5. Placement, Higher Studies and Entrepreneurship (40)
Assessment Points = 40 × average placement
Item CAYm1 CAYm2 CAYm3
Total No. of Final Year Students (N)
No. of students placed in companies or Government Sector (x)
No. of students admitted to higher studies with valid qualifying scores
(GATE or equivalent State or National Level Tests, GRE, GMAT etc.) (y)
No. of students turned entrepreneur in engineering/technology (z)
x + y + z =
Placement Index : (x + y + z )/N P1 P2 P3
Average placement= (P1 + P2 + P3)/3
Table B.4.5
Average API = (AP1 + AP2 + AP3)/3
Academic Performance CAYm1 CAYm2 CAYm3
Mean of CGPA or Mean Percentage of all successful students
(X)
Total no. of successful students (Y)
Total no. of students appeared in the examination (Z)
API = X* (Y/Z) AP 1 AP 2 AP 3
Average API = (AP1 + AP2 + AP3)/3
23
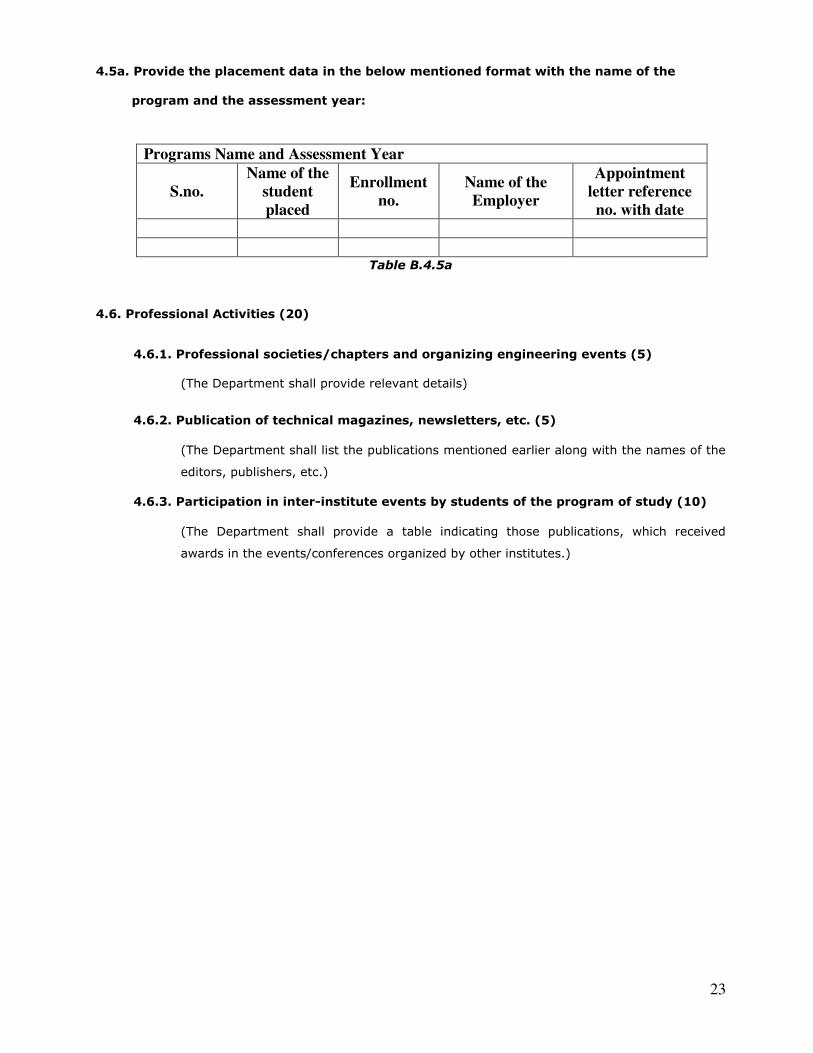
4.5a. Provide the placement data in the below mentioned format with the name of the
program and the assessment year:
Programs Name and Assessment Year
S.no.
Name of the
student
placed
Enrollment
no.
Name of the
Employer
Appointment
letter reference
no. with date
Table B.4.5a
4.6. Professional Activities (20)
4.6.1. Professional societies/chapters and organizing engineering events (5)
(The Department shall provide relevant details)
4.6.2. Publication of technical magazines, newsletters, etc. (5)
(The Department shall list the publications mentioned earlier along with the names of the
editors, publishers, etc.)
4.6.3. Participation in inter-institute events by students of the program of study (10)
(The Department shall provide a table indicating those publications, which received
awards in the events/conferences organized by other institutes.)
24
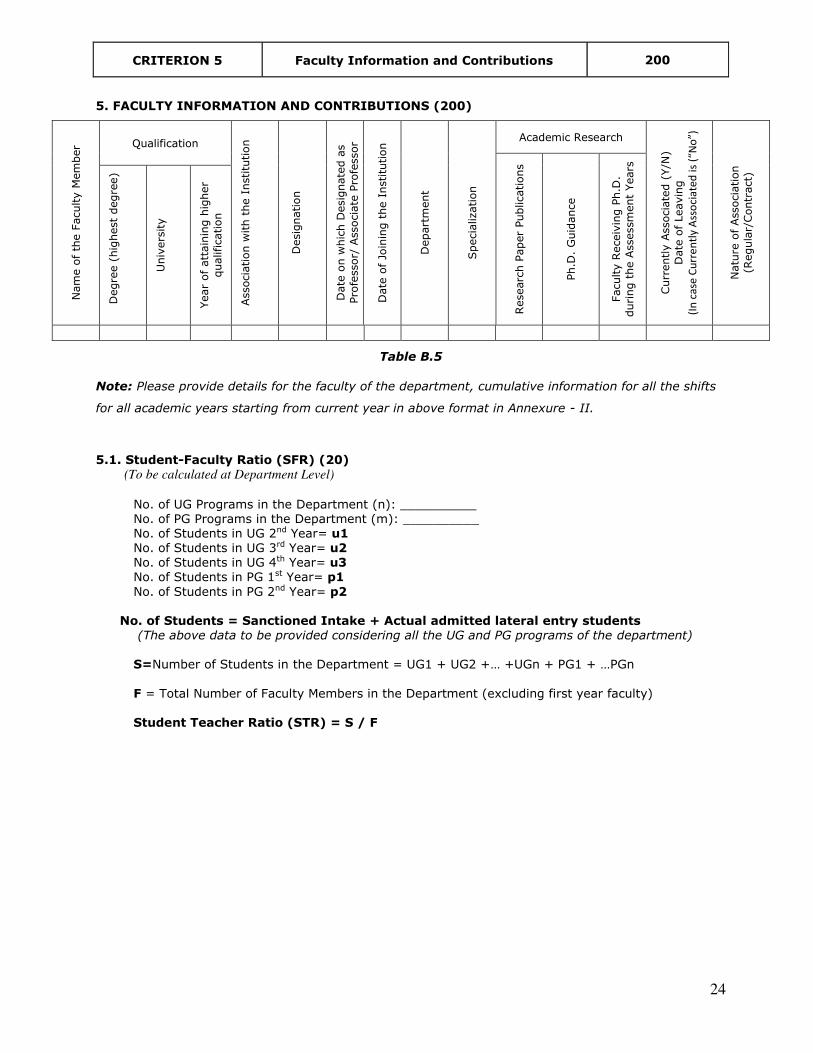
CRITERION 5 Faculty Information and Contributions 200
5. FACULTY INFORMATION AND CONTRIBUTIONS (200)
Nam
e o
f th
e F
aculty M
em
ber Qualification
Associa
tion w
ith t
he I
nstitu
tion
Desig
nation
Date
on w
hic
h D
esig
nate
d a
s
Pro
fessor/
Associa
te P
rofe
ssor
Date
of Jo
inin
g t
he I
nstitu
tion
Depart
ment
Specia
lization
Academic Research
Curr
ently A
ssocia
ted (
Y/N
)
Date
of Leavin
g
(In
ca
se C
urr
en
tly
Ass
oci
ate
d i
s (“
No”)
Natu
re o
f Associa
tion
(Regula
r/Contr
act)
Researc
h P
aper
Publications
Ph.D
. G
uid
ance
Faculty R
eceiv
ing P
h.D
.
during t
he A
ssessm
ent
Years
Degre
e (
hig
hest
degre
e)
Univ
ers
ity
Year
of att
ain
ing h
igher
qualification
Table B.5
Note: Please provide details for the faculty of the department, cumulative information for all the shifts
for all academic years starting from current year in above format in Annexure - II.
5.1. Student-Faculty Ratio (SFR) (20) (To be calculated at Department Level)
No. of UG Programs in the Department (n): __________
No. of PG Programs in the Department (m): __________
No. of Students in UG 2nd Year= u1
No. of Students in UG 3rd Year= u2
No. of Students in UG 4th Year= u3
No. of Students in PG 1st Year= p1
No. of Students in PG 2nd Year= p2
No. of Students = Sanctioned Intake + Actual admitted lateral entry students
(The above data to be provided considering all the UG and PG programs of the department)
S=Number of Students in the Department = UG1 + UG2 +… +UGn + PG1 + …PGn
F = Total Number of Faculty Members in the Department (excluding first year faculty)
Student Teacher Ratio (STR) = S / F
25
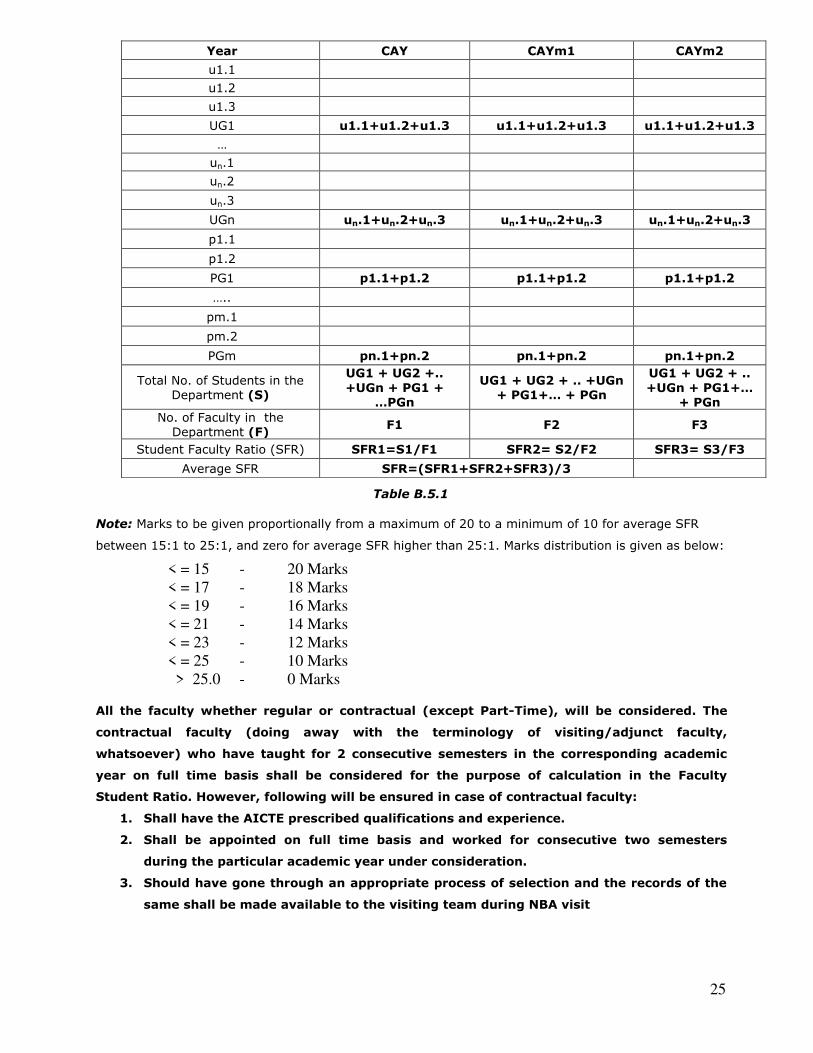
Table B.5.1
Note: Marks to be given proportionally from a maximum of 20 to a minimum of 10 for average SFR
between 15:1 to 25:1, and zero for average SFR higher than 25:1. Marks distribution is given as below:
< = 15 - 20 Marks
< = 17 - 18 Marks
< = 19 - 16 Marks
< = 21 - 14 Marks
< = 23 - 12 Marks
< = 25 - 10 Marks
> 25.0 - 0 Marks
All the faculty whether regular or contractual (except Part-Time), will be considered. The
contractual faculty (doing away with the terminology of visiting/adjunct faculty,
whatsoever) who have taught for 2 consecutive semesters in the corresponding academic
year on full time basis shall be considered for the purpose of calculation in the Faculty
Student Ratio. However, following will be ensured in case of contractual faculty:
1. Shall have the AICTE prescribed qualifications and experience.
2. Shall be appointed on full time basis and worked for consecutive two semesters
during the particular academic year under consideration.
3. Should have gone through an appropriate process of selection and the records of the
same shall be made available to the visiting team during NBA visit
Year CAY CAYm1 CAYm2
u1.1
u1.2
u1.3
UG1 u1.1+u1.2+u1.3 u1.1+u1.2+u1.3 u1.1+u1.2+u1.3
…
un.1
un.2
un.3
UGn un.1+un.2+un.3 un.1+un.2+un.3 un.1+un.2+un.3
p1.1
p1.2
PG1 p1.1+p1.2 p1.1+p1.2 p1.1+p1.2
…..
pm.1
pm.2
PGm pn.1+pn.2 pn.1+pn.2 pn.1+pn.2
Total No. of Students in the
Department (S)
UG1 + UG2 +..
+UGn + PG1 + …PGn
UG1 + UG2 + .. +UGn + PG1+… + PGn
UG1 + UG2 + ..
+UGn + PG1+… + PGn
No. of Faculty in the
Department (F) F1 F2 F3
Student Faculty Ratio (SFR) SFR1=S1/F1 SFR2= S2/F2 SFR3= S3/F3
Average SFR SFR=(SFR1+SFR2+SFR3)/3
26
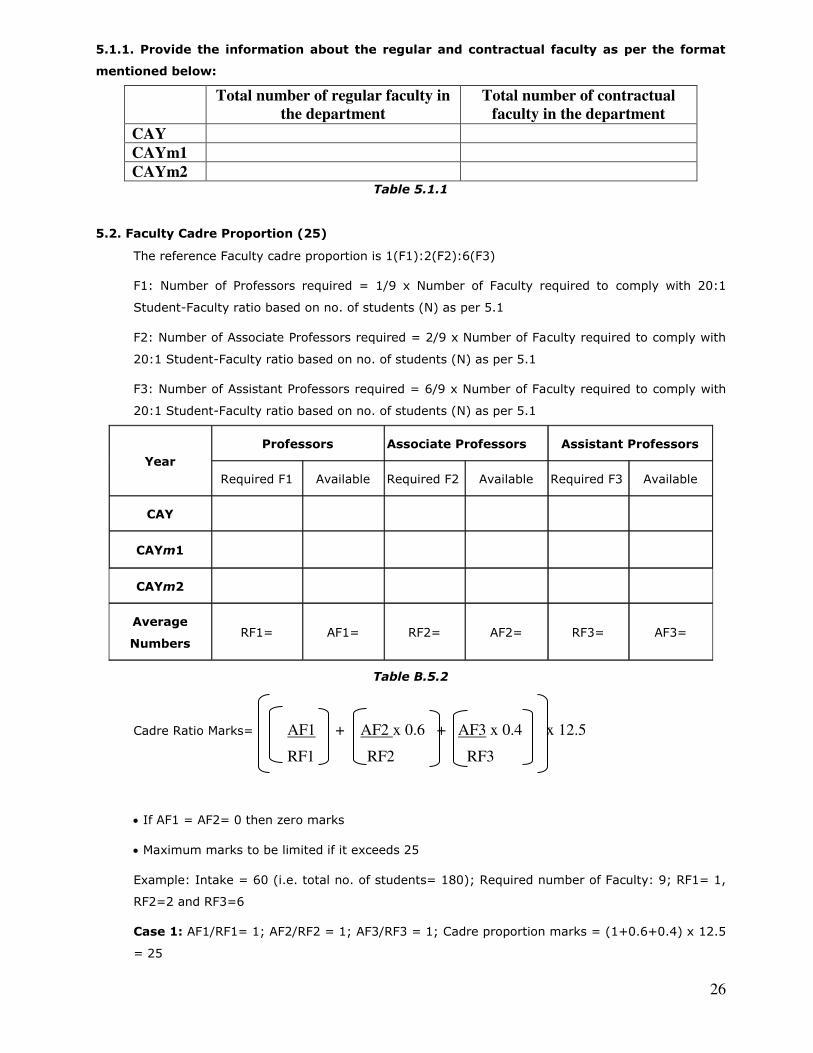
5.1.1. Provide the information about the regular and contractual faculty as per the format
mentioned below:
Total number of regular faculty in
the department
Total number of contractual
faculty in the department
CAY
CAYm1
CAYm2
Table 5.1.1
5.2. Faculty Cadre Proportion (25)
The reference Faculty cadre proportion is 1(F1):2(F2):6(F3)
F1: Number of Professors required = 1/9 x Number of Faculty required to comply with 20:1
Student-Faculty ratio based on no. of students (N) as per 5.1
F2: Number of Associate Professors required = 2/9 x Number of Faculty required to comply with
20:1 Student-Faculty ratio based on no. of students (N) as per 5.1
F3: Number of Assistant Professors required = 6/9 x Number of Faculty required to comply with
20:1 Student-Faculty ratio based on no. of students (N) as per 5.1
Year
Professors Associate Professors Assistant Professors
Required F1 Available Required F2 Available Required F3 Available
CAY
CAYm1
CAYm2
Average
Numbers RF1= AF1= RF2= AF2= RF3= AF3=
Table B.5.2
Cadre Ratio Marks= AF1 + AF2 x 0.6 + AF3 x 0.4 x 12.5
RF1 RF2 RF3
If AF1 = AF2= 0 then zero marks
Maximum marks to be limited if it exceeds 25
Example: Intake = 60 (i.e. total no. of students= 180); Required number of Faculty: 9; RF1= 1,
RF2=2 and RF3=6
Case 1: AF1/RF1= 1; AF2/RF2 = 1; AF3/RF3 = 1; Cadre proportion marks = (1+0.6+0.4) x 12.5
= 25
27
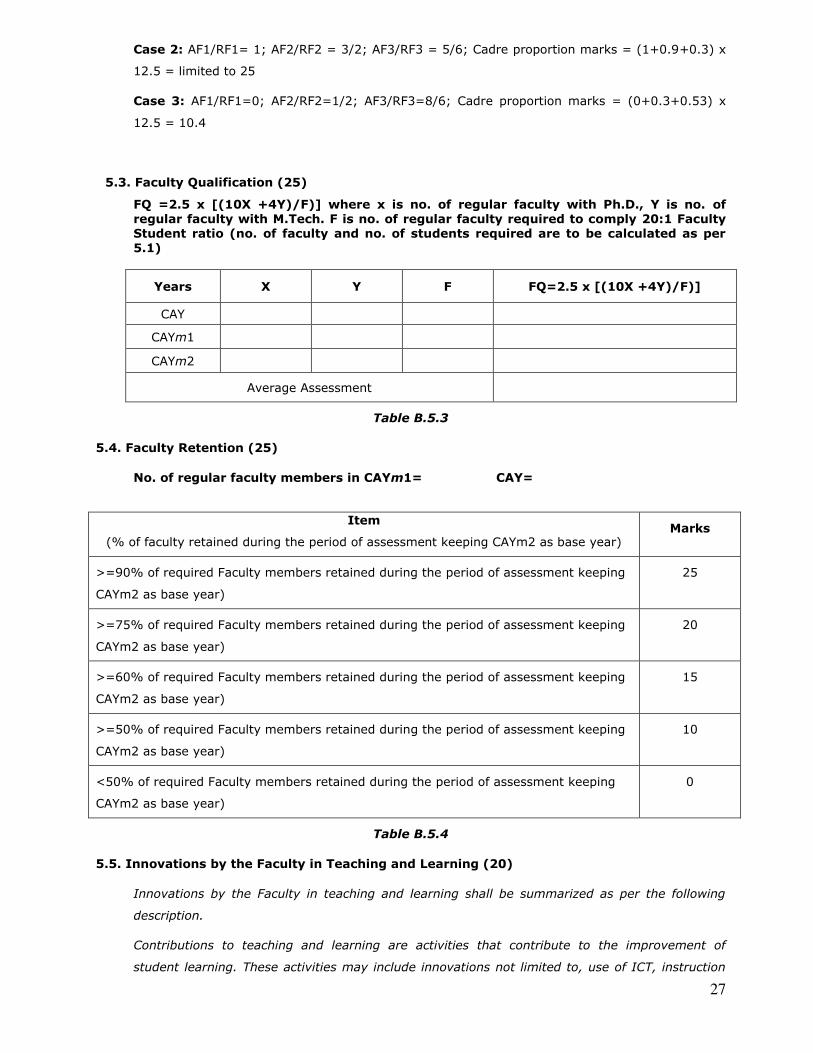
Case 2: AF1/RF1= 1; AF2/RF2 = 3/2; AF3/RF3 = 5/6; Cadre proportion marks = (1+0.9+0.3) x
12.5 = limited to 25
Case 3: AF1/RF1=0; AF2/RF2=1/2; AF3/RF3=8/6; Cadre proportion marks = (0+0.3+0.53) x
12.5 = 10.4
5.3. Faculty Qualification (25)
FQ =2.5 x [(10X +4Y)/F)] where x is no. of regular faculty with Ph.D., Y is no. of regular faculty with M.Tech. F is no. of regular faculty required to comply 20:1 Faculty Student ratio (no. of faculty and no. of students required are to be calculated as per 5.1)
Years X Y F FQ=2.5 x [(10X +4Y)/F)]
CAY
CAYm1
CAYm2
Average Assessment
Table B.5.3
5.4. Faculty Retention (25)
No. of regular faculty members in CAYm1= CAY=
Item
(% of faculty retained during the period of assessment keeping CAYm2 as base year) Marks
>=90% of required Faculty members retained during the period of assessment keeping
CAYm2 as base year)
25
>=75% of required Faculty members retained during the period of assessment keeping
CAYm2 as base year)
20
>=60% of required Faculty members retained during the period of assessment keeping
CAYm2 as base year)
15
>=50% of required Faculty members retained during the period of assessment keeping
CAYm2 as base year)
10
<50% of required Faculty members retained during the period of assessment keeping
CAYm2 as base year)
0
Table B.5.4
5.5. Innovations by the Faculty in Teaching and Learning (20)
Innovations by the Faculty in teaching and learning shall be summarized as per the following
description.
Contributions to teaching and learning are activities that contribute to the improvement of
student learning. These activities may include innovations not limited to, use of ICT, instruction
28
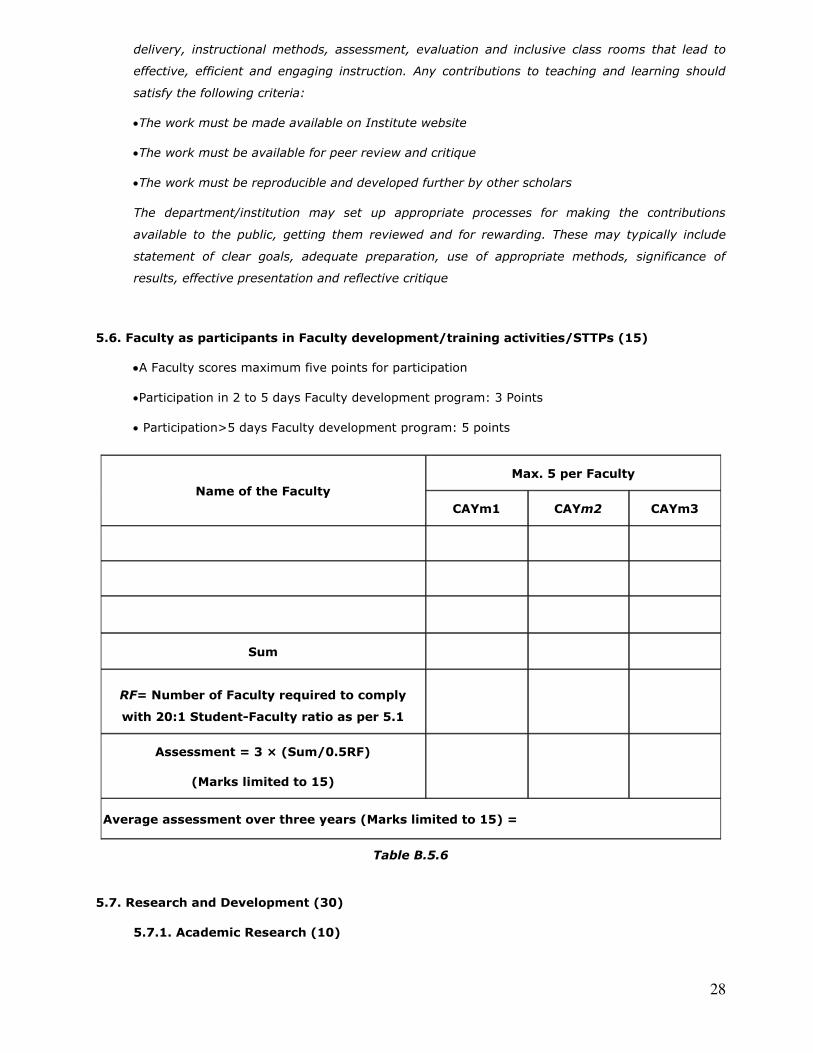
delivery, instructional methods, assessment, evaluation and inclusive class rooms that lead to
effective, efficient and engaging instruction. Any contributions to teaching and learning should
satisfy the following criteria:
The work must be made available on Institute website
The work must be available for peer review and critique
The work must be reproducible and developed further by other scholars
The department/institution may set up appropriate processes for making the contributions
available to the public, getting them reviewed and for rewarding. These may typically include
statement of clear goals, adequate preparation, use of appropriate methods, significance of
results, effective presentation and reflective critique
5.6. Faculty as participants in Faculty development/training activities/STTPs (15)
A Faculty scores maximum five points for participation
Participation in 2 to 5 days Faculty development program: 3 Points
Participation>5 days Faculty development program: 5 points
Name of the Faculty
Max. 5 per Faculty
CAYm1 CAYm2 CAYm3
Sum
RF= Number of Faculty required to comply
with 20:1 Student-Faculty ratio as per 5.1
Assessment = 3 × (Sum/0.5RF)
(Marks limited to 15)
Average assessment over three years (Marks limited to 15) =
Table B.5.6
5.7. Research and Development (30)
5.7.1. Academic Research (10)
29
Academic research includes research paper publications, Ph.D. guidance, and faculty
receiving Ph.D. during the assessment period.
Number of quality publications in refereed/SCI Journals, citations, Books/Book Chapters
etc. (6)
Ph.D. guided /Ph.D. awarded during the assessment period while working in the
institute (4)
All relevant details shall be mentioned.
5.7.2. Sponsored Research (5)
Funded research:
(Provide a list with Project Title, Funding Agency, Amount and Duration)
Funding amount (Cumulative during CAYm1, CAYm2 and CAYm3):
Amount > 20 Lakh – 5 Marks
Amount >= 16 Lakh and <= 20 Lakh – 4 Marks
Amount >= 12 Lakh and < 16 Lakh – 3 Marks
Amount >= 8 Lakh and < 12 Lakh – 2 Marks
Amount >= 4 Lakh and < 8 Lakh – 1 Mark
Amount < 4 Lakh – 0 Mark
5.7.3. Development activities (10)
Provide details:
Product Development
Research laboratories
Instructional materials
Working models/charts/monograms etc.
5.7.4. Consultancy (from Industry) (5)
(Provide a list with Project Title, Funding Agency, Amount and Duration)
Funding amount (Cumulative during CAYm1, CAYm2 and CAYm3):
Amount > 10 Lakh – 5 Marks
Amount >= 8 Lakh and <= 10 Lakh – 4 Marks
Amount >= 6 Lakh and < 8 Lakh – 3 Marks
Amount >= 4 Lakh and < 6 Lakh – 2 Marks
Amount >= 2 Lakh and < 4 Lakh – 1 Mark
Amount < 2 Lakh – 0 Mark
5.8. Faculty Performance Appraisal and Development System (FPADS) (30)
Faculty members of Higher Educational Institutions today have to perform a variety of tasks
pertaining to diverse roles. In addition to instruction, Faculty members need to innovate and
conduct research for their self-renewal, keep abreast with changes in technology, and develop
expertise for effective implementation of curricula. They are also expected to provide services to
the industry and community for understanding and contributing to the solution of real life problems
in industry. Another role relates to the shouldering of administrative responsibilities and co-
operation with other Faculty, Heads-of-Departments and the Head of Institute. An effective
30
performance appraisal system for Faculty is vital for optimizing the contribution of individual
Faculty to institutional performance.
The assessment is based on:
A well-defined system for faculty appraisal for all the assessment years (10)
Its implementation and effectiveness (20)
5.9. Visiting/Adjunct/Emeritus Faculty etc. (10)
Adjunct faculty also includes Industry experts. Provide details of participation and contributions in
teaching and learning and /or research by visiting/adjunct/Emeritus faculty etc. for all the
assessment years:
Provision of inviting/having visiting/adjunct/emeritus faculty (1)
Minimum 50 hours per year interaction with adjunct faculty from industry/retired professors
etc.
(Minimum 50 hours interaction in a year will result in 3 marks for that year; 3 marks x 3
years = 9 marks)
31
CRITERION 6 Facilities and Technical Support 80
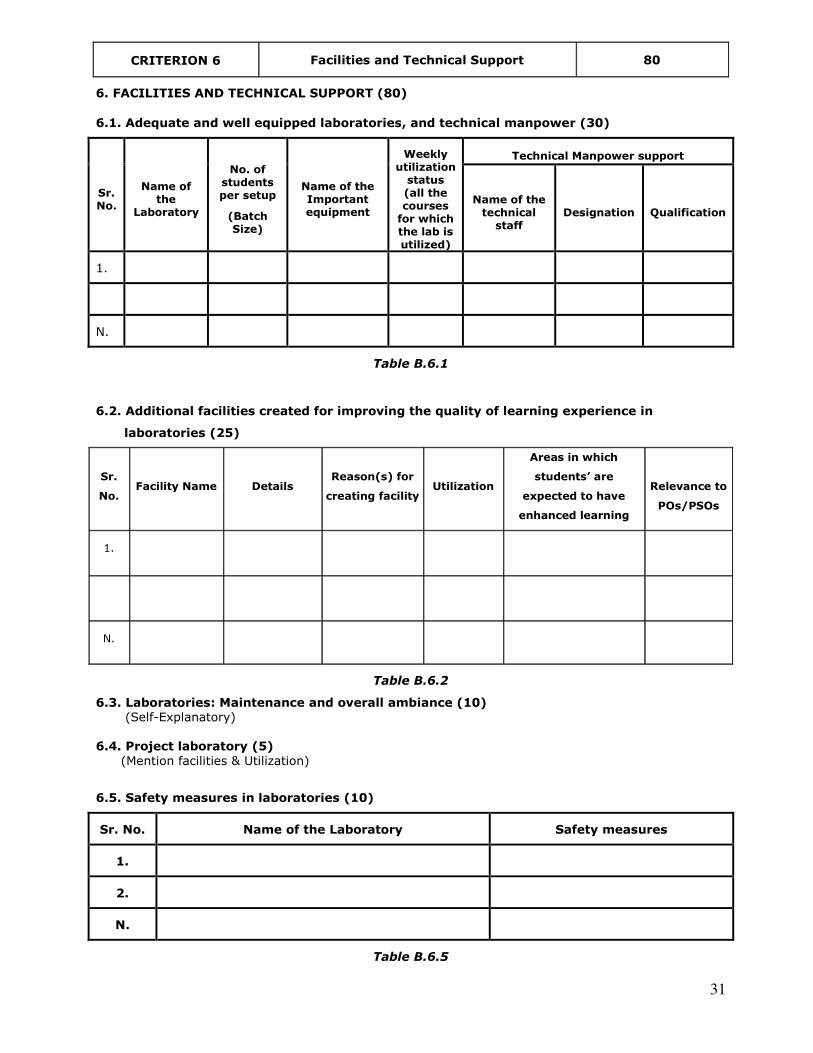
6. FACILITIES AND TECHNICAL SUPPORT (80)
6.1. Adequate and well equipped laboratories, and technical manpower (30)
Sr. No.
Name of the
Laboratory
No. of students per setup
(Batch Size)
Name of the Important equipment
Weekly utilization
status (all the courses
for which the lab is utilized)
Technical Manpower support
Name of the technical
staff Designation Qualification
1.
N.
Table B.6.1
6.2. Additional facilities created for improving the quality of learning experience in
laboratories (25)
Sr.
No. Facility Name Details
Reason(s) for
creating facility Utilization
Areas in which
students’ are
expected to have
enhanced learning
Relevance to
POs/PSOs
1.
N.
Table B.6.2
6.3. Laboratories: Maintenance and overall ambiance (10) (Self-Explanatory)
6.4. Project laboratory (5)
(Mention facilities & Utilization)
6.5. Safety measures in laboratories (10)
Sr. No. Name of the Laboratory Safety measures
1.
2.
N.
Table B.6.5
32
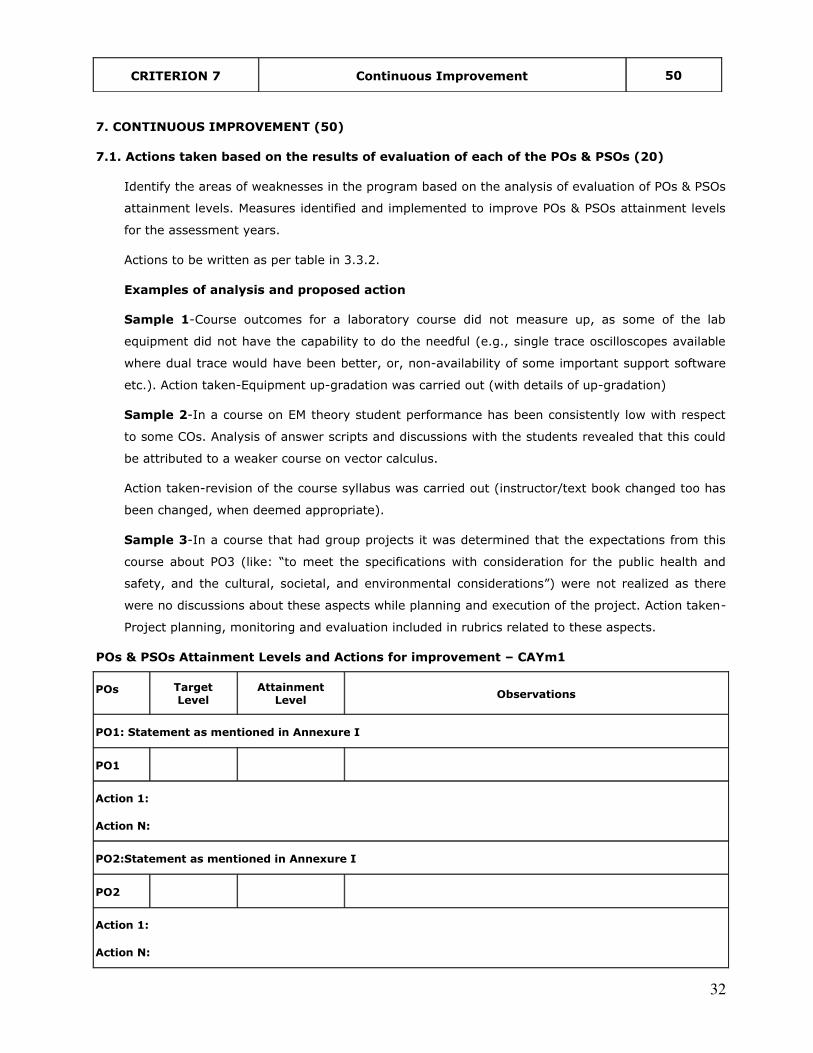
7. CONTINUOUS IMPROVEMENT (50)
7.1. Actions taken based on the results of evaluation of each of the POs & PSOs (20)
Identify the areas of weaknesses in the program based on the analysis of evaluation of POs & PSOs
attainment levels. Measures identified and implemented to improve POs & PSOs attainment levels
for the assessment years.
Actions to be written as per table in 3.3.2.
Examples of analysis and proposed action
Sample 1-Course outcomes for a laboratory course did not measure up, as some of the lab
equipment did not have the capability to do the needful (e.g., single trace oscilloscopes available
where dual trace would have been better, or, non-availability of some important support software
etc.). Action taken-Equipment up-gradation was carried out (with details of up-gradation)
Sample 2-In a course on EM theory student performance has been consistently low with respect
to some COs. Analysis of answer scripts and discussions with the students revealed that this could
be attributed to a weaker course on vector calculus.
Action taken-revision of the course syllabus was carried out (instructor/text book changed too has
been changed, when deemed appropriate).
Sample 3-In a course that had group projects it was determined that the expectations from this
course about PO3 (like: “to meet the specifications with consideration for the public health and
safety, and the cultural, societal, and environmental considerations”) were not realized as there
were no discussions about these aspects while planning and execution of the project. Action taken-
Project planning, monitoring and evaluation included in rubrics related to these aspects.
POs & PSOs Attainment Levels and Actions for improvement – CAYm1
POs Target Level
Attainment Level
Observations
PO1: Statement as mentioned in Annexure I
PO1
Action 1:
Action N:
PO2:Statement as mentioned in Annexure I
PO2
Action 1:
Action N:
CRITERION 7 Continuous Improvement 50
33
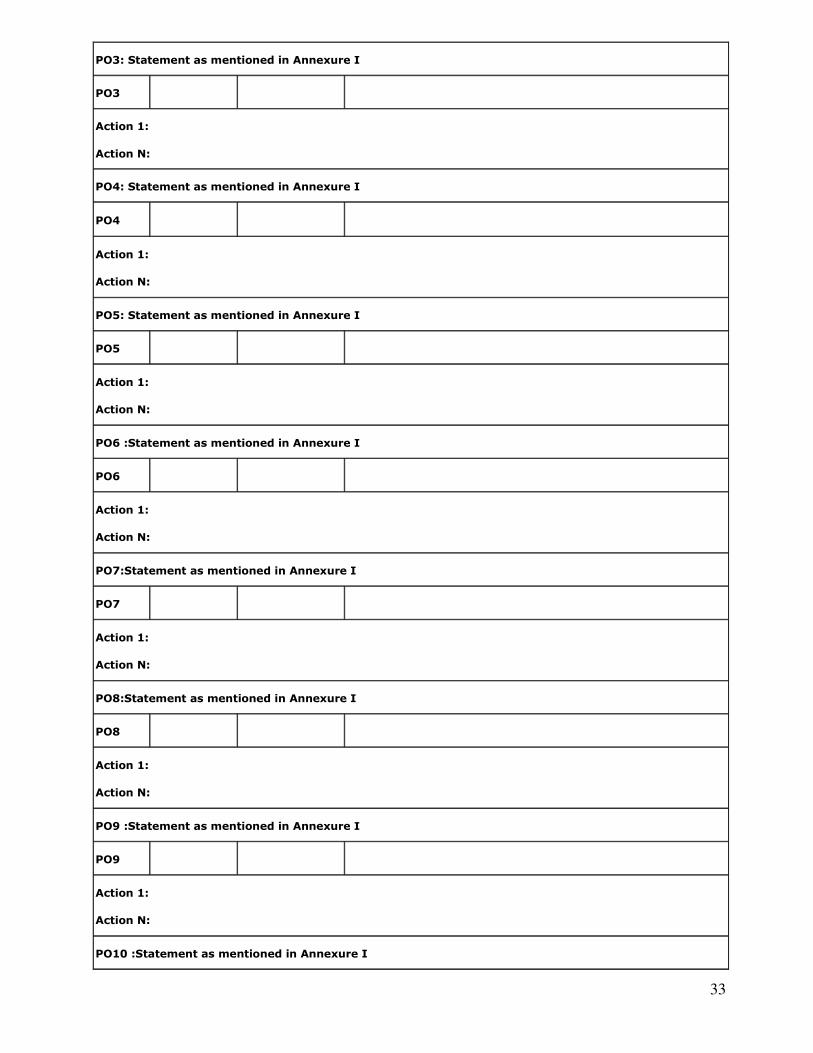
PO3: Statement as mentioned in Annexure I
PO3
Action 1:
Action N:
PO4: Statement as mentioned in Annexure I
PO4
Action 1:
Action N:
PO5: Statement as mentioned in Annexure I
PO5
Action 1:
Action N:
PO6 :Statement as mentioned in Annexure I
PO6
Action 1:
Action N:
PO7:Statement as mentioned in Annexure I
PO7
Action 1:
Action N:
PO8:Statement as mentioned in Annexure I
PO8
Action 1:
Action N:
PO9 :Statement as mentioned in Annexure I
PO9
Action 1:
Action N:
PO10 :Statement as mentioned in Annexure I
34
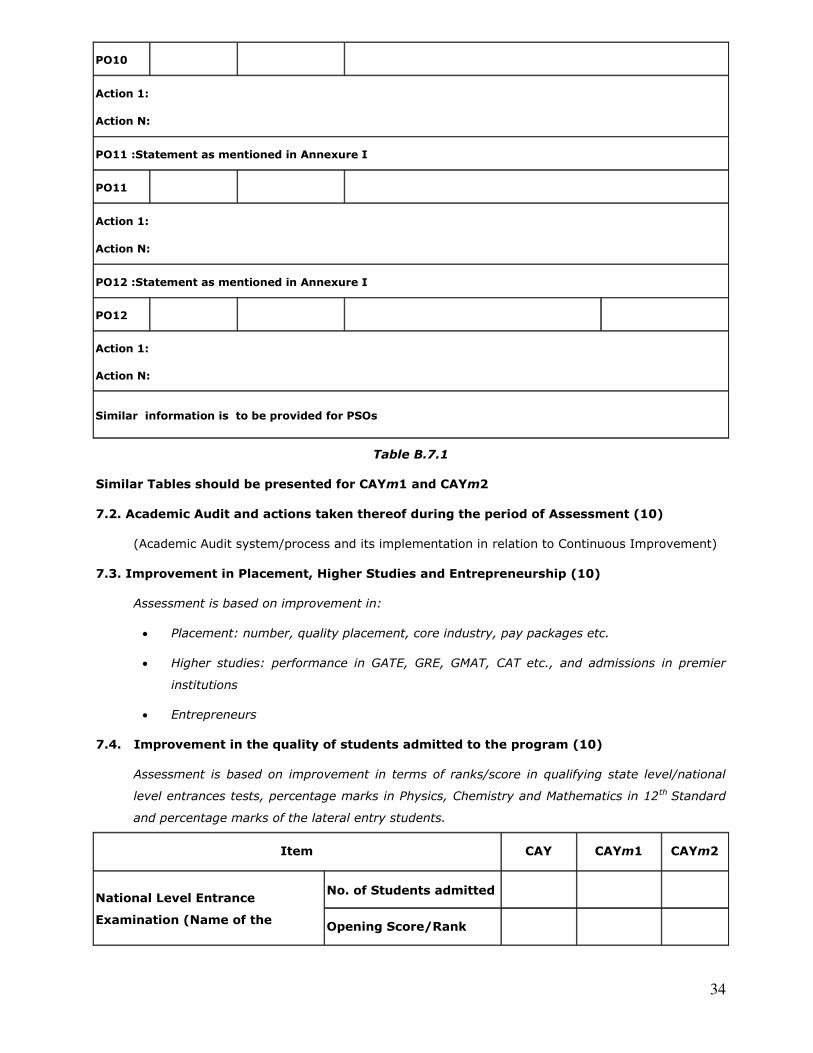
PO10
Action 1:
Action N:
PO11 :Statement as mentioned in Annexure I
PO11
Action 1:
Action N:
PO12 :Statement as mentioned in Annexure I
PO12
Action 1:
Action N:
Similar information is to be provided for PSOs
Table B.7.1
Similar Tables should be presented for CAYm1 and CAYm2
7.2. Academic Audit and actions taken thereof during the period of Assessment (10)
(Academic Audit system/process and its implementation in relation to Continuous Improvement)
7.3. Improvement in Placement, Higher Studies and Entrepreneurship (10)
Assessment is based on improvement in:
Placement: number, quality placement, core industry, pay packages etc.
Higher studies: performance in GATE, GRE, GMAT, CAT etc., and admissions in premier
institutions
Entrepreneurs
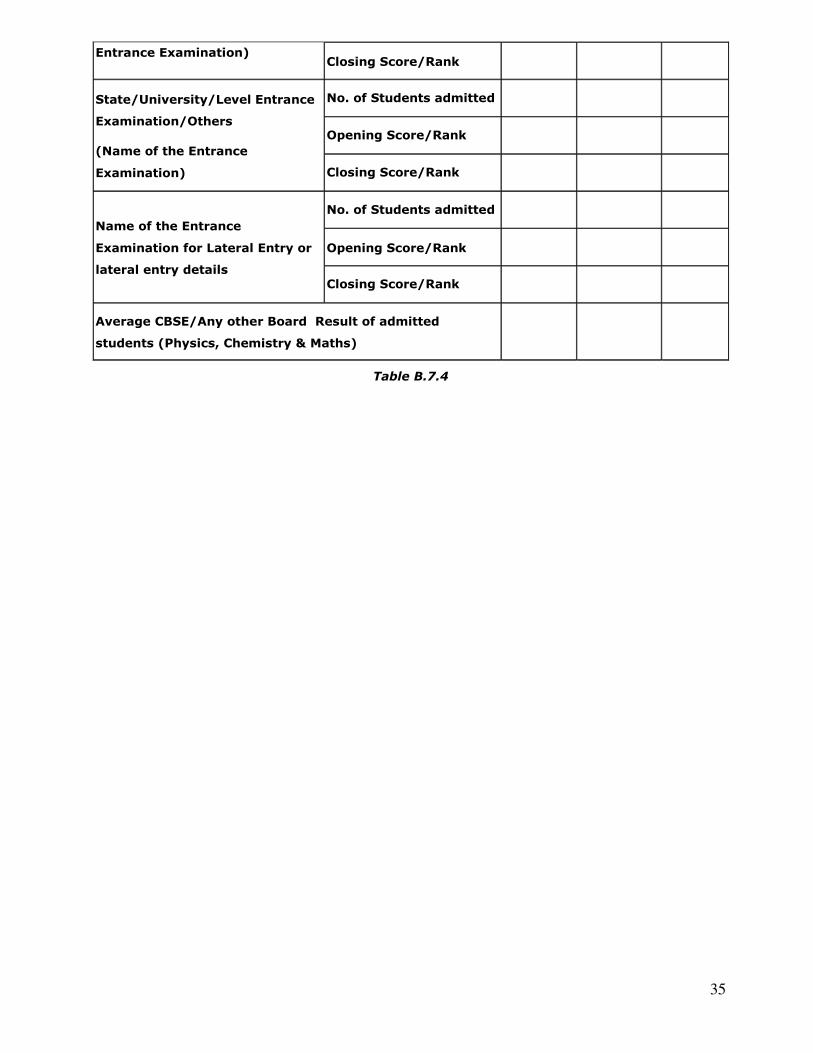
7.4. Improvement in the quality of students admitted to the program (10)
Assessment is based on improvement in terms of ranks/score in qualifying state level/national
level entrances tests, percentage marks in Physics, Chemistry and Mathematics in 12th Standard
and percentage marks of the lateral entry students.
Item CAY CAYm1 CAYm2
National Level Entrance
Examination (Name of the
No. of Students admitted
Opening Score/Rank
35
Entrance Examination) Closing Score/Rank
State/University/Level Entrance
Examination/Others
(Name of the Entrance
Examination)
No. of Students admitted
Opening Score/Rank
Closing Score/Rank
Name of the Entrance
Examination for Lateral Entry or
lateral entry details
No. of Students admitted
Opening Score/Rank
Closing Score/Rank
Average CBSE/Any other Board Result of admitted
students (Physics, Chemistry & Maths)
Table B.7.4
36
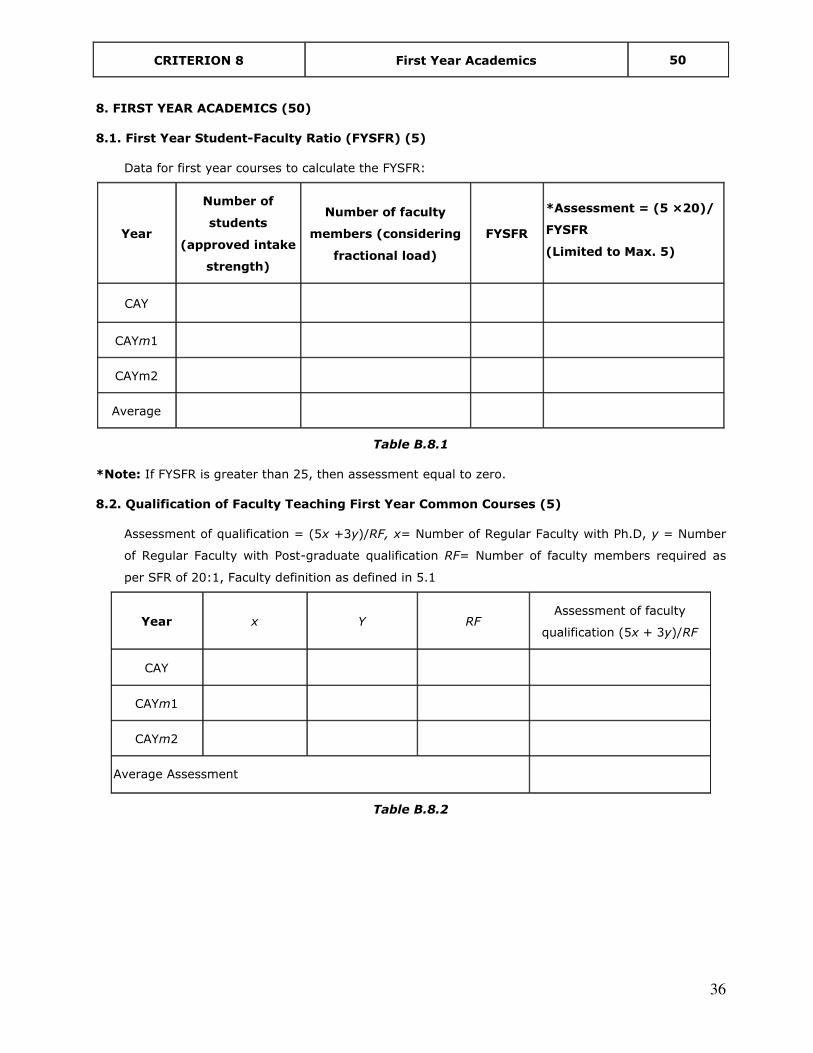
CRITERION 8 First Year Academics 50
8. FIRST YEAR ACADEMICS (50)
8.1. First Year Student-Faculty Ratio (FYSFR) (5)
Data for first year courses to calculate the FYSFR:
Year
Number of
students
(approved intake
strength)
Number of faculty
members (considering
fractional load)
FYSFR
*Assessment = (5 ×20)/
FYSFR
(Limited to Max. 5)
CAY
CAYm1
CAYm2
Average
Table B.8.1
*Note: If FYSFR is greater than 25, then assessment equal to zero.
8.2. Qualification of Faculty Teaching First Year Common Courses (5)
Assessment of qualification = (5x +3y)/RF, x= Number of Regular Faculty with Ph.D, y = Number
of Regular Faculty with Post-graduate qualification RF= Number of faculty members required as
per SFR of 20:1, Faculty definition as defined in 5.1
Year x Y RF Assessment of faculty
qualification (5x + 3y)/RF
CAY
CAYm1
CAYm2
Average Assessment
Table B.8.2
37
8.3. First Year Academic Performance (10)
Academic Performance = ((Mean of 1st Year Grade Point Average of all successful Students on a 10
point scale) or (Mean of the percentage of marks in First Year of all successful students/10)) x
(number of successful students/number of students appeared in the examination)
Successful students are those who are permitted to proceed to the second year.
8.4. Attainment of Course Outcomes of first year courses (10)
8.4.1. Describe the assessment processes used to gather the data upon which the
evaluation of Course Outcomes of first year is done (5)
(Examples of data collection processes may include, but are not limited to, specific exam
questions, laboratory tests, internally developed assessment exams, oral exams
assignments, presentations, tutorial sheets etc.)
8.4.2. Record the attainment of Course Outcomes of all first year courses (5)
Program shall have set attainment levels for all first year courses.
(The attainment levels shall be set considering average performance levels in the university
examination or any higher value set as target for the assessment years. Attainment level is
to be measured in terms of student performance in internal assessments with respect the
COs of a subject plus the performance in the University examination)
Refer to 3.2.2 for further details
8.5. Attainment of Program Outcomes from first year courses (20)
8.5.1. Indicate results of evaluation of each relevant PO and/or PSO, if applicable (15)
The relevant program outcomes that are to be addressed at first year need to be identified
by the institution.
Program Outcome attainment levels shall be set for all relevant POs and/or PSOs through
first year courses.
(Describe the assessment processes that demonstrate the degree to which the Program
Outcomes are attained through first year courses and document the attainment levels. Also
include information on assessment processes used to gather the data upon which the
evaluation of each Program Outcome is based indicating the frequency with which these
processes are carried out)
PO Attainment: Mention first year details from table 3.1.3
Course PO1 PO2 PO3 PO4 PO5 PO6 PO7 PO8 PO9 PO10 PO11 PO12
C101
C102
…
38
….
Direct
Attainment*
Table B.8.5.1
* Direct attainment level of a PO is determined by taking average across all courses addressing that
PO. Fractional numbers may be used for example 1.55.
Note: Add PSOs; if applicable
8.5.2. Actions taken based on the results of evaluation of relevant POs (5)
(The attainment levels by direct (student performance) are to be presented through Program
level Course-PO matrix as indicated)
PO Attainment Levels and Actions for improvement – CAYm1 – Mention for relevant POs
POs Target Level
Attainment Level
Observations
PO1: Statement as mentioned in Annexure I
PO1
Action 1:
Action N:
PO2:Statement as mentioned in Annexure I
PO2
Action 1:
Action N:
PO3: Statement as mentioned in Annexure I
PO3
Action 1:
Action N:
PO4: Statement as mentioned in Annexure I
PO4
Action 1:
Action N:
PO5: Statement as mentioned in Annexure I
39
PO5
Action 1:
Action N:
PO6 :Statement as mentioned in Annexure I
PO6
Action 1:
Action N:
PO7:Statement as mentioned in Annexure I
PO7
Action 1:
Action N:
PO8:Statement as mentioned in Annexure I
PO8
Action 1:
Action N:
PO9 :Statement as mentioned in Annexure I
PO9
Action 1:
Action N:
PO10 :Statement as mentioned in Annexure I
PO10
Action 1:
Action N:
PO11 :Statement as mentioned in Annexure I
PO11
Action 1:
Action N:
PO12 :Statement as mentioned in Annexure I
PO12

40
Action 1:
Action N:
Table B.8.5.2
Note: PSOs, if applicable to be added appropriately.
Similar Tables should be presented for CAYm1 and CAYm2
41
CRITERION 9 Student Support Systems
50
9. STUDENT SUPPORT SYSTEMS (50)
9.1 Mentoring system to help at individual level (5)
Type of mentoring: Professional guidance/career advancement/course work specific/laboratory
specific/all-round development. Number of faculty mentors: Number of students per mentor:
Frequency of meeting:
(The institution may report the details of the mentoring system that has been developed for the
students for various purposes and also state the efficacy of such system)
9.2. Feedback analysis and reward /corrective measures taken, if any (10)
Feedback collected for all courses: YES/NO; Specify the feedback collection process; Average
Percentage of students who participate; Specify the feedback analysis process; Basis of reward/
corrective measures, if any; Indices used for measuring quality of teaching & learning and
summary of the index values for all courses/teachers; Number of corrective actions taken.
9.3. Feedback on facilities (5)
Assessment is based on student feedback collection, analysis and corrective action taken.
9.4. Self-Learning (5)
(The institution needs to specify the facilities, materials and scope for self-learning / learning
beyond syllabus, Webinars, Podcast, MOOCs etc. and evaluate their effectiveness)
9.5. Career Guidance, Training, Placement (10)
(The institution may specify the facility, its management and its effectiveness for career guidance
including counseling for higher studies, campus placement support, industry interaction for
training/internship/placement, etc.)
9.6. Entrepreneurship Cell (5)
(The institution may describe the facility, its management and its effectiveness in encouraging
entrepreneurship and incubation) (Success stories for each of the assessment years are to be
mentioned)
9.7. Co-curricular and Extra-curricular Activities (10)
(The institution may specify the co-curricular and extra-curricular activities) (Quantify activities
such as NCC, NSS etc.)
42
CRITERION 10 Governance, Institutional Support and Financial
Resources 120
10. GOVERNANCE, INSTITUTIONAL SUPPORT AND FINANCIAL RESOURCES (120)
10.1. Organization, Governance and Transparency (40)
10.1.1. State the Vision and Mission of the Institute (5)
(Vision statement typically indicates aspirations and Mission statement states the
broad approach to achieve aspirations)
10.1.2. Governing body, administrative setup, functions of various bodies, service
rules, procedures, recruitment and promotional policies (10)
List the governing, senate, and all other academic and administrative bodies; their
memberships, functions, and responsibilities; frequency of the meetings; and
attendance therein, in a tabular form. A few sample minutes of the meetings and
action-taken reports should be annexed.
The published rules including service rules, policies and procedures; year of
publication shall be listed. Also state the extent of awareness among the
employees/students.
10.1.3. Decentralization in working and grievance redressal mechanism (10)
List the names of the faculty members who have been delegated powers for taking
administrative decisions. Mention details in respect of decentralization in working.
Specify the mechanism and composition of grievance redressal cell including Anti
Ragging Committee & Sexual Harassment Committee.
10.1.4. Delegation of financial powers (10)
Institution should explicitly mention financial powers delegated to the Principal,
Heads of Departments and relevant in-charges. Demonstrate the utilization of
financial powers for each year of the assessment years.
10.1.5. Transparency and availability of correct/unambiguous information in public
domain (5)
(Information on policies, rules, processes and dissemination of this information to
stakeholders is to be made available on the web site)
10.2. Budget Allocation, Utilization, and Public Accounting at Institute level (30)
Summary of current financial year’s budget and actual expenditure incurred (for the institution
exclusively) in the three previous financial years.
43
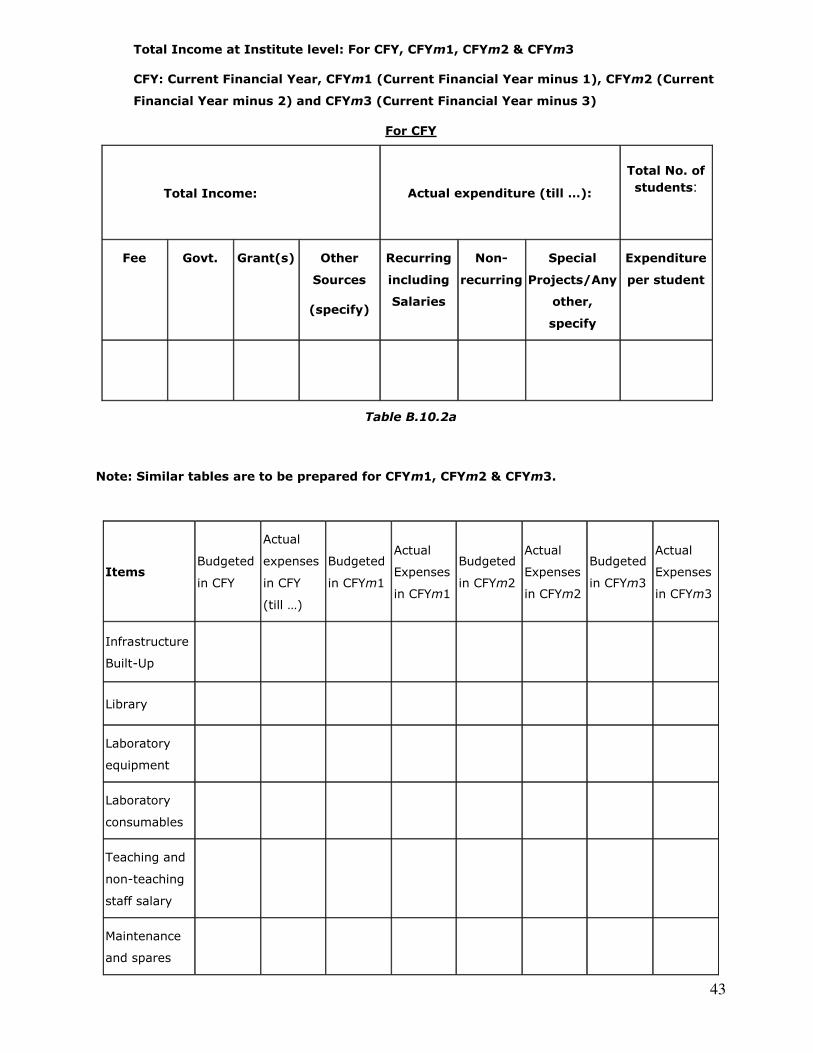
Total Income at Institute level: For CFY, CFYm1, CFYm2 & CFYm3
CFY: Current Financial Year, CFYm1 (Current Financial Year minus 1), CFYm2 (Current
Financial Year minus 2) and CFYm3 (Current Financial Year minus 3)
For CFY
Total Income: Actual expenditure (till …):
Total No. of
students:
Fee Govt. Grant(s)
Other
Sources
(specify)
Recurring
including
Salaries
Non-
recurring
Special
Projects/Any
other,
specify
Expenditure
per student
Table B.10.2a
Note: Similar tables are to be prepared for CFYm1, CFYm2 & CFYm3.
Items Budgeted
in CFY
Actual
expenses
in CFY
(till …)
Budgeted
in CFYm1
Actual
Expenses
in CFYm1
Budgeted
in CFYm2
Actual
Expenses
in CFYm2
Budgeted
in CFYm3
Actual
Expenses
in CFYm3
Infrastructure
Built-Up
Library
Laboratory
equipment
Laboratory
consumables
Teaching and
non-teaching
staff salary
Maintenance
and spares
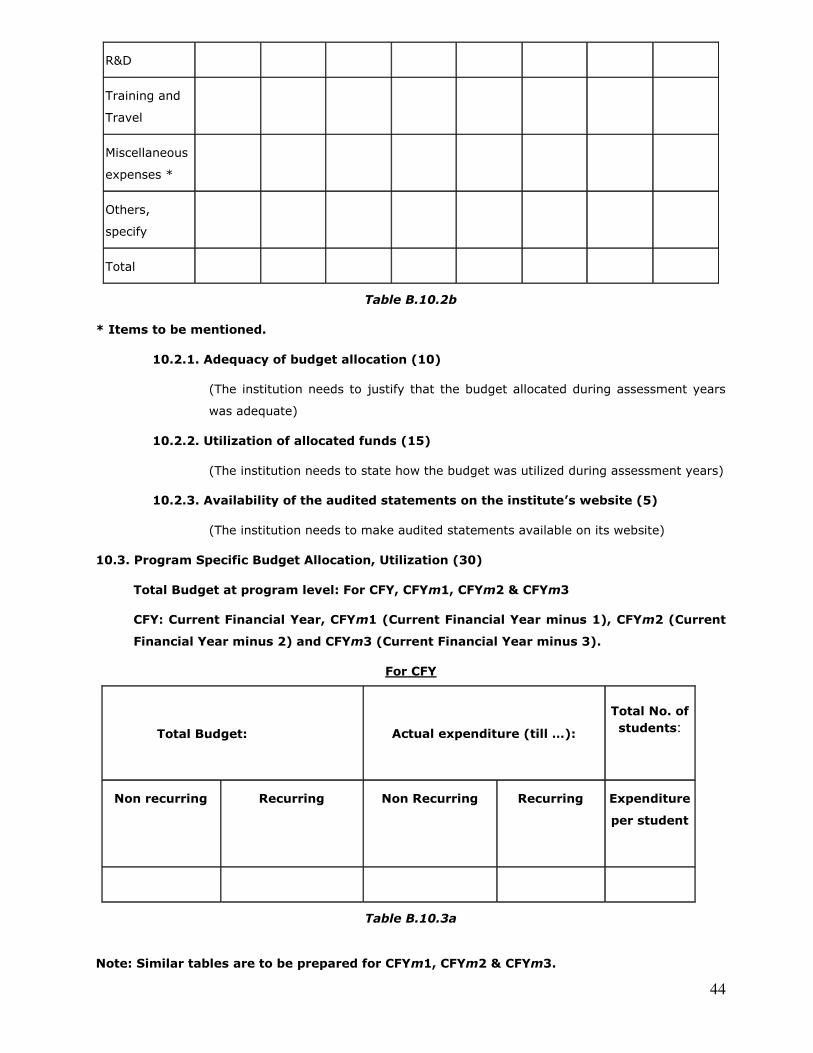
44
R&D
Training and
Travel
Miscellaneous
expenses *
Others,
specify
Total
Table B.10.2b
* Items to be mentioned.
10.2.1. Adequacy of budget allocation (10)
(The institution needs to justify that the budget allocated during assessment years
was adequate)
10.2.2. Utilization of allocated funds (15)
(The institution needs to state how the budget was utilized during assessment years)
10.2.3. Availability of the audited statements on the institute’s website (5)
(The institution needs to make audited statements available on its website)
10.3. Program Specific Budget Allocation, Utilization (30)
Total Budget at program level: For CFY, CFYm1, CFYm2 & CFYm3
CFY: Current Financial Year, CFYm1 (Current Financial Year minus 1), CFYm2 (Current
Financial Year minus 2) and CFYm3 (Current Financial Year minus 3).
For CFY
Total Budget: Actual expenditure (till …):
Total No. of
students:
Non recurring Recurring
Non Recurring Recurring Expenditure
per student
Table B.10.3a
Note: Similar tables are to be prepared for CFYm1, CFYm2 & CFYm3.

45
Items Budgeted
in CFY
Actual
expenses
in CFY (till
…)
Budgeted
in CFYm1
Actual
Expenses
in CFYm1
Budgeted
in CFYm2
Actual
Expenses
in CFYm2
Budgeted
in CFYm3
Actual
Expenses
in CFYm3
Laboratory
equipment
Software
Laboratory
consumable
Maintenance and
spares
R & D
Training and
Travel
Miscellaneous
expenses *
Total
Table B.10.3b
* Items to be mentioned.
10.3.1. Adequacy of budget allocation (10)
(Program needs to justify that the budget allocated over the assessment years was
adequate for the program)
10.3.2. Utilization of allocated funds (20)
(Program needs to state how the budget was utilized during the last three assessment
years)
10.4. Library and Internet (20)
(Indicate whether zero deficiency report was received by the Institution for all the assessment
years. Effective availability/purchase records and utilization of facilities/equipment etc. to be
documented and demonstrated)
46
10.4.1. Quality of learning resources (hard/soft) (10)
Relevance of available learning resources including e-resources
Accessibility to students
Support to students for self-learning activities
10.4.2. Internet (10)
Name of the Internet provider:
Available bandwidth:
Wi Fi availability:
Internet access in labs, classrooms, library and offices of all Departments:
Security arrangements:
47
Declaration
(The head of the institution needs to make a declaration as per the format given)
I undertake that, the institution is well aware about the provisions in the NBA’s accreditation
manual concerned for this application, rules, regulations, notifications and NBA expert visit
guidelines in force as on date and the institute shall fully abide by them.
It is submitted that information provided in this Self Assessment Report is factually correct. I
understand and agree that an appropriate disciplinary action against the Institute will be
initiated by the NBA, in case any false statement/information is observed during pre-visit,
visit, post visit and subsequent to grant of accreditation.
Date: Signature & Name
Place: Head of the Institution with seal
48
ANNEXURE I:
(A) PROGRAM OUTCOMES(POs)
Engineering Graduates will be able to:
1. Engineering knowledge: Apply the knowledge of mathematics, science, engineering
fundamentals, and an engineering specialization to the solution of complex engineering problems.
2. Problem analysis: Identify, formulate, review research literature, and analyze complex
engineering problems reaching substantiated conclusions using first principles of mathematics,
natural sciences, and engineering sciences.
3. Design/development of solutions: Design solutions for complex engineering problems and
design system components or processes that meet the specified needs with appropriate
consideration for the public health and safety, and the cultural, societal, and environmental
considerations.
4. Conduct investigations of complex problems: Use research-based knowledge and research
methods including design of experiments, analysis and interpretation of data, and synthesis of the
information to provide valid conclusions.
5. Modern tool usage: Create, select, and apply appropriate techniques, resources, and modern
engineering and IT tools including prediction and modeling to complex engineering activities with an
understanding of the limitations.
6. The engineer and society: Apply reasoning informed by the contextual knowledge to assess
societal, health, safety, legal and cultural issues and the consequent responsibilities relevant to the
professional engineering practice.
7. Environment and sustainability: Understand the impact of the professional engineering solutions
in societal and environmental contexts, and demonstrate the knowledge of, and need for
sustainable development.
8. Ethics: Apply ethical principles and commit to professional ethics and responsibilities and norms of
the engineering practice.
9. Individual and team work: Function effectively as an individual, and as a member or leader in
diverse teams, and in multidisciplinary settings.
10. Communication: Communicate effectively on complex engineering activities with the engineering
community and with society at large, such as, being able to comprehend and write effective reports
and design documentation, make effective presentations, and give and receive clear instructions.
11. Project management and finance: Demonstrate knowledge and understanding of the
engineering and management principles and apply these to one’s own work, as a member and
leader in a team, to manage projects and in multidisciplinary environments.
12. Life-long learning: Recognize the need for, and have the preparation and ability to engage in
independent and life-long learning in the broadest context of technological change.
(B) PROGRAM SPECIFIC OUTCOMES (PSOs)
Program shall specify 2-4 program specific outcomes.
Recommended