Find CIBC research on Bloomberg, Reuters, firstcall.com
and ResearchCentral.cibcwm.com CIBC World Markets Inc., P.O. Box 500, 161 Bay Street, Brookfield Place, Toronto, Canada M5J 2S8 (416) 594-7000
Institutional Equity Research
Industry Update
March 02, 2011 Metals & Minerals
M&A Is Heating Up But Not Boiling Over Americas-focused Junior Copper Screen Update
� A value-weighted index started at Sept. 12, 2010, when our original junior
copper report was published, would have returned 78% vs. 28% for junior
copper producers, 31% for LME copper and 17% for the S&P TSX Materials
Index. Simply put, we believe there is more to come from this space.
� M&A transaction volume is starting to heat up, with TRX, ANM, and NOM
from our original screening being acquired, as well as transactions in the
more senior space. While valuations seem to have moved in response to
this, we believe the junior copper market is far from overbought.
� We have now split our ranking system into developers (those with projects
with at least a PEA study completed) and exploration companies (those with
a NI 43-101 resource calculation completed). We believe this better reflects
how the market views and values these companies.
� Our top-ranked, unpartnered developers include Western Copper, Minera
Andes, Candente Resource, Coro Mining, Redhawk Resources & Rio Alto
Mining. Our top-ranked explorers include Entree Gold, Peregrine Metals &
Lumina Copper. No partner + world-class asset = desirable target.
All figures in Canadian dollars, unless otherwise stated. 11-107909 © 2011
CIBC World Markets does and seeks to do business with companies covered in its research reports. As a result, investors should be aware that the firm may have a conflict of interest that could affect the objectivity of this report.
Investors should consider this report as only a single factor in making their investment decision.
See "Important Disclosures" section at the end of this report for important
required disclosures, including potential conflicts of interest.
See "Price Target Calculation" and "Key Risks to Price Target" sections at the
end of this report, or at the end of each section hereof, where applicable.
Sector Weighting: Market Weight
Ian Parkinson 1 (416) 956-6169 [email protected]
Matthew Gibson 1 (416) 956-6729 [email protected]

M&A Is Heating Up But Not Boiling Over - March 02, 2011
2
M&A Will Continue To Be The Theme
In 2011 Since we published our last report in September 2010, there have been several
transactions in the junior copper space that have set alight share prices and
focused more attention on the space. This space went ignored for almost three
years but has gained much attention over the past six months. In the past three
months, two transactions have closed and one is in process of closing, all together
totaling ~$1.5 billion in value. While sovereign interests may have taken a back
seat in this recent activity, we believe with the establishment of China Investment
Corp’s first permanent office outside of China in Toronto, the Chinese may enter
the fray more and more in the coming year. A summary of transactions
announced since we last published our junior copper report is shown in Exhibit 1.
Exhibit 1. Recent Copper Developer M&A Transactions
Acquisition Capital Operating
Target (Acquiror) - Date Cost Cost Cost TAC US$/lb TAC as % Cu Price
(US$/lb Cu Total
adj)(US$/lb Cu) (US$/lb Cu) (US$/lb Cu)
Norsemont (Hudbay) - Jan-11 $0.238 $0.411 $0.760 $1.408 $4.270 33%
Citadel (Equinox) - Oct-10 $0.806 $0.197 $0.940 $1.943 $3.800 51%
Antares Minerals (First Quantum)- Oct-10 $0.105 $0.649 $0.924 $1.678 $3.800 44%
Terrane (Thompson Creek)- July-10 $0.170 $0.296 $1.051 $1.517 $3.010 50%
Continental Minerals (Jinchuan)-Sept-10 $0.214 $0.286 $1.048 $1.548 $3.510 44%
Rosemont (Korea Resources)-Sept-10 $0.188 $0.215 $0.864 $1.268 $3.490 36%
LME Spot Cu Price
Source: Company reports and Reuters.
While this has been a busy time, we believe things are just getting started. With
other more senior producers bulking up through mergers, we believe growth
projects such as those highlighted in this report will most likely be snatched up.
Deal metrics have been generally consistent in these transactions. Excluding the
outliers like the stakes sold in the Rosemont and Citadel transactions due to their
strategic nature, one can see that total acquisition costs (TAC) have been
US$1.40/lb. Cu-US$1.55/lb Cu. Due to the volatile swings in copper prices, we have
not seen similar consistency in the discount these TAC values have in relation to the
spot price of copper. Not surprisingly, TAC values have moved higher through 2010
as confidence in the longer-term copper price has strengthened.

M&A Is Heating Up But Not Boiling Over - March 02, 2011
3
Exhibit 2. Copper Transaction History
$0.00
$0.50
$1.00
$1.50
$2.00
$2.50
$3.00
Nor
sem
ont (
Hud
bay)
- Ja
n-11
Cita
del (
Equi
nox)
- O
ct-1
0
Ant
ares
Min
eral
s (F
irst Q
uant
um)-
Oct
-10
Terr
ane
(Tho
mps
on C
reek
)- J
uly-
10
Con
tinen
tal M
iner
als
(Jin
chua
n)-S
ept-1
0
Ros
emon
t (K
orea
Res
ourc
es)-
Sep
t-10
Cha
riot (
Chi
na S
ci-T
ech)
- Fe
b-10
Nok
omis
(Ant
ofag
asta
) - J
an-1
0
Cor
rient
e (C
RC
C-T
ongg
uan)
- Dec
-09
Gib
ralta
r (S
ojitz
)- N
ov-0
9
Stin
gray
(M
erca
tor)
- O
ct-0
9
Cen
tena
rio C
oppe
r (Q
uadr
a)-
Feb-
09
Cop
per M
ount
ain
(Mits
ubis
hi)-
Nov
-09
She
rwoo
d (C
apst
one)
- Sep
t-08
El T
esor
o &
Esp
eran
za (
Mar
uben
i) - A
pr-0
8
Bol
eo (K
orea
Res
ourc
es)-
Apr
-08
Tyle
r R
esou
rces
(Jin
chua
n) J
an-0
8
El G
alen
o (C
NM
C/J
iang
xi) -
Dec
-07
Wes
tern
Kel
tic (S
herw
ood)
- N
ov-0
7
Mic
hiqu
illay
(A
nglo
Am
eric
an)
- Apr
-07
Tint
aya
(Xst
rata
) - M
ay-0
6
Cer
ro C
oron
a (G
old
Fiel
ds) -
Jan
-06
Ada
stra
(Firs
t Qua
ntum
) - J
an-0
6
La G
ranj
a (R
io T
into
) - D
ec-0
5
Car
lota
(Qua
dra)
- D
ec-0
5
Cer
ro V
erde
(S
umito
mo/
Bue
nave
ntur
a) -
Jun-
05
Las
Cru
ces
(Inm
et)
- Apr
-05
Mag
istra
l (Q
uadr
a) -
Jan-
05
Hud
son
Bay
(Ont
zinc
) - D
ec-0
4
Las
Bam
bas
(Xst
rata
) - A
ug-0
4
Mar
cona
(Cha
riot R
es)
- May
-04
Nev
es C
orvo
(E
uroz
inc)
- F
eb-0
4
Rob
inso
n M
ine
(Qua
dra)
- Fe
b-04
Hig
hlan
d V
alle
y (T
eck
Com
inco
) - D
ec-0
3
Dis
puta
da (A
nglo
Am
eric
an) -
May
-02
Pyh
asal
mi (
Inm
et) -
Jan
-02
Tot
al A
cqui
sitio
n C
ost (
$/lb
Cu
Rec
over
able
Res
erve
)
0%
10%
20%
30%
40%
50%
60%
70%
80%
90%
100%
Tota
l Acq
uisi
tion
Cos
t as
a %
of P
reva
iling
Cu
Pric
e
Operating Capital Acquisition TAC as % Cu Price
Source: Company reports.
Based on this historical data, we attempt to outline what the potential upside for
each company may be should it get taken out using some of the historical
average deal metrics. Compared to the same chart in our September 2010
report, valuations have moved higher, but we reiterate that the fundamentals
for copper continue to be robust, which should support copper prices at these
lofty levels until a sufficient supply-side response can be mounted. Junior copper
companies have had a positive ride since our last report but we do not believe
they are running out of steam yet. Exhibit 3 highlights the potential upside that
remains for many of the names in this body of work based on recent transaction
valuations. The exhibit does not factor in any additional exploration upside and
simply looks at publically disclosed NI 43-101 resources. Obviously any
exploration success will move possible valuation scenarios higher. Also
companies closer to production, such as Baja (BAJ-TSX) and Copper Mountain
(CUM-TSX), tend to look worse in this exercise as market valuations for these
companies have started to move towards those of a producer not developer.

M&A Is Heating Up But Not Boiling Over - March 02, 2011
4
Exhibit 3. Potential Upside Based On $0.05/lb.-$0.20/lb. Of Recoverable Copper
-
500.0
1,000.0
1,500.0
2,000.0
2,500.0
3,000.0M
iner
a A
ndes
Inc
Wes
tern
Cop
per C
orp
Can
dent
e R
esou
rce
Cor
p
Red
haw
k R
esou
rces
Inc
Aug
usta
Res
ourc
e C
orp
Far
Wes
t Min
ing
Ltd
Nev
ada
Cop
per C
orp
Nor
sem
ont M
inin
g In
c
Dul
uth
Met
als
Ltd
Pol
ymet
Min
ing
Cor
p
Cor
o M
inin
g C
orp
Cop
per F
ox M
etal
s In
c
Inte
rnat
iona
l Pbx
Ven
ture
s Lt
d
Baj
a M
inin
g C
orp
Rio
Alto
Min
ing
Ltd
Pac
ific
Boo
ker M
iner
als
Inc
Ent
rée
Gol
d
Cop
per M
ount
ain
Min
ing
Cor
p
Exp
lora
tor R
esou
rces
Inc
Additional Possible Upside Current Market Cap
Prior to Hudbay's bid
NOM had a market cap
of $386MM
Source: Company reports and Bloomberg.
M&A Is Heating Up But Not Boiling Over - March 02, 2011
5
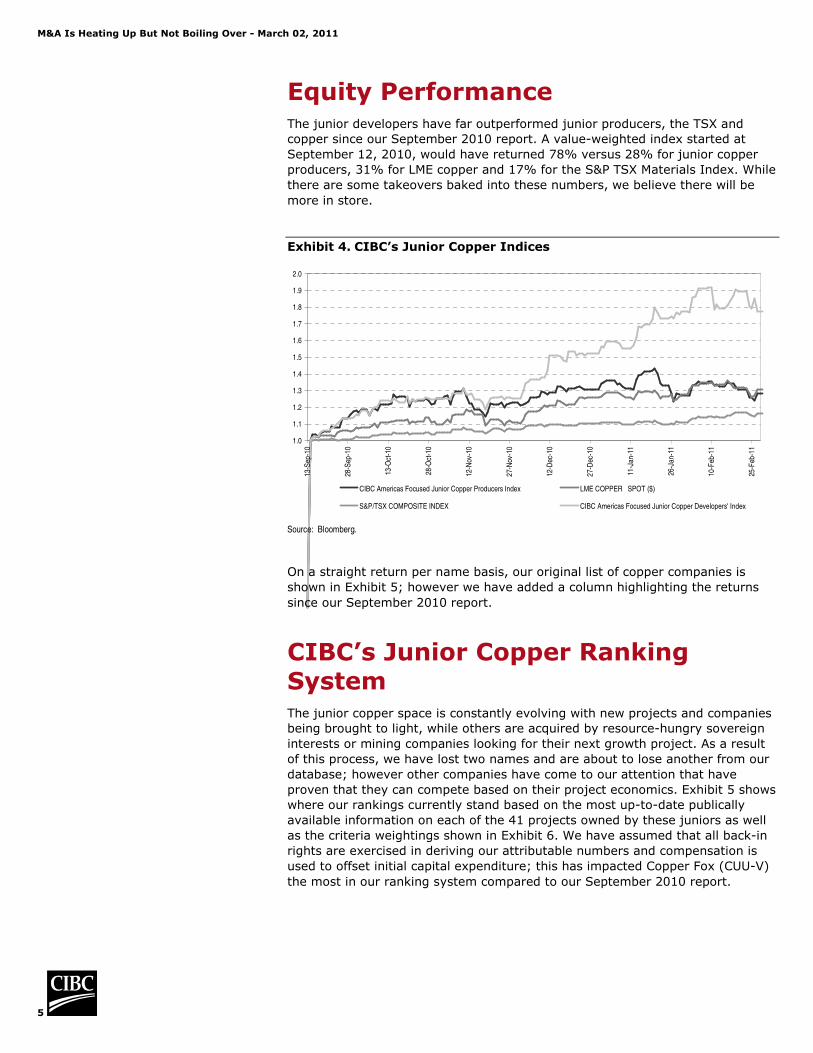
Equity Performance The junior developers have far outperformed junior producers, the TSX and
copper since our September 2010 report. A value-weighted index started at
September 12, 2010, would have returned 78% versus 28% for junior copper
producers, 31% for LME copper and 17% for the S&P TSX Materials Index. While
there are some takeovers baked into these numbers, we believe there will be
more in store.
Exhibit 4. CIBC’s Junior Copper Indices
1.0
1.1
1.2
1.3
1.4
1.5
1.6
1.7
1.8
1.9
2.0
13-S
ep-1
0
28-S
ep-1
0
13-O
ct-1
0
28-O
ct-1
0
12-N
ov-1
0
27-N
ov-1
0
12-D
ec-1
0
27-D
ec-1
0
11-J
an-1
1
26-J
an-1
1
10-F
eb-1
1
25-F
eb-1
1
CIBC Americas Focused Junior Copper Producers Index LME COPPER SPOT ($)
S&P/TSX COMPOSITE INDEX CIBC Americas Focused Junior Copper Developers' Index
Source: Bloomberg.
On a straight return per name basis, our original list of copper companies is
shown in Exhibit 5; however we have added a column highlighting the returns
since our September 2010 report.
CIBC’s Junior Copper Ranking System The junior copper space is constantly evolving with new projects and companies
being brought to light, while others are acquired by resource-hungry sovereign
interests or mining companies looking for their next growth project. As a result
of this process, we have lost two names and are about to lose another from our
database; however other companies have come to our attention that have
proven that they can compete based on their project economics. Exhibit 5 shows
where our rankings currently stand based on the most up-to-date publically
available information on each of the 41 projects owned by these juniors as well
as the criteria weightings shown in Exhibit 6. We have assumed that all back-in
rights are exercised in deriving our attributable numbers and compensation is
used to offset initial capital expenditure; this has impacted Copper Fox (CUU-V)
the most in our ranking system compared to our September 2010 report.

M&A Is Heating Up But Not Boiling Over - March 02, 2011
6
Exhibit 5. CIBC’s North American Focused Junior Copper Rankings
Company
CIBC Junior
Copper Score
Mkt Cap
(C$ MM)
02/18/2011
Mkt Cap
(C$ MM)
09/12/2010
Overall
Ranking Strategic Partnerships
Return Since Last
Published Report
(Sept 12 2010)
Developers
Northern Dynasty Minerals Ltd 3.35 1,526 704 1 Partnered 50/50 with Anglo American on Pebble 117%
Duluth Metals Ltd 6.40 278 217 2 Antofagasta (ANTO-LN) has 40% interest in Nokomis 28%
Polymet Mining Corp 8.00 317 227 3 Glencore owns 6.3%, Cliffs Natural Resources own 6.1% 40%
Western Copper Corp 8.60 283 101 4 181%
Augusta Resource Corp 9.95 717 397 5 Hudbay (HBM-TSX) owns 11%, 20/80 Partners with Korean Consortium 81%
Minera Andes Inc 10.20 713 249 6 186%
Copper Fox Metals Inc 10.25 624 229 7 Teck (TCK.B-TSX) has back-in right for up to 75% of Shaft Creek 173%
Far West Mining Ltd 11.25 443 287 8 Quadra FNX (QUX-TSX) owns 7.9% (14.64% fully diluted) 54%
Abacus Mining And Exploration Corp 11.45 41 29 9 KGHM can earn 80% of the project giving AME a free carry 40%
Candente Resource Corp 11.75 202 39 10 411%
Coro Mining Corp 12.75 148 57 11 159%
Baja Mining Corp 12.95 348 138 12 25% partner on Boleo with a consortium of Korean companies 152%
Nevada Copper Corp 13.25 289 170 13 Pala Investments owns 29% of the company 70%
Redhawk Resources Inc 13.95 99 50 14 97%
Norsemont Mining Inc 14.90 442 163 15 Being acquired by Hudbay (HBM-TSX) 170%
Rio Alto Mining Ltd 15.30 318 NA 16 NA
Copper Mountain Mining Corp 16.35 604 301 17 25% of Copper Mountain project is owned by Mitsubishi Materials 101%
International Pbx Ventures Ltd 16.65 51 23 18 119%
Explorator Resources Inc 17.60 45 34 19 31%
Pacific Booker Minerals Inc 18.45 106 87 20 21%
Explorers
Entrée Gold 10.30 353 278 1 80% of Lookout Hill Project owned by Ivanhoe (IVN-TSX) 27%
Peregrine Metals Ltd 15.55 94 NA 2 NA
Lumina Copper Corp 16.15 208 88 3 136%
NGEX Resources 17.65 213 88 4 142%
Serengeti Resources Inc 18.25 16 NA 5 NA
Yellowhead Mining Inc 18.35 62 NA 6 NA
Panoro Minerals Ltd 18.85 57 23 7 145%
AQM Copper 21.55 88 NA 8 In a 50/50 JV with Teck (TCK.B-TSX) NA
Recent Transactions
Take Out
Valuation at
Announcement
TAC (US$/lb
Cu)
Mkt Cap
(C$ MM)
09/12/2010
Previous
Rank
Terrane Metals Corp C$650MM 1.52 639 2 Acquired By Thompson Creek Metals (TCM-TSX) 6%
Antares Minerals Inc C$460MM 1.68 250 7 Acquired by First Quantum (FM-TSX) 118%
Norsemont Mining Inc C$520MM 1.41 163 16 Being acquired by Hudbay (HBM-TSX) 177% Source: Bloomberg and company reports.
Exhibit 6. Criteria Weightings
Criteria Weighting
EV / lb Cu Eq 10%
Mkt Cap to Capex 20%
Resource Cu Eq 20%
Capex / lb of Annual Production CuEq LOM 15%
Total Attributable Production Cu Eq 20%
Cash Costs (net) 15%
100% Source: CIBC World Markets Inc.
M&A Is Heating Up But Not Boiling Over - March 02, 2011
7
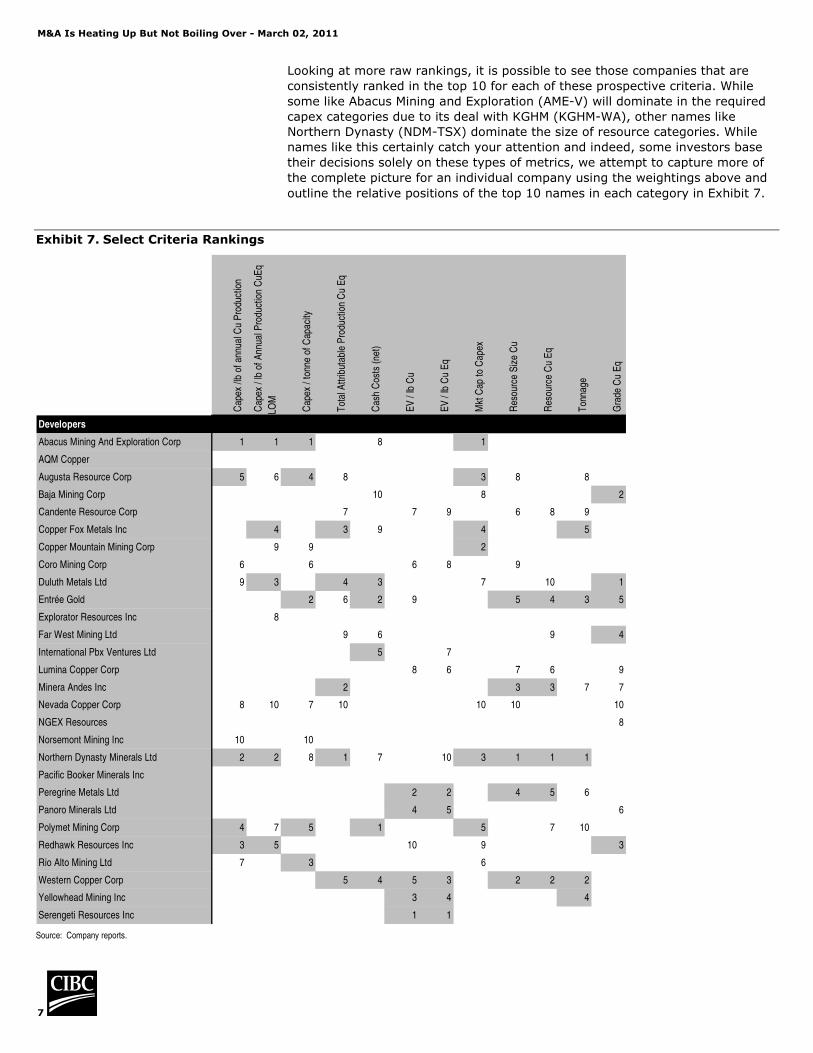
Looking at more raw rankings, it is possible to see those companies that are
consistently ranked in the top 10 for each of these prospective criteria. While
some like Abacus Mining and Exploration (AME-V) will dominate in the required
capex categories due to its deal with KGHM (KGHM-WA), other names like
Northern Dynasty (NDM-TSX) dominate the size of resource categories. While
names like this certainly catch your attention and indeed, some investors base
their decisions solely on these types of metrics, we attempt to capture more of
the complete picture for an individual company using the weightings above and
outline the relative positions of the top 10 names in each category in Exhibit 7.
Exhibit 7. Select Criteria Rankings C
apex
/lb
of a
nnua
l Cu
Pro
duct
ion
Cap
ex /
lb o
f Ann
ual P
rodu
ctio
n C
uEq
LOM
Cap
ex /
tonn
e of
Cap
acity
Tot
al A
ttrib
utab
le P
rodu
ctio
n C
u E
q
Cas
h C
osts
(ne
t)
EV
/ lb
Cu
EV
/ lb
Cu
Eq
Mkt
Cap
to C
apex
Res
ourc
e S
ize
Cu
Res
ourc
e C
u E
q
Ton
nage
Gra
de C
u E
q
Developers
Abacus Mining And Exploration Corp 1 1 1 12 8 19 19 1 28 28 18 23
AQM Copper 20 20 21 22 21 17 20 19 25 26 24 18
Augusta Resource Corp 5 6 4 8 11 24 26 3 8 13 8 22
Baja Mining Corp 19 13 21 13 10 22 23 8 14 15 22 2
Candente Resource Corp 13 14 11 7 17 7 9 16 6 8 9 17
Copper Fox Metals Inc 15 4 17 3 9 28 27 4 24 21 5 24
Copper Mountain Mining Corp 11 9 9 20 20 27 28 2 19 24 16 25
Coro Mining Corp 6 12 6 16 13 6 8 13 9 12 14 14
Duluth Metals Ltd 9 3 20 4 3 20 13 7 15 10 12 1
Entrée Gold 20 20 2 6 2 9 12 19 5 4 3 5
Explorator Resources Inc 12 8 18 18 16 13 16 17 27 27 28 13
Far West Mining Ltd 16 15 14 9 6 26 21 12 17 9 15 4
International Pbx Ventures Ltd 20 20 16 17 5 14 7 19 26 25 23 27
Lumina Copper Corp 20 20 21 22 21 8 6 19 7 6 11 9
Minera Andes Inc 14 16 19 2 12 18 22 14 3 3 7 7
Nevada Copper Corp 8 10 7 10 21 11 18 10 10 14 19 10
NGEX Resources 20 20 21 22 21 12 11 19 11 11 13 8
Norsemont Mining Inc 10 17 10 11 15 25 25 11 16 16 21 15
Northern Dynasty Minerals Ltd 2 2 8 1 7 15 10 3 1 1 1 12
Pacific Booker Minerals Inc 17 19 12 21 14 16 17 15 23 23 25 16
Peregrine Metals Ltd 20 20 21 22 21 2 2 19 4 5 6 20
Panoro Minerals Ltd 20 20 21 22 21 4 5 19 18 20 26 6
Polymet Mining Corp 4 7 5 15 1 21 14 5 12 7 10 11
Redhawk Resources Inc 3 5 15 14 18 10 15 9 20 22 27 3
Rio Alto Mining Ltd 7 11 3 19 19 23 24 6 21 17 20 21
Western Copper Corp 18 18 13 5 4 5 3 18 2 2 2 19
Yellowhead Mining Inc 20 20 21 22 21 3 4 19 13 18 4 27
Serengeti Resources Inc 20 20 21 22 21 1 1 19 22 19 17 26
Source: Company reports.
M&A Is Heating Up But Not Boiling Over - March 02, 2011
8
Company Comparisons
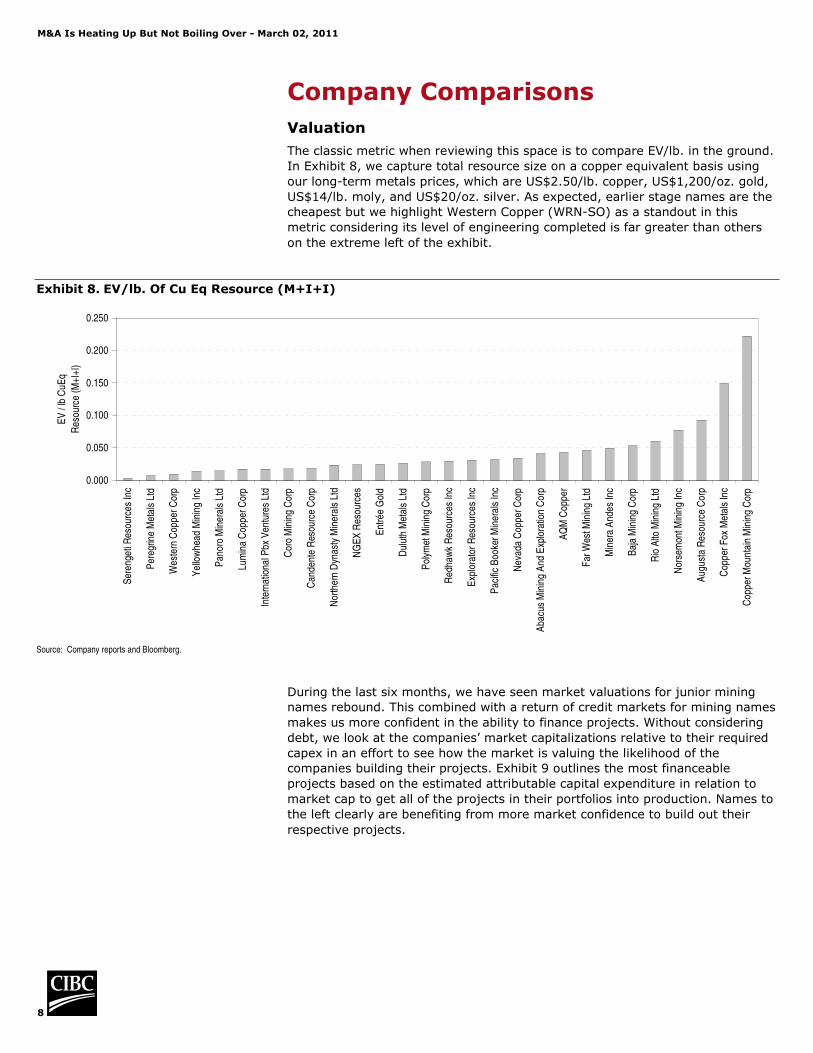
Valuation
The classic metric when reviewing this space is to compare EV/lb. in the ground.
In Exhibit 8, we capture total resource size on a copper equivalent basis using
our long-term metals prices, which are US$2.50/lb. copper, US$1,200/oz. gold,
US$14/lb. moly, and US$20/oz. silver. As expected, earlier stage names are the
cheapest but we highlight Western Copper (WRN-SO) as a standout in this
metric considering its level of engineering completed is far greater than others
on the extreme left of the exhibit.
Exhibit 8. EV/lb. Of Cu Eq Resource (M+I+I)
0.000
0.050
0.100
0.150
0.200
0.250
Ser
enge
ti R
esou
rces
Inc
Per
egrin
e M
etal
s Lt
d
Wes
tern
Cop
per C
orp
Yel
low
head
Min
ing
Inc
Pan
oro
Min
eral
s Lt
d
Lum
ina
Cop
per C
orp
Inte
rnat
iona
l Pbx
Ven
ture
s Lt
d
Cor
o M
inin
g C
orp
Can
dent
e R
esou
rce
Cor
p
Nor
ther
n D
ynas
ty M
iner
als
Ltd
NG
EX
Res
ourc
es
Ent
rée
Gol
d
Dul
uth
Met
als
Ltd
Pol
ymet
Min
ing
Cor
p
Red
haw
k R
esou
rces
Inc
Exp
lora
tor R
esou
rces
Inc
Pac
ific
Boo
ker M
iner
als
Inc
Nev
ada
Cop
per C
orp
Aba
cus
Min
ing
And
Exp
lora
tion
Cor
p
AQ
M C
oppe
r
Far
Wes
t Min
ing
Ltd
Min
era
And
es In
c
Baj
a M
inin
g C
orp
Rio
Alto
Min
ing
Ltd
Nor
sem
ont M
inin
g In
c
Aug
usta
Res
ourc
e C
orp
Cop
per F
ox M
etal
s In
c
Cop
per M
ount
ain
Min
ing
Cor
p
EV
/ lb
CuE
q
Res
ourc
e (M
+I+I
)
Source: Company reports and Bloomberg.
During the last six months, we have seen market valuations for junior mining
names rebound. This combined with a return of credit markets for mining names
makes us more confident in the ability to finance projects. Without considering
debt, we look at the companies’ market capitalizations relative to their required
capex in an effort to see how the market is valuing the likelihood of the
companies building their projects. Exhibit 9 outlines the most financeable
projects based on the estimated attributable capital expenditure in relation to
market cap to get all of the projects in their portfolios into production. Names to
the left clearly are benefiting from more market confidence to build out their
respective projects.

M&A Is Heating Up But Not Boiling Over - March 02, 2011
9
Exhibit 9. Market Capitalization/Attributable Capex
0%20%40%60%80%
100%120%140%160%180%200%
Aba
cus
Min
ing
And
Exp
lora
tion
Cor
p
Cop
per M
ount
ain
Min
ing
Cor
p
Aug
usta
Res
ourc
e C
orp
Nor
ther
n D
ynas
ty M
iner
als
Ltd
Cop
per F
ox M
etal
s In
c
Pol
ymet
Min
ing
Cor
p
Rio
Alto
Min
ing
Ltd
Dul
uth
Met
als
Ltd
Baj
a M
inin
g C
orp
Red
haw
k R
esou
rces
Inc
Nor
sem
ont M
inin
g In
c
Far
Wes
t Min
ing
Ltd
Cor
o M
inin
g C
orp
Min
era
And
es In
c
Pac
ific
Boo
ker M
iner
als
Inc
Can
dent
e R
esou
rce
Cor
p
Exp
lora
tor R
esou
rces
Inc
Wes
tern
Cop
per C
orp
Inte
rnat
iona
l Pbx
Ven
ture
s
Ltd
Mar
ket C
ap /
Attr
ibut
able
Cap
ex
Fre
e C
arry
Source: Company reports and Bloomberg.
Attributable Company Metrics
Capital intensity has crept up in the industry and we expect this to continue.
Many current projects have experienced capex creep and the junior copper
names will not be immune to this and, if anything based on their timing, may be
the worst affected. Based on current numbers, the junior copper names are
outlined in Exhibit 10 with the least capital intensive names on the left.
Exhibit 10. Capex/lb. Of Cu Eq Production LOM
$-
$0.05
$0.10
$0.15
$0.20
$0.25
$0.30
$0.35
Aba
cus
Min
ing
And
Exp
lora
tion
Cor
p
Nor
ther
n D
ynas
ty M
iner
als
Ltd
Dul
uth
Met
als
Ltd
Cop
per F
ox M
etal
s In
c
Red
haw
k R
esou
rces
Inc
Aug
usta
Res
ourc
e C
orp
Pol
ymet
Min
ing
Cor
p
Exp
lora
tor R
esou
rces
Inc
Cop
per M
ount
ain
Min
ing
Cor
p
Nev
ada
Cop
per C
orp
Rio
Alto
Min
ing
Ltd
Cor
o M
inin
g C
orp
Baj
a M
inin
g C
orp
Can
dent
e R
esou
rce
Cor
p
Far
Wes
t Min
ing
Ltd
Min
era
And
es In
c
Nor
sem
ont M
inin
g In
c
Wes
tern
Cop
per C
orp
Pac
ific
Boo
ker M
iner
als
Inc
Cap
ex R
equi
red
Per
lb o
f
Pro
duct
ion
LOM
(CuE
q)
Fre
e C
arry
Source: Company reports.
Exhibit 11 shows rankings of our 28 developers based on published asset size using
the respective mine plan’s last economic cut-off grade. In the case of multiple
projects, it is a weighted average grade. Higher-grade projects typically have lower
operating costs and tend to have a cushion in overall production, once in operation.
It is for this reason that higher-grade assets are seen as more desirable. Very little
has changed in this list since our September 2010 report. New additions include Rio
Alto Mining Ltd. (RIO-V) and AQM Copper (AQM-V) and Yellowhead Mining (YMI-V).

M&A Is Heating Up But Not Boiling Over - March 02, 2011
10
Exhibit 11. Cu Eq Grades
0.00%
0.20%
0.40%
0.60%
0.80%
1.00%
1.20%
1.40%
1.60%D
ulut
h M
etal
s Lt
d
Baj
a M
inin
g C
orp
Red
haw
k R
esou
rces
Inc
Far
Wes
t Min
ing
Ltd
Ent
rée
Gol
d
Pan
oro
Min
eral
s Lt
d
Min
era
And
es In
c
NG
EX
Res
ourc
es
Lum
ina
Cop
per C
orp
Nev
ada
Cop
per C
orp
Pol
ymet
Min
ing
Cor
p
Nor
ther
n D
ynas
ty M
iner
als
Ltd
Exp
lora
tor
Res
ourc
es In
c
Cor
o M
inin
g C
orp
Nor
sem
ont M
inin
g In
c
Pac
ific
Boo
ker M
iner
als
Inc
Can
dent
e R
esou
rce
Cor
p
AQ
M C
oppe
r
Wes
tern
Cop
per C
orp
Per
egrin
e M
etal
s Lt
d
Rio
Alto
Min
ing
Ltd
Aug
usta
Res
ourc
e C
orp
Aba
cus
Min
ing
And
Exp
lora
tion
Cor
p
Cop
per
Fox
Met
als
Inc
Cop
per
Mou
ntai
n M
inin
g C
orp
Ser
enge
ti R
esou
rces
Inc
Yel
low
head
Min
ing
Inc
Inte
rnat
iona
l Pbx
Ven
ture
s Lt
d
Gra
de (C
uEq)
Source: Company reports.
Strong by-product prices across the board continue to support the economics of
many projects in our space. Looking at cash cost per pound of copper net of by-
product credits, we see that polymetallic names continue to have a clear
advantage when viewed on a cash cost per pound of copper basis (see Exhibit
12). It can be argued that many of the stronger names are not true copper
names as much of their respective revenues are derived from a suite of metals.
Exhibit 12. Total Expected Cash Costs Net Of By-product Credits
(1.50)
(1.00)
(0.50)
-
0.50
1.00
1.50
2.00
2.50
Pol
ymet
Min
ing
Cor
p
Ent
rée
Gol
d
Dul
uth
Met
als
Ltd
Wes
tern
Cop
per
Cor
p
Inte
rnat
iona
l Pbx
Ven
ture
s Lt
d
Far
Wes
t Min
ing
Ltd
Nor
ther
n D
ynas
ty M
iner
als
Ltd
Aba
cus
Min
ing
And
Exp
lora
tion
Cor
p
Cop
per
Fox
Met
als
Inc
Baj
a M
inin
g C
orp
Aug
usta
Res
ourc
e C
orp
Min
era
And
es In
c
Cor
o M
inin
g C
orp
Pac
ific
Boo
ker M
iner
als
Inc
Nor
sem
ont M
inin
g In
c
Exp
lora
tor
Res
ourc
es In
c
Can
dent
e R
esou
rce
Cor
p
Red
haw
k R
esou
rces
Inc
Rio
Alto
Min
ing
Ltd
Cop
per M
ount
ain
Min
ing
Cor
p
Nev
ada
Cop
per
Cor
p
Cas
h C
osts
(U
S$/
lb)
Net
of b
ypro
duct
cre
dits
Source: Company reports.
M&A Is Heating Up But Not Boiling Over - March 02, 2011
11
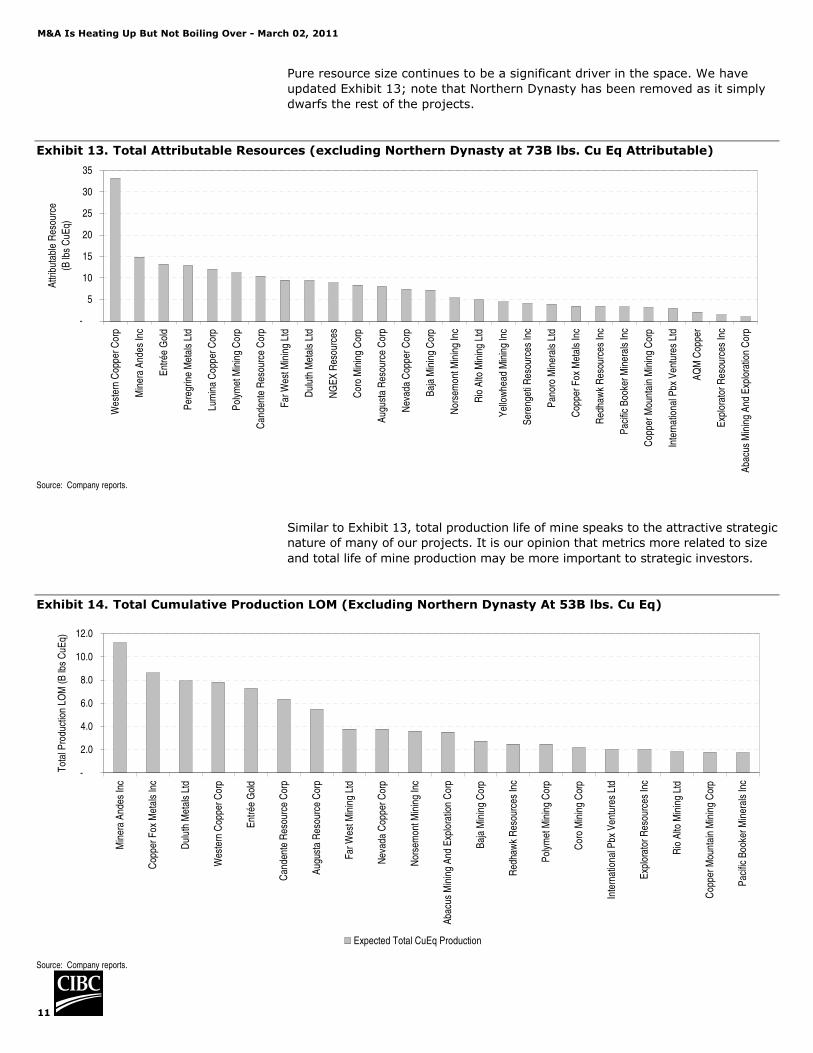
Pure resource size continues to be a significant driver in the space. We have
updated Exhibit 13; note that Northern Dynasty has been removed as it simply
dwarfs the rest of the projects.
Exhibit 13. Total Attributable Resources (excluding Northern Dynasty at 73B lbs. Cu Eq Attributable)
-
5
10
15
20
25
30
35
Wes
tern
Cop
per C
orp
Min
era
And
es In
c
Ent
rée
Gol
d
Per
egrin
e M
etal
s Lt
d
Lum
ina
Cop
per C
orp
Pol
ymet
Min
ing
Cor
p
Can
dent
e R
esou
rce
Cor
p
Far
Wes
t Min
ing
Ltd
Dul
uth
Met
als
Ltd
NG
EX
Res
ourc
es
Cor
o M
inin
g C
orp
Aug
usta
Res
ourc
e C
orp
Nev
ada
Cop
per C
orp
Baj
a M
inin
g C
orp
Nor
sem
ont M
inin
g In
c
Rio
Alto
Min
ing
Ltd
Yel
low
head
Min
ing
Inc
Ser
enge
ti R
esou
rces
Inc
Pan
oro
Min
eral
s Lt
d
Cop
per F
ox M
etal
s In
c
Red
haw
k R
esou
rces
Inc
Pac
ific
Boo
ker M
iner
als
Inc
Cop
per M
ount
ain
Min
ing
Cor
p
Inte
rnat
iona
l Pbx
Ven
ture
s Lt
d
AQ
M C
oppe
r
Exp
lora
tor R
esou
rces
Inc
Aba
cus
Min
ing
And
Exp
lora
tion
Cor
p
Attr
ibut
able
Res
ourc
e
(B lb
s C
uEq)
Source: Company reports.
Similar to Exhibit 13, total production life of mine speaks to the attractive strategic
nature of many of our projects. It is our opinion that metrics more related to size
and total life of mine production may be more important to strategic investors.
Exhibit 14. Total Cumulative Production LOM (Excluding Northern Dynasty At 53B lbs. Cu Eq)
-
2.0
4.0
6.0
8.0
10.0
12.0
Min
era
And
es In
c
Cop
per F
ox M
etal
s In
c
Dul
uth
Met
als
Ltd
Wes
tern
Cop
per C
orp
Ent
rée
Gol
d
Can
dent
e R
esou
rce
Cor
p
Aug
usta
Res
ourc
e C
orp
Far W
est M
inin
g Lt
d
Nev
ada
Cop
per C
orp
Nor
sem
ont M
inin
g In
c
Aba
cus
Min
ing
And
Exp
lora
tion
Cor
p
Baj
a M
inin
g C
orp
Red
haw
k R
esou
rces
Inc
Pol
ymet
Min
ing
Cor
p
Cor
o M
inin
g C
orp
Inte
rnat
iona
l Pbx
Ven
ture
s Lt
d
Exp
lora
tor R
esou
rces
Inc
Rio
Alto
Min
ing
Ltd
Cop
per M
ount
ain
Min
ing
Cor
p
Pac
ific
Boo
ker M
iner
als
Inc
Tot
al P
rodu
ctio
n LO
M (B
lbs
CuE
q)
Expected Total CuEq Production
Source: Company reports.

M&A Is Heating Up But Not Boiling Over - March 02, 2011
12
Project Level Comparisons
By displaying projects in a scatter chart, it is evident that a possible production
frontier could develop, particularly in the Latin American projects, in terms of
tonnage and grade. This frontier would represent the best the region has to offer
in the investable junior copper space.
Exhibit 15. Project Scatters
Latin American Projects
Haquira (Oxide)
Haquira (Sulphide)
Arapiraca (Oxide)
Arapiraca (Sulphide)
Cañariaco
San Jorge (Oxide)
San Jorge (Sulphide)
El Espino-Venus Santo Domingo
Bayaguana
Copaquire
Vizcachitas (Sulphide)
Vizcachitas (Oxide)
Taca Taca Josemaria
Cotabambas
Antilla
Sierra Gorda
Constancia
La Arena (Sulphide)
Zafranal
Altar
0.00%
0.20%
0.40%
0.60%
0.80%
1.00%
1.20%
- 200 400 600 800 1,000 1,200 1,400 1,600 1,800 2,000
Tonnage (MM)
Gra
de C
uEq
First Quantum
Aura Minerals Inc
Candente Resource Corp
Coro Mining Corp
Explorator Resources Inc
Far West Mining Ltd
Globestar Mining Corp
International Pbx Ventures Ltd
Los Andes Copper Ltd
Lumina Copper Corp
Ngex Resources
Panoro Minerals Ltd
Quadra Mining Ltd
Norsemont Mining Inc
Rio Alto Mining Ltd
AQM Copper
Peregrine Metals Ltd
US and Canada OP (Late Stage / Production)
Prosperity
Gibraltar
Huckleberry
Mount Polley
Red Chris
Carmacks (Oxide)
Rosemont (Oxide)
Rosemont (Sulphide)
Mount Milligan
Northmet
Morrison
Copper Mountain
Minto
Robinson
Carlota
Mineral Park
0.00%
0.20%
0.40%
0.60%
0.80%
1.00%
1.20%
1.40%
1.60%
1.80%
- 200 400 600 800 1,000 1,200
Tonnage (MM)
Gra
de (C
uEq)
Taseko Mines Ltd
Imperial Metals Corp
Western Copper Corp
Augusta Resource Corp
Terrane Metals Corp
Polymet Mining Corp
Pacific Booker Minerals Inc
Copper Mountain Mining Corp
Capstone Mining Corp
Quadra Mining Ltd
Mercator Minerals Ltd

M&A Is Heating Up But Not Boiling Over - March 02, 2011
13
US/Canada Early Stage OP
Catface
Giant Copper (Open Pit)
Casino (Oxide)
Casino (Sulphide)
Island Copper
Carmacks (Sulphide)
Pebble Berg
Pumpkin Hollow
Ajax
GJ
Schaft Creek
Ann Mason
Harper CreekKwaniki
0.00%
0.10%
0.20%
0.30%
0.40%
0.50%
0.60%
0.70%
0.80%
0.90%
1.00%
1,000 10,000 100,000 1,000,000 10,000,000 100,000,000
Tonnage (ln)
Cop
per G
rade
(CuE
q)
Imperial Metals Corp
Western Copper Corp
Northern Dynasty Minerals Ltd
Thompson Creek Metals
Nevada Copper Corp
Abacus Mining And Exploration Corp
Ngex Resources
Copper Fox Metals Inc
Entrée Gold
Yellowhead Mining Inc
Serengeti Resources Inc
Americas Underground Projects
Pumpkin Hollow (Ungerground)
Bo leo
Giant Copper (Underground)
Redstone
Aranzazu
Cozamin (Copper)
Cozamin (Zinc)
Kutcho
Condestable / Raul
Nokomis
Minera Va lle
Copper Creek
0.00%
0.50%
1.00%
1.50%
2.00%
2.50%
3.00%
3.50%
4.00%
4.50%
1,000 10,000 100,000 1,000,000Tonnage (ln)
Cop
per
Gra
de (C
uEq
)
Nevada Copper Corp
Baja Mining Corp
Imperial Metals Corp
Western Copper Corp
Aura Minera ls Inc
Capstone Mining Corp
Iberian Minerals Corp
Duluth Metals Ltd
Amerigo Resources Ltd
Redhawk Resources Inc
Source: Company reports.
M&A Is Heating Up But Not Boiling Over - March 02, 2011
14
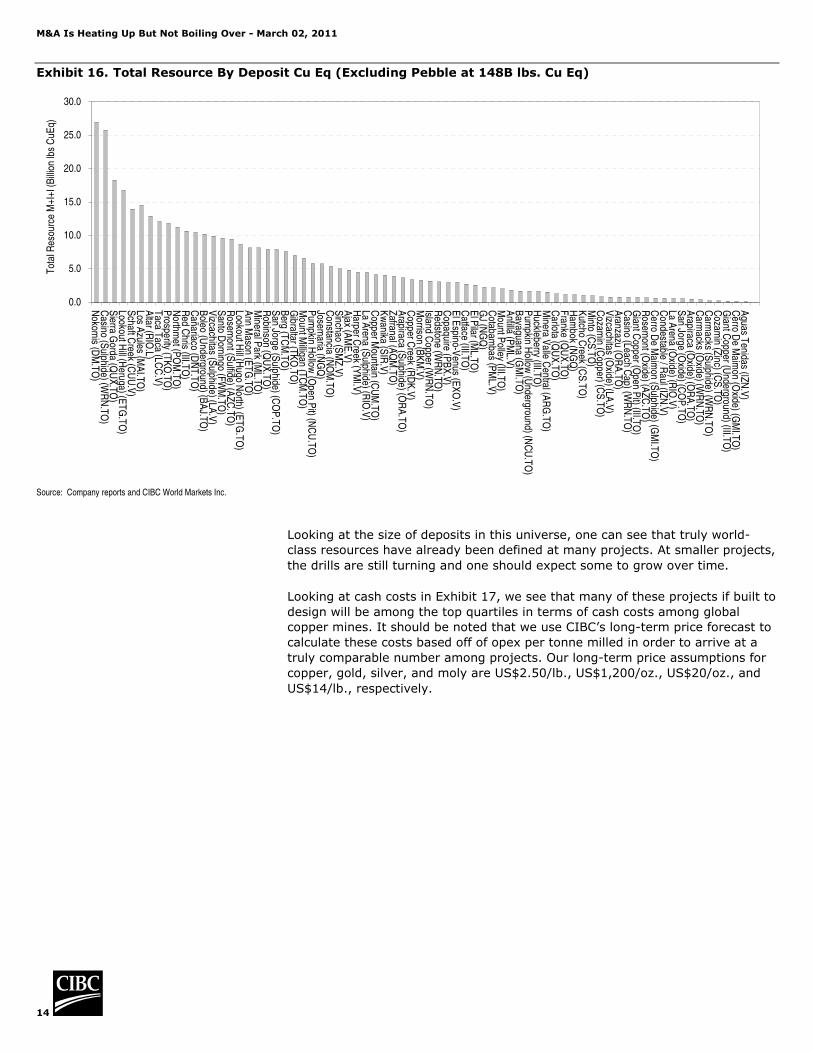
Exhibit 16. Total Resource By Deposit Cu Eq (Excluding Pebble at 148B lbs. Cu Eq)
0.0
5.0
10.0
15.0
20.0
25.0
30.0
Nokom
is (DM
.TO
)C
asino (Sulphide) (W
RN
.TO
)S
ierra Gorda (Q
UX
.TO
)Lookout H
ill (Heruga) (E
TG
.TO
)S
chaft Creek (C
UU
.V)
Los Azules (M
AI.TO
)A
ltar (RIO
.L)T
aca Taca (LC
C.V
)P
rosperity (TK
O.TO
)N
orthmet (P
OM
.TO
)R
ed Chris (III.T
O)
Cañariaco (D
NT
.TO
)B
oleo (Underground) (B
AJ.T
O)
Vizcachitas (S
ulphide) (LA.V
)S
anto Dom
ingo (FWM
.TO
)R
osemont (S
ulfide) (AZ
C.T
O)
Lookout Hill (H
ugo North) (E
TG
.TO
)A
nn Mason (E
TG
.TO)
Mineral P
ark (ML.TO
)R
obinson (QU
X.T
O)
San Jorge (S
ulphide) (CO
P.T
O)
Berg (T
CM
.TO
)G
ibraltar (TK
O.T
O)
Mount M
illigan (TC
M.T
O)
Pum
pkin Hollow
(Open P
it) (NC
U.TO
)Josem
aria (NG
Q)
Constancia (N
OM
.TO
)S
inchao (SM
Z.V
)A
jax (AM
E.V
)H
arper Creek (Y
MI.V
)La A
rena (Sulphide) (R
IO.V
)C
opper Mountain (C
UM
.TO
)K
wanika (S
IR.V
)Z
afranal (AQ
M.T
O)
Arapiraca (S
ulphide) (OR
A.T
O)
Copper C
reek (RD
K.V
)M
orrison (BK
M.V
)Island C
opper (WR
N.T
O)
Redstone (W
RN
.TO)
Copaquire (P
BX
.V)
El E
spino-Venus (E
XO
.V)
Catface (III.T
O)
El P
ilar (ML.T
O)
GJ (N
GQ
)C
otabambas (P
ML.V
)M
ount Polley (III.TO
)A
ntilla (PM
L.V)
Bayaguana (G
MI.TO
)P
umpkin H
ollow (U
nderground) (NC
U.T
O)
Huckleberry (III.T
O)
Minera V
alle Central (A
RG
.TO
)C
arlota (QU
X.T
O)
Franke (Q
UX
.TO
)H
ambok (N
GQ
)K
utcho Creek (C
S.T
O)
Minto (C
S.T
O)
Cozam
in (Copper) (C
S.T
O)
Vizcachitas (O
xide) (LA.V
)A
ranzazu (OR
A.T
O)
Casino (Leach C
ap) (WR
N.T
O)
Giant C
opper (Open P
it) (III.TO
)R
osemont (O
xide) (AZ
C.T
O)
Cerro D
e Maim
on (Sulphide) (G
MI.T
O)
Condestable / R
aul (IZN
.V)
La Arena (O
xide) (RIO
.V)
San Jorge (O
xide) (CO
P.T
O)
Arapiraca (O
xide) (OR
A.T
O)
Carm
acks (Oxide) (W
RN
.TO
)C
armacks (S
ulphide) (WR
N.T
O)
Cozam
in (Zinc) (C
S.T
O)
Giant C
opper (Underground) (III.T
O)
Cerro D
e Maim
on (Oxide) (G
MI.T
O)
Aguas T
enidas (IZN.V
)
Tot
al R
esou
rce
M+I
+I (B
illio
n lb
s C
uEq)
Source: Company reports and CIBC World Markets Inc.
Looking at the size of deposits in this universe, one can see that truly world-
class resources have already been defined at many projects. At smaller projects,
the drills are still turning and one should expect some to grow over time.
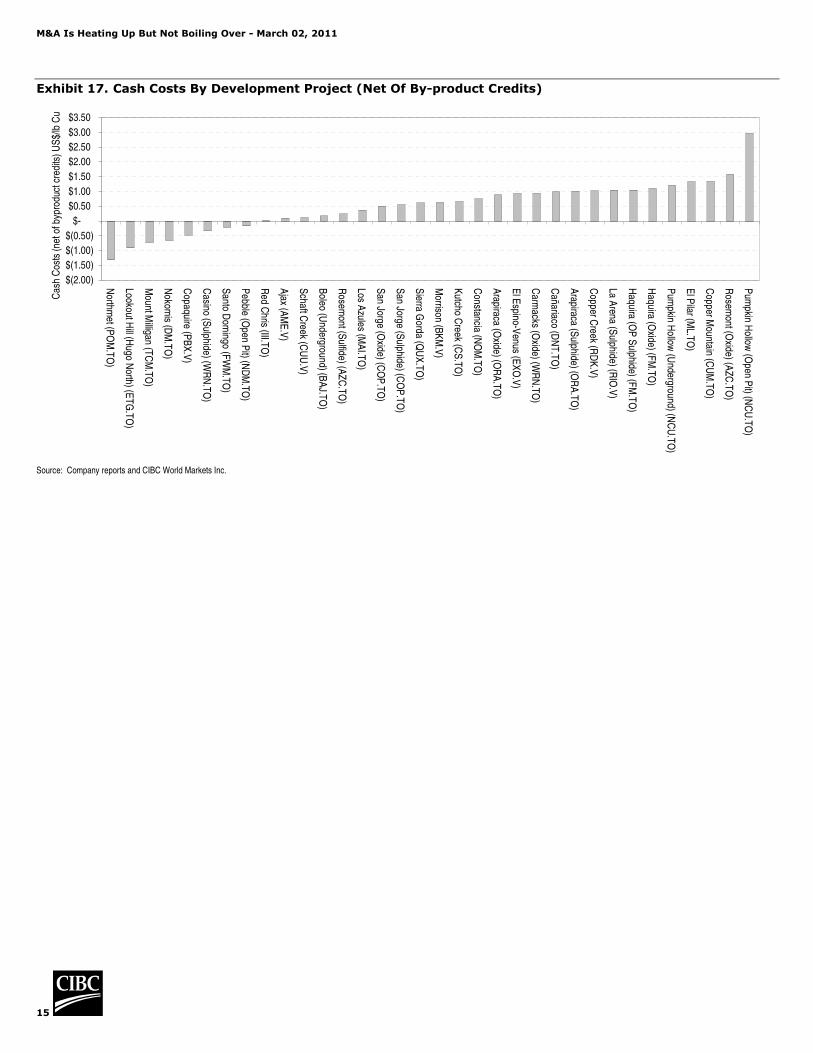
Looking at cash costs in Exhibit 17, we see that many of these projects if built to
design will be among the top quartiles in terms of cash costs among global
copper mines. It should be noted that we use CIBC’s long-term price forecast to
calculate these costs based off of opex per tonne milled in order to arrive at a
truly comparable number among projects. Our long-term price assumptions for
copper, gold, silver, and moly are US$2.50/lb., US$1,200/oz., US$20/oz., and
US$14/lb., respectively.
M&A Is Heating Up But Not Boiling Over - March 02, 2011
15
Exhibit 17. Cash Costs By Development Project (Net Of By-product Credits)
$(2.00)
$(1.50)
$(1.00)
$(0.50)
$-
$0.50
$1.00
$1.50
$2.00
$2.50
$3.00
$3.50
Northm
et (PO
M.T
O)
Lookout Hill (H
ugo North) (E
TG
.TO
)
Mount M
illigan (TC
M.TO
)
Nokom
is (DM
.TO
)
Copaquire (P
BX
.V)
Casino (S
ulphide) (WR
N.T
O)
Santo D
omingo (F
WM
.TO
)
Pebble (O
pen Pit) (N
DM
.TO
)
Red C
hris (III.TO
)
Ajax (A
ME
.V)
Schaft C
reek (CU
U.V
)
Boleo (U
nderground) (BA
J.TO
)
Rosem
ont (Sulfide) (A
ZC
.TO
)
Los Azules (M
AI.T
O)
San Jorge (O
xide) (CO
P.T
O)
San Jorge (S
ulphide) (CO
P.T
O)
Sierra G
orda (QU
X.T
O)
Morrison (B
KM
.V)
Kutcho C
reek (CS
.TO
)
Constancia (N
OM
.TO
)
Arapiraca (O
xide) (OR
A.T
O)
El E
spino-Venus (E
XO
.V)
Carm
acks (Oxide) (W
RN
.TO
)
Cañariaco (D
NT
.TO
)
Arapiraca (S
ulphide) (OR
A.T
O)
Copper C
reek (RD
K.V
)
La Arena (S
ulphide) (RIO
.V)
Haquira (O
P S
ulphide) (FM
.TO
)
Haquira (O
xide) (FM
.TO)
Pum
pkin Hollow
(Underground) (N
CU
.TO
)
El P
ilar (ML.T
O)
Copper M
ountain (CU
M.T
O)
Rosem
ont (Oxide) (A
ZC.T
O)
Pum
pkin Hollow
(Open P
it) (NC
U.T
O)
Cas
h C
osts
(net
of b
ypro
duct
cre
dits
) US
$/lb
Cu
Source: Company reports and CIBC World Markets Inc.
M&A Is Heating Up But Not Boiling Over - March 02, 2011
16
Junior Copper Company Summary Sheets

M&A Is Heating Up But Not Boiling Over - March 02, 2011
17
Abacus Mining & Exploration (AME-TSXV) Not RatedLast Price: Ian Parkinson - (416-956-6169) - [email protected]
Price Target: N/A Matthew Gibson - (416-956-6729) - [email protected]
Company Profile Key Data
52wk High (4/14/2010) 0.38 52wk Low (7/13/2010) 0.15
Avg Daily Volume (000s) 425.92
TSX Index weight (%) nm
Key Projects Shares Outstanding (MM) 171.3
Float (MM) 150.9
Market Cap ($MM) 40.6
Enterprise Value ($MM) 39.7
CQ3 2010
Cash ($mm) 4.8 P/E (Trailing 12m) (x) #N/A N/A
Working capital ($MM) (1.90) P/CF (x) 31.4
Total debt ($MM) - P/B (x) 0.79
Common equity ($mm) 51.6 EV / EBITDA (Trailing 12m) (x) #N/A N/A
Net debt/common equity (x) nm Cash Gen / Cash Req (x) (0.5)
EPS (Trailing 12m) - Price / Free Cash Flow (x) #N/A N/A
Cash Flow / Basic Share ($) (0.0) Cash Flow / Net Income (x) #N/A N/A
Book Value / Share ($) 0.3 EV/OPFCF (x) (6.5)
Sales / Share (Trailing 12m) ($) - ROE (%) (3.7)
Free Cash Flow / Share ($) (0.0) ROCE (%) #N/A N/A
Income Statement (CAD) CQ4 2010 CQ3 2010 CQ2 2010 CQ1 2010 CQ4 2009
Revenue ($MM) #N/A N/A - - - -
Operating Income ($MM) #N/A N/A (1.33) (0.58) (0.58) (0.53)
Pretax Income ($MM) #N/A N/A (1.32) (0.54) (0.61) (0.50)
Income bef XO items ($MM) #N/A N/A (1.32) (0.54) (0.61) 0.58
Net Income ($MM) #N/A N/A (1.32) (0.54) (0.61) 0.58
Basic EPS ($) #N/A N/A (0.01) - - 0.01
Diluted EPS ($) #N/A N/A (0.01) - - 0.01
EBITDA ($MM) #N/A N/A (1.32) (0.57) (0.57) (0.52)
Return on Common Equity (%) #N/A N/A (3.75) (2.54) (3.60) (3.73)
Balance Sheet CQ4 2010 CQ3 2010 CQ2 2010 CQ1 2010 CQ4 2009Total Current Assets ($MM) #N/A N/A 3.09 4.45 2.51 7.06
Total Long-Term Assets ($MM) #N/A N/A 54.72 50.84 48.14 46.81 Total Assets ($MM) #N/A N/A 57.81 55.29 50.65 53.87
Total Current Liabilities ($MM) #N/A N/A 4.99 1.33 1.04 3.69
Total Long-Term Liabilities ($MM) #N/A N/A 1.25 1.25 1.25 1.25
Total Liabilities ($MM) #N/A N/A 6.24 2.58 2.29 4.95
Total Shareholders' Equity ($MM) #N/A N/A 51.57 52.70 48.36 48.93
Shares Outstanding (MM) #N/A N/A 176.35 176.35 156.33 156.30
Book Value per Share ($) #N/A N/A 0.29 0.30 0.31 0.31
Tangible Book Value / Sh ($) #N/A N/A 0.29 0.30 0.31 0.31
Shrhldr Eqy / Tot Liab & Eqy (%) #N/A N/A 89.20 95.32 95.48 90.82
Cash Flow CQ4 2010 CQ3 2010 CQ2 2010 CQ1 2010 CQ4 2009
Net Income ($MM) #N/A N/A (1.32) (0.54) (0.61) 0.58
Cash - Operating Activities ($MM) #N/A N/A 0.74 0.05 0.51 (0.05)
Cash - Investing Activities ($MM) #N/A N/A (3.89) (1.60) (1.34) (0.94)
Cash - Financing Activities ($MM) #N/A N/A - 3.75 (2.14) 5.38
Net Changes in Cash ($MM) #N/A N/A (3.15) 2.20 (2.97) 4.39
Free Cash Flow ($MM) #N/A N/A (2.46) (1.55) (0.83) (1.07)
Free Cash Flow / Diluted Sh ($) #N/A N/A (0.01) (0.01) (0.01) (0.01)
Cash flow per Share ($) #N/A N/A 0.00 0.00 0.00 (0.00)
Share Price Performance
Project Locations
Project Specifics
Ownership
% Location Deposit Type
Ajax 20% British Columbia, Canada PEA Cu Au Porphyry OP 23 1.7 Floatation
Resources Class Tonnes Grades Contained Metal
(MM)
Ajax M+I 442.0 0.30% 0.19 2,923 2,700 Management Team
Inferred 81.0 0.22% 0.16 393 417 JIM EXCELL, PRESIDENT & CEO
ANDREW F POOLER, EXEC VP/COO
Operating Metrics Attributable Capex Operating Costs Attributable Production (avg p.a.) JIM WHITTAKER, PROJECT MANAGER - AJAX
GORDON FROST, CHIEF MINING ENGINEER
Initial Sustaining US$/lb Cu* JOHN PATRICK NICOL, SENIOR VP/CFO
Ajax - 313.0 0.10 6.04 60,000 21.0 20.0 ROBERT FRIESEN, SENIOR EXPLORATION MANAGERRD - Resource Definition, PEA - Preliminary Economic Assessment (Scoping Study), PFS - Prefeasibility Study, DFS - Definitive Feasibility Study Website www.amemining.com
*By-product credits based on CIBC long term metal price forecasts
Cu
(MM lbs)
Au
(000 oz)
US$/t milled Throughput (tpd)
Cu
(MM lbs)
Au
(000 oz)
C$0.23
Mining
Method
Engineering
Completed
Cu
(%)
Au
(g/t)
Recovery Method
Mine
Life (yrs)
Ratio
(w/o)
0.00
0.05
0.10
0.15
0.20
0.25
0.30
0.35
0.40
F-10 A-10 J-10 A-10 O-10 D-10 F-11
.0 M
.5 M
1.0 M
1.5 M
2.0 M
2.5 M
3.0 M
Ajax
The Ajax property comprises eight 100% owned Crown grants including the historic Ajax East and West pits. Also included is an interest in claims between the pits
acquired as a result of a joint-venture agreement signed with New Gold Inc. The Ajax area lies nine kilometres southeast along an existing haul road from the Afton mill,
shop facilities, tailings area, and water rights which Abacus agreed to purchase in 2005 from Teck-Cominco.
Preliminary Analysis - The preliminary analysis on Ajax underscores the potential for a robust mining operation. The National Instrument 43-101 compliant study
completed by Wardrop, a Tetra Tech Company ("Wardrop"), contains production parameters, capital costs, operating costs, and other financial projections for an open pit
mine processing 60,000 tonnes of mill feed per day. The metal prices used for the base case were US $2.00 per pound copper and US $700 per ounce gold.
Base Case Highlights (All figures in US dollars and pre-tax):
-Net present value of $192.7 million discounted at 8%
-Return on initial capital expenditures of $535 million is 40.4%
-Average life of mine cash costs of $1.17 per pound copper net of gold credit at $700 per ounce
-Average annual production estimated at 106 million pounds of copper and 99,400 ounces of gold in concentrate
-Mine life of approximately 23 years
-The pit inventory resource contains 2.6 billion pounds of copper and 2.4 million ounces of gold in the measured and indicated category
-Highly sensitive to the upward movement in copper and gold prices
-The following sensitivity tables provide net present value, internal rate of return, return on initial capital and payback period data at a discount rate of 8%:
Mining and Milling - A detailed open pit mine plan was completed to supply 21.9 million tonnes of ore per year (60,000 tonnes per day) to the mill. The mine life is
approximately 23 years and has an average strip ratio of 1.7:1 (waste tonnes: mill feed tonnes). The open pit was designed with 12 metre benches and pit slopes
adjusted to comply with the geotechnical analysis. The ore and waste will be drilled for blasting utilizing electric drills capable of drilling 311 millimetre diameter blast-
holes. Blasted material will then be loaded into 228 tonne haul trucks with 35 cubic metre electric rope shovels and 19 cubic metre front-end loaders. The ore will be
delivered to a 60 inch x 89 inch gyratory primary crusher. The crushed ore will feed to a conventional copper concentrator. The concentrator design includes a single 40
foot x 25 foot SAG mill followed by two 24 foot x 42 foot ball mills. Copper and gold are then recovered in concentrate through a conventional flotation circuit. The
concentrate will then be filtered and shipped by rail to the port in Vancouver. Metal production in concentrate is estimated at approximately 106 million pounds of copper
and 99,400 ounces of gold per year. Metallurgical recovery equations were based on a series of lock-cycle recovery tests performed by G&T Labs of Kamloops, B.C. The
expected recoveries were determined to be 81.5% copper and 81.1% gold providing a 25% copper concentrate at the average mill feed grade. Further metallurgical
testing will be carried out in conjunction with the prefeasibility work.
Location and Infrastructure - The Ajax property is favorably situated in south-central British Columbia, approximately 10 kilometres from the city of Kamloops. The local
economy is largely resource and service oriented with a major emphasis on forestry, mining, agriculture, and ranching. The city is a central trading hub to a region with
population of 127,000 with established transportation routes and communication infrastructure. The infrastructure that presently exists near the Ajax property is
significant. The property is surrounded by two major highways and rail lines with direct access to deep sea ports. Power and water are also readily available, with both
running up to the historic Afton mine camp that was operated by Teck between the 1970s and 1990s. On the property, access is gained by haul roads constructed by
Teck in the 1980s. The haul roads connect the Ajax area to the Company's tailings storage facility, and to other high priority targets in the Afton area, including the
Rainbow and DM zones.
Capital - The total capital cost to commence production is estimated at $535 million. Included in the capital estimate are costs for the initial mining equipment, pre-
production stripping, a 60,000 tonnes per day copper concentrator, shop, warehouse, infrastructure and indirect costs associated with the design engineering
procurement and construction, commissioning, spare parts, contingency and owner's cost. The costs also include the initial expansion of the existing tailings facility. All
capital costs are estimated to an accuracy of + 25% / -5%.
Environmental - In preparation for permitting an environmental baseline study was completed to assess the current environmental status across the mine site. The study
includes evaluation of the flora and fauna, ground and surface water quality and static testing for acid generating potential. The study concluded that no significant issues
are present that would impede the permitting process. The static testing for acid generating suggested the material to be mined is not acid generating. Kinetic testing is
scheduled for completion during the upcoming pre-feasibility study.
KGHM Partnership - Abacus signed an investment agreement with KGHM. The agreement called for $4.5MM in an immediate private placement, which will fully fund
AME corporate costs through to the end of construction. An earn-in for 51% of the project for US$37MM, $30MM to fund the DFS and $7MM to fund exploration. An
additional 29% of the project interest can be earned by KGHM for a payment of US$35MM and funds 100% of the US$535MM expected initial capex.
With resources rich in copper and gold. Abacus Mining is a mineral exploration and development company with advanced-stage projects located in the prolific Afton Mining
Camp near Kamloops, British Columbia. The company has partnered with KGHM in order to develop the Ajax project.
Company Update
January 10, 2011 - Abacus and KGHM Ajax initiate Environmental Assessment Review Process - Abacus Mining announced the initiation of the Environmental
Assessment Review Process for the Ajax Project, a proposed copper-gold mine located 10 kilometres southwest of Kamloops, B.C. The Environmental Assessment Review
and permitting phase for the Ajax Project has now been launched with the submission of the Project Description to the British Columbia Environmental Assessment Office
and the Canadian Environmental Assessment Agency.
December 1, 2010 - Feasibility Study Underway on Ajax Copper-gold Project B.C.- Abacus Mining through the KGHM Ajax Joint Venture with KGHM Polska Miedz
S.A. provide an update on the Feasibility Study currently underway on the Ajax copper-gold project located 10 kilometres southwest of Kamloops, B.C. The Feasibility Study
commenced shortly after Abacus and KGHM announced the formation of the Joint Venture in May 2010, and is expected to be completed next year. The purpose of the
Study is to determine updated estimates for the life of mine production schedule of the Ajax project, initial and sustaining capital, as well as operational costs.
November 2, 2010 - Abacus Reports on 18,000m Drill Program - Results from the first 15 holes of exploration drilling and 7 holes on infill drilling. Highlights of the Ajax
East Extention drilling include:
Hole AM-10-066 72m of 0.61% Cu and 0.35 g/t Au starting at 27m
Hole AM-10-068 66m of 0.36% Cu and 0.24 g/t Au starting at 28m
Hole AM-10-069 8m of 0.49% Cu and 0.28 g/t Au starting at 107m
Source: Company reports.
M&A Is Heating Up But Not Boiling Over - March 02, 2011
18
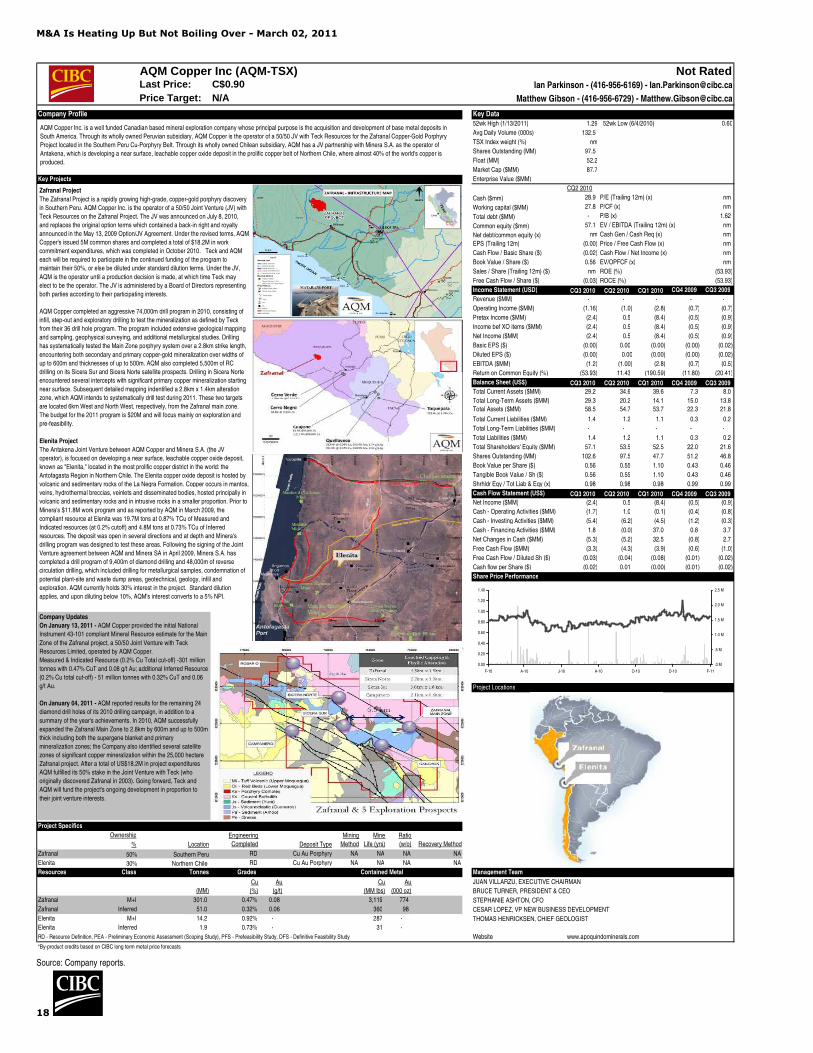
AQM Copper Inc (AQM-TSX) Not RatedLast Price: Ian Parkinson - (416-956-6169) - [email protected]
Price Target: N/A Matthew Gibson - (416-956-6729) - [email protected]
Company Profile Key Data52wk High (1/13/2011) 1.29 52wk Low (6/4/2010) 0.60
Avg Daily Volume (000s) 132.5
TSX Index weight (%) nm
Shares Outstanding (MM) 97.5
Float (MM) 52.2
Market Cap ($MM) 87.7
Key Projects Enterprise Value ($MM) #N/A N/A
CQ2 2010
Cash ($mm) 28.9 P/E (Trailing 12m) (x) nm
Working capital ($MM) 27.8 P/CF (x) nm
Total debt ($MM) - P/B (x) 1.62
Common equity ($mm) 57.1 EV / EBITDA (Trailing 12m) (x) nm
Net debt/common equity (x) nm Cash Gen / Cash Req (x) nm
EPS (Trailing 12m) (0.00) Price / Free Cash Flow (x) nm
Cash Flow / Basic Share ($) (0.02) Cash Flow / Net Income (x) nm
Book Value / Share ($) 0.56 EV/OPFCF (x) nm
Sales / Share (Trailing 12m) ($) nm ROE (%) (53.93)
Free Cash Flow / Share ($) (0.03) ROCE (%) (53.93)
Income Statement (USD) CQ3 2010 CQ2 2010 CQ1 2010 CQ4 2009 CQ3 2009
Revenue ($MM) - - - - -
Operating Income ($MM) (1.16) (1.0) (2.8) (0.7) (0.7)
Pretax Income ($MM) (2.4) 0.5 (8.4) (0.5) (0.9)
Income bef XO items ($MM) (2.4) 0.5 (8.4) (0.5) (0.9)
Net Income ($MM) (2.4) 0.5 (8.4) (0.5) (0.9)
Basic EPS ($) (0.00) 0.00 (0.00) (0.00) (0.02)
Diluted EPS ($) (0.00) 0.00 (0.00) (0.00) (0.02)
EBITDA ($MM) (1.2) (1.00) (2.8) (0.7) (0.5)
Return on Common Equity (%) (53.93) 11.43 (190.59) (11.80) (20.41)
Balance Sheet (US$) CQ3 2010 CQ2 2010 CQ1 2010 CQ4 2009 CQ3 2009
Total Current Assets ($MM) 29.2 34.6 39.6 7.3 8.0
Total Long-Term Assets ($MM) 29.3 20.2 14.1 15.0 13.8
Total Assets ($MM) 58.5 54.7 53.7 22.3 21.8
Total Current Liabilities ($MM) 1.4 1.2 1.1 0.3 0.2
Total Long-Term Liabilities ($MM) - - - - -
Total Liabilities ($MM) 1.4 1.2 1.1 0.3 0.2
Total Shareholders' Equity ($MM) 57.1 53.5 52.5 22.0 21.6
Shares Outstanding (MM) 102.6 97.5 47.7 51.2 46.8
Book Value per Share ($) 0.56 0.55 1.10 0.43 0.46
Tangible Book Value / Sh ($) 0.56 0.55 1.10 0.43 0.46
Shrhldr Eqy / Tot Liab & Eqy (x) 0.98 0.98 0.98 0.99 0.99
Cash Flow Statement (US$) CQ3 2010 CQ2 2010 CQ1 2010 CQ4 2009 CQ3 2009
Net Income ($MM) (2.4) 0.5 (8.4) (0.5) (0.9)
Cash - Operating Activities ($MM) (1.7) 1.0 (0.1) (0.4) (0.8)
Cash - Investing Activities ($MM) (5.4) (6.2) (4.5) (1.2) (0.3)
Cash - Financing Activities ($MM) 1.8 (0.0) 37.0 0.8 3.7
Net Changes in Cash ($MM) (5.3) (5.2) 32.5 (0.8) 2.7
Free Cash Flow ($MM) (3.3) (4.3) (3.9) (0.6) (1.0)
Free Cash Flow / Diluted Sh ($) (0.03) (0.04) (0.08) (0.01) (0.02)
Cash flow per Share ($) (0.02) 0.01 (0.00) (0.01) (0.02)
Share Price Performance
Project Locations
Project Specifics
Ownership
% Location Deposit Type
Zafranal 50% Southern Peru RD Cu Au Porphyry NA NA NA NA
Elenita 30% Northern Chile RD Cu Au Porphyry NA NA NA NA
Resources Class Tonnes Grades Contained Metal Management Team
JUAN VILLARZU, EXECUTIVE CHAIRMAN
(MM) BRUCE TURNER, PRESIDENT & CEO
Zafranal M+I 301.0 0.47% 0.08 3,119 774 STEPHANIE ASHTON, CFO
Zafranal Inferred 51.0 0.32% 0.06 360 98 CESAR LOPEZ, VP NEW BUSINESS DEVELOPMENT
Elenita M+I 14.2 0.92% - 287 - THOMAS HENRICKSEN, CHIEF GEOLOGIST
Elenita Inferred 1.9 0.73% - 31 -
RD - Resource Definition, PEA - Preliminary Economic Assessment (Scoping Study), PFS - Prefeasibility Study, DFS - Definitive Feasibility Study Website www.apoquindominerals.com
*By-product credits based on CIBC long term metal price forecasts
Au
(g/t)
Cu
(MM lbs)
Cu
(%)
Au
(000 oz)
Recovery Method
C$0.90
Mining
Method
Mine
Life (yrs)
Ratio
(w/o)
Engineering
Completed
Zafranal Project
The Zafranal Project is a rapidly growing high-grade, copper-gold porphyry discovery
in Southern Peru. AQM Copper Inc. is the operator of a 50/50 Joint Venture (JV) with
Teck Resources on the Zafranal Project. The JV was announced on July 8, 2010,
and replaces the original option terms which contained a back-in right and royalty
announced in the May 13, 2009 Option/JV Agreement. Under the revised terms, AQM
Copper's issued 5M common shares and completed a total of $18.2M in work
commitment expenditures, which was completed in October 2010. Teck and AQM
each will be required to participate in the continued funding of the program to
maintain their 50%, or else be diluted under standard dilution terms. Under the JV,
AQM is the operator until a production decision is made, at which time Teck may
elect to be the operator. The JV is administered by a Board of Directors representing
both parties according to their participating interests.
AQM Copper completed an aggressive 74,000m drill program in 2010, consisting of
infill, step-out and exploratory drilling to test the mineralization as defined by Teck
from their 36 drill hole program. The program included extensive geological mapping
and sampling, geophysical surveying, and additional metallurgical studies. Drilling
has systematically tested the Main Zone porphyry system over a 2.8km strike length,
encountering both secondary and primary copper-gold mineralization over widths of
up to 600m and thicknesses of up to 500m. AQM also completed 5,500m of RC
drilling on its Sicera Sur and Sicera Norte satellite prospects. Drilling in Sicera Norte
encountered several intercepts with significant primary copper mineralization starting
near surface. Subsequent detailed mapping indentified a 2.8km x 1.4km alteration
zone, which AQM intends to systematically drill test during 2011. These two targets
are located 6km West and North West, respectively, from the Zafranal main zone.
The budget for the 2011 program is $20M and will focus mainly on exploration and
pre-feasibility.
Elenita Project
The Antakena Joint Venture between AQM Copper and Minera S.A. (the JV
operator), is focused on developing a near surface, leachable copper oxide deposit,
known as "Elenita," located in the most prolific copper district in the world: the
Antofagasta Region in Northern Chile. The Elenita copper oxide deposit is hosted by
volcanic and sedimentary rocks of the La Negra Formation. Copper occurs in mantos,
veins, hydrothermal breccias, veinlets and disseminated bodies, hosted principally in
volcanic and sedimentary rocks and in intrusive rocks in a smaller proportion. Prior to
Minera's $11.8M work program and as reported by AQM in March 2009, the
compliant resource at Elenita was 19.7M tons at 0.87% TCu of Measured and
Indicated resources (at 0.2% cutoff) and 4.8M tons at 0.73% TCu of Inferred
resources. The deposit was open in several directions and at depth and Minera's
drilling program was designed to test these areas. Following the signing of the Joint
Venture agreement between AQM and Minera SA in April 2009, Minera S.A. has
completed a drill program of 9,400m of diamond drilling and 48,000m of reverse
circulation drilling, which included drilling for metallurgical samples, condemnation of
potential plant-site and waste dump areas, geotechnical, geology, infill and
exploration. AQM currently holds 30% interest in the project. Standard dilution
applies, and upon diluting below 10%, AQM's interest converts to a 5% NPI.
AQM Copper Inc. is a well funded Canadian based mineral exploration company whose principal purpose is the acquisition and development of base metal deposits in
South America. Through its wholly owned Peruvian subsidiary, AQM Copper is the operator of a 50/50 JV with Teck Resources for the Zafranal Copper-Gold Porphyry
Project located in the Southern Peru Cu-Porphyry Belt. Through its wholly owned Chilean subsidiary, AQM has a JV partnership with Minera S.A. as the operator of
Antakena, which is developing a near surface, leachable copper oxide deposit in the prolific copper belt of Northern Chile, where almost 40% of the world's copper is
produced.
0.00
0.20
0.40
0.60
0.80
1.00
1.20
1.40
F-10 A-10 J-10 A-10 O-10 D-10 F-11
.0 M
.5 M
1.0 M
1.5 M
2.0 M
2.5 M
Company Updates
On January 13, 2011 - AQM Copper provided the initial National
Instrument 43-101 compliant Mineral Resource estimate for the Main
Zone of the Zafranal project, a 50/50 Joint Venture with Teck
Resources Limited, operated by AQM Copper.
Measured & Indicated Resource (0.2% Cu Total cut-off) -301 million
tonnes with 0.47% CuT and 0.08 g/t Au; additional Inferred Resource
(0.2% Cu total cut-off) - 51 million tonnes with 0.32% CuT and 0.06
g/t Au.
On January 04, 2011 - AQM reported results for the remaining 24
diamond drill holes of its 2010 drilling campaign, in addition to a
summary of the year's achievements. In 2010, AQM successfully
expanded the Zafranal Main Zone to 2.8km by 600m and up to 500m
thick including both the supergene blanket and primary
mineralization zones; the Company also identified several satellite
zones of significant copper mineralization within the 25,000 hectare
Zafranal project. After a total of US$18.2M in project expenditures
AQM fulfilled its 50% stake in the Joint Venture with Teck (who
originally discovered Zafranal in 2003). Going forward, Teck and
AQM will fund the project's ongoing development in proportion to
their joint venture interests.
Source: Company reports.
M&A Is Heating Up But Not Boiling Over - March 02, 2011
19
Augusta Resource Corp (AZC-TSX) Not RatedLast Price: Ian Parkinson - (416-956-6169) - [email protected]
Price Target: N/A Matthew Gibson - (416-956-6729) - [email protected]
Company Profile Key Data52wk High (2/17/2011) 5.60 52wk Low (7/12/2010) 1.31
Avg Daily Volume (000s) 447.58
TSX Index weight (%) nm
Shares Outstanding (MM) 122.5
Float (MM) 92.8
Market Cap ($MM) 716.9
Key Projects Enterprise Value ($MM) 745.5
FQ3 2010
Cash ($mm) 6.2 P/E (Trailing 12m) (x) #N/A N/A
Working capital ($MM) 5.54 P/CF (x) #N/A N/A
Total debt ($MM) 45.8 P/B (x) 4.84
Common equity ($mm) 149.8 EV / EBITDA (Trailing 12m) (x) #N/A N/A
Net debt/common equity (x) 0.2637805 Cash Gen / Cash Req (x) (0.1)
EPS (Trailing 12m) (0.1) Price / Free Cash Flow (x) #N/A N/A
Cash Flow / Basic Share ($) (0.0) Cash Flow / Net Income (x) #N/A N/A
Book Value / Share ($) 1.1 EV/OPFCF (x) nm
Sales / Share (Trailing 12m) ($) #N/A N/A ROE (%) (8.3)
Free Cash Flow / Share ($) (0.4) ROCE (%) #N/A N/A
Income Statement (USD) FQ3 2010 FQ2 2010 FQ1 2010 FQ4 2009 FQ3 2009
Revenue ($MM) #N/A N/A #N/A N/A #N/A N/A - #N/A N/A
Operating Income ($MM) (1.74) (1.23) (1.48) (1.33) (1.12)
Pretax Income ($MM) (1.09) (2.21) (1.44) (1.63) (0.94)
Income bef XO items ($MM) (1.09) (2.21) (1.37) (1.63) (0.94)
Net Income ($MM) (1.09) (2.21) (1.37) (2.14) (0.94)
Basic EPS ($) (0.01) (0.02) (0.01) (0.02) (0.01)
Diluted EPS ($) (0.01) (0.02) (0.01) (0.02) (0.01)
EBITDA ($MM) (1.69) (1.19) (1.44) (1.26) (1.09)
Return on Common Equity (%) (5.53) (6.87) (6.26) (8.28) (11.17)
Balance Sheet FQ3 2010 FQ2 2010 FQ1 2010 FQ4 2009 FQ3 2009
Total Current Assets ($MM) 15.15 8.64 17.23 7.08 17.21
Total Long-Term Assets ($MM) 186.42 164.65 147.88 135.56 127.41
Total Assets ($MM) 201.57 173.28 165.11 142.64 144.62
Total Current Liabilities ($MM) 9.61 7.93 4.34 54.56 44.50
Total Long-Term Liabilities ($MM) 42.14 44.26 46.44 3.59 3.56
Total Liabilities ($MM) 51.75 52.19 50.78 58.15 48.07
Total Shareholders' Equity ($MM) 149.82 121.09 114.33 84.48 96.55
Shares Outstanding (MM) 133.93 122.48 119.13 106.77 106.39
Book Value per Share ($) 1.12 0.99 0.96 0.79 0.91
Tangible Book Value / Sh ($) 1.12 0.99 0.96 0.79 0.91
Shrhldr Eqy / Tot Liab & Eqy (%) 74.33 69.88 69.24 59.23 66.76
Cash Flow FQ3 2010 FQ2 2010 FQ1 2010 FQ4 2009 FQ3 2009
Net Income ($MM) (1.09) (2.21) (1.37) (2.14) (0.94)
Cash - Operating Activities ($MM) (1.47) (0.85) (1.67) (1.36) (0.56)
Cash - Investing Activities ($MM) (16.72) (14.66) (18.77) (10.31) (9.42)
Cash - Financing Activities ($MM) 26.67 5.44 29.80 2.08 24.60
Net Changes in Cash ($MM) 8.48 (10.07) 9.36 (9.59) 14.61
Free Cash Flow ($MM) (18.44) (15.51) (20.45) (13.07) (7.60)
Free Cash Flow / Diluted Sh ($) (0.15) (0.13) (0.19) (0.13) (0.08)
Cash flow per Share ($) (0.01) (0.01) (0.02) (0.01) (0.01)
Share Price Performance
Project Location
Project Specifics
Ownership
% Location Deposit Type
Rosemont (Oxide) 80% Arizona, USA DFS Cu-Mo-Ag Porphyry OP 7 2.0 SX/EW
Rosemont (Sulfide) 80% Arizona, USA DFS Cu-Mo-Ag Porphyry OP 21 2.0 Floatation
Resources Class Tonnes
(MM)
Rosemont (Oxide) M+I 103.4 0.20% - - - 456 - - -
Inferred 30.4 0.24% - - - 161 - - -
Rosemont (Sulfide) M+I 635.9 0.46% 0.013% - 0.12 6,492 94 - 2,365
Inferred 229.9 0.38% 0.007% - 0.06 1,912 34 - 416
Operating Metrics Attributable Capex Management Team
RICHARD W. WARKE, CHAIRMAN
Initial Sustaining US$/lb Cu* US$/t milled GIL CLAUSEN, PRESIDENT/CEO
Rosemont (Oxide) 0.0 - 1.58 3.50 16.0 - - - RAGHUNATH REDDY, CHIEF FINANCIAL OFFICER
Rosemont (Sulfide) 611.7 109.8 0.24 7.43 160.0 3.8 13.6 1,920.0 LANCE NEWMAN, VP PROJECT DEVELOPMENT
ROD PACE, CEO ROSEMONT COPPER COMPANY
MARK STEVENS, VP EXPLORATION
RD - Resource Definition, PEA - Preliminary Economic Assessment (Scoping Study), PFS - Prefeasibility Study, DFS - Definitive Feasibility Study Website www.augustaresource.com
*By-product credits based on CIBC long term metal price forecasts
Ag
(000 oz)
Attributable Production (avg p.a.)
C$5.30
Cu
(MM lbs)
Recovery Method
Au
(000 oz)
Ag
(000 oz)
Cu
(MM lbs)
25,000
Au
(000 oz)Throughput (tpd)
Engineering
Completed
Mine
Life (yrs)
Mining
Method
Mo
(MM lbs)
Strip Ratio
(w/o)
Contained Metal
Mo
MM lbs
Grades
Ag
(g/t)
Au
(g/t)
Mo
(%)
Cu
(%)
Operating Costs
68,000
Rosemont
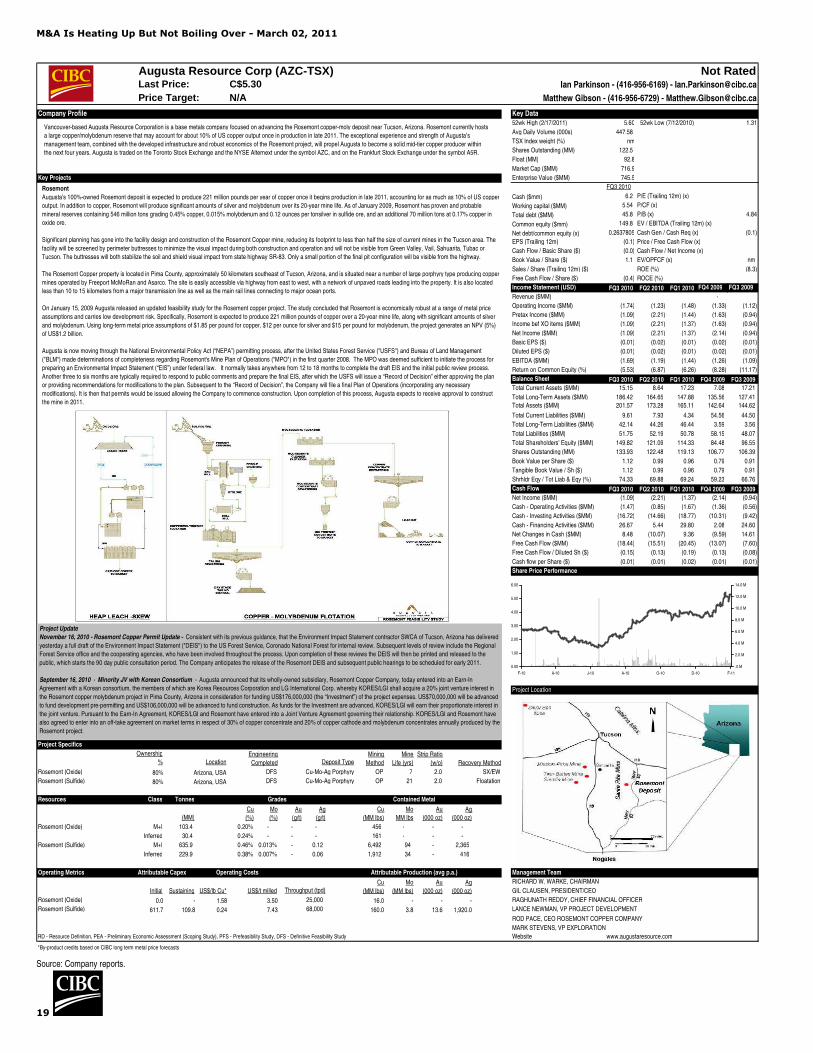
Augusta's 100%-owned Rosemont deposit is expected to produce 221 million pounds per year of copper once it begins production in late 2011, accounting for as much as 10% of US copper
output. In addition to copper, Rosemont will produce significant amounts of silver and molybdenum over its 20-year mine life. As of January 2009, Rosemont has proven and probable
mineral reserves containing 546 million tons grading 0.45% copper, 0.015% molybdenum and 0.12 ounces per tonsilver in sulfide ore, and an additional 70 million tons at 0.17% copper in
oxide ore.
Significant planning has gone into the facility design and construction of the Rosemont Copper mine, reducing its footprint to less than half the size of current mines in the Tucson area. The
facility will be screened by perimeter buttresses to minimize the visual impact during both construction and operation and will not be visible from Green Valley, Vail, Sahuarita, Tubac or
Tucson. The buttresses will both stabilize the soil and shield visual impact from state highway SR-83. Only a small portion of the final pit configuration will be visible from the highway.
The Rosemont Copper property is located in Pima County, approximately 50 kilometers southeast of Tucson, Arizona, and is situated near a number of large porphyry type producing copper
mines operated by Freeport McMoRan and Asarco. The site is easily accessible via highway from east to west, with a network of unpaved roads leading into the property. It is also located
less than 10 to 15 kilometers from a major transmission line as well as the main rail lines connecting to major ocean ports.
On January 15, 2009 Augusta released an updated feasibility study for the Rosement copper project. The study concluded that Rosemont is economically robust at a range of metal price
assumptions and carries low development risk. Specifically, Rosemont is expected to produce 221 million pounds of copper over a 20-year mine life, along with significant amounts of silver
and molybdenum. Using long-term metal price assumptions of $1.85 per pound for copper, $12 per ounce for silver and $15 per pound for molybdenum, the project generates an NPV (5%)
of US$1.2 billion.
Augusta is now moving through the National Environmental Policy Act (“NEPA”) permitting process, after the United States Forest Service ("USFS") and Bureau of Land Management
("BLM") made determinations of completeness regarding Rosemont's Mine Plan of Operations ("MPO") in the first quarter 2008. The MPO was deemed sufficient to initiate the process for
preparing an Environmental Impact Statement (“EIS”) under federal law. It normally takes anywhere from 12 to 18 months to complete the draft EIS and the initial public review process.
Another three to six months are typically required to respond to public comments and prepare the final EIS, after which the USFS will issue a “Record of Decision” either approving the plan
or providing recommendations for modifications to the plan. Subsequent to the “Record of Decision”, the Company will file a final Plan of Operations (incorporating any necessary
modifications). It is then that permits would be issued allowing the Company to commence construction. Upon completion of this process, Augusta expects to receive approval to construct
the mine in 2011.
Vancouver-based Augusta Resource Corporation is a base metals company focused on advancing the Rosemont copper-moly deposit near Tucson, Arizona. Rosemont currently hosts
a large copper/molybdenum reserve that may account for about 10% of US copper output once in production in late 2011. The exceptional experience and strength of Augusta’s
management team, combined with the developed infrastructure and robust economics of the Rosemont project, will propel Augusta to become a solid mid-tier copper producer within
the next four years. Augusta is traded on the Toronto Stock Exchange and the NYSE Alternext under the symbol AZC, and on the Frankfurt Stock Exchange under the symbol A5R.
0.00
1.00
2.00
3.00
4.00
5.00
6.00
F-10 A-10 J-10 A-10 O-10 D-10 F-11
.0 M
2.0 M
4.0 M
6.0 M
8.0 M
10.0 M
12.0 M
14.0 M
Project Update
November 16, 2010 - Rosemont Copper Permit Update - Consistent with its previous guidance, that the Environment Impact Statement contractor SWCA of Tucson, Arizona has delivered
yesterday a full draft of the Environment Impact Statement ("DEIS") to the US Forest Service, Coronado National Forest for internal review. Subsequent levels of review include the Regional
Forest Service office and the cooperating agencies, who have been involved throughout the process. Upon completion of these reviews the DEIS will then be printed and released to the
public, which starts the 90 day public consultation period. The Company anticipates the release of the Rosemont DEIS and subsequent public hearings to be scheduled for early 2011.
September 16, 2010 - Minority JV with Korean Consortium - Augusta announced that its wholly-owned subsidiary, Rosemont Copper Company, today entered into an Earn-In
Agreement with a Korean consortium, the members of which are Korea Resources Corporation and LG International Corp. whereby KORES/LGI shall acquire a 20% joint venture interest in
the Rosemont copper molybdenum project in Pima County, Arizona in consideration for funding US$176,000,000 (the “Investment”) of the project expenses. US$70,000,000 will be advanced
to fund development pre-permitting and US$106,000,000 will be advanced to fund construction. As funds for the Investment are advanced, KORES/LGI will earn their proportionate interest in
the joint venture. Pursuant to the Earn-In Agreement, KORES/LGI and Rosemont have entered into a Joint Venture Agreement governing their relationship. KORES/LGI and Rosemont have
also agreed to enter into an off-take agreement on market terms in respect of 30% of copper concentrate and 20% of copper cathode and molybdenum concentrates annually produced by the
Rosemont project.
Source: Company reports.

M&A Is Heating Up But Not Boiling Over - March 02, 2011
20
Baja Mining Corp (BAJ-TSX) Not RatedLast Price: Ian Parkinson - (416-956-6169) - [email protected]
Price Target: N/A Matthew Gibson - (416-956-6729) - [email protected]
Company Profile Key Data52wk High (10/6/2010) 1.40 52wk Low (6/8/2010) 0.54
Avg Daily Volume (000s) 1,400
TSX Index weight (%) nm
Shares Outstanding (MM) 334.2
Float (MM) 278.7
Market Cap ($MM) 347.5
Key Projects Enterprise Value ($MM) 378.9
FQ3 2010
Cash ($mm) 22.6 P/E (Trailing 12m) (x) #N/A N/A
Working capital ($MM) (15.02) P/CF (x) #N/A N/A
Total debt ($MM) 0.4 P/B (x) 1.21
Common equity ($mm) 142.2 EV / EBITDA (Trailing 12m) (x) #N/A N/A
Net debt/common equity (x) nm Cash Gen / Cash Req (x) (0.3)
EPS (Trailing 12m) (0.1) Price / Free Cash Flow (x) #N/A N/A
Cash Flow / Basic Share ($) (0.1) Cash Flow / Net Income (x) #N/A N/A
Book Value / Share ($) 0.9 EV/OPFCF (x) nm
Sales / Share (Trailing 12m) ($) - ROE (%) (6.0)
Free Cash Flow / Share ($) (0.3) ROCE (%) #N/A N/A
Income Statement (CAD) FQ3 2010 FQ2 2010 FQ1 2010 FQ4 2009 FQ3 2009
Revenue ($MM) - - - - -
Operating Income ($MM) (2.56) (2.02) (1.85) (1.96) (1.80)
Pretax Income ($MM) (1.00) (2.27) (0.80) (2.28) (2.53)
Income bef XO items ($MM) (1.06) (2.25) (0.73) (1.89) (2.53)
Net Income ($MM) (1.06) (2.25) (0.73) (1.89) (2.53)
Basic EPS ($) (0.01) (0.02) (0.01) (0.01) (0.02)
Diluted EPS ($) (0.01) (0.02) (0.01) (0.01) (0.02)
EBITDA ($MM) (2.29) (1.86) (1.71) (1.35) (1.57)
Return on Common Equity (%) (4.34) (5.70) (5.36) (6.01) (4.60)
Balance Sheet FQ3 2010 FQ2 2010 FQ1 2010 FQ4 2009 FQ3 2009Total Current Assets ($MM) 18.89 13.57 16.52 23.60 30.24
Total Long-Term Assets ($MM) 210.34 170.10 163.18 157.33 149.62 Total Assets ($MM) 229.22 183.67 179.70 180.93 179.86
Total Current Liabilities ($MM) 33.90 5.41 3.60 5.05 2.84
Total Long-Term Liabilities ($MM) 53.12 9.15 9.78 10.26 46.34
Total Liabilities ($MM) 87.02 14.56 13.38 15.31 49.17
Total Shareholders' Equity ($MM) 142.20 169.12 166.32 165.63 130.69
Shares Outstanding (MM) 165.86 143.98 143.90 143.39 143.39
Book Value per Share ($) 0.86 0.88 0.90 0.90 0.91
Tangible Book Value / Sh ($) 0.86 0.88 0.90 0.90 0.91
Shrhldr Eqy / Tot Liab & Eqy (%) 62.04 92.08 92.56 91.54 72.66
Cash Flow FQ3 2010 FQ2 2010 FQ1 2010 FQ4 2009 FQ3 2009Net Income ($MM) (1.06) (2.25) (0.73) (1.89) (2.53)
Cash - Operating Activities ($MM) (3.31) (1.67) (2.89) (9.94) (4.78)
Cash - Investing Activities ($MM) (10.18) 2.36 2.57 (13.34) (5.63)
Cash - Financing Activities ($MM) 16.79 3.04 2.22 1.23 1.05
Net Changes in Cash ($MM) 3.30 3.73 1.91 (22.05) (9.35)
Free Cash Flow ($MM) (12.73) (6.64) (8.86) #N/A N/A (12.16)
Free Cash Flow / Diluted Sh ($) (0.08) (0.05) (0.06) #N/A N/A (0.08)
Cash flow per Share ($) (0.02) (0.01) (0.02) (0.07) (0.03)
Share Price Performance
Project Location
Project Specifics
Ownership
% Location Deposit Type
Boleo 70% Baja California, Mexico DFS Cu-Co-Zn-Mn Seam UG 23 NA
Resources Class Tons
(MM)
Boleo M+I 264.7 0.76% 0.64% 0.06% 3.23% 4,435 3,735 350 18,849
Inferred 159.9 0.47% 0.70% 0.04% 2.93% 1,657 2,468 141 10,329
Operating Metrics Attributable Capex Operating Costs Management Team
CHARLES THOMAS OGRYZLO, CHAIRMAN
Boleo Initial Sustaining US$/lb Cu* US$/t milled L ROWLAND WALLENIUS, CHIEF FINANCIAL OFFICER
622.3 108.0 0.17 33.79 58.8 45.6 2.5 - MICHAEL F SHAW, VP:CONSTRUCTION & ENG/COO
KENDRA LOW, VP:ADMINISTRATION/SECRETARY
RD - Resource Definition, PEA - Preliminary Economic Assessment (Scoping Study), PFS - Prefeasibility Study, DFS - Definitive Feasibility Study Website www.bajamining.com
*By-product credits based on CIBC long term metal price forecasts
Recovery Method
Mn
(000 oz)
Attributable Production (avg p.a.)
Contained Metal
Co
(MM lbs)
Mn
(MM lbs)
Co
(MM lbs)
Mine
Life (yrs)
8,500
Throughput (tpd)
Mn
(%)
Zn
(%)
Cu
(%)
Engineering
Completed
Floatation/SXEW
Zn
(MM lbs)
Zn
(MM lbs)
C$1.04
Cu
(MM lbs)
Mining
Method
Strip Ratio
(w/o)
Cu
(MM lbs)
Grades
Co
(%)
0.00
0.20
0.40
0.60
0.80
1.00
1.20
1.40
1.60
F-10 A-10 J-10 A-10 O-10 D-10 F-11
.0 M
10.0 M
20.0 M
30.0 M
40.0 M
50.0 M
60.0 M
Boleo
The Boleo Cu-Co-Zn-Mn Project is located on the east coast of Baja California Sur, Mexico, near the town of Santa Rosalia. The deposit contains seven mineralized seams
(mantos), stacked within a single formation, all dipping gently to the east towards the Sea of Cortez in a step-like fashion, due to post depositional faulting.
The Project consists of approximately 11,000 hectares of mineral concessions and 7,000 hectares of surface occupancy rights, each assembled as a contiguous titled block. The
Project is located within the “buffer zone” of the El Vizcaino Biosphere, a Mexican National environmental reserve. An Environmental Impact Manifest (EIM) was submitted in early
2006, and approved by the Mexican authorities in December 2006. The Company has also received authorization to commence development of the Project within the Biosphere.
The Project is to be developed as a series of underground mines using conventional soft rock mining methods, coupled with several small open-cut mines feeding ore to a
processing plant using a two stage leaching circuit followed by solid/liquid separation and solvent extraction – electrowinning steps to produce copper and cobalt metal and
crystallization to produce zinc sulphate monohydrate.
Both surface and underground mining operations have been designed by AAI to extract ore for the first 23 years at a full mining rate exceeding 3.1 million dry metric tonnes per
annum. Approximately 67 million tonnes of ore will be mined from underground operations and three million tonnes from surface open cuts.
The process plant has been designed to treat 3.1 million dry metric tonnes per annum at maximum head grades of 2.2% copper, 0.1% cobalt and 0.67% zinc through an integrated
hydrometallurgical facility to produce LME Grade ‘A’ copper cathode; high purity (>99.8% Co) cobalt cathode; and zinc sulphate monohydrate.
Since completion of the Definitive Feasibility Study (DFS) in 2007, the Company, in conjunction with Wardrop, has prepared a revised geological model that incorporates drill results
not included in the DFS, has added recoveries to the CuEq formula and has placed all geological data into a UTM grid format that is more compatible for long term mine planning. A
National Instrument 43-101 geological report is currently being finalized for filing on SEDAR. Total reported Measured, Indicated and Inferred resources, estimated using 3D block
models, are based on Copper equivalent (CuEq)1,3 cut-off grade of 0.5%.
Manganese Opportunity
The Boleo deposit is endowed with a rich resource of manganese that can be recovered in the form of manganese carbonate. The majority of demand for manganese follows trends
in global steel production and is marketed in a number of different product forms. The market for manganese carbonate is limited but the Company has shown that this material can
be further processed into electrolytic manganese metal (EMM) and manganese sulphate monohydrate. Prices and demand for a number of manganese products have recovered
following the downturn in the global economy in 2008. Although manganese is not included in the current economic evaluation, the Company continues to assess the future potential
of manganese carbonate sales as an intermediate product and further processing potential and anticipates it will commence a feasibility study on manganese production in 2010.
Baja is a mine development company that is poised to recommence construction of the Boleo project, a large copper deposit that also contains significant quantities of cobalt, zinc
and manganese. The mine plan envisages a long-life, low-cost operation — the first 30 years of production have been scheduled — in a mining friendly jurisdiction. The first high-
purity copper cathode from Boleo should be available two years after construction financing has been finalized. Baja’s management team consists of a group of key individuals with
proven mine building and operation experience. The Company is currently working diligently to complete the debt facilities for the project, with substantial interest being shown by
several key financial institutions and development agencies. Baja expects to announce details of its progress in this area shortly.
Project Update
January 18, 2011 - Finalizes Fixed Interest Rate on US EXIM loans at 3.02% and Provides Boleo Project Update - The JV met all of the condition precedents necessary for the
Export-Import Bank of the United States (“US EXIM”) loan facility to become operative on January 14, 2011. The interest rate on the US$ 419.6 million US EXIM loan facility has
consequently been fixed at 3.02% for the full 14 year term of the loan. “As of mid January the project has made significant progress in mobilizing site construction and committing to the
purchase of mining and process plant equipment,” said Mike Shaw, COO. “The EPCM contractor mobilized to site in November and the site earthworks contractor began working in
December. In addition, construction contracts for completion of camp construction, haul roads and infrastructure have been issued. A cement batch plant is being mobilized to be closely
followed by first concrete installation construction.”
November 23, 2010 - Baja Fully Funded for Boleo Construction – Baja announce that its Boleo Project is now fully funded for construction following Baja’s recently completed
US$858 Million project financing and C$184 Million bought deal financing.
Source: Company reports.
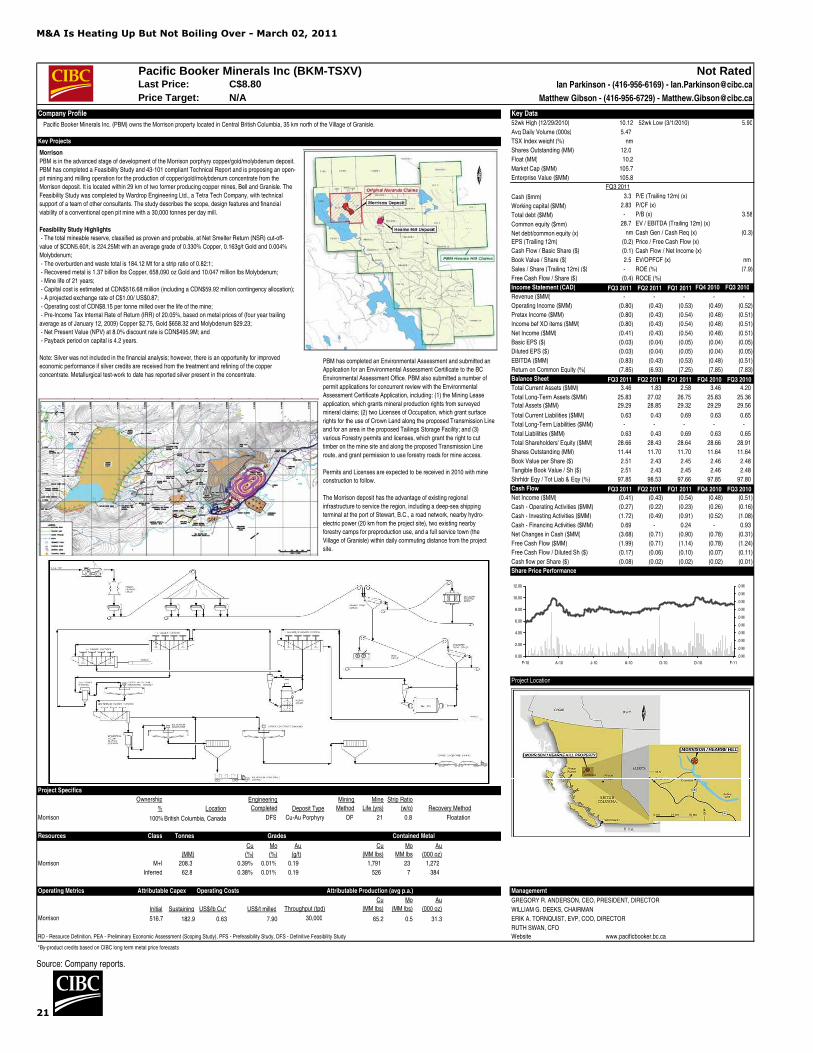
M&A Is Heating Up But Not Boiling Over - March 02, 2011
21
Pacific Booker Minerals Inc (BKM-TSXV) Not RatedLast Price: Ian Parkinson - (416-956-6169) - [email protected]
Price Target: N/A Matthew Gibson - (416-956-6729) - [email protected]
Company Profile Key Data52wk High (12/29/2010) 10.12 52wk Low (3/1/2010) 5.90
Avg Daily Volume (000s) 5.47
Key Projects TSX Index weight (%) nm
Shares Outstanding (MM) 12.0
Float (MM) 10.2
Market Cap ($MM) 105.7
Enterprise Value ($MM) 105.8
FQ3 2011
Cash ($mm) 3.3 P/E (Trailing 12m) (x) #N/A N/A
Working capital ($MM) 2.83 P/CF (x) #N/A N/A
Total debt ($MM) - P/B (x) 3.58
Common equity ($mm) 28.7 EV / EBITDA (Trailing 12m) (x) #N/A N/A
Net debt/common equity (x) nm Cash Gen / Cash Req (x) (0.3)
EPS (Trailing 12m) (0.2) Price / Free Cash Flow (x) #N/A N/A
Cash Flow / Basic Share ($) (0.1) Cash Flow / Net Income (x) #N/A N/A
Book Value / Share ($) 2.5 EV/OPFCF (x) nm
Sales / Share (Trailing 12m) ($) - ROE (%) (7.9)
Free Cash Flow / Share ($) (0.4) ROCE (%) #N/A N/A
Income Statement (CAD) FQ3 2011 FQ2 2011 FQ1 2011 FQ4 2010 FQ3 2010
Revenue ($MM) - - - - -
Operating Income ($MM) (0.80) (0.43) (0.53) (0.49) (0.52)
Pretax Income ($MM) (0.80) (0.43) (0.54) (0.48) (0.51)
Income bef XO items ($MM) (0.80) (0.43) (0.54) (0.48) (0.51)
Net Income ($MM) (0.41) (0.43) (0.54) (0.48) (0.51)
Basic EPS ($) (0.03) (0.04) (0.05) (0.04) (0.05)
Diluted EPS ($) (0.03) (0.04) (0.05) (0.04) (0.05)
EBITDA ($MM) (0.83) (0.43) (0.53) (0.48) (0.51)
Return on Common Equity (%) (7.85) (6.93) (7.25) (7.85) (7.83)
Balance Sheet FQ3 2011 FQ2 2011 FQ1 2011 FQ4 2010 FQ3 2010
Total Current Assets ($MM) 3.46 1.83 2.58 3.46 4.20
Total Long-Term Assets ($MM) 25.83 27.02 26.75 25.83 25.36
Total Assets ($MM) 29.29 28.85 29.32 29.29 29.56
Total Current Liabilities ($MM) 0.63 0.43 0.69 0.63 0.65
Total Long-Term Liabilities ($MM) - - - - -
Total Liabilities ($MM) 0.63 0.43 0.69 0.63 0.65
Total Shareholders' Equity ($MM) 28.66 28.43 28.64 28.66 28.91
Shares Outstanding (MM) 11.44 11.70 11.70 11.64 11.64
Book Value per Share ($) 2.51 2.43 2.45 2.46 2.48
Tangible Book Value / Sh ($) 2.51 2.43 2.45 2.46 2.48
Shrhldr Eqy / Tot Liab & Eqy (%) 97.85 98.53 97.66 97.85 97.80
Cash Flow FQ3 2011 FQ2 2011 FQ1 2011 FQ4 2010 FQ3 2010
Net Income ($MM) (0.41) (0.43) (0.54) (0.48) (0.51)
Cash - Operating Activities ($MM) (0.27) (0.22) (0.23) (0.26) (0.16)
Cash - Investing Activities ($MM) (1.72) (0.49) (0.91) (0.52) (1.08)
Cash - Financing Activities ($MM) 0.69 - 0.24 - 0.93
Net Changes in Cash ($MM) (3.68) (0.71) (0.90) (0.78) (0.31)
Free Cash Flow ($MM) (1.99) (0.71) (1.14) (0.78) (1.24)
Free Cash Flow / Diluted Sh ($) (0.17) (0.06) (0.10) (0.07) (0.11)
Cash flow per Share ($) (0.08) (0.02) (0.02) (0.02) (0.01)
Share Price Performance
Project Location
Project Specifics
Ownership
% Location Deposit Type
Morrison 100% British Columbia, Canada DFS Cu-Au Porphyry OP 21 0.8 Floatation
Resources Class Tonnes
(MM)
Morrison M+I 208.3 0.39% 0.01% 0.19 1,791 23 1,272
Inferred 62.8 0.38% 0.01% 0.19 526 7 384
Operating Metrics Attributable Capex Operating Costs Attributable Production (avg p.a.) Managemernt
GREGORY R. ANDERSON, CEO, PRESIDENT, DIRECTOR
Initial Sustaining US$/lb Cu* US$/t milled WILLIAM G. DEEKS, CHAIRMAN
Morrison 182.9 0.63 7.90 65.2 0.5 31.3 ERIK A. TORNQUIST, EVP, COO, DIRECTOR
RUTH SWAN, CFO
RD - Resource Definition, PEA - Preliminary Economic Assessment (Scoping Study), PFS - Prefeasibility Study, DFS - Definitive Feasibility Study Website www.pacificbooker.bc.ca
*By-product credits based on CIBC long term metal price forecasts
Cu
(MM lbs)
Mo
(MM lbs)
Au
(000 oz)
516.7
C$8.80
Engineering
Completed
Mining
Method Recovery Method
Strip Ratio
(w/o)
Mine
Life (yrs)
Contained Metal
Mo
MM lbs
Au
(000 oz)
Cu
(MM lbs)
Grades
Au
(g/t)
Mo
(%)
Cu
(%)
Throughput (tpd)
30,000
Morrison
PBM is in the advanced stage of development of the Morrison porphyry copper/gold/molybdenum deposit.
PBM has completed a Feasibility Study and 43-101 compliant Technical Report and is proposing an open-
pit mining and milling operation for the production of copper/gold/molybdenum concentrate from the
Morrison deposit. It is located within 29 km of two former producing copper mines, Bell and Granisle. The
Feasibility Study was completed by Wardrop Engineering Ltd., a Tetra Tech Company, with technical
support of a team of other consultants. The study describes the scope, design features and financial
viability of a conventional open pit mine with a 30,000 tonnes per day mill.
Feasibility Study Highlights
- The total mineable reserve, classified as proven and probable, at Net Smelter Return (NSR) cut-off-
value of $CDN5.60/t, is 224.25Mt with an average grade of 0.330% Copper, 0.163g/t Gold and 0.004%
Molybdenum;
- The overburden and waste total is 184.12 Mt for a strip ratio of 0.82:1;
- Recovered metal is 1.37 billion lbs Copper, 658,090 oz Gold and 10.047 million lbs Molybdenum;
- Mine life of 21 years;
- Capital cost is estimated at CDN$516.68 million (including a CDN$59.92 million contingency allocation);
- A projected exchange rate of C$1.00/ US$0.87;
- Operating cost of CDN$8.15 per tonne milled over the life of the mine;
- Pre-Income Tax Internal Rate of Return (IRR) of 20.05%, based on metal prices of (four year trailing
average as of January 12, 2009) Copper $2.75, Gold $658.32 and Molybdenum $29.23;
- Net Present Value (NPV) at 8.0% discount rate is CDN$495.9M; and
- Payback period on capital is 4.2 years.
Note: Silver was not included in the financial analysis; however, there is an opportunity for improved
economic performance if silver credits are received from the treatment and refining of the copper
concentrate. Metallurgical test-work to date has reported silver present in the concentrate.
Pacific Booker Minerals Inc. (PBM) owns the Morrison property located in Central British Columbia, 35 km north of the Village of Granisle.
0.00
2.00
4.00
6.00
8.00
10.00
12.00
F-10 A-10 J-10 A-10 O-10 D-10 F-11
.0 M
.0 M
.0 M
.0 M
.0 M
.0 M
.0 M
.0 M
.0 M
.0 M
PBM has completed an Environmental Assessment and submitted an
Application for an Environmental Assessment Certificate to the BC
Environmental Assessment Office. PBM also submitted a number of
permit applications for concurrent review with the Environmental
Assessment Certificate Application, including: (1) the Mining Lease
application, which grants mineral production rights from surveyed
mineral claims; (2) two Licenses of Occupation, which grant surface
rights for the use of Crown Land along the proposed Transmission Line
and for an area in the proposed Tailings Storage Facility; and (3)
various Forestry permits and licenses, which grant the right to cut
timber on the mine site and along the proposed Transmission Line
route, and grant permission to use forestry roads for mine access.
Permits and Licenses are expected to be received in 2010 with mine
construction to follow.
The Morrison deposit has the advantage of existing regional
infrastructure to service the region, including a deep-sea shipping
terminal at the port of Stewart, B.C., a road network, nearby hydro-
electric power (20 km from the project site), two existing nearby
forestry camps for preproduction use, and a full service town (the
Village of Granisle) within daily commuting distance from the project
site.
Source: Company reports.

M&A Is Heating Up But Not Boiling Over - March 02, 2011
22
Coro Mining Corp (COP-TSX) Not RatedLast Price: Ian Parkinson - (416-956-6169) - [email protected]
Price Target: N/A Matthew Gibson - (416-956-6729) - [email protected]
Company Profile Key Data
52wk High (2/7/2011) 1.62 52wk Low (7/15/2010) 0.27
Avg Daily Volume (000s) 159.33
TSX Index weight (%) nm
Shares Outstanding (MM) 105.8
Key Projects Float (MM) 48.3
Market Cap ($MM) 148.2
Enterprise Value ($MM) 143.4
FQ3 2010
Cash ($mm) 2.1 P/E (Trailing 12m) (x) #N/A N/A
Working capital ($MM) 1.48 P/CF (x) #N/A N/A
Total debt ($MM) - P/B (x) 6.20
Common equity ($mm) 37.8 EV / EBITDA (Trailing 12m) (x) #N/A N/A
Net debt/common equity (x) nm Cash Gen / Cash Req (x) (0.6)
EPS (Trailing 12m) (0.0) Price / Free Cash Flow (x) #N/A N/A
Cash Flow / Basic Share ($) (0.0) Cash Flow / Net Income (x) #N/A N/A
Book Value / Share ($) 0.2 EV/OPFCF (x) nm
Sales / Share (Trailing 12m) ($) - ROE (%) (1.5)
Free Cash Flow / Share ($) (0.0) ROCE (%) #N/A N/A
Income Statement (USD) FQ3 2010 FQ2 2010 FQ1 2010 FQ4 2009 FQ3 2009
Revenue ($MM) - - - - -
Operating Income ($MM) (0.23) (0.58) (0.46) (0.70) (0.28)
Pretax Income ($MM) (0.38) (0.82) (0.54) 0.45 (0.21)
Income bef XO items ($MM) (0.38) (0.82) (0.54) 0.45 (0.21)
Net Income ($MM) (0.54) (1.23) (0.54) 0.45 (0.21)
Basic EPS ($) - (0.01) (0.01) - -
Diluted EPS ($) - (0.01) (0.01) - -
EBITDA ($MM) (0.45) (0.58) (0.45) (0.70) (0.26)
Return on Common Equity (%) (10.23) (7.08) (2.57) (1.54) (6.97)
Balance Sheet FQ3 2010 FQ2 2010 FQ1 2010 FQ4 2009 FQ3 2009Total Current Assets ($MM) 1.86 3.27 1.86 2.19 1.12
Total Long-Term Assets ($MM) 20.96 23.73 20.96 20.98 19.50 Total Assets ($MM) 22.82 27.00 22.82 23.17 20.63
Total Current Liabilities ($MM) 0.38 0.41 0.38 0.39 0.23
Total Long-Term Liabilities ($MM) 1.37 2.43 1.37 1.40 1.37
Total Liabilities ($MM) 1.75 2.83 1.75 1.79 1.60
Total Shareholders' Equity ($MM) 37.85 24.17 21.07 21.39 19.03
Shares Outstanding (MM) 91.18 104.20 91.41 90.57 79.74
Book Value per Share ($) 0.42 0.23 0.23 0.24 0.24
Tangible Book Value / Sh ($) 0.42 0.23 0.23 0.24 0.24
Shrhldr Eqy / Tot Liab & Eqy (%) 95.59 89.52 92.34 92.29 92.24
Cash Flow FQ3 2010 FQ2 2010 FQ1 2010 FQ4 2009 FQ3 2009
Net Income ($MM) (0.54) (1.23) (0.54) 0.45 (0.21)
Cash - Operating Activities ($MM) (0.30) (0.43) (0.30) (0.54) (0.18)
Cash - Investing Activities ($MM) (0.15) (2.35) (0.15) (0.25) (0.39)
Cash - Financing Activities ($MM) 0.14 4.21 0.14 1.83 0.05
Net Changes in Cash ($MM) (0.31) 1.44 (0.31) 1.04 (0.53)
Free Cash Flow ($MM) (0.45) (0.43) (0.45) (1.73) (0.57)
Free Cash Flow / Diluted Sh ($) (0.00) (0.00) (0.00) (0.02) (0.01)
Cash flow per Share ($) (0.00) (0.00) (0.00) (0.01) (0.00)
Share Price Performance
Cerro Chacay Drill Results
Hole From To Meters %CuT g/t Au
CHCRC 14 42 28 0.51
CHCRC 190198 end of hole 8 0.56
CHCRC 82 160 78 0.44 Project Location
- 102 126 24 0.73
CGCRC 112 234 122.0 0.77 0.05
- 114 172 58.0 0.99 0.05
CGCRC 68 82 14.0 0.53 0.05
CGCRC 120 160 40.0 0.65 0.03
Project Specifics
Ownership
% Location Deposit Type
San Jorge (Oxide) 100% Mendoza Province, Argentina PEA Cu Au Porphyry OP 10 0.8 SXEW
San Jorge (Sulphide) 100% Mendoza Province, Argentina PEA Cu Au Porphyry OP 16 2.9 Floatation
Resources Class Tonnes
(MM)
San Jorge (Oxide) M+I 32.3 0.53% 0.22 377 228
Inferred 1.1 0.39% 0.12 9 4
San Jorge (Sulphide) M+I 162.2 0.47% 0.19 1,663 1,007
Inferred 466.5 0.50% 0.08 5,112 1,211
Operating Metrics Attributable Capex Management Team
ROBERT A. WATTS, CHAIRMAN
Initial Sustaining US$/lb Cu* US$/t milled ALAN STEPHENS, PRESIDENT/CEO
San Jorge (Oxide) 162.5 19.0 0.51 3.96 49.2 - MICHAEL PHILPOT, VP CORP SECRETARY
San Jorge (Sulphide) 277.5 90.9 0.55 9.77 87.0 39.3 DAMIEN TOWNS, CHIEF FINANCIAL OFFICER
ANGELO PERI, VP EXPLORATION
FABIAN GREGORIA, PRESIDENT MINERA SAN JORGERD - Resource Definition, PEA - Preliminary Economic Assessment (Scoping Study), PFS - Prefeasibility Study, DFS - Definitive Feasibility Study Website www.coromining.com
*By-product credits based on CIBC long term metal price forecasts
27,000
Grades
Au
(g/t)
Cu
(%)
Operating Costs
17,500
C$1.40
Cu
(MM lbs)
Engineering
Completed
Throughput (tpd)
Contained Metal
Au
(000 oz)
Cu
(MM lbs)
Mining
Method
Au
(000 oz)
Attributable Production (avg p.a.)
Strip Ratio
(w/o) Recovery Method
Mine
Life (yrs)
San Jorge (Earn-in 100%)
Located in west-central Argentina in the Province of Mendoza, the large (115,000 ha) San Jorge property lies approximately 45 km north of the town of Uspallata and 250 km northeast of
Santiago, Chile. San Jorge hosts a medium sized copper gold porphyry deposit. The Company has completed a Pre-Feasibility Study (PFS) on the leachable copper resources and a
Preliminary Economic Assessment (PEA) on the floatable copper resources. The PEA concluded that the float project, which would have a production of 40,000tpy Cu and 39,000 opy Au,
has an NPV 10 of $220 million at a Cu price of $2/lb and $600/oz Au. In Q308, the Company filed the Environmental Impact Study ("EIS") for its San Jorge copper-gold project, which was
formally accepted to enter the evaluation process by the Secretary of the Environment of the Government of Mendoza.
Underlying Option Agreement: Coro has an Option to purchase 100% of San Jorge from Lumina Copper by making further staged payments of $15.15 mm on or before May 2013. Upon
commercial production, Coro pays Lumina USD$0.02 per paid copper minable proven and probable copper reserves as defined in a bankable feasibility study, less the total cash
payments. Lumina will also receive a 1.5% NSR in all products produced other than copper.
Geology and Mineralization: San Jorge is a Permian age granodiorite porphyry stock with associated contact and hydrothermal breccias intruded into Paleozoic sandstones and shales.
Strong silicification and quartz stockworking has developed in the sediments and porphyry. The porphyry shows a vertical zonation from hypogene mineralization at depth, passing
upwards into a supergene enriched zone, which is overlain by a zone of oxide mineralization and finally into a thin, poorly developed leach cap.
Mendoza Province Chemical Ban: In June 2007, legislation was passed banning the use of toxic chemicals including sulphuric acid in mining activities, which has meant the Leach Only
project is not possible at this time and the Float Only project has considered the oxide material as waste to be stockpiled separately.
EIS Approval Process: The San Jorge EIS' approval process has a number of steps, the first of which was a technical evaluation of the EIS by a local university on behalf of the
government which was obtained in Q3-09. This was followed by a ministerial project review, and public consultation. The Company has been requested to conduct additional studies to
reconfirm the impact of the project on the hydrological resources of the area and once completed and accepted, a formal public meeting will be held. Upon completion of these steps, the
EIS will be submitted for approval by the Secretary of the Environment, such approval to be ratified by Parliament.
Cerro Chacay, Chile (100%)
The Cerro Chacay Property is located 12km southeast of the Teck Resources Relincho copper project, and 50km east of the city of Vallenar in the III Region of Chile.
Geology and Mineralization:
The Chacay property hosts a porphyry copper prospect of probable Eocene age that has previously been drill tested by several companies. A zoned porphyry alteration suite of external
propylitic alteration surrounding a phyllically altered core is developed over a distance of 3500m, oriented west northwest. Three zones of copper mineralization have been outlined by the
drilling to date.
The largest of these, known as the Nacho Zone, occupies an area of approximately 900 x 850m centered on Cerro Colorado. This hill has an elevation difference of 300m over the
surrounding valleys and hosts a leached cap, which drilling has shown to vary from 50 to 200m in thickness. Underlying the leached cap, a partially oxidized, flat lying, chalcocite
enrichment blanket has been intersected in drilling, that is currently interpreted to be between 20m thick on its margins and greater than 100m thick towards its centre. Re-logging of all
available RC drill chips has shown that the chalcocite blanket is thickest and has the highest copper grades when developed within a diorite porphyry intrusive exhibiting sericite-chlorite-
quartz alteration, and which contained original primary copper sulphides. Based on drilling to date, this chalcocite blanket is expected to grade between 0.30 and 0.70% Cu.
Coro owns 100% of the Chacay property, subject to a 2% Net Profits Interest with a US$2 million cap, payable to First Quantum Minerals.
Llancahue (100%)
The Llancahue Project is a porphyry copper prospect located 38km south west of the city of Talca, some 300km south of Santiago, Chile.
Until recently, the Company had a Joint Venture partner that drilled 7 reverse circulation holes, one of which intersected 100 meters grading 1.375% Cu, 0.015% Mo and 3.8g/tAg. The
Company then followed up with 6 additional holes two of which intersected mineralization, including one intersection of 36m grading 2.43%Cu, 0.102%Mo and 5.8g/t Ag. Follow up drilling
is planned for 2010.
Built by proven mine-finders and developers, Coro is on track to become a mid-tier copper producer. The company is focused on developing the San Jorge copper-gold project located
in the province of Mendoza, Argentina. San Jorge is currently in the permitting phase, which is anticipated to be completed by late 2010. Coro is also exploring two copper porphyries
projects in Chile, the newly discovered Llancahue project, and Cerro Chacay.
0.00
0.20
0.40
0.60
0.80
1.00
1.20
1.40
1.60
1.80
F-10 A-10 J-10 A-10 O-10 D-10 F-11
.0 M
.2 M
.4 M
.6 M
.8 M
1.0 M
1.2 M
1.4 M
1.6 M
1.8 M
Project Update
February 8, 2011 - 170 Meters at 0.63% Copper From Drilling
Program at Chacay Property - 8 RC holes for a total 2424m were
completed. Other highlights from the program include: 158m at
0.39% Cu and 54m at 0.75% Cu. COP now plans to conduct a
diamond drilling program to gain a better understanding of the
geology of the Nacho Zone and provide further definition of the
mineralization.
February 7, 2011 - Approval of San Jorge Project
Environmental Impact Study - The EIS has been approved by the
Mendoza Provincial Government. COP will be required to adhere to
the highest standards of environmental protection, control and
monitoring including the requirement for the paste tailings deposit to
be made impermeable with a liner, COP will be required to contribute
0.5% of metal sales on an annual basis to an environmental
remediation fund, to be recovered upon satisfactory closure of the
mine and COP will be required to negotiate the terms of an
agreement with the Provincial Government and the Department of
Las Heras, where the project is located, whereby MSJ will contribute
to a social development fund to benefit the local community
Source: Company reports.
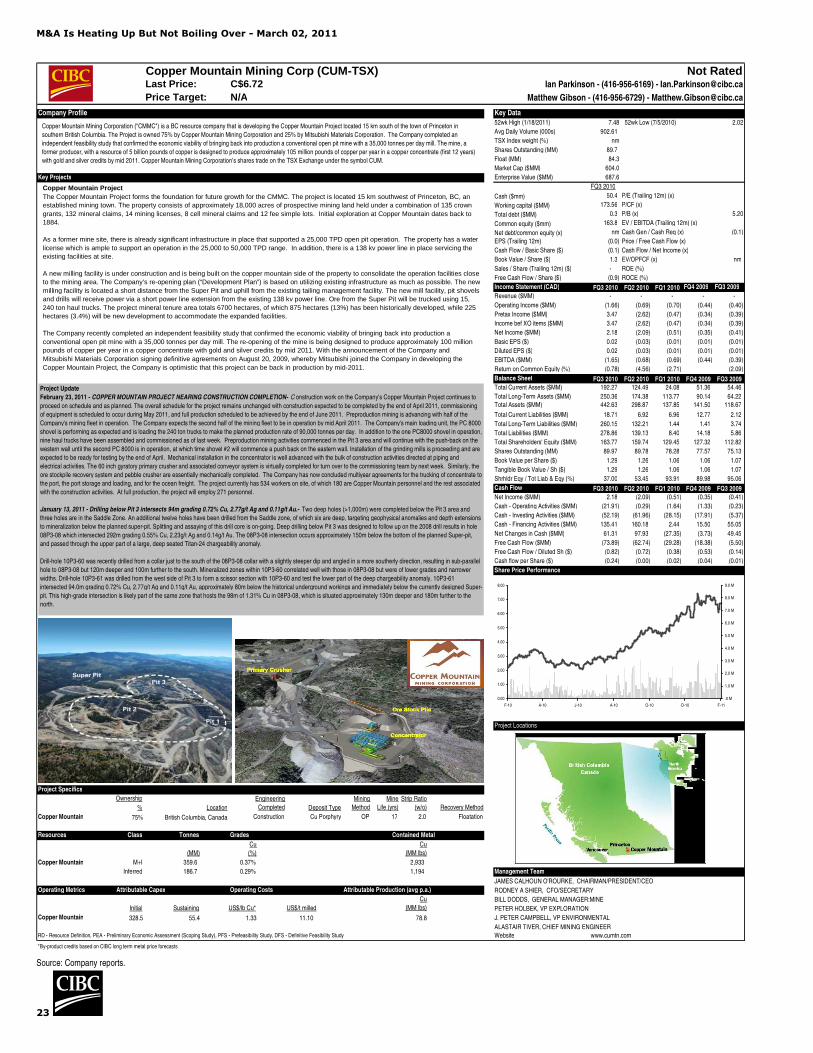
M&A Is Heating Up But Not Boiling Over - March 02, 2011
23
Copper Mountain Mining Corp (CUM-TSX) Not RatedLast Price: Ian Parkinson - (416-956-6169) - [email protected]
Price Target: N/A Matthew Gibson - (416-956-6729) - [email protected]
Company Profile Key Data
52wk High (1/18/2011) 7.48 52wk Low (7/5/2010) 2.02
Avg Daily Volume (000s) 902.61
TSX Index weight (%) nm
Shares Outstanding (MM) 89.7
Float (MM) 84.3
Market Cap ($MM) 604.0
Key Projects Enterprise Value ($MM) 687.6
FQ3 2010
Cash ($mm) 50.4 P/E (Trailing 12m) (x) #N/A N/A
Working capital ($MM) 173.56 P/CF (x) #N/A N/A
Total debt ($MM) 0.3 P/B (x) 5.20
Common equity ($mm) 163.8 EV / EBITDA (Trailing 12m) (x) #N/A N/A
Net debt/common equity (x) nm Cash Gen / Cash Req (x) (0.1)
EPS (Trailing 12m) (0.0) Price / Free Cash Flow (x) #N/A N/A
Cash Flow / Basic Share ($) (0.1) Cash Flow / Net Income (x) #N/A N/A
Book Value / Share ($) 1.3 EV/OPFCF (x) nm
Sales / Share (Trailing 12m) ($) - ROE (%) #N/A N/A
Free Cash Flow / Share ($) (0.9) ROCE (%) #N/A N/A
Income Statement (CAD) FQ3 2010 FQ2 2010 FQ1 2010 FQ4 2009 FQ3 2009
Revenue ($MM) - - - - -
Operating Income ($MM) (1.66) (0.69) (0.70) (0.44) (0.40)
Pretax Income ($MM) 3.47 (2.62) (0.47) (0.34) (0.39)
Income bef XO items ($MM) 3.47 (2.62) (0.47) (0.34) (0.39)
Net Income ($MM) 2.18 (2.09) (0.51) (0.35) (0.41)
Basic EPS ($) 0.02 (0.03) (0.01) (0.01) (0.01)
Diluted EPS ($) 0.02 (0.03) (0.01) (0.01) (0.01)
EBITDA ($MM) (1.65) (0.68) (0.69) (0.44) (0.39)
Return on Common Equity (%) (0.78) (4.56) (2.71) #N/A N/A (2.09)
Balance Sheet FQ3 2010 FQ2 2010 FQ1 2010 FQ4 2009 FQ3 2009Total Current Assets ($MM) 192.27 124.49 24.08 51.36 54.46
Total Long-Term Assets ($MM) 250.36 174.38 113.77 90.14 64.22 Total Assets ($MM) 442.63 298.87 137.85 141.50 118.67
Total Current Liabilities ($MM) 18.71 6.92 6.96 12.77 2.12
Total Long-Term Liabilities ($MM) 260.15 132.21 1.44 1.41 3.74
Total Liabilities ($MM) 278.86 139.13 8.40 14.18 5.86
Total Shareholders' Equity ($MM) 163.77 159.74 129.45 127.32 112.82
Shares Outstanding (MM) 89.97 89.78 78.28 77.57 75.13
Book Value per Share ($) 1.29 1.26 1.06 1.06 1.07
Tangible Book Value / Sh ($) 1.29 1.26 1.06 1.06 1.07
Shrhldr Eqy / Tot Liab & Eqy (%) 37.00 53.45 93.91 89.98 95.06
Cash Flow FQ3 2010 FQ2 2010 FQ1 2010 FQ4 2009 FQ3 2009
Net Income ($MM) 2.18 (2.09) (0.51) (0.35) (0.41)
Cash - Operating Activities ($MM) (21.91) (0.29) (1.64) (1.33) (0.23)
Cash - Investing Activities ($MM) (52.19) (61.96) (28.15) (17.91) (5.37)
Cash - Financing Activities ($MM) 135.41 160.18 2.44 15.50 55.05
Net Changes in Cash ($MM) 61.31 97.93 (27.35) (3.73) 49.45
Free Cash Flow ($MM) (73.89) (62.74) (29.28) (18.38) (5.50)
Free Cash Flow / Diluted Sh ($) (0.82) (0.72) (0.38) (0.53) (0.14)
Cash flow per Share ($) (0.24) (0.00) (0.02) (0.04) (0.01)
Share Price Performance
Project Locations
Project Specifics
Ownership
% Location Deposit Type
Copper Mountain 75% British Columbia, Canada Construction Cu Porphyry OP 17 2.0 Floatation
Resources Class Tonnes Grades Contained Metal
Copper Mountain M+I 359.6 0.37% 2,933
Inferred 186.7 0.29% 1,194 Management Team
JAMES CALHOUN O'ROURKE, CHAIRMAN/PRESIDENT/CEO
Operating Metrics Attributable Capex Operating Costs Attributable Production (avg p.a.) RODNEY A SHIER, CFO/SECRETARY
BILL DODDS, GENERAL MANAGER:MINE
Initial Sustaining US$/lb Cu* US$/t milled PETER HOLBEK, VP EXPLORATION
Copper Mountain 328.5 55.4 1.33 11.10 78.8 J. PETER CAMPBELL, VP ENVIRONMENTAL
ALASTAIR TIVER, CHIEF MINING ENGINEERRD - Resource Definition, PEA - Preliminary Economic Assessment (Scoping Study), PFS - Prefeasibility Study, DFS - Definitive Feasibility Study Website www.cumtn.com
*By-product credits based on CIBC long term metal price forecasts
C$6.72
Engineering
Completed
Cu
(MM lbs)
Recovery Method
(MM)
Cu
(%)
Cu
(MM lbs)
Mining
Method
Mine
Life (yrs)
Strip Ratio
(w/o)
Copper Mountain Mining Corporation ("CMMC") is a BC resource company that is developing the Copper Mountain Project located 15 km south of the town of Princeton in
southern British Columbia. The Project is owned 75% by Copper Mountain Mining Corporation and 25% by Mitsubishi Materials Corporation. The Company completed an
independent feasibility study that confirmed the economic viability of bringing back into production a conventional open pit mine with a 35,000 tonnes per day mill. The mine, a
former producer, with a resource of 5 billion pounds of copper is designed to produce approximately 105 million pounds of copper per year in a copper concentrate (first 12 years)
with gold and silver credits by mid 2011. Copper Mountain Mining Corporation’s shares trade on the TSX Exchange under the symbol CUM.
0.00
1.00
2.00
3.00
4.00
5.00
6.00
7.00
8.00
F-10 A-10 J-10 A-10 O-10 D-10 F-11
.0 M
1.0 M
2.0 M
3.0 M
4.0 M
5.0 M
6.0 M
7.0 M
8.0 M
9.0 M
Copper Mountain ProjectThe Copper Mountain Project forms the foundation for future growth for the CMMC. The project is located 15 km southwest of Princeton, BC, an established mining town. The property consists of approximately 18,000 acres of prospective mining land held under a combination of 135 crown grants, 132 mineral claims, 14 mining licenses, 8 cell mineral claims and 12 fee simple lots. Initial exploration at Copper Mountain dates back to 1884.
As a former mine site, there is already significant infrastructure in place that supported a 25,000 TPD open pit operation. The property has a water license which is ample to support an operation in the 25,000 to 50,000 TPD range. In addition, there is a 138 kv power line in place servicing the existing facilities at site.
A new milling facility is under construction and is being built on the copper mountain side of the property to consolidate the operation facilities close to the mining area. The Company’s re-opening plan (“Development Plan”) is based on utilizing existing infrastructure as much as possible. The new milling facility is located a short distance from the Super Pit and uphill from the existing tailing management facility. The new mill facility, pit shovels and drills will receive power via a short power line extension from the existing 138 kv power line. Ore from the Super Pit will be trucked using 15, 240 ton haul trucks. The project mineral tenure area totals 6700 hectares, of which 875 hectares (13%) has been historically developed, while 225 hectares (3.4%) will be new development to accommodate the expanded facilities.
The Company recently completed an independent feasibility study that confirmed the economic viability of bringing back into production a conventional open pit mine with a 35,000 tonnes per day mill. The re-opening of the mine is being designed to produce approximately 100 million pounds of copper per year in a copper concentrate with gold and silver credits by mid 2011. With the announcement of the Company and Mitsubishi Materials Corporation signing definitive agreements on August 20, 2009, whereby Mitsubishi joined the Company in developing the Copper Mountain Project, the Company is optimistic that this project can be back in production by mid-2011.
Project Update
February 23, 2011 - COPPER MOUNTAIN PROJECT NEARING CONSTRUCTION COMPLETION- C onstruction work on the Company's Copper Mountain Project continues to
proceed on schedule and as planned. The overall schedule for the project remains unchanged with construction expected to be completed by the end of April 2011, commissioning
of equipment is scheduled to occur during May 2011, and full production scheduled to be achieved by the end of June 2011. Preproduction mining is advancing with half of the
Company's mining fleet in operation. The Company expects the second half of the mining fleet to be in operation by mid April 2011. The Company's main loading unit, the PC 8000
shovel is performing as expected and is loading the 240 ton trucks to make the planned production rate of 90,000 tonnes per day. In addition to the one PC8000 shovel in operation,
nine haul trucks have been assembled and commissioned as of last week. Preproduction mining activities commenced in the Pit 3 area and will continue with the push-back on the
western wall until the second PC 8000 is in operation, at which time shovel #2 will commence a push back on the eastern wall. Installation of the grinding mills is proceeding and are
expected to be ready for testing by the end of April. Mechanical installation in the concentrator is well advanced with the bulk of construction activities directed at piping and
electrical activities. The 60 inch gyratory primary crusher and associated conveyor system is virtually completed for turn over to the commissioning team by next week. Similarly, the
ore stockpile recovery system and pebble crusher are essentially mechanically completed. The Company has now concluded multiyear agreements for the trucking of concentrate to
the port, the port storage and loading, and for the ocean freight. The project currently has 534 workers on site, of which 180 are Copper Mountain personnel and the rest associated
with the construction activities. At full production, the project will employ 271 personnel.
January 13, 2011 - Drilling below Pit 3 intersects 94m grading 0.72% Cu, 2.77g/t Ag and 0.11g/t Au.- Two deep holes (>1,000m) were completed below the Pit 3 area and
three holes are in the Saddle Zone. An additional twelve holes have been drilled from the Saddle zone, of which six are deep, targeting geophysical anomalies and depth extensions
to mineralization below the planned super-pit. Splitting and assaying of this drill core is on-going. Deep drilling below Pit 3 was designed to follow up on the 2008 drill results in hole
08P3-08 which intersected 292m grading 0.55% Cu, 2.23g/t Ag and 0.14g/t Au. The 08P3-08 intersection occurs approximately 150m below the bottom of the planned Super-pit,
and passed through the upper part of a large, deep seated Titan-24 chargeability anomaly.
Drill-hole 10P3-60 was recently drilled from a collar just to the south of the 08P3-08 collar with a slightly steeper dip and angled in a more southerly direction, resulting in sub-parallel
hole to 08P3-08 but 120m deeper and 100m further to the south. Mineralized zones within 10P3-60 correlated well with those in 08P3-08 but were of lower grades and narrower
widths. Drill-hole 10P3-61 was drilled from the west side of Pit 3 to form a scissor section with 10P3-60 and test the lower part of the deep chargeability anomaly. 10P3-61
intersected 94.0m grading 0.72% Cu, 2.77g/t Ag and 0.11g/t Au, approximately 80m below the historical underground workings and immediately below the currently designed Super-
pit. This high-grade intersection is likely part of the same zone that hosts the 98m of 1.31% Cu in 08P3-08, which is situated approximately 130m deeper and 180m further to the
north.
Source: Company reports.

M&A Is Heating Up But Not Boiling Over - March 02, 2011
24
Copper Fox Metals Inc (CUU-TSXV) Not RatedLast Price: Ian Parkinson - (416-956-6169) - [email protected]
Price Target: N/A Matthew Gibson - (416-956-6729) - [email protected]
Company Profile Key Data
52wk High (2/25/2011) 1.70 52wk Low (3/1/2010) 0.15
Avg Daily Volume (000s) 1,487.7
TSX Index weight (%) nm
Shares Outstanding (MM) 367.2
Float (MM) 144.7
Key Projects Market Cap ($MM) 624.3
Enterprise Value ($MM) 521.0
FQ4 2010
Cash ($mm) 0.5 P/E (Trailing 12m) (x) #N/A N/A
Working capital ($MM) (0.84) P/CF (x) #N/A N/A
Total debt ($MM) - P/B (x) 29.74
Common equity ($mm) 20.7 EV / EBITDA (Trailing 12m) (x) #N/A N/A
Net debt/common equity (x) nm Cash Gen / Cash Req (x) (0.2)
EPS (Trailing 12m) (0.0) Price / Free Cash Flow (x) #N/A N/A
Cash Flow / Basic Share ($) (0.0) Cash Flow / Net Income (x) #N/A N/A
Book Value / Share ($) 0.1 EV/OPFCF (x) nm
Sales / Share (Trailing 12m) ($) - ROE (%) (9.7)
Free Cash Flow / Share ($) (0.0) ROCE (%) #N/A N/A
Income Statement (CAD) FQ4 2010 FQ3 2010 FQ2 2010 FQ1 2010 FQ4 2009
Revenue ($MM) - - - - -
Operating Income ($MM) (0.41) (0.44) (0.31) (0.46) (0.93)
Pretax Income ($MM) (0.42) (0.44) (0.31) (0.45) (0.92)
Income bef XO items ($MM) (0.42) (0.44) (0.31) (0.45) 1.53
Net Income ($MM) (0.42) (0.44) (0.31) (0.45) 1.53
Basic EPS ($) (0.01) - - - 0.01
Diluted EPS ($) (0.01) - - - 0.01
EBITDA ($MM) (0.38) (0.40) (0.28) (0.42) (0.89)
Return on Common Equity (%) (9.66) 2.20 2.84 1.76 (119.07)
Balance Sheet FQ4 2010 FQ3 2010 FQ2 2010 FQ1 2010 FQ4 2009Total Current Assets ($MM) 1.78 3.61 1.87 1.71 3.05
Total Long-Term Assets ($MM) 21.97 17.62 13.75 11.63 10.50 Total Assets ($MM) 23.75 21.23 15.61 13.34 13.56
Total Current Liabilities ($MM) 2.61 0.88 0.71 0.40 0.51
Total Long-Term Liabilities ($MM) 0.42 0.37 0.36 0.35 0.35
Total Liabilities ($MM) 3.04 1.25 1.07 0.76 0.85
Total Shareholders' Equity ($MM) 20.71 19.98 14.55 12.58 12.70
Shares Outstanding (MM) 362.34 352.42 274.62 245.12 242.36
Book Value per Share ($) 0.06 0.06 0.05 0.05 0.05
Tangible Book Value / Sh ($) 0.06 0.06 0.05 0.05 0.05
Shrhldr Eqy / Tot Liab & Eqy (%) 87.21 94.11 93.15 94.34 93.71
Cash Flow FQ4 2010 FQ3 2010 FQ2 2010 FQ1 2010 FQ4 2009Net Income ($MM) (0.42) (0.44) (0.31) (0.45) 1.53
Cash - Operating Activities ($MM) (1.47) 0.18 (0.04) (1.02) (1.09)
Cash - Investing Activities ($MM) (1.59) (4.14) (2.37) (1.21) (0.16)
Cash - Financing Activities ($MM) 1.15 5.86 2.27 0.21 1.97
Net Changes in Cash ($MM) (1.91) 1.90 (0.14) (2.03) 0.72
Free Cash Flow ($MM) (5.80) (3.72) (2.18) (2.17) (1.85)
Free Cash Flow / Diluted Sh ($) (0.02) (0.01) (0.01) (0.01) (0.01)
Cash flow per Share ($) (0.01) 0.00 (0.00) (0.00) (0.00)
Share Price Performance
Project Location
Project Specifics
Ownership
% Location Deposit Type
Schaft Creek 93%British Columbia, Canada PFS Cu Au Porphyry OP 23 1.9 Floatation
Resources Class Tonnes Grades Contained Metal
(MM)
Schaft Creek M+I 1,393.3 0.25% 0.02% 0.18 1.55 7,679 553 8,063 69,432
Inferred 186.8 0.14% 0.02% 0.09 1.61 577 74 541 9,671
Operating Metrics Attributable Capex Operating Costs Attributable Production (avg p.a.) Management Team
ELMER B. STEWART, CHAIR, PRESIDENT & CEO
Sustaining US$/lb Cu* US$/t milled J. MICHAEL SMITH, EVP
Schaft Creek 797.4 0.11 12.49 197.2 10.6 186.0 1,344.7 MURRAY J. HUNTER, CFO & VP
CAM GRUNDSTROM, VP OPERATIONSRD - Resource Definition, PEA - Preliminary Economic Assessment (Scoping Study), PFS - Prefeasibility Study, DFS - Definitive Feasibility Study Website www.copperfoxmetals.com
*By-product credits based on CIBC long term metal price forecasts
Ag
(000 oz)
2,895.4
Initial Throughput (tpd)
100,000
Cu
(MM lbs)
Mo
(MM lbs)
Au
(000 oz)
Ag
(000 oz)
Mine
Life (yrs)
Strip Ratio
(w/o) Recovery Method
Cu
(%)
Mo
(%)
Au
(g/t)
Ag
(g/t)
Cu
(MM lbs)
Mo
MM lbs
Au
(000 oz)
C$1.70
Engineering
Completed
Mining
Method
Schaft Creek
Location: The Schaft Creek Project is a porphyry copper-gold-molybdenum deposit situated 45
kilometers west of the Stewart-Cassiar Highway in northwestern British Columbia. The project area
covers 21,025 hectares within a world-class mineral district hosting several porphyry copper-gold
deposits.
History: The Schaft Creek Project was extensively explored and drilled by several mining
companies from the 1960s through early 1980s, culminating with a pre-feasibility study by Teck.
Copper Fox Metals secured rights to acquire up to a 93.4% interest in the project pursuant to an
Option Agreement with Teck and related underlying agreements. The Company has since earned a
70% direct interest in the project through required expenditures of $15 million and can acquire a
23.4% indirect interest on delivery of a positive feasibility study. At this stage, Teck Cominco may
exercise back-in rights to acquire interests in the project in order to participate in mine development
with Copper Fox Metals.
Bankable Feasibility Study: In January 2010 CUU retained Wardrop to complete a bankable
feasibility study on the Schaft Creek deposit. This study is expected to be completed by Jun 2011.
The Company's goals are to advance Schaft Creek to production in an environmentally and socially
progressive manner and become a significant minerals producer by 2013.
Schaft Creek Option: Copper Fox has an option agreement dated January 1, 2002 to acquire
100% of Teck's 'Direct Holding', defined as a 70% direct participating interest in the Schaft Creek
Property, by: Incurring $5,000,000 in expenditures on or before December 31, 2006 and aggregate
expenditures of $15,000.000 on or before December 31, 2011. This milestone has been met by
Copper Fox. Further acquire Teck's 'Indirect Holding' (defined as an indirect 23.4% carried interest
through its 78% shareholding in Liard Copper Mines Ltd. who hold a 30% carried interest in the
property) by incurring the above described $5,000,000 in expenditures and completing and
delivering to Teck a positive bankable feasibility study.
Teck may at any time elect to exercise one of it’s “earn-back options” pursuant to the terms and
conditions of 2002 Option Agreement. On receipt of a Positive Bankable Feasibility Study, as
defined, Teck has 120 days in which to elect to either: i) exercise one of its earn-back options, or ii)
retain a 1% net smelter return royalty, or iii) receive shares of Copper Fox to a value of $1,000,000.
If Teck exercises its earn-back option, then Teck can elect to acquire either 20%, 40% or 75% of
Copper Fox’s interest in the Schaft Creek Project from Copper Fox by solely funding subsequent
expenditures equal to either 100%, 300% or 400% of Copper Fox’s prior expenditures of which
approximately $43 million have been incurred to date. If Teck elects to earn-back a 75% working
interest, Teck will be responsible for arranging Copper Fox’s share of project financing and will
recover such project financing funds from Copper Fox’s share of metal sales until payout is
reached."
The option agreement includes provisions for joint management and for dilution of interests in
proportion to expenditures, including reversion of either party to a defined net profits royalty if that
party's interest is diluted below a 20% working interest in the joint venture.
Copper Fox is focused exclusively on completing the Feasibility Study on Schaft Creek, one of the largest undeveloped copper, gold, molybdenum and silver deposits in Canada. Copper
Fox has earned a 100% working interest in the Schaft Creek project subject to a 30% net proceeds interest held by Liard Copper Mines Limited (“Liard”) a private company 78% owned by
Teck Resources Limited (“Teck”) and a 3.5% net profits interest held by International Royalty Corporation. Teck’s 78% equity interest in Liard represents 23.4% of Liard’s 30% net
proceeds interest in the Schaft Creek project referred to as the “indirect interest”. Copper Fox can earn the “indirect interest” by completing a “positive” Feasibility Study, under the terms of
the 2002 Option Agreement with Teck.
0.00
0.20
0.40
0.60
0.80
1.00
1.20
1.40
1.60
1.80
F-10 A-10 J-10 A-10 O-10 D-10 F-11
.0 M
1.0 M
2.0 M
3.0 M
4.0 M
5.0 M
6.0 M
7.0 M
8.0 M
9.0 M
10.0 M
Project Update
December 14, 2010 - Drilling Continues to Intersect Deep Higher Grade Copper-Gold-Molybdenum Mineralization at Schaft Creek - Additional assay results from the ongoing
diamond drilling program concentrating on an area of the deposit that is 600m long by 200m wide to: i) establish a higher grade starter pit on surface and ii) to test for higher grade copper-
gold mineralization at depth. Highlights are as follows:
CF399 has extended the mineralization 175m to the east and 125m at depth, intersecting 508.1m at 0.39% Cu, 0.10 g/t Au, 0.05% Mo, 2.09 g/t Ag from 9.14m
CF401 has extended the mineralization a further 130m to the east and 100m at depth, intersecting 489.5m of 0.43% Cu, 0.25g/t Au, 0.04% Mo and 2.40 g/t Ag from 5.66m
November 16, 2010 - Geophysical Survey Indicates Deep Potential At Schaft Creek, Drilling Program Continues, Completion Of Resource Estimate Extended To Q1 2011 To
Include 2010 Drilling And Re-Assay Results - Copper Fox announced the results for the recently completed Quantec Titan-24 DCIP and MT survey at Schaft Creek. Copper Fox also
advises that it has extended the expected completion date for the updated resource estimate to allow inclusion of the assay results for the 2010 diamond drilling and the re-sampling of
selected historical diamond drill holes that is currently underway. The chargeability anomaly that reflects the Schaft Creek deposit has been extended an additional 800 metres (m) to the
north and 800 m to the south. This anomaly now has a strike length of 3,200 m and significantly increases the potential size of the deposit. At a depth of 700 m below surface, the
chargeability anomaly located in the center of the Schaft Creek deposit measures 1,000 m long by 500 m wide and is open to depth. The diamond drilling program is continuing to prove
up a higher grade starter pit, test the depth extent of the chargeability anomaly, and test the higher grade copper-gold mineralization intersected at the bottom of DDH CF398. The
chargeability anomaly suggests that the majority of the historical drilling was completed on a possible flank of the deposit (Liard Zone) and was too shallow to test the deeper part of the
chargeability anomaly. The resource estimate scheduled to be completed in December 2010 has been extended to Q1, 2011 and will include the analytical results of the 2010 diamond
drilling program and the re-sampling of historical drill holes.
November 4, 2010 - Drilling Intersects Significantly Higher Grade Mineralization At Schaft Creek And Confirms Mineralized Nature Of Geophysical Anomaly - Two diamond
drills are currently working at Schaft Creek to test the extensions of the mineralization intersected in DDH CF398 and to test the deposit at depth for higher grade copper-gold
mineralization. CF398 has intersected 54.3m of 0.70% Cu, 0.42 g/t Au, 2.80 g/t Ag, and 0.04% Mo from 7.1m. The hole may outline a possible starter pit for the project. The copper-gold-
molybdenum-silver mineralization is open at depth and the assay results confirm the mineralized nature of the chargeability anomaly identified in July 2010. The re-sampling of
approximately 40 historical diamond drill holes that contain higher grade copper mineralization is progressing well. Held public open house sessions on the draft Application Information
Requirements (AIR) in Tahltan communities, Terrace and Stewart B.C. The public comment period on the draft AIR will close on November 5, 2010, and
- The Quantec Titan-24 deep penetrating DCIP and MT survey over the interpreted north and south extensions of the Schaft Creek deposit has been completed.
Source: Company reports.
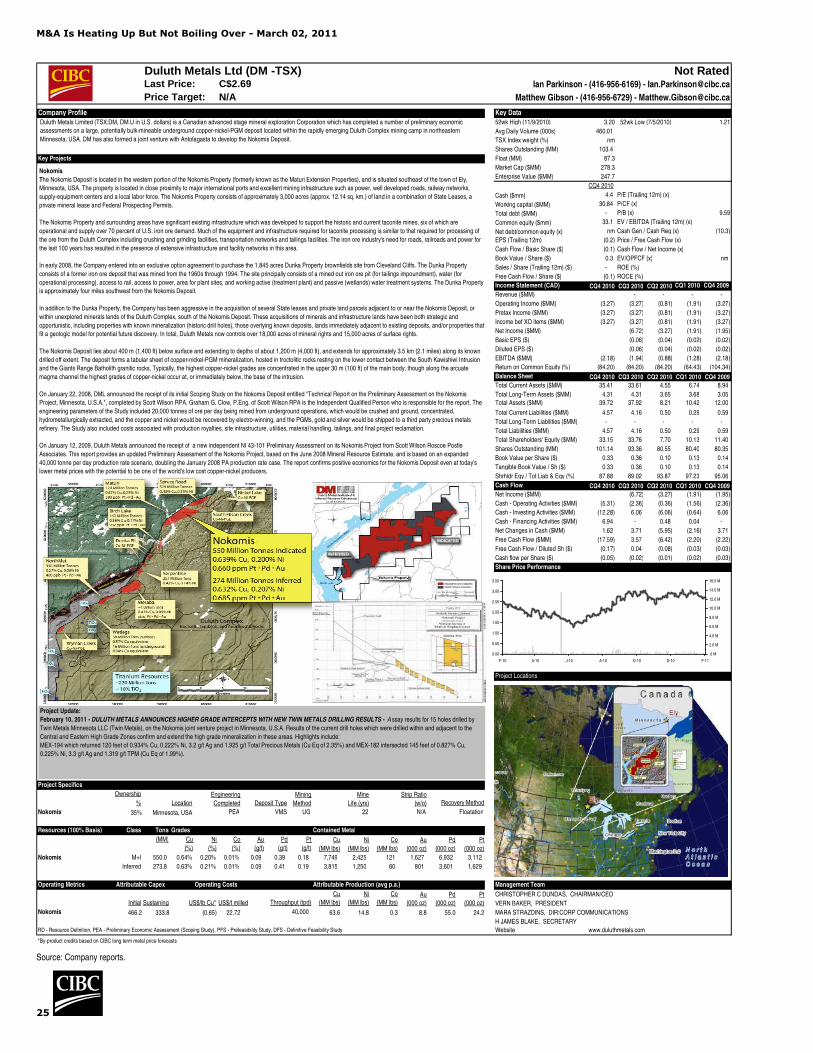
M&A Is Heating Up But Not Boiling Over - March 02, 2011
25
Duluth Metals Ltd (DM -TSX) Not RatedLast Price: Ian Parkinson - (416-956-6169) - [email protected]
Price Target: N/A Matthew Gibson - (416-956-6729) - [email protected]
Company Profile Key Data52wk High (11/9/2010) 3.20 52wk Low (7/5/2010) 1.21
Avg Daily Volume (000s) 460.01
TSX Index weight (%) nm
Shares Outstanding (MM) 103.4
Key Projects Float (MM) 87.3
Market Cap ($MM) 278.3
Enterprise Value ($MM) 247.7
CQ4 2010
Cash ($mm) 4.4 P/E (Trailing 12m) (x) #N/A N/A
Working capital ($MM) 30.84 P/CF (x) #N/A N/A
Total debt ($MM) - P/B (x) 9.59
Common equity ($mm) 33.1 EV / EBITDA (Trailing 12m) (x) #N/A N/A
Net debt/common equity (x) nm Cash Gen / Cash Req (x) (10.3)
EPS (Trailing 12m) (0.2) Price / Free Cash Flow (x) #N/A N/A
Cash Flow / Basic Share ($) (0.1) Cash Flow / Net Income (x) #N/A N/A
Book Value / Share ($) 0.3 EV/OPFCF (x) nm
Sales / Share (Trailing 12m) ($) - ROE (%) #N/A N/A
Free Cash Flow / Share ($) (0.1) ROCE (%) #N/A N/A
Income Statement (CAD) CQ4 2010 CQ3 2010 CQ2 2010 CQ1 2010 CQ4 2009
Revenue ($MM) #N/A N/A - - - -
Operating Income ($MM) (3.27) (3.27) (0.81) (1.91) (3.27)
Pretax Income ($MM) (3.27) (3.27) (0.81) (1.91) (3.27)
Income bef XO items ($MM) (3.27) (3.27) (0.81) (1.91) (3.27)
Net Income ($MM) #N/A N/A (6.72) (3.27) (1.91) (1.95)
Basic EPS ($) #N/A N/A (0.06) (0.04) (0.02) (0.02)
Diluted EPS ($) #N/A N/A (0.06) (0.04) (0.02) (0.02)
EBITDA ($MM) (2.18) (1.94) (0.88) (1.28) (2.18)
Return on Common Equity (%) (84.20) (84.20) (84.20) (64.43) (104.34)
Balance Sheet CQ4 2010 CQ3 2010 CQ2 2010 CQ1 2010 CQ4 2009
Total Current Assets ($MM) 35.41 33.61 4.55 6.74 8.94
Total Long-Term Assets ($MM) 4.31 4.31 3.65 3.68 3.05 Total Assets ($MM) 39.72 37.92 8.21 10.42 12.00
Total Current Liabilities ($MM) 4.57 4.16 0.50 0.29 0.59
Total Long-Term Liabilities ($MM) - - - - -
Total Liabilities ($MM) 4.57 4.16 0.50 0.29 0.59
Total Shareholders' Equity ($MM) 33.15 33.76 7.70 10.13 11.40
Shares Outstanding (MM) 101.14 93.36 80.55 80.40 80.35
Book Value per Share ($) 0.33 0.36 0.10 0.13 0.14
Tangible Book Value / Sh ($) 0.33 0.36 0.10 0.13 0.14
Shrhldr Eqy / Tot Liab & Eqy (%) 87.88 89.02 93.87 97.23 95.06
Cash Flow CQ4 2010 CQ3 2010 CQ2 2010 CQ1 2010 CQ4 2009
Net Income ($MM) #N/A N/A (6.72) (3.27) (1.91) (1.95)
Cash - Operating Activities ($MM) (5.31) (2.36) (0.36) (1.56) (2.36)
Cash - Investing Activities ($MM) (12.28) 6.06 (6.06) (0.64) 6.06
Cash - Financing Activities ($MM) 6.94 - 0.48 0.04 -
Net Changes in Cash ($MM) 1.62 3.71 (5.95) (2.16) 3.71
Free Cash Flow ($MM) (17.59) 3.57 (6.42) (2.20) (2.22)
Free Cash Flow / Diluted Sh ($) (0.17) 0.04 (0.08) (0.03) (0.03)
Cash flow per Share ($) (0.05) (0.02) (0.01) (0.02) (0.03)
Share Price Performance
Project Locations
Project Specifics
Ownership
% Location Deposit Type
Nokomis 35% Minnesota, USA PEA VMS UG 22 N/A Floatation
Resources (100% Basis) Class Tons Grades Contained Metal
(MM)
Nokomis M+I 550.0 0.64% 0.20% 0.01% 0.09 0.39 0.18 7,749 2,425 121 1,627 6,932 3,112
Inferred 273.8 0.63% 0.21% 0.01% 0.09 0.41 0.19 3,815 1,250 60 801 3,601 1,629
Operating Metrics Attributable Capex Operating Costs Attributable Production (avg p.a.) Management Team
CHRISTOPHER C DUNDAS, CHAIRMAN/CEO
Initial Sustaining US$/lb Cu* US$/t milled VERN BAKER, PRESIDENT
Nokomis 466.2 333.8 (0.65) 22.72 63.6 14.8 0.3 8.8 55.0 24.2 MARA STRAZDINS, DIR:CORP COMMUNICATIONS
H JAMES BLAKE, SECRETARYRD - Resource Definition, PEA - Preliminary Economic Assessment (Scoping Study), PFS - Prefeasibility Study, DFS - Definitive Feasibility Study Website www.duluthmetals.com
*By-product credits based on CIBC long term metal price forecasts
Mine
Life (yrs)
Strip Ratio
(w/o)
Pt
(000 oz)
Ni
(MM lbs)
Co
(MM lbs)
Au
(000 oz)
Pd
(000 oz)
Recovery Method
Throughput (tpd)
Cu
(MM lbs)
Ni
(MM lbs)
Co
(MM lbs)Au
(000 oz)
Pd
(000 oz)
Pt
(000 oz)
40,000
Cu
(%)
Ni
(%)
Co
(%)
Au
(g/t)
C$2.69
Pd
(g/t)
Pt
(g/t)Cu
(MM lbs)
Engineering
Completed
Mining
Method
0.00
0.50
1.00
1.50
2.00
2.50
3.00
3.50
F-10 A-10 J-10 A-10 O-10 D-10 F-11
.0 M
2.0 M
4.0 M
6.0 M
8.0 M
10.0 M
12.0 M
14.0 M
16.0 M
Nokomis
The Nokomis Deposit is located in the western portion of the Nokomis Property (formerly known as the Maturi Extension Properties), and is situated southeast of the town of Ely,
Minnesota, USA. The property is located in close proximity to major international ports and excellent mining infrastructure such as power, well developed roads, railway networks,
supply-equipment centers and a local labor force. The Nokomis Property consists of approximately 3,000 acres (approx. 12.14 sq. km.) of land in a combination of State Leases, a
private mineral lease and Federal Prospecting Permits.
The Nokomis Property and surrounding areas have significant existing infrastructure which was developed to support the historic and current taconite mines, six of which are
operational and supply over 70 percent of U.S. iron ore demand. Much of the equipment and infrastructure required for taconite processing is similar to that required for processing of
the ore from the Duluth Complex including crushing and grinding facilities, transportation networks and tailings facilities. The iron ore industry's need for roads, railroads and power for
the last 100 years has resulted in the presence of extensive infrastructure and facility networks in this area.
In early 2008, the Company entered into an exclusive option agreement to purchase the 1,845 acres Dunka Property brownfields site from Cleveland Cliffs. The Dunka Property
consists of a former iron ore deposit that was mined from the 1960s through 1994. The site principally consists of a mined out iron ore pit (for tailings impoundment), water (for
operational processing), access to rail, access to power, area for plant sites, and working active (treatment plant) and passive (wetlands) water treatment systems. The Dunka Property
is approximately four miles southwest from the Nokomis Deposit.
In addition to the Dunka Property, the Company has been aggressive in the acquisition of several State leases and private land parcels adjacent to or near the Nokomis Deposit, or
within unexplored minerals lands of the Duluth Complex, south of the Nokomis Deposit. These acquisitions of minerals and infrastructure lands have been both strategic and
opportunistic, including properties with known mineralization (historic drill holes), those overlying known deposits, lands immediately adjacent to existing deposits, and/or properties that
fit a geologic model for potential future discovery. In total, Duluth Metals now controls over 18,000 acres of mineral rights and 15,000 acres of surface rights.
The Nokomis Deposit lies about 400 m (1,400 ft) below surface and extending to depths of about 1,200 m (4,000 ft), and extends for approximately 3.5 km (2.1 miles) along its known
drilled off extent. The deposit forms a tabular sheet of copper-nickel-PGM mineralization, hosted in troctolitic rocks resting on the lower contact between the South Kawishiwi Intrusion
and the Giants Range Batholith granitic rocks. Typically, the highest copper-nickel grades are concentrated in the upper 30 m (100 ft) of the main body, though along the arcuate
magma channel the highest grades of copper-nickel occur at, or immediately below, the base of the intrusion.
On January 22, 2008, DML announced the receipt of its initial Scoping Study on the Nokomis Deposit entitled "Technical Report on the Preliminary Assessment on the Nokomis
Project, Minnesota, U.S.A.", completed by Scott Wilson RPA. Graham G. Clow, P.Eng. of Scott Wilson RPA is the Independent Qualified Person who is responsible for the report. The
engineering parameters of the Study included 20,000 tonnes of ore per day being mined from underground operations, which would be crushed and ground, concentrated,
hydrometallurgically extracted, and the copper and nickel would be recovered by electro-winning, and the PGMs, gold and silver would be shipped to a third party precious metals
refinery. The Study also included costs associated with production royalties, site infrastructure, utilities, material handling, tailings, and final project reclamation.
On January 12, 2009, Duluth Metals announced the receipt of a new independent NI 43-101 Preliminary Assessment on its Nokomis Project from Scott Wilson Roscoe Postle
Associates. This report provides an updated Preliminary Assessment of the Nokomis Project, based on the June 2008 Mineral Resource Estimate, and is based on an expanded
40,000 tonne per day production rate scenario, doubling the January 2008 PA production rate case. The report confirms positive economics for the Nokomis Deposit even at today's
lower metal prices with the potential to be one of the world's low cost copper-nickel producers.
Duluth Metals Limited (TSX:DM, DM.U in U.S. dollars) is a Canadian advanced stage mineral exploration Corporation which has completed a number of preliminary economic
assessments on a large, potentially bulk-mineable underground copper-nickel-PGM deposit located within the rapidly emerging Duluth Complex mining camp in northeastern
Minnesota, USA. DM has also formed a joint venture with Antofagasta to develop the Nokomis Deposit.
Project Update:
February 10, 2011 - DULUTH METALS ANNOUNCES HIGHER GRADE INTERCEPTS WITH NEW TWIN METALS DRILLING RESULTS - A ssay results for 15 holes drilled by
Twin Metals Minnesota LLC (Twin Metals), on the Nokomis joint venture project in Minnesota, U.S.A. Results of the current drill holes which were drilled within and adjacent to the
Central and Eastern High Grade Zones confirm and extend the high grade mineralization in these areas. Highlights include:
MEX-194 which returned 120 feet of 0.934% Cu, 0.222% Ni, 3.2 g/t Ag and 1.925 g/t Total Precious Metals (Cu Eq of 2.35%) and MEX-182 intersected 145 feet of 0.827% Cu,
0.225% Ni, 3.3 g/t Ag and 1.319 g/t TPM (Cu Eq of 1.99%).
Source: Company reports.

M&A Is Heating Up But Not Boiling Over - March 02, 2011
26
Candente Copper Corp (DNT-TSX) Not RatedLast Price: Ian Parkinson - (416-956-6169) - [email protected]
Price Target: N/A Matthew Gibson - (416-956-6729) - [email protected]
Company Profile Key Data52wk High (1/19/2011) 2.63 52wk Low (7/20/2010) 0.29
Toronto Lima Frankfurt
Avg Daily Volume (000s) 518.30 113.74 21.14
Shares Outstanding (MM) 101.2
Float (MM) 86.2
Market Cap ($MM) 202.3
Key Projects Enterprise Value ($MM) 189.7
FQ3 2010
Cash ($mm) 1.4 P/E (Trailing 12m) (x) #N/A N/A
Working capital ($MM) 2.64 P/CF (x) #N/A N/A
Total debt ($MM) - P/B (x) 4.39
Common equity ($mm) 46.0 EV / EBITDA (Trailing 12m) (x) #N/A N/A
Net debt/common equity (x) nm Cash Gen / Cash Req (x) (0.4)
EPS (Trailing 12m) (0.0) Price / Free Cash Flow (x) #N/A N/A
Cash Flow / Basic Share ($) (0.0) Cash Flow / Net Income (x) #N/A N/A
Book Value / Share ($) 0.5 EV/OPFCF (x) nm
Sales / Share (Trailing 12m) ($) - ROE (%) (3.2)
Free Cash Flow / Share ($) (0.0) ROCE (%) #N/A N/A
Income Statement (USD) FQ3 2010 FQ2 2010 FQ1 2010 FQ4 2009 FQ3 2009
Revenue ($MM) - - - - -
Operating Income ($MM) (0.61) (0.34) (0.31) (0.44) (0.80)
Pretax Income ($MM) (0.53) (0.42) (0.28) (0.30) (0.83)
Income bef XO items ($MM) (0.53) (0.42) (0.28) (0.30) (0.83)
Net Income ($MM) (0.53) (0.42) (0.28) (0.30) (0.83)
Basic EPS ($) - (0.01) - (0.01) (0.01)
Diluted EPS ($) - (0.01) - (0.01) (0.01)
EBITDA ($MM) (0.60) (0.33) (0.31) (0.43) (0.80)
Return on Common Equity (%) (3.46) (4.16) (2.75) (3.15) (6.14)
Balance Sheet FQ3 2010 FQ2 2010 FQ1 2010 FQ4 2009 FQ3 2009
Total Current Assets ($MM) 3.35 5.31 6.29 1.72 1.97
Total Long-Term Assets ($MM) 43.38 41.28 40.79 42.12 42.14 Total Assets ($MM) 46.73 46.59 47.08 43.84 44.11
Total Current Liabilities ($MM) 0.70 1.13 0.51 1.25 1.51
Total Long-Term Liabilities ($MM) - - - - -
Total Liabilities ($MM) 0.70 1.13 0.51 1.25 1.51
Total Shareholders' Equity ($MM) 46.03 45.45 46.58 42.59 42.61
Shares Outstanding (MM) 98.90 98.90 94.05 81.07 80.94
Book Value per Share ($) 0.47 0.46 0.50 0.53 0.53
Tangible Book Value / Sh ($) 0.47 0.46 0.50 #N/A N/A 0.53
Shrhldr Eqy / Tot Liab & Eqy (%) 98.49 97.57 98.92 97.14 96.58
Cash Flow FQ3 2010 FQ2 2010 FQ1 2010 FQ4 2009 FQ3 2009Net Income ($MM) (0.53) (0.42) (0.28) (0.30) (0.83)
Cash - Operating Activities ($MM) (0.10) (1.01) 0.03 (0.19) (0.16)
Cash - Investing Activities ($MM) (1.73) (0.56) (1.05) (0.29) (0.28)
Cash - Financing Activities ($MM) 0.00 1.59 4.08 0.29 -
Net Changes in Cash ($MM) (1.83) 0.02 3.06 (0.19) (0.44)
Free Cash Flow ($MM) (1.70) (1.48) (0.95) (0.42) (0.32)
Free Cash Flow / Diluted Sh ($) (0.02) (0.02) (0.01) (0.01) (0.00)
Cash flow per Share ($) (0.00) (0.01) 0.00 (0.00) (0.00)
Share Price Performance
Project Locations
Drill Results Summary, Canariaco Sur and Quebrada
Drill Hole From (m) To (m) Interval (m)Cu (%) Au (gpt) Ag (gpt)
CS08-001 - 146.0 146.0 0.095 0.032 0.581 -600 /south 146.0 180.0 34.0 0.25 0.11 1.27
180.0 534.9 354.9 0.35 0.15 1.43
CS08-002 - 73.0 73.0 0.19 0.08 1.79
-550 /south 73.0 249.2 176.2 0.41 0.12 1.59
Project Specifics
Ownership
% Location Deposit Type
Cañariaco 100% Ferreñafe, Peru PEA Cu Au Porphyry OP 22 1.0 Floatation
Resources Class Tonnes Grades Contained Metal
(MM) (%) (g/t) (g/t) Cu
(MM lbs)(000 oz) (000 oz)
Cañariaco M+I 752.4 0.45% 0.07 1.90 7,533 1,669 45,237 Management Team
Inferred 157.7 0.41% 0.07 1.90 1,434 304 8,932 DR. KLAUS M. ZEITLER, CHAIRMAN
JOANNE CONSTANCE FREEZE, CEO
Operating Metrics Attributable Capex Operating Costs Attributable Production (avg p.a.) SEAN IVOR WALLER, PRESIDENTut (MM lbs) (000 oz) (000 oz) AURORA G DAVIDSON, CHIEF FINANCIAL OFFICER
Initial Sustaining US$/lb Cu* US$/t milled THEODORE MURARO, GENERAL MANGER, PERU’
Cañariaco 1,437.0 128.0 0.99 9.48 95,000 262.0 39.0 911.0 MARIA EUGENIA MONTAGNE, TREASURER/SECRETARYRD - Resource Definition, PEA - Preliminary Economic Assessment (Scoping Study), PFS - Prefeasibility Study, DFS - Definitive Feasibility Study Website www.candente.com
*By-product credits based on CIBC long term metal price forecasts
C$2.00
Recovery Method
Strip Ratio
(w/o)
Engineering
Completed
Mining
Method
Mine
Life (yrs)
Candente is a diversified exploration and development company with copper and zinc projects in Peru. The most advanced project is the large scale Cañariaco Norte copper
deposit located in Northern Peru with a measured and indicated resource of 752 million tonnes of 0.45% Cu, 0.07 g/t Au and 1.9 g/t Au (0.52% Cu equivalent, containing 7.53
billion lbs Cu, 1.67 million oz Au and 45.2 million oz Ag). A Preliminary Economic Assessment (PEA -- Scoping level) update completed in December 2010 demonstrates that
the project has strong economics at consensus long term copper prices. A second mineralized copper porphyry has been discovered adjacent to the Norte deposit and
excellent potential exists for discovery of a third porphyry deposit, which offer the potential to significantly expand the scope of the Canariaco project.
Cañariaco Sur and Quebrada
Cañariaco Sur is the second copper-gold porphyry intrusive body discovered to
date on the Cañariaco Property and lies 1.3 km south of the centre of the
Cañariaco Norte deposit. The close proximity of Cañariaco Sur to Cañariaco
Norte, offers the potential to add significantly to the economics of the Cañariaco
project through shared infrastructure and facilities. Candente drilled two holes,
320 metres apart, to depths of 535 and 506 metres in the Cañariaco Sur target in
2008.
Cañariaco Norte, Cañariaco Sur and a third target, Quebrada Verde, are part of
an extensive porphyry complex covering a minimum length of five kilometres and
an average width of two kilometres. The porphyry complex is covered entirely by
the Cañariaco property, which is held 100% by Candente. Geological mapping,
geophysics and geochemical sampling by Candente, and by Billiton in 1999
(including limited drilling), indicate a strong potential for additional porphyry
copper-gold mineralization within the complex.
The Cañariaco Sur and Quebrada Verde area is underlined by Calipuy volcanic
sequence intruded by several phases of porphyry and locally tourmaline breccias.
Calipuy volcanics consist mainly of lavas and pyroclastics. Intrusives are of
granodiorite composition and they vary from biotite rich (quartz diorite porphyry)
to quartz "eye" rich (quartz monzonite porphyry, quartz feldspar porphyry).
Tourmaline breccias similar to those seen at Cañariaco Norte have been mapped
along the margins of the porphyry intrusives.
0.00
0.50
1.00
1.50
2.00
2.50
3.00
F-10 A-10 J-10 A-10 O-10 D-10 F-11
.0 M
1.0 M
2.0 M
3.0 M
4.0 M
5.0 M
6.0 M
7.0 M
Cañariaco Copper Project
The Company has a 100% interest in the mineral rights of the property. Surface rights are in negotiation with local communities. The Cañariaco Copper Project property is
approximately 100 kilometers (km) northeast of the city of Chiclayo and 700 km north-northwest of Lima. The property is located at elevations that range from 2,500 meters (m) to
3,500 m. The topography features moderate to steep slopes cut by streams and rivers. Above 3,000 m the vegetation is mostly short grass and pastures while below 3,000 m native
forests extend up into the valleys.
Access to the property is from Chiclayo with major port facilities and a major airport, from where mining supplies and services can be procured. Access is along a paved road to Batan
Grande and then via gravel road. Travel time to the property from Chiclayo averages six hours by four-wheel drive vehicle. The Cañariaco project area is sparsely populated with
farming families. A local labor force is readily available and favorable to exploration and development activities. Exploration and development work can be performed year round at
Cañariaco. The rainy season (January to March) may affect field activities.
The Cañariaco Copper Project porphyry system lies within a belt of porphyry copper deposits which extend 350 km from Cajamarca north by northwest to the Ecuadorian border. The
mineralized systems known in this belt comprise two types, porphyry copper-molybdenum and porphyry copper-gold deposits. Three separate porphyry systems have been identified
on the Cañariaco Copper Project property: Cañariaco Norte, Cañariaco Sur and Quebrada Verde. The Cañariaco Norte has had extensive drilling; Cañariaco Sur and Quebrada
Verde have had only limited drilling. Mineralization of economic interest at Cañariaco Norte is primarily copper associated with a quartz-feldspar porphyry stock with a well developed
fine to medium grained quartz-sulphide stockwork. Copper mineralization at Cañariaco Norte occurs mainly as primary hypogene chalcopyrite, chalcocite and minor bornite, covellite,
and lesser enargite and tenantite. Gold and silver are present at levels that would generate smelter credits when processed. At Cañariaco Norte, mineralization has been identified in
an area of 1,200 m by 700 m and to a depth of about 600 m. Age dating puts the mineralization event at approximately 17 million years ago.
Project Update
January 18, 2010 - Candente Copper Announces Positive Pre-Feasibility
Progress Report for the Cañariaco Norte Copper Project - Based on
projected annual production of 262 million lbs of copper, 39,000 ozs of gold and
911,000 ozs of silver over a mine life of 22 years, the Cañariaco Norte project
has an after tax net present value ("NPV") of US$960.0M, and after tax Internal
Rate of Return ("IRR") of 17.7% using a long term copper price reverting to
US$2.25 /lb and a discount rate of 8%.
The Cañariaco Norte copper project will see development of a large scale open
pit mine utilizing conventional truck and shovel mining. The mine plan calls for
the extraction of 728.2 million tonnes of mineralized material and 713.5 million
tonnes of waste over the projected 22 year mine life (strip ratio of 0.98 to 1).
Average life-of-mine head grades to the process plant will be 0.40% copper,
0.067 g/t gold and 1.71 g/t silver. The mine grades during the first three years of
production will be higher, with average feed grades of 0.48% copper, 0.086 g/t
gold and 2.14 g/t silver.
The Cañariaco Norte is reasonably close to key road and power infrastructure,
has a low strip ratio, soft rock, low operating cost, offers excellent potential for
discovery of additional resources, and is located in Peru, one of the most
favourable countries in the world for mining project development.
Source: Company reports.

M&A Is Heating Up But Not Boiling Over - March 02, 2011
27
Entree Gold Inc (ETG-TSX) Not RatedLast Price: Ian Parkinson - (416-956-6169) - [email protected]
Price Target: N/A Matthew Gibson - (416-956-6729) - [email protected]
Company Profile Key Data
52wk High (12/31/2010) 3.47 52wk Low (7/8/2010) 1.84
Avg Daily Volume (000s) 143.59
TSX Index weight (%) nm
Shares Outstanding (MM) 114.4
Float (MM) 82.6
Market Cap ($MM) 353.4
Key Projects Enterprise Value ($MM) 323.2
FQ3 2010
Cash ($mm) 40.4 P/E (Trailing 12m) (x) #N/A N/A
Working capital ($MM) 40.30 P/CF (x) #N/A N/A
Total debt ($MM) 0.7 P/B (x) 5.56
Common equity ($mm) 43.9 EV / EBITDA (Trailing 12m) (x) #N/A N/A
Net debt/common equity (x) nm Cash Gen / Cash Req (x) (74.3)
EPS (Trailing 12m) (0.18) Price / Free Cash Flow (x) #N/A N/A
Cash Flow / Basic Share ($) (0.14) Cash Flow / Net Income (x) #N/A N/A
Book Value / Share ($) 0.57 EV/OPFCF (x) nm
Sales / Share (Trailing 12m) ($) - ROE (%) (37.7)
Free Cash Flow / Share ($) (0.14) ROCE (%) #N/A N/A
Income Statement (USD) FQ3 2010 FQ2 2010 FQ1 2010 FQ4 2009 FQ3 2009
Revenue ($MM) - - - - -
Operating Income ($MM) (2.17) (3.44) (2.18) (5.92) (3.60)
Pretax Income ($MM) (2.16) (3.42) (2.16) (6.04) (3.62)
Income bef XO items ($MM) (2.16) (3.42) (2.16) (6.04) (3.62)
Net Income ($MM) (6.55) (3.42) (2.16) (6.04) (3.62)
Basic EPS ($) (0.06) (0.04) (0.02) (0.06) (0.04)
Diluted EPS ($) (0.06) (0.04) (0.02) (0.06) (0.04)
EBITDA ($MM) (2.27) (3.40) (2.14) (5.88) (3.56)
Return on Common Equity (%) (19.63) (27.41) (35.71) (37.67) (30.43)
Balance Sheet (US$) FQ3 2010 FQ2 2010 FQ1 2010 FQ4 2009 FQ3 2009Total Current Assets ($MM) 40.95 31.60 40.95 42.04 42.33
Total Long-Term Assets ($MM) 4.32 53.85 4.32 3.77 2.91 Total Assets ($MM) 45.26 85.45 45.26 45.80 45.24
Total Current Liabilities ($MM) 0.65 1.61 0.65 1.16 0.61
Total Long-Term Liabilities ($MM) 0.72 16.11 0.72 0.68 0.46
Total Liabilities ($MM) 1.36 17.71 1.36 1.84 1.06
Total Shareholders' Equity ($MM) 43.90 67.73 43.90 43.97 44.18
Shares Outstanding (MM) 97.07 113.43 97.48 97.06 95.15
Book Value per Share ($) 0.45 0.60 0.45 0.45 0.46
Tangible Book Value / Sh ($) 0.45 0.60 0.45 0.45 0.46
Shrhldr Eqy / Tot Liab & Eqy (x) 32.23 79.27 96.99 95.99 97.65
Cash Flow Statement (US$) FQ3 2010 FQ2 2010 FQ1 2010 FQ4 2009 FQ3 2009
Net Income ($MM) (6.55) (3.42) (2.16) (6.04) (3.62)
Cash - Operating Activities ($MM) (2.34) (2.59) (2.34) (3.70) (3.65)
Cash - Investing Activities ($MM) (0.46) (5.61) (0.46) (0.16) (0.11)
Cash - Financing Activities ($MM) 0.61 (0.96) 1.76 2.55 3.96
Net Changes in Cash ($MM) (1.03) (9.16) (1.03) (1.31) 0.20
Free Cash Flow ($MM) (2.80) (2.68) (2.36) (3.78) (3.71)
Free Cash Flow / Diluted Sh ($) (0.03) (0.03) (0.02) (0.04) (0.04)
Cash flow per Share ($) (0.02) (0.03) (0.02) (0.04) (0.04)
Share Price Performance
From To Length Cu Mo Au Ag
(m) (m) (m) % % g/t g/t
EG-AM-10-001 214 1201.8 987.8 0.31 0.01 0.04 0.76
Including 472 812 340 0.4 0.02 0.06 1.1 Project Location
Including 608 646 38 0.6 0.02 0.12 2.09
Project Specifics
Ownership
% Location Deposit Type
Ann Mason 100% Nevada, USA RD Cu Mo Skarn NA NA NA NA
Lookout Hill (Heruga) 20% Gobi Desert, Mongolia PEA Cu Au Mo Porphyry UG NA NA NA
Lookout Hill (Hugo North) 20% Gobi Desert, Mongolia PEA Cu Au Porphyry UG 30 NA Floatation
Resources Class Tonnes Grades Contained Metal Management Team
JAMES L. HARRIS, CHAIRMAN
(MM) GREGORY G. CROWE, PRESIDENT & CEO
Ann Mason Inferred 810.4 0.40% 0.01% - 7,129 179 - BRUCE COLWILL, CFO
Lookout Hill (Heruga) Inferred 910.0 0.48% 0.01% 0.49 9,630 201 14,336 LINDSAY R. BOTTOMER, VP BUSINESS DEVELOPMENT
Lookout Hill (Hugo North) M+I 117.0 1.80% - 0.61 4,643 - 2,295
Lookout Hill (Hugo North) Inferred 95.5 1.15% - 0.31 2,421 - 952
RD - Resource Definition, PEA - Preliminary Economic Assessment (Scoping Study), PFS - Prefeasibility Study, DFS - Definitive Feasibility Study Website www.entreegold.com
*By-product credits based on CIBC long term metal price forecasts
Au
(g/t)
Cu
(MM lbs)
Mo
MM lbs
Cu
(%)
Mo
(%)
Au
(000 oz)
Recovery Method
C$3.09
Mining
Method
Mine
Life (yrs)
Ratio
(w/o)
Engineering
Completed
Lookout Hill
Entrée’s flagship property is in Mongolia, where it holds two mining
licences and one exploration licence comprising the 179,590 hectare
Lookout Hill property that completely surrounds the 8,500-hectare Oyu
Tolgoi project of Ivanhoe Mines, and hosts the Hugo North Extension of
the Hugo Dummett copper-gold deposit and the Heruga copper-gold-
molybdenum deposit.
Part of the Lookout Hill property which includes the eastern portion of the
Shivee Tolgoi licence and all of the Javhlant licence is subject to a joint
venture with Ivanhoe Mines Mongolia Inc. (now renamed Oyu Tolgoi
LLC). The joint venture was formed following expenditure of US$35
million by Oyu Tolgoi LLC, and Entrée now retains a 20% or 30% carried
interest through to production, with Entrée’s share of development costs
to be repaid from future production cash flow. Entree retains 100%
ownership of the western portion of the Shivee Tolgoi licence, known as
Shivee West and all of the Togoot exploration licence. A portion of the
Togoot exploration license is under application for conversion to a mining
license, based on a small thermal coal resources at Nomkhon Bohr. At
this time the status of this application is pending.
Nevada Properties
The area around Yerington, Nevada is currently experiencing renewed
exploration activity. Successful work by other companies actively
exploring in the Yerington district has demonstrated the potential of this
camp to host sizeable copper resources. Entrée’s Blackjack and Roulette
prospects, under option agreements with Honey Badger Exploration and
Bronco Creek Exploration respectively, are surrounded by substantial
confirmed copper deposits: Quaterra’s MacArthur deposit, PacMag’s Ann
Mason deposit and Nevada Copper’s Pumpkin Hollow copper skarn
deposit. Recent exploration activity suggests the area has significant
exploration potential in an area with excellent infrastructure and a long
history of mining.
Arizona/New Mexico Properties
Entrée has two agreements with Empirical Discovery, LLC to explore for
porphyry copper-gold targets in two specified areas extending southeast
from Safford, Arizona into New Mexico and near Bisbee, Arizona. This
area of the USA is one of the most significant copper producing areas in
the world. Entrée's ground position now covers six targets and totals
approximately 14,365 ha (35,500 acres). The 2010 exploration budget for
initial work programs in Mongolia, the USA and Canada is approximately
US$7MM.
Crystal
Located approximately 120 kilometres west-southwest of Prince George,
BC, the Crystal Property is comprised of ten contiguous claims covering
almost 4,800 hectares. The Crystal Property is an early stage copper-
molybdenum prospect covering a sizeable lake sediment geochemical
anomaly that has never been tested. The anomaly lies in an area of
known molybdenum deposits such as Thompson Creek’s Endako Mine.
Entrée Gold Inc. is a Canadian mineral resource company successfully meeting the global demand for products derived from gold, copper, molybdenum and coal.
Entrée Gold is achieving this goal through concerted exploration efforts. With operations in Mongolia, China, the United States and Canada, Entrée has assembled a
portfolio of exploration projects balanced between grass roots, advanced exploration and pre-production. Entrée has raised over C$100 million since its inception in
2002, with its market capitalization growing from under $4 million to over $250 million. Its treasury stands at over C$20 million, providing them with ample funds to
weather economic uncertainty and expand our portfolio.
0.00
0.50
1.00
1.50
2.00
2.50
3.00
3.50
4.00
F-10 A-10 J-10 A-10 O-10 D-10 F-11
.0 M
.2 M
.4 M
.6 M
.8 M
1.0 M
1.2 M
1.4 M
Company Update
February 7, 2011 - Entrée Gold Intersects 988 Metres Of Copper
Mineralization At Ann Mason - Assay results from its first diamond drill
hole completed on the Ann Mason deposit in the Yerington district of
Nevada. This hole (EG-AM-10-001) returned 987.8 metres averaging
0.31% Cu or 0.38% copper equivalent ("CuEq"), including a higher grade
section of 340 metres averaging 0.40% Cu or 0.51% CuEq. The hole
bottomed in strong mineralization averaging 0.41% Cu or 0.53% CuEq over the last 35.8 metres, indicating the continuation of mineralization to greater depths. With
completion of this hole, copper mineralization has been extended for 325 metres below the limit of the current resource.
The primary copper sulphide mineralization (chalcopyrite and bornite) in this hole has associated gold, silver and molybdenum values which were not systematically
measured during previous drilling. The hole collared in 40 metres of overburden and then cut increasingly mineralized and altered intrusive host rocks. Significant copper
mineralization commences at approximately 100 metres depth, with consistent grades greater than 0.3% Cu starting at a depth of 214 metres.
Recently completed Induced Polarization ("IP") geophysical surveying suggests that the Ann Mason sulphide system may extend for at least 3 kilometres west to the
Blue Hill area, where recent drilling (see news release dated November 17, 2010) has shown surface oxide copper mineralization to be underlain by primary sulphide
mineralization. Future drilling will include testing for the possible continuation of this copper system between Ann Mason and the Blue Hill area.
Source: Company reports.

M&A Is Heating Up But Not Boiling Over - March 02, 2011
28
Explorator Resources Inc (EXO-TSXV) Not RatedLast Price: Ian Parkinson - (416-956-6169) - [email protected]
Price Target: N/A Matthew Gibson - (416-956-6729) - [email protected]
Company Profile Key Data52wk High (1/7/2011) 0.80 52wk Low (6/17/2010) 0.36
Avg Daily Volume (000s) 50.55
TSX Index weight (%) nm
Shares Outstanding (MM) 98.0
Float (MM) 60.7
Key Projects Market Cap ($MM) 45.1
Enterprise Value ($MM) #N/A N/A
CQ4 2009
Cash ($mm) 5.2 P/E (Trailing 12m) (x) nm
Working capital ($MM) 5.18 P/CF (x) nm
Total debt ($MM) - P/B (x) 2.79
Common equity ($mm) 13.2 EV / EBITDA (Trailing 12m) (x) nm
Net debt/common equity (x) nm Cash Gen / Cash Req (x) nm
EPS (Trailing 12m) (0.04) Price / Free Cash Flow (x) nm
Cash Flow / Basic Share ($) (0.00) Cash Flow / Net Income (x) nm
Book Value / Share ($) 0.16 EV/OPFCF (x) nm
Sales / Share (Trailing 12m) ($) nm ROE (%) (60.6)
Free Cash Flow / Share ($) (0.00) ROCE (%) (60.6)
Income Statement (CAD) CQ1 2010 CQ4 2009 CQ3 2009 CQ2 2009 CQ1 2009
Revenue ($MM) - - - -
Operating Income ($MM) (0.07) (0.41) (0.17) (0.27) (2.42)
Pretax Income ($MM) (0.33) (1.70) (0.88) (0.31) (0.02)
Income bef XO items ($MM) (0.33) (1.70) (0.88) (0.31) (0.02)
Hole ID From - To Width Cu Au Net Income ($MM) (0.33) (1.70) (0.88) (0.31) (0.02)
MXE-01 12-15 3m 0.98% Cu 0.01g/tAu Basic EPS ($) (0.04) (0.02) (0.02) (0.01) 0.00
32-84 52m 0.51% Cu 0.14g/tAu Diluted EPS ($) (0.04) (0.02) (0.02) (0.01) 0.00
174-184 10m 0.46% Cu 0.83g/tAu EBITDA ($MM) (0.22) (0.41) (0.17) (0.27) (2.42)
MXE-02 52-83 31m 0.27% Cu 0.05g/tAu Return on Common Equity (%) (9.81) (60.59) (36.74) (12.10) (9.72)
MXE-03 90-93 3m 1.53% Cu 0.05g/tAu Balance Sheet CQ1 2010 CQ4 2009 CQ3 2009 CQ2 2009 CQ1 2009
122-132 10m 0.85% Cu 0.11g/tAu Total Current Assets ($MM) 5.24 5.33 1.21 1.39 1.87
160-210 50m 1.10% Cu 0.11g/tAu Total Long-Term Assets ($MM) 7.99 8.10 9.01 9.93 9.93
MXE-04 62-82 20m 0.17% Cu 0.01g/tAu Total Assets ($MM) 13.23 13.43 10.22 11.32 11.81
MXE-05 18-44 26m 0.60% Cu 0.04g/tAu Total Current Liabilities ($MM) 0.05 0.06 0.04 0.08 1.18
MXE-06 129-154 25m 1.40% Cu 0.25g/tAu Total Long-Term Liabilities ($MM) - - - - -
and 144-149 5m 1.92 0.30g/tAu Total Liabilities ($MM) 0.05 0.06 0.04 0.08 1.18
MXE-07 173-186 13m 2.07% Cu 0.04g/tAu Total Shareholders' Equity ($MM) 13.18 13.37 10.18 11.24 10.63
MXE-08 128-193 65m 2.07% Cu 0.31g/tAu Shares Outstanding (MM) 79.89 67.20 68.73 67.77 56.63
234-250 16m 0.61% Cu 0.10g/tAu Book Value per Share ($) 0.16 0.20 0.15 0.17 0.19
MXE-09 210-241 31m 0.75% Cu 0.55g/tAu Tangible Book Value / Sh ($) 0.16 0.20 0.15 0.17 0.19
and 261-263 2m 6.03% Cu 8.25g/tAu Shrhldr Eqy / Tot Liab & Eqy (x) 99.59 99.57 99.59 99.27 90.02
MXE-10 90-96 6m 0.49% Cu Cash Flow CQ1 2010 CQ4 2009 CQ3 2009 CQ2 2009 CQ1 2009
MXE-11 21-153 132m 0.52% Cu 0.11g/tAu Net Income ($MM) (0.33) (1.70) (0.88) (0.31) (0.02)
MXE-12 Cash - Operating Activities ($MM) (0.14) (0.25) (0.17) (1.41) (0.89)
MXE-13 70-113 43m 0.24% Cu 0.02g/tAu Cash - Investing Activities ($MM) - (0.00) (0.00) 0.00 0.03
MXE-14 72-87 15m 1.22% Cu 0.04g/tAu Cash - Financing Activities ($MM) 0.05 4.38 0.00 0.88 1.78
MXE-15 90-144 54m 1.11% Cu 0.25g/tAu Net Changes in Cash ($MM) (0.09) 4.13 (0.17) (0.52) 0.92
MXE-20 185-194 9m 0.37% Cu 0.06g/tAu Free Cash Flow ($MM) (0.14) (0.25) (0.17) (1.41) (0.86)
MXE-21 57-68 26m 0.65% Cu 0.20g/tAu Free Cash Flow / Diluted Sh ($) (0.00) (0.00) (0.00) (0.02) (0.02)
MXE-22 47-59 12m 0.35% Cu 0.03g/tAu Cash flow per Share ($) (0.00) (0.03) (0.00) (0.00) (0.00)
164-176 12m 0.41% Cu 0.03g/tAu Share Price Performance
MXE-23 0-38 38m 0.80% Cu 0.12g/tAu
MXE-24 54-69 15m 0.37% Cu 0.05g/tAu
MXE-30 24-52 28m 0.54% Cu 0.14g/tAu
MXE-31 26-66 40m 0.57% Cu 0.62g/tAu
MXE-32 0-6 6m 0.22% Cu 0.02g/tAu
26-28 2m 0.69% Cu
40-42 2m 0.17% Cu 1.09g/tAu
Project Locations
Project Specifics
Ownership
% Location Deposit Type
El Espino-Venus 49% Region IV, Chile PEA IOCG OP 13.5 4.7 Floatation / SX/EW
Resources Class Tonnes Grades Contained Metal
El Espino-Venus M+I 144.8 0.55% 0.22 1,756 1,024
Inferred 85.4 0.27% 0.15 508 412 Management Team
DAVID O'CONNOR, PRESIDENT & CEO
Operating Metrics Attributable Capex Operating Costs Attributable Production (avg p.a.) REBECCA HUDSON, CFO
MICHAEL SCHULER, VP OPERATIONS
Initial Sustaining US$/lb Cu* US$/t milled ANTONIO ORTUZAR JR., CHAIRMAN
El Espino-Venus 348.9 120.2 0.92 17.05 30,000 58.8 29.9 TONY WONNACOTT, GENERAL COUNSEL, CORP SECRETARY
DAVID PRINS, CHAIRMAN TECHNICIAL ADVISORY COMMITTEE
RD - Resource Definition, PEA - Preliminary Economic Assessment (Scoping Study), PFS - Prefeasibility Study, DFS - Definitive Feasibility Study Website www.explorator.ca
*By-product credits based on CIBC long term metal price forecasts
C$0.46
No Significant Results
Engineering
Completed
Mining
Method
Mine
Life (yrs)
Ratio
(w/o)
(MM)
Cu
(%)
Au
(g/t)
Cu
(MM lbs)
Throughput (tpd)
Cu
(MM lbs)
Au
(000 oz)
Recovery Method
Au
(000 oz)
0.00
0.10
0.20
0.30
0.40
0.50
0.60
0.70
0.80
F-10 A-10 J-10 A-10 O-10 D-10
.0 M
.1 M
.2 M
.3 M
.4 M
.5 M
.6 M
El Espino-Venus
The El Espino Project is located in the Illapel district 3.5 hours drive north of Santiago. The nearby town of Illapel provides excellent local infrastructure and the Project is
accessed by good quality gravel roads, is transected by a high tension power line and has abundant water supply. El Espino is in the center of an important cluster of small,
active copper and gold mines.
The El Espino Copper Project is an advanced I.O.C.G. (iron oxide copper gold) system which extends for at least 3 km long (N-S) by 2 km wide (E-W) on the El Espino block of
claims, within which numerous small and several extensive underground workings are indicative of substantial historical copper and gold production, generally from oxidized
near surface mineralization. The old gold and current operating mines within the El Espino block are almost exclusively developed on steeply dipping veins (feeder structures)
and drilling by several companies has demonstrated that there is substantial tonnage of copper-gold mineralization hosted in sub-horizontal and lithologically controlled mantos
which have been intersected by these feeders. These mantos appear to host the bulk of the mineralized tonnage outlined by previous explorers (North Ltd., Teck-Cominco, Rio
Tinto).
Modern exploration at the El Espino Copper Project commenced in early 1990's when Anaconda carried out the initial drilling. Subsequently the Project was explored by other
major international mining companies, including Rayrock Resources Inc., Goldfields, North Ltd., Anaconda Mining Co. and Teck-Cominco. Exploration has included detailed
geological mapping, geochemical sampling, geophysical surveying and 13,785 meters of drilling, which intersected up to 103 meters of 0.98% Cu and 0.10g/t Au, with
numerous intercepts averaging about 30 meters thick and grading over 1% Cu, within a much broader halo of about 0.5% Cu. Variable amounts of associated gold occur with
the copper mineralization, e.g. hole F15, with 12m at 1.05% Cu and 2.03g/t Au.
Explorator Resources Inc. is a Canadian-based mining exploration company focused on building a strong portfolio of copper-gold Projects in South America. Explorator is
initially concentrating its efforts in the mineral rich Cordillera de la Costa province. The Company's El Espino Copper Project lies within this prolific copper-gold metallic area
and is central to an important cluster of copper-gold deposits. Explorator is publicly listed and trades on the TSX Venture Exchange under the ticker symbol EXO.
Company Updates
January 27, 2011 - Explorator Announces El Espino Project 2011
Program and Budget of US$14.5 Million and Related Capital Call to
Complete Prefeasibility Study and Commence Feasibility Study - At a
shareholder meeting held on the 24th of January 2011, the shareholders of
Explorator Chile approved the Project's 2011 Program and Budget. The
2011 Program and Budget totals US$14.5 million and includes the following
key activities: -- Completion of a Pre-Feasibility Study in Q3 2011; -- 25,000
meters of diamond drilling for 2011, of which about 30% will be in the core
Rachel and Chon Chon zones and the remaining 70% directed in the
peripheral zones; -- Additional Metallurgical test work; -- Other related
technical engineering studies; -- Advancing Social aspects of the project; --
Commence Feasibility Study on completion and approval of the Pre-
Feasibility study, scheduled for completion in Q3, 2012; -- Environmental
Impact Study to be submitted on completion of the Pre-Feasibility Study.
January 24, 2011 - Explorator Announces Highlights From the 2011 El
Espino Updated Preliminary Economic Assessment-NPV of US$529
Million and IRR of 24.4% - Highlights from an updated NI 43-101 compliant
Preliminary Economic Assessment Technical Report on the El Espino
project that has been undertaken on its behalf by AMEC International.
Highlights from 2011 AMEC Report:
After-tax NPV (8%) and IRR: Base Case NPV8 of $529 million and 24.4%
IRR, using long-term prices reverting to $2.40/lb copper and $1,000/oz. gold
($2.61/lb Cu or $2.62/lb including copper cathode premium and$1,059/oz Au
average prices over the life of mine); $341 million NPV8 and 18.2% IRR at a
flat prices of $2.40/lb Cu and $1,000/oz Au.
Mine Plan: Total payable LOM production increases to 1,621 million lbs Cu
and 828,000 oz Au, from 1,467 million lbs and 755,000 oz. Au. Average
annual payable production increases to 120 million lbs Cu and 61,000 oz Au
over 13.5 years; from 79 million lbs and 40,000 oz over 19 years. Average
annual production in Years 1-3 of 134 million lbs Cu and 71,000 oz. Au.--
LOM Cash Costs: Base Case of $1.02/lb Cu from $1.06/lb, net of Au credit
at an average of $1,059/oz. and $680/oz. respectively. Average Cash Cost
for Years 1-3 of $0.66/lb, net of gold credit.
Process Flow Sheet: Differential flotation of oxides and sulphides
followed by leaching of the oxide concentrate and SX-EW of copper oxide
material; similar to 2009 Micon Report. Plant processing capacity increased
to 30,000 tpd, from 17,500 tpd. Gold in the sulphides is recovered in a
copper-gold concentrate. Gold in the oxides and in a separate high-grade
gold mineralization is recovered by gravity concentration and cyanide
leaching of the oxide concentrate.
Recoveries: Cu recoveries of 93% for sulphides and 79% for oxides; Au
recoveries of 80% for sulphides and oxides and 95% for high grade gold
material; compares to Cu recoveries of 95% for sulphides and 45% for
oxides and Au recoveries of 46% for sulphides, 68% for oxides and 83% for
high grade gold material in the 2009 Micon Report.
Capital costs: increase from $434 million to $712 million, including direct
costs, indirect costs, owners costs, contingency and pre-production working
capital.
Source: Company reports.
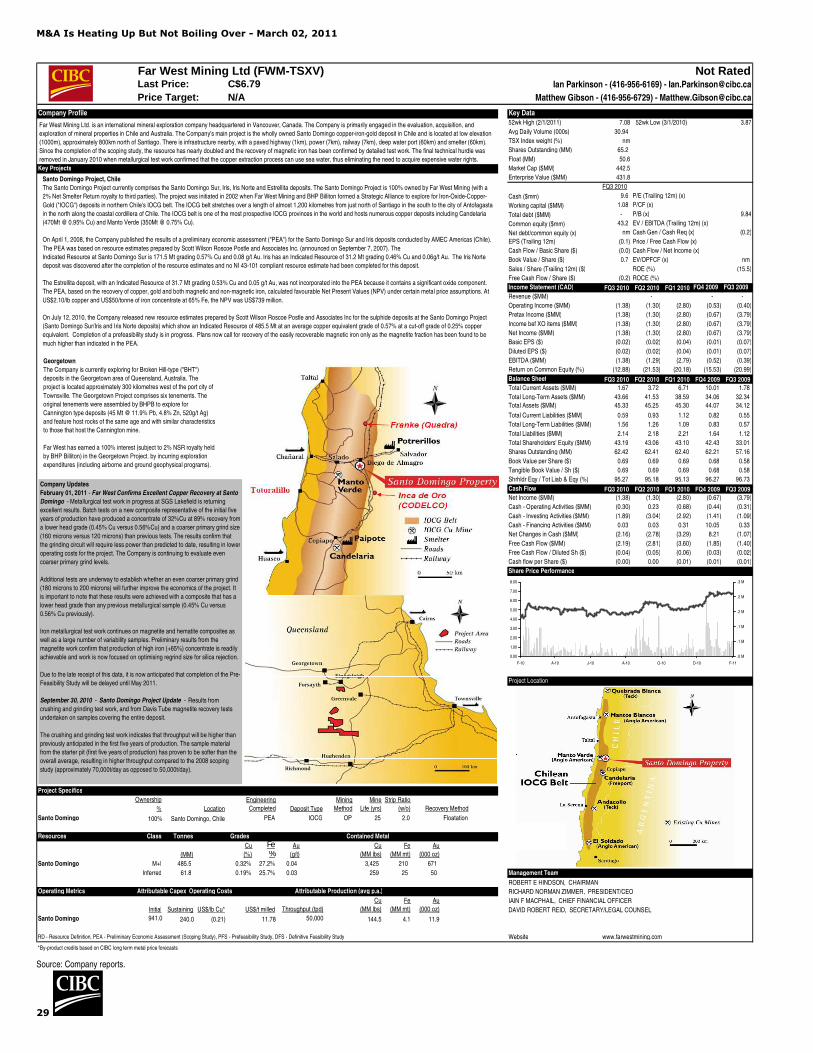
M&A Is Heating Up But Not Boiling Over - March 02, 2011
29
Far West Mining Ltd (FWM-TSXV) Not RatedLast Price: Ian Parkinson - (416-956-6169) - [email protected]
Price Target: N/A Matthew Gibson - (416-956-6729) - [email protected]
Company Profile Key Data52wk High (2/1/2011) 7.08 52wk Low (3/1/2010) 3.87
Avg Daily Volume (000s) 30.94
TSX Index weight (%) nm
Shares Outstanding (MM) 65.2
Float (MM) 50.6
Key Projects Market Cap ($MM) 442.5
Enterprise Value ($MM) 431.8
FQ3 2010
Cash ($mm) 9.6 P/E (Trailing 12m) (x) #N/A N/A
Working capital ($MM) 1.08 P/CF (x) #N/A N/A
Total debt ($MM) - P/B (x) 9.84
Common equity ($mm) 43.2 EV / EBITDA (Trailing 12m) (x) #N/A N/A
Net debt/common equity (x) nm Cash Gen / Cash Req (x) (0.2)
EPS (Trailing 12m) (0.1) Price / Free Cash Flow (x) #N/A N/A
Cash Flow / Basic Share ($) (0.0) Cash Flow / Net Income (x) #N/A N/A
Book Value / Share ($) 0.7 EV/OPFCF (x) nm
Sales / Share (Trailing 12m) ($) #N/A N/A ROE (%) (15.5)
Free Cash Flow / Share ($) (0.2) ROCE (%) #N/A N/A
Income Statement (CAD) FQ3 2010 FQ2 2010 FQ1 2010 FQ4 2009 FQ3 2009
Revenue ($MM) #N/A N/A - #N/A N/A - -
Operating Income ($MM) (1.38) (1.30) (2.80) (0.53) (0.40)
Pretax Income ($MM) (1.38) (1.30) (2.80) (0.67) (3.79)
Income bef XO items ($MM) (1.38) (1.30) (2.80) (0.67) (3.79)
Net Income ($MM) (1.38) (1.30) (2.80) (0.67) (3.79)
Basic EPS ($) (0.02) (0.02) (0.04) (0.01) (0.07)
Diluted EPS ($) (0.02) (0.02) (0.04) (0.01) (0.07)
EBITDA ($MM) (1.38) (1.29) (2.79) (0.52) (0.39)
Return on Common Equity (%) (12.88) (21.53) (20.18) (15.53) (20.99)
Balance Sheet FQ3 2010 FQ2 2010 FQ1 2010 FQ4 2009 FQ3 2009Total Current Assets ($MM) 1.67 3.72 6.71 10.01 1.78
Total Long-Term Assets ($MM) 43.66 41.53 38.59 34.06 32.34
Total Assets ($MM) 45.33 45.25 45.30 44.07 34.12
Total Current Liabilities ($MM) 0.59 0.93 1.12 0.82 0.55
Total Long-Term Liabilities ($MM) 1.56 1.26 1.09 0.83 0.57
Total Liabilities ($MM) 2.14 2.18 2.21 1.64 1.12
Total Shareholders' Equity ($MM) 43.19 43.06 43.10 42.43 33.01
Shares Outstanding (MM) 62.42 62.41 62.40 62.21 57.16
Book Value per Share ($) 0.69 0.69 0.69 0.68 0.58
Tangible Book Value / Sh ($) 0.69 0.69 0.69 0.68 0.58
Shrhldr Eqy / Tot Liab & Eqy (%) 95.27 95.18 95.13 96.27 96.73
Cash Flow FQ3 2010 FQ2 2010 FQ1 2010 FQ4 2009 FQ3 2009Net Income ($MM) (1.38) (1.30) (2.80) (0.67) (3.79)
Cash - Operating Activities ($MM) (0.30) 0.23 (0.68) (0.44) (0.31)
Cash - Investing Activities ($MM) (1.89) (3.04) (2.92) (1.41) (1.09)
Cash - Financing Activities ($MM) 0.03 0.03 0.31 10.05 0.33
Net Changes in Cash ($MM) (2.16) (2.78) (3.29) 8.21 (1.07)
Free Cash Flow ($MM) (2.19) (2.81) (3.60) (1.85) (1.40)
Free Cash Flow / Diluted Sh ($) (0.04) (0.05) (0.06) (0.03) (0.02)
Cash flow per Share ($) (0.00) 0.00 (0.01) (0.01) (0.01)
Share Price Performance
Project Location
Project Specifics
Ownership
% Location Deposit Type
Santo Domingo 100% Santo Domingo, Chile PEA IOCG OP 25 2.0 Floatation
Resources Class Tonnes Grades Contained Metal
Fe(MM) %
Santo Domingo M+I 485.5 0.32% 27.2% 0.04 3,425 210 671
Inferred 61.8 0.19% 25.7% 0.03 259 25 50 Management Team
ROBERT E HINDSON, CHAIRMAN
Operating Metrics Attributable Capex Operating Costs Attributable Production (avg p.a.) RICHARD NORMAN ZIMMER, PRESIDENT/CEO
IAIN F MACPHAIL, CHIEF FINANCIAL OFFICER
Initial Sustaining US$/lb Cu* US$/t milled DAVID ROBERT REID, SECRETARY/LEGAL COUNSEL
Santo Domingo 240.0 (0.21) 11.78 144.5 4.1 11.9
RD - Resource Definition, PEA - Preliminary Economic Assessment (Scoping Study), PFS - Prefeasibility Study, DFS - Definitive Feasibility Study Website www.farwestmining.com
*By-product credits based on CIBC long term metal price forecasts
Cu
(MM lbs)
Fe
(MM mt)
Au
(000 oz)
Cu
(%)
Au
(g/t)
Cu
(MM lbs)
Recovery Method
Fe
(MM mt)
Engineering
Completed
Mining
Method
Mine
Life (yrs)
Strip Ratio
(w/o)
Au
(000 oz)
C$6.79
Throughput (tpd)
50,000 941.0
Far West Mining Ltd. is an international mineral exploration company headquartered in Vancouver, Canada. The Company is primarily engaged in the evaluation, acquisition, and
exploration of mineral properties in Chile and Australia. The Company's main project is the wholly owned Santo Domingo copper-iron-gold deposit in Chile and is located at low elevation
(1000m), approximately 800km north of Santiago. There is infrastructure nearby, with a paved highway (1km), power (7km), railway (7km), deep water port (60km) and smelter (60km).
Since the completion of the scoping study, the resource has nearly doubled and the recovery of magnetic iron has been confirmed by detailed test work. The final technical hurdle was
removed in January 2010 when metallurgical test work confirmed that the copper extraction process can use sea water, thus eliminating the need to acquire expensive water rights.
0.00
1.00
2.00
3.00
4.00
5.00
6.00
7.00
8.00
F-10 A-10 J-10 A-10 O-10 D-10 F-11
.0 M
.1 M
.1 M
.2 M
.2 M
.3 M
Santo Domingo Project, Chile
The Santo Domingo Project currently comprises the Santo Domingo Sur, Iris, Iris Norte and Estrellita deposits. The Santo Domingo Project is 100% owned by Far West Mining (with a
2% Net Smelter Return royalty to third parties). The project was initiated in 2002 when Far West Mining and BHP Billiton formed a Strategic Alliance to explore for Iron-Oxide-Copper-
Gold ("IOCG") deposits in northern Chile's IOCG belt. The IOCG belt stretches over a length of almost 1,200 kilometres from just north of Santiago in the south to the city of Antofagasta
in the north along the coastal cordillera of Chile. The IOCG belt is one of the most prospective IOCG provinces in the world and hosts numerous copper deposits including Candelaria
(470Mt @ 0.95% Cu) and Manto Verde (350Mt @ 0.75% Cu).
On April 1, 2008, the Company published the results of a preliminary economic assessment ("PEA") for the Santo Domingo Sur and Iris deposits conducted by AMEC Americas (Chile).
The PEA was based on resource estimates prepared by Scott Wilson Roscoe Postle and Associates Inc. (announced on September 7, 2007). The
Indicated Resource at Santo Domingo Sur is 171.5 Mt grading 0.57% Cu and 0.08 g/t Au. Iris has an Indicated Resource of 31.2 Mt grading 0.46% Cu and 0.06g/t Au. The Iris Norte
deposit was discovered after the completion of the resource estimates and no NI 43-101 compliant resource estimate had been completed for this deposit.
The Estrellita deposit, with an Indicated Resource of 31.7 Mt grading 0.53% Cu and 0.05 g/t Au, was not incorporated into the PEA because it contains a significant oxide component.
The PEA, based on the recovery of copper, gold and both magnetic and non-magnetic iron, calculated favourable Net Present Values (NPV) under certain metal price assumptions. At
US$2.10/lb copper and US$50/tonne of iron concentrate at 65% Fe, the NPV was US$739 million.
On July 12, 2010, the Company released new resource estimates prepared by Scott Wilson Roscoe Postle and Associates Inc for the sulphide deposits at the Santo Domingo Project
(Santo Domingo Sur/Iris and Iris Norte deposits) which show an Indicated Resource of 485.5 Mt at an average copper equivalent grade of 0.57% at a cut-off grade of 0.25% copper
equivalent. Completion of a prefeasibility study is in progress. Plans now call for recovery of the easily recoverable magnetic iron only as the magnetite fraction has been found to be
much higher than indicated in the PEA.
Georgetown
The Company is currently exploring for Broken Hill-type ("BHT")
deposits in the Georgetown area of Queensland, Australia. The
project is located approximately 300 kilometres west of the port city of
Townsville. The Georgetown Project comprises six tenements. The
original tenements were assembled by BHPB to explore for
Cannington type deposits (45 Mt @ 11.9% Pb, 4.8% Zn, 520g/t Ag)
and feature host rocks of the same age and with similar characteristics
to those that host the Cannington mine.
Far West has earned a 100% interest (subject to 2% NSR royalty held
by BHP Billiton) in the Georgetown Project. by incurring exploration
expenditures (including airborne and ground geophysical programs).
Company Updates
February 01, 2011 - Far West Confirms Excellent Copper Recovery at Santo
Domingo - Metallurgical test work in progress at SGS Lakefield is returning
excellent results. Batch tests on a new composite representative of the initial five
years of production have produced a concentrate of 32%Cu at 89% recovery from
a lower head grade (0.45% Cu versus 0.56%Cu) and a coarser primary grind size
(160 microns versus 120 microns) than previous tests. The results confirm that
the grinding circuit will require less power than predicted to date, resulting in lower
operating costs for the project. The Company is continuing to evaluate even
coarser primary grind levels.
Additional tests are underway to establish whether an even coarser primary grind
(180 microns to 200 microns) will further improve the economics of the project. It
is important to note that these results were achieved with a composite that has a
lower head grade than any previous metallurgical sample (0.45% Cu versus
0.56% Cu previously).
Iron metallurgical test work continues on magnetite and hematite composites as
well as a large number of variability samples. Preliminary results from the
magnetite work confirm that production of high iron (+65%) concentrate is readily
achievable and work is now focused on optimising regrind size for silica rejection.
Due to the late receipt of this data, it is now anticipated that completion of the Pre-
Feasibility Study will be delayed until May 2011.
September 30, 2010 - Santo Domingo Project Update - Results from
crushing and grinding test work, and from Davis Tube magnetite recovery tests
undertaken on samples covering the entire deposit.
The crushing and grinding test work indicates that throughput will be higher than
previously anticipated in the first five years of production. The sample material
from the starter pit (first five years of production) has proven to be softer than the
overall average, resulting in higher throughput compared to the 2008 scoping
study (approximately 70,000t/day as opposed to 50,000t/day).
Source: Company reports.
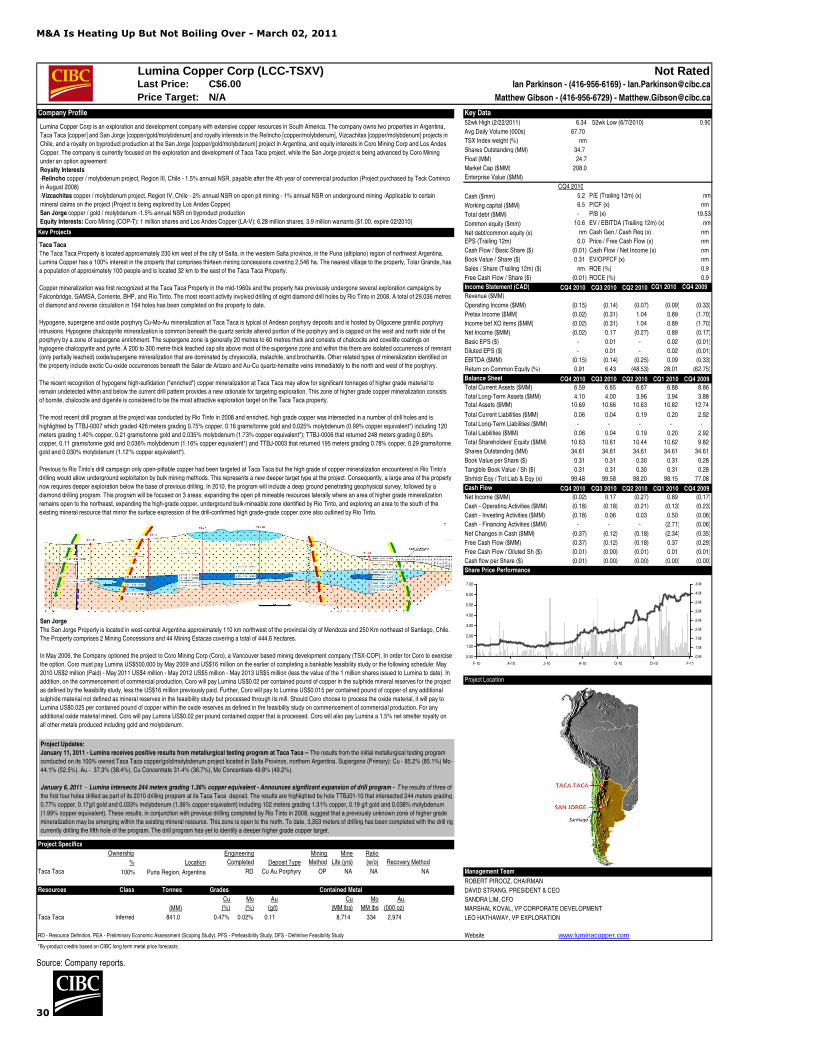
M&A Is Heating Up But Not Boiling Over - March 02, 2011
30
Lumina Copper Corp (LCC-TSXV) Not RatedLast Price: Ian Parkinson - (416-956-6169) - [email protected]
Price Target: N/A Matthew Gibson - (416-956-6729) - [email protected]
Company Profile Key Data
52wk High (2/22/2011) 6.34 52wk Low (6/7/2010) 0.90
Avg Daily Volume (000s) 67.70
TSX Index weight (%) nm
Shares Outstanding (MM) 34.7
Float (MM) 24.7
Market Cap ($MM) 208.0
Enterprise Value ($MM) #N/A N/A
CQ4 2010
Cash ($mm) 5.2 P/E (Trailing 12m) (x) nm
Working capital ($MM) 6.5 P/CF (x) nm
Total debt ($MM) - P/B (x) 19.53
Common equity ($mm) 10.6 EV / EBITDA (Trailing 12m) (x) nm
Key Projects Net debt/common equity (x) nm Cash Gen / Cash Req (x) nm
EPS (Trailing 12m) 0.0 Price / Free Cash Flow (x) nm
Cash Flow / Basic Share ($) (0.01) Cash Flow / Net Income (x) nm
Book Value / Share ($) 0.31 EV/OPFCF (x) nm
Sales / Share (Trailing 12m) ($) nm ROE (%) 0.9
Free Cash Flow / Share ($) (0.01) ROCE (%) 0.9
Income Statement (CAD) CQ4 2010 CQ3 2010 CQ2 2010 CQ1 2010 CQ4 2009
Revenue ($MM) #N/A N/A #N/A N/A #N/A N/A #N/A N/A #N/A N/A
Operating Income ($MM) (0.15) (0.14) (0.07) (0.09) (0.33)
Pretax Income ($MM) (0.02) (0.31) 1.04 0.89 (1.70)
Income bef XO items ($MM) (0.02) (0.31) 1.04 0.89 (1.70)
Net Income ($MM) (0.02) 0.17 (0.27) 0.89 (0.17)
Basic EPS ($) - 0.01 - 0.02 (0.01)
Diluted EPS ($) - 0.01 - 0.02 (0.01)
EBITDA ($MM) (0.15) (0.14) (0.25) 0.09 (0.33)
Return on Common Equity (%) 0.91 6.43 (48.53) 28.01 (62.75)
Balance Sheet CQ4 2010 CQ3 2010 CQ2 2010 CQ1 2010 CQ4 2009Total Current Assets ($MM) 6.59 6.65 6.67 6.88 8.86
Total Long-Term Assets ($MM) 4.10 4.00 3.96 3.94 3.88 Total Assets ($MM) 10.69 10.66 10.63 10.82 12.74
Total Current Liabilities ($MM) 0.06 0.04 0.19 0.20 2.92
Total Long-Term Liabilities ($MM) - - - - -
Total Liabilities ($MM) 0.06 0.04 0.19 0.20 2.92
Total Shareholders' Equity ($MM) 10.63 10.61 10.44 10.62 9.82
Shares Outstanding (MM) 34.61 34.61 34.61 34.61 34.61
Book Value per Share ($) 0.31 0.31 0.30 0.31 0.28
Tangible Book Value / Sh ($) 0.31 0.31 0.30 0.31 0.28
Shrhldr Eqy / Tot Liab & Eqy (x) 99.48 99.58 98.20 98.15 77.08
Cash Flow CQ4 2010 CQ3 2010 CQ2 2010 CQ1 2010 CQ4 2009
Net Income ($MM) (0.02) 0.17 (0.27) 0.89 (0.17)
Cash - Operating Activities ($MM) (0.18) (0.18) (0.21) (0.13) (0.23)
Cash - Investing Activities ($MM) (0.18) 0.06 0.03 0.50 (0.06)
Cash - Financing Activities ($MM) - - - (2.71) (0.06)
Net Changes in Cash ($MM) (0.37) (0.12) (0.18) (2.34) (0.35)
Free Cash Flow ($MM) (0.37) (0.12) (0.18) 0.37 (0.29)
Free Cash Flow / Diluted Sh ($) (0.01) (0.00) (0.01) 0.01 (0.01)
Cash flow per Share ($) (0.01) (0.00) (0.00) (0.00) (0.00)
Share Price Performance
Project Location
Project Specifics
Ownership
% Location Deposit Type
Taca Taca 100% Puna Region, Argentina RD Cu Au Porphyry OP NA NA NA Management Team
ROBERT PIROOZ, CHAIRMAN
Resources Class Tonnes Grades Contained Metal DAVID STRANG, PRESIDENT & CEO
SANDRA LIM, CFO
(MM) MARSHAL KOVAL, VP CORPORATE DEVELOPMENT
Taca Taca Inferred 841.0 0.47% 0.02% 0.11 8,714 334 2,974 LEO HATHAWAY, VP EXPLORATION
RD - Resource Definition, PEA - Preliminary Economic Assessment (Scoping Study), PFS - Prefeasibility Study, DFS - Definitive Feasibility Study Website www.luminacopper.com
*By-product credits based on CIBC long term metal price forecasts
Mine
Life (yrs)
Ratio
(w/o) Recovery Method
Cu
(%)
Mo
(%)
Au
(g/t)
Cu
(MM lbs)
Mo
MM lbs
Au
(000 oz)
C$6.00
Engineering
Completed
Mining
Method
Taca Taca
The Taca Taca Property is located approximately 230 km west of the city of Salta, in the western Salta province, in the Puna (altiplano) region of northwest Argentina.
Lumina Copper has a 100% interest in the property that comprises thirteen mining concessions covering 2,546 ha. The nearest village to the property, Tolar Grande, has
a population of approximately 100 people and is located 32 km to the east of the Taca Taca Property.
Copper mineralization was first recognized at the Taca Taca Property in the mid-1960s and the property has previously undergone several exploration campaigns by
Falconbridge, GAMSA, Corriente, BHP, and Río Tinto. The most recent activity involved drilling of eight diamond drill holes by Rio Tinto in 2008. A total of 29,036 metres
of diamond and reverse circulation in 164 holes has been completed on the property to date.
Hypogene, supergene and oxide porphyry Cu-Mo-Au mineralization at Taca Taca is typical of Andean porphyry deposits and is hosted by Oligocene granitic porphyry
intrusions. Hypogene chalcopyrite mineralization is common beneath the quartz sericite altered portion of the porphyry and is capped on the west and north side of the
porphyry by a zone of supergene enrichment. The supergene zone is generally 20 metres to 60 metres thick and consists of chalcocite and covellite coatings on
hypogene chalcopyrite and pyrite. A 200 to 300 metre thick leached cap sits above most of the supergene zone and within this there are isolated occurrences of remnant
(only partially leached) oxide/supergene mineralization that are dominated by chrysocolla, malachite, and brochantite. Other related types of mineralization identified on
the property include exotic Cu-oxide occurrences beneath the Salar de Arizaro and Au-Cu quartz-hematite veins immediately to the north and west of the porphyry.
The recent recognition of hypogene high-sulfidation ("enriched") copper mineralization at Taca Taca may allow for significant tonnages of higher grade material to
remain undetected within and below the current drill pattern provides a new rationale for targeting exploration. This zone of higher grade copper mineralization consists
of bornite, chalcocite and digenite is considered to be the most attractive exploration target on the Taca Taca property.
The most recent drill program at the project was conducted by Rio Tinto in 2008 and enriched, high grade copper was intersected in a number of drill holes and is
highlighted by TTBJ-0007 which graded 426 meters grading 0.75% copper, 0.16 grams/tonne gold and 0.025% molybdenum (0.99% copper equivalent*) including 120
meters grading 1.40% copper, 0.21 grams/tonne gold and 0.035% molybdenum (1.73% copper equivalent*); TTBJ-0006 that returned 248 meters grading 0.89%
copper, 0.11 grams/tonne gold and 0.036% molybdenum (1.16% copper equivalent*) and TTBJ-0003 that returned 195 meters grading 0.78% copper, 0.29 grams/tonne
gold and 0.030% molybdenum (1.12'% copper equivalent*).
Previous to Rio Tinto's drill campaign only open-pittable copper had been targeted at Taca Taca but the high grade of copper mineralization encountered in Rio Tinto's
drilling would allow underground exploitation by bulk mining methods. This represents a new deeper target type at the project. Consequently, a large area of the property
now requires deeper exploration below the base of previous drilling. In 2010, the program will include a deep ground penetrating geophysical survey, followed by a
diamond drilling program. This program will be focused on 3 areas: expanding the open pit mineable resources laterally where an area of higher grade mineralization
remains open to the northeast, expanding the high-grade copper, underground bulk-mineable zone identified by Rio Tinto, and exploring an area to the south of the
existing mineral resource that mirror the surface expression of the drill-confirmed high grade-grade copper zone also outlined by Rio Tinto.
Lumina Copper Corp is an exploration and development company with extensive copper resources in South America. The company owns two properties in Argentina,
Taca Taca [copper] and San Jorge [copper/gold/molybdenum] and royalty interests in the Relincho [copper/molybdenum], Vizcachitas [copper/molybdenum] projects in
Chile, and a royalty on byproduct production at the San Jorge [copper/gold/molybdenum] project in Argentina, and equity interests in Coro Mining Corp and Los Andes
Copper. The company is currently focused on the exploration and development of Taca Taca project, while the San Jorge project is being advanced by Coro Mining
under an option agreement
Royalty Interests
-Relincho copper / molybdenum project, Region III, Chile - 1.5% annual NSR, payable after the 4th year of commercial production (Project purchased by Teck Cominco
in August 2008)
-Vizcachitas copper / molybdenum project, Region IV, Chile - 2% annual NSR on open pit mining - 1% annual NSR on underground mining -Applicable to certain
mineral claims on the project (Project is being explored by Los Andes Copper)
San Jorge copper / gold / molybdenum -1.5% annual NSR on byproduct production
Equity Interests: Coro Mining (COP-T): 1 million shares and Los Andes Copper (LA-V): 6.28 million shares, 3.9 million warrants ($1.00, expire 02/2010)
0.00
1.00
2.00
3.00
4.00
5.00
6.00
7.00
F-10 A-10 J-10 A-10 O-10 D-10 F-11
.0 M
.1 M
.1 M
.2 M
.2 M
.3 M
.3 M
.4 M
.4 M
San Jorge
The San Jorge Property is located in west-central Argentina approximately 110 km northwest of the provincial city of Mendoza and 250 Km northeast of Santiago, Chile.
The Property comprises 2 Mining Concessions and 44 Mining Estacas covering a total of 444.6 hectares.
In May 2006, the Company optioned the project to Coro Mining Corp (Coro), a Vancouver based mining development company (TSX-COP). In order for Coro to exercise
the option, Coro must pay Lumina US$500,000 by May 2009 and US$16 million on the earlier of completing a bankable feasibility study or the following schedule: May
2010 US$2 million (Paid) - May 2011 US$4 million - May 2012 US$5 million - May 2013 US$5 million (less the value of the 1 million shares issued to Lumina to date). In
addition, on the commencement of commercial production, Coro will pay Lumina US$0.02 per contained pound of copper in the sulphide mineral reserves for the project
as defined by the feasibility study, less the US$16 million previously paid. Further, Coro will pay to Lumina US$0.015 per contained pound of copper of any additional
sulphide material not defined as mineral reserves in the feasibility study but processed through its mill. Should Coro choose to process the oxide material, it will pay to
Lumina US$0.025 per contained pound of copper within the oxide reserves as defined in the feasibility study on commencement of commercial production. For any
additional oxide material mined, Coro will pay Lumina US$0.02 per pound contained copper that is processed. Coro will also pay Lumina a 1.5% net smelter royalty on
all other metals produced including gold and molybdenum.
Project Updates:
January 11, 2011 - Lumina receives positive results from metallurgical testing program at Taca Taca -- The results from the initial metallurgical testing program
conducted on its 100% owned Taca Taca copper/gold/molybdenum project located in Salta Province, northern Argentina. Supergene (Primary): Cu - 85.2% (85.1%) Mo -
44.1% (52.5%), Au - 37.3% (38.4%), Cu Concentrate 31.4% (36.7%), Mo Concentrate 49.8% (49.2%).
January 6, 2011 - Lumina intersects 244 meters grading 1.36% copper equivalent - Announces significant expansion of drill program - T he results of three of
the first four holes drilled as part of its 2010 drilling program at its Taca Taca deposit. The results are highlighted by hole TTBJ01-10 that intersected 244 meters grading
0.77% copper, 0.17g/t gold and 0.033% molybdenum (1.36% copper equivalent) including 102 meters grading 1.31% copper, 0.19 g/t gold and 0.038% molybdenum
(1.99% copper equivalent). These results, in conjunction with previous drilling completed by Rio Tinto in 2008, suggest that a previously unknown zone of higher grade
mineralization may be emerging within the existing mineral resource. This zone is open to the north. To date, 3,353 meters of drilling has been completed with the drill rig
currently drilling the fifth hole of the program. The drill program has yet to identify a deeper higher grade copper target.
Source: Company reports.
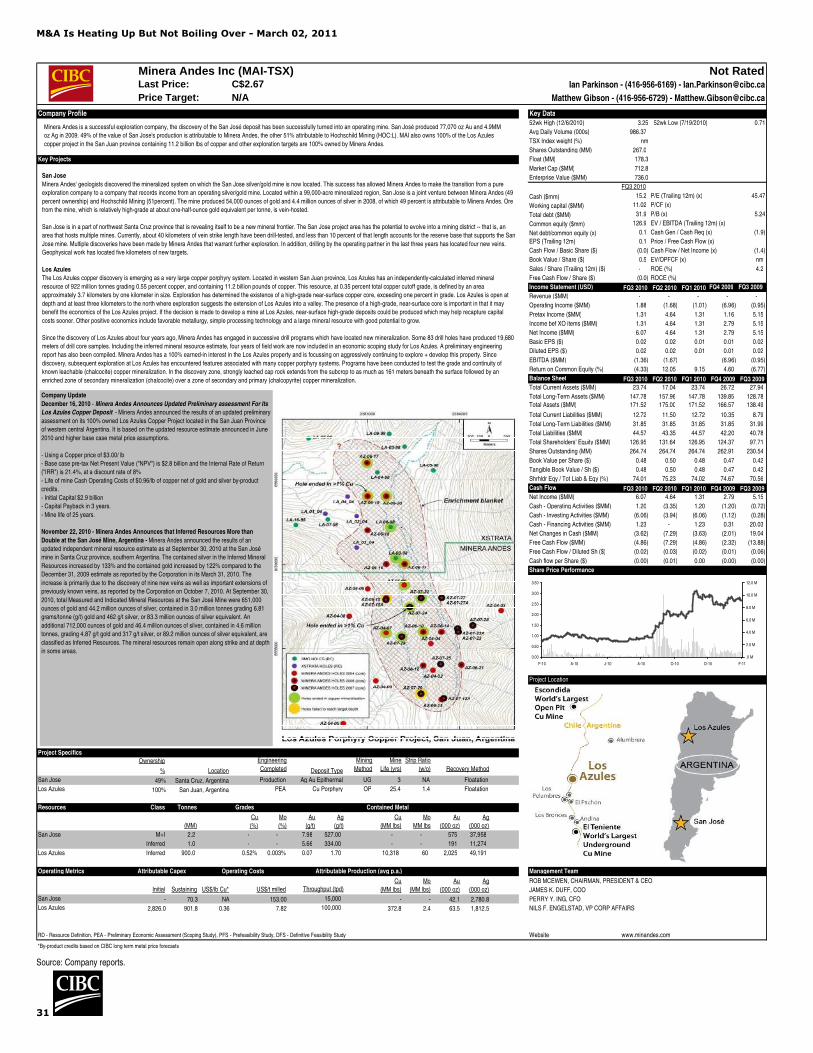
M&A Is Heating Up But Not Boiling Over - March 02, 2011
31
Minera Andes Inc (MAI-TSX) Not RatedLast Price: Ian Parkinson - (416-956-6169) - [email protected]
Price Target: N/A Matthew Gibson - (416-956-6729) - [email protected]
Company Profile Key Data52wk High (12/6/2010) 3.25 52wk Low (7/19/2010) 0.71
Avg Daily Volume (000s) 986.37
TSX Index weight (%) nm
Shares Outstanding (MM) 267.0
Key Projects Float (MM) 178.3
Market Cap ($MM) 712.8
Enterprise Value ($MM) 736.0
FQ3 2010
Cash ($mm) 15.2 P/E (Trailing 12m) (x) 45.47
Working capital ($MM) 11.02 P/CF (x) #N/A N/A
Total debt ($MM) 31.9 P/B (x) 5.24
Common equity ($mm) 126.9 EV / EBITDA (Trailing 12m) (x) #N/A N/A
Net debt/common equity (x) 0.1 Cash Gen / Cash Req (x) (1.9)
EPS (Trailing 12m) 0.1 Price / Free Cash Flow (x) #N/A N/A
Cash Flow / Basic Share ($) (0.0) Cash Flow / Net Income (x) (1.4)
Book Value / Share ($) 0.5 EV/OPFCF (x) nm
Sales / Share (Trailing 12m) ($) - ROE (%) 4.2
Free Cash Flow / Share ($) (0.0) ROCE (%) #N/A N/A
Income Statement (USD) FQ3 2010 FQ2 2010 FQ1 2010 FQ4 2009 FQ3 2009
Revenue ($MM) - - - - -
Operating Income ($MM) 1.88 (1.68) (1.01) (6.96) (0.95)
Pretax Income ($MM) 1.31 4.64 1.31 1.16 5.15
Income bef XO items ($MM) 1.31 4.64 1.31 2.79 5.15
Net Income ($MM) 6.07 4.64 1.31 2.79 5.15
Basic EPS ($) 0.02 0.02 0.01 0.01 0.02
Diluted EPS ($) 0.02 0.02 0.01 0.01 0.02
EBITDA ($MM) (1.36) (1.67) #N/A N/A (6.96) (0.95)
Return on Common Equity (%) (4.33) 12.05 9.15 4.60 (6.77)
Balance Sheet FQ3 2010 FQ2 2010 FQ1 2010 FQ4 2009 FQ3 2009
Total Current Assets ($MM) 23.74 17.04 23.74 26.72 27.94
Total Long-Term Assets ($MM) 147.78 157.96 147.78 139.85 128.78
Total Assets ($MM) 171.52 175.00 171.52 166.57 138.49
Total Current Liabilities ($MM) 12.72 11.50 12.72 10.35 8.79
Total Long-Term Liabilities ($MM) 31.85 31.85 31.85 31.85 31.99
Total Liabilities ($MM) 44.57 43.35 44.57 42.20 40.78
Total Shareholders' Equity ($MM) 126.95 131.64 126.95 124.37 97.71
Shares Outstanding (MM) 264.74 264.74 264.74 262.91 230.54
Book Value per Share ($) 0.48 0.50 0.48 0.47 0.42
Tangible Book Value / Sh ($) 0.48 0.50 0.48 0.47 0.42
Shrhldr Eqy / Tot Liab & Eqy (%) 74.01 75.23 74.02 74.67 70.56
Cash Flow FQ3 2010 FQ2 2010 FQ1 2010 FQ4 2009 FQ3 2009
Net Income ($MM) 6.07 4.64 1.31 2.79 5.15
Cash - Operating Activities ($MM) 1.20 (3.35) 1.20 (1.20) (0.72)
Cash - Investing Activities ($MM) (6.06) (3.94) (6.06) (1.12) (0.28)
Cash - Financing Activities ($MM) 1.23 - 1.23 0.31 20.03
Net Changes in Cash ($MM) (3.62) (7.29) (3.63) (2.01) 19.04
Free Cash Flow ($MM) (4.86) (7.29) (4.86) (2.32) (13.88)
Free Cash Flow / Diluted Sh ($) (0.02) (0.03) (0.02) (0.01) (0.06)
Cash flow per Share ($) (0.00) (0.01) 0.00 (0.00) (0.00)
Share Price Performance
Project Location
Project Specifics
Ownership
% Location Deposit Type
San Jose 49% Santa Cruz, Argentina Production Ag Au Epithermal UG 3 NA Floatation
Los Azules 100% San Juan, Argentina PEA Cu Porphyry OP 25.4 1.4 Floatation
Resources Class Tonnes Grades Contained Metal
(MM)
San Jose M+I 2.2 - - 7.98 527.00 - - 575 37,958
Inferred 1.0 - - 5.66 334.00 - - 191 11,274
Los Azules Inferred 900.0 0.52% 0.003% 0.07 1.70 10,318 60 2,025 49,191
Operating Metrics Attributable Capex Attributable Production (avg p.a.) Management Team
ROB MCEWEN, CHAIRMAN, PRESIDENT & CEO
Initial Sustaining US$/lb Cu* US$/t milled JAMES K. DUFF, COO
San Jose - 70.3 NA 153.00 15,000 - - 42.1 2,780.8 PERRY Y. ING, CFO
Los Azules 2,826.0 901.8 0.36 7.82 372.8 2.4 63.5 1,812.5 NILS F. ENGELSTAD, VP CORP AFFAIRS
RD - Resource Definition, PEA - Preliminary Economic Assessment (Scoping Study), PFS - Prefeasibility Study, DFS - Definitive Feasibility Study Website www.minandes.com
*By-product credits based on CIBC long term metal price forecasts
C$2.67
Throughput (tpd)Cu
(MM lbs)
Mo
(MM lbs)
Operating Costs
100,000
Au
(000 oz)
Ag
(000 oz)
Mining
Method
Mine
Life (yrs)
Strip Ratio
(w/o) Recovery Method
Cu
(%)
Mo
(%)
Au
(g/t)
Ag
(g/t)
Cu
(MM lbs)
Mo
MM lbs
Au
(000 oz)
Ag
(000 oz)
Engineering
Completed
San Jose
Minera Andes' geologists discovered the mineralized system on which the San Jose silver/gold mine is now located. This success has allowed Minera Andes to make the transition from a pure
exploration company to a company that records income from an operating silver/gold mine. Located within a 99,000-acre mineralized region, San Jose is a joint venture between Minera Andes (49
percent ownership) and Hochschild Mining (51percent). The mine produced 54,000 ounces of gold and 4.4 million ounces of silver in 2008, of which 49 percent is attributable to Minera Andes. Ore
from the mine, which is relatively high-grade at about one-half-ounce gold equivalent per tonne, is vein-hosted.
San Jose is in a part of northwest Santa Cruz province that is revealing itself to be a new mineral frontier. The San Jose project area has the potential to evolve into a mining district -- that is, an
area that hosts multiple mines. Currently, about 40 kilometers of vein strike length have been drill-tested, and less than 10 percent of that length accounts for the reserve base that supports the San
Jose mine. Multiple discoveries have been made by Minera Andes that warrant further exploration. In addition, drilling by the operating partner in the last three years has located four new veins.
Geophysical work has located five kilometers of new targets.
Los Azules
The Los Azules copper discovery is emerging as a very large copper porphyry system. Located in western San Juan province, Los Azules has an independently-calculated inferred mineral
resource of 922 million tonnes grading 0.55 percent copper, and containing 11.2 billion pounds of copper. This resource, at 0.35 percent total copper cutoff grade, is defined by an area
approximately 3.7 kilometers by one kilometer in size. Exploration has determined the existence of a high-grade near-surface copper core, exceeding one percent in grade. Los Azules is open at
depth and at least three kilometers to the north where exploration suggests the extension of Los Azules into a valley. The presence of a high-grade, near-surface core is important in that it may
benefit the economics of the Los Azules project. If the decision is made to develop a mine at Los Azules, near-surface high-grade deposits could be produced which may help recapture capital
costs sooner. Other positive economics include favorable metallurgy, simple processing technology and a large mineral resource with good potential to grow.
Since the discovery of Los Azules about four years ago, Minera Andes has engaged in successive drill programs which have located new mineralization. Some 83 drill holes have produced 19,680
meters of drill core samples. Including the inferred mineral resource estimate, four years of field work are now included in an economic scoping study for Los Azules. A preliminary engineering
report has also been compiled. Minera Andes has a 100% earned-in interest in the Los Azules property and is focussing on aggressively continuing to explore + develop this property. Since
discovery, subsequent exploration at Los Azules has encountered features associated with many copper porphyry systems. Programs have been conducted to test the grade and continuity of
known leachable (chalcocite) copper mineralization. In the discovery zone, strongly leached cap rock extends from the subcrop to as much as 161 meters beneath the surface followed by an
enriched zone of secondary mineralization (chalcocite) over a zone of secondary and primary (chalcopyrite) copper mineralization.
Minera Andes is a successful exploration company, the discovery of the San José deposit has been successfully turned into an operating mine. San José produced 77,070 oz Au and 4.9MM
oz Ag in 2009. 49% of the value of San Jose's production is attributable to Minera Andes, the other 51% attributable to Hochschild Mining (HOC:L). MAI also owns 100% of the Los Azules
copper project in the San Juan province containing 11.2 billion lbs of copper and other exploration targets are 100% owned by Minera Andes.
0.00
0.50
1.00
1.50
2.00
2.50
3.00
3.50
F-10 A-10 J-10 A-10 O-10 D-10 F-11
.0 M
2.0 M
4.0 M
6.0 M
8.0 M
10.0 M
12.0 M
Company Update
December 16, 2010 - Minera Andes Announces Updated Preliminary assessment For Its
Los Azules Copper Deposit - Minera Andes announced the results of an updated preliminary
assessment on its 100% owned Los Azules Copper Project located in the San Juan Province
of western central Argentina. It is based on the updated resource estimate announced in June
2010 and higher base case metal price assumptions.
- Using a Copper price of $3.00/ lb
- Base case pre-tax Net Present Value ("NPV") is $2.8 billion and the Internal Rate of Return
("IRR") is 21.4%, at a discount rate of 8%
- Life of mine Cash Operating Costs of $0.96/lb of copper net of gold and silver by-product
credits.
- Initial Capital $2.9 billion
- Capital Payback in 3 years.
- Mine life of 25 years.
November 22, 2010 - Minera Andes Announces that Inferred Resources More than
Double at the San José Mine, Argentina - Minera Andes announced the results of an
updated independent mineral resource estimate as at September 30, 2010 at the San José
mine in Santa Cruz province, southern Argentina. The contained silver in the Inferred Mineral
Resources increased by 133% and the contained gold increased by 122% compared to the
December 31, 2009 estimate as reported by the Corporation in its March 31, 2010. The
increase is primarily due to the discovery of nine new veins as well as important extensions of
previously known veins, as reported by the Corporation on October 7, 2010. At September 30,
2010, total Measured and Indicated Mineral Resources at the San José Mine were 651,000
ounces of gold and 44.2 million ounces of silver, contained in 3.0 million tonnes grading 6.81
grams/tonne (g/t) gold and 462 g/t silver, or 83.3 million ounces of silver equivalent. An
additional 712,000 ounces of gold and 46.4 million ounces of silver, contained in 4.6 million
tonnes, grading 4.87 g/t gold and 317 g/t silver, or 89.2 million ounces of silver equivalent, are
classified as Inferred Resources. The mineral resources remain open along strike and at depth
in some areas.
Source: Company reports.
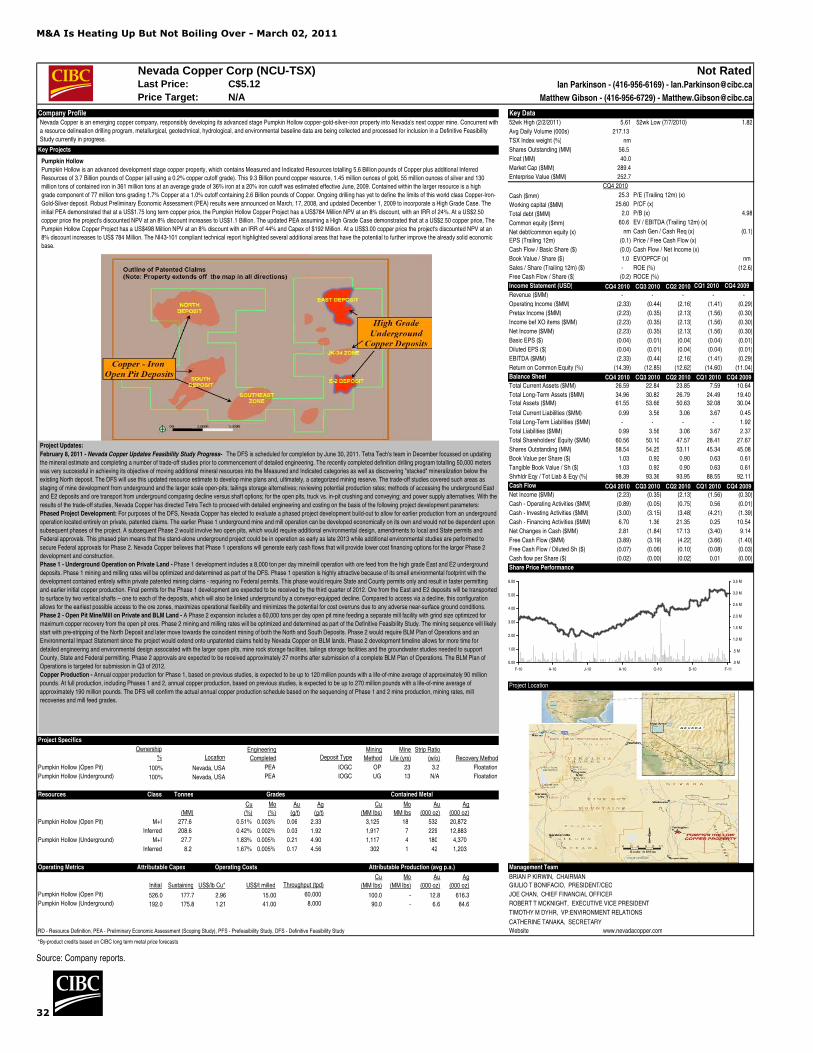
M&A Is Heating Up But Not Boiling Over - March 02, 2011
32
Nevada Copper Corp (NCU-TSX) Not RatedLast Price: Ian Parkinson - (416-956-6169) - [email protected]
Price Target: N/A Matthew Gibson - (416-956-6729) - [email protected]
Company Profile Key Data52wk High (2/2/2011) 5.61 52wk Low (7/7/2010) 1.82
Avg Daily Volume (000s) 217.13
TSX Index weight (%) nm
Key Projects Shares Outstanding (MM) 56.5
Float (MM) 40.0
Market Cap ($MM) 289.4
Key Projects Enterprise Value ($MM) 252.7
CQ4 2010
Cash ($mm) 25.3 P/E (Trailing 12m) (x) #N/A N/A
Working capital ($MM) 25.60 P/CF (x) #N/A N/A
Total debt ($MM) 2.0 P/B (x) 4.98
Common equity ($mm) 60.6 EV / EBITDA (Trailing 12m) (x) #N/A N/A
Net debt/common equity (x) nm Cash Gen / Cash Req (x) (0.1)
EPS (Trailing 12m) (0.1) Price / Free Cash Flow (x) #N/A N/A
Cash Flow / Basic Share ($) (0.0) Cash Flow / Net Income (x) #N/A N/A
Book Value / Share ($) 1.0 EV/OPFCF (x) nm
Sales / Share (Trailing 12m) ($) - ROE (%) (12.6)
Free Cash Flow / Share ($) (0.2) ROCE (%) #N/A N/A
Income Statement (USD) CQ4 2010 CQ3 2010 CQ2 2010 CQ1 2010 CQ4 2009
Revenue ($MM) - - - - -
Operating Income ($MM) (2.33) (0.44) (2.16) (1.41) (0.29)
Pretax Income ($MM) (2.23) (0.35) (2.13) (1.56) (0.30)
Income bef XO items ($MM) (2.23) (0.35) (2.13) (1.56) (0.30)
Net Income ($MM) (2.23) (0.35) (2.13) (1.56) (0.30)
Basic EPS ($) (0.04) (0.01) (0.04) (0.04) (0.01)
Diluted EPS ($) (0.04) (0.01) (0.04) (0.04) (0.01)
EBITDA ($MM) (2.33) (0.44) (2.16) (1.41) (0.29)
Return on Common Equity (%) (14.39) (12.85) (12.62) (14.60) (11.04)
Balance Sheet CQ4 2010 CQ3 2010 CQ2 2010 CQ1 2010 CQ4 2009
Total Current Assets ($MM) 26.59 22.84 23.85 7.59 10.64
Total Long-Term Assets ($MM) 34.96 30.82 26.79 24.49 19.40
Total Assets ($MM) 61.55 53.66 50.63 32.08 30.04
Total Current Liabilities ($MM) 0.99 3.56 3.06 3.67 0.45
Total Long-Term Liabilities ($MM) - - - - 1.92
Total Liabilities ($MM) 0.99 3.56 3.06 3.67 2.37
Total Shareholders' Equity ($MM) 60.56 50.10 47.57 28.41 27.67
Shares Outstanding (MM) 58.54 54.25 53.11 45.34 45.08
Book Value per Share ($) 1.03 0.92 0.90 0.63 0.61
Tangible Book Value / Sh ($) 1.03 0.92 0.90 0.63 0.61
Shrhldr Eqy / Tot Liab & Eqy (%) 98.39 93.36 93.95 88.55 92.11
Cash Flow CQ4 2010 CQ3 2010 CQ2 2010 CQ1 2010 CQ4 2009
Net Income ($MM) (2.23) (0.35) (2.13) (1.56) (0.30)
From To Length Length True Length Cu Au Ag Mo Fe Cash - Operating Activities ($MM) (0.89) (0.05) (0.75) 0.56 (0.01)
Drill Hole # Target (m) (m) (m) (ft) (m) (%) (g/t) (g/t) (%) (%) Cash - Investing Activities ($MM) (3.00) (3.15) (3.48) (4.21) (1.39)
NC10-41 North Deposit 329.5 334 4.5 15 3.2 0.97 0.09 1.5 0.01 Cash - Financing Activities ($MM) 6.70 1.36 21.35 0.25 10.54
350.5 358.1 7.6 25 5.4 0.45 0.018 1 0.002 Net Changes in Cash ($MM) 2.81 (1.84) 17.13 (3.40) 9.14
NC10-46 North Deposit 226.2 233.2 7 23 5 0.42 0.03 1.8 0.007 Free Cash Flow ($MM) (3.89) (3.19) (4.22) (3.66) (1.40)
281 285 4 13 2.8 0.74 0.05 3 0.01 Free Cash Flow / Diluted Sh ($) (0.07) (0.06) (0.10) (0.08) (0.03)
326.1 330.7 4.6 15 3.2 0.33 0.054 1.7 0.001 Cash flow per Share ($) (0.02) (0.00) (0.02) 0.01 (0.00)
344.4 356.6 12.2 40 8.6 0.36 0.031 1.5 <.001 Share Price Performance
NC10-48 North Deposit 172.2 183.8 11.6 38 8.9 1 0.039 3.6 0.004
202.7 208.5 5.8 19 4.4 1.55 0.097 5.4 0.012
NC10-50 North Deposit 222.5 251.5 29 95 29 0.56 0.055 1.7 0.004
262.1 292.9 30.8 101 30.8 0.48 0.069 2 0.003
NC10-52 North Deposit 199.6 205.7 6.1 20 20 0.35 0.011 0.8 0.002
211.8 281.9 70.1 230 230 1.46 0.005 0.4 0.001
352 353.5 1.5 5 1.5 1.22 0.612 4.3 0.006
455.1 483.1 28 92 22.9 0.65 0.1 2.7 0.006
500.2 551.7 51.5 169 41.9 0.95 0.212 3.2 0.016
578.8 582.1 3.3 11 2.7 0.65 0.116 1.8 0.003
NC10-53 E2 Deposit 272.8 301.8 29 95 14.5 1.9 0.394 7.7 16.4
309.4 315.5 6.1 20 3.1 1.12 0.188 6 19.9
342.9 346 3.1 10 1.6 1.27 0.277 4.2 29.2 Project Location
NC10-49 East Deposit 527.3 538 10.7 35 3 0.278 6.1 6.1
559.3 625.4 6.1 20 1.4 0.231 2.2 5.4
NC10-54 East Deposit 468.3 470.9 2.6 8.5 2.69 0.289 11.6 26.4
504.4 515.1 10.7 35 1.24 0.14 3.1 18.4
Project Specifics
Ownership
% Location Deposit Type
Pumpkin Hollow (Open Pit) 100% Nevada, USA PEA IOGC OP 23 3.2 Floatation
Pumpkin Hollow (Underground) 100% Nevada, USA PEA IOGC UG 13 N/A Floatation
Resources Class Tonnes
(MM)
Pumpkin Hollow (Open Pit) M+I 277.6 0.51% 0.003% 0.06 2.33 3,125 18 532 20,872
Inferred 208.6 0.42% 0.002% 0.03 1.92 1,917 7 229 12,883
Pumpkin Hollow (Underground) M+I 27.7 1.83% 0.005% 0.21 4.90 1,117 4 180 4,370
Inferred 8.2 1.67% 0.005% 0.17 4.56 302 1 42 1,203
Operating Metrics Attributable Capex Management Team
BRIAN P KIRWIN, CHAIRMAN
Initial Sustaining US$/lb Cu* US$/t milled GIULIO T BONIFACIO, PRESIDENT/CEO
Pumpkin Hollow (Open Pit) 526.0 177.7 2.96 15.00 100.0 - 12.8 616.3 JOE CHAN, CHIEF FINANCIAL OFFICER
Pumpkin Hollow (Underground) 192.0 175.8 1.21 41.00 90.0 - 6.6 84.6 ROBERT T MCKNIGHT, EXECUTIVE VICE PRESIDENT
TIMOTHY M DYHR, VP:ENVIRONMENT RELATIONS
CATHERINE TANAKA, SECRETARY
RD - Resource Definition, PEA - Preliminary Economic Assessment (Scoping Study), PFS - Prefeasibility Study, DFS - Definitive Feasibility Study Website www.nevadacopper.com
*By-product credits based on CIBC long term metal price forecasts
Grades
Ag
(g/t)
Au
(g/t)
Mo
(%)
Cu
(%)
Operating Costs
8,000
60,000
Au
(000 oz)Throughput (tpd)
Engineering
Completed
Mine
Life (yrs)
Mining
Method
Mo
(MM lbs)
Strip Ratio
(w/o)
Contained Metal
Mo
MM lbs
Ag
(000 oz)
Attributable Production (avg p.a.)
C$5.12
Cu
(MM lbs)
Recovery Method
Au
(000 oz)
Ag
(000 oz)
Cu
(MM lbs)
0.00
1.00
2.00
3.00
4.00
5.00
6.00
F-10 A-10 J-10 A-10 O-10 D-10 F-11
.0 M
.5 M
1.0 M
1.5 M
2.0 M
2.5 M
3.0 M
3.5 M
Pumpkin Hollow
Pumpkin Hollow is an advanced development stage copper property, which contains Measured and Indicated Resources totalling 5.6 Billion pounds of Copper plus additional Inferred
Resources of 3.7 Billion pounds of Copper (all using a 0.2% copper cutoff grade). This 9.3 Billion pound copper resource, 1.45 million ounces of gold, 55 million ounces of silver and 130
million tons of contained iron in 361 million tons at an average grade of 36% iron at a 20% iron cutoff was estimated effective June, 2009. Contained within the larger resource is a high
grade component of 77 million tons grading 1.7% Copper at a 1.0% cutoff containing 2.6 Billion pounds of Copper. Ongoing drilling has yet to define the limits of this world class Copper-Iron-
Gold-Silver deposit. Robust Preliminary Economic Assessment (PEA) results were announced on March, 17, 2008, and updated December 1, 2009 to incorporate a High Grade Case. The
initial PEA demonstrated that at a US$1.75 long term copper price, the Pumpkin Hollow Copper Project has a US$784 Million NPV at an 8% discount, with an IRR of 24%. At a US$2.50
copper price the project's discounted NPV at an 8% discount increases to US$1.1 Billion. The updated PEA assuming a High Grade Case demonstrated that at a US$2.50 copper price, The
Pumpkin Hollow Copper Project has a US$498 Million NPV at an 8% discount with an IRR of 44% and Capex of $192 Million. At a US$3.00 copper price the project's discounted NPV at an
8% discount increases to US$ 784 Million. The NI43-101 compliant technical report highlighted several additional areas that have the potential to further improve the already solid economic
base.
Nevada Copper is an emerging copper company, responsibly developing its advanced stage Pumpkin Hollow copper-gold-silver-iron property into Nevada's next copper mine. Concurrent with
a resource delineation drilling program, metallurgical, geotechnical, hydrological, and environmental baseline data are being collected and processed for inclusion in a Definitive Feasibility
Study currently in progress.
Project Updates:
February 8, 2011 - Nevada Copper Updates Feasibility Study Progress- The DFS is scheduled for completion by June 30, 2011. Tetra Tech's team in December focussed on updating
the mineral estimate and completing a number of trade-off studies prior to commencement of detailed engineering. The recently completed definition drilling program totalling 50,000 meters
was very successful in achieving its objective of moving additional mineral resources into the Measured and Indicated categories as well as discovering "stacked" mineralization below the
existing North deposit. The DFS will use this updated resource estimate to develop mine plans and, ultimately, a categorized mining reserve. The trade-off studies covered such areas as
staging of mine development from underground and the larger scale open-pits; tailings storage alternatives; reviewing potential production rates; methods of accessing the underground East
and E2 deposits and ore transport from underground comparing decline versus shaft options; for the open pits, truck vs. in-pit crushing and conveying; and power supply alternatives. With the
results of the trade-off studies, Nevada Copper has directed Tetra Tech to proceed with detailed engineering and costing on the basis of the following project development parameters:
Phased Project Development: For purposes of the DFS, Nevada Copper has elected to evaluate a phased project development build-out to allow for earlier production from an underground
operation located entirely on private, patented claims. The earlier Phase 1 underground mine and mill operation can be developed economically on its own and would not be dependent upon
subsequent phases of the project. A subsequent Phase 2 would involve two open pits, which would require additional environmental design, amendments to local and State permits and
Federal approvals. This phased plan means that the stand-alone underground project could be in operation as early as late 2013 while additional environmental studies are performed to
secure Federal approvals for Phase 2. Nevada Copper believes that Phase 1 operations will generate early cash flows that will provide lower cost financing options for the larger Phase 2
development and construction.
Phase 1 - Underground Operation on Private Land - Phase 1 development includes a 8,000 ton per day mine/mill operation with ore feed from the high grade East and E2 underground
deposits. Phase 1 mining and milling rates will be optimized and determined as part of the DFS. Phase 1 operation is highly attractive because of its small environmental footprint with the
development contained entirely within private patented mining claims - requiring no Federal permits. This phase would require State and County permits only and result in faster permitting
and earlier initial copper production. Final permits for the Phase 1 development are expected to be received by the third quarter of 2012. Ore from the East and E2 deposits will be transported
to surface by two vertical shafts -- one to each of the deposits, which will also be linked underground by a conveyor-equipped decline. Compared to access via a decline, this configuration
allows for the earliest possible access to the ore zones, maximizes operational flexibility and minimizes the potential for cost overruns due to any adverse near-surface ground conditions.
Phase 2 - Open Pit Mine/Mill on Private and BLM Land - A Phase 2 expansion includes a 60,000 tons per day open pit mine feeding a separate mill facility with grind size optimized for
maximum copper recovery from the open pit ores. Phase 2 mining and milling rates will be optimized and determined as part of the Definitive Feasibility Study. The mining sequence will likely
start with pre-stripping of the North Deposit and later move towards the coincident mining of both the North and South Deposits. Phase 2 would require BLM Plan of Operations and an
Environmental Impact Statement since the project would extend onto unpatented claims held by Nevada Copper on BLM lands. Phase 2 development timeline allows for more time for
detailed engineering and environmental design associated with the larger open pits, mine rock storage facilities, tailings storage facilities and the groundwater studies needed to support
County, State and Federal permitting. Phase 2 approvals are expected to be received approximately 27 months after submission of a complete BLM Plan of Operations. The BLM Plan of
Operations is targeted for submission in Q3 of 2012.
Copper Production - Annual copper production for Phase 1, based on previous studies, is expected to be up to 120 million pounds with a life-of-mine average of approximately 90 million
pounds. At full production, including Phases 1 and 2, annual copper production, based on previous studies, is expected to be up to 270 million pounds with a life-of-mine average of
approximately 190 million pounds. The DFS will confirm the actual annual copper production schedule based on the sequencing of Phase 1 and 2 mine production, mining rates, mill
recoveries and mill feed grades.
Source: Company reports.
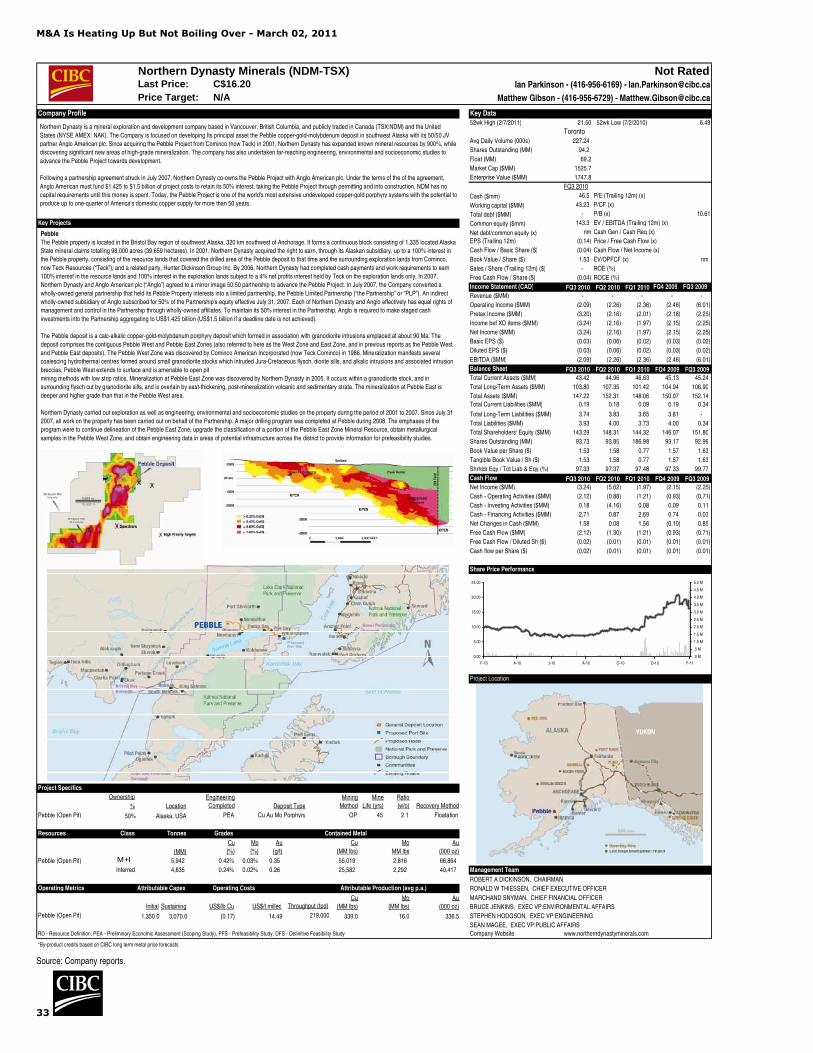
M&A Is Heating Up But Not Boiling Over - March 02, 2011
33
Northern Dynasty Minerals (NDM-TSX) Not RatedLast Price: Ian Parkinson - (416-956-6169) - [email protected]
Price Target: N/A Matthew Gibson - (416-956-6729) - [email protected]
Company Profile Key Data52wk High (2/7/2011) 21.50 52wk Low (7/2/2010) 6.49
TorontoAvg Daily Volume (000s) 227.24
Shares Outstanding (MM) 94.2
Float (MM) 69.2
Market Cap ($MM) 1525.7
Enterprise Value ($MM) 1747.8
FQ3 2010
Cash ($mm) 46.5 P/E (Trailing 12m) (x) #N/A N/A
Working capital ($MM) 43.23 P/CF (x) #N/A N/A
Total debt ($MM) - P/B (x) 10.61
Key Projects Common equity ($mm) 143.3 EV / EBITDA (Trailing 12m) (x) #N/A N/A
Net debt/common equity (x) nm Cash Gen / Cash Req (x) #N/A N/A
EPS (Trailing 12m) (0.14) Price / Free Cash Flow (x) #N/A N/A
Cash Flow / Basic Share ($) (0.04) Cash Flow / Net Income (x) #N/A N/A
Book Value / Share ($) 1.53 EV/OPFCF (x) nm
Sales / Share (Trailing 12m) ($) - ROE (%) #N/A N/A
Free Cash Flow / Share ($) (0.04) ROCE (%) #N/A N/A
Income Statement (CAD) FQ3 2010 FQ2 2010 FQ1 2010 FQ4 2009 FQ3 2009
Revenue ($MM) - - - - -
Operating Income ($MM) (2.09) (2.26) (2.36) (2.46) (6.01)
Pretax Income ($MM) (3.20) (2.16) (2.01) (2.18) (2.25)
Income bef XO items ($MM) (3.24) (2.16) (1.97) (2.15) (2.25)
Net Income ($MM) (3.24) (2.16) (1.97) (2.15) (2.25)
Basic EPS ($) (0.03) (0.06) (0.02) (0.03) (0.02)
Diluted EPS ($) (0.03) (0.06) (0.02) (0.03) (0.02)
EBITDA ($MM) (2.09) (2.26) (2.36) (2.46) (6.01)
Balance Sheet FQ3 2010 FQ2 2010 FQ1 2010 FQ4 2009 FQ3 2009
Total Current Assets ($MM) 43.42 44.96 46.63 45.13 45.24
Total Long-Term Assets ($MM) 103.80 107.35 101.42 104.94 106.90
Total Assets ($MM) 147.22 152.31 148.06 150.07 152.14
Total Current Liabilities ($MM) 0.19 0.18 0.09 0.19 0.34
Total Long-Term Liabilities ($MM) 3.74 3.83 3.65 3.81 -
Total Liabilities ($MM) 3.93 4.00 3.73 4.00 0.34
Total Shareholders' Equity ($MM) 143.29 148.31 144.32 146.07 151.80
Shares Outstanding (MM) 93.73 93.85 186.98 93.17 92.99
Book Value per Share ($) 1.53 1.58 0.77 1.57 1.63
Tangible Book Value / Sh ($) 1.53 1.58 0.77 1.57 1.63
Shrhldr Eqy / Tot Liab & Eqy (%) 97.33 97.37 97.48 97.33 99.77
Cash Flow FQ3 2010 FQ2 2010 FQ1 2010 FQ4 2009 FQ3 2009
Net Income ($MM) (3.24) (5.62) (1.97) (2.15) (2.25)
Cash - Operating Activities ($MM) (2.12) (0.88) (1.21) (0.93) (0.71)
Cash - Investing Activities ($MM) 0.18 (4.16) 0.08 0.09 0.11
Cash - Financing Activities ($MM) 2.71 0.87 2.69 0.74 0.03
Net Changes in Cash ($MM) 1.58 0.08 1.56 (0.10) 0.85
Free Cash Flow ($MM) (2.12) (1.30) (1.21) (0.93) (0.71)
Free Cash Flow / Diluted Sh ($) (0.02) (0.01) (0.01) (0.01) (0.01)
Cash flow per Share ($) (0.02) (0.01) (0.01) (0.01) (0.01)
Share Price Performance
Project Location
Project Specifics
Ownership
% Location Deposit Type
Pebble (Open Pit) 50% Alaska, USA PEA Cu Au Mo Porphyry OP 45 2.1 Floatation
Resources Class Tonnes Grades Contained Metal
(MM)
Pebble (Open Pit) M+I 5,942 0.42% 0.03% 0.35 55,019 2,816 66,864
Inferred 4,835 0.24% 0.02% 0.26 25,582 2,292 40,417 Management Team
ROBERT A DICKINSON, CHAIRMAN
Operating Metrics Attributable Capex Operating Costs RONALD W THIESSEN, CHIEF EXECUTIVE OFFICER
MARCHAND SNYMAN, CHIEF FINANCIAL OFFICER
Initial Sustaining US$/lb Cu US$/t milled BRUCE JENKINS, EXEC VP:ENVIRONMENTAL AFFAIRS
Pebble (Open Pit) 1,350.0 3,070.0 (0.17) 14.49 339.0 16.0 336.5 STEPHEN HODGSON, EXEC VP:ENGINEERING
SEAN MAGEE, EXEC VP:PUBLIC AFFAIRS
RD - Resource Definition, PEA - Preliminary Economic Assessment (Scoping Study), PFS - Prefeasibility Study, DFS - Definitive Feasibility Study Company Website www.northerndynastyminerals.com
*By-product credits based on CIBC long term metal price forecasts
Mine
Life (yrs)
Ratio
(w/o) Recovery Method
Engineering
Completed
Mining
Method
Cu
(MM lbs)
Au
(000 oz)
Mo
MM lbs
Mo
(MM lbs)
Attributable Production (avg p.a.)
Au
(000 oz)
Throughput (tpd)
Cu
(MM lbs)
C$16.20
219,000
Cu
(%)
Mo
(%)
Au
(g/t)
Pebble
The Pebble property is located in the Bristol Bay region of southwest Alaska, 320 km southwest of Anchorage. It forms a continuous block consisting of 1,335 located Alaska
State mineral claims totalling 98,000 acres (39,659 hectares). In 2001, Northern Dynasty acquired the right to earn, through its Alaskan subsidiary, up to a 100% interest in
the Pebble property, consisting of the resource lands that covered the drilled area of the Pebble deposit to that time and the surrounding exploration lands from Cominco,
now Teck Resources (“Teck”), and a related party, Hunter Dickinson Group Inc. By 2006, Northern Dynasty had completed cash payments and work requirements to earn
100% interest in the resource lands and 100% interest in the exploration lands subject to a 4% net profits interest held by Teck on the exploration lands only. In 2007,
Northern Dynasty and Anglo American plc (“Anglo”) agreed to a mirror image 50:50 partnership to advance the Pebble Project. In July 2007, the Company converted a
wholly-owned general partnership that held its Pebble Property interests into a limited partnership, the Pebble Limited Partnership (“the Partnership” or “PLP”). An indirect
wholly-owned subsidiary of Anglo subscribed for 50% of the Partnership's equity effective July 31, 2007. Each of Northern Dynasty and Anglo effectively has equal rights of
management and control in the Partnership through wholly-owned affiliates. To maintain its 50% interest in the Partnership, Anglo is required to make staged cash
investments into the Partnership aggregating to US$1.425 billion (US$1.5 billion if a deadline date is not achieved).
The Pebble deposit is a calc-alkalic copper-gold-molybdenum porphyry deposit which formed in association with granodiorite intrusions emplaced at about 90 Ma. The
deposit comprises the contiguous Pebble West and Pebble East Zones (also referred to here as the West Zone and East Zone, and in previous reports as the Pebble West
and Pebble East deposits). The Pebble West Zone was discovered by Cominco American Incorporated (now Teck Cominco) in 1986. Mineralization manifests several
coalescing hydrothermal centres formed around small granodiorite stocks which intruded Jura-Cretaceous flysch, diorite sills, and alkalic intrusions and associated intrusion
breccias. Pebble West extends to surface and is amenable to open pit
mining methods with low strip ratios. Mineralization at Pebble East Zone was discovered by Northern Dynasty in 2005. It occurs within a granodiorite stock, and in
surrounding flysch cut by granodiorite sills, and is overlain by east-thickening, post-mineralization volcanic and sedimentary strata. The mineralization at Pebble East is
deeper and higher grade than that in the Pebble West area.
Northern Dynasty carried out exploration as well as engineering, environmental and socioeconomic studies on the property during the period of 2001 to 2007. Since July 31
2007, all work on the property has been carried out on behalf of the Partnership. A major drilling program was completed at Pebble during 2008. The emphases of the
program were to continue delineation of the Pebble East Zone, upgrade the classification of a portion of the Pebble East Zone Mineral Resource, obtain metallurgical
samples in the Pebble West Zone, and obtain engineering data in areas of potential infrastructure across the district to provide information for prefeasibility studies.
Northern Dynasty is a mineral exploration and development company based in Vancouver, British Columbia, and publicly traded in Canada (TSX:NDM) and the United
States (NYSE AMEX: NAK). The Company is focused on developing Its principal asset the Pebble copper-gold-molybdenum deposit in southwest Alaska with its 50/50 JV
partner Anglo American plc. Since acquiring the Pebble Project from Cominco (now Teck) in 2001, Northern Dynasty has expanded known mineral resources by 900%, while
discovering significant new areas of high-grade mineralization. The company has also undertaken far-reaching engineering, environmental and socioeconomic studies to
advance the Pebble Project towards development.
Following a partnership agreement struck in July 2007, Northern Dynasty co-owns the Pebble Project with Anglo American plc. Under the terms of the of the agreement,
Anglo American must fund $1.425 to $1.5 billion of project costs to retain its 50% interest, taking the Pebble Project through permitting and into construction, NDM has no
capital requirements until this money is spent. Today, the Pebble Project is one of the world's most extensive undeveloped copper-gold porphyry systems with the potential to
produce up to one-quarter of America's domestic copper supply for more than 50 years.
0.00
5.00
10.00
15.00
20.00
25.00
F-10 A-10 J-10 A-10 O-10 D-10 F-11
.0 M
.5 M
1.0 M
1.5 M
2.0 M
2.5 M
3.0 M
3.5 M
4.0 M
4.5 M
5.0 M
Source: Company reports.
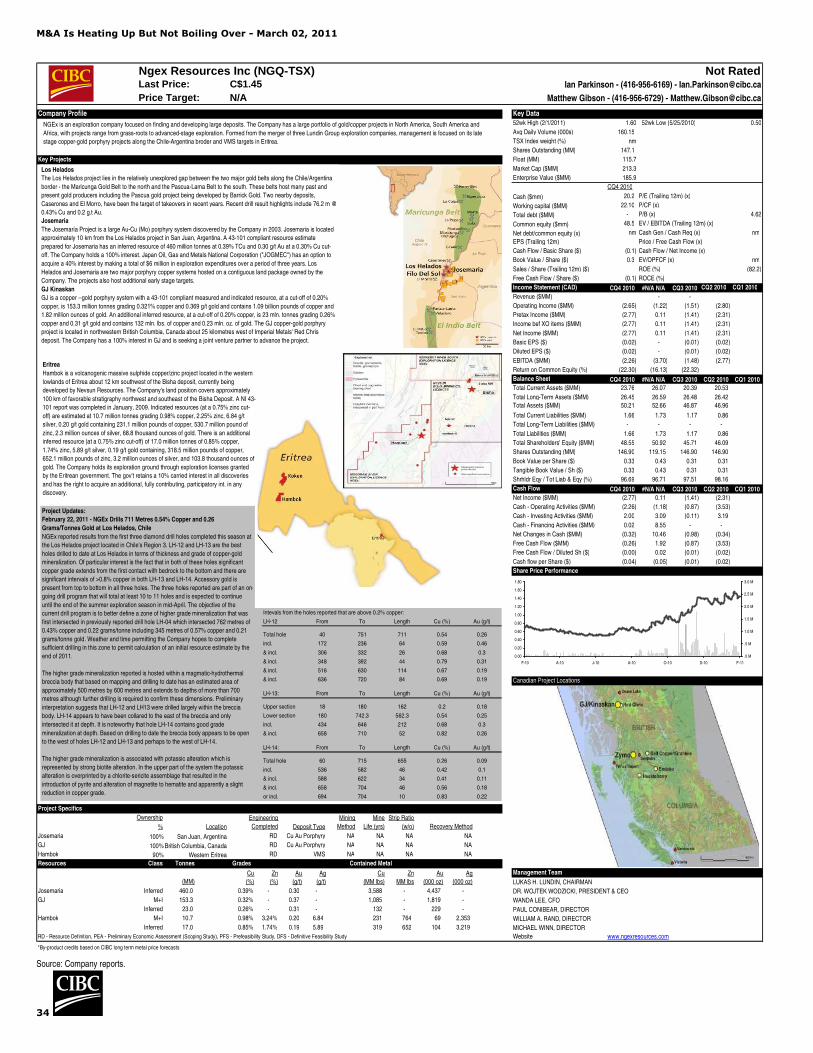
M&A Is Heating Up But Not Boiling Over - March 02, 2011
34
Ngex Resources Inc (NGQ-TSX) Not RatedLast Price: Ian Parkinson - (416-956-6169) - [email protected]
Price Target: N/A Matthew Gibson - (416-956-6729) - [email protected]
Company Profile Key Data52wk High (2/1/2011) 1.60 52wk Low (5/25/2010) 0.50
Avg Daily Volume (000s) 160.15
TSX Index weight (%) nm
Shares Outstanding (MM) 147.1
Key Projects Float (MM) 115.7
Market Cap ($MM) 213.3
Enterprise Value ($MM) 185.9
CQ4 2010
Cash ($mm) 20.2 P/E (Trailing 12m) (x) #N/A N/A
Working capital ($MM) 22.10 P/CF (x) #N/A N/A
Total debt ($MM) - P/B (x) 4.62
Common equity ($mm) 48.5 EV / EBITDA (Trailing 12m) (x) #N/A N/A
Net debt/common equity (x) nm Cash Gen / Cash Req (x) nm
EPS (Trailing 12m) #N/A N/A Price / Free Cash Flow (x) #N/A N/A
Cash Flow / Basic Share ($) (0.1) Cash Flow / Net Income (x) #N/A N/A
Book Value / Share ($) 0.3 EV/OPFCF (x) nm
Sales / Share (Trailing 12m) ($) #N/A N/A ROE (%) (82.2)
Free Cash Flow / Share ($) (0.1) ROCE (%) #N/A N/A
Income Statement (CAD) CQ4 2010 #N/A N/A CQ3 2010 CQ2 2010 CQ1 2010
Revenue ($MM) #N/A N/A - - #N/A N/A #N/A N/A
Operating Income ($MM) (2.65) (1.22) (1.51) (2.80) #N/A N/A
Pretax Income ($MM) (2.77) 0.11 (1.41) (2.31) #N/A N/A
Income bef XO items ($MM) (2.77) 0.11 (1.41) (2.31) #N/A N/A
Net Income ($MM) (2.77) 0.11 (1.41) (2.31) #N/A N/A
Basic EPS ($) (0.02) - (0.01) (0.02) #N/A N/A
Diluted EPS ($) (0.02) - (0.01) (0.02) #N/A N/A
EBITDA ($MM) (2.26) (3.70) (1.48) (2.77) #N/A N/A
Return on Common Equity (%) (22.30) (16.13) (22.32) #N/A N/A #N/A N/A
Balance Sheet CQ4 2010 #N/A N/A CQ3 2010 CQ2 2010 CQ1 2010
Total Current Assets ($MM) 23.76 26.07 20.39 20.53 #N/A N/A
Total Long-Term Assets ($MM) 26.45 26.59 26.48 26.42 #N/A N/A
Total Assets ($MM) 50.21 52.66 46.87 46.96 #N/A N/A
Total Current Liabilities ($MM) 1.66 1.73 1.17 0.86 #N/A N/A
Total Long-Term Liabilities ($MM) - - - - #N/A N/A
Total Liabilities ($MM) 1.66 1.73 1.17 0.86 #N/A N/A
Total Shareholders' Equity ($MM) 48.55 50.92 45.71 46.09 #N/A N/A
Shares Outstanding (MM) 146.90 119.15 146.90 146.90 #N/A N/A
Book Value per Share ($) 0.33 0.43 0.31 0.31 #N/A N/A
Tangible Book Value / Sh ($) 0.33 0.43 0.31 0.31 #N/A N/A
Shrhldr Eqy / Tot Liab & Eqy (%) 96.69 96.71 97.51 98.16 #N/A N/A
Cash Flow CQ4 2010 #N/A N/A CQ3 2010 CQ2 2010 CQ1 2010
Net Income ($MM) (2.77) 0.11 (1.41) (2.31) #N/A N/A
Cash - Operating Activities ($MM) (2.26) (1.18) (0.87) (3.53) #N/A N/A
Cash - Investing Activities ($MM) 2.00 3.09 (0.11) 3.19 #N/A N/A
Cash - Financing Activities ($MM) 0.02 8.55 - - #N/A N/A
Net Changes in Cash ($MM) (0.32) 10.46 (0.98) (0.34) #N/A N/A
Free Cash Flow ($MM) (0.26) 1.92 (0.87) (3.53) #N/A N/A
Free Cash Flow / Diluted Sh ($) (0.00) 0.02 (0.01) (0.02) #N/A N/A
Cash flow per Share ($) (0.04) (0.05) (0.01) (0.02) #N/A N/A
Share Price Performance
Canadian Project Locations
Project Specifics
Ownership
% Location Deposit Type
Josemaria 100% San Juan, Argentina RD Cu Au Porphyry NA NA NA NA
GJ 100% British Columbia, Canada RD Cu Au Porphyry NA NA NA NA
Hambok 90% Western Eritrea RD VMS NA NA NA NA
Resources Class Tonnes Grades Contained Metal
Management Team
(MM) LUKAS H. LUNDIN, CHAIRMAN
Josemaria Inferred 460.0 0.39% - 0.30 - 3,588 - 4,437 - DR. WOJTEK WODZICKI, PRESIDENT & CEO
GJ M+I 153.3 0.32% - 0.37 - 1,085 - 1,819 - WANDA LEE, CFO
Inferred 23.0 0.26% - 0.31 - 132 - 229 - PAUL CONIBEAR, DIRECTOR
Hambok M+I 10.7 0.98% 3.24% 0.20 6.84 231 764 69 2,353 WILLIAM A. RAND, DIRECTOR
Inferred 17.0 0.85% 1.74% 0.19 5.89 319 652 104 3,219 MICHAEL WINN, DIRECTOR
RD - Resource Definition, PEA - Preliminary Economic Assessment (Scoping Study), PFS - Prefeasibility Study, DFS - Definitive Feasibility Study Website www.ngexresources.com
*By-product credits based on CIBC long term metal price forecasts
Cu
(%)
Zn
(%)
Au
(g/t)
Ag
(g/t)
Au
(000 oz)
Ag
(000 oz)
C$1.45
Engineering
Completed
Cu
(MM lbs)
Zn
MM lbs
Mining
Method
Mine
Life (yrs)
Strip Ratio
(w/o) Recovery Method
NGEx is an exploration company focused on finding and developing large deposits. The Company has a large portfolio of gold/copper projects in North America, South America and
Africa, with projects range from grass-roots to advanced-stage exploration. Formed from the merger of three Lundin Group exploration companies, management is focused on its late
stage copper-gold porphyry projects along the Chile-Argentina broder and VMS targets in Eritrea.
0.00
0.20
0.40
0.60
0.80
1.00
1.20
1.40
1.60
1.80
F-10 A-10 J-10 A-10 O-10 D-10 F-11
.0 M
.5 M
1.0 M
1.5 M
2.0 M
2.5 M
3.0 M
Los Helados
The Los Helados project lies in the relatively unexplored gap between the two major gold belts along the Chile/Argentina
border - the Maricunga Gold Belt to the north and the Pascua-Lama Belt to the south. These belts host many past and
present gold producers including the Pascua gold project being developed by Barrick Gold. Two nearby deposits,
Caserones and El Morro, have been the target of takeovers in recent years. Recent drill result highlights include 76.2 m @
0.43% Cu and 0.2 g.t Au.
Josemaria
The Josemaría Project is a large Au-Cu (Mo) porphyry system discovered by the Company in 2003. Josemaria is located
approximately 10 km from the Los Helados project in San Juan, Argentina. A 43-101 compliant resource estimate
prepared for Josemaria has an inferred resource of 460 million tonnes at 0.39% TCu and 0.30 g/t Au at a 0.30% Cu cut-
off. The Company holds a 100% interest. Japan Oil, Gas and Metals National Corporation ("JOGMEC") has an option to
acquire a 40% interest by making a total of $6 million in exploration expenditures over a period of three years. Los
Helados and Josemaria are two major porphyry copper systems hosted on a contiguous land package owned by the
Company. The projects also host additional early stage targets.
GJ Kinaskan
GJ is a copper --gold porphyry system with a 43-101 compliant measured and indicated resource, at a cut-off of 0.20%
copper, is 153.3 million tonnes grading 0.321% copper and 0.369 g/t gold and contains 1.09 billion pounds of copper and
1.82 million ounces of gold. An additional inferred resource, at a cut-off of 0.20% copper, is 23 mln. tonnes grading 0.26%
copper and 0.31 g/t gold and contains 132 mln. lbs. of copper and 0.23 mln. oz. of gold. The GJ copper-gold porphyry
project is located in northwestern British Columbia, Canada about 25 kilometres west of Imperial Metals' Red Chris
deposit. The Company has a 100% interest in GJ and is seeking a joint venture partner to advance the project.
Intevals from the holes reported that are above 0.2% copper:
LH-12 From To Length Cu (%) Au (g/t)
Total hole 40 751 711 0.54 0.26
incl. 172 236 64 0.59 0.46
& incl. 306 332 26 0.68 0.3
& incl. 348 392 44 0.79 0.31
& incl. 516 630 114 0.67 0.19
& incl. 636 720 84 0.69 0.19
LH-13: From To Length Cu (%) Au (g/t)
Upper section 18 180 162 0.2 0.18
Lower section 180 742.3 562.3 0.54 0.25
incl. 434 646 212 0.68 0.3
& incl. 658 710 52 0.82 0.26
LH-14: From To Length Cu (%) Au (g/t)
Total hole 60 715 655 0.26 0.09
incl. 536 582 46 0.42 0.1
& incl. 588 622 34 0.41 0.11
& incl. 658 704 46 0.56 0.18
or incl. 694 704 10 0.83 0.22
Eritrea
Hambok is a volcanogenic massive sulphide copper/zinc project located in the western
lowlands of Eritrea about 12 km southwest of the Bisha deposit, currently being
developed by Nevsun Resources. The Company's land position covers approximately
100 km of favorable stratigraphy northwest and southeast of the Bisha Deposit. A NI 43-
101 report was completed in January, 2009. Indicated resources (at a 0.75% zinc cut-
off) are estimated at 10.7 million tonnes grading 0.98% copper, 2.25% zinc, 6.84 g/t
silver, 0.20 g/t gold containing 231.1 million pounds of copper, 530.7 million pound of
zinc, 2.3 million ounces of silver, 68.8 thousand ounces of gold. There is an additional
inferred resource (at a 0.75% zinc cut-off) of 17.0 million tonnes of 0.85% copper,
1.74% zinc, 5.89 g/t silver, 0.19 g/t gold containing, 318.5 million pounds of copper,
652.1 million pounds of zinc, 3.2 million ounces of silver, and 103.8 thousand ounces of
gold. The Company holds its exploration ground through exploration licenses granted
by the Eritrean government. The gov't retains a 10% carried interest in all discoveries
and has the right to acquire an additional, fully contributing, participatory int. in any
discovery.
Project Updates:
February 22, 2011 - NGEx Drills 711 Metres 0.54% Copper and 0.26
Grams/Tonnes Gold at Los Helados, Chile
NGEx reported results from the first three diamond drill holes completed this season at
the Los Helados project located in Chile's Region 3. LH-12 and LH-13 are the best
holes drilled to date at Los Helados in terms of thickness and grade of copper-gold
mineralization. Of particular interest is the fact that in both of these holes significant
copper grade extends from the first contact with bedrock to the bottom and there are
significant intervals of >0.8% copper in both LH-13 and LH-14. Accessory gold is
present from top to bottom in all three holes. The three holes reported are part of an on-
going drill program that will total at least 10 to 11 holes and is expected to continue
until the end of the summer exploration season in mid-April. The objective of the
current drill program is to better define a zone of higher grade mineralization that was
first intersected in previously reported drill hole LH-04 which intersected 762 metres of
0.43% copper and 0.22 grams/tonne including 345 metres of 0.57% copper and 0.21
grams/tonne gold. Weather and time permitting the Company hopes to complete
sufficient drilling in this zone to permit calculation of an initial resource estimate by the
end of 2011.
The higher grade mineralization reported is hosted within a magmatic-hydrothermal
breccia body that based on mapping and drilling to date has an estimated area of
approximately 500 metres by 600 metres and extends to depths of more than 700
metres although further drilling is required to confirm these dimensions. Preliminary
interpretation suggests that LH-12 and LH13 were drilled largely within the breccia
body. LH-14 appears to have been collared to the east of the breccia and only
intersected it at depth. It is noteworthy that hole LH-14 contains good grade
mineralization at depth. Based on drilling to date the breccia body appears to be open
to the west of holes LH-12 and LH-13 and perhaps to the west of LH-14.
The higher grade mineralization is associated with potassic alteration which is
represented by strong biotite alteration. In the upper part of the system the potassic
alteration is overprinted by a chlorite-sericite assemblage that resulted in the
introduction of pyrite and alteration of magnetite to hematite and apparently a slight
reduction in copper grade.
Source: Company reports.
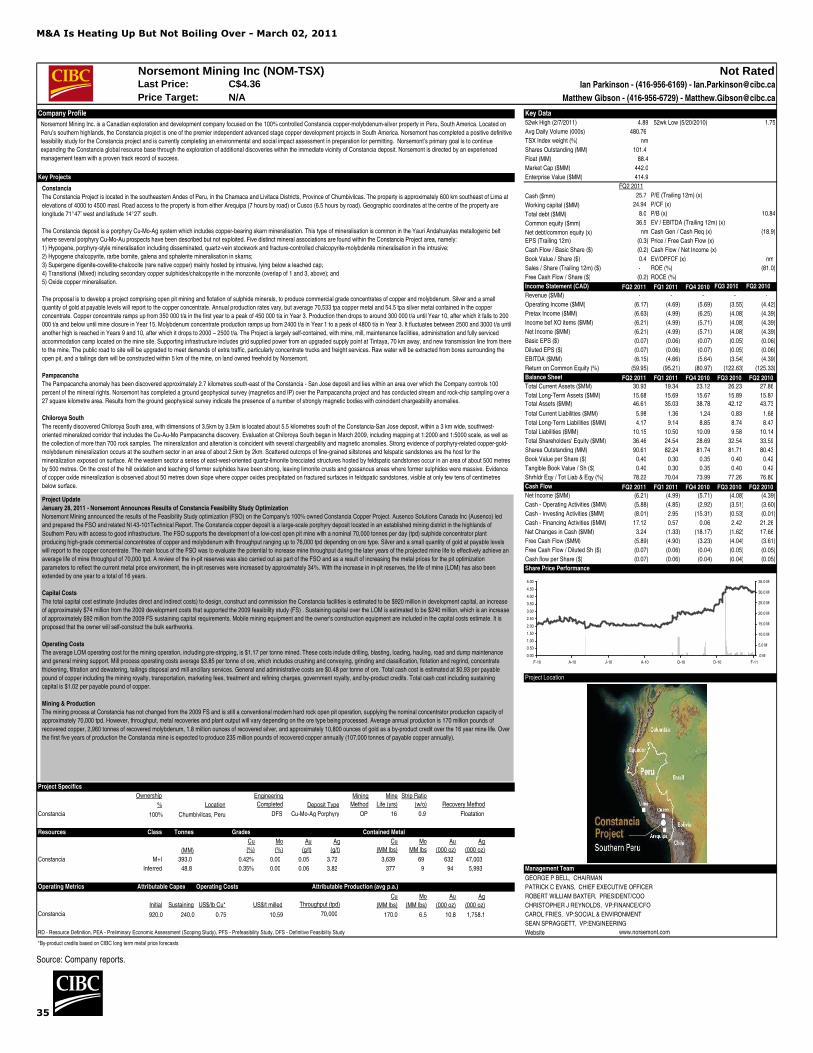
M&A Is Heating Up But Not Boiling Over - March 02, 2011
35
Norsemont Mining Inc (NOM-TSX) Not RatedLast Price: Ian Parkinson - (416-956-6169) - [email protected]
Price Target: N/A Matthew Gibson - (416-956-6729) - [email protected]
Company Profile Key Data52wk High (2/7/2011) 4.89 52wk Low (5/20/2010) 1.75
Avg Daily Volume (000s) 480.76
TSX Index weight (%) nm
Shares Outstanding (MM) 101.4
Float (MM) 88.4
Market Cap ($MM) 442.0
Key Projects Enterprise Value ($MM) 414.9
FQ2 2011
Cash ($mm) 25.7 P/E (Trailing 12m) (x) #N/A N/A
Working capital ($MM) 24.94 P/CF (x) #N/A N/A
Total debt ($MM) 8.0 P/B (x) 10.84
Common equity ($mm) 36.5 EV / EBITDA (Trailing 12m) (x) #N/A N/A
Net debt/common equity (x) nm Cash Gen / Cash Req (x) (18.9)
EPS (Trailing 12m) (0.3) Price / Free Cash Flow (x) #N/A N/A
Cash Flow / Basic Share ($) (0.2) Cash Flow / Net Income (x) #N/A N/A
Book Value / Share ($) 0.4 EV/OPFCF (x) nm
Sales / Share (Trailing 12m) ($) - ROE (%) (81.0)
Free Cash Flow / Share ($) (0.2) ROCE (%) #N/A N/A
Income Statement (CAD) FQ2 2011 FQ1 2011 FQ4 2010 FQ3 2010 FQ2 2010
Revenue ($MM) - - - - -
Operating Income ($MM) (6.17) (4.69) (5.69) (3.55) (4.42)
Pretax Income ($MM) (6.63) (4.99) (6.25) (4.08) (4.39)
Income bef XO items ($MM) (6.21) (4.99) (5.71) (4.08) (4.39)
Net Income ($MM) (6.21) (4.99) (5.71) (4.08) (4.39)
Basic EPS ($) (0.07) (0.06) (0.07) (0.05) (0.06)
Diluted EPS ($) (0.07) (0.06) (0.07) (0.05) (0.06)
EBITDA ($MM) (6.15) (4.66) (5.64) (3.54) (4.39)
Return on Common Equity (%) (59.95) (95.21) (80.97) (122.63) (125.33)
Balance Sheet FQ2 2011 FQ1 2011 FQ4 2010 FQ3 2010 FQ2 2010
Total Current Assets ($MM) 30.93 19.34 23.12 26.23 27.86
Total Long-Term Assets ($MM) 15.68 15.69 15.67 15.89 15.87
Total Assets ($MM) 46.61 35.03 38.78 42.12 43.73
Total Current Liabilities ($MM) 5.98 1.36 1.24 0.83 1.68
Total Long-Term Liabilities ($MM) 4.17 9.14 8.85 8.74 8.47
Total Liabilities ($MM) 10.15 10.50 10.09 9.58 10.14
Total Shareholders' Equity ($MM) 36.46 24.54 28.69 32.54 33.59
Shares Outstanding (MM) 90.61 82.24 81.74 81.71 80.43
Book Value per Share ($) 0.40 0.30 0.35 0.40 0.42
Tangible Book Value / Sh ($) 0.40 0.30 0.35 0.40 0.42
Shrhldr Eqy / Tot Liab & Eqy (%) 78.22 70.04 73.99 77.26 76.80
Cash Flow FQ2 2011 FQ1 2011 FQ4 2010 FQ3 2010 FQ2 2010
Net Income ($MM) (6.21) (4.99) (5.71) (4.08) (4.39)
Cash - Operating Activities ($MM) (5.88) (4.85) (2.92) (3.51) (3.60)
Cash - Investing Activities ($MM) (8.01) 2.95 (15.31) (0.53) (0.01)
Cash - Financing Activities ($MM) 17.12 0.57 0.06 2.42 21.26
Net Changes in Cash ($MM) 3.24 (1.33) (18.17) (1.62) 17.66
Free Cash Flow ($MM) (5.89) (4.90) (3.23) (4.04) (3.61)
Free Cash Flow / Diluted Sh ($) (0.07) (0.06) (0.04) (0.05) (0.05)
Cash flow per Share ($) (0.07) (0.06) (0.04) (0.04) (0.05)
Share Price Performance
Project Location
Project Specifics
Ownership
% Location Deposit Type
Constancia 100% Chumbivilcas, Peru DFS Cu-Mo-Ag Porphyry OP 16 0.9 Floatation
Resources Class Tonnes Grades Contained Metal
(MM)
Constancia M+I 393.0 0.42% 0.00 0.05 3.72 3,639 69 632 47,003
Inferred 48.8 0.35% 0.00 0.06 3.82 377 9 94 5,993 Management Team
GEORGE P BELL, CHAIRMAN
Operating Metrics Attributable Capex Operating Costs Attributable Production (avg p.a.) PATRICK C EVANS, CHIEF EXECUTIVE OFFICER
ROBERT WILLIAM BAXTER, PRESIDENT/COO
Initial Sustaining US$/lb Cu* US$/t milled CHRISTOPHER J REYNOLDS, VP:FINANCE/CFO
Constancia 920.0 240.0 0.75 10.59 70,000 170.0 6.5 10.8 1,758.1 CAROL FRIES, VP:SOCIAL & ENVIRONMENT
SEAN SPRAGGETT, VP:ENGINEERING
RD - Resource Definition, PEA - Preliminary Economic Assessment (Scoping Study), PFS - Prefeasibility Study, DFS - Definitive Feasibility Study Website www.norsemont.com
*By-product credits based on CIBC long term metal price forecasts
Cu
(MM lbs)
Mo
(MM lbs)
Au
(000 oz)
Ag
(000 oz)
Cu
(MM lbs)
Mo
MM lbs
Au
(000 oz)
Ag
(000 oz)
Cu
(%)
Mo
(%)
Au
(g/t)
Ag
(g/t)
Throughput (tpd)
C$4.36
Engineering
Completed
Mining
Method
Mine
Life (yrs)
Strip Ratio
(w/o) Recovery Method
Constancia
The Constancia Project is located in the southeastern Andes of Peru, in the Chamaca and Livitaca Districts, Province of Chumbivilcas. The property is approximately 600 km southeast of Lima at
elevations of 4000 to 4500 masl. Road access to the property is from either Arequipa (7 hours by road) or Cusco (6.5 hours by road). Geographic coordinates at the centre of the property are
longitude 71°47’ west and latitude 14°27’ south.
The Constancia deposit is a porphyry Cu-Mo-Ag system which includes copper-bearing skarn mineralisation. This type of mineralisation is common in the Yauri Andahuaylas metallogenic belt
where several porphyry Cu-Mo-Au prospects have been described but not exploited. Five distinct mineral associations are found within the Constancia Project area, namely:
1) Hypogene, porphyry-style mineralisation including disseminated, quartz-vein stockwork and fracture-controlled chalcopyrite-molybdenite mineralisation in the intrusive;
2) Hypogene chalcopyrite, rarbe bornite, galena and sphalerite mineralisation in skarns;
3) Supergene digenite-covellite-chalcocite (rare native copper) mainly hosted by intrusive, lying below a leached cap;
4) Transitional (Mixed) including secondary copper sulphides/chalcopyrite in the monzonite (overlap of 1 and 3, above); and
5) Oxide copper mineralisation.
The proposal is to develop a project comprising open pit mining and flotation of sulphide minerals, to produce commercial grade concentrates of copper and molybdenum. Silver and a small
quantity of gold at payable levels will report to the copper concentrate. Annual production rates vary, but average 70,533 tpa copper metal and 54.5 tpa silver metal contained in the copper
concentrate. Copper concentrate ramps up from 350 000 t/a in the first year to a peak of 450 000 t/a in Year 3. Production then drops to around 300 000 t/a until Year 10, after which it falls to 200
000 t/a and below until mine closure in Year 15. Molybdenum concentrate production ramps up from 2400 t/a in Year 1 to a peak of 4800 t/a in Year 3. It fluctuates between 2500 and 3000 t/a until
another high is reached in Years 9 and 10, after which it drops to 2000 – 2500 t/a. The Project is largely self-contained, with mine, mill, maintenance facilities, administration and fully serviced
accommodation camp located on the mine site. Supporting infrastructure includes grid supplied power from an upgraded supply point at Tintaya, 70 km away, and new transmission line from there
to the mine. The public road to site will be upgraded to meet demands of extra traffic, particularly concentrate trucks and freight services. Raw water will be extracted from bores surrounding the
open pit, and a tailings dam will be constructed within 5 km of the mine, on land owned freehold by Norsemont.
Pampacancha
The Pampacancha anomaly has been discovered approximately 2.7 kilometres south-east of the Constancia - San Jose deposit and lies within an area over which the Company controls 100
percent of the mineral rights. Norsemont has completed a ground geophysical survey (magnetics and IP) over the Pampacancha project and has conducted stream and rock-chip sampling over a
27 square kilometre area. Results from the ground geophysical survey indicate the presence of a number of strongly magnetic bodies with coincident chargeability anomalies.
Chiloroya South
The recently discovered Chiloroya South area, with dimensions of 3.5km by 3.5km is located about 5.5 kilometres south of the Constancia-San Jose deposit, within a 3 km wide, southwest-
oriented mineralized corridor that includes the Cu-Au-Mo Pampacancha discovery. Evaluation at Chiloroya South began in March 2009, including mapping at 1:2000 and 1:5000 scale, as well as
the collection of more than 700 rock samples. The mineralization and alteration is coincident with several chargeability and magnetic anomalies. Strong evidence of porphyry-related copper-gold-
molybdenum mineralization occurs at the southern sector in an area of about 2.5km by 2km. Scattered outcrops of fine-grained siltstones and felspatic sandstones are the host for the
mineralization exposed on surface. At the western sector a series of east-west-oriented quartz-limonite brecciated structures hosted by feldspatic sandstones occur in an area of about 500 metres
by 500 metres. On the crest of the hill oxidation and leaching of former sulphides have been strong, leaving limonite crusts and gossanous areas where former sulphides were massive. Evidence
of copper oxide mineralization is observed about 50 metres down slope where copper oxides precipitated on fractured surfaces in feldspatic sandstones, visible at only few tens of centimetres
below surface.
Norsemont Mining Inc. is a Canadian exploration and development company focused on the 100% controlled Constancia copper-molybdenum-silver property in Peru, South America. Located on
Peru’s southern highlands, the Constancia project is one of the premier independent advanced stage copper development projects in South America. Norsemont has completed a positive definitive
feasibility study for the Constancia project and is currently completing an environmental and social impact assessment in preparation for permitting. Norsemont’s primary goal is to continue
expanding the Constancia global resource base through the exploration of additional discoveries within the immediate vicinity of Constancia deposit. Norsemont is directed by an experienced
management team with a proven track record of success.
0.00
0.50
1.00
1.50
2.00
2.50
3.00
3.50
4.00
4.50
5.00
F-10 A-10 J-10 A-10 O-10 D-10 F-11
.0 M
5.0 M
10.0 M
15.0 M
20.0 M
25.0 M
30.0 M
35.0 M
Project Update
January 28, 2011 - Norsemont Announces Results of Constancia Feasibility Study Optimization
Norsemont Mining announced the results of the Feasibility Study optimization (FSO) on the Company’s 100% owned Constancia Copper Project. Ausenco Solutions Canada Inc (Ausenco) led
and prepared the FSO and related NI 43-101Technical Report. The Constancia copper deposit is a large-scale porphyry deposit located in an established mining district in the highlands of
Southern Peru with access to good infrastructure. The FSO supports the development of a low-cost open pit mine with a nominal 70,000 tonnes per day (tpd) sulphide concentrator plant
producing high-grade commercial concentrates of copper and molybdenum with throughput ranging up to 76,000 tpd depending on ore type. Silver and a small quantity of gold at payable levels
will report to the copper concentrate. The main focus of the FSO was to evaluate the potential to increase mine throughput during the later years of the projected mine life to effectively achieve an
average life of mine throughput of 70,000 tpd. A review of the in-pit reserves was also carried out as part of the FSO and as a result of increasing the metal prices for the pit optimization
parameters to reflect the current metal price environment, the in-pit reserves were increased by approximately 34%. With the increase in in-pit reserves, the life of mine (LOM) has also been
extended by one year to a total of 16 years.
Capital Costs
The total capital cost estimate (includes direct and indirect costs) to design, construct and commission the Constancia facilities is estimated to be $920 million in development capital, an increase
of approximately $74 million from the 2009 development costs that supported the 2009 feasibility study (FS) . Sustaining capital over the LOM is estimated to be $240 million, which is an increase
of approximately $92 million from the 2009 FS sustaining capital requirements. Mobile mining equipment and the owner’s construction equipment are included in the capital costs estimate. It is
proposed that the owner will self-construct the bulk earthworks.
Operating Costs
The average LOM operating cost for the mining operation, including pre-stripping, is $1.17 per tonne mined. These costs include drilling, blasting, loading, hauling, road and dump maintenance
and general mining support. Mill process operating costs average $3.85 per tonne of ore, which includes crushing and conveying, grinding and classification, flotation and regrind, concentrate
thickening, filtration and dewatering, tailings disposal and mill ancillary services. General and administrative costs are $0.48 per tonne of ore. Total cash cost is estimated at $0.93 per payable
pound of copper including the mining royalty, transportation, marketing fees, treatment and refining charges, government royalty, and by-product credits. Total cash cost including sustaining
capital is $1.02 per payable pound of copper.
Mining & Production
The mining process at Constancia has not changed from the 2009 FS and is still a conventional modern hard rock open pit operation, supplying the nominal concentrator production capacity of
approximately 70,000 tpd. However, throughput, metal recoveries and plant output will vary depending on the ore type being processed. Average annual production is 170 million pounds of
recovered copper, 2,960 tonnes of recovered molybdenum, 1.8 million ounces of recovered silver, and approximately 10,800 ounces of gold as a by-product credit over the 16 year mine life. Over
the first five years of production the Constancia mine is expected to produce 235 million pounds of recovered copper annually (107,000 tonnes of payable copper annually).
Source: Company reports.
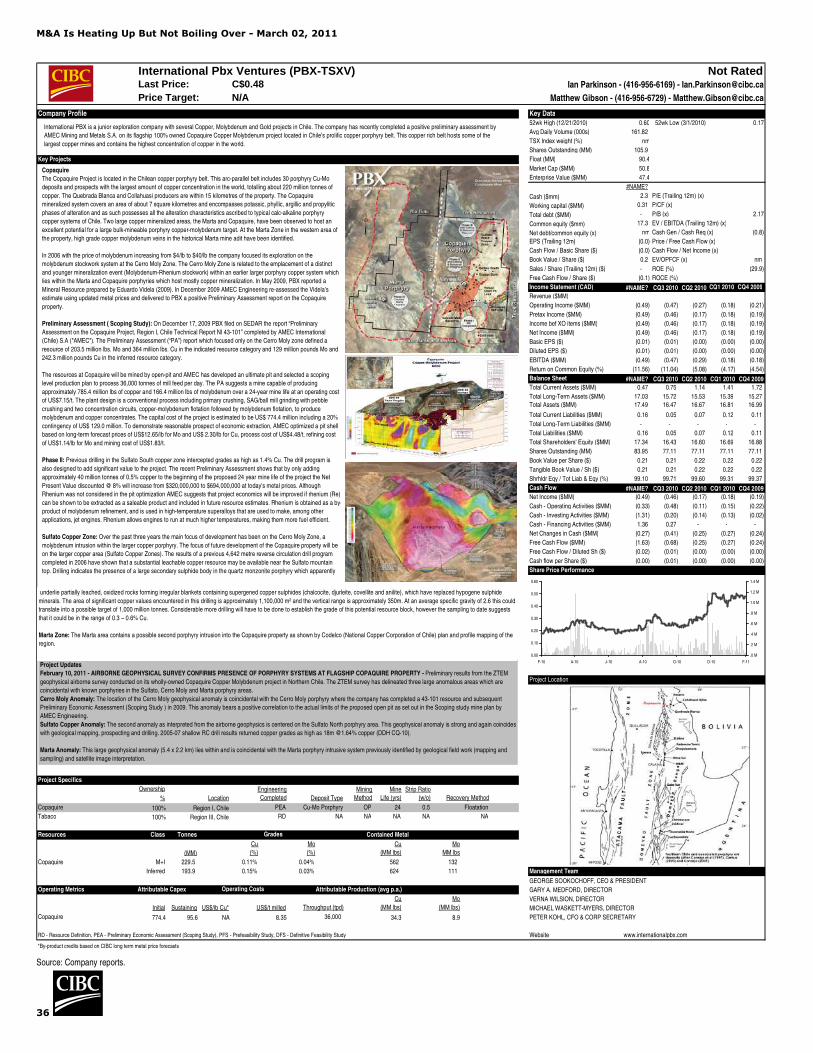
M&A Is Heating Up But Not Boiling Over - March 02, 2011
36
International Pbx Ventures (PBX-TSXV) Not RatedLast Price: Ian Parkinson - (416-956-6169) - [email protected]
Price Target: N/A Matthew Gibson - (416-956-6729) - [email protected]
Company Profile Key Data52wk High (12/21/2010) 0.60 52wk Low (3/1/2010) 0.17
Avg Daily Volume (000s) 161.82
TSX Index weight (%) nm
Shares Outstanding (MM) 105.9
Key Projects Float (MM) 90.4
Market Cap ($MM) 50.8
Enterprise Value ($MM) 47.4
#NAME?
Cash ($mm) 2.3 P/E (Trailing 12m) (x) #N/A N/A
Working capital ($MM) 0.31 P/CF (x) #N/A N/A
Total debt ($MM) - P/B (x) 2.17
Common equity ($mm) 17.3 EV / EBITDA (Trailing 12m) (x) #N/A N/A
Net debt/common equity (x) nm Cash Gen / Cash Req (x) (0.8)
EPS (Trailing 12m) (0.0) Price / Free Cash Flow (x) #N/A N/A
Cash Flow / Basic Share ($) (0.0) Cash Flow / Net Income (x) #N/A N/A
Book Value / Share ($) 0.2 EV/OPFCF (x) nm
Sales / Share (Trailing 12m) ($) - ROE (%) (29.9)
Free Cash Flow / Share ($) (0.1) ROCE (%) #N/A N/A
Income Statement (CAD) #NAME? CQ3 2010 CQ2 2010 CQ1 2010 CQ4 2009
Revenue ($MM) #N/A N/A #N/A N/A #N/A N/A #N/A N/A #N/A N/A
Operating Income ($MM) (0.49) (0.47) (0.27) (0.18) (0.21)
Pretax Income ($MM) (0.49) (0.46) (0.17) (0.18) (0.19)
Income bef XO items ($MM) (0.49) (0.46) (0.17) (0.18) (0.19)
Net Income ($MM) (0.49) (0.46) (0.17) (0.18) (0.19)
Basic EPS ($) (0.01) (0.01) (0.00) (0.00) (0.00)
Diluted EPS ($) (0.01) (0.01) (0.00) (0.00) (0.00)
EBITDA ($MM) (0.49) (0.47) (0.29) (0.18) (0.18)
Return on Common Equity (%) (11.56) (11.04) (5.08) (4.17) (4.54)
Balance Sheet #NAME? CQ3 2010 CQ2 2010 CQ1 2010 CQ4 2009
Total Current Assets ($MM) 0.47 0.75 1.14 1.41 1.72
Total Long-Term Assets ($MM) 17.03 15.72 15.53 15.39 15.27
Total Assets ($MM) 17.49 16.47 16.67 16.81 16.99
Total Current Liabilities ($MM) 0.16 0.05 0.07 0.12 0.11
Total Long-Term Liabilities ($MM) - - - - -
Total Liabilities ($MM) 0.16 0.05 0.07 0.12 0.11
Total Shareholders' Equity ($MM) 17.34 16.43 16.60 16.69 16.88
Shares Outstanding (MM) 83.95 77.11 77.11 77.11 77.11
Book Value per Share ($) 0.21 0.21 0.22 0.22 0.22
Tangible Book Value / Sh ($) 0.21 0.21 0.22 0.22 0.22
Shrhldr Eqy / Tot Liab & Eqy (%) 99.10 99.71 99.60 99.31 99.37
Cash Flow #NAME? CQ3 2010 CQ2 2010 CQ1 2010 CQ4 2009
Net Income ($MM) (0.49) (0.46) (0.17) (0.18) (0.19)
Cash - Operating Activities ($MM) (0.33) (0.48) (0.11) (0.15) (0.22)
Cash - Investing Activities ($MM) (1.31) (0.20) (0.14) (0.13) (0.02)
Cash - Financing Activities ($MM) 1.36 0.27 - - -
Net Changes in Cash ($MM) (0.27) (0.41) (0.25) (0.27) (0.24)
Free Cash Flow ($MM) (1.63) (0.68) (0.25) (0.27) (0.24)
Free Cash Flow / Diluted Sh ($) (0.02) (0.01) (0.00) (0.00) (0.00)
Cash flow per Share ($) (0.00) (0.01) (0.00) (0.00) (0.00)
Share Price Performance
Project Location
Project Specifics
Ownership
% Location Deposit Type
Copaquire 100% Region I, Chile PEA Cu-Mo Porphyry OP 24 0.5 Floatation
Tabaco 100% Region III, Chile RD NA NA NA NA NA
Resources Class Tonnes Contained Metal
(MM)
Copaquire M+I 229.5 0.11% 0.04% 562 132
Inferred 193.9 0.15% 0.03% 624 111 Management Team
GEORGE SOOKOCHOFF, CEO & PRESIDENT
Operating Metrics Attributable Capex Attributable Production (avg p.a.) GARY A. MEDFORD, DIRECTOR
VERNA WILSION, DIRECTOR
Initial Sustaining US$/lb Cu* US$/t milled MICHAEL WASKETT-MYERS, DIRECTOR
Copaquire 774.4 95.6 NA 8.35 36,000 34.3 8.9 PETER KOHL, CFO & CORP SECRETARY
RD - Resource Definition, PEA - Preliminary Economic Assessment (Scoping Study), PFS - Prefeasibility Study, DFS - Definitive Feasibility Study Website www.internationalpbx.com
*By-product credits based on CIBC long term metal price forecasts
C$0.48
Engineering
Completed
Mining
Method
Throughput (tpd)
Mo
MM lbs
Cu
(MM lbs)
Mo
(MM lbs)
Operating Costs
Mine
Life (yrs)
Strip Ratio
(w/o) Recovery Method
Cu
(%)
Mo
(%)
Grades
Cu
(MM lbs)
Copaquire
The Copaquire Project is located in the Chilean copper porphyry belt. This arc-parallel belt includes 30 porphyry Cu-Mo
deposits and prospects with the largest amount of copper concentration in the world, totalling about 220 million tonnes of
copper. The Quebrada Blanca and Collahuasi producers are within 15 kilometres of the property. The Copaquire
mineralized system covers an area of about 7 square kilometres and encompasses potassic, phyllic, argillic and propylitic
phases of alteration and as such possesses all the alteration characteristics ascribed to typical calc-alkaline porphyry
copper systems of Chile. Two large copper mineralized areas, the Marta and Copaquire, have been observed to host an
excellent potential for a large bulk-mineable porphyry copper-molybdenum target. At the Marta Zone in the western area of
the property, high grade copper molybdenum veins in the historical Marta mine adit have been identified.
In 2006 with the price of molybdenum increasing from $4/lb to $40/lb the company focused its exploration on the
molybdenum stockwork system at the Cerro Moly Zone. The Cerro Moly Zone is related to the emplacement of a distinct
and younger mineralization event (Molybdenum-Rhenium stockwork) within an earlier larger porphyry copper system which
lies within the Marta and Copaquire porphyries which host mostly copper mineralization. In May 2009, PBX reported a
Mineral Resource prepared by Eduardo Videla (2009). In December 2009 AMEC Engineering re-assessed the Videla’s
estimate using updated metal prices and delivered to PBX a positive Preliminary Assessment report on the Copaquire
property.
Preliminary Assessment ( Scoping Study): On December 17, 2009 PBX filed on SEDAR the report “Preliminary
Assessment on the Copaquire Project, Region I, Chile Technical Report NI 43-101” completed by AMEC International
(Chile) S.A ("AMEC"). The Preliminary Assessment (“PA”) report which focused only on the Cerro Moly zone defined a
resource of 203.5 million lbs. Mo and 364 million lbs. Cu in the indicated resource category and 129 million pounds Mo and
242.3 million pounds Cu in the inferred resource category.
The resources at Copaquire will be mined by open-pit and AMEC has developed an ultimate pit and selected a scoping
level production plan to process 36,000 tonnes of mill feed per day. The PA suggests a mine capable of producing
approximately 785.4 million lbs of copper and 166.4 million lbs of molybdenum over a 24-year mine life at an operating cost
of US$7.15/t. The plant design is a conventional process including primary crushing, SAG/ball mill grinding with pebble
crushing and two concentration circuits, copper-molybdenum flotation followed by molybdenum flotation, to produce
molybdenum and copper concentrates. The capital cost of the project is estimated to be US$ 774.4 million including a 20%
contingency of US$ 129.0 million. To demonstrate reasonable prospect of economic extraction, AMEC optimized a pit shell
based on long-term forecast prices of US$12.65/lb for Mo and US$ 2.30/lb for Cu, process cost of US$4.48/t, refining cost
of US$1.14/lb for Mo and mining cost of US$1.83/t.
Phase II: Previous drilling in the Sulfato South copper zone intercepted grades as high as 1.4% Cu. The drill program is
also designed to add significant value to the project. The recent Preliminary Assessment shows that by only adding
approximately 40 million tonnes of 0.5% copper to the beginning of the proposed 24 year mine life of the project the Net
Present Value discounted @ 8% will increase from $320,000,000 to $694,000,000 at today's metal prices. Although
Rhenium was not considered in the pit optimization AMEC suggests that project economics will be improved if rhenium (Re)
can be shown to be extracted as a saleable product and included in future resource estimates. Rhenium is obtained as a by-
product of molybdenum refinement, and is used in high-temperature superalloys that are used to make, among other
applications, jet engines. Rhenium allows engines to run at much higher temperatures, making them more fuel efficient.
Sulfato Copper Zone: Over the past three years the main focus of development has been on the Cerro Moly Zone, a
molybdenum intrusion within the larger copper porphyry. The focus of future development of the Copaquire property will be
on the larger copper area (Sulfato Copper Zones). The results of a previous 4,642 metre reverse circulation drill program
completed in 2006 have shown that a substantial leachable copper resource may be available near the Sulfato mountain
top. Drilling indicates the presence of a large secondary sulphide body in the quartz monzonite porphyry which apparently
International PBX is a junior exploration company with several Copper, Molybdenum and Gold projects in Chile. The company has recently completed a positive preliminary assessment by
AMEC Mining and Metals S.A. on its flagship 100% owned Copaquire Copper Molybdenum project located in Chile’s prolific copper porphyry belt. This copper rich belt hosts some of the
largest copper mines and contains the highest concentration of copper in the world.
0.00
0.10
0.20
0.30
0.40
0.50
0.60
F-10 A-10 J-10 A-10 O-10 D-10 F-11
.0 M
.2 M
.4 M
.6 M
.8 M
1.0 M
1.2 M
1.4 M
Project Updates
February 10, 2011 - AIRBORNE GEOPHYSICAL SURVEY CONFIRMS PRESENCE OF PORPHYRY SYSTEMS AT FLAGSHIP COPAQUIRE PROPERTY - Preliminary results from the ZTEM
geophysical airborne survey conducted on its wholly-owned Copaquire Copper Molybdenum project in Northern Chile. The ZTEM survey has delineated three large anomalous areas which are
coincidental with known porphyries in the Sulfato, Cerro Moly and Marta porphyry areas.
Cerro Moly Anomaly: The location of the Cerro Moly geophysical anomaly is coincidental with the Cerro Moly porphyry where the company has completed a 43-101 resource and subsequent
Preliminary Economic Assessment (Scoping Study ) in 2009. This anomaly bears a positive correlation to the actual limits of the proposed open pit as set out in the Scoping study mine plan by
AMEC Engineering.
Sulfato Copper Anomaly: The second anomaly as interpreted from the airborne geophysics is centered on the Sulfato North porphyry area. This geophysical anomaly is strong and again coincides
with geological mapping, prospecting and drilling. 2005-07 shallow RC drill results returned copper grades as high as 18m @1.64% copper (DDH CQ-10).
Marta Anomaly: This large geophysical anomaly (5.4 x 2.2 km) lies within and is coincidental with the Marta porphyry intrusive system previously identified by geological field work (mapping and
sampling) and satellite image interpretation.
underlie partially leached, oxidized rocks forming irregular blankets containing supergened copper sulphides (chalcocite, djurleite, covellite and anilite), which have replaced hypogene sulphide
minerals. The area of significant copper values encountered in this drilling is approximately 1,100,000 m² and the vertical range is approximately 350m. At an average specific gravity of 2.6 this could
translate into a possible target of 1,000 million tonnes. Considerable more drilling will have to be done to establish the grade of this potential resource block, however the sampling to date suggests
that it could be in the range of 0.3 – 0.6% Cu.
Marta Zone: The Marta area contains a possible second porphyry intrusion into the Copaquire property as shown by Codelco (National Copper Corporation of Chile) plan and profile mapping of the
region.
Source: Company reports.

M&A Is Heating Up But Not Boiling Over - March 02, 2011
37
Peregrine Metals Ltd (PGM-TSX) Not RatedLast Price: Ian Parkinson - (416-956-6169) - [email protected]
Price Target: N/A Matthew Gibson - (416-956-6729) - [email protected]
Company Profile Key Data52wk High (3/11/2010) 1.16 52wk Low (8/31/2010) 0.47
Avg Daily Volume (000s) 134.83
TSX Index weight (%) nm
Shares Outstanding (MM) 117.8
Float (MM) 97.5
Market Cap ($MM) 94.2
Key Projects Enterprise Value ($MM) #N/A N/A
CQ3 2010
Cash ($mm) 25.7 P/E (Trailing 12m) (x) #N/A N/A
Working capital ($MM) 13.31 P/CF (x) #N/A N/A
Total debt ($MM) - P/B (x) #N/A N/A
Common equity ($mm) 16.6 EV / EBITDA (Trailing 12m) (x) #N/A N/A
Net debt/common equity (x) nm Cash Gen / Cash Req (x) #N/A N/A
EPS (Trailing 12m) #N/A N/A Price / Free Cash Flow (x) #N/A N/A
Cash Flow / Basic Share ($) #N/A N/A Cash Flow / Net Income (x) #N/A N/A
Book Value / Share ($) #N/A N/A EV/OPFCF (x) nm
Sales / Share (Trailing 12m) ($) #N/A N/A ROE (%) #N/A N/A
Free Cash Flow / Share ($) #N/A N/A ROCE (%) #N/A N/A
Income Statement (CAD) CQ3 2010 CQ2 2010 CQ1 2010
Revenue ($MM) - - -
Operating Income ($MM) (1.63) (4.37) (6.91)
Pretax Income ($MM) (1.60) (4.32) (6.90)
Income bef XO items ($MM) (1.60) (4.32) (6.90)
Net Income ($MM) (1.60) (4.32) (6.90)
Basic EPS ($) (0.01) (0.04) (0.07)
Diluted EPS ($) (0.01) (0.04) (0.07)
EBITDA ($MM) (1.62) (4.36) (6.91)
Return on Common Equity (%) (11.31) (29.29) (40.82)
Balance Sheet CQ3 2010 CQ2 2010 CQ1 2010
Total Current Assets ($MM) 14.02 17.35 25.60
Total Long-Term Assets ($MM) 3.33 3.34 3.04 Total Assets ($MM) 17.35 20.70 28.64
Total Current Liabilities ($MM) 0.71 2.46 6.09
Total Long-Term Liabilities ($MM) - - -
Total Liabilities ($MM) 0.71 2.46 6.09
Total Shareholders' Equity ($MM) 16.64 18.24 22.55
Shares Outstanding (MM) 117.48 117.48 94.21
Book Value per Share ($) 0.14 0.16 0.24
Tangible Book Value / Sh ($) 0.14 0.16 0.24
Shrhldr Eqy / Tot Liab & Eqy (%) 95.88 88.11 78.74
Cash Flow CQ3 2010 CQ2 2010 CQ1 2010Net Income ($MM) (1.60) (4.32) (6.90)
Cash - Operating Activities ($MM) (3.38) (7.96) (1.46)
Cash - Investing Activities ($MM) (0.02) (0.31) 0.06
Cash - Financing Activities ($MM) (0.00) (0.01) 18.09
Net Changes in Cash ($MM) (3.40) (8.28) 16.69
Free Cash Flow ($MM) (3.40) (8.27) (1.40)
Free Cash Flow / Diluted Sh ($) (0.03) (0.07) (0.01)
Cash flow per Share ($) (0.03) (0.07) (0.02)
Share Price Performance
Project Location
Project Specifics
Ownership
% Location Deposit Type
Altar 100% San Juan, Argentina RD Cu Au Porphyry OP NA NA NA
Resources Class Tonnes Management Team
ERIC V FRIEDLAND, CHAIRMAN/PRESIDENT
(MM) GREGORY SHENTON, CHIEF FINANCIAL OFFICER
Altar M+I 802.0 0.42% 0.06 7,426 1,521 RODERICK DAVEY, CHIEF OPERATING OFFICER
Inferred 465.0 0.42% 0.06 4,306 867 BROOKE P CLEMENTS, SENIOR VICE PRESIDENT
MIKE WESTERLUND, VP:INVESTOR RELATIONS
RD - Resource Definition, PEA - Preliminary Economic Assessment (Scoping Study), PFS - Prefeasibility Study, DFS - Definitive Feasibility Study Website www.peregrinemetals.com/
*By-product credits based on CIBC long term metal price forecasts
Mining
Method
Mine
Life (yrs) Recovery Method
Au
(000 oz)
C$0.80
Strip Ratio
(w/o)
Grades Contained Metal
Cu
(%)
Au
(g/t)
Cu
(MM lbs)
Engineering
Completed
Altar
Altar is a large Miocene-aged (approximately 10 million years old) porphyry copper-gold-molybdenum deposit located in the Central Andes of western Argentina close to the border with Chile.
Characteristically, it is a sulphide deposit with a 50 to 150 m thick high-grade (up to >1.0% Cu) chalcocite enrichment zone within the upper part of a large body of chalcopyrite-dominant
mineralization.
Location - Altar is located in San Juan Province, Argentina, an area of considerable mining development activity, including two major projects held by Barrick Gold Corporation, Veladero, a
producing gold mine and Pascua-Lama, an advanced-stage gold development project currently under construction, as well as Gualcamayo, a producing gold mine owned by Yamana Gold Inc.
The site sits at relatively low elevations of 3,100 to 3,300 metres, is accessible seasonally by roads in Argentina and is connected by road to Xstrata's El Pachon copper porphyry project 23
kilometres to the south. Altar is only eight kilometres from the Chilean border and within 16 kilometres of the Chilean roadway system. Ample water sources exist on the property and potential
future power sources will be located 25 kilometres away at El Pachon. The local topography is amenable to the construction of a concentrator and large leach pads.
Project History - In 2003, Rio Tinto drilled the first seven holes at Altar. Peregrine optioned 100% of the property from Rio Tinto in 2005 and initiated an aggressive exploration and drilling
programme that same year. Peregrine Metals now holds a 100% interest in the Altar Project subject to a 1% NSR royalty granted to Rio Tinto and another 1% NSR royalty granted to the
underlying concession owners that may be purchased by Peregrine at any time for US$1 million.
Peregrine Metals is a publicly-traded copper exploration and development company which is listed on the Toronto Stock Exchange (TSX:PGM). Peregrine Metals has a 100% interest in the
large Altar porphyry copper-gold deposit ("Altar" or "the Project") located in San Juan Province, a mining-friendly jurisdiction of Argentina. A total of 149 holes have been drilled at Altar since
2003 for 58,642 metres.
0.00
0.20
0.40
0.60
0.80
1.00
1.20
F-10 A-10 J-10 A-10 O-10 D-10 F-11
.0 M
.5 M
1.0 M
1.5 M
2.0 M
2.5 M
3.0 M
2010 Program and Future Work - The first 2010 drill program was
focused on step-out and infill holes to expand and upgrade the global
copper resource to higher percentages in the Measured and Indicated
category. As a result, the M+I resource increased 74 percent over the
2009 numbers. The second 2010 drilling program provided material for
metallurgical testwork that is currently ongoing, as well as exploration
drilling in the East Zone for gold potential. The preliminary economic
assessment (PEA) on a combined concentrator and leach option, is
schedule for completion in 2011.
Gold Potential - A new gold-copper porphyry called Quebrada de la Mina
has been discovered 2 kilometres north of Altar. Four holes have been
drilled on the new porphyry to date, and the first two assays have been
received showing intersections up to 164 metres of 1.15 g/t gold. The
exposed mineralization exhibits characteristics that are typical of
productive high-sulphidation epithermal gold deposits, including vuggy
silica, multi-stage episodic hydrothermal breccias, colloform and crustiform
banded quartz, and deposition of native sulphur, alunite, barite, copper
sulphates, sulphides and sulphosalts, limonite and boxworks after
sulphides.
Additional gold potential has been recognized in the leached capping of
the Altar porphyry copper deposit, where drill holes have returned intervals
including: 318 metres @ 0.31 g/t gold; 243 metres @ 0.25 g/t gold; and
114 m @ 0.57 g/t gold. The leached capping of the porphyry copper
deposit transitions upwards into the roots of the high-sulphidation
epithermal gold-silver system and together this large volume of material
represents a potential bulk-tonnage, gold-silver target that would be
removed as pre-stripping to accessing a portion of the porphyry copper
mineralization.
Geological Description - The geologic setting and style of mineralization
are typical of large porphyry Cu systems in the Andes. Dacitic to andesitic
flows and ignimbrites of the Permo-Triassic Choiyoi Group are overlain
unconformably by the Cretaceous Pachon Andesite. This stratigraphic
sequence is
intruded by Miocene quartz diorite porphyries. The Altar deposit is exposed at the transition between intense pervasive sericitic alteration (which overprints earlier potassic alteration) and the
overlying advanced argillic lithocap. The broad sericitic alteration zone affects all lithologies on the property and is related to moderate to intense quartz veinlet stockworks, within the quartz
diorite porphyries and to a lesser degree within the intruded volcanics.
Hypogene Cu mineralization occurs as a high-sulphidation chalcocite-covellite-bornite assemblage related to strong sericitic alteration and moderate to intense D-vein development,
overprinting an earlier low-sulphidation chalcopyrite-bornite assemblage related to A- and B-veins preserved in the underlying potassic alteration zone. Most of the Cu-sulphide mineralization
occurs as disseminations and as fracture and vein fillings. Molybdenite occurs in fine quartz-molybdenite veinlets occasionally together with traces of chalcopyrite.
Project Updates
February 23, 2011 - Peregrine Metals Drills 164 Metres of 1.15 Grams Per Tonne Gold at Quebrada de la Mina, a New Porphyry Gold-Copper Discovery at the Altar Project,
Argentina
Peregrine Metals reported the results of the first two core holes, drilled 140 metres apart, into the Quebrada de la Mina ("QDM") porphyry gold-copper discovery located two kilometres
northwest of the Company's large Altar porphyry copper-gold deposit ("Altar") in San Juan Province, Argentina. Intersections from these two holes include 164 metres averaging 1.150 g/t gold
("Au") and 141 metres averaging 0.699 g/t Au.
Drill Hole Azimuth (degrees) Inclination (degrees) Total Depth (m) From (m) To (m) Interval (m) Au (g/t) Cu (%) Ag (g/t) Au Cut-off Grade (g/t)
QDM-01 195 -50 309 9.00 212.00 203.00 0.545 0.036 1.0 0.1
Including 9.00 150.00 141.00 0.699 0.015 1.2 0.3
QDM-02 210 -60 300 14.00 238.00 224.00 0.925 0.065 3.5 0.1
Including 22.00 228.00 206.00 0.987 0.068 3.6 0.2
& Including 38.00 202.00 164.00 1.150 0.074 3.8 0.3
Intersection Grade
Source: Company reports.
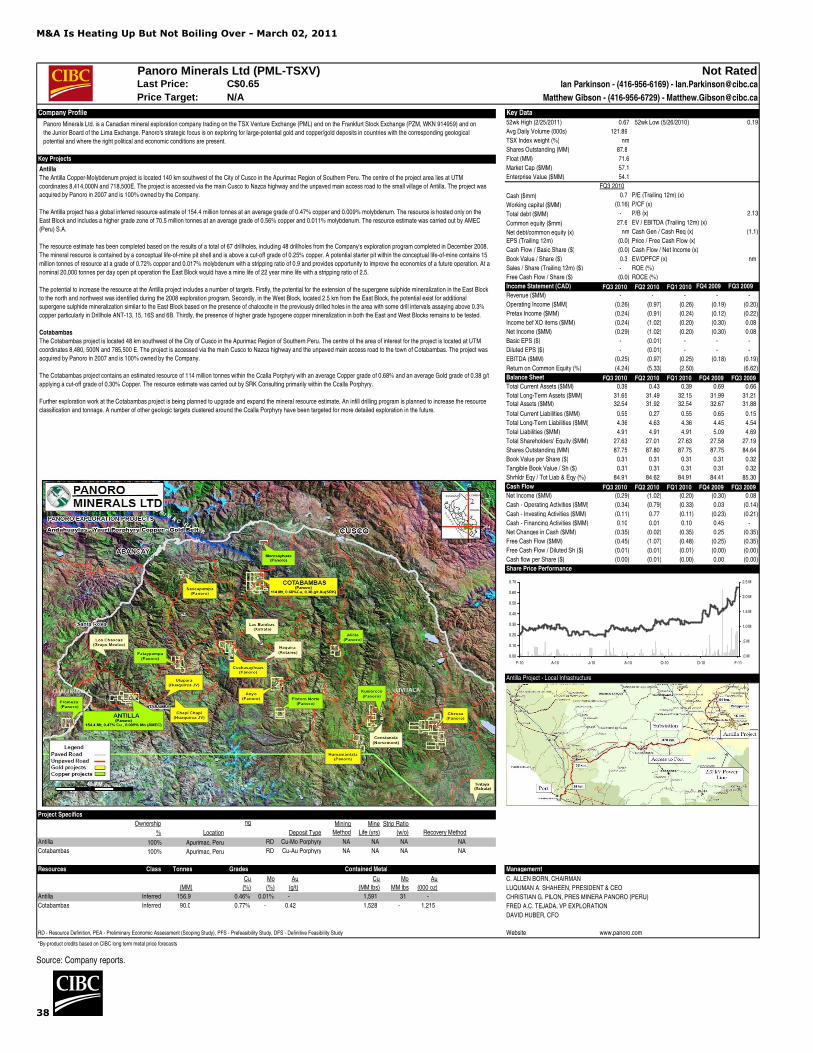
M&A Is Heating Up But Not Boiling Over - March 02, 2011
38
Panoro Minerals Ltd (PML-TSXV) Not RatedLast Price: Ian Parkinson - (416-956-6169) - [email protected]
Price Target: N/A Matthew Gibson - (416-956-6729) - [email protected]
Company Profile Key Data
52wk High (2/25/2011) 0.67 52wk Low (5/26/2010) 0.19
Avg Daily Volume (000s) 121.89
TSX Index weight (%) nm
Shares Outstanding (MM) 87.8
Key Projects Float (MM) 71.6
Market Cap ($MM) 57.1
Enterprise Value ($MM) 54.1
FQ3 2010
Cash ($mm) 0.7 P/E (Trailing 12m) (x) #N/A N/A
Working capital ($MM) (0.16) P/CF (x) #N/A N/A
Total debt ($MM) - P/B (x) 2.13
Common equity ($mm) 27.6 EV / EBITDA (Trailing 12m) (x) #N/A N/A
Net debt/common equity (x) nm Cash Gen / Cash Req (x) (1.1)
EPS (Trailing 12m) (0.0) Price / Free Cash Flow (x) #N/A N/A
Cash Flow / Basic Share ($) (0.0) Cash Flow / Net Income (x) #N/A N/A
Book Value / Share ($) 0.3 EV/OPFCF (x) nm
Sales / Share (Trailing 12m) ($) - ROE (%) #N/A N/A
Free Cash Flow / Share ($) (0.0) ROCE (%) #N/A N/A
Income Statement (CAD) FQ3 2010 FQ2 2010 FQ1 2010 FQ4 2009 FQ3 2009
Revenue ($MM) - - - - -
Operating Income ($MM) (0.26) (0.97) (0.26) (0.19) (0.20)
Pretax Income ($MM) (0.24) (0.91) (0.24) (0.12) (0.22)
Income bef XO items ($MM) (0.24) (1.02) (0.20) (0.30) 0.08
Net Income ($MM) (0.29) (1.02) (0.20) (0.30) 0.08
Basic EPS ($) - (0.01) - - -
Diluted EPS ($) - (0.01) - - -
EBITDA ($MM) (0.25) (0.97) (0.25) (0.18) (0.19)
Return on Common Equity (%) (4.24) (5.33) (2.50) #N/A N/A (6.62)
Balance Sheet FQ3 2010 FQ2 2010 FQ1 2010 FQ4 2009 FQ3 2009Total Current Assets ($MM) 0.39 0.43 0.39 0.69 0.66
Total Long-Term Assets ($MM) 31.65 31.49 32.15 31.99 31.21 Total Assets ($MM) 32.54 31.92 32.54 32.67 31.88
Total Current Liabilities ($MM) 0.55 0.27 0.55 0.65 0.15
Total Long-Term Liabilities ($MM) 4.36 4.63 4.36 4.45 4.54
Total Liabilities ($MM) 4.91 4.91 4.91 5.09 4.69
Total Shareholders' Equity ($MM) 27.63 27.01 27.63 27.58 27.19
Shares Outstanding (MM) 87.75 87.80 87.75 87.75 84.64
Book Value per Share ($) 0.31 0.31 0.31 0.31 0.32
Tangible Book Value / Sh ($) 0.31 0.31 0.31 0.31 0.32
Shrhldr Eqy / Tot Liab & Eqy (%) 84.91 84.62 84.91 84.41 85.30
Cash Flow FQ3 2010 FQ2 2010 FQ1 2010 FQ4 2009 FQ3 2009Net Income ($MM) (0.29) (1.02) (0.20) (0.30) 0.08
Cash - Operating Activities ($MM) (0.34) (0.79) (0.33) 0.03 (0.14)
Cash - Investing Activities ($MM) (0.11) 0.77 (0.11) (0.23) (0.21)
Cash - Financing Activities ($MM) 0.10 0.01 0.10 0.45 -
Net Changes in Cash ($MM) (0.35) (0.02) (0.35) 0.25 (0.35)
Free Cash Flow ($MM) (0.45) (1.07) (0.48) (0.25) (0.35)
Free Cash Flow / Diluted Sh ($) (0.01) (0.01) (0.01) (0.00) (0.00)
Cash flow per Share ($) (0.00) (0.01) (0.00) 0.00 (0.00)
Share Price Performance
Antilla Project - Local Infrastructure
Project Specifics
Ownership ng
% Location Deposit Type
Antilla 100% Apurimac, Peru RD Cu-Mo Porphyry NA NA NA NA
Cotabambas 100% Apurimac, Peru RD Cu-Au Porphyry NA NA NA NA
Resources Class Tonnes Grades Contained Metal Managemernt
C. ALLEN BORN, CHAIRMAN
(MM) LUQUMAN A. SHAHEEN, PRESIDENT & CEO
Antilla Inferred 156.9 0.46% 0.01% - 1,591 31 - CHRISTIAN G. PILON, PRES MINERA PANORO (PERU)
Cotabambas Inferred 90.0 0.77% - 0.42 1,528 - 1,215 FRED A.C. TEJADA, VP EXPLORATION
DAVID HUBER, CFO
RD - Resource Definition, PEA - Preliminary Economic Assessment (Scoping Study), PFS - Prefeasibility Study, DFS - Definitive Feasibility Study Website www.panoro.com
*By-product credits based on CIBC long term metal price forecasts
Strip Ratio
(w/o) Recovery Method
Au
(000 oz)
Cu
(%)
Mo
(%)
Au
(g/t)
Mo
MM lbs
C$0.65
Cu
(MM lbs)
Mining
Method
Mine
Life (yrs)
Antilla
The Antilla Copper-Molybdenum project is located 140 km southwest of the City of Cusco in the Apurimac Region of Southern Peru. The centre of the project area lies at UTM
coordinates 8,414,000N and 718,500E. The project is accessed via the main Cusco to Nazca highway and the unpaved main access road to the small village of Antilla. The project was
acquired by Panoro in 2007 and is 100% owned by the Company.
The Antilla project has a global inferred resource estimate of 154.4 million tonnes at an average grade of 0.47% copper and 0.009% molybdenum. The resource is hosted only on the
East Block and includes a higher grade zone of 70.5 million tonnes at an average grade of 0.56% copper and 0.011% molybdenum. The resource estimate was carried out by AMEC
(Peru) S.A.
The resource estimate has been completed based on the results of a total of 67 drillholes, including 48 drillholes from the Company's exploration program completed in December 2008.
The mineral resource is contained by a conceptual life-of-mine pit shell and is above a cut-off grade of 0.25% copper. A potential starter pit within the conceptual life-of-mine contains 15
million tonnes of resource at a grade of 0.72% copper and 0.017% molybdenum with a stripping ratio of 0.9 and provides opportunity to improve the economics of a future operation. At a
nominal 20,000 tonnes per day open pit operation the East Block would have a mine life of 22 year mine life with a stripping ratio of 2.5.
The potential to increase the resource at the Antilla project includes a number of targets. Firstly, the potential for the extension of the supergene sulphide mineralization in the East Block
to the north and northwest was identified during the 2008 exploration program. Secondly, in the West Block, located 2.5 km from the East Block, the potential exist for additional
supergene sulphide mineralization similar to the East Block based on the presence of chalcocite in the previously drilled holes in the area with some drill intervals assaying above 0.3%
copper particularly in Drillhole ANT-13, 15, 16S and 6B. Thirdly, the presence of higher grade hypogene copper mineralization in both the East and West Blocks remains to be tested.
Cotabambas
The Cotabambas project is located 48 km southwest of the City of Cusco in the Apurimac Region of Southern Peru. The centre of the area of interest for the project is located at UTM
coordinates 8,480, 500N and 785,500 E. The project is accessed via the main Cusco to Nazca highway and the unpaved main access road to the town of Cotabambas. The project was
acquired by Panoro in 2007 and is 100% owned by the Company.
The Cotabambas project contains an estimated resource of 114 million tonnes within the Ccalla Porphyry with an average Copper grade of 0.68% and an average Gold grade of 0.38 g/t
applying a cut-off grade of 0.30% Copper. The resource estimate was carried out by SRK Consulting primarily within the Ccalla Porphyry.
Further exploration work at the Cotabambas project is being planned to upgrade and expand the mineral resource estimate. An infill drilling program is planned to increase the resource
classification and tonnage. A number of other geologic targets clustered around the Ccalla Porphyry have been targeted for more detailed exploration in the future.
Panoro Minerals Ltd. is a Canadian mineral exploration company trading on the TSX Venture Exchange (PML) and on the Frankfurt Stock Exchange (PZM, WKN 914959) and on
the Junior Board of the Lima Exchange. Panoro's strategic focus is on exploring for large-potential gold and copper/gold deposits in countries with the corresponding geological
potential and where the right political and economic conditions are present.
0.00
0.10
0.20
0.30
0.40
0.50
0.60
0.70
F-10 A-10 J-10 A-10 O-10 D-10 F-11
.0 M
.5 M
1.0 M
1.5 M
2.0 M
2.5 M
Source: Company reports.

M&A Is Heating Up But Not Boiling Over - March 02, 2011
39
Polymet Mining Corp (POM-TSX) Not RatedLast Price: Ian Parkinson - (416-956-6169) - [email protected]
Price Target: N/A Matthew Gibson - (416-956-6729) - [email protected]
Company Profile Key Data52wk High (3/11/2010) 2.80 52wk Low (6/23/2010) 1.33
Toronto New York
Avg Daily Volume (000s) 122.00 502
Shares Outstanding (MM) 149.5
Key Projects Float (MM) 118.3
Market Cap ($MM) 317.0
Enterprise Value ($MM) 356.5
FQ3 2011
Cash ($mm) 21.4 P/E (Trailing 12m) (x) #N/A N/A
Working capital ($MM) 16.31 P/CF (x) #N/A N/A
Total debt ($MM) 35.8 P/B (x) 3.41
Common equity ($mm) 97.6 EV / EBITDA (Trailing 12m) (x) #N/A N/A
Net debt/common equity (x) 0.1471809 Cash Gen / Cash Req (x) (0.1)
EPS (Trailing 12m) (0.1) Price / Free Cash Flow (x) #N/A N/A
Cash Flow / Basic Share ($) (0.0) Cash Flow / Net Income (x) #N/A N/A
Book Value / Share ($) 0.6 EV/OPFCF (x) nm
Sales / Share (Trailing 12m) ($) - ROE (%) (10.7)
Free Cash Flow / Share ($) (0.1) ROCE (%) #N/A N/A
Income Statement (USD) FQ3 2011 FQ2 2011 FQ1 2011 FQ4 2010 FQ3 2010
Revenue ($MM) - - - - -
Operating Income ($MM) 0.52 (2.56) (0.94) (6.18) #N/A N/A
Pretax Income ($MM) (0.51) (2.49) (0.86) (5.16) #N/A N/A
Income bef XO items ($MM) (0.51) (2.49) (0.86) (5.16) #N/A N/A
Net Income ($MM) (0.51) (2.49) (0.86) (5.16) #N/A N/A
Basic EPS ($) (0.06) (0.02) (0.01) (0.03) #N/A N/A
Diluted EPS ($) (0.06) (0.02) (0.01) (0.03) #N/A N/A
EBITDA ($MM) 6.34 (2.56) (0.94) (6.17) #N/A N/A
Return on Common Equity (%) (10.75) (11.18) (9.37) (9.55) #N/A N/A
Balance Sheet (US$) FQ3 2011 FQ2 2011 FQ1 2011 FQ4 2010 FQ3 2010
Total Current Assets ($MM) 22.02 10.49 15.79 22.02 #N/A N/A
Total Long-Term Assets ($MM) 117.63 125.96 122.95 117.63 #N/A N/ATotal Assets ($MM) 139.65 136.45 138.74 139.65 #N/A N/A
Total Current Liabilities ($MM) 5.71 4.99 5.28 5.71 #N/A N/A
Total Long-Term Liabilities ($MM) 36.37 36.15 36.27 36.37 #N/A N/A
Total Liabilities ($MM) 42.08 41.13 41.55 42.08 #N/A N/A
Total Shareholders' Equity ($MM) 97.57 95.32 97.20 97.57 #N/A N/A
Shares Outstanding (MM) 139.46 149.23 149.01 148.98 #N/A N/A
Book Value per Share ($) 0.70 0.64 0.65 0.65 #N/A N/A
Tangible Book Value / Sh ($) 0.70 #N/A N/A 0.65 0.65 #N/A N/A
Shrhldr Eqy / Tot Liab & Eqy (%) 69.87 69.86 70.06 69.87 #N/A N/A
Cash Flow (US$) FQ3 2011 FQ2 2011 FQ1 2011 FQ4 2010 FQ3 2010
Net Income ($MM) (0.51) (2.49) (0.86) (5.16) #N/A N/A
Cash - Operating Activities ($MM) 0.85 (1.07) (0.83) (1.38) #N/A N/A
Cash - Investing Activities ($MM) (3.61) (4.17) (4.78) (5.20) #N/A N/A
Cash - Financing Activities ($MM) 10.00 (0.34) (0.48) 24.94 #N/A N/A
Net Changes in Cash ($MM) 7.24 (5.57) (6.09) 18.36 #N/A N/A
Free Cash Flow ($MM) (2.76) (5.24) (5.61) (6.58) #N/A N/A
Free Cash Flow / Diluted Sh ($) (0.02) (0.04) (0.04) (0.05) #N/A N/A
Cash flow per Share ($) 0.00 (0.01) (0.01) (0.01) #N/A N/A
Share Price Performance
Project Location
Project Specifics
Ownership
% Location Deposit Type
Northmet 100% Minnesota, USA DFS Volcanic OP 20 1.5 Autoclave / SX/EW
Resources Class Tons Grades Contained Metal
(MM)
Northmet M+I 638.2 0.27% 0.08% 0.01% 0.03 0.23 0.07 3,382 996 91 698 4,801 1,354
Inferred 251.6 0.28% 0.08% 0.01% 0.04 0.27 0.08 1,384 392 28 299 2,200 615
Operating Metrics Attributable Capex Operating Costs Attributable Production (avg p.a.) Management Team
FRANK L SIMS, CO-CHAIRMAN
Initial Sustaining US$/lb Cu* US$/t milled WALTER IAN LOGAN FORREST, CO-CHAIRMAN
Northmet 312.0 290.0 (1.32) 6.56 61.5 14.5 0.7 9.9 72.0 17.6 JOSEPH M SCIPIONI, PRESIDENT/CEO/COO
DOUGLAS J NEWBY, CHIEF FINANCIAL OFFICERRD - Resource Definition, PEA - Preliminary Economic Assessment (Scoping Study), PFS - Prefeasibility Study, DFS - Definitive Feasibility Study www.polymetmining.com
*By-product credits based on CIBC long term metal price forecasts
Pt
(000 oz)
Throughput (tpd)
32,000
Cu
(MM lbs)
Ni
(MM lbs)
Co
(MM lbs)
Au
(000 oz)
Pd
(000 oz)
Pt
(000 oz)
Co
(MM lbs)
Au
(000 oz)
Pd
(000 oz)
C$2.12
Strip Ratio
(w/o) Recovery Method
Pd
(g/t)
Pt
(g/t)
Cu
(MM lbs)
Ni
(MM lbs)
Engineering
Completed
Mining
Method
Mine
Life (yrs)
Cu
(%)
Ni
(%)
Co
(%)
Au
(g/t)
0.00
0.50
1.00
1.50
2.00
2.50
3.00
F-10 A-10 J-10 A-10 O-10 D-10 F-11
.0 M
.2 M
.4 M
.6 M
.8 M
1.0 M
1.2 M
NorthMet
Acquisition of the Erie Plant. Beginning on November 15, 2005 POM entered into three Contracts for Deed with a subsidiary of Cliffs Natural Resources Inc, under which POM
now owns a large processing facility, a tailings disposal facility, and extensive associated infrastructure located approximately six miles west of POM’s NorthMet deposit. In
combination, the Erie Plant includes a 100,000 ton-per-day crushing and milling facility, a railroad and railroad access rights connecting the Erie Plant to the NorthMet deposit, as
well as 120 railcars, locomotive fuelling and maintenance facilities, water rights and pipelines, large administrative offices on site and approximately 6,000 acres to the east and
west of the Erie Plant, contiguous to the existing tailing facilities.
Engineering and feasibility. POM retained Bateman Engineering Pty. of Brisbane, Australia (“Bateman”) as the coordinating consultant to prepare a Definitive Feasibility Study
(the “DFS”). On September 25, 2006, POM reported that the Definitive Feasibility Study (DFS) prepared by Bateman confirming the economic and technical viability of the
NorthMet Project. Since September 2006 POM has completed additional drilling, expanded the reserves, and more recently POM has been updating the mine scheduling,
approximately within the DFS pit design, and updating estimated capital and operating costs. In May 2008 it completed an internal update of the DFS (the “DFS Update”) which
contemplates an initial stage in which POM would sell concentrate during completion of construction and commissioning of the hydrometallurgical plant contemplated in the DFS.
This approach has the advantage of staging capital costs so that the hydrometallurgical plant can be funded in part from cash flow from sales of concentrate, and it reduces POM’s
reliance on delivery of long lead-time equipment before the start of commercial production.
Glencore Strategic Partnership. In October 2008, POM entered into a strategic partnership with Glencore AG (“Glencore”) whereby Glencore will invest up to $50 million in
PolyMet in the form of a loan exchangeable into POM common shares, and Glencore agreed to purchase all of POM's production of concentrates, metal, or intermediate products
on market terms at the time of delivery, for at least the first five years of production. POM also appointed a senior technical representative of Glencore to join its Technical Steering
Committee.
Project Update
Environmental review of the project is a joint state and federal process led by the Minnesota Department of Natural Resources (DNR) and the US Army Corp. of Engineers
(USACE), jointly the Lead Agencies. An EIS, prepared by a third party contractor for the Lead Agencies, is intended to provide information to the public and government agencies
that: describes potential environmental impacts of the project, explores alternatives to the Proposed Project that avoid or minimize potential environmental impacts, and considers
mitigation of environmental impacts.
EIS Status
The PolyMet draft EIS was published in early November 2009 and the public review period was completed in early February 2010. The Lead Agencies held two informational
meetings: one near site and one in the metro Minneapolis area. The Lead Agencies are reviewing the approximately 3,800 comments received on the draft EIS in order to prepare
a work program for response and possible incorporation into the final EIS, as well as any additional analysis that may be needed before the final EIS can be completed. The US
Environmental Protection Agency (EPA) was not formally involved in preparation of the draft EIS. However, it has provided critical comments that PolyMet has reviewed in detail –
the Company makes the following observations:
- The EPA’s rating of the draft EIS as unsatisfactory appears to have been based on the “proposed project” without consideration of alternatives or mitigations discussed in the
document.
- During the past four-and-a-half years following approval of the Environmental Assessment Worksheet (the draft EIS scoping document) PolyMet has spent in excess of $20
million on environmental engineering and review. Much of this work, undertaken by some of the world’s leading environmental engineers and scientists, has been directed at
enhancing environmental protections and minimizing impacts of the project.
- Many of the results of this work were incorporated in various alternatives set out in the draft EIS. However, many of the comments on the draft EIS did not focus on these
alternatives and may not have fully considered the supporting information.
- The draft EIS is supported by extensive scientific studies and, in some areas, identified the need for additional information. PolyMet has been working with the Lead Agencies to
complete additional information for inclusion in the final EIS.
Permitting
The permitting process is linked to, but separate from, environmental review. Permits can only be issued once the environmental review has been completed and the DNR has
issued an “Adequacy Decision” and the USACE has issued its “Record of Decision.” Several permits will need to be issued by the DNR, the Minnesota Pollution Control Agency
(PCA) and the USACE before construction can begin.
PolyMet Mining Corporation (NYSE-A: PLM; TSX: POM) is developing a copper-nickel-precious metals project in the established mining district of the Mesabi Iron Range in
northeastern Minnesota. PolyMet controls 100% of the NorthMet ore deposit and owns the nearby Erie Plant, a large crushing and milling facility with associated infrastructure.
Environmental review by the State of Minnesota is nearing completion. Project construction is planned to start upon receipt of permits and is expected to require approximately
one million man-hours of construction labor, leading to the creation of approximately 400 long-term jobs during commercial operations.
Source: Company reports.
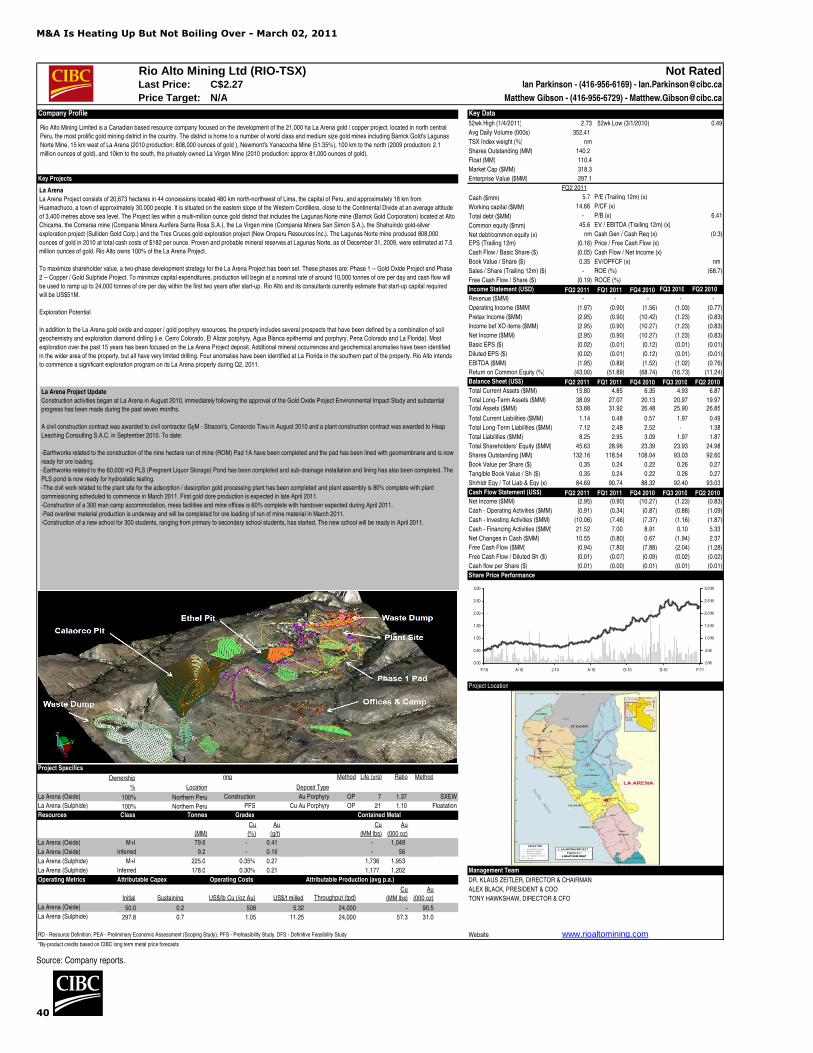
M&A Is Heating Up But Not Boiling Over - March 02, 2011
40
Rio Alto Mining Ltd (RIO-TSX) Not RatedLast Price: Ian Parkinson - (416-956-6169) - [email protected]
Price Target: N/A Matthew Gibson - (416-956-6729) - [email protected]
Company Profile Key Data
52wk High (1/4/2011) 2.73 52wk Low (3/1/2010) 0.49
Avg Daily Volume (000s) 352.41
TSX Index weight (%) nm
Shares Outstanding (MM) 140.2
Float (MM) 110.4
Market Cap ($MM) 318.3
Key Projects Enterprise Value ($MM) 297.1
FQ2 2011
Cash ($mm) 5.7 P/E (Trailing 12m) (x) #N/A N/A
Working capital ($MM) 14.66 P/CF (x) #N/A N/A
Total debt ($MM) - P/B (x) 6.41
Common equity ($mm) 45.6 EV / EBITDA (Trailing 12m) (x) #N/A N/A
Net debt/common equity (x) nm Cash Gen / Cash Req (x) (0.3)
EPS (Trailing 12m) (0.16) Price / Free Cash Flow (x) #N/A N/A
Cash Flow / Basic Share ($) (0.05) Cash Flow / Net Income (x) #N/A N/A
Book Value / Share ($) 0.35 EV/OPFCF (x) nm
Sales / Share (Trailing 12m) ($) - ROE (%) (68.7)
Free Cash Flow / Share ($) (0.19) ROCE (%) #N/A N/A
Income Statement (USD) FQ2 2011 FQ1 2011 FQ4 2010 FQ3 2010 FQ2 2010
Revenue ($MM) - - - - -
Operating Income ($MM) (1.97) (0.90) (1.56) (1.03) (0.77)
Pretax Income ($MM) (2.95) (0.90) (10.42) (1.23) (0.83)
Income bef XO items ($MM) (2.95) (0.90) (10.27) (1.23) (0.83)
Net Income ($MM) (2.95) (0.90) (10.27) (1.23) (0.83)
Basic EPS ($) (0.02) (0.01) (0.12) (0.01) (0.01)
Diluted EPS ($) (0.02) (0.01) (0.12) (0.01) (0.01)
EBITDA ($MM) (1.95) (0.89) (1.52) (1.02) (0.76)
Return on Common Equity (%) (43.00) (51.89) (68.74) (16.73) (11.24)
Balance Sheet (US$) FQ2 2011 FQ1 2011 FQ4 2010 FQ3 2010 FQ2 2010
Total Current Assets ($MM) 15.80 4.85 6.35 4.93 6.87
Total Long-Term Assets ($MM) 38.09 27.07 20.13 20.97 19.97 Total Assets ($MM) 53.88 31.92 26.48 25.90 26.85
Total Current Liabilities ($MM) 1.14 0.48 0.57 1.97 0.49
Total Long-Term Liabilities ($MM) 7.12 2.48 2.52 - 1.38
Total Liabilities ($MM) 8.25 2.95 3.09 1.97 1.87
Total Shareholders' Equity ($MM) 45.63 28.96 23.39 23.93 24.98
Shares Outstanding (MM) 132.16 118.54 108.04 93.03 92.60
Book Value per Share ($) 0.35 0.24 0.22 0.26 0.27
Tangible Book Value / Sh ($) 0.35 0.24 0.22 0.26 0.27
Shrhldr Eqy / Tot Liab & Eqy (x) 84.69 90.74 88.32 92.40 93.03
Cash Flow Statement (US$) FQ2 2011 FQ1 2011 FQ4 2010 FQ3 2010 FQ2 2010Net Income ($MM) (2.95) (0.90) (10.27) (1.23) (0.83)
Cash - Operating Activities ($MM) (0.91) (0.34) (0.87) (0.88) (1.09)
Cash - Investing Activities ($MM) (10.06) (7.46) (7.37) (1.16) (1.87)
Cash - Financing Activities ($MM) 21.52 7.00 8.91 0.10 5.33
Net Changes in Cash ($MM) 10.55 (0.80) 0.67 (1.94) 2.37
Free Cash Flow ($MM) (0.94) (7.80) (7.88) (2.04) (1.28)
Free Cash Flow / Diluted Sh ($) (0.01) (0.07) (0.09) (0.02) (0.02)
Cash flow per Share ($) (0.01) (0.00) (0.01) (0.01) (0.01)
Share Price Performance
Project Location
Project Specifics
Ownership ring Method Life (yrs) Ratio Method
% Location Deposit Type
La Arena (Oxide) 100% Northern Peru Construction Au Porphyry OP 7 1.37 SXEW
La Arena (Sulphide) 100% Northern Peru PFS Cu Au Porphyry OP 21 1.10 Floatation
Resources Class Tonnes Grades Contained Metal
(MM)
La Arena (Oxide) M+I 79.6 - 0.41 - 1,049
La Arena (Oxide) Inferred 9.2 - 0.19 - 56
La Arena (Sulphide) M+I 225.0 0.35% 0.27 1,736 1,953
La Arena (Sulphide) Inferred 178.0 0.30% 0.21 1,177 1,202 Management Team
Operating Metrics Attributable Capex Operating Costs Attributable Production (avg p.a.) DR. KLAUS ZEITLER, DIRECTOR & CHAIRMAN
ALEX BLACK, PRESIDENT & COO
Initial Sustaining US$/lb Cu (/oz Au) TONY HAWKSHAW, DIRECTOR & CFO
La Arena (Oxide) 50.0 0.2 508 5.32 24,000 - 90.5
La Arena (Sulphide) 297.8 0.7 1.05 11.25 24,000 57.3 31.0
RD - Resource Definition, PEA - Preliminary Economic Assessment (Scoping Study), PFS - Prefeasibility Study, DFS - Definitive Feasibility Study Website www.rioaltomining.com*By-product credits based on CIBC long term metal price forecasts
C$2.27
Cu
(%)
Au
(g/t)
Cu
(MM lbs)
Au
(000 oz)
Cu
(MM lbs)
Au
(000 oz)Throughput (tpd)US$/t milled
La Arena
La Arena Project consists of 20,673 hectares in 44 concessions located 480 km north-northwest of Lima, the capital of Peru, and approximately 18 km from
Huamachuco, a town of approximately 30,000 people. It is situated on the eastern slope of the Western Cordillera, close to the Continental Divide at an average altitude
of 3,400 metres above sea level. The Project lies within a multi-million ounce gold district that includes the Lagunas Norte mine (Barrick Gold Corporation) located at Alto-
Chicama, the Comarsa mine (Compania Minera Aurifera Santa Rosa S.A.), the La Virgen mine (Compania Minera San Simon S.A.), the Shahuindo gold-silver
exploration project (Sulliden Gold Corp.) and the Tres Cruces gold exploration project (New Oroperu Resources Inc.). The Lagunas Norte mine produced 808,000
ounces of gold in 2010 at total cash costs of $182 per ounce. Proven and probable mineral reserves at Lagunas Norte, as of December 31, 2009, were estimated at 7.5
million ounces of gold. Rio Alto owns 100% of the La Arena Project.
To maximize shareholder value, a two-phase development strategy for the La Arena Project has been set. These phases are: Phase 1 -- Gold Oxide Project and Phase
2 -- Copper / Gold Sulphide Project. To minimize capital expenditures, production will begin at a nominal rate of around 10,000 tonnes of ore per day and cash flow will
be used to ramp up to 24,000 tonnes of ore per day within the first two years after start-up. Rio Alto and its consultants currently estimate that start-up capital required
will be US$51M.
Exploration Potential
In addition to the La Arena gold oxide and copper / gold porphyry resources, the property includes several prospects that have been defined by a combination of soil
geochemistry and exploration diamond drilling (i.e. Cerro Colorado, El Alizar porphyry, Agua Blanca epithermal and porphyry, Pena Colorado and La Florida). Most
exploration over the past 15 years has been focused on the La Arena Project deposit. Additional mineral occurrences and geochemical anomalies have been identified
in the wider area of the property, but all have very limited drilling. Four anomalies have been identified at La Florida in the southern part of the property. Rio Alto intends
to commence a significant exploration program on its La Arena property during Q2, 2011.
Rio Alto Mining Limited is a Canadian based resource company focused on the development of the 21,000 ha La Arena gold / copper project, located in north central
Peru, the most prolific gold mining district in the country. The district is home to a number of world class and medium size gold mines including Barrick Gold's Lagunas
Norte Mine, 15 km west of La Arena (2010 production: 808,000 ounces of gold ), Newmont's Yanacocha Mine (51.35%), 100 km to the north (2009 production: 2.1
million ounces of gold), and 10km to the south, the privately owned La Virgen Mine (2010 production: approx 81,000 ounces of gold).
0.00
0.50
1.00
1.50
2.00
2.50
3.00
F-10 A-10 J-10 A-10 O-10 D-10 F-11
.0 M
.5 M
1.0 M
1.5 M
2.0 M
2.5 M
3.0 M
La Arena Project Update
Construction activities began at La Arena in August 2010, immediately following the approval of the Gold Oxide Project Environmental Impact Study and substantial
progress has been made during the past seven months.
A civil construction contract was awarded to civil contractor GyM - Stracon's, Consorcio Tiwu in August 2010 and a plant construction contract was awarded to Heap
Leaching Consulting S.A.C. in September 2010. To date:
-Earthworks related to the construction of the nine hectare run of mine (ROM) Pad 1A have been completed and the pad has been lined with geomembrane and is now
ready for ore loading.
-Earthworks related to the 60,000 m3 PLS (Pregnant Liquor Storage) Pond has been completed and sub-drainage installation and lining has also been completed. The
PLS pond is now ready for hydrostatic testing.
-The civil work related to the plant site for the adsorption / desorption gold processing plant has been completed and plant assembly is 80% complete with plant
commissioning scheduled to commence in March 2011. First gold dore production is expected in late April 2011.
-Construction of a 300 man camp accommodation, mess facilities and mine offices is 60% complete with handover expected during April 2011.
-Pad overliner material production is underway and will be completed for ore loading of run of mine material in March 2011.
-Construction of a new school for 300 students, ranging from primary to secondary school students, has started. The new school will be ready in April 2011.
Source: Company reports.
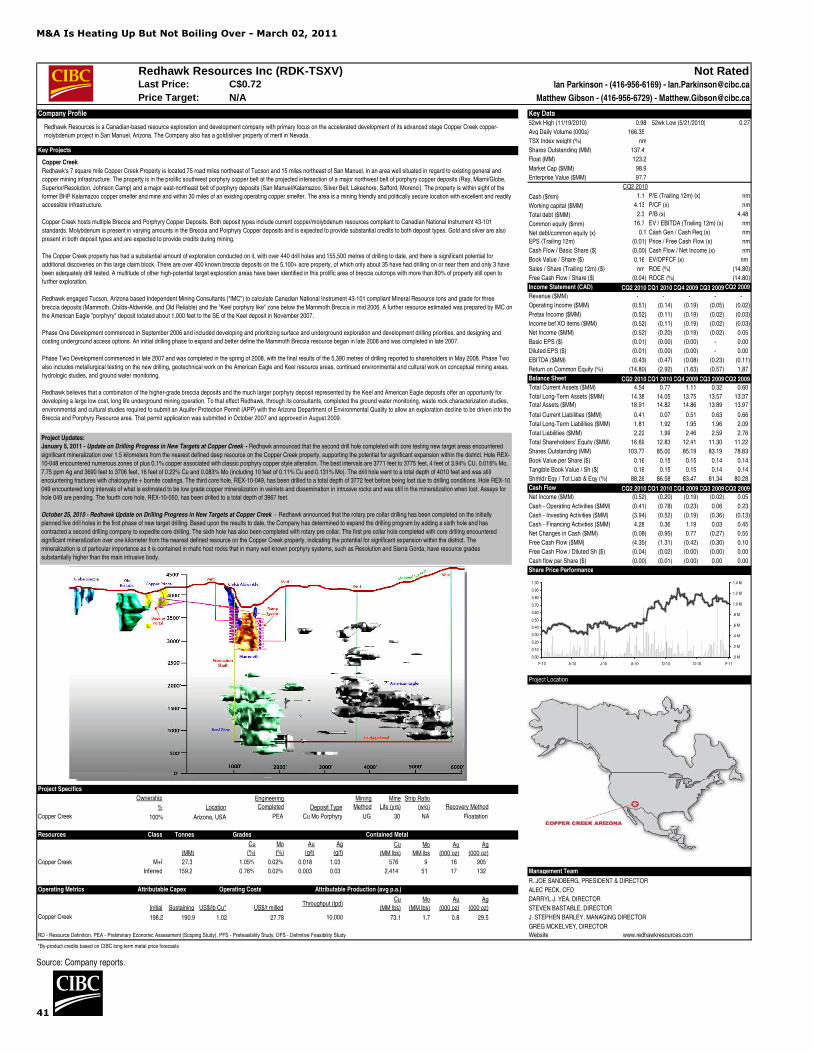
M&A Is Heating Up But Not Boiling Over - March 02, 2011
41
Redhawk Resources Inc (RDK-TSXV) Not RatedLast Price: Ian Parkinson - (416-956-6169) - [email protected]
Price Target: N/A Matthew Gibson - (416-956-6729) - [email protected]
Company Profile Key Data52wk High (11/19/2010) 0.98 52wk Low (5/21/2010) 0.27
Avg Daily Volume (000s) 166.35
TSX Index weight (%) nm
Key Projects Shares Outstanding (MM) 137.4
Float (MM) 123.2
Market Cap ($MM) 98.9
Enterprise Value ($MM) 97.7
CQ2 2010
Cash ($mm) 1.1 P/E (Trailing 12m) (x) nm
Working capital ($MM) 4.13 P/CF (x) nm
Total debt ($MM) 2.3 P/B (x) 4.48
Common equity ($mm) 16.7 EV / EBITDA (Trailing 12m) (x) nm
Net debt/common equity (x) 0.1 Cash Gen / Cash Req (x) nm
EPS (Trailing 12m) (0.01) Price / Free Cash Flow (x) nm
Cash Flow / Basic Share ($) (0.00) Cash Flow / Net Income (x) nm
Book Value / Share ($) 0.16 EV/OPFCF (x) nm
Sales / Share (Trailing 12m) ($) nm ROE (%) (14.80)
Free Cash Flow / Share ($) (0.04) ROCE (%) (14.80)
Income Statement (CAD) CQ2 2010 CQ1 2010 CQ4 2009 CQ3 2009 CQ2 2009
Revenue ($MM) - - - - -
Operating Income ($MM) (0.51) (0.14) (0.19) (0.05) (0.02)
Pretax Income ($MM) (0.52) (0.11) (0.19) (0.02) (0.03)
Income bef XO items ($MM) (0.52) (0.11) (0.19) (0.02) (0.03)
Net Income ($MM) (0.52) (0.20) (0.19) (0.02) 0.05
Basic EPS ($) (0.01) (0.00) (0.00) - 0.00
Diluted EPS ($) (0.01) (0.00) (0.00) - 0.00
EBITDA ($MM) (0.43) (0.47) (0.08) (0.23) (0.11)
Return on Common Equity (%) (14.80) (2.92) (1.63) (0.57) 1.87
Balance Sheet CQ2 2010 CQ1 2010 CQ4 2009 CQ3 2009 CQ2 2009
Total Current Assets ($MM) 4.54 0.77 1.11 0.32 0.60
Total Long-Term Assets ($MM) 14.38 14.05 13.75 13.57 13.37 Total Assets ($MM) 18.91 14.82 14.86 13.89 13.97
Total Current Liabilities ($MM) 0.41 0.07 0.51 0.63 0.66
Total Long-Term Liabilities ($MM) 1.81 1.92 1.95 1.96 2.09
Total Liabilities ($MM) 2.22 1.99 2.46 2.59 2.76
Total Shareholders' Equity ($MM) 16.69 12.83 12.41 11.30 11.22
Shares Outstanding (MM) 103.77 85.00 85.19 83.19 78.83
Book Value per Share ($) 0.16 0.15 0.15 0.14 0.14
Tangible Book Value / Sh ($) 0.16 0.15 0.15 0.14 0.14
Shrhldr Eqy / Tot Liab & Eqy (%) 88.26 86.58 83.47 81.34 80.28
Cash Flow CQ2 2010 CQ1 2010 CQ4 2009 CQ3 2009 CQ2 2009
Net Income ($MM) (0.52) (0.20) (0.19) (0.02) 0.05
Cash - Operating Activities ($MM) (0.41) (0.78) (0.23) 0.06 0.23
Cash - Investing Activities ($MM) (3.94) (0.52) (0.19) (0.36) (0.13)
Cash - Financing Activities ($MM) 4.28 0.36 1.19 0.03 0.45
Net Changes in Cash ($MM) (0.08) (0.95) 0.77 (0.27) 0.55
Free Cash Flow ($MM) (4.35) (1.31) (0.42) (0.30) 0.10
Free Cash Flow / Diluted Sh ($) (0.04) (0.02) (0.00) (0.00) 0.00
Cash flow per Share ($) (0.00) (0.01) (0.00) 0.00 0.00
Share Price Performance
Project Location
Project Specifics
Ownership
% Location Deposit Type
Copper Creek 100% Arizona, USA PEA Cu Mo Porphyry UG 30 NA Floatation
Resources Class Tonnes Grades Contained Metal
(MM)
Copper Creek M+I 27.3 1.05% 0.02% 0.018 1.03 576 9 16 905
Inferred 159.2 0.76% 0.02% 0.003 0.03 2,414 51 17 132 Management Team
R. JOE SANDBERG, PRESIDENT & DIRECTOR
Operating Metrics Attributable Capex Attributable Production (avg p.a.) ALEC PECK, CFO
DARRYL J. YEA, DIRECTOR
Initial Sustaining US$/lb Cu* US$/t milled STEVEN BASTABLE, DIRECTOR
Copper Creek 198.2 190.9 1.02 27.78 73.1 1.7 0.8 29.5 J. STEPHEN BARLEY, MANAGING DIRECTOR
GREG MCKELVEY, DIRECTORRD - Resource Definition, PEA - Preliminary Economic Assessment (Scoping Study), PFS - Prefeasibility Study, DFS - Definitive Feasibility Study Website www.redhawkresources.com
*By-product credits based on CIBC long term metal price forecasts
Cu
(MM lbs)
Mo
(MM lbs)
Au
(000 oz)
Mo
MM lbs
Au
(000 oz)
Ag
(000 oz)
Operating Costs
Mo
(%)
Au
(g/t)
Ag
(g/t)Cu
(MM lbs)
Throughput (tpd)
10,000
Strip Ratio
(w/o)
C$0.72
Engineering
Completed
Mining
Method
Mine
Life (yrs)
Ag
(000 oz)
Recovery Method
Cu
(%)
Copper Creek
Redhawk's 7 square mile Copper Creek Property is located 75 road miles northeast of Tucson and 15 miles northeast of San Manuel, in an area well situated in regard to existing general and
copper mining infrastructure. The property is in the prolific southwest porphyry copper belt at the projected intersection of a major northwest belt of porphyry copper deposits (Ray, Miami/Globe,
Superior/Resolution, Johnson Camp) and a major east-northeast belt of porphyry deposits (San Manuel/Kalamazoo, Silver Bell, Lakeshore, Safford, Morenci). The property is within sight of the
former BHP Kalamazoo copper smelter and mine and within 30 miles of an existing operating copper smelter. The area is a mining friendly and politically secure location with excellent and readily
accessible infrastructure.
Copper Creek hosts multiple Breccia and Porphyry Copper Deposits. Both deposit types include current copper/molybdenum resources compliant to Canadian National Instrument 43-101
standards. Molybdenum is present in varying amounts in the Breccia and Porphyry Copper deposits and is expected to provide substantial credits to both deposit types. Gold and silver are also
present in both deposit types and are expected to provide credits during mining.
The Copper Creek property has had a substantial amount of exploration conducted on it, with over 440 drill holes and 155,500 metres of drilling to date, and there is significant potential for
additional discoveries on this large claim block. There are over 400 known breccia deposits on the 5,100+ acre property, of which only about 35 have had drilling on or near them and only 3 have
been adequately drill tested. A multitude of other high-potential target exploration areas have been identified in this prolific area of breccia outcrops with more than 80% of property still open to
further exploration.
Redhawk engaged Tucson, Arizona based Independent Mining Consultants ("IMC") to calculate Canadian National Instrument 43-101 compliant Mineral Resource tons and grade for three
breccia deposits (Mammoth, Childs-Aldwinkle, and Old Reliable) and the "Keel porphyry like" zone below the Mammoth Breccia in mid 2006. A further resource estimated was prepared by IMC on
the American Eagle "porphyry" deposit located about 1,000 feet to the SE of the Keel deposit in November 2007.
Phase One Development commenced in September 2006 and included developing and prioritizing surface and underground exploration and development drilling priorities, and designing and
costing underground access options. An initial drilling phase to expand and better define the Mammoth Breccia resource began in late 2006 and was completed in late 2007.
Phase Two Development commenced in late 2007 and was completed in the spring of 2008, with the final results of the 5,390 metres of drilling reported to shareholders in May 2008. Phase Two
also includes metallurgical testing on the new drilling, geotechnical work on the American Eagle and Keel resource areas, continued environmental and cultural work on conceptual mining areas,
hydrologic studies, and ground water monitoring.
Redhawk believes that a combination of the higher-grade breccia deposits and the much larger porphyry deposit represented by the Keel and American Eagle deposits offer an opportunity for
developing a large low cost, long life underground mining operation. To that effect Redhawk, through its consultants, completed the ground water monitoring, waste rock characterization studies,
environmental and cultural studies required to submit an Aquifer Protection Permit (APP) with the Arizona Department of Environmental Quality to allow an exploration decline to be driven into the
Breccia and Porphyry Resource area. That permit application was submitted in October 2007 and approved in August 2009.
Redhawk Resources is a Canadian-based resource exploration and development company with primary focus on the accelerated development of its advanced stage Copper Creek copper-
molybdenum project in San Manuel, Arizona. The Company also has a gold/silver property of merit in Nevada.
0.00
0.10
0.20
0.30
0.40
0.50
0.60
0.70
0.80
0.90
1.00
F-10 A-10 J-10 A-10 O-10 D-10 F-11
.0 M
.2 M
.4 M
.6 M
.8 M
1.0 M
1.2 M
1.4 M
Project Updates:
January 5, 2011 - Update on Drilling Progress in New Targets at Copper Creek - Redhawk announced that the second drill hole completed with core testing new target areas encountered
significant mineralization over 1.5 kilometers from the nearest defined deep resource on the Copper Creek property, supporting the potential for significant expansion within the district. Hole REX-
10-048 encountered numerous zones of plus 0.1% copper associated with classic porphyry copper style alteration. The best intervals are 3771 feet to 3775 feet, 4 feet of 3.94% CU, 0.016% Mo,
7.75 ppm Ag and 3690 feet to 3706 feet, 16 feet of 0.22% Cu and 0.083% Mo (including 10 feet of 0.11% Cu and 0.131% Mo). The drill hole went to a total depth of 4010 feet and was still
encountering fractures with chalcopyrite + bornite coatings. The third core hole, REX-10-049, has been drilled to a total depth of 3772 feet before being lost due to drilling conditions. Hole REX-10-
049 encountered long intervals of what is estimated to be low grade copper mineralization in veinlets and dissemination in intrusive rocks and was still in the mineralization when lost. Assays for
hole 049 are pending. The fourth core hole, REX-10-050, has been drilled to a total depth of 3967 feet.
October 25, 2010 - Redhawk Update on Drilling Progress in New Targets at Copper Creek - Redhawk announced that the rotary pre collar drilling has been completed on the initially
planned five drill holes in the first phase of new target drilling. Based upon the results to date, the Company has determined to expand the drilling program by adding a sixth hole and has
contracted a second drilling company to expedite core drilling. The sixth hole has also been completed with rotary pre collar. The first pre collar hole completed with core drilling encountered
significant mineralization over one kilometer from the nearest defined resource on the Copper Creek property, indicating the potential for significant expansion within the district. The
mineralization is of particular importance as it is contained in mafic host rocks that in many well known porphyry systems, such as Resolution and Sierra Gorda, have resource grades
substantially higher than the main intrusive body.
Source: Company reports.

M&A Is Heating Up But Not Boiling Over - March 02, 2011
42
Serengeti Resources Inc (SIR-TSX) Not RatedLast Price: Ian Parkinson - (416-956-6169) - [email protected]
Price Target: N/A Matthew Gibson - (416-956-6729) - [email protected]
Company Profile Key Data52wk High (2/14/2011) 0.41 52wk Low (7/26/2010) 0.22
Avg Daily Volume (000s) 93.32
TSX Index weight (%) nm
Shares Outstanding (MM) 46.8
Float (MM) 43.6
Key Projects Market Cap ($MM) 16.4
Enterprise Value ($MM) 13.4
FQ3 2011
Cash ($mm) 2.5 P/E (Trailing 12m) (x) #N/A N/A
Working capital ($MM) 5.62 P/CF (x) #N/A N/A
Total debt ($MM) - P/B (x) 0.66
Common equity ($mm) 24.6 EV / EBITDA (Trailing 12m) (x) #N/A N/A
Net debt/common equity (x) nm Cash Gen / Cash Req (x) (0.3)
EPS (Trailing 12m) (0.0) Price / Free Cash Flow (x) #N/A N/A
Cash Flow / Basic Share ($) (0.0) Cash Flow / Net Income (x) #N/A N/A
Book Value / Share ($) 0.5 EV/OPFCF (x) nm
Sales / Share (Trailing 12m) ($) - ROE (%) (2.8)
Free Cash Flow / Share ($) (0.1) ROCE (%) #N/A N/A
Income Statement (CAD) FQ3 2011 FQ2 2011 FQ1 2011 FQ4 2010 FQ3 2010
Revenue ($MM) - - - - -
Operating Income ($MM) (0.34) (0.26) (0.34) (0.31) (0.31)
Pretax Income ($MM) (0.38) (0.26) (0.34) (0.67) (0.31)
Income bef XO items ($MM) (0.38) (0.26) (0.34) 0.32 (0.31)
Net Income ($MM) (0.38) (0.26) (0.34) 0.32 (0.31)
Basic EPS ($) (0.01) (0.01) (0.01) 0.01 (0.01)
Diluted EPS ($) (0.01) (0.01) (0.01) 0.01 (0.01)
EBITDA ($MM) (0.34) (0.26) (0.34) (0.31) (0.31)
Return on Common Equity (%) (1.51) (2.38) (2.27) (3.83) (6.03)
Balance Sheet FQ3 2011 FQ2 2011 FQ1 2011 FQ4 2010 FQ3 2010
Total Current Assets ($MM) 5.72 6.32 8.29 8.84 8.53
Total Long-Term Assets ($MM) 19.78 19.53 17.72 17.42 17.98 Total Assets ($MM) 25.50 25.85 26.01 26.26 26.52
Total Current Liabilities ($MM) 0.10 0.15 0.14 0.13 0.08
Total Long-Term Liabilities ($MM) 0.81 0.81 0.81 0.81 1.80
Total Liabilities ($MM) 0.91 0.96 0.95 0.94 1.88
Total Shareholders' Equity ($MM) 24.59 24.89 25.06 25.32 24.63
Shares Outstanding (MM) 46.22 46.17 45.99 45.99 45.84
Book Value per Share ($) 0.53 0.54 0.54 0.55 0.54
Tangible Book Value / Sh ($) 0.53 0.54 0.54 0.55 0.54
Shrhldr Eqy / Tot Liab & Eqy (%) 96.43 96.28 96.34 96.43 92.89
Cash Flow FQ3 2011 FQ2 2011 FQ1 2011 FQ4 2010 FQ3 2010
Net Income ($MM) (0.38) (0.26) (0.34) 0.32 (0.31)
Cash - Operating Activities ($MM) (0.28) (0.38) (0.36) (0.13) (0.25)
Cash - Investing Activities ($MM) (0.34) (1.78) (0.23) (0.17) (1.06)
Cash - Financing Activities ($MM) 0.01 0.04 - (0.03) -
Net Changes in Cash ($MM) (0.61) (2.12) (0.59) (0.34) (1.31)
Free Cash Flow ($MM) (0.62) (2.16) (0.58) (0.23) (1.31)
Free Cash Flow / Diluted Sh ($) (0.01) (0.05) (0.01) (0.01) (0.03)
Cash flow per Share ($) (0.01) (0.01) (0.01) (0.00) (0.01)
Share Price Performance
Project Location
Project Specifics
Ownership
% Location Deposit Type
Kwanika 100% British Columbia, Canada RD Cu-Au Porphyry OP NA NA NA
Management Team
Resources Class Tonnes Grades Contained Metal DAVID W MOORE, PRESIDENT/CEO
ALEC PECK, CHIEF FINANCIAL OFFICER
(MM)
Kwanika M+I 243.6 0.23% - 0.21 0.69 1,235 31 1,645 5,404
Inferred 295.1 0.19% 0.01% 0.10 1.29 1,228 37 943 12,238
RD - Resource Definition, PEA - Preliminary Economic Assessment (Scoping Study), PFS - Prefeasibility Study, DFS - Definitive Feasibility Study Website www.serengetiresources.com
*By-product credits based on CIBC long term metal price forecasts
Engineering
Completed
Mining
Method
Mine
Life (yrs)
Strip Ratio
(w/o)
C$0.35
Recovery Method
Cu
(%)
Mo
(%)
Au
(g/t)
Ag
(g/t)
Cu
(MM lbs)
Mo
MM lbs
Au
(000 oz)
Ag
(000 oz)
Kwanika
Location - The project is situated in a large porphyry copper-gold belt known as the Quesnel Trough;
Kwanika is located in north-central British Columbia approximately 140 kilometers northwest of Fort
St. James. Property Ownership - Serengeti retains 100% ownership of the Kwanika property which is
situated in the Omineca Mining Division. It comprises almost 9,000 hectares. History - Previous
exploration on the property occurred as early as the 1930's and copper mineralization was first
recognized along Kwanika Creek in 1964. Prior to Serengeti's discovery, the property hosted a
historical, non 43-101 compliant resource containing 36 million tonnes grading 0.2% copper in a
portion of what is now recognized as the South Zone. Exploration conducted by Serengeti during
2005 and 2006 included airborne and ground IP geophysics as well as drill programs that resulted in
the discovery hole K-06-9 that intersected 111.1 meters grading 0.69% copper and 0.54 grams
gold/tonne in the Central Zone in December 2006.
Geology - The Kwanika Project consists of two mineralized areas known as the Central Zone and the
South Zone. Since the discovery, Serengeti has expanded the central area of high-grade, copper-
gold mineralization using drill hole spacings designed to support a resource calculation.
The has completed 69,000 meters of drilling in 168 holes since 2006. Some of the drilling highlights
include Hole K-07-15 that cut 328.3 metres grading 0.61% copper and 0.72 grams gold/tonne and
Hole K07-29 that intersected 48.6 metres of 0.75% copper and 2.5 grams gold/tonne. Hole K-07-28
encountered a 322-metre interval of porphyry-style copper-gold mineralization that graded 0.40%
copper and 0.40 grams gold/tonne. A 240-metre interval in Hole K-08-62 contained 1.28% copper
and 1.41 grams gold/tonne.
Infrastructure - One of the many upsides to the project is the excellent infrastructure, with the drill
area being road accessible. The nearby BC rail-line would potentially provide a concentrate loadout
capacity at Ft St James. The Kwanika property is within 75 kilometers of the Kemess power line
which provides the potential to be into the provincial powergrid. All exploration operations have been
conducted from a fully established 30 man base camp which could support year round exploration.
Serengeti is a mineral exploration company managed by an experienced team of professionals with a solid track record of exploration success. The Company is currently advancing its Kwanika
copper-gold project, exploring its extensive portfolio of properties in the highly prospective Quesnel Trough of British Columbia and has initiated exploration for gold-silver deposits in Mexico.
Additional information on Serengeti's projects can be found on the Company's website at www.serengetiresources.com. Serengeti is well funded to advance its projects with a current working
capital position of approximately $5.4 million, which includes $2.9 million receivable from the B.C. government's METC program. Serengeti has 46.8 million shares issued and outstanding and 52.2
million shares on a fully diluted basis.
0.00
0.05
0.10
0.15
0.20
0.25
0.30
0.35
0.40
0.45
F-10 A-10 J-10 A-10 O-10 D-10 F-11
.0 M
.5 M
1.0 M
1.5 M
2.0 M
2.5 M
3.0 M
3.5 M
4.0 M
4.5 M
Company Update
February 07th, 2011: Results have been received from a Geoscience BC (a government funded, applied geoscience research group) commissioned study identifying a compelling, untested,
multi-element Ah soil anomaly immediately adjacent to the Central copper-gold Zone at Kwanika. The newly identified ‘Northeast Target’ anomaly is defined by a strong copper-gold-silver-
molybdenum response that is comparable in both magnitude and character to the response found over the known Central Zone deposit. Furthermore, the Northeast Target is located in an area
that is completely covered by glacial sediments and has not been subject to any previous drilling.
This new target was identified by the second stage of a comparative geochemical study using an innovative technique completed by David Heberlein in September 2010. The initial study was
successful in identifying a strong gold-copper-tungsten anomaly over top of the Central Zone mineralization through 20 to 40 m of glacial till and up to 300 m of post-mineral consolidated rock
cover. The 2010 survey expanded on the results of this previous study and identified the Northeast Target which potentially indicates mineralization in an untested area. Drilling of their attractive
target is planned during 2011.
Property-Scale Exploration Potential:
The Kwanika project consists of two known deposits, the Central copper gold Zone and the South Zone, a copper-moly-silver-gold zone located two km to the South. A key to the exploration
potential on the property is the presence of a relatively high grade core to the Central Zone deposit. This coherent higher grade core contains 75 Mt grading 0.41% Cu and 0.42 g/t Au (March
2010 43-101 Technical Report). Within this core is a supergene enrichment blanket that overlies the primary mineralization. The chalcocite and covellite rich supergene blanket formed as a result
of a secondary enrichment process, upgrading the mineralization to commonly more than 1% CuEq.
Such supergene enrichment zones are rarely observed in the northern Cordillera and are similar to those observed in the major porphyry deposits of Chile and SW United States. At Kwanika this
enrichment zone is preserved beneath post-mineral sedimentary basin rocks that are extensively developed over the southern part of the property (see map included). The Serengeti technical
team believes that this covered area which extends 25 km to the south within the Kwanika claims, presents the opportunity to locate an as yet undiscovered supergene enriched porphyry copper-
gold deposit.
Previous geophysical surveying in the prospective southern portion of property has identified a more than 1 km long IP chargeability anomaly that has a comparable response to the IP anomaly
that identified the Central Zone. This anomaly is interpreted to be near surface and may occur beneath or adjacent to relatively thin sedimentary basin cover.
The recently completed studies have demonstrated that low-cost geochemical survey methods have been highly successful in identifying the Central Zone beneath up to 300 meters of post-
mineral consolidated sediments. The success of these studies is an exciting and recent breakthrough for detecting ‘blind’ deposits within the highly prospective Kwanika property and the
approach will be used to further explore the properties in 2011.
Source: Company reports.
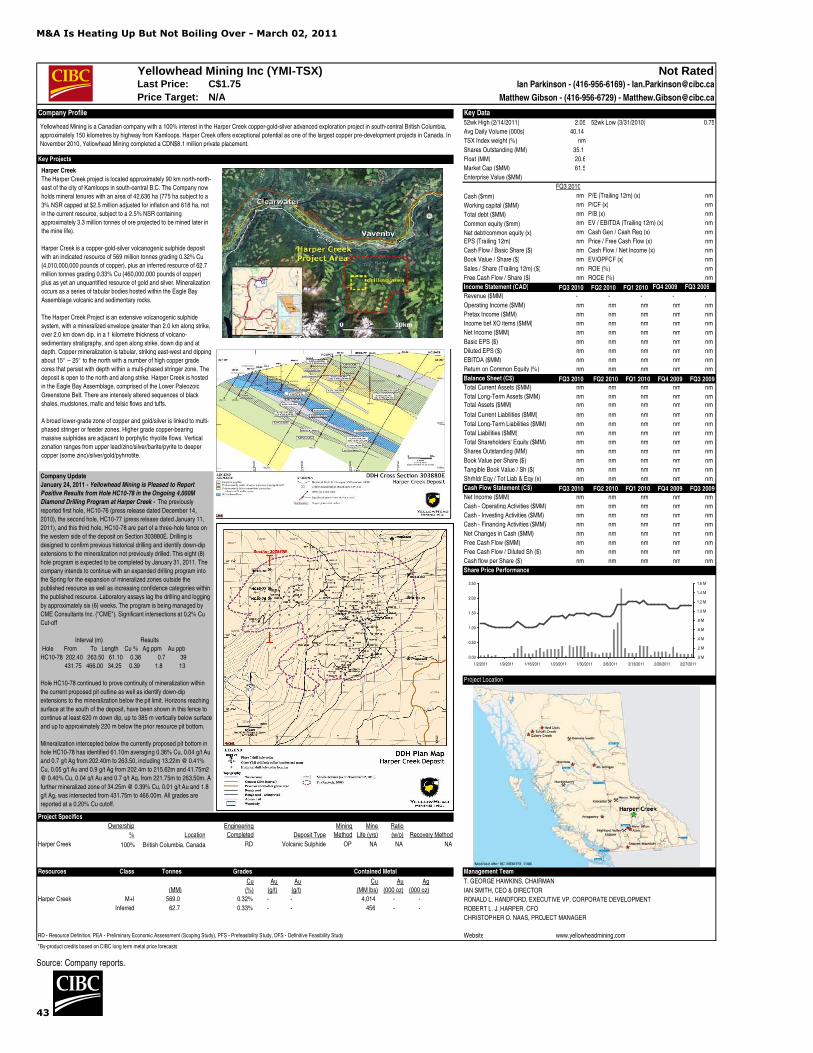
M&A Is Heating Up But Not Boiling Over - March 02, 2011
43
Yellowhead Mining Inc (YMI-TSX) Not RatedLast Price: Ian Parkinson - (416-956-6169) - [email protected]
Price Target: N/A Matthew Gibson - (416-956-6729) - [email protected]
Company Profile Key Data
52wk High (2/14/2011) 2.05 52wk Low (3/31/2010) 0.75
Avg Daily Volume (000s) 40.14
TSX Index weight (%) nm
Shares Outstanding (MM) 35.1
Key Projects Float (MM) 20.6
Market Cap ($MM) 61.5
Enterprise Value ($MM) #N/A N/A
FQ3 2010
Cash ($mm) nm P/E (Trailing 12m) (x) nm
Working capital ($MM) nm P/CF (x) nm
Total debt ($MM) nm P/B (x) nm
Common equity ($mm) nm EV / EBITDA (Trailing 12m) (x) nm
Net debt/common equity (x) nm Cash Gen / Cash Req (x) nm
EPS (Trailing 12m) nm Price / Free Cash Flow (x) nm
Cash Flow / Basic Share ($) nm Cash Flow / Net Income (x) nm
Book Value / Share ($) nm EV/OPFCF (x) nm
Sales / Share (Trailing 12m) ($) nm ROE (%) nm
Free Cash Flow / Share ($) nm ROCE (%) nm
Income Statement (CAD) FQ3 2010 FQ2 2010 FQ1 2010 FQ4 2009 FQ3 2009
Revenue ($MM) - - - - -
Operating Income ($MM) nm nm nm nm nm
Pretax Income ($MM) nm nm nm nm nm
Income bef XO items ($MM) nm nm nm nm nm
Net Income ($MM) nm nm nm nm nm
Basic EPS ($) nm nm nm nm nm
Diluted EPS ($) nm nm nm nm nm
EBITDA ($MM) nm nm nm nm nm
Return on Common Equity (%) nm nm nm nm nm
Balance Sheet (C$) FQ3 2010 FQ2 2010 FQ1 2010 FQ4 2009 FQ3 2009Total Current Assets ($MM) nm nm nm nm nm
Total Long-Term Assets ($MM) nm nm nm nm nmTotal Assets ($MM) nm nm nm nm nm
Total Current Liabilities ($MM) nm nm nm nm nm
Total Long-Term Liabilities ($MM) nm nm nm nm nm
Total Liabilities ($MM) nm nm nm nm nm
Total Shareholders' Equity ($MM) nm nm nm nm nm
Shares Outstanding (MM) nm nm nm nm nm
Book Value per Share ($) nm nm nm nm nm
Tangible Book Value / Sh ($) nm nm nm nm nm
Shrhldr Eqy / Tot Liab & Eqy (x) nm nm nm nm nm
Cash Flow Statement (C$) FQ3 2010 FQ2 2010 FQ1 2010 FQ4 2009 FQ3 2009
Net Income ($MM) nm nm nm nm nm
Cash - Operating Activities ($MM) nm nm nm nm nm
Cash - Investing Activities ($MM) nm nm nm nm nm
Cash - Financing Activities ($MM) nm nm nm nm nm
Net Changes in Cash ($MM) nm nm nm nm nm
Free Cash Flow ($MM) nm nm nm nm nm
Free Cash Flow / Diluted Sh ($) nm nm nm nm nm
Cash flow per Share ($) nm nm nm nm nm
Share Price Performance
Project Location
Project Specifics
Ownership
% Location Deposit Type
Harper Creek 100% British Columbia. Canada RD Volcanic Sulphide OP NA NA NA
Resources Class Tonnes Grades Contained Metal Management Team
T. GEORGE HAWKINS, CHAIRMAN
(MM) IAN SMITH, CEO & DIRECTOR
Harper Creek M+I 569.0 0.32% - - 4,014 - - RONALD L. HANDFORD, EXECUTIVE VP, CORPORATE DEVELOPMENT
Inferred 62.7 0.33% - - 456 - - ROBERT L. J. HARPER, CFO
CHRISTOPHER O. NAAS, PROJECT MANAGER
RD - Resource Definition, PEA - Preliminary Economic Assessment (Scoping Study), PFS - Prefeasibility Study, DFS - Definitive Feasibility Study Website www.yellowheadmining.com
*By-product credits based on CIBC long term metal price forecasts
Au
(g/t)
Cu
(MM lbs)
Cu
(%)
Au
(g/t)
Au
(000 oz)
Ag
(000 oz)
Recovery Method
C$1.75
Mining
Method
Mine
Life (yrs)
Ratio
(w/o)
Engineering
Completed
Harper Creek
The Harper Creek project is located approximately 90 km north-north-
east of the city of Kamloops in south-central B.C. The Company now
holds mineral tenures with an area of 42,636 ha (775 ha subject to a
3% NSR capped at $2.5 million adjusted for inflation and 618 ha, not
in the current resource, subject to a 2.5% NSR containing
approximately 3.3 million tonnes of ore projected to be mined later in
the mine life).
Harper Creek is a copper-gold-silver volcanogenic sulphide deposit
with an indicated resource of 569 million tonnes grading 0.32% Cu
(4,010,000,000 pounds of copper), plus an inferred resource of 62.7
million tonnes grading 0.33% Cu (460,000,000 pounds of copper)
plus as yet an unquantified resource of gold and silver. Mineralization
occurs as a series of tabular bodies hosted within the Eagle Bay
Assemblage volcanic and sedimentary rocks.
The Harper Creek Project is an extensive volcanogenic sulphide
system, with a mineralized envelope greater than 2.0 km along strike,
over 2.0 km down dip, in a 1 kilometre thickness of volcano-
sedimentary stratigraphy, and open along strike, down dip and at
depth. Copper mineralization is tabular, striking east-west and dipping
about 15° -- 25° to the north with a number of high copper grade
cores that persist with depth within a multi-phased stringer zone. The
deposit is open to the north and along strike. Harper Creek is hosted
in the Eagle Bay Assemblage, comprised of the Lower Paleozoic
Greenstone Belt. There are intensely altered sequences of black
shales, mudstones, mafic and felsic flows and tuffs.
A broad lower-grade zone of copper and gold/silver is linked to multi-
phased stringer or feeder zones. Higher grade copper-bearing
massive sulphides are adjacent to porphytic rhyolite flows. Vertical
zonation ranges from upper lead/zinc/silver/barite/pyrite to deeper
copper (some zinc)/silver/gold/pyhrrotite.
Yellowhead Mining is a Canadian company with a 100% interest in the Harper Creek copper-gold-silver advanced exploration project in south-central British Columbia,
approximately 150 kilometres by highway from Kamloops. Harper Creek offers exceptional potential as one of the largest copper pre-development projects in Canada. In
November 2010, Yellowhead Mining completed a CDN$8.1 million private placement.
0.00
0.50
1.00
1.50
2.00
2.50
1/2/2011 1/9/2011 1/16/2011 1/23/2011 1/30/2011 2/6/2011 2/13/2011 2/20/2011 2/27/2011
.0 M
.2 M
.4 M
.6 M
.8 M
1.0 M
1.2 M
1.4 M
1.6 M
Company Update
January 24, 2011 - Yellowhead Mining is Pleased to Report
Positive Results from Hole HC10-78 in the Ongoing 4,000M
Diamond Drilling Program at Harper Creek - The previously
reported first hole, HC10-76 (press release dated December 14,
2010), the second hole, HC10-77 (press release dated January 11,
2011), and this third hole, HC10-78 are part of a three-hole fence on
the western side of the deposit on Section 303880E. Drilling is
designed to confirm previous historical drilling and identify down-dip
extensions to the mineralization not previously drilled. This eight (8)
hole program is expected to be completed by January 31, 2011. The
company intends to continue with an expanded drilling program into
the Spring for the expansion of mineralized zones outside the
published resource as well as increasing confidence categories within
the published resource. Laboratory assays lag the drilling and logging
by approximately six (6) weeks. The program is being managed by
CME Consultants Inc. ("CME"). Significant intersections at 0.2% Cu
Cut-off
Interval (m) Results
Hole From To Length Cu % Ag ppm Au ppb
HC10-78 202.40 263.50 61.10 0.36 0.7 39
431.75 466.00 34.25 0.39 1.8 13
Hole HC10-78 continued to prove continuity of mineralization within
the current proposed pit outline as well as identify down-dip
extensions to the mineralization below the pit limit. Horizons reaching
surface at the south of the deposit, have been shown in this fence to
continue at least 620 m down dip, up to 385 m vertically below surface
and up to approximately 220 m below the prior resource pit bottom.
Mineralization intercepted below the currently proposed pit bottom in
hole HC10-78 has identified 61.10m averaging 0.36% Cu, 0.04 g/t Au
and 0.7 g/t Ag from 202.40m to 263.50, including 13.22m @ 0.41%
Cu, 0.05 g/t Au and 0.9 g/t Ag from 202.4m to 215.62m and 41.75m2
@ 0.40% Cu, 0.04 g/t Au and 0.7 g/t Ag, from 221.75m to 263.50m. A
further mineralized zone of 34.25m @ 0.39% Cu, 0.01 g/t Au and 1.8
g/t Ag, was intersected from 431.75m to 466.00m. All grades are
reported at a 0.20% Cu cutoff.
Source: Company reports.

M&A Is Heatin
g Up But N
ot B
oilin
g Over - M
arch 02, 2
011
44
Appendix. Company And Project Details
Exhibit 18. CIBC's North America Focused Junior Copper Companies
Company Projects Stake LocationEngineering
Complete
Total Cu Resource (MM lbs)
Total Cu Eq Resource (MM lbs) Mine Type
Tonnage (000s)
Grade CuEq
Initial Capex US$ MM (100%)
Cash Costs
DevelopersAbacus Mining And Exploration Corp Ajax 100% Canada PEA 3,316 4,812 OP 523,000 0.42% 534 0.10 AQM Copper Zafranal 50% Peru RD 3,479 3,898 OP 352,000 0.50% - NMAugusta Resource Corp Rosemont (Oxide) 100% USA DFS 617 617 OP 133,800 0.21% 65 1.58
Rosemont (Sulfide) 100% USA DFS 8,404 9,423 OP 865,800 0.49% 832 0.24 Baja Mining Corp Boleo (Underground) 70% Mexico DFS 6,092 10,186 UG 424,600 1.09% 889 0.17 Candente Resource Corp Cañariaco 100% Peru PEA 8,967 10,395 OP 910,100 0.52% 1,437 0.99 Copper Fox Metals Inc Schaft Creek 25% Canada PFS 8,256 13,939 OP 1,580,121 0.40% 3,100 0.11 Copper Mountain Mining Corp Copper Mountain 75% Canada Construction 4,127 4,127 OP 546,300 0.34% 438 1.33 Coro Mining Corp San Jorge (Oxide) 100% Argentina PEA 386 498 OP 33,330 0.68% 163 0.51
San Jorge (Sulphide) 100% Argentina PEA 6,775 7,840 OP 628,693 0.57% 278 0.55 Duluth Metals Ltd Nokomis 60% USA PEA 11,564 26,904 UG 823,873 1.48% 1,332 (0.65) Entrée Gold Ann Mason 100% USA RD 7,129 8,129 NA 810,390 0.46% - NM
Lookout Hill (Hugo North) 20% Mongolia PEA 7,064 8,622 UG 212,500 1.84% 220 NMLookout Hill (Heruga) 20% Mongolia PEA 9,630 16,736 UG 910,000 0.83% - NM
Explorator Resources Inc El Espino-Venus 49% Chile PEA 2,264 2,953 OP 230,200 0.58% 712 0.92 Far West Mining Ltd Santo Domingo 100% Chile PEA 3,684 9,525 OP 547,300 0.79% 941 (0.21) International PBX Ventures Ltd Copaquire 100% Chile PEA 1,186 2,913 OP 423,362 0.31% 774 (0.48) Lumina Copper Corp Taca Taca 100% Argentina RD 8,714 12,011 OP 841,000 0.65% - NMMinera Andes Inc Los Azules 100% Argentina PEA 12,522 14,497 OP 1,037,000 0.63% 2,826 0.36
San Jose 49% Argentina Production - 761 UG 3,290 10.50% - NMNevada Copper Corp Pumpkin Hollow (Open Pit) 100% USA PEA 5,042 5,788 OP 486,167 0.54% 526 2.96
Pumpkin Hollow (Underground) 100% USA PEA 1,419 1,597 UG 35,865 2.02% 192 1.21 NGEX Resources Josemaria 100% Argentina RD 3,588 5,718 OP 460,000 0.62% - NM
GJ 100% Canada RD 1,217 2,200 OP/UG 176,300 0.57% - NMHambok 100% Eritrea RD 550 1,074 OP/UG 27,700 1.76% - NM
Norsemont Mining Inc Constancia 100% Peru DFS 4,015 5,370 OP 441,800 0.55% 920 0.75 Northern Dynasty Minerals Ltd Pebble (Open Pit) 50% USA PEA 80,602 147,683 OP 10,777,000 0.62% 4,700 (0.17) Pacific Booker Minerals Inc Morrison 100% Canada DFS 2,317 3,279 OP 271,089 0.55% 517 0.63 Panoro Minerals Ltd Antilla 100% Peru RD 1,591 1,765 NA 156,900 0.51% - NM
Cotabambas 100% Peru RD 1,528 2,111 NA 90,000 1.06% - NMPeregrine Metals Ltd Altar 100% Argentina RD 11,732 12,878 OP 1,267,000 0.46% - NMPolymet Mining Corp Northmet 100% USA DFS 4,766 11,184 OP 889,800 0.63% 312 (1.32) Redhawk Resources Inc Copper Creek 100% USA PEA 2,991 3,372 UG 186,551 0.90% 198 1.02 Rio Alto Mining Ltd La Arena (Oxide) 100% Peru Construction - 531 OP 88,800 0.27% 50 NM
La Arena (Sulphide) 100% Peru PFS 2,913 4,428 OP 403,000 0.50% 298 1.05 Serengeti Resources Inc Kwanika 100% Canada RD 2,463 4,054 OP 538,700 0.34% - NMWestern Copper Corp Carmacks (Oxide) 100% Canada DFS 260 356 OP 10,454 1.55% 151 0.93
Carmacks (Sulphide) 100% Canada RD 144 177 NA 8,816 0.91% - NMCasino (Leach Cap) 100% Canada PFS 53 709 OP 67,000 0.48% 325 (24.78) Casino (Sulphide) 100% Canada PFS 9,895 25,746 OP 2,753,000 0.42% 1,838 (0.33) Island Copper 100% Canada RD 1,751 3,160 OP 283,700 0.51% - NMRedstone 100% Canada RD 2,938 3,017 UG 34,000 4.03% - NM
Yellowhead Mining Inc Harper Creek 100% Canada RD 4,470 4,470 OP 631,700 0.32% - NM Source: Company reports.

M&A Is Heating Up But Not Boiling Over - March 02, 2011
45
IMPORTANT DISCLOSURES:
Analyst Certification: Each CIBC World Markets research analyst named on the front page of this research report, or
at the beginning of any subsection hereof, hereby certifies that (i) the recommendations and opinions expressed herein
accurately reflect such research analyst's personal views about the company and securities that are the subject of this
report and all other companies and securities mentioned in this report that are covered by such research analyst and (ii)
no part of the research analyst's compensation was, is, or will be, directly or indirectly, related to the specific
recommendations or views expressed by such research analyst in this report.
Potential Conflicts of Interest: Equity research analysts employed by CIBC World Markets are compensated from
revenues generated by various CIBC World Markets businesses, including the CIBC World Markets Investment Banking
Department. Research analysts do not receive compensation based upon revenues from specific investment banking
transactions. CIBC World Markets generally prohibits any research analyst and any member of his or her household from
executing trades in the securities of a company that such research analyst covers. Additionally, CIBC World Markets
generally prohibits any research analyst from serving as an officer, director or advisory board member of a company that
such analyst covers.
In addition to 1% ownership positions in covered companies that are required to be specifically disclosed in this report,
CIBC World Markets may have a long position of less than 1% or a short position or deal as principal in the securities
discussed herein, related securities or in options, futures or other derivative instruments based thereon.
Recipients of this report are advised that any or all of the foregoing arrangements, as well as more specific disclosures
set forth below, may at times give rise to potential conflicts of interest.

M&A Is Heating Up But Not Boiling Over - March 02, 2011
46
Important Disclosure Footnotes for Companies Mentioned in this Report that Are Covered by CIBC World Markets Inc.:
Stock Prices as of 03/02/2011:
Capstone Mining Corporation (2g, 7) (CS-TSX, C$4.59, Sector Outperformer)
Equinox Minerals Limited (2a, 2e, 2g) (EQN-TSX, C$5.76, Restricted)
First Quantum Minerals Ltd. (FM-TSX, C$118.68, Sector Outperformer)
HudBay Minerals Inc. (2g, 7) (HBM-TSX, C$16.71, Sector Outperformer)
Inmet Mining Corporation (2a, 2e, 2g) (IMN-TSX, C$67.88, Restricted)
Ivanhoe Mines Ltd. (2a, 2e, 2g) (IVN-TSX, C$27.73, Sector Performer)
Mercator Minerals Ltd. (ML-TSX, C$4.36, Sector Performer)
Quadra FNX Mining Ltd. (2a, 2e, 2g, 7) (QUX-TSX, C$14.10, Sector Outperformer)
Taseko Mines Limited (2g) (TKO-TSX, C$6.13, Sector Performer)
Teck Resources Limited (2a, 2b, 2c, 2d, 2e, 2f, 2g, 3a, 3c, 7, 9, 12) (TCK.B-TSX, C$52.85, Sector Outperformer)
Thompson Creek Metals Company, Inc. (2g) (TCM-TSX, C$12.62, Sector Outperformer)
Western Copper Corporation (2a, 2c, 2e, 2g) (WRN-TSX, C$3.62, Sector Outperformer)
Companies Mentioned in this Report that Are Not Covered by CIBC World Markets Inc.:
Stock Prices as of 03/02/2011:
Abacus Mining & Exploration Corp. (AME-V, C$0.24, Not Rated)
Amerigo Resources Ltd (ARG-TSX, C$1.31, Not Rated)
Anglo American PLC (AAL-L, p3253.22, Not Rated)
Antofagasta (ANTO-L, £1395.17, Not Rated)
AQM Copper Inc. (AQM-V, C$0.84, Not Rated)
Augusta Resource Corporation (AZC-TSX, C$5.84, Not Rated)
Aura Minerals Inc. (ORA-TSX, C$3.62, Not Rated)
Baja Mining Corporation (BAJ-TSX, C$1.03, Not Rated)
Candente Resource Corp (DNT-TSX, C$1.99, Not Rated)
China Sci-Tech Holdings Ltd. (0985-HK, [HKD]0.23, Not Rated)
Cliffs Natural Resources Inc. (CLF-NYSE, US$96.88, Not Rated)
Compania de Minas Buenaventura SAA (BVN-NYSE, US$47.35, Not Rated)
Copper Fox Metals Inc. (CUU-V, C$1.69, Not Rated)
Copper Mountain Mining (CUM-TSX, C$6.75, Not Rated)
Coro Mining Corporation (COP-TSX, C$1.43, Not Rated)
Duluth Metals Ltd. (DM-TSX, C$2.80, Not Rated)
Entree Gold Inc. (ETG-TSX, C$3.05, Not Rated)
Explorator Resources Inc. (EXO-V, C$0.50, Not Rated)
Far West Mining Ltd. (FWM-TSX, C$7.54, Not Rated)
Gold Fields Ltd. (GFI-NYSE, US$18.13, Not Rated)
Iberian Minerals Corp. (IZN-V, C$0.94, Not Rated)
Imperial Metals Corp. (III-TSX, C$23.14, Not Rated)
International PBX Ventures Ltd. (PBX-V, C$0.49, Not Rated)
Jiangxi Copper (0358-HK, [HKD]24.30, Not Rated)
KGHM Polska Miedz. S.A. (KGHPF-PN, US$64.14, Not Rated)
Los Andes Copper Limited (LA-V, C$0.48, Not Rated)
Lumina Copper Corp. (LCC-V, C$6.01, Not Rated)
Marubeni Corporation (8002-T, ¥620.00, Not Rated)
Minera Andes Inc. (MAI-TSX, C$2.80, Not Rated)

M&A Is Heating Up But Not Boiling Over - March 02, 2011
47
Companies Mentioned in this Report that Are Not Covered by CIBC World Markets Inc.: (Continued)
Stock Prices as of 03/02/2011:
Mitsubishi Materials Corp. (5711-T, ¥301.00, Not Rated)
Nevada Copper Corp. (NCU-TSX, C$5.35, Not Rated)
NGEx Resources Inc. (NGQ-TSX, C$1.50, Not Rated)
Norsemont Mining (NOM-TSX, C$4.40, Not Rated)
Northern Dynasty Minerals Ltd (NDM-TSX, C$17.42, Not Rated)
Pacific Booker Minerals Inc. (BKM-V, C$8.70, Not Rated)
Panoro Minerals Ltd. (PML-V, C$0.65, Not Rated)
Peregrine Metals Ltd. (PGM-TSX, C$0.86, Not Rated)
Polymet Mining (POM-TSX, C$2.08, Not Rated)
Redhawk Resources, Inc. (RDK-V, C$0.74, Not Rated)
Rio Alto Exploration Ltd. (RIO-V, C$2.36, Not Rated)
Rio Tinto plc (RIO-L, p4182.74, Not Rated)
Serengeti Resources Inc. (SIR-V, C$0.37, Not Rated)
Sojitz Corporation (2768-T, ¥184.00, Not Rated)
Sumitomo Metal Mining (5713-T, ¥1531.00, Not Rated)
Xstrata (XTA-L, p1412.00, Not Rated)
Yellowhead Mining Inc. (YMI-V, C$1.76, Not Rated)
Important disclosure footnotes that correspond to the footnotes in this table may be found in the "Key to
Important Disclosure Footnotes" section of this report.

M&A Is Heating Up But Not Boiling Over - March 02, 2011
48
Key to Important Disclosure Footnotes:
1 CIBC World Markets Corp. makes a market in the securities of this company.
2a This company is a client for which a CIBC World Markets company has performed investment banking services
in the past 12 months.
2b CIBC World Markets Corp. has managed or co-managed a public offering of securities for this company in the
past 12 months.
2c CIBC World Markets Inc. has managed or co-managed a public offering of securities for this company in the
past 12 months.
2d CIBC World Markets Corp. has received compensation for investment banking services from this company in
the past 12 months.
2e CIBC World Markets Inc. has received compensation for investment banking services from this company in the
past 12 months.
2f CIBC World Markets Corp. expects to receive or intends to seek compensation for investment banking services
from this company in the next 3 months.
2g CIBC World Markets Inc. expects to receive or intends to seek compensation for investment banking services
from this company in the next 3 months.
3a This company is a client for which a CIBC World Markets company has performed non-investment banking,
securities-related services in the past 12 months.
3b CIBC World Markets Corp. has received compensation for non-investment banking, securities-related services
from this company in the past 12 months.
3c CIBC World Markets Inc. has received compensation for non-investment banking, securities-related services
from this company in the past 12 months.
4a This company is a client for which a CIBC World Markets company has performed non-investment banking,
non-securities-related services in the past 12 months.
4b CIBC World Markets Corp. has received compensation for non-investment banking, non-securities-related
services from this company in the past 12 months.
4c CIBC World Markets Inc. has received compensation for non-investment banking, non-securities-related
services from this company in the past 12 months.
5a The CIBC World Markets Corp. analyst(s) who covers this company also has a long position in its common
equity securities.
5b A member of the household of a CIBC World Markets Corp. research analyst who covers this company has a
long position in the common equity securities of this company.
6a The CIBC World Markets Inc. fundamental analyst(s) who covers this company also has a long position in its
common equity securities.
6b A member of the household of a CIBC World Markets Inc. fundamental research analyst who covers this
company has a long position in the common equity securities of this company.
7 CIBC World Markets Corp., CIBC World Markets Inc., and their affiliates, in the aggregate, beneficially own 1%
or more of a class of equity securities issued by this company.
8 An executive of CIBC World Markets Inc. or any analyst involved in the preparation of this research report has
provided services to this company for remuneration in the past 12 months.
9 A senior executive member or director of Canadian Imperial Bank of Commerce ("CIBC"), the parent company
to CIBC World Markets Inc. and CIBC World Markets Corp., or a member of his/her household is an officer,
director or advisory board member of this company or one of its subsidiaries.
10 Canadian Imperial Bank of Commerce ("CIBC"), the parent company to CIBC World Markets Inc. and CIBC
World Markets Corp., has a significant credit relationship with this company.
11 The equity securities of this company are restricted voting shares.
12 The equity securities of this company are subordinate voting shares.
13 The equity securities of this company are non-voting shares.
14 The equity securities of this company are limited voting shares.

M&A Is Heating Up But Not Boiling Over - March 02, 2011
49
CIBC World Markets Inc. Price Chart
For price and performance information charts required under NYSE and NASD rules, please visit CIBC on the web at http://apps.cibcwm.com/sec2711 or write to CIBC World Markets Inc., Brookfield Place, 161 Bay Street, 4th Floor, Toronto, Ontario M5J 2S8, Attn: Research Disclosure Chart Request.
CIBC World Markets Inc. Stock Rating System
Abbreviation Rating Description
Stock Ratings
SO Sector Outperformer Stock is expected to outperform the sector during the next 12-18 months.
SP Sector Performer Stock is expected to perform in line with the sector during the next 12-18 months.
SU Sector Underperformer Stock is expected to underperform the sector during the next 12-18 months.
NR Not Rated CIBC World Markets does not maintain an investment recommendation on the stock.
R Restricted CIBC World Markets is restricted*** from rating the stock.
Sector Weightings**
O Overweight Sector is expected to outperform the broader market averages.
M Market Weight Sector is expected to equal the performance of the broader market averages.
U Underweight Sector is expected to underperform the broader market averages.
NA None Sector rating is not applicable.
**Broader market averages refer to the S&P 500 in the U.S. and the S&P/TSX Composite in Canada.
"Speculative" indicates that an investment in this security involves a high amount of risk due to volatility and/or liquidity issues.
***Restricted due to a potential conflict of interest.
Ratings Distribution*: CIBC World Markets Inc. Coverage Universe
(as of 02 Mar 2011) Count Percent Inv. Banking Relationships Count Percent
Sector Outperformer (Buy) 135 43.7% Sector Outperformer (Buy) 132 97.8%
Sector Performer (Hold/Neutral) 127 41.1% Sector Performer (Hold/Neutral) 116 91.3%
Sector Underperformer (Sell) 30 9.7% Sector Underperformer (Sell) 27 90.0%
Restricted 16 5.2% Restricted 16 100.0%
Ratings Distribution: Metals & Minerals Coverage Universe
(as of 02 Mar 2011) Count Percent Inv. Banking Relationships Count Percent
Sector Outperformer (Buy) 13 43.3% Sector Outperformer (Buy) 12 92.3%
Sector Performer (Hold/Neutral) 10 33.3% Sector Performer (Hold/Neutral) 9 90.0%
Sector Underperformer (Sell) 2 6.7% Sector Underperformer (Sell) 2 100.0%
Restricted 5 16.7% Restricted 5 100.0%
Metals & Minerals Sector includes the following tickers: ADV, BAN, BIM, CCO, CLM, CS, DML, EQN, FM, GCE, GMO, HBM, IMN, IVN,
LIF.UN, LUN, ML, MNB, NML, PDN, QUX, S, SGQ, TCK.B, TCM, TKO, UEC, UUU, WRN, WTN.
*Although the investment recommendations within the three-tiered, relative stock rating system utilized by CIBC World Markets Inc.
do not correlate to buy, hold and sell recommendations, for the purposes of complying with NYSE and NASD rules, CIBC World
Markets Inc. has assigned buy ratings to securities rated Sector Outperformer, hold ratings to securities rated Sector Performer, and
sell ratings to securities rated Sector Underperformer without taking into consideration the analyst's sector weighting.
Important disclosures required by IIROC Rule 3400, including potential conflicts of interest information, our system for
rating investment opportunities and our dissemination policy can be obtained by visiting CIBC World Markets on the web at http://researchcentral.cibcwm.com under 'Quick Links' or by writing to CIBC World Markets Inc., Brookfield Place, 161 Bay Street, 4th Floor, Toronto, Ontario M5J 2S8, Attention: Research Disclosures Request.
M&A Is Heating Up But Not Boiling Over - March 02, 2011
50
Legal Disclaimer
This report is issued and approved for distribution by (a) in Canada, CIBC World Markets Inc., a member of the
Investment Industry Regulatory Organization of Canada (“IIROC”), the Toronto Stock Exchange, the TSX Venture
Exchange and CIPF, (b) in the United Kingdom, CIBC World Markets plc, which is regulated by the Financial Services
Authority ("FSA"), and (c) in Australia, CIBC Australia Limited, a member of the Australian Stock Exchange and regulated
by the ASIC (collectively, "CIBC World Markets") and (d) in the United States either by (i) CIBC World Markets Inc. for
distribution only to U.S. Major Institutional Investors (“MII”) (as such term is defined in SEC Rule 15a-6) or (ii) CIBC
World Markets Corp., a member of the Financial Industry Regulatory Authority (“FINRA”). U.S. MIIs receiving this report
from CIBC World Markets Inc. (the Canadian broker-dealer) are required to effect transactions (other than negotiating
their terms) in securities discussed in the report through CIBC World Markets Corp. (the U.S. broker-dealer).
This report is provided, for informational purposes only, to institutional investor and retail clients of CIBC World
Markets in Canada, and does not constitute an offer or solicitation to buy or sell any securities discussed herein in any
jurisdiction where such offer or solicitation would be prohibited. This document and any of the products and information
contained herein are not intended for the use of private investors in the United Kingdom. Such investors will not be able
to enter into agreements or purchase products mentioned herein from CIBC World Markets plc. The comments and views
expressed in this document are meant for the general interests of wholesale clients of CIBC Australia Limited.
The securities mentioned in this report may not be suitable for all types of investors. This report does not take into
account the investment objectives, financial situation or specific needs of any particular client of CIBC World Markets.
Recipients should consider this report as only a single factor in making an investment decision and should not rely solely
on investment recommendations contained herein, if any, as a substitution for the exercise of independent judgment of
the merits and risks of investments. The analyst writing the report is not a person or company with actual, implied or
apparent authority to act on behalf of any issuer mentioned in the report. Before making an investment decision with
respect to any security recommended in this report, the recipient should consider whether such recommendation is
appropriate given the recipient's particular investment needs, objectives and financial circumstances. CIBC World
Markets suggests that, prior to acting on any of the recommendations herein, Canadian retail clients of CIBC World
Markets contact one of our client advisers in your jurisdiction to discuss your particular circumstances. Non-client
recipients of this report who are not institutional investor clients of CIBC World Markets should consult with an
independent financial advisor prior to making any investment decision based on this report or for any necessary
explanation of its contents. CIBC World Markets will not treat non-client recipients as its clients solely by virtue of their
receiving this report.
Past performance is not a guarantee of future results, and no representation or warranty, express or implied, is
made regarding future performance of any security mentioned in this report. The price of the securities mentioned in
this report and the income they produce may fluctuate and/or be adversely affected by exchange rates, and investors
may realize losses on investments in such securities, including the loss of investment principal. CIBC World Markets
accepts no liability for any loss arising from the use of information contained in this report, except to the extent that
liability may arise under specific statutes or regulations applicable to CIBC World Markets.
Information, opinions and statistical data contained in this report were obtained or derived from sources believed to
be reliable, but CIBC World Markets does not represent that any such information, opinion or statistical data is accurate
or complete (with the exception of information contained in the Important Disclosures section of this report provided by
CIBC World Markets or individual research analysts), and they should not be relied upon as such. All estimates, opinions
and recommendations expressed herein constitute judgments as of the date of this report and are subject to change
without notice. Nothing in this report constitutes legal, accounting or tax advice. Since the levels and bases of taxation
can change, any reference in this report to the impact of taxation should not be construed as offering tax advice on the
tax consequences of investments. As with any investment having potential tax implications, clients should consult with
their own independent tax adviser. This report may provide addresses of, or contain hyperlinks to, Internet web sites.
CIBC World Markets has not reviewed the linked Internet web site of any third party and takes no responsibility for the
contents thereof. Each such address or hyperlink is provided solely for the recipient's convenience and information, and
the content of linked third-party web sites is not in any way incorporated into this document. Recipients who choose to
access such third-party web sites or follow such hyperlinks do so at their own risk. Although each company issuing this
report is a wholly owned subsidiary of Canadian Imperial Bank of Commerce ("CIBC"), each is solely responsible for its
contractual obligations and commitments, and any securities products offered or recommended to or purchased or sold
in any client accounts (i) will not be insured by the Federal Deposit Insurance Corporation ("FDIC"), the Canada Deposit
Insurance Corporation or other similar deposit insurance, (ii) will not be deposits or other obligations of CIBC, (iii) will
not be endorsed or guaranteed by CIBC, and (iv) will be subject to investment risks, including possible loss of the
principal invested. The CIBC trademark is used under license.
© 2011 CIBC World Markets Inc. All rights reserved. Unauthorized use, distribution, duplication or disclosure
without the prior written permission of CIBC World Markets is prohibited by law and may result in prosecution.
Recommended