
1
Second Wind Final Design
Dec. 8, 2009
Josh Dowler
Caleb Meeks
John Snyder

2
Table of Contents
Requirements Specification...………………………………………….…………………………….………………….…..…….……….….3
Final Design…………………………………..……………………………………………………………………………………………….…..…….5
Block Diagram……………………………………………………………..…………………………………………………..….….....6
Organization and Management.………………………………………………..………………………….…..……..………..7
Generator Motor Selection.…….………………………………………………………..…………………...………...……..…8
Sprockets and Chains……………..…………………………………………………………..…………………………..………....9
Motor and Gearing Calculations……...………………………………………………..…………….…….………..………..11
Freewheel and Return Mechanisms..………………………………………………..…………….……….………...…….12
Generation Stress Concentration Points……………………………………………………..….……….………...……..14
Generation System Diagrams….…………………………………………………..………………………………….…..……15
Charge Controller Design ………………………….…………..……………….……………………….….………….………..20
Microprocessor Design………………………….…………..……………….…………………………….….................…..25
Software Design…………………………..………….………..……………….……………………………………………….…...27
Motor Controller Design………………………….………..……………….……………………………………………….…...30
Electrical Components………………………….…………..……………….…………………………………………..…...…..31
Electronically Assisted Design…………………………………………………………..……………………………………….33
Kite Retraction System Design………………………..………………………………..…………………………..………….43
Budget Analysis.………………..…….…………………….…………………………………..…………………………...….……45
Updated Budget………………..………………………………………………………………..…………………..………….……46
Schedule Analysis.……………..………………………………..…………………………………..……………..………….……47
Gantt Chart – Fall 2009…………………………………………………………………………..………………..…….…………48
Gantt Chart – Spring 2010…………………………………………………………………..…………………………………….49
Appendices…………………………………………………………………………………………………..…………………………….…......….50
MAX15046 DC-DC Converter………………………………………………………………………………………..…….………A
PIC18F4550 Microprocessor……………………………………………………………………………………………………….B
TLE5205-2 Motor Controller……………………………………………………………………………………………………….C

3
Kite Wind Generator
Requirements Specification Overview: Our team will design and prototype a kite wind generator. The generator will produce electrical power from the drag force applied to the kite by wind. The kite will be autonomously guided by a microprocessor to perform the gliding maneuvers necessary to produce power. A kite wind generator would be useful for generating power on large scale agricultural farms, in remote locations for disaster relief or military, or as a part of a larger wind farm. Problem Statement: Due to pollution and depletion of traditional energy sources there is a need to generate power from renewable energy sources. Wind is the second most abundant energy resource, next to solar energy, that can be harnessed to generate power. Kite wind generation is more effective than conventional turbines in gathering the energy from the wind for two reasons. First, the kite can reach much higher altitudes than turbines, where the wind is more reliable and strong. Second, kites can cover more area in the sky and therefore use more of the energy than a stationary turbine can. This technology could allow individuals to become energy self-sufficient and it could also be used in large scale projects as wind farms that produce high power. Operational Description: The kite wind generation unit will produce power based on the drag force produced by the kite in flight and the amount of line pulled, which will be connected to a generator, over time. When the kite has reached its maximum height the kite orientation will be changed to reduce its drag coefficient, and the kite will be retracted using much less power than is generated from the pull up. The kite will run autonomously in winds of 10 to 45 kilometers per hour. When the wind speeds are too high the kite will be retracted to prevent damage to the system. If the wind speeds are too low the kite will be retracted. The system will also have a user interface that displays the length of line released, and power generation. The user will also have options for three different modes of operation for the kite; deploy, sustain, and retract. Technical Requirements:
System will initially supply its own power to initiate energy generation and then store excess generated power
If power generation is not sufficient to generate excess power the kite will be retracted and the user interface will run off of stored power
System will generate at least 500 watt hours DC within 10 hours Kite system will be able to generate power in winds from 10 - 45 kilometers per hour Setup, including kite deployment, should take no more than 30 minutes Power generation should occur within five minutes of kite deployment System must have deploy, sustain, and retract modes of operation Autonomous control of each mode (deploy, sustain, retract) User interface to enable user to specify modes of operation (deploy, sustain, retract) and show user
length of line released within one meter and power generated within 20 watts Must be able to sense length of line released within one meter and power generation within 20 watts

4
System will be able to fit through a standard door frame, with width of one meter and height of two meters Design Deliverables:
User manual Drawings and schematics with analyses Kite generator unit User interface Parts list with associated costs Test report Final technical report
System Test Plan
1. Kite stays aloft in winds of 10 - 45 kilometers per hour 2. 10 minutes of autonomous flight and power generation in winds of 10 - 45 kilometers per hour 3. Generation of 500 watt hours DC within 10 hours 4. The electrical system will have a fail safe mechanism that will enable in case of a power surge 5. Kite retraction of less than 10 minutes in winds of 10 - 45 kilometers per hour 6. Shows accurate value for length of line released by comparing it with a tape measure within one meter 7. Shows accurate value for power generation within 20 watts by using current and voltage measurements
using a multimeter Implementation Consideration: Follow FAA regulations part 101, subparts A and B: no flight between sunset and sunrise, a letter of intent to fly the kite above 150 feet sent to the nearest FAA ATC facility, a 100m radius of land without obstruction around base, set in an area five miles away from an airport, land must have ground visibility greater than 3 miles, and the kite line must have streamers at 50 foot intervals above 150 feet that are visible for one mile. The leads for the generator and battery will be covered to prevent shock. Sprockets and chains are part of the design and could propose some safety issues.

5
Final Design
6
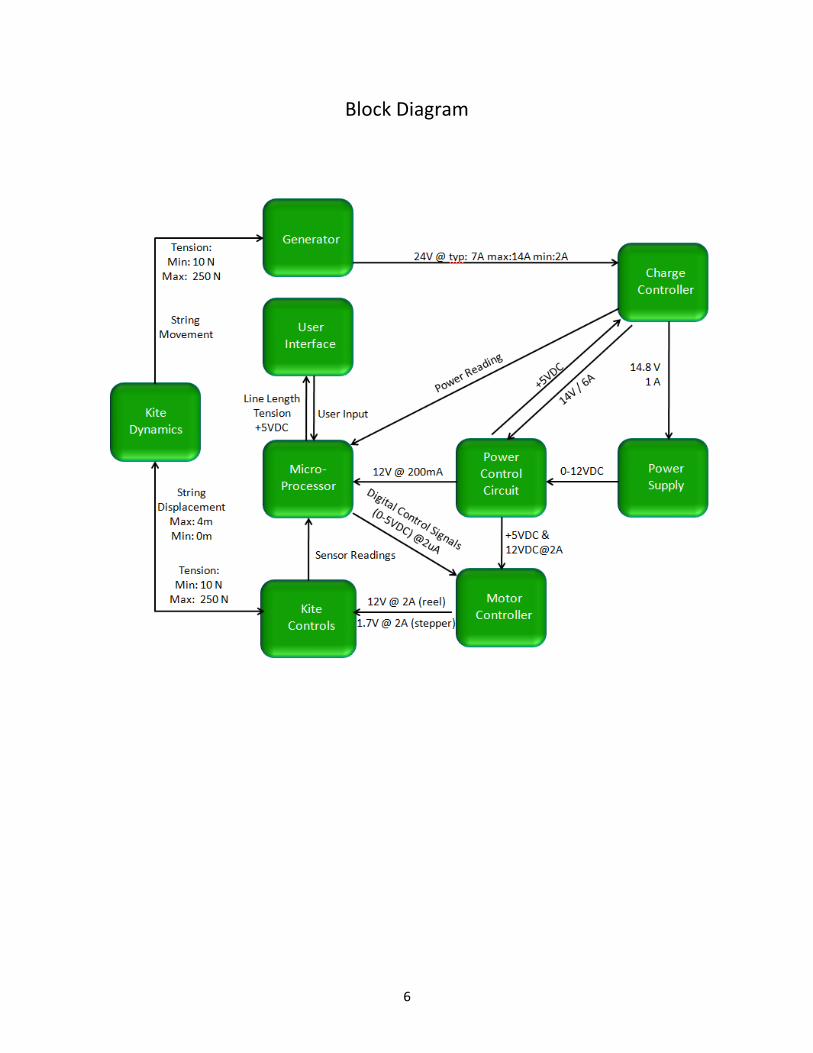
Block Diagram

7
Organization and Management
John Snyder – John is a senior computer engineering student, with a 50/50 electrical and engineering and computer science split. He will be working with programming the microprocessor to get it to work with the motor controller, kite controls system, and the user interface. He will also be working on the charge controller to prevent it from overcharging and surge protection for the power supply. He will also be working with different sensors to provide information for the system.
Josh Dowler – Josh is a senior mechanical engineering student, and is the project leader. He will be in charge of converting the tension provided by the kite behavior and turning it into electric power. He will be working with the generator motor and a freewheel mechanism to allow the kite to retract without affecting the generator and selecting gear ratios as necessary. As project leader, he will be in charge of managing the budget, overseeing all project happenings, and reviewing documentation.
Caleb Meeks – Caleb is a senior mechanical engineering student. He will be in charge of working with the controls system and kite behavior. He will construct and work closely with John on the electrical and mechanical aspects of the controls system. The controls system will also link with the power generation processes, and therefore Caleb and Josh will be working to integrate their systems.
All team members will contribute equally to any documentation that will be presented, including reports and oral presentations. Each team member will be in charge of maintaining their notebooks and doing research on their respective parts outside of group meeting times. Team members are required to attend team meetings unless they notify the other team members about their absence.

8
Table 2
Table 1
Generator Motor Selection
Ideal motor criteria:
1) Reversible - motor can act as a generator
2) DC - no AC/DC inverter needed
3) Permanent Magnet - powerful
4) Brushless - less friction loss
5) Low rated RPM - less gearing required
6) Continuous Duty - made to run continuously
Based on some basic lift and drag force
equations ( , ) tension force from the kite onto the system was calculated. In these equations; p is air density, ν is the wind speed, A is the characteristic area of the kite, and Cl and Cd are the lift and
drag coefficients, respectively. The tension force was then converted into a torque value based on assumed values for sprockets used to gear the system. The torque transferred to the motor varied based upon the assumed values for the sprockets, so an Excel spreadsheet was used to calculate various possible torque values that could be transferred to the motor based upon the gearing ratio and the speed of the kite pulling out (Figure 2).
Based upon the calculated torque that could be supplied to the system our system will be able to overcome the torque for a 350 watt motor. Many inexpensive brushed motors are available with power outputs around 350 watts. One brushless motor was found that had a power output in the range of 350 watts. However, this motor is not reversible and thus cannot be used as a generator
The chosen motor is priced at $47.91 from Monster Scooter Parts shown in table 1. The motor has an 11 tooth sprocket for #25 roller chain. The system will need a form of gearing to reach the rated motor speed.
Motor Torque in*lbf (N*m)
Gear Ratio
Kite Tension lbf (N)
Motor Power (watts)
1.0 (0.113) 7.4 3.5 (15.6) 30.76
2.0 (0.246) 7.0 7.0 (31.1) 61.53
3.0 (0.369) 7.0 10.5 (46.7) 92.29
4.0 (0.492) 7.0 14.0 (62.3) 123.05
5.0 (0.615) 7.0 17.5 (77.8) 153.82
6.0 (0.738) 7.0 21.0 (93.4) 184.58
7.0 (0.861) 7.0 24.5 (109.0) 215.34
8.0 (0.984) 7.0 28.0 (124.6) 246.11
9.0 (1.107) 7.0 31.5 (140.1) 276.87
10.0 (1.230) 7.0 35.0 (155.7) 307.63
11.0 (1.353) 7.0 38.5 (171.3) 338.40
12.0 (1.476) 7.0 42.0 (186.8) 369.16
13.0 (1.599) 7.0 45.5 (202.4) 399.92
14.0 (1.722) 7.0 49.0 (218.0) 430.68
15.0 (1.845) 7.0 52.5 (233.5) 461.45
Assuming a 4" diameter spring return mechanism
9
Figure 2
Sprockets and Chains
The design of the gearing system began during the generator motor selection phase due
to the dependency between the two systems. The force coming in from the lines needs to be
geared up to supply the rated RPMs of the motor.
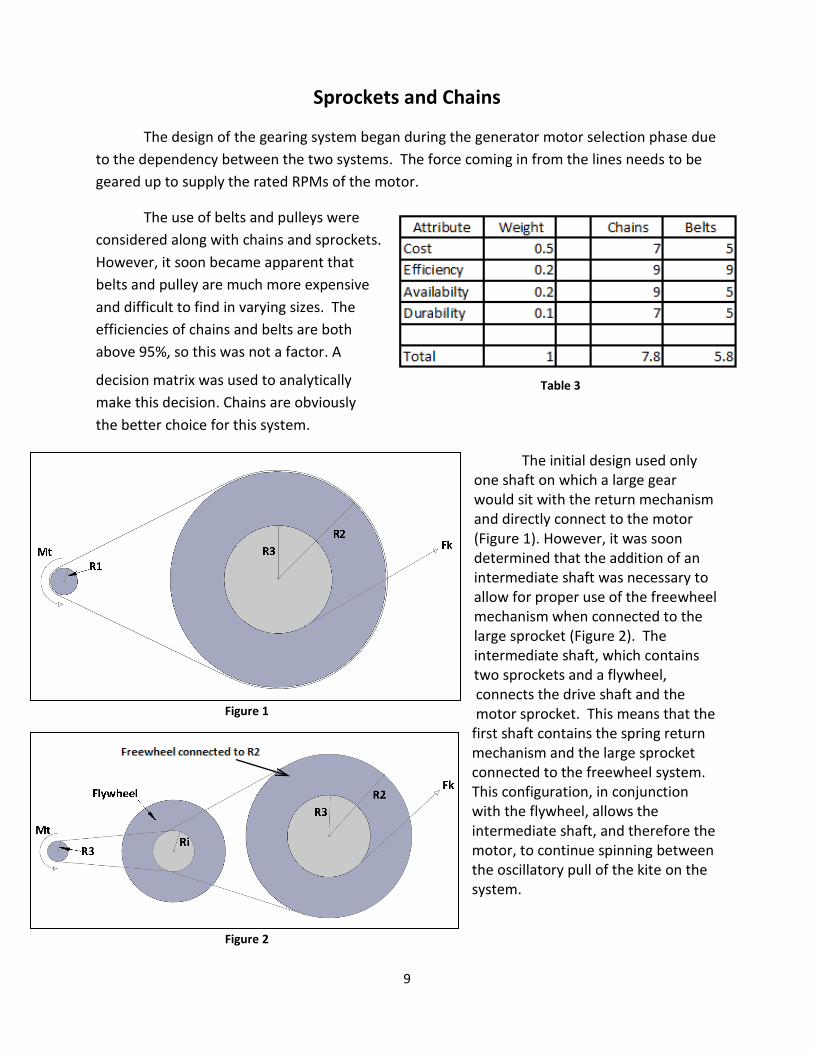
The use of belts and pulleys were
considered along with chains and sprockets.
However, it soon became apparent that
belts and pulley are much more expensive
and difficult to find in varying sizes. The
efficiencies of chains and belts are both
above 95%, so this was not a factor. A
decision matrix was used to analytically
make this decision. Chains are obviously
the better choice for this system.
The initial design used only one shaft on which a large gear would sit with the return mechanism and directly connect to the motor (Figure 1). However, it was soon determined that the addition of an intermediate shaft was necessary to allow for proper use of the freewheel mechanism when connected to the large sprocket (Figure 2). The intermediate shaft, which contains two sprockets and a flywheel, connects the drive shaft and the motor sprocket. This means that the
first shaft contains the spring return mechanism and the large sprocket connected to the freewheel system. This configuration, in conjunction with the flywheel, allows the intermediate shaft, and therefore the motor, to continue spinning between the oscillatory pull of the kite on the system.
Figure 1
Table 3

10
The generator motor uses #25 roller chain, therefore the sprockets must also use #25
roller chain. The tension of the kite lines at maximum wind speed is 50.97 lbs (226.75 N), as
calculated from the lift and drag force equations stated earlier. The working load of #25 roller
chain is 140 lbs (622.75 N) which gives a factor of safety of 2.75 for the chains. The designed
system gearing ratio will be 7.4:1, which will give a balance between the kite speed required
and the torque the kite tension force will generate. The Excel data and graph is shown on the
following page in Figure 3 and Table 4.
A fully assembled rear wheel assembly comes with the large sprocket combined with the
freewheel, and axle size needed as well as a wheel and tire that is not needed. Two sprockets
(one 14 tooth and one 16 tooth), a steel bar of ½ inch diameter, and two bearings for the
intermediate shaft will be purchased.
The flywheel does not have a specific design as of yet. From research it has been found
that the heavier the flywheel the smoother the operation of the motor, as long as the driving
force is able to overcome the inertia of the flywheel. The design portion on flywheels in the
machine design text book is not clear in the actual process for designing the flywheels. There
are also no online resources that use an engineering approach to designing flywheels.
I will continue to do more research on the design of flywheels.
11
0
2
4
6
8
10
12
14
16
10 20 30 40 50 60
Kit
e S
pe
ed
(ft
/s)
Force of the Kite Fk (lbs)
Force of the Kite vs. Kite Speed
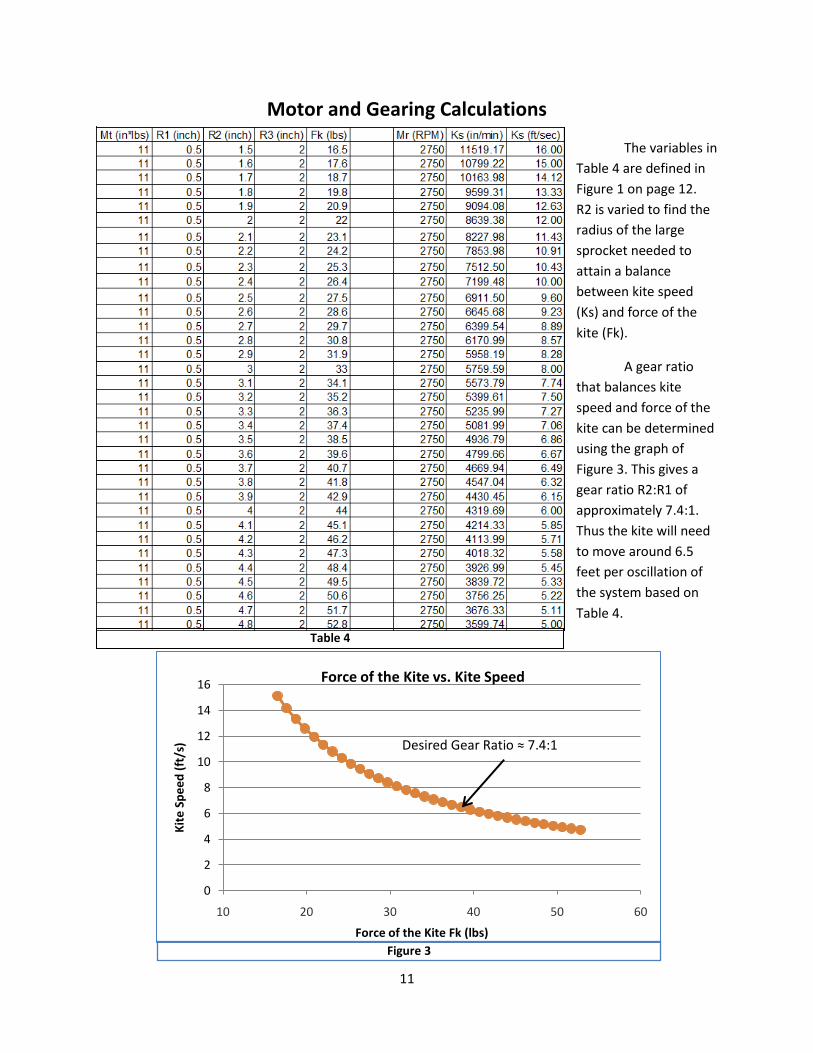
Motor and Gearing Calculations
The variables in
Table 4 are defined in
Figure 1 on page 12.
R2 is varied to find the
radius of the large
sprocket needed to
attain a balance
between kite speed
(Ks) and force of the
kite (Fk).
A gear ratio
that balances kite
speed and force of the
kite can be determined
using the graph of
Figure 3. This gives a
gear ratio R2:R1 of
approximately 7.4:1.
Thus the kite will need
to move around 6.5
feet per oscillation of
the system based on
Table 4.
Desired Gear Ratio ≈ 7.4:1
Table 4
Figure 3

12
Figure 4
Freewheel and Return Mechanism
The freewheel mechanism is a vital part of the
generation system design. Figure 4 shows how a basic
freewheel mechanism works. A freewheel allows free rotation
in one direction, but when spun in the opposite direction the
system engages and allows energy transfer. This means that
the kite string, when pulled out, will engage the freewheel and
transfer energy into the shafts and motor. However, when the
kite is in the return stage of its oscillatory motion, due to the
spring return mechanism, the kite string and the motor can
move independently.
This system will use a freewheel that is already
attached to a sprocket and axle on a rear wheel assembly of
an electric scooter. There are no force or life specifications on the freewheel that we will be
using. However, it is assumed that this system will undergo far less stress compared to a high
powered electric scooter that the part is made for.
The return mechanism is the system that will be used to retract the kite during each
oscillation of the kite through its figure eight pattern. The return mechanism consists of a spring
that will store some of the energy of the kite into potential spring energy when the kite is on its
outward pull. The potential spring energy will then be released when the kite is on the outside
of its figure eight flight pattern, which will be discussed later, and the kite will be retracted to
its original position.
The spring return mechanism is
more difficult to design due to the need
for a constant kite pull out length at
varying wind speeds. R3 (Figure 2)
needs to remain constant at 2 inches
due to the gearing ratio already being
selected. The values for the force of
the kite are already known as shown in
Table 5. The cheapest and easiest way
to allow the kite to have a constant pull
out length at varying wind speeds is to
vary the spring constant ‘k’ of the
spring. Under the budget of this
Kite string
Attached Spring
Shaft
Variable Diameter
Spools for Spring
Return Mechanism
Figure 5
String Connecting
Spring and Variable
Diameter Spools
13
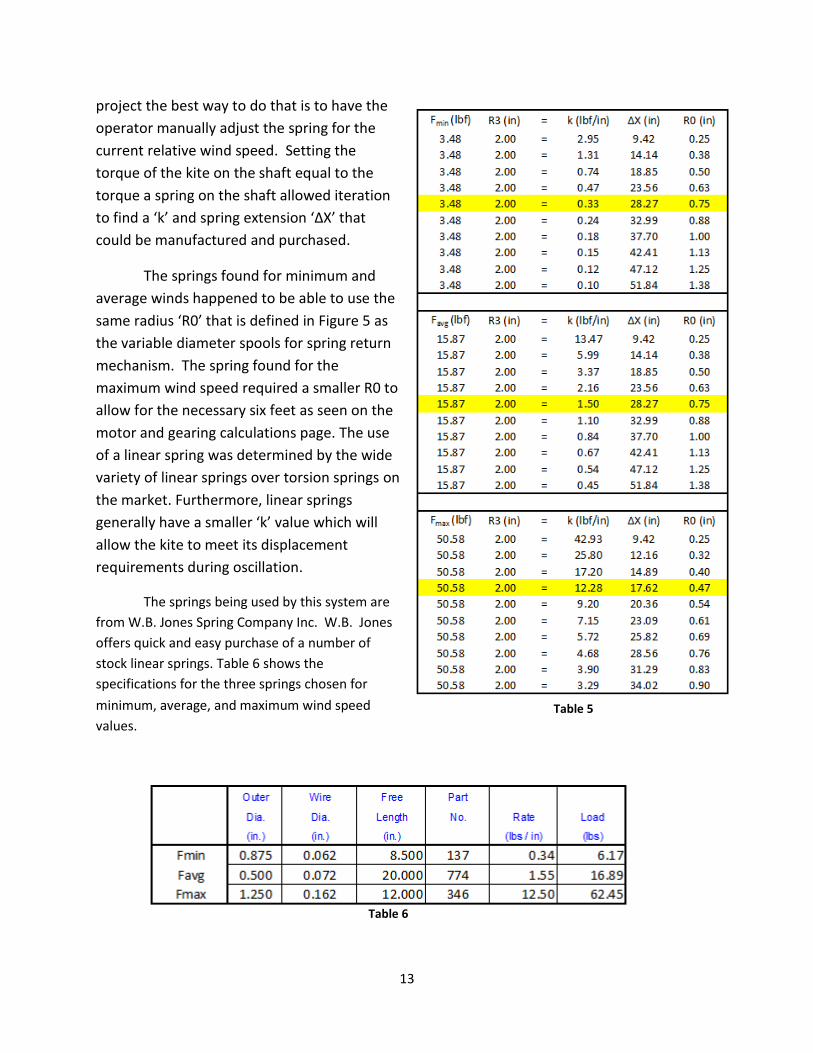
project the best way to do that is to have the
operator manually adjust the spring for the
current relative wind speed. Setting the
torque of the kite on the shaft equal to the
torque a spring on the shaft allowed iteration
to find a ‘k’ and spring extension ‘∆X’ that
could be manufactured and purchased.
The springs found for minimum and
average winds happened to be able to use the
same radius ‘R0’ that is defined in Figure 5 as
the variable diameter spools for spring return
mechanism. The spring found for the
maximum wind speed required a smaller R0 to
allow for the necessary six feet as seen on the
motor and gearing calculations page. The use
of a linear spring was determined by the wide
variety of linear springs over torsion springs on
the market. Furthermore, linear springs
generally have a smaller ‘k’ value which will
allow the kite to meet its displacement
requirements during oscillation.
The springs being used by this system are
from W.B. Jones Spring Company Inc. W.B. Jones
offers quick and easy purchase of a number of
stock linear springs. Table 6 shows the
specifications for the three springs chosen for
minimum, average, and maximum wind speed
values.
Table 5
Table 6

14
Generation System Finite Element Analysis
Finite Element Analysis was completed on the shaft that would have the most likelihood to
fail. This is due to the large load of the flywheel on the shaft as well as the two intermediate
sprockets. There is a force of 50 lbs (N) in the center of the shaft, where there would actually be a
weight of 25 lbs (N). There are also two torsion forces where the intermediate sprockets will go
with a value of 22 lb*in (), where there would actually be only as much as 11 lb*in of torque.
Figures 6, 7, and 8 below represent the deflection, stress, and factor of safety of the beam with
exaggerated deflections. The deflections are well below one thousandth of an inch. This proves that
the shaft will easily support the forces acting on it.
Figure 6
Figure 7
Figure 8
Intermediate Sprocket Locations Flywheel Location
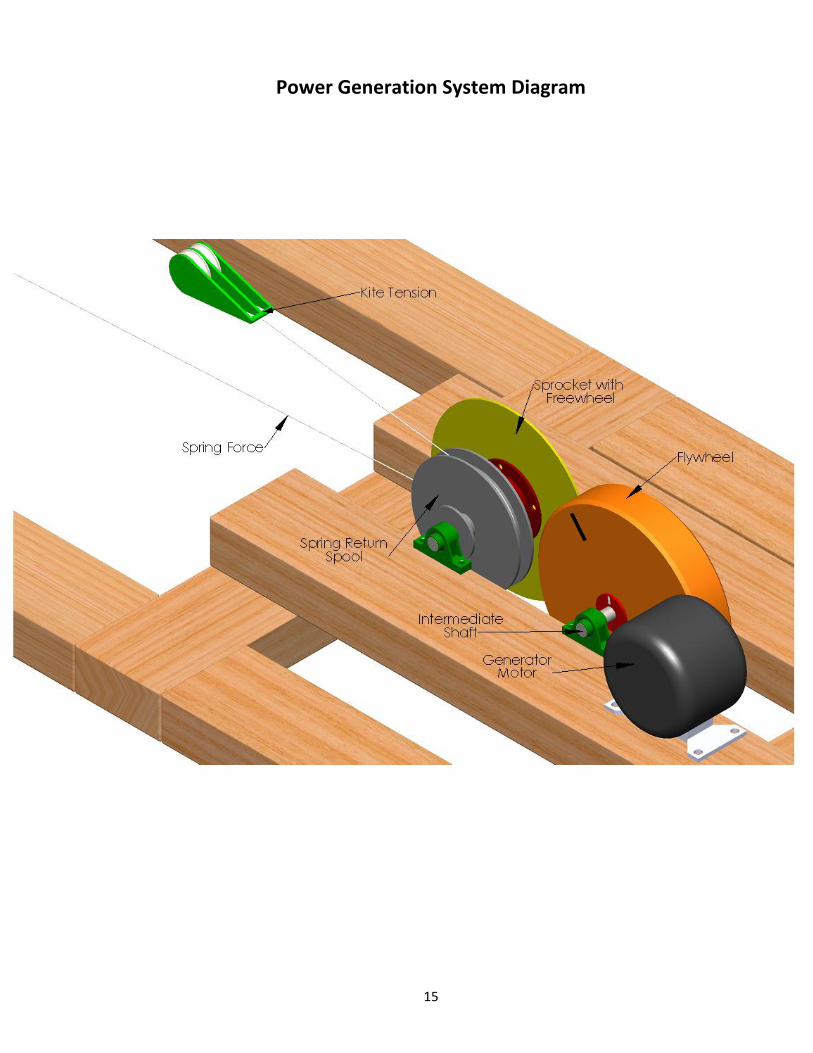
Power Generation System Diagram
15
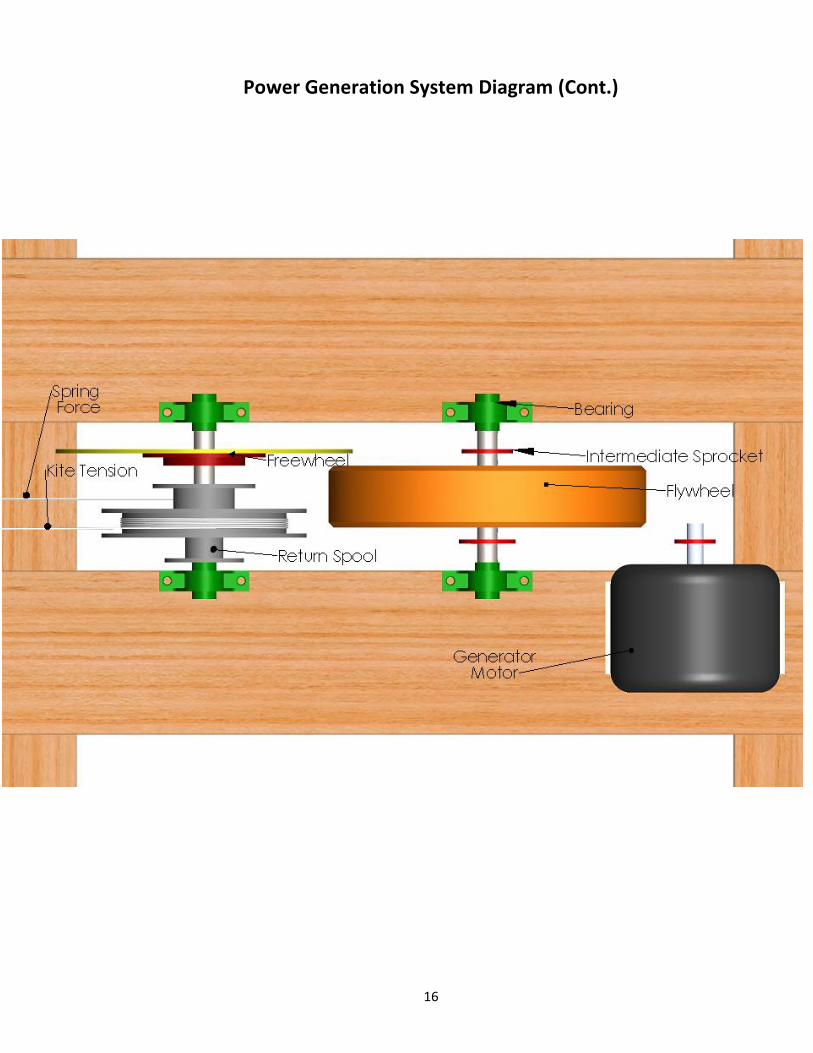
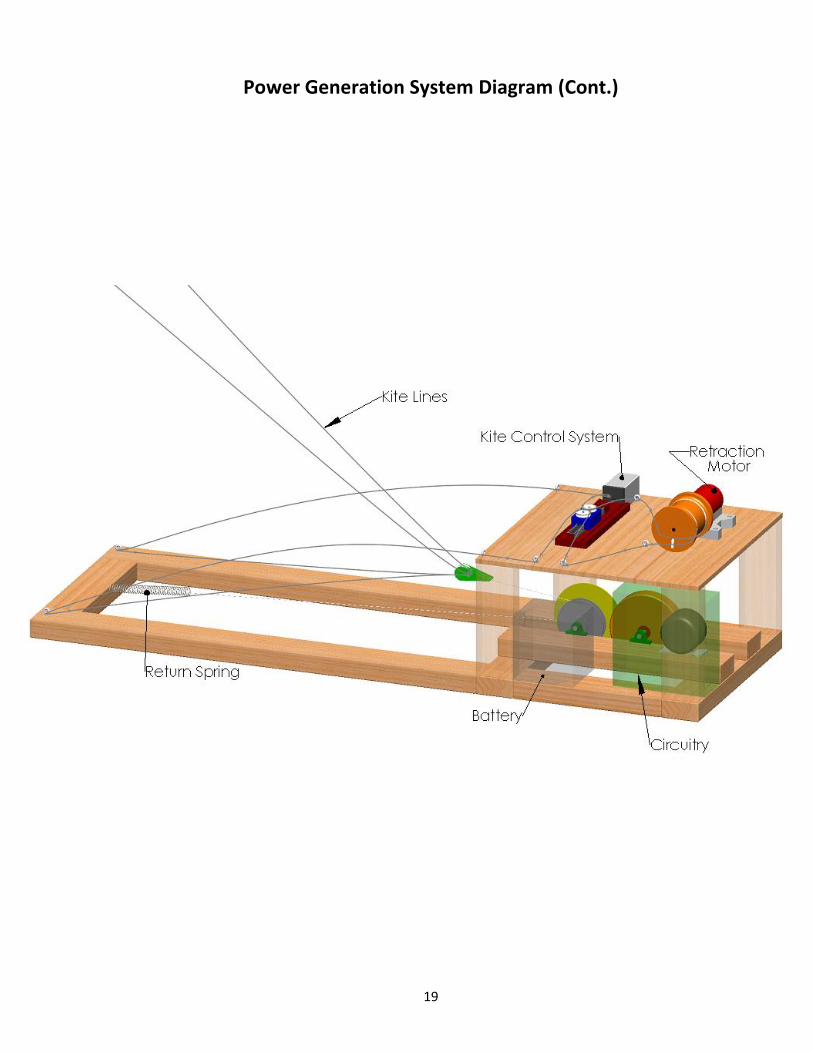
Power Generation System Diagram (Cont.)
16
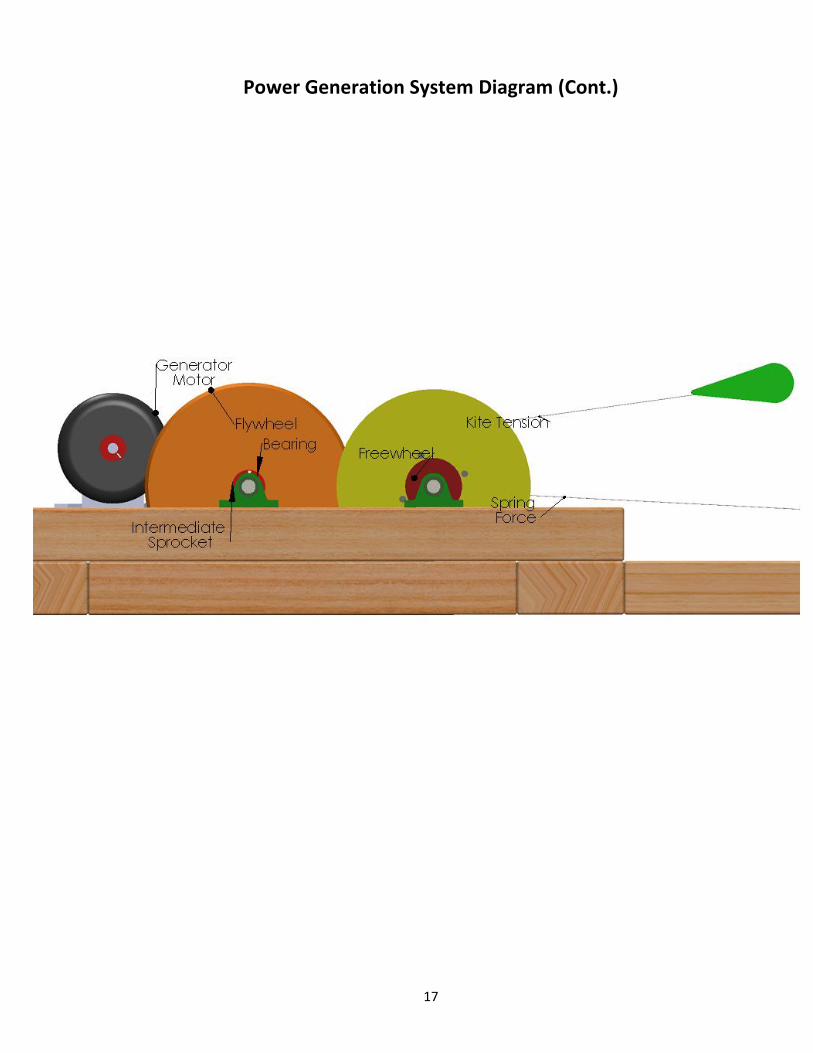
Power Generation System Diagram (Cont.)
17
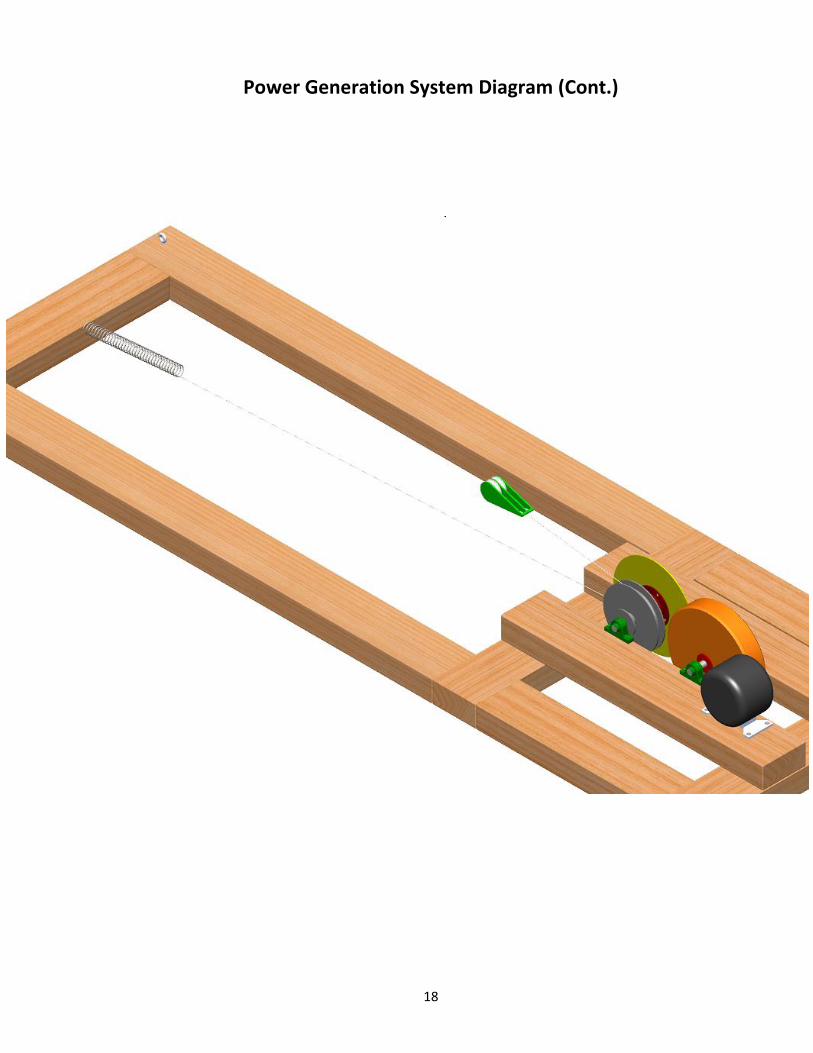
Power Generation System Diagram (Cont.)
18
Power Generation System Diagram (Cont.)
19

Charge Controller Design
Development of a proper charge controller for our application required the consideration of many different factors. This begins with the motor that is generating our power. We have a 24V, 350W DC motor as our generator. This means the charge controller needs to be able to handle high voltage (up to 24V) and high current inputs (up to 14A). It then needs to regulate those high inputs into a manageable power source to charge a battery. The battery chosen is a 12V 26Ah lead acid battery. This battery will allow a capacity of 312 watt hours. The entire system needs to prove it can generate 500 watt hours within a ten hour period. Since storing all of this energy to the battery is not possible, the current and voltage generated will be monitored over that time to compute the average energy production.
Since constant current and voltage generation measurements need to be taken to output the instantaneous power generation to an LCD screen, sensors that were rated to handle a high power input needed to be acquired. Some possible sensors looked into were current monitor ICs using high side current shunt and a simple Hall Effect current sensor (uses the electrical fields produced by the current to produce potential). Most current monitor ICs are rated for very low currents therefore they were irrelevant to the application of the project. The Hall Effect sensors seemed promising, but it would have been a lot of extra design work to create the current sensor circuit which would be outside our time constraints. Both the current and voltage ICs were found from a company called Phidgets which provides prebuilt circuits rated high enough to handle our power and still stay within our budget.
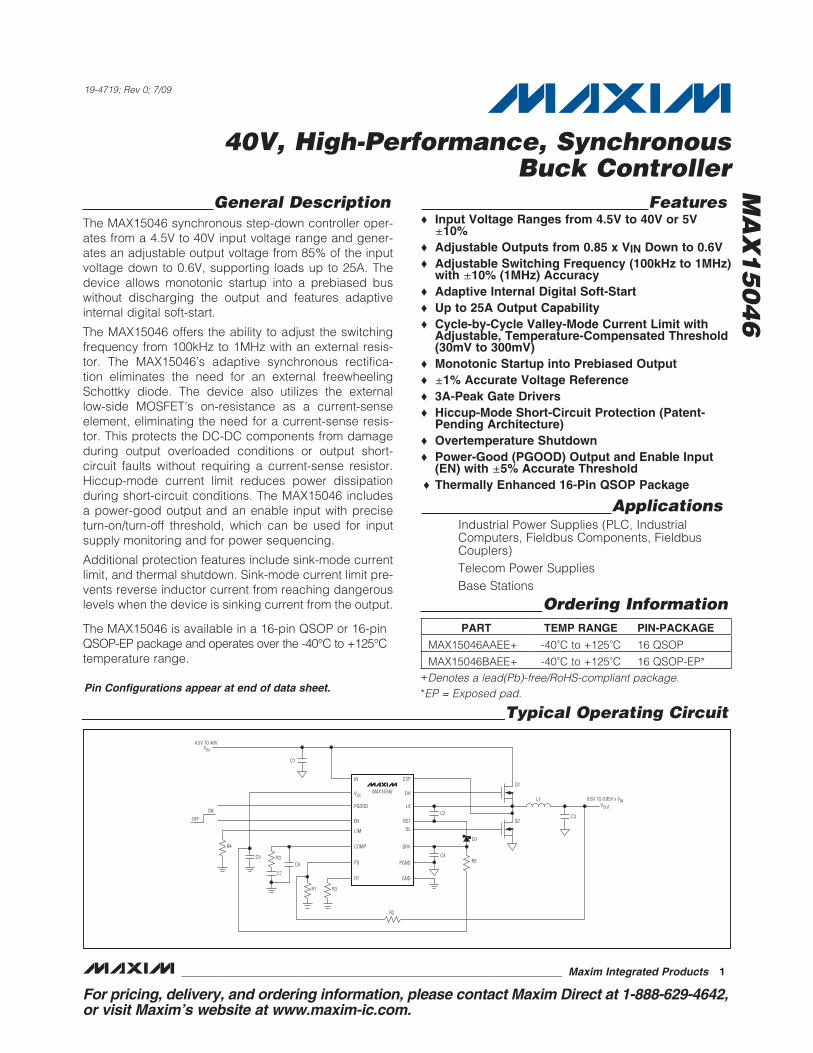
Once a way to monitor power was discovered, the next roadblock was voltage and current regulation. The Maxim MAX15046 is a 40V, high‐performance, synchronous Buck controller. This chip (while it is complex) provided the exact regulation needed all for less than five dollars per IC. This IC accepts an input voltage from 4.5V to 40V and outputs a fixed voltage that can be configured between the range of .6V to 85% of Vin. It also provides up to a 25A output capability. This will allow stable voltage to be provided to the battery. In parallel with the battery there is a Zener diode to act as overcharge protection. After the battery, the sources run into other regulators that will provide ample voltage to the motors, microprocessor, and other IC chips.
Current Monitor Decision
Criteria Weights Phidgets 30A Current Monitor Allegro ACS712 TI INA219 Hall Effect Current Monitor
Effectiveness 0.4 9 8 3 7
Practicality 0.2 9 5 3 5
Time 0.25 7 2 1 1
Cost 0.15 5 9 7 8
TOTALS 1 7.9 6.05 3.1 5.25
Table 8 ‐ current monitor mechanism decision matrix
20
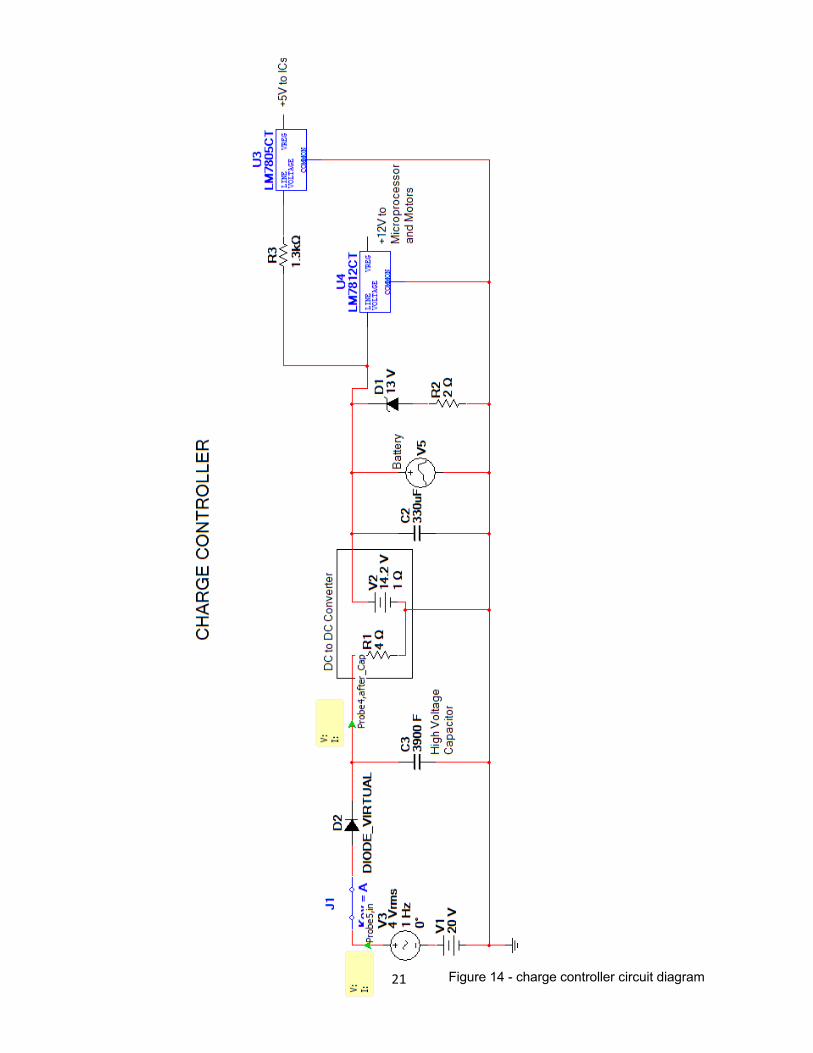
21 Figure 14 - charge controller circuit diagram

DC‐DC Converter
As afore stated, the Maxim MAX15046 is a 40V, high‐performance, synchronous Buck controller is the switching regulator chosen as a part of the charge controller design. This chip (while it is complex) provided the exact regulation needed all for less than five dollars per IC. This IC accepts an input voltage from 4.5V to 40V and outputs a fixed voltage that can be configured between the range of .6V to 85% of Vin. It also provides up to a 25A output capability. This will allow stable voltage to be provided to the battery.
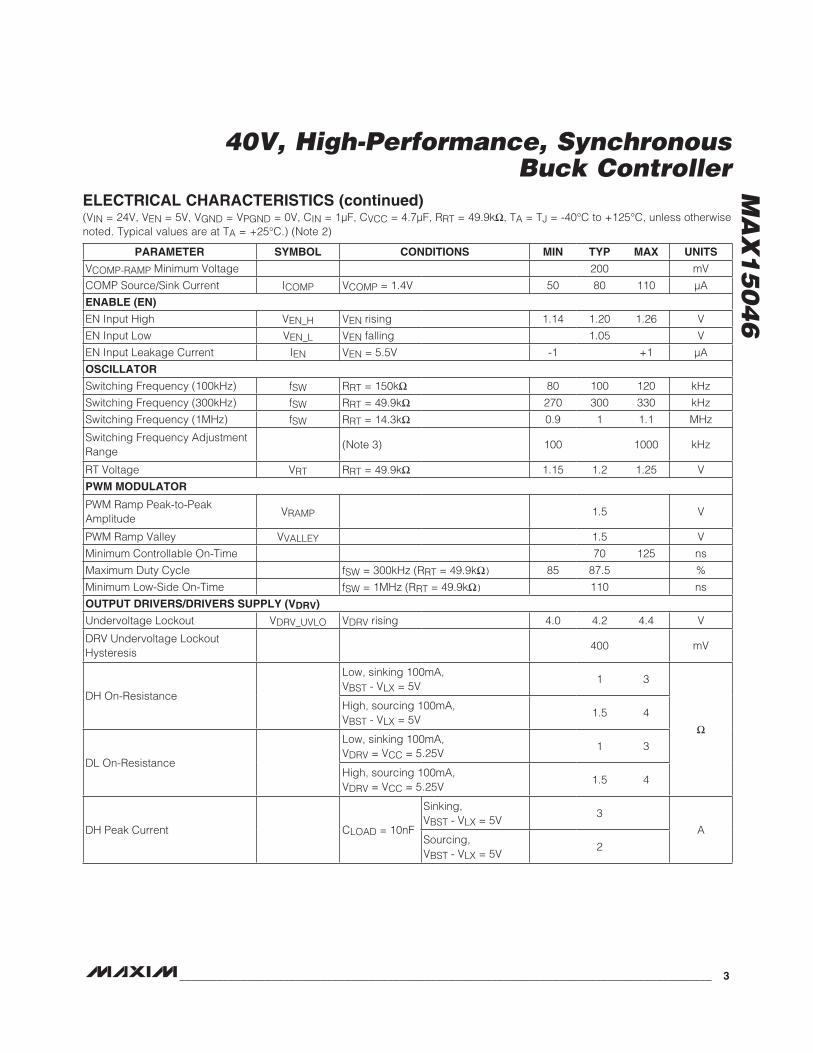
The MAX15046 is excellent for the specifications it needs to meet for the project however it requires a lot of external circuitry and can’t be modeled easily is MultiSim. The MAX15046 is a pulse width modulated controller which uses a frequency to step down the voltage from the input. Despite not being able to be easily simulated, the MAX15046 comes with exact specifications how to calculate the values of the external components. Beginning on Appendix A7, the equations for the external components can be found. These equations are given to find the effective input‐voltage range, set the output voltage, set the switching frequency, determine the inductor used, set the valley current limit, and determine the input and output capacitors.
22
23
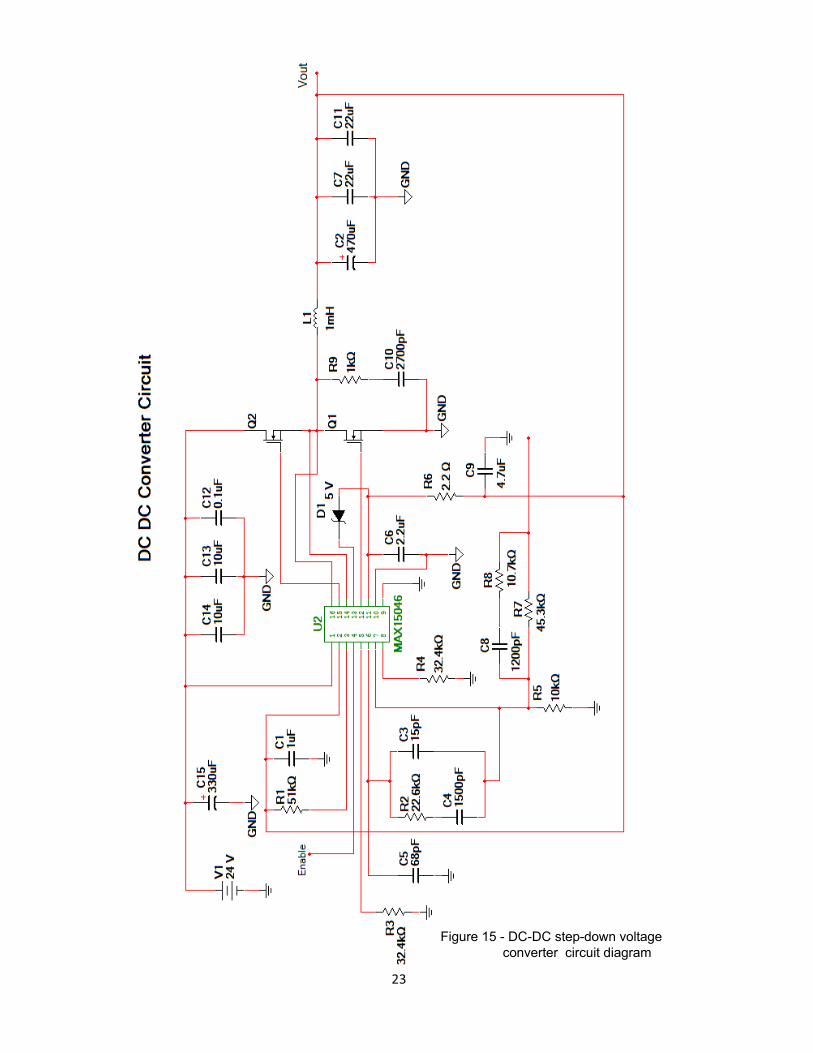
Figure 15 - DC-DC step-down voltage converter circuit diagram
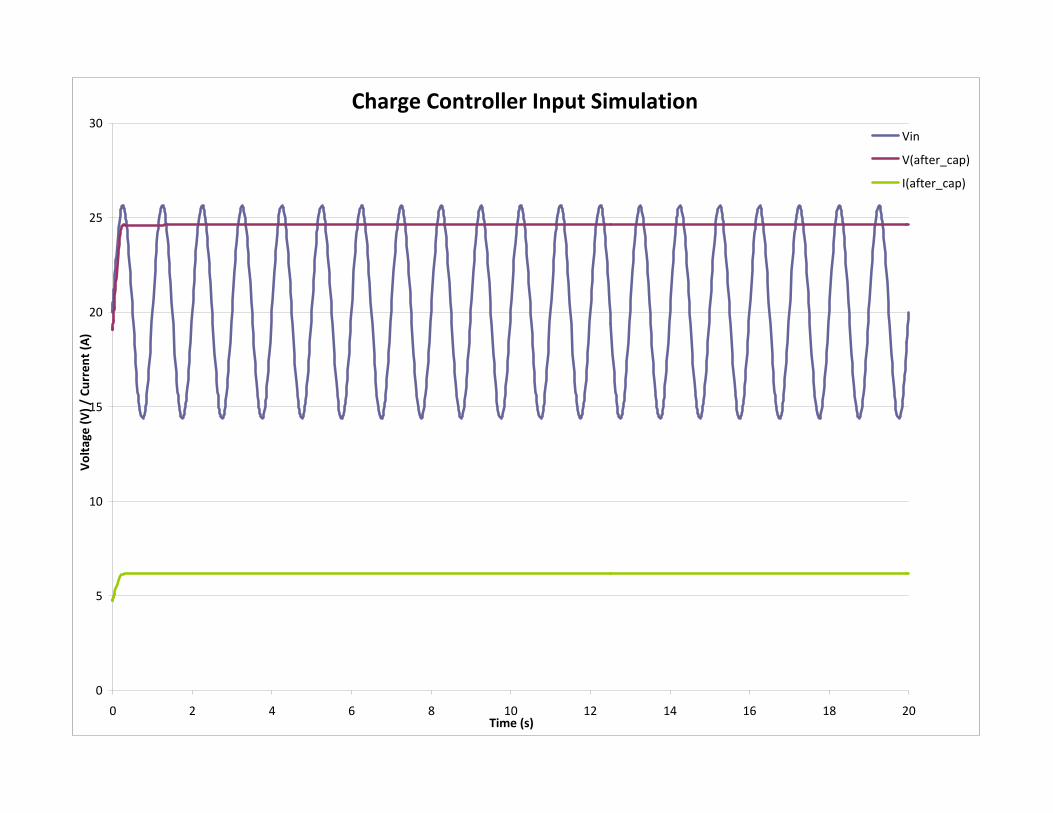
Charge Controller Input Simulation
0
5
10
15
20
25
30
0 2 4 6 8 10 12 14 16 18 20Time (s)
Voltage
(V) /
Current (A
)
Vin
V(after_cap)
I(after_cap)

25
Microprocessor Design
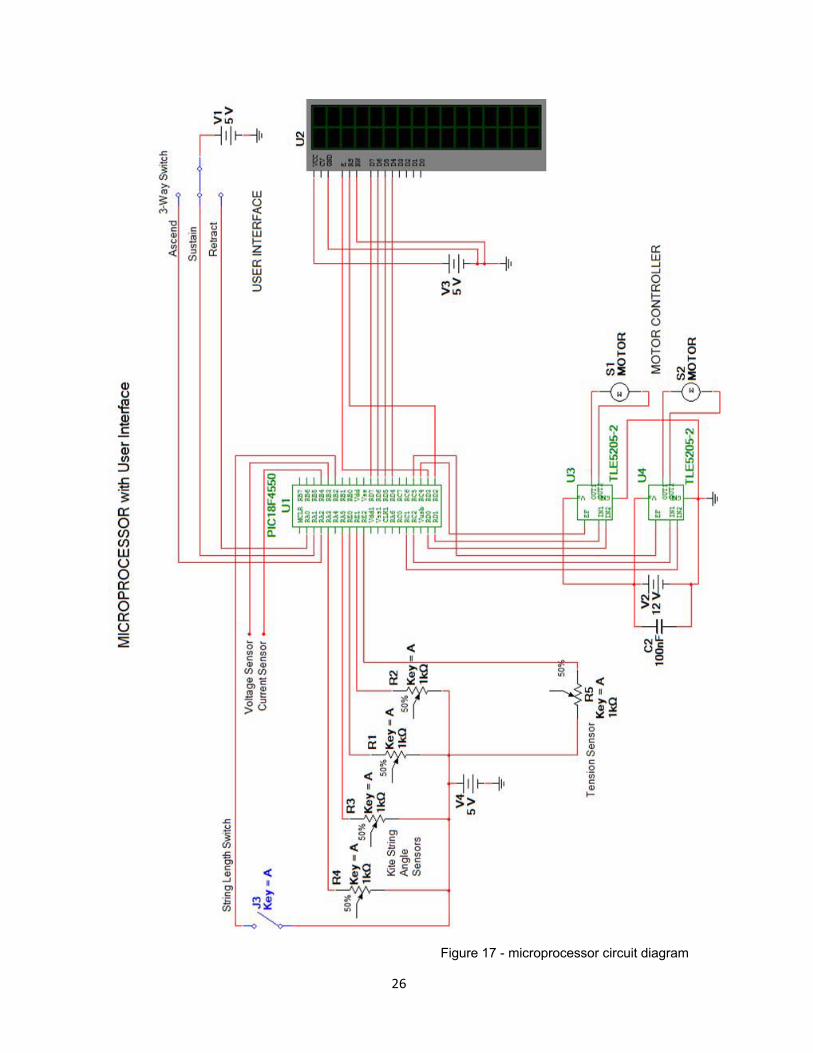
The microprocessor needs to be chosen based upon what inputs and outputs it needs to have for the current project. After the kite system conceptualization, ideas of what is needed in a microprocessor are formed. The need to monitor the current and voltage to calculate the power is first understood. There is also need for an input to measure the length of string released as well as a need for four inputs to measure the kite string angles to determine the kite’s relative position in the air. Finally, a tension sensor input is necessary to be able to scale calculations up or down depending on wind speed. All of these inputs require at least 8 A/D Inputs. A/D inputs will also be needed for the three way user mode switch on the user interface. This switch allows the user to let the kite ascend, retract, or sustain. The other portion of the user interface is the LCD screen which will output the length of line released and the instantaneous power generation measured. The LCD screen will require five I/O ports on the microprocessor. The last feature the microprocessor needs is a pulse width modulation system to control the two motors.
Another important consideration taken with the microprocessor is time. Development time is a significant factor in building the electrical system. This led to the need for a development board. A development board allows the programmer to easily write software for the microprocessor and upload it without having the hassle of a using a microchip programmer and designing a PCB board for the microprocessor. The only downfall is the expense that arises with development boards. If a single microprocessor was purchased it would cost $4‐6. The development board cost close to $50. This cost was worth the time that would have been lost if a standalone microprocessor was purchased. To view the trade‐off decision matrix for microprocessor selection, see table 8.
All of these considerations led to the Microchip PIC18F4550 Development Board from Futerlec.com. This is a development board within budget that meets all the criteria needed for inputs and outputs, and it even allocates some extra features.
All of the sensors will have to be checked on a constant basis and be locked in a continuous loop to keep the kite in flight. The only exceptions will be user‐mode changes from the user interface. This switch will trigger interrupts in the microprocessor and alter the flow of the program which will resume once the interrupt is completed. In figure 17, the string length switch is represented as a simple switch. This will be a ticker switch which will click each time the reel spool rotates. In figure 17, there are also four potentiometers used to represent the kite angle sensors. As the resistance of these changes, the input voltage will change telling the microprocessor the angle change of the string. There are two angle sensors for each string, one for vertical angle and one for horizontal angle. Another potentiometer for the tension sensor is used in figure 17. This is a resistor that varies with the pressure placed on it and will be used to find the tension in the kite strings. The voltage and current sensors will be inputs that vary from 0‐5 volts. These sensors will take a reading on the voltage and current generated by the generator motor and convert that reading to a 0‐5 volt signal. The user interface contains a simple three way switch that will allow the user to select between three modes. The LCD screen will utilize six input/output pins of the microprocessor. The motor controls will utilize six input/output pins as well.
Microprocessor Decision
Criteria Weights MicroChip STARTER DEMO
BOARD KIT Futurlec MicroChip Development
Board Individual MicroChip
PIC18F4550
Effectiveness 0.4 9 9 8
Practicality 0.2 8 9 7
Time 0.25 8 9 1
Cost 0.15 1 3 9
TOTALS 1 7.35 8.1 6.2
Table 8 ‐ microprocessor selection matrix
26
Figure 17 - microprocessor circuit diagram

Software Design
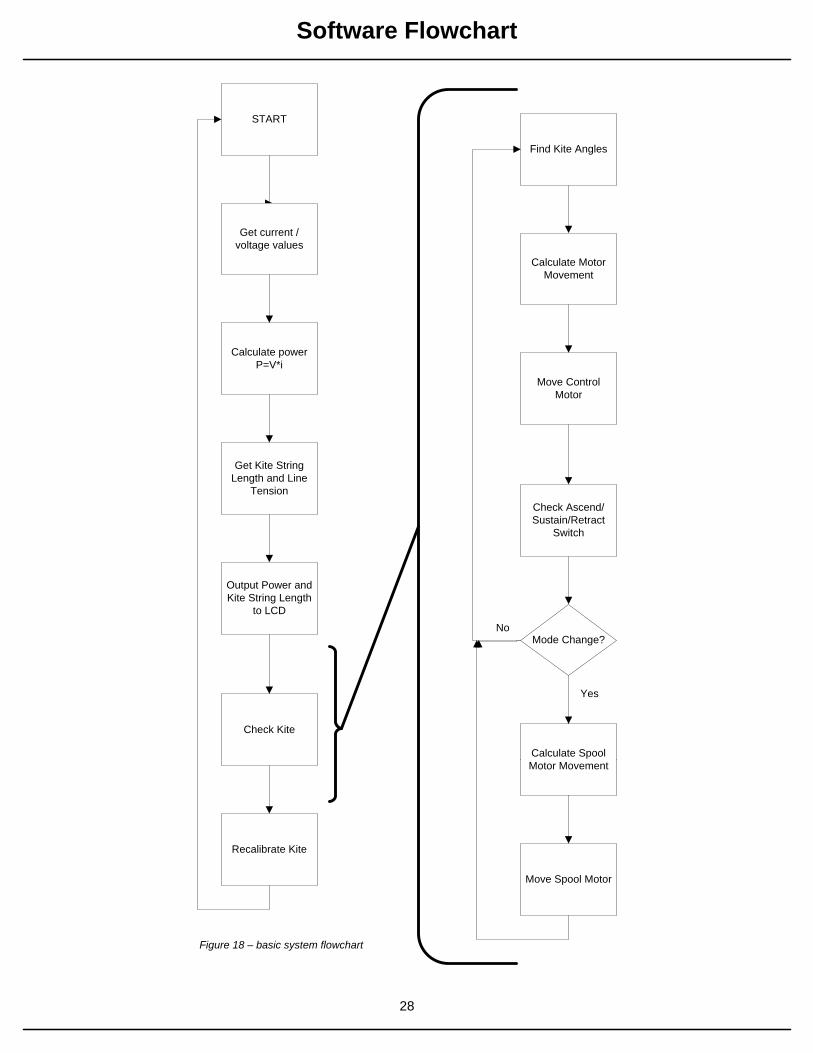
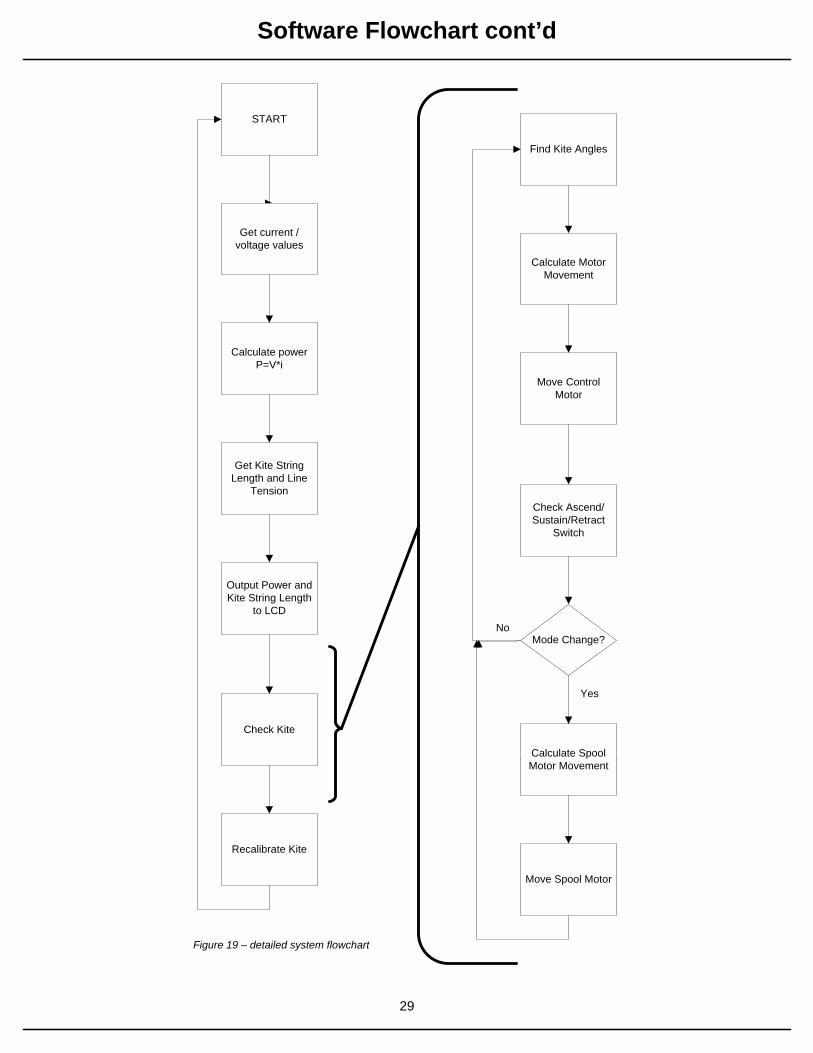
The actual flow of the software is currently becoming more detailed in development. The kite flight test data is still currently being turned into a mathematical model that can easily be manipulated for software applications. All of the sensors will have to be checked on a constant basis and be locked in a continuous loop to keep the kite in flight. The only exceptions will be user‐mode changes from the user interface. This switch will trigger interrupts in the microprocessor and alter the flow of the program which will resume once the interrupt is completed. The software system will begin by reading the input A/D ports from the voltage and current sensors to monitor the power generated. It will then calculate the power with an equation programmed into memory. This number will then be stored to memory. The program will then reading the input switch sensor for the kite string and line tension using A/D inputs. These values will then be stored to memory as well. The kite string length and generate power will then be taken out of memory and be translated to allow it to be exported to the LCD screen. The export to the screen will then take place. Once the LCD screen has been updated, the software will begin the check kite algorithm. The software will first read in the values of the kite angle potentiometers and calculate the kite string angles. These angles will then be compared with the kite flight algorithms to determine the next move. These movements will then be applied to the control motors to control the kite. The user three way switch is then checked to see if the kite needs to be retracted or ascended. If it needs to change, an output to the spool motor will be applied. This whole process is then repeated.
27
START
Check Kite
Recalibrate Kite
28
Software Flowchart
Get current / voltage values
Calculate powerP=V*i
Get Kite String Length and Line
Tension
Output Power and Kite String Length
to LCD
Find Kite Angles
Calculate Motor Movement
Check Ascend/Sustain/Retract
Switch
Mode Change?
Calculate Spool Motor Movement
Move Spool Motor
Move Control Motor
Yes
No
Figure 18 – basic system flowchart
START
Check Kite
Recalibrate Kite
29
Software Flowchart cont’d
Get current / voltage values
Calculate powerP=V*i
Get Kite String Length and Line
Tension
Output Power and Kite String Length
to LCD
Find Kite Angles
Calculate Motor Movement
Check Ascend/Sustain/Retract
Switch
Mode Change?
Calculate Spool Motor Movement
Move Spool Motor
Move Control Motor
Yes
No
Figure 19 – detailed system flowchart

Motor Controller
Choosing a motor controller configuration is highly dependent upon the types of motors being used. Two different motors need to be chosen for the current project. One motor, the reel motor, will control the spool that allows the kite to ascend, sustain, or retract. The other motor will adjust the kite controls according to the kite control algorithms. The motor chosen for the reel is a typical 12V DC motor, and the control motor is a 1.76V 2A stepper motor that changes at .8 per degree change.
The reel motor will be controlled by an Infineon TLE5205‐2 motor controller chip. This chip is a 5A output H‐bridge made for DC motor management applications. This chip will accept PWM signals from the microprocessor and will turn the motors on and off based upon the inputs received which are set in the programming of the microprocessor. The motors will not need to vary in speed, only in direction, so only the duration the motor is on will need to be adjusted by the software of the microprocessor.
Table 9 – function truth table of TLE205‐2
The control motor can be controller with inputs and outputs from the microprocessor. A set of binary codes are programmed and repeatedly sent to the motor to allow it to move to exact specification. A stepper motor is good for the current application because it allows the system to know exactly how far the controls are moving.
30

Electrical Components LCD16x2‐ 16 x 2 Character LCD Display – futurlec.com
Figure 20 – 16x2 lcd display Features 16 Characters x 2 Lines 5 x 7 Dots with Cursor Built in Controller +5v Power Supply (Also Available for +3V) 1/16 Duty Circle
Phidget 30 AMP Current Sensor AC&DC – trossenrobotics.com
Figure 21 – 30A current sensor The formula to translate SensorValue into Current is: DC Amps = (SensorValue / 13.2) ‐ 37.8787 AC RMS Amps = SensorValue x 0.04204
Device Specifications Characteristic Value Active Current Consumption 10mA Output Impedance 1K ohms Maximum Measurable AC Current 30A Maximum Measurable DC Current ±30A Maximum Measurable AC Frequency 10kHz Current Conductor Resistance 1.5mΩ Maximum Supply Voltage 5.5VDC Minimum Supply Voltage 4.5VDC Terminal Block Recommended Wire Size 10 ‐ 26 AWG Wire Stripping Length 6‐7mm Total Output Error 1 ±5% Max between ‐40°C to +85°C Total Output Error (Typical) ±1.5% @ 25°C
31

32
Battery Decision
A large portion of the design decision was reliant upon the battery. The system in creation not only needs to generate power but store it. The chemistry of the battery chosen needs to be looked at closely to make sure it can handle the ruggedness of such a high power system. Since it needs to be a battery that can be recharged, the most likely possible battery chemistries for this system include NiMH, lithium‐ion, and lead acid. After analyzing these battery types, a few conclusions can be drawn. NiMH batteries are too small in capacity and are rated at a current too small for the current project. Lithium‐Ion batteries would possibly work for the current project but are extremely expensive and would be way out of the budget. The last choice is lead acid which applies satisfactorily to this project. Lead acid batteries are rugged and can handle large voltages and currents. Lead acid batteries (even those rated into the dozens of amp‐hours) are moderately affordable. The only disadvantage to lead acid batteries is that a deep discharge can cause an extreme memory loss. The battery chosen is a 12V 26Ah sealed lead acid battery and was purchased for around $50.00. Access SLAA1224F Battery is rated at 12Volts, 26Ah rating. The Access SLAA1224F Battery from AtBatt.com deliver power when you need it and where you need it. It has been specially designed to meet the power needs of your Access SLAA1224F and is maintenance free, easy to handle, rugged and economical. It has a characteristic of high discharge rate, wide operating temperature, long service life and deep discharge recover.
Amstron 12 volt 26Ah valve regulated sealed lead acid batteries are maintenance free, rugged and economical. Amstron SLA batteries are utilized in a wide variety of applications including electric vehicles, wheelchairs, scooters, UPS backups, computer systems, industrial and medical equipment and more. Delivering power when you need it, the AP‐12260R uses a state of the art, heavy‐duty, calcium‐alloy grid that provides exceptional performance and service life in both float and cyclic applications. • Absorbent Glass Mat (AGM) technology for superior performance • Valve regulated, spill proof construction allows safe operation in any position • High energy density • Approved for transport by air. • UL recognized under file number MH47341
Specifications
Chemistry Lead Acid
Voltage 12
Capacity 26,000 mAh / 26 Ah
Rating 312 Whr
Connector R Terminal
Length 6.54 inch / 16.61 cm
Width 6.89 inch / 17.50 cm
Height 4.92 inch / 12.50 cm
Color Gray
Weight 18.08 lb / 8,200.91 g
Warranty 1 Year
UPC Code 880487220654
Figure 22 ‐ Amstron 12V / 26Ah Sealed Lead Acid Battery w/ R Terminal

33
Electronically Assisted Design:
Power from the wind is harnessed from the drag force and movement of the kite parallel to the kite strings through the power generation system. A kite flight pattern that allows the wind to produce this force and movement, thereby transferring power, is necessary. It is also important that this power is delivered in a repeatable method. From the equation for the drag force parallel to the kite strings (equation 1) we see that the force is a function of how much of the kite area is perpendicular to the wind. This renders the power zone as shown is figure 23b where the area, hence forces, are greatest. A kite flying repeatedly in and out of the power zone would produce a figure eight path, such as is shown in figure 23a This path delivers alternating in and out movements that pull the freewheel to generate electricity and then allow the freewheel to be retracted in preparation for another generation pull.
To produce this power generating flight path software, sensors, and electromechanical means will be used. The kite controls sensors will send analog tension sensor and spherical position signals to the microprocessor. The electromechanical controls physically control the kite flight through manipulation of the kite string lengths.
FD = ½ ρV2CLAK
Where CD is the drag coefficient equal to about 1.2, AK is the kite area 2m2, ρ is the density of air at 1.2kg/m2, and V is the wind speed.
Controls Sensors Design:
The sensory requirements for autonomous control of the Second Wind system stand on three legs. First the location of kite must be sensed, second the velocity vector of the kite must be sensed, and finally a desired location or path of the kite must be predetermined. The effects of wind speed are discussed below.
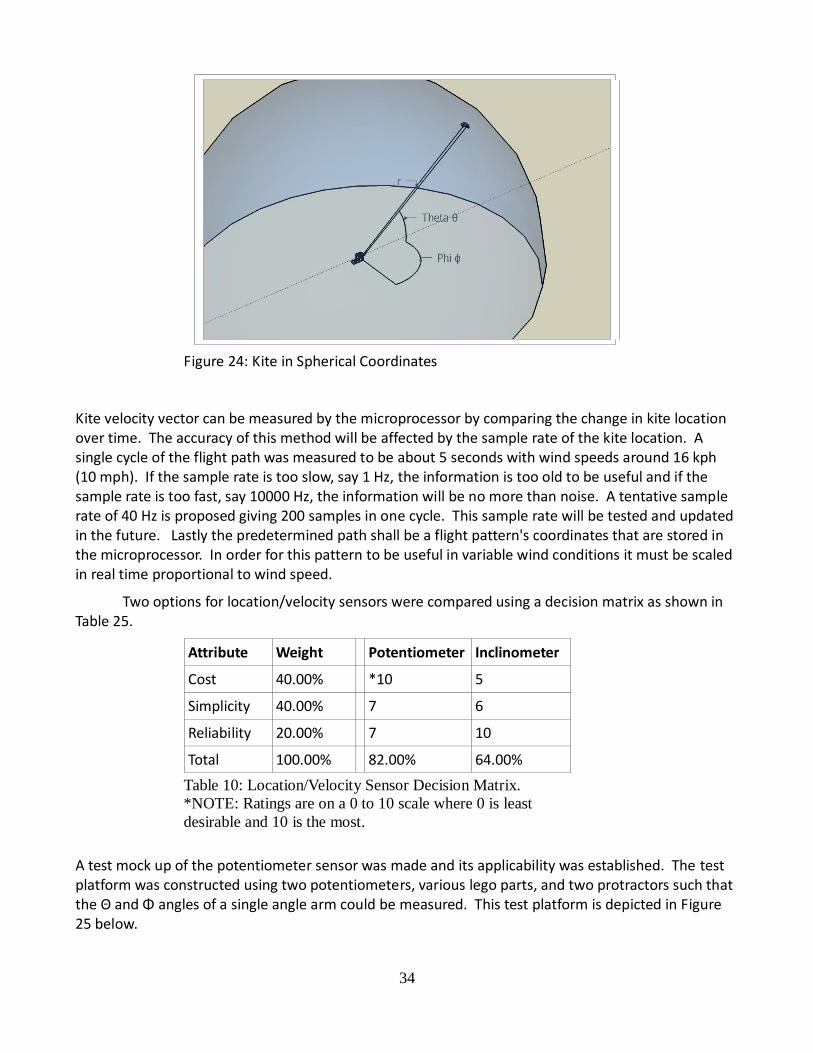
The kite's location can be conveniently measured in spherical coordinates using the kite string length for the radius r and sensors attached to the kite strings to sense angles φ and θ, as depicted in figure 24, thus giving the kite's location in spherical coordinates.
Figure 23a: Sample Flight Path in 3D Figure 23b: Power Zone
34
Kite velocity vector can be measured by the microprocessor by comparing the change in kite location over time. The accuracy of this method will be affected by the sample rate of the kite location. A single cycle of the flight path was measured to be about 5 seconds with wind speeds around 16 kph (10 mph). If the sample rate is too slow, say 1 Hz, the information is too old to be useful and if the sample rate is too fast, say 10000 Hz, the information will be no more than noise. A tentative sample rate of 40 Hz is proposed giving 200 samples in one cycle. This sample rate will be tested and updated in the future. Lastly the predetermined path shall be a flight pattern's coordinates that are stored in the microprocessor. In order for this pattern to be useful in variable wind conditions it must be scaled in real time proportional to wind speed.
Two options for location/velocity sensors were compared using a decision matrix as shown in Table 25.
Attribute Weight Potentiometer Inclinometer
Cost 40.00% *10 5
Simplicity 40.00% 7 6
Reliability 20.00% 7 10
Total 100.00% 82.00% 64.00%
A test mock up of the potentiometer sensor was made and its applicability was established. The test platform was constructed using two potentiometers, various lego parts, and two protractors such that the Θ and Φ angles of a single angle arm could be measured. This test platform is depicted in Figure 25 below.
Figure 24: Kite in Spherical Coordinates
Table 10: Location/Velocity Sensor Decision Matrix.
*NOTE: Ratings are on a 0 to 10 scale where 0 is least
desirable and 10 is the most.
35
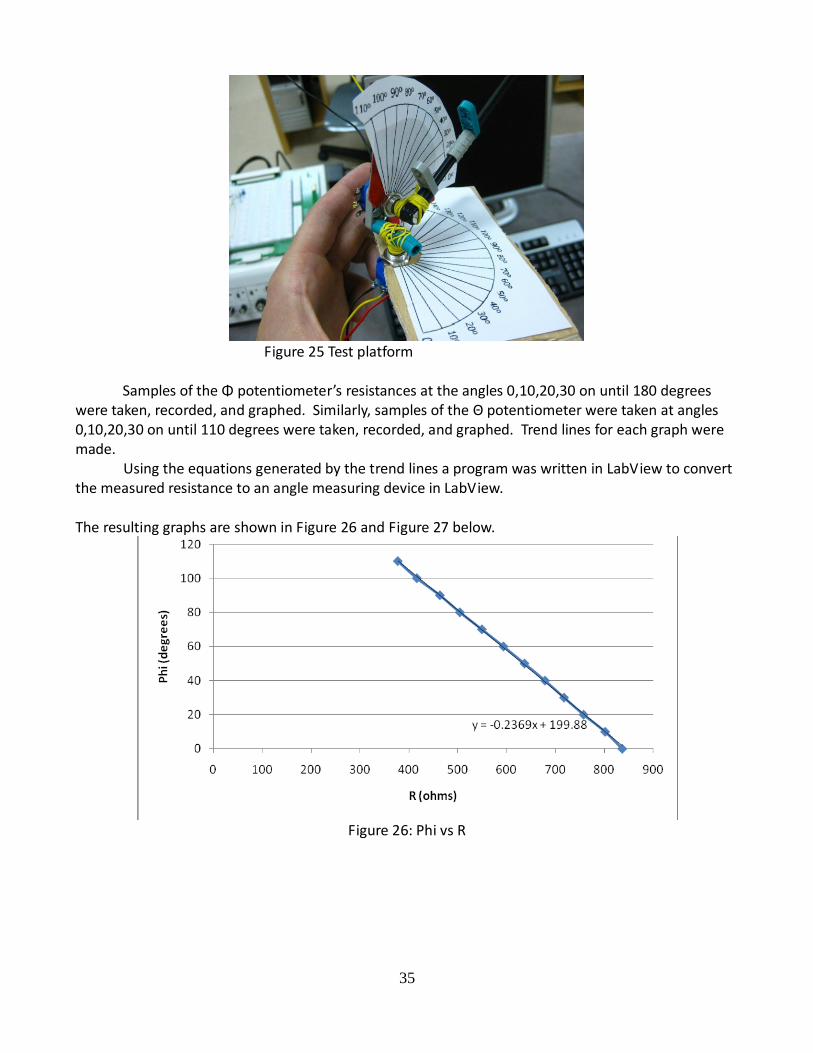
Figure 25 Test platform
Samples of the Φ potentiometer’s resistances at the angles 0,10,20,30 on until 180 degrees were taken, recorded, and graphed. Similarly, samples of the Θ potentiometer were taken at angles 0,10,20,30 on until 110 degrees were taken, recorded, and graphed. Trend lines for each graph were made.
Using the equations generated by the trend lines a program was written in LabView to convert the measured resistance to an angle measuring device in LabView. The resulting graphs are shown in Figure 26 and Figure 27 below.
Figure 26: Phi vs R
36
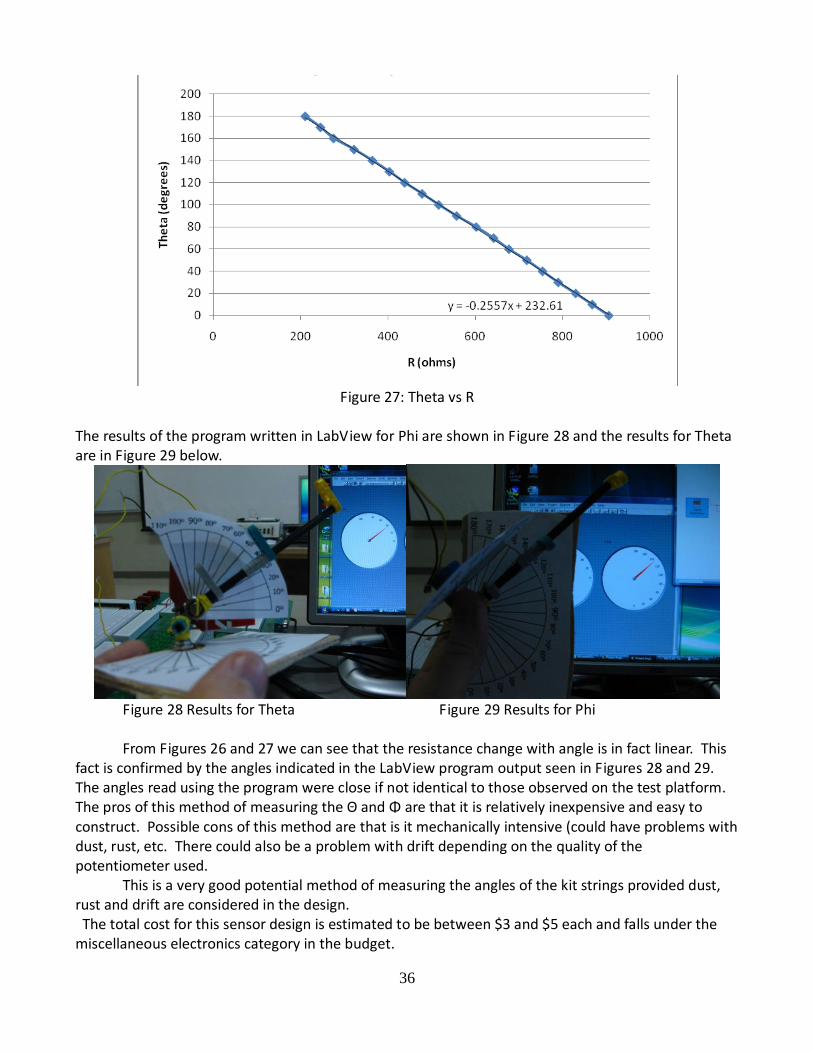
Figure 27: Theta vs R
The results of the program written in LabView for Phi are shown in Figure 28 and the results for Theta are in Figure 29 below.
Figure 28 Results for Theta Figure 29 Results for Phi
From Figures 26 and 27 we can see that the resistance change with angle is in fact linear. This
fact is confirmed by the angles indicated in the LabView program output seen in Figures 28 and 29. The angles read using the program were close if not identical to those observed on the test platform. The pros of this method of measuring the Θ and Φ are that it is relatively inexpensive and easy to construct. Possible cons of this method are that is it mechanically intensive (could have problems with dust, rust, etc. There could also be a problem with drift depending on the quality of the potentiometer used. This is a very good potential method of measuring the angles of the kit strings provided dust, rust and drift are considered in the design. The total cost for this sensor design is estimated to be between $3 and $5 each and falls under the miscellaneous electronics category in the budget.
37
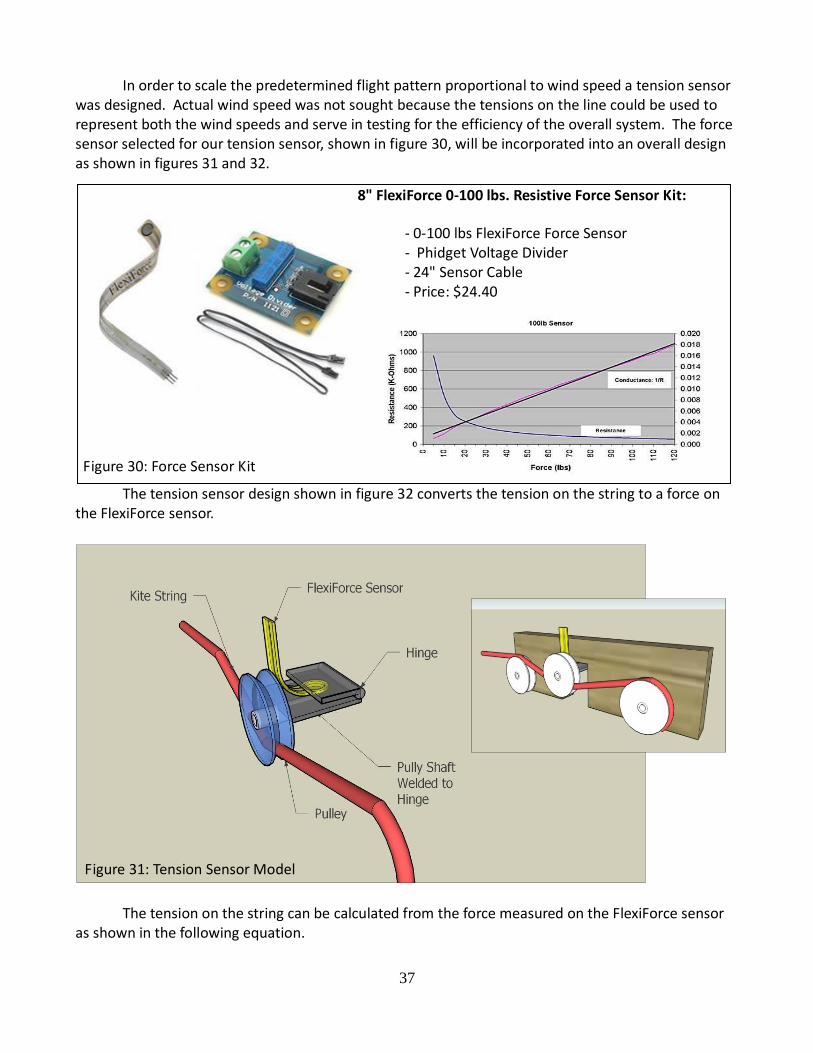
In order to scale the predetermined flight pattern proportional to wind speed a tension sensor was designed. Actual wind speed was not sought because the tensions on the line could be used to represent both the wind speeds and serve in testing for the efficiency of the overall system. The force sensor selected for our tension sensor, shown in figure 30, will be incorporated into an overall design as shown in figures 31 and 32.
The tension sensor design shown in figure 32 converts the tension on the string to a force on the FlexiForce sensor.
The tension on the string can be calculated from the force measured on the FlexiForce sensor as shown in the following equation.
8" FlexiForce 0-100 lbs. Resistive Force Sensor Kit:
- 0-100 lbs FlexiForce Force Sensor - Phidget Voltage Divider - 24" Sensor Cable - Price: $24.40
Figure 30: Force Sensor Kit
Figure 31: Tension Sensor Model
38
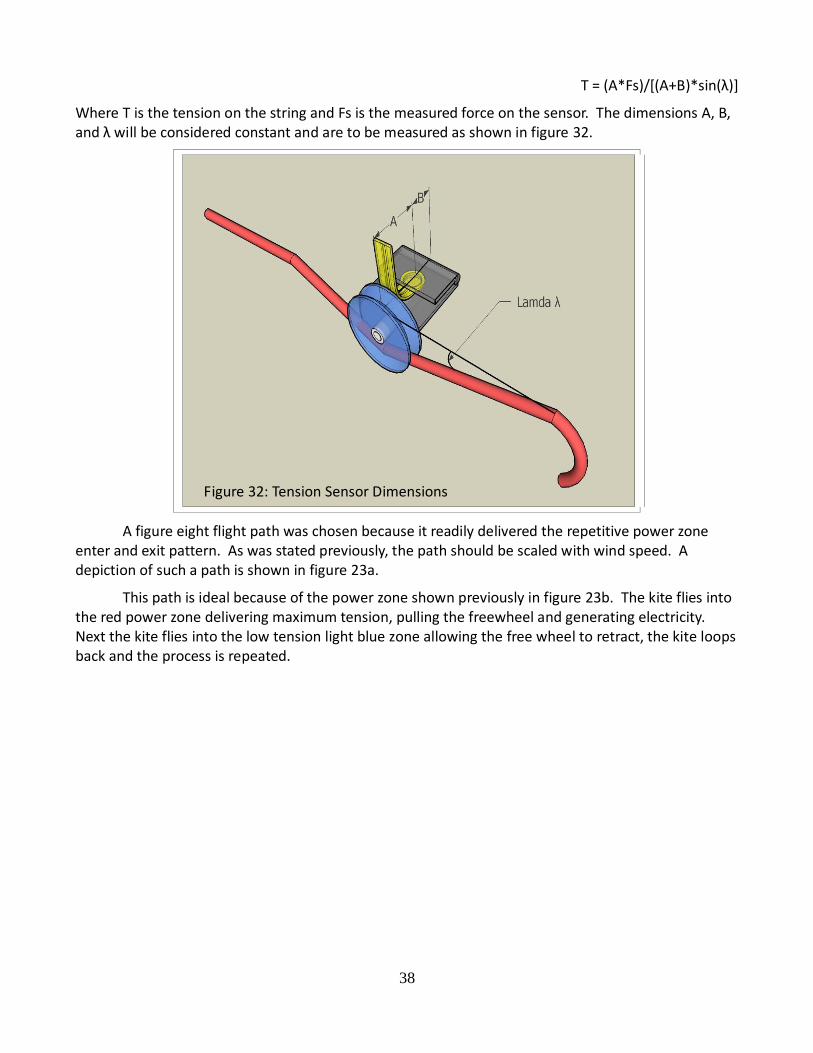
T = (A*Fs)/*(A+B)*sin(λ)+
Where T is the tension on the string and Fs is the measured force on the sensor. The dimensions A, B, and λ will be considered constant and are to be measured as shown in figure 32.
A figure eight flight path was chosen because it readily delivered the repetitive power zone enter and exit pattern. As was stated previously, the path should be scaled with wind speed. A depiction of such a path is shown in figure 23a.
This path is ideal because of the power zone shown previously in figure 23b. The kite flies into the red power zone delivering maximum tension, pulling the freewheel and generating electricity. Next the kite flies into the low tension light blue zone allowing the free wheel to retract, the kite loops back and the process is repeated.
Figure 32: Tension Sensor Dimensions

39
Controls Kite String Manipulator Design:
The kite's flight is manipulated by pulling the right line IN while letting the left line OUT to turn CW and pulling the left line IN while letting the right line OUT to turn CCW. To accomplish this a slider controller is designed such that the linear movement of the slider causes the above mentioned maneuvers. Our designed controller is depicted in figure 33.
The slider controller is depicted from above in figure 34. It can be seen that when theta equals zero the line length Y can be calculated to be equal to twice that of the slider position X. For example, as the slider moves distance X to the right, the right line will bet let out distance 2*X and the left line will be taken in distance 2*X. The converse is true of the slider moving to the left. This effectively
Figure 33: Slider Controller Design
Figure 34: Slider Controller Design From Above
40
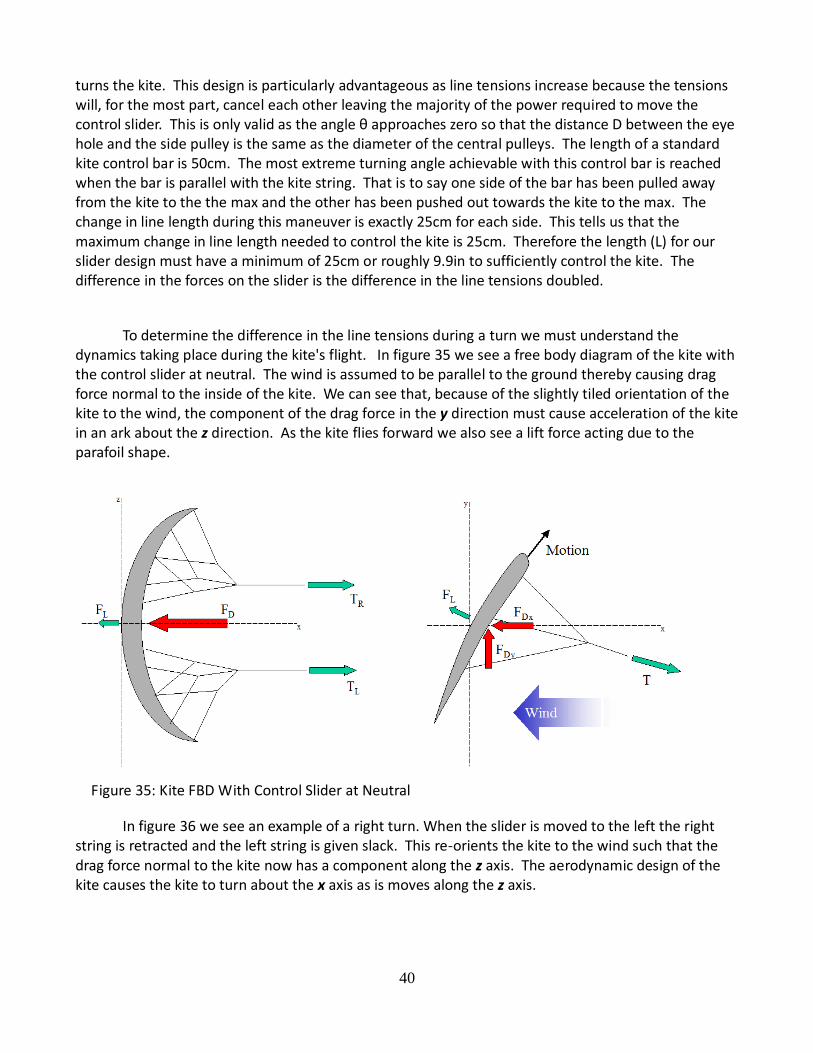
turns the kite. This design is particularly advantageous as line tensions increase because the tensions will, for the most part, cancel each other leaving the majority of the power required to move the control slider. This is only valid as the angle θ approaches zero so that the distance D between the eye hole and the side pulley is the same as the diameter of the central pulleys. The length of a standard kite control bar is 50cm. The most extreme turning angle achievable with this control bar is reached when the bar is parallel with the kite string. That is to say one side of the bar has been pulled away from the kite to the the max and the other has been pushed out towards the kite to the max. The change in line length during this maneuver is exactly 25cm for each side. This tells us that the maximum change in line length needed to control the kite is 25cm. Therefore the length (L) for our slider design must have a minimum of 25cm or roughly 9.9in to sufficiently control the kite. The difference in the forces on the slider is the difference in the line tensions doubled.
To determine the difference in the line tensions during a turn we must understand the dynamics taking place during the kite's flight. In figure 35 we see a free body diagram of the kite with the control slider at neutral. The wind is assumed to be parallel to the ground thereby causing drag force normal to the inside of the kite. We can see that, because of the slightly tiled orientation of the kite to the wind, the component of the drag force in the y direction must cause acceleration of the kite in an ark about the z direction. As the kite flies forward we also see a lift force acting due to the parafoil shape.
In figure 36 we see an example of a right turn. When the slider is moved to the left the right string is retracted and the left string is given slack. This re-orients the kite to the wind such that the drag force normal to the kite now has a component along the z axis. The aerodynamic design of the kite causes the kite to turn about the x axis as is moves along the z axis.
Figure 35: Kite FBD With Control Slider at Neutral

41
If we assume that the drag force and lift force along the x axis are at the center of the kite, that the kite strings are at an equal distance Rcenter
from the center, and that there is no movement in the x direction then we can say from statics that TR and TL are equal and there is no difference in line tension.
ΣMy: TL*Rcenter +TR*Rcenter = 0
Therefore we can say that there will be no holding force needed. The work required to make
the line length change can be calculated as the difference of the work done by the slider to pull one line in and the work done on the slider by the other line going out.
Wtotal = FS*x - TL *x*2
From the free body diagram in figure 37 we can see that
FS - 2*TR - FFriction= Msystem*aslider .
Plugging this into the work equation we get
Wtotal = (2*TR + Ffriction + Msystem*aslider )*x - TL x*2
Assuming TR = TL this can simplify to
Wtotal = (Ffriction + Msystem*aslider )*x
We see that the amount of work done by the slider will primarily be a function of friction in the system and the mass and acceleration of the system. It can be assumed that any slider purchased will already be able to move its own weight. The only other mass in this system is that of the kite and the strings which are negligible. In conclusion; special attention to the frictional losses to be overcome by the controller must be considered in the final selection of small parts that the strings run through such as pulleys and eye holes.
Figure 36: Kite FBD With Right Turn
Figure 37: Slider Controller FBD

42
The current slider design is made of the components shown in figure 38.
A motor was purchased to run this slider. The motor is rated at 1.76V 2A and turns at 0.8 deg per revolution. A cog pulley came with the motor that will mate with the belt drive. This motor coasted $35 with shipping. This slider meets the length requirements of a 9.9 inch travel length.
Kite Retraction System Design:
The purpose of the kite retraction system is to deploy and retract the kite when the user so desires or to retract the kite when wind speed is either too high for safety or too low for flight >50 kph <6 kph.
Two designs were considered, one using a motorized big game fishing reel, and the other using a simple motor and drum set up. A decision matrix was created to help in the decision process and is shown in table 11.
Attribute Weight Fishing Reel Simple Drum
Cost 50.00% *6 10
Simplicity 30.00% 7 10
Consistent Line Intake 20.00% 10 7
Total 100.00% 71.00% 94.00%
As is shown above the decision was made to go with a simple drum. In the design specifications the retraction time is set to be no less than 10 minutes. Using equation 3 it has been
Figure 38: Belt Slider Rail
Belt Slider Rail Truck travel: 13 inches Cost: $45 (including shipping)
Table 11: Kite Retraction Decision Matrix.
*NOTE: Ratings are on a 0 to 10 scale where 0 is least
desirable and 10 is the most.
43
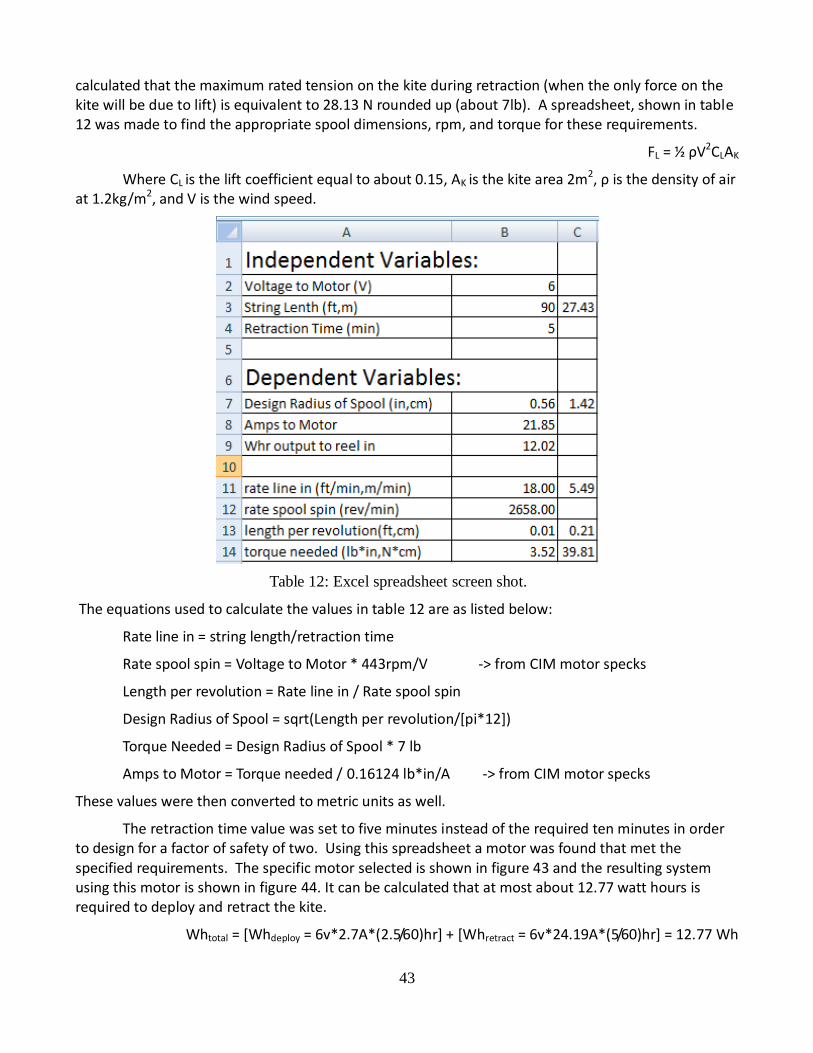
calculated that the maximum rated tension on the kite during retraction (when the only force on the kite will be due to lift) is equivalent to 28.13 N rounded up (about 7lb). A spreadsheet, shown in table 12 was made to find the appropriate spool dimensions, rpm, and torque for these requirements.
FL = ½ ρV2CLAK
Where CL is the lift coefficient equal to about 0.15, AK is the kite area 2m2, ρ is the density of air at 1.2kg/m2, and V is the wind speed.
The equations used to calculate the values in table 12 are as listed below:
Rate line in = string length/retraction time
Rate spool spin = Voltage to Motor * 443rpm/V -> from CIM motor specks
Length per revolution = Rate line in / Rate spool spin
Design Radius of Spool = sqrt(Length per revolution/[pi*12])
Torque Needed = Design Radius of Spool * 7 lb
Amps to Motor = Torque needed / 0.16124 lb*in/A -> from CIM motor specks
These values were then converted to metric units as well.
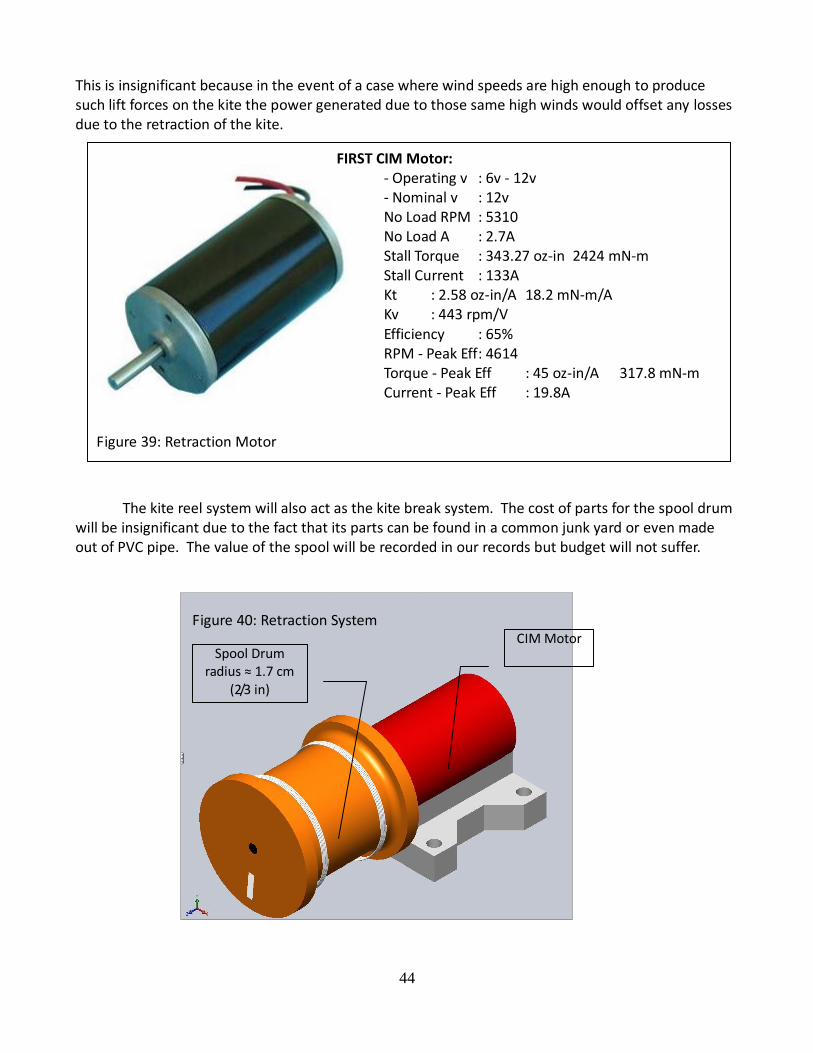
The retraction time value was set to five minutes instead of the required ten minutes in order to design for a factor of safety of two. Using this spreadsheet a motor was found that met the specified requirements. The specific motor selected is shown in figure 43 and the resulting system using this motor is shown in figure 44. It can be calculated that at most about 12.77 watt hours is required to deploy and retract the kite.
Whtotal = [Whdeploy = 6v*2.7A*(2.5/60)hr] + [Whretract = 6v*24.19A*(5/60)hr] = 12.77 Wh
Table 12: Excel spreadsheet screen shot.
44
This is insignificant because in the event of a case where wind speeds are high enough to produce such lift forces on the kite the power generated due to those same high winds would offset any losses due to the retraction of the kite.
The kite reel system will also act as the kite break system. The cost of parts for the spool drum will be insignificant due to the fact that its parts can be found in a common junk yard or even made out of PVC pipe. The value of the spool will be recorded in our records but budget will not suffer.
Spool Drum radius ≈ 1.7 cm
(2/3 in)
CIM Motor
FIRST CIM Motor: - Operating v : 6v - 12v - Nominal v : 12v No Load RPM : 5310 No Load A : 2.7A Stall Torque : 343.27 oz-in 2424 mN-m Stall Current : 133A Kt : 2.58 oz-in/A 18.2 mN-m/A Kv : 443 rpm/V Efficiency : 65% RPM - Peak Eff : 4614 Torque - Peak Eff : 45 oz-in/A 317.8 mN-m Current - Peak Eff : 19.8A
Figure 39: Retraction Motor
Figure 40: Retraction System

45
Budget Analysis
Currently 33.3% of the budget has been used by spending $283.09. A large number of
purchases will be made within the next week so that majority of the required parts for the
system will be purchased. Vendors have been selected for all the parts of the project.
Some of the more expensive items:
Kite
Generator Motor
Development Board
Battery
These are some of the more important items that were required in order to further the
research and development of the project.
The generator motor was expected to be more expensive, so this was an unexpected
saving. The budget previously listed the use of used bicycle parts for items such as sprockets,
chains, and axles. However, the design now calls for the use of sprockets and chains of
different pitch from a bicycle system. However, due to the low cost of the motor, the sprockets
and chains still fit within the budget of the generation system.
The battery design was changed from one that could hold 500 watt hours of energy to
one that can hold just over 300 watt hours of energy. This design change was done in order to
save on the cost of the battery. The system will still be able to show that it can produce 500
watt hours of energy within a ten hour period.
A development board was purchased instead of individual microprocessors to allow for
ease and speed of programming. The change proved more expensive however, the
microprocessor that comes with the development board has free samples that can be obtained.
Another major change to the budget comes from the controls system. It was
determined that the most accurate and effective way to control the kite would be by using a
system similar to that used on computer numerical control (CNC) machines. These slider
controller mechanisms can be purchased on ebay, however they are expensive, and will
therefore be a larger part of our budget.
The updated budget has allocated $91.82 or 10.80% of the total budget as a buffer in
case of unpredicted expenditures in the future. So, as of now the project is still on budget.

Product Vendor Cost Ordered
Kite Kite Wind Surf $131.95 Y
Development Board Futurlec $52.90 Y
Battery atbatt.com $50.33 Y
Generator Motor Monster Scooter Parts $47.91 Y
Nuts/Bolts/Wood Lowes $50.00
Sprockets/Chains/Axle Electric Scooter Parts $104.87 Y
Axle Lowes $5.71
Springs W.B. Jones Spring Co. $36.00 Y
Bearings VXB.com $28.43 Y
Circuit Boards 4pcb $50.00
Controls System ebay.com $80.00 Y
Retraction Motor Trossen Robotics $32.00 Y
Sensors Trossen Robotics $78.62 Y
Electrical Components allelectronics.com $25.00
Miscellaneous $76.28
TOTAL $850.00
Amount Spent $643.01
80% of Budgeted Items $618.98
Figure 41
47
Updated Budget

Schedule Analysis
Having a retrospective look at our semester has given us essential insight for the remainder of our project’s development. After the completion of our Requirements Specification our project was well under way. Research began to become more intensive and creativity was vital. As we continued to meet deadlines, our first accomplishment was the successful delivery of our Stage/Gate Presentation as well as the completion of our Final System Overview and Project Plan. Once this was completed, deadlines became more reliant upon the timeframes our own group established. We are persisting through the final steps in the design process.
Hands‐on models, circuit simulations and schematics, 3‐D Solidworks models and analyses, and overall systems analyses have been completed. Analyses of Solidworks models and circuit diagrams have taken place in order to justify our design choices. There are currently still finalizations being made to a few subsystems but this should not cause many future delays. These finalizations begin with the kite control algorithms. A little behind schedule, the algorithms are still being modeled in a way that is applicable for software development. This should be finished by the end of the semester but can be finished during the first week of Christmas break if needed. A final decision on the control motor also still needs to be made. The limitations in variety, voltage/current necessities, and funds are making this a difficult search, but it will be decided and ordered by the end of the fall semester. This decision is slightly delaying the design for the motor controller since motor specifications for the control motor are not yet available, only assumptions can be made. Thankfully, the motor controller configuration is simplistic and will be quick and easy to implement (less than a week) once a motor decision is made. This final motor controller design implementation may need to take place over Christmas break, but the spring semester will not be delayed. More research is also being done in the use of the microprocessor in order to begin programming. The microprocessor wasn’t received until December 8, 2009, so strides toward being able to program are well under way. More microprocessor self‐education and programming will take place over Christmas break and will allow the spring semester to run smoothly from a software standpoint. Any delays are only minor design decisions that can be decided before the spring semester. Parts selection is still taking place, however all parts will be ordered before Christmas break and are expected to arrive by January 11. Final analyses and simulations are being completed for use in the final presentation.
48
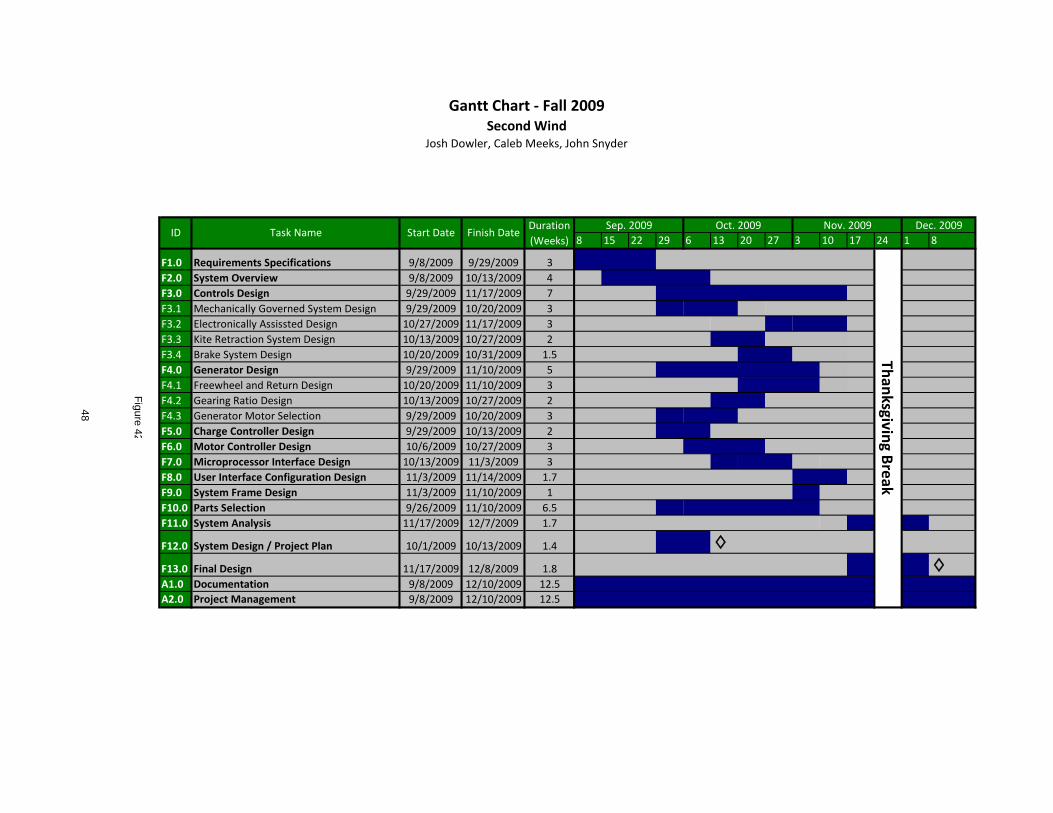
Gantt Chart - Fall 2009Second Wind
Josh Dowler, Caleb Meeks, John Snyder
8 15 22 29 6 13 20 27 3 10 17 24 1 8
F1.0 Requirements Specifications 9/8/2009 9/29/2009 3
F2.0 System Overview 9/8/2009 10/13/2009 4
F3.0 Controls Design 9/29/2009 11/17/2009 7
F3.1 Mechanically Governed System Design 9/29/2009 10/20/2009 3
F3.2 Electronically Assissted Design 10/27/2009 11/17/2009 3
F3.3 Kite Retraction System Design 10/13/2009 10/27/2009 2
F3.4 Brake System Design 10/20/2009 10/31/2009 1.5
F4.0 Generator Design 9/29/2009 11/10/2009 5
F4.1 Freewheel and Return Design 10/20/2009 11/10/2009 3
F4.2 Gearing Ratio Design 10/13/2009 10/27/2009 2
F4.3 Generator Motor Selection 9/29/2009 10/20/2009 3
F5.0 Charge Controller Design 9/29/2009 10/13/2009 2
F6.0 Motor Controller Design 10/6/2009 10/27/2009 3
F7.0 Microprocessor Interface Design 10/13/2009 11/3/2009 3
F8.0 User Interface Configuration Design 11/3/2009 11/14/2009 1.7
F9.0 System Frame Design 11/3/2009 11/10/2009 1
F10.0 Parts Selection 9/26/2009 11/10/2009 6.5
F11.0 System Analysis 11/17/2009 12/7/2009 1.7
F12.0 System Design / Project Plan 10/1/2009 10/13/2009 1.4 ◊
F13.0 Final Design 11/17/2009 12/8/2009 1.8 ◊A1.0 Documentation 9/8/2009 12/10/2009 12.5
A2.0 Project Management 9/8/2009 12/10/2009 12.5
Fig
ure
42
48
Than
ksgiving B
reak
ID Task Name Start Date Finish DateDuration
(Weeks)
Sep. 2009 Oct. 2009 Nov. 2009 Dec. 2009
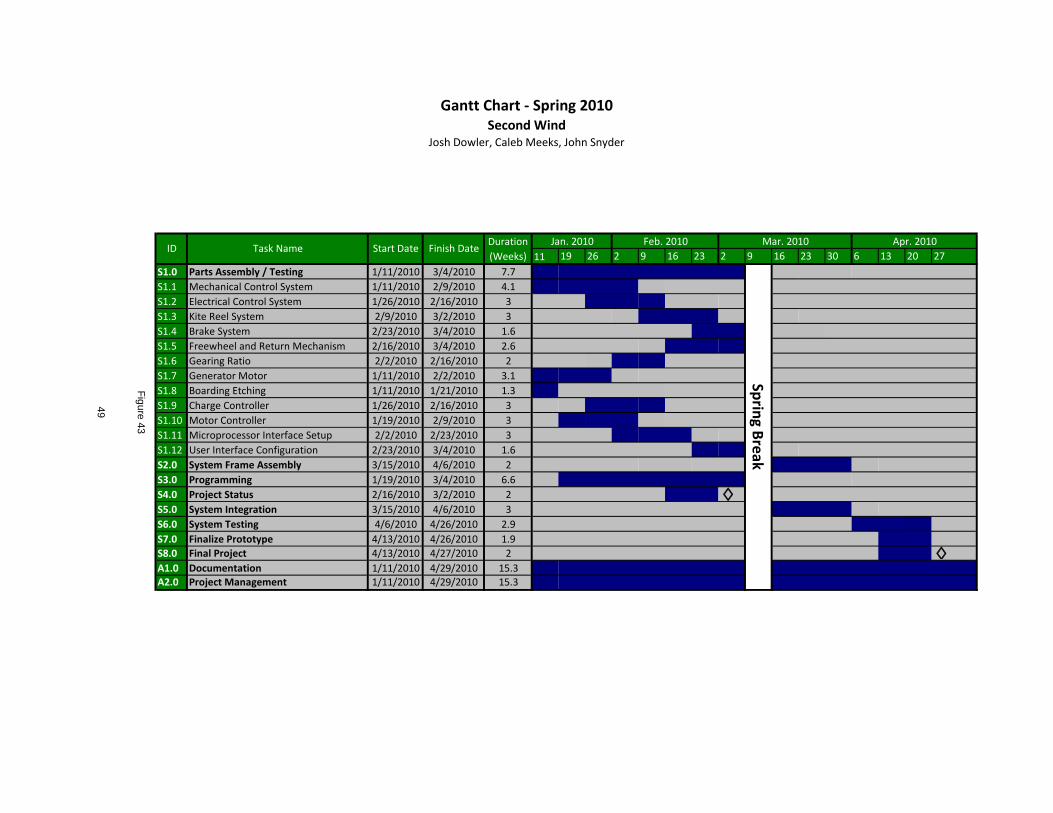
Gantt Chart - Spring 2010Second Wind
Josh Dowler, Caleb Meeks, John Snyder
11 19 26 2 9 16 23 2 9 16 23 30 6 13 20 27
S1.0 Parts Assembly / Testing 1/11/2010 3/4/2010 7.7
S1.1 Mechanical Control System 1/11/2010 2/9/2010 4.1
S1.2 Electrical Control System 1/26/2010 2/16/2010 3
S1.3 Kite Reel System 2/9/2010 3/2/2010 3
S1.4 Brake System 2/23/2010 3/4/2010 1.6
S1.5 Freewheel and Return Mechanism 2/16/2010 3/4/2010 2.6
S1.6 Gearing Ratio 2/2/2010 2/16/2010 2
S1.7 Generator Motor 1/11/2010 2/2/2010 3.1
S1.8 Boarding Etching 1/11/2010 1/21/2010 1.3
S1.9 Charge Controller 1/26/2010 2/16/2010 3
S1.10 Motor Controller 1/19/2010 2/9/2010 3
S1.11 Microprocessor Interface Setup 2/2/2010 2/23/2010 3
S1.12 User Interface Configuration 2/23/2010 3/4/2010 1.6
S2.0 System Frame Assembly 3/15/2010 4/6/2010 2
S3.0 Programming 1/19/2010 3/4/2010 6.6
S4.0 Project Status 2/16/2010 3/2/2010 2 ◊S5.0 System Integration 3/15/2010 4/6/2010 3
S6.0 System Testing 4/6/2010 4/26/2010 2.9
S7.0 Finalize Prototype 4/13/2010 4/26/2010 1.9
S8.0 Final Project 4/13/2010 4/27/2010 2 ◊A1.0 Documentation 1/11/2010 4/29/2010 15.3A2.0 Project Management 1/11/2010 4/29/2010 15.3
49
Fig
ure
43
Jan. 2010 Feb. 2010 Mar. 2010 Apr. 2010
Sprin
g Bre
ak
ID Task Name Start Date Finish DateDuration
(Weeks)

50
Appendices

Appendix A MAX15046 DC-DC Converter
_______________________________________________________________ Maxim Integrated Products 1
For pricing, delivery, and ordering information, please contact Maxim Direct at 1-888-629-4642, or visit Maxim’s website at www.maxim-ic.com.
40V, High-Performance, Synchronous Buck Controller M
AX
15
04
6
General DescriptionThe MAX15046 synchronous step-down controller oper-
ates from a 4.5V to 40V input voltage range and gener-
ates an adjustable output voltage from 85% of the input
voltage down to 0.6V, supporting loads up to 25A. The
device allows monotonic startup into a prebiased bus
without discharging the output and features adaptive
internal digital soft-start.
The MAX15046 offers the ability to adjust the switching
frequency from 100kHz to 1MHz with an external resis-
tor. The MAX15046’s adaptive synchronous rectifica-
tion eliminates the need for an external freewheeling
Schottky diode. The device also utilizes the external
low-side MOSFET’s on-resistance as a current-sense
element, eliminating the need for a current-sense resis-
tor. This protects the DC-DC components from damage
during output overloaded conditions or output short-
circuit faults without requiring a current-sense resistor.
Hiccup-mode current limit reduces power dissipation
during short-circuit conditions. The MAX15046 includes
a power-good output and an enable input with precise
turn-on/turn-off threshold, which can be used for input
supply monitoring and for power sequencing.
Additional protection features include sink-mode current
limit, and thermal shutdown. Sink-mode current limit pre-
vents reverse inductor current from reaching dangerous
levels when the device is sinking current from the output.
The MAX15046 is available in a 16-pin QSOP or 16-pin
QSOP-EP package and operates over the -40NC to +125NC
temperature range.
FeaturesS Input Voltage Ranges from 4.5V to 40V or 5V
Q10%S Adjustable Outputs from 0.85 x VIN Down to 0.6VS Adjustable Switching Frequency (100kHz to 1MHz)
with Q10% (1MHz) AccuracyS Adaptive Internal Digital Soft-StartS Up to 25A Output CapabilityS Cycle-by-Cycle Valley-Mode Current Limit with
Adjustable, Temperature-Compensated Threshold (30mV to 300mV)
S Monotonic Startup into Prebiased OutputS Q1% Accurate Voltage ReferenceS 3A-Peak Gate DriversS Hiccup-Mode Short-Circuit Protection (Patent-
Pending Architecture)S Overtemperature ShutdownS Power-Good (PGOOD) Output and Enable Input
(EN) with Q5% Accurate ThresholdS Thermally Enhanced 16-Pin QSOP Package
ApplicationsIndustrial Power Supplies (PLC, Industrial Computers, Fieldbus Components, Fieldbus Couplers)
Telecom Power Supplies
Base Stations
19-4719; Rev 0; 7/09
Pin Configurations appear at end of data sheet.
Ordering Information
+Denotes a lead(Pb)-free/RoHS-compliant package.
*EP = Exposed pad.
Typical Operating Circuit
MAX15046
IN
VCC DH
CSP
LX
BST
DL
DRV
PGND
GND
C1
Q1
Q2
PGOOD
EN
LIM
COMP
FB
RT
L1 0.6V TO 0.85V x VINVOUT
D1
R5C4
C3C2
R2
R3
R3C6
C5
R4
4.5V TO 40V VIN
ON
OFF
C7
R1
PART TEMP RANGE PIN-PACKAGE
MAX15046AAEE+ -40�C to +125�C 16 QSOP
MAX15046BAEE+ -40�C to +125�C 16 QSOP-EP*

40V, High-Performance, Synchronous Buck Controller
MA
X1
50
46
2 ______________________________________________________________________________________
Stresses beyond those listed under “Absolute Maximum Ratings” may cause permanent damage to the device. These are stress ratings only, and functional operation of the device at these
or any other conditions beyond those indicated in the operational sections of the specifications is not implied. Exposure to absolute maximum rating conditions for extended periods may
affect device reliability.
IN to GND ..............................................................-0.3V to +45V
VCC to GND ..................... -0.3V to lower of (VIN + 0.6V) and 6V
EN, DRV to GND .....................................................-0.3V to +6V
PGOOD to GND ....................................................-0.3V to +45V
PGND to GND ......................................................-0.3V to +0.3V
DL to PGND .............................................-0.3V to (VDRV + 0.3V)
BST to PGND .......................................................-0.3V to +50V
LX and CSP to PGND ...............................................-1V to +45V
LX and CSP to PGND ............................-2V (50ns max) to +45V
BST to LX .................................................................-0.3V to +6V
CSP to LX .............................................................-0.3V to +0.3V
DH to LX .................................................. -0.3V to (VBST + 0.3V)
All Other Pins to GND .............................. -0.3V to (VCC + 0.3V)
VCC Short Circuit to GND ..........................................Continuous
PGOOD Maximum Sink Current .........................................20mA
Continuous Power Dissipation (TA = +70NC):
16-Pin QSOP (derate 9.6mW/NC above +70NC) .......771.5mW
16-Pin QSOP-EP (derate 22.7mW/NC above +70NC) 1818.2mW
Junction-to-Case Thermal Resistance (θJC) (Note 1)
16-Pin QSOP ................................................................37NC/W
16-Pin QSOP-EP ............................................................6NC/W
Junction-to-Ambient Thermal Resistance (θJA) (Note 1)
16-Pin QSOP ...........................................................103.7NC/W
16-Pin QSOP-EP ..........................................................44NC/WOperating Temperature Range ........................ -40NC to +125NC
Junction Temperature .....................................................+150NC
Storage Temperature Range ............................ -65NC to +150NC
Lead Temperature (soldering, 10s) ................................+300NC
ELECTRICAL CHARACTERISTICS(VIN = 24V, VEN = 5V, VGND = VPGND = 0V, CIN = 1FF, CVCC = 4.7FF, RRT = 49.9kI, TA = TJ = -40NC to +125NC, unless otherwise
noted. Typical values are at TA = +25NC.) (Note 2)
ABSOLUTE MAXIMUM RATINGS
Note 1: Package thermal resistances were obtained using the method described in JEDEC specification JESD51-7, using a four-lay-
er board. For detailed information on package thermal considerations, refer to http://www.maxim-ic.com/thermal-tutorial.
PARAMETER SYMBOL CONDITIONS MIN TYP MAX UNITS
SYSTEM SPECIFICATIONS
Input-Voltage Range VIN4.5 40
VVIN = VCC = VDRV 4.5 5.5
Quiescent Supply Current IIN_Q VIN = 24V, VFB = 0.9V, no switching 2 3 mA
Shutdown Supply Current IIN_SBYVIN = 24V, VEN = 0V, IVCC = 0,
PGOOD = unconnected0.35 0.55 mA
VCC REGULATOR
Output Voltage VVCC 6V ≤ VIN ≤ 40V, ILOAD = 6mA 5 5.25 5.5 V
VCC Regulator Dropout VIN = 4.5V, ILOAD = 25mA 0.18 0.45 V
VCC Short-Circuit Output Current VIN = 5V 30 55 90 mA
VCC Undervoltage Lockout VCCUVLO VVCC rising 3.8 4 4.2 V
VCC Undervoltage Lockout
Hysteresis400 mV
ERROR AMPLIFIER (FB, COMP)
FB Input-Voltage Set Point VFB 584 590 596 mV
FB Input Bias Current IFB VFB = 0.6V -250 +250 nA
FB to COMP Transconductance gM ICOMP = Q20FA 600 1200 1800 FS
Open-Loop Gain 80 dB
Unity-Gain BandwidthCapacitor from COMP to GND =
47pF5 MHz
40V, High-Performance, Synchronous Buck Controller
MA
X1
50
46
_______________________________________________________________________________________ 3
ELECTRICAL CHARACTERISTICS (continued)(VIN = 24V, VEN = 5V, VGND = VPGND = 0V, CIN = 1FF, CVCC = 4.7FF, RRT = 49.9kI, TA = TJ = -40NC to +125NC, unless otherwise
noted. Typical values are at TA = +25NC.) (Note 2)
PARAMETER SYMBOL CONDITIONS MIN TYP MAX UNITS
VCOMP-RAMP Minimum Voltage 200 mV
COMP Source/Sink Current ICOMP VCOMP = 1.4V 50 80 110 FA
ENABLE (EN)
EN Input High VEN_H VEN rising 1.14 1.20 1.26 V
EN Input Low VEN_L VEN falling 1.05 V
EN Input Leakage Current IEN VEN = 5.5V -1 +1 FA
OSCILLATOR
Switching Frequency (100kHz) fSW RRT = 150kI 80 100 120 kHz
Switching Frequency (300kHz) fSW RRT = 49.9kI 270 300 330 kHz
Switching Frequency (1MHz) fSW RRT = 14.3kI 0.9 1 1.1 MHz
Switching Frequency Adjustment
Range (Note 3) 100 1000 kHz
RT Voltage VRT RRT = 49.9kI 1.15 1.2 1.25 V
PWM MODULATOR
PWM Ramp Peak-to-Peak
AmplitudeVRAMP 1.5 V
PWM Ramp Valley VVALLEY 1.5 V
Minimum Controllable On-Time 70 125 ns
Maximum Duty Cycle fSW = 300kHz (RRT = 49.9kI) 85 87.5 %
Minimum Low-Side On-Time fSW = 1MHz (RRT = 49.9kI) 110 ns
OUTPUT DRIVERS/DRIVERS SUPPLY (VDRV)
Undervoltage Lockout VDRV_UVLO VDRV rising 4.0 4.2 4.4 V
DRV Undervoltage Lockout
Hysteresis400 mV
DH On-Resistance
Low, sinking 100mA,
VBST - VLX = 5V1 3
I
High, sourcing 100mA,
VBST - VLX = 5V1.5 4
DL On-Resistance
Low, sinking 100mA,
VDRV = VCC = 5.25V1 3
High, sourcing 100mA,
VDRV = VCC = 5.25V1.5 4
DH Peak Current CLOAD = 10nF
Sinking,
VBST - VLX = 5V3
ASourcing,
VBST - VLX = 5V2

40V, High-Performance Synchronous Buck Controller
MA
X1
50
46
4 ______________________________________________________________________________________
ELECTRICAL CHARACTERISTICS (continued)(VIN = 24V, VEN = 5V, VGND = VPGND = 0V, CIN = 1FF, CVCC = 4.7FF, RRT = 49.9kI, TA = TJ = -40NC to +125NC, unless otherwise
noted. Typical values are at TA = +25NC.) (Note 2)
Note 2: All devices are 100% tested at room temperature and guaranteed by design over the specified temperature range.
Note 3: Select RRT as:9
RT -7 2SW SW
17.3 10R
f (1 x 10 )(f )
��
�, where fSW is in Hertz.
PARAMETER SYMBOL CONDITIONS MIN TYP MAX UNITS
DL Peak Current CLOAD = 10nF
Sinking, VDRV = VCC
= 5.25V3
ASourcing, VDRV =
VCC = 5.25V2
DH, DL Break-Before-Make Time
(Dead Time)10 ns
SOFT-START
Soft-Start Duration 2048Switching
Cycles
Reference Voltage Steps 64 Steps
CURRENT LIMIT/HICCUP
Cycle-by-Cycle Valley Current-
Limit Threshold Adjustment
Range
VCSP - VPGND,
valley limit =
VLIM/10
VLIM = 0.3V 30
mV
VLIM = 3V 300
LIM Reference Current ILIM VLIM = 0.3V to 3V, TA = +25NC 45 50 55 FA
LIM Reference Current
Temperature Coefficient2300 ppm/NC
CSP Input Bias Current VCSP = 40V -1 +1 FA
Number of Consecutive Current-
Limit Events to Hiccup 7 Events
Hiccup Timeout 4096Switching
Cycles
Peak Low-Side Sink Current-Limit
Threshold
VCSP - VPGND, sink limit = VLIM/20,
RILIM = 30kI, VLIM = 1.5V,
TA = +25NC
75 mV
POWER-GOOD (PGOOD)
PGOOD Threshold VFB rising 90 94 97.5 %VFB
PGOOD Threshold Hysteresis VFB falling 2.65 %VFB
PGOOD Output Low Voltage VPGOOD_L IPGOOD = 2mA, VEN = 0V 0.4 V
PGOOD Output Leakage Current ILEAK_PGOOD VPGOOD = 40V, VEN = 5V, VFB = 1V -1 +1 FA
THERMAL SHUTDOWN
Thermal Shutdown Threshold Temperature rising +150 NC
Thermal Shutdown Hysteresis 20 NC
40V, High-Performance, Synchronous Buck Controller
MA
X1
50
46
8 ______________________________________________________________________________________
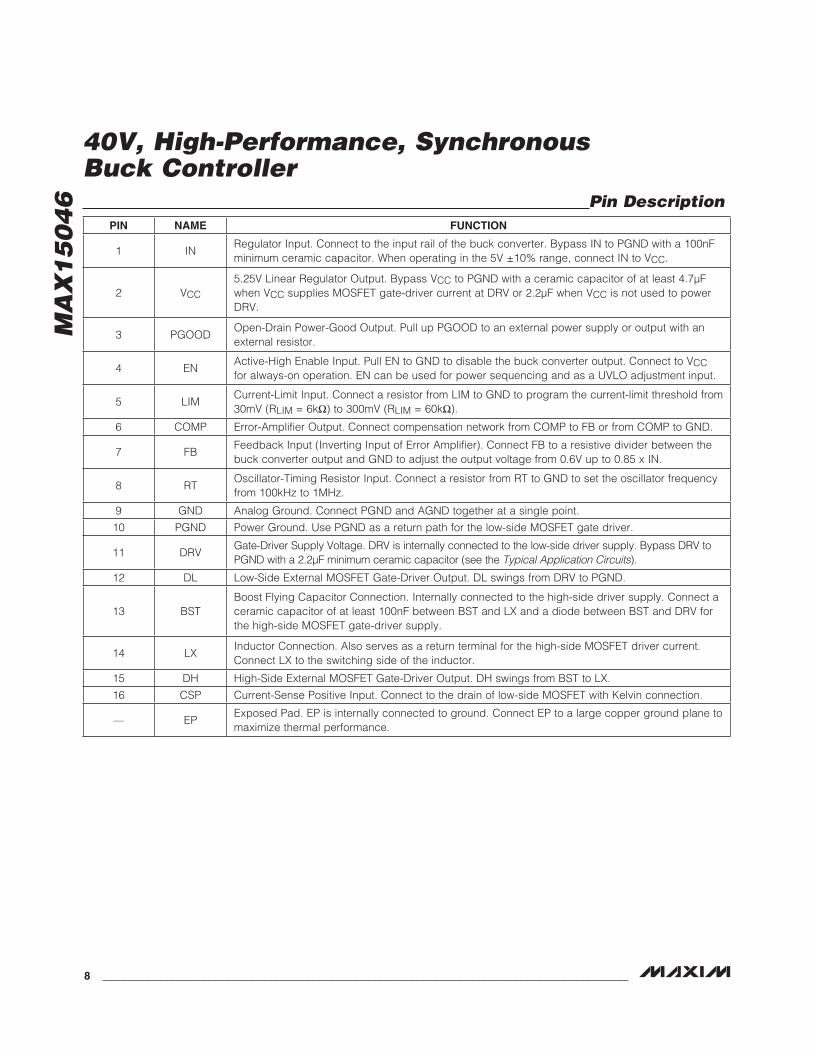
Pin DescriptionPIN NAME FUNCTION
1 INRegulator Input. Connect to the input rail of the buck converter. Bypass IN to PGND with a 100nF
minimum ceramic capacitor. When operating in the 5V Q10% range, connect IN to VCC.
2 VCC
5.25V Linear Regulator Output. Bypass VCC to PGND with a ceramic capacitor of at least 4.7FF
when VCC supplies MOSFET gate-driver current at DRV or 2.2FF when VCC is not used to power
DRV.
3 PGOODOpen-Drain Power-Good Output. Pull up PGOOD to an external power supply or output with an
external resistor.
4 ENActive-High Enable Input. Pull EN to GND to disable the buck converter output. Connect to VCC
for always-on operation. EN can be used for power sequencing and as a UVLO adjustment input.
5 LIMCurrent-Limit Input. Connect a resistor from LIM to GND to program the current-limit threshold from
30mV (RLIM = 6kI) to 300mV (RLIM = 60kI).
6 COMP Error-Amplifier Output. Connect compensation network from COMP to FB or from COMP to GND.
7 FBFeedback Input (Inverting Input of Error Amplifier). Connect FB to a resistive divider between the
buck converter output and GND to adjust the output voltage from 0.6V up to 0.85 x IN.
8 RTOscillator-Timing Resistor Input. Connect a resistor from RT to GND to set the oscillator frequency
from 100kHz to 1MHz.
9 GND Analog Ground. Connect PGND and AGND together at a single point.
10 PGND Power Ground. Use PGND as a return path for the low-side MOSFET gate driver.
11 DRVGate-Driver Supply Voltage. DRV is internally connected to the low-side driver supply. Bypass DRV to
PGND with a 2.2FF minimum ceramic capacitor (see the Typical Application Circuits).
12 DL Low-Side External MOSFET Gate-Driver Output. DL swings from DRV to PGND.
13 BST
Boost Flying Capacitor Connection. Internally connected to the high-side driver supply. Connect a
ceramic capacitor of at least 100nF between BST and LX and a diode between BST and DRV for
the high-side MOSFET gate-driver supply.
14 LXInductor Connection. Also serves as a return terminal for the high-side MOSFET driver current.
Connect LX to the switching side of the inductor.
15 DH High-Side External MOSFET Gate-Driver Output. DH swings from BST to LX.
16 CSP Current-Sense Positive Input. Connect to the drain of low-side MOSFET with Kelvin connection.
— EPExposed Pad. EP is internally connected to ground. Connect EP to a large copper ground plane to
maximize thermal performance.
40V, High-Performance, Synchronous Buck Controller
MA
X1
50
46
10 _____________________________________________________________________________________
Detailed DescriptionThe MAX15046 synchronous step-down controller oper-
ates from a 4.5V to 40V input-voltage range and gener-
ates an adjustable output voltage from 85% of the input-
voltage down to 0.6V while supporting loads up to 25A.
As long as the device supply voltage is within 5.0V to
5.5V, the input power bus (VIN) can be as low as 3.3V.
The MAX15046 offers adjustable switching frequency
from 100kHz to 1MHz with an external resistor. The
adjustable switching frequency provides design flex-
ibility in selecting passive components. The MAX15046
adopts an adaptive synchronous rectification to elimi-
nate external freewheeling Schottky diodes and improve
efficiency. The device utilizes the on-resistance of the
external low-side MOSFET as a current-sense element.
The current-limit threshold voltage is resistor-adjustable
from 30mV to 300mV and is temperature-compensated,
so that the effects of the MOSFET RDS(ON) variation
over temperature are reduced. This current-sensing
scheme protects the external components from damage
during output overloaded conditions or output short-
circuit faults without requiring a current-sense resistor.
Hiccup-mode current limit reduces power dissipation
during short-circuit conditions. The MAX15046 includes
a power-good output and an enable input with precise
turn-on/-off threshold to be used for monitoring and for
power sequencing.
The MAX15046 features internal digital soft-start that
allows prebias startup without discharging the output. The
digital soft-start function employs sink current limiting to
prevent the regulator from sinking excessive current when
the prebias voltage exceeds the programmed steady-
state regulation level. The digital soft-start feature prevents
the synchronous rectifier MOSFET and the body diode of
the high-side MOSFET from experiencing dangerous lev-
els of current while the regulator is sinking current from the
output. The MAX15046 shuts down at a +150NC junction
temperature to prevent damage to the device.
DC-DC PWM ControllerThe MAX15046 step-down controller uses a PWM volt-
age-mode control scheme (see the Functional Diagram).
Control-loop compensation is external for providing max-
imum flexibility in choosing the operating frequency and
output LC filter components. An internal transconduc-
tance error amplifier produces an integrated error volt-
age at COMP that helps to provide higher DC accuracy.
The voltage at COMP sets the duty cycle using a PWM
comparator and a ramp generator. On the rising edge
of an internal clock, the high-side n-channel MOSFET
turns on and remains on until either the appropriate duty
cycle or the maximum duty cycle is reached. During
the on-time of the high-side MOSFET, the inductor cur-
rent ramps up. During the second-half of the switching
cycle, the high-side MOSFET turns off and the low-side
n-channel MOSFET turns on. The inductor releases the
stored energy as the inductor current ramps down, pro-
viding current to the output. Under overload conditions,
when the inductor current exceeds the selected valley
current-limit threshold (see the Current-Limit Circuit (LIM)
section), the high-side MOSFET does not turn on at the
subsequent clock rising edge and the low-side MOSFET
remains on to let the inductor current ramp down.
Internal 5.25V Linear RegulatorAn internal linear regulator (VCC) provides a 5.25V nomi-
nal supply to power the internal functions and to drive the
low-side MOSFET. Connect IN and VCC together when
using an external 5V Q10% power supply. The maximum
regulator input voltage (VIN) is 40V. Bypass IN to GND
with a 1FF ceramic capacitor. Bypass the output of the
linear regulator (VCC) with a 4.7FF ceramic capacitor to
GND. The VCC dropout voltage is typically 180mV. When
VIN is higher than 5.5V, VVCC is typically 5.25V. The
MAX15046 also employs an undervoltage lockout circuit
that disables the internal linear regulator when VVCC
falls below 3.6V (typical). The 400mV UVLO hysteresis
prevents chattering on power-up/power-down.
MOSFET Gate Drivers (DH, DL)DH and DL are optimized for driving large-size n-channel
power MOSFETs. Under normal operating conditions and
after startup, the DL low-side drive waveform is always
the complement of the DH high-side drive waveform,
with controlled dead time to prevent crossconduction or
“shoot-through.” An adaptive dead-time circuit monitors
the DH and DL outputs and prevents the opposite-side
MOSFET from turning on until the MOSFET is fully off.
Thus, the circuit allows the high-side driver to turn on
only when the DL gate driver has turned off preventing
the low side (DL) from turning on until the DH gate driver
has turned off.
The adaptive driver dead time allows operation without
shoot-through with a wide range of MOSFETs, minimiz-
ing delays and maintaining efficiency. There must be a
low-resistance, low-inductance path from DL and DH to
the MOSFET gates for the adaptive dead-time circuits
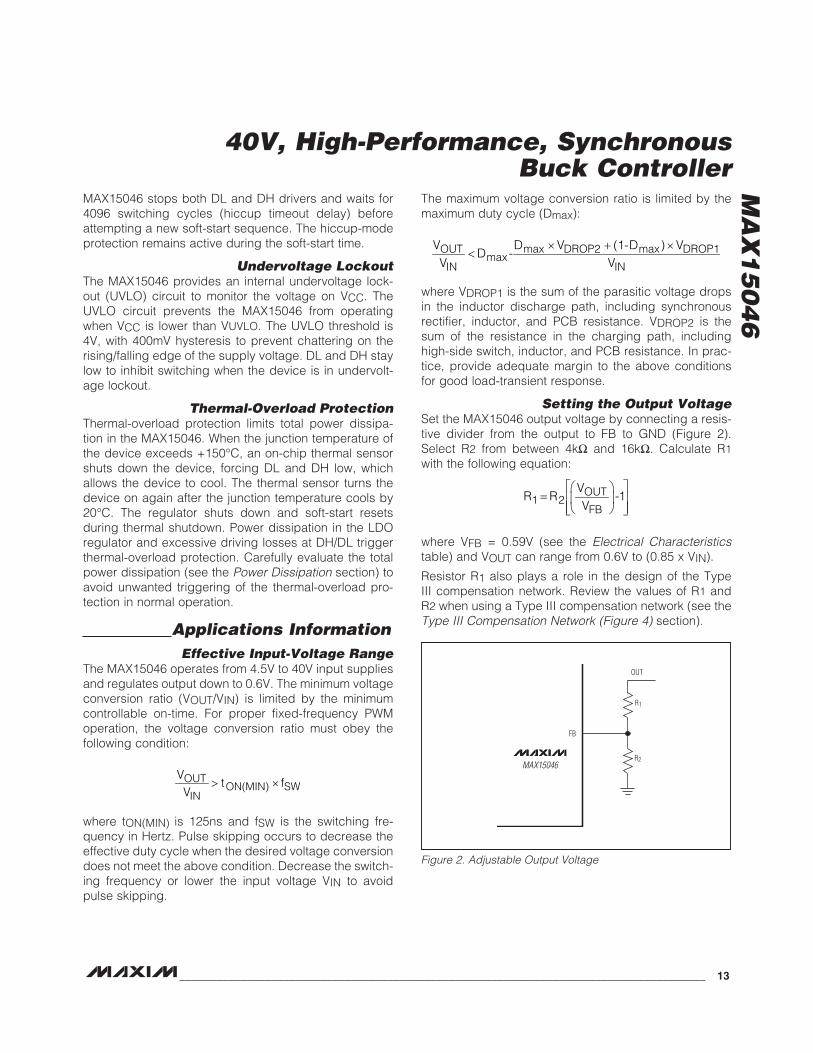
40V, High-Performance, Synchronous Buck Controller
MA
X1
50
46
______________________________________________________________________________________ 13
MAX15046 stops both DL and DH drivers and waits for
4096 switching cycles (hiccup timeout delay) before
attempting a new soft-start sequence. The hiccup-mode
protection remains active during the soft-start time.
Undervoltage LockoutThe MAX15046 provides an internal undervoltage lock-
out (UVLO) circuit to monitor the voltage on VCC. The
UVLO circuit prevents the MAX15046 from operating
when VCC is lower than VUVLO. The UVLO threshold is
4V, with 400mV hysteresis to prevent chattering on the
rising/falling edge of the supply voltage. DL and DH stay
low to inhibit switching when the device is in undervolt-
age lockout.
Thermal-Overload ProtectionThermal-overload protection limits total power dissipa-
tion in the MAX15046. When the junction temperature of
the device exceeds +150NC, an on-chip thermal sensor
shuts down the device, forcing DL and DH low, which
allows the device to cool. The thermal sensor turns the
device on again after the junction temperature cools by
20NC. The regulator shuts down and soft-start resets
during thermal shutdown. Power dissipation in the LDO
regulator and excessive driving losses at DH/DL trigger
thermal-overload protection. Carefully evaluate the total
power dissipation (see the Power Dissipation section) to
avoid unwanted triggering of the thermal-overload pro-
tection in normal operation.
Applications InformationEffective Input-Voltage Range
The MAX15046 operates from 4.5V to 40V input supplies
and regulates output down to 0.6V. The minimum voltage
conversion ratio (VOUT/VIN) is limited by the minimum
controllable on-time. For proper fixed-frequency PWM
operation, the voltage conversion ratio must obey the
following condition:
OUTON(MIN) SW
IN
Vt f
V� �
where tON(MIN) is 125ns and fSW is the switching fre-
quency in Hertz. Pulse skipping occurs to decrease the
effective duty cycle when the desired voltage conversion
does not meet the above condition. Decrease the switch-
ing frequency or lower the input voltage VIN to avoid
pulse skipping.
The maximum voltage conversion ratio is limited by the
maximum duty cycle (Dmax):
� � ��OUT max DROP2 max DROP1
maxIN IN
V D V (1-D ) VD -
V V
where VDROP1 is the sum of the parasitic voltage drops
in the inductor discharge path, including synchronous
rectifier, inductor, and PCB resistance. VDROP2 is the
sum of the resistance in the charging path, including
high-side switch, inductor, and PCB resistance. In prac-
tice, provide adequate margin to the above conditions
for good load-transient response.
Setting the Output VoltageSet the MAX15046 output voltage by connecting a resis-
tive divider from the output to FB to GND (Figure 2).
Select R2 from between 4kI and 16kI. Calculate R1
with the following equation:
� �� �� �
�� �� �
OUT1 2
FB
VR R -1
V
where VFB = 0.59V (see the Electrical Characteristics
table) and VOUT can range from 0.6V to (0.85 O VIN).
Resistor R1 also plays a role in the design of the Type
III compensation network. Review the values of R1 and
R2 when using a Type III compensation network (see the
Type III Compensation Network (Figure 4) section).
Figure 2. Adjustable Output Voltage
FB
R1
OUT
R2MAX15046
40V, High-Performance, Synchronous Buck Controller
MA
X1
50
46
14 _____________________________________________________________________________________
Setting the Switching FrequencyAn external resistor connecting RT to GND sets the
switching frequency (fSW). The relationship between fSW
and RRT is:9
RT -7 2SW SW
17.3 10R
f (1x10 ) x (f )
��
�
where fSW is in kHz and RRT is in kI. For example, a
300kHz switching frequency is set with RRT = 49.9kI.
Higher frequencies allow designs with lower inductor
values and less output capacitance. Peak currents and
I2R losses are lower at higher switching frequencies, but
core losses, gate-charge currents, and switching losses
increase.
Inductor SelectionThree key inductor parameters must be specified for
operation with the MAX15046: inductance value (L),
inductor saturation current (ISAT), and DC resistance
(RDC). To determine the inductance, select the ratio of
inductor peak-to-peak AC current to DC average cur-
rent (LIR) first. For LIR values that are too high, the RMS
currents are high, and therefore I2R losses are high.
Use high-valued inductors to achieve low LIR values.
Typically, inductor resistance is proportional to induc-
tance for a given package type, which again makes I2R
losses high for very low LIR values. A good compromise
between size and loss is a 30% peak-to-peak ripple cur-
rent to average-current ratio (LIR = 0.3). The switching
frequency, input voltage, output voltage, and selected
LIR determine the inductor value as follows:
OUT IN OUT
IN SW OUT
V (V - V )L
V f I LIR�
� � �
where VIN, VOUT, and IOUT are typical values. The
switching frequency is set by RT (see Setting the
Switching Frequency section). The exact inductor value
is not critical and can be adjusted to make trade-offs
among size, cost, and efficiency. Lower inductor val-
ues minimize size and cost, but also improve transient
response and reduce efficiency due to higher peak cur-
rents. On the other hand, higher inductance increases
efficiency by reducing the RMS current.
Find a low-loss inductor with the lowest possible DC
resistance that fits in the allotted dimensions. The
saturation current rating (ISAT) must be high enough to
ensure that saturation cannot occur below the maximum
current-limit value (ICL(MAX)), given the tolerance of the
on-resistance of the low-side MOSFET and of the LIM
reference current (ILIM). Combining these conditions,
select an inductor with a saturation current (ISAT) of:
� �SAT CL(TYP)I 1.35 I
where ICL(TYP) is the typical current-limit set point. The
factor 1.35 includes RDS(ON) variation of 25% and 10%
for the LIM reference current error. A variety of inductors
from different manufacturers are available to meet this
requirement (for example, Vishay IHLP-4040DZ-1-5 and
other inductors from the same series).
Setting the Valley Current LimitThe minimum current-limit threshold must be high enough
to support the maximum expected load current with the
worst-case low-side MOSFET on-resistance value as the
RDS(ON) of the low-side MOSFET is used as the current-
sense element. The inductor’s valley current occurs at
ILOAD(MAX) minus one half of the ripple current. The
minimum value of the current-limit threshold voltage
(VITH) must be higher than the voltage on the low-side
MOSFET during the ripple-current valley,
ITH DS(ON,MAX) LOAD(MAX)LIR
V R I 12
�� �� � � � �� �
where RDS(ON,MAX) in I is the maximum on-resistance
of the low-side MOSFET at maximum load current
ILOAD(MAX) and is calculated from the following equation:
DS(ON,MAX) DS(ON) MOSFET MAX AMBR R [1 TC (T - T )]� � � �
where RDS(ON) (in I is the on-resistance of the low-
side MOSFET at ambient temperature TAMB (in degrees
Celsius), TCMOSFET is the temperature coefficient of
the low-side MOSFET in ppm/NC, and TMAX (in degrees
Celsius) is the temperature at maximum load current
ILOAD(MAX). Obtain the RDS(ON) and TCMOSFET from the
MOSFET data sheet.
40V, High-Performance, Synchronous Buck Controller
MA
X1
50
46
______________________________________________________________________________________ 15
Connect an external resistor (RLIM) from LIM to GND
to adjust the current-limit threshold, which is temper-
ature-compensated with a temperature coefficient of
-2300ppm/NC. The relationship between the current-limit
threshold (VITH) and RLIM is:
ITHLIM 6
MAX AMB)
10 VR
50 10 1 2300 (T - T��
� � � � �� �
where RLIM is in I, VITH is in V, TMAX and TAMB are in
NC.
An RLIM resistance range of 6kI to 60kI corresponds
to a current-limit threshold of 30mV to 300mV. Use 1%
tolerance resistors when adjusting the current limit to
minimize error in the current-limit threshold.
Input CapacitorThe input filter capacitor reduces peak current drawn
from the power source and reduces noise and voltage
ripple on the input caused by the switching circuitry. The
input capacitor must meet the ripple current requirement
(IRMS) imposed by the switching currents as defined by
the following equation:
OUT IN OUTRMS LOAD(MAX)
IN
V (V - V )I I
V�
IRMS attains a maximum value when the input volt-
age equals twice the output voltage (VIN = 2VOUT),
so IRMS(MAX) = ILOAD(MAX)/2. For most applications,
nontantalum capacitors (ceramic, aluminum, polymer, or
OS-CON) are preferred at the inputs due to the robust-
ness of nontantalum capacitors to accommodate high
inrush currents of systems being powered from very low
impedance sources. Additionally, two (or more) smaller-
value low-ESR capacitors should be connected in paral-
lel to reduce high-frequency noise.
Output CapacitorThe key selection parameters for the output capacitor
are capacitance value, ESR, and voltage rating. These
parameters affect the overall stability, output ripple volt-
age, and transient response. The output ripple has two
components: variations in the charge stored in the output
capacitor, and the voltage drop across the capacitor’s
ESR caused by the current flowing into and out of the
capacitor:
DVRIPPLE = DVESR + DVQ
The output-voltage ripple as a consequence of the ESR
and the output capacitance is:
ESR P-P
P-PQ
OUT SW
IN OUT OUTP-P
SW IN
V I ESR
IV
8 C f
V - V VI
f L V
� � �
� �� �
� � � �� �� � � �� � �� �
where IP-P is the peak-to-peak inductor current ripple
(see the Inductor Selection section). Use these equa-
tions for initial capacitor selection. Decide on the final
values by testing a prototype or an evaluation circuit.
Check the output capacitor against load-transient
response requirements. The allowable deviation of the
output voltage during fast load transients determines
the capacitor output capacitance, ESR, and equivalent
series inductance (ESL). The output capacitor supplies
the load current during a load step until the controller
responds with a higher duty cycle. The response time
(tRESPONSE) depends on the closed-loop bandwidth of
the converter (see the Compensation Design section).
The resistive drop across the ESR of the output capaci-
tor, the voltage drop across the ESL (DVESL) of the
capacitor, and the capacitor discharge, cause a voltage
droop during the load step.
Use a combination of low-ESR tantalum/aluminum elec-
trolytic and ceramic capacitors for improved transient
load and voltage ripple performance. Nonleaded capac-
itors and capacitors in parallel help reduce the ESL.
Keep the maximum output-voltage deviation below the
tolerable limits of the load. Use the following equations to
calculate the required ESR, ESL, and capacitance value
during a load step:
��
��
�
� ��
��
ESR
STEP
STEP RESPONSEOUT
Q
ESL STEP
STEP
RESPONSEO
VESR
I
I tC
V
V tESL
I
1t
3 f
where ISTEP is the load step, tSTEP is the rise time of the
load step, tRESPONSE is the response time of the control-
ler, and fO is the closed-loop crossover frequency.

Appendix B PIC18F4550 Microprocessor

Appendix C TLE5205-2 Motor Controller

Data Sheet 1 2001-06-19
built using the Infineon multi-technology process SPT® which allows bipolar and CMOScontrol circuitry plus DMOS power devices to exist on the same monolithic structure.Operation modes forward (cw), reverse (ccw), brake and high impedance are invokedfrom just two control pins with TTL/CMOS compatible levels. The combination of anextremely low RDS ON and the use of a power IC package with low thermal resistance andhigh thermal capacity helps to minimize system power dissipation. A blocking capacitorat the supply voltage is the only external circuitry due to the integrated freewheelingdiodes.
1 Overview
1.1 Features• Delivers up to 5 A continuous 6 A peak current• Optimized for DC motor management applications• Operates at supply voltages up to 40 V• Very low RDS ON; typ. 200 mΩ @ 25 °C per switch• Output full short circuit protected• Overtemperature protection with hysteresis
and diagnosis• Short circuit and open load diagnosis
with open drain error flag• Undervoltage lockout• CMOS/TTL compatible inputs with hysteresis• No crossover current• Internal freewheeling diodes• Wide temperature range; − 40 °C < Tj < 150 °C
DescriptionThe TLE 5205-2 is an integrated power H-bridge withDMOS output stages for driving DC-Motors. The part is
Type Ordering Code Package
TLE 5205-2 Q67000-A9283 P-TO220-7-11
TLE 5205-2GP Q67006-A9237 P-DSO-20-12
TLE 5205-2G Q67006-A9325 P-TO263-7-1
TLE 5205-2S Q67000-A9324 P-TO220-7-12
5-A H-Bridge for DC-Motor Applications TLE 5205-2
P-TO220-7-11
P-DSO-20-12
P-TO263-7-1
P-TO220-7-12
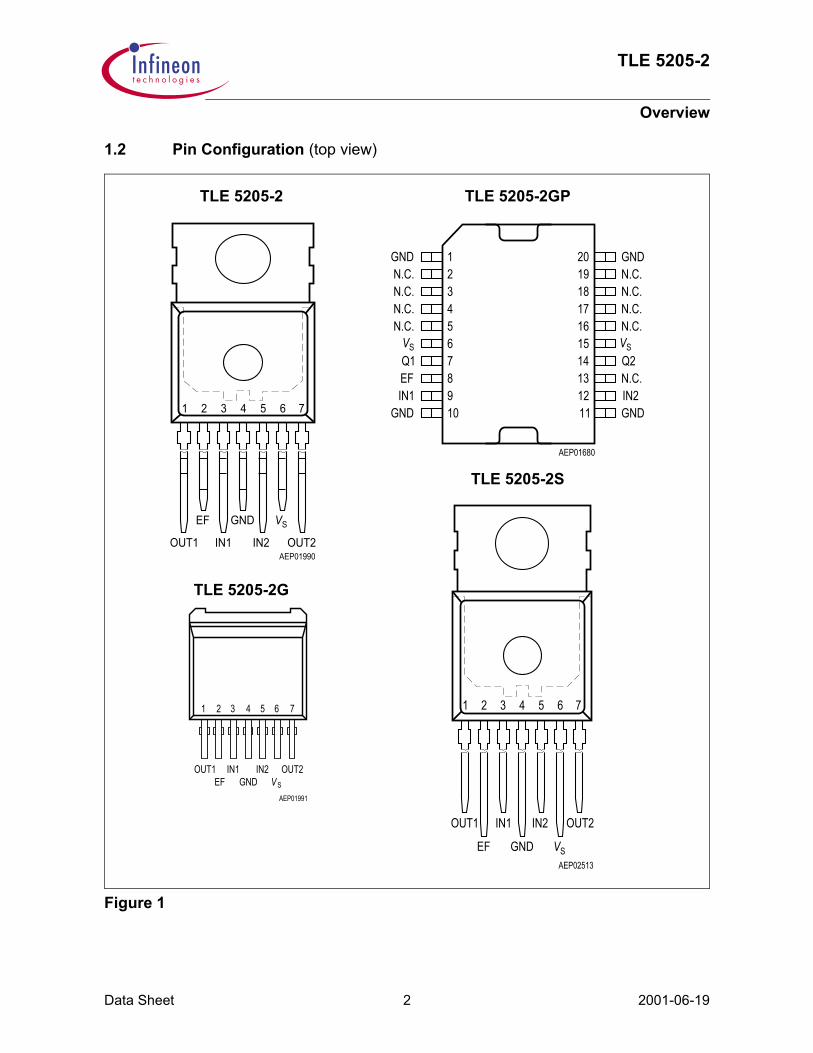
TLE 5205-2
Overview
Data Sheet 2 2001-06-19
1.2 Pin Configuration (top view)
Figure 1
AEP02513
OUT1
EF
IN1
GND
IN2
SV
OUT2
1 2 3 4 5 6 7
OUT2OUT1
7651 2 3 4
IN2GND
IN1EF SV
AEP01991
TLE 5205-2G
TLE 5205-2S
AEP01680
IN1 IN21211
SV
1234
20
5
19
6
18
7
17
8
16
9
15
10
1413
GNDN.C.
VS
N.C.GND
EFQ1 Q2
GND GND
N.C.N.C.N.C.
N.C.N.C.
N.C.
N.C.
AEP01990OUT1
EF
IN1
GND
IN2 OUT2SV
1 2 3 4 5 6 7
TLE 5205-2 TLE 5205-2GP
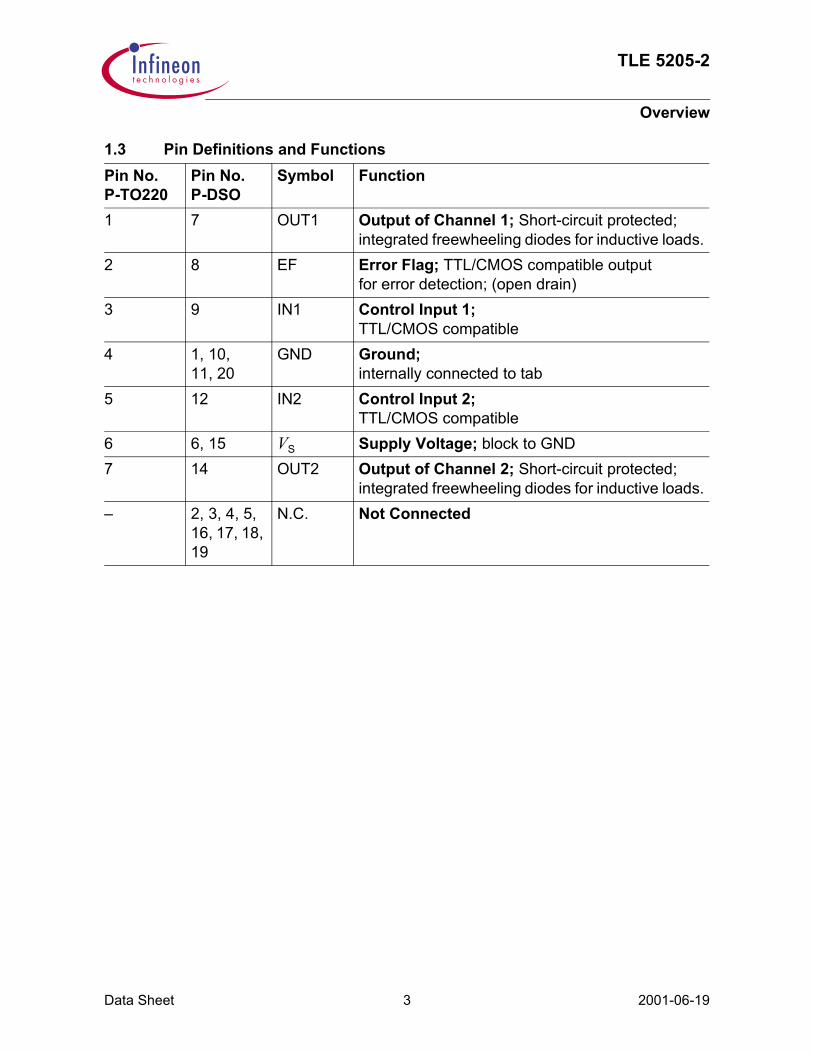
TLE 5205-2
Overview
Data Sheet 3 2001-06-19
1.3 Pin Definitions and FunctionsPin No.P-TO220
Pin No.P-DSO
Symbol Function
1 7 OUT1 Output of Channel 1; Short-circuit protected;integrated freewheeling diodes for inductive loads.
2 8 EF Error Flag; TTL/CMOS compatible outputfor error detection; (open drain)
3 9 IN1 Control Input 1;TTL/CMOS compatible
4 1, 10,11, 20
GND Ground;internally connected to tab
5 12 IN2 Control Input 2;TTL/CMOS compatible
6 6, 15 VS Supply Voltage; block to GND7 14 OUT2 Output of Channel 2; Short-circuit protected;
integrated freewheeling diodes for inductive loads.– 2, 3, 4, 5,
16, 17, 18, 19
N.C. Not Connected
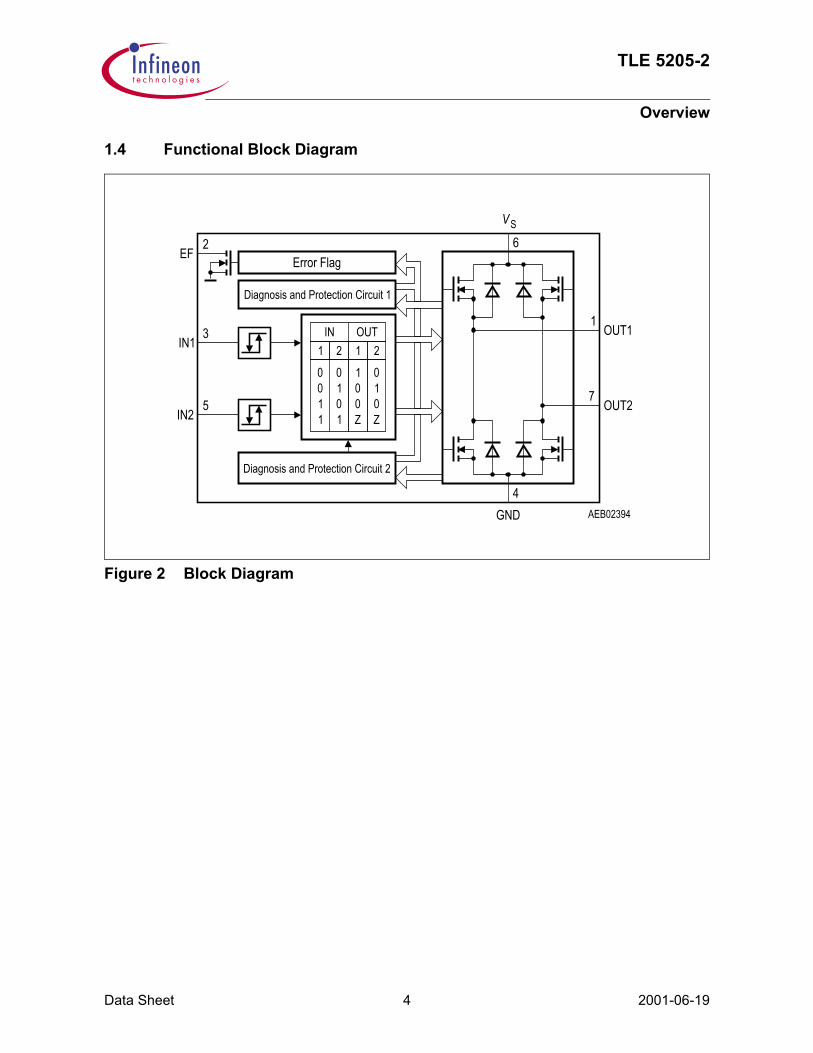
TLE 5205-2
Overview
Data Sheet 4 2001-06-19
1.4 Functional Block Diagram
Figure 2 Block Diagram
1
0011 1
010
2
Z
100
1
Z
010
2IN OUT
Error Flag
1
7
EF
IN1
IN2
2
3
5
4
6
OUT1
OUT2
GND
VS
AEB02394
Diagnosis and Protection Circuit 1
Diagnosis and Protection Circuit 2

TLE 5205-2
Overview
Data Sheet 5 2001-06-19
1.5 Circuit Description
Input CircuitThe control inputs consist of TTL/CMOS-compatible schmitt-triggers with hysteresis.Buffer amplifiers are driven by this stages.
Output StagesThe output stages consist of a DMOS H-bridge. Integrated circuits protect the outputsagainst short-circuit to ground and to the supply voltage. Positive and negative voltagespikes, which occur when switching inductive loads, are limited by integratedfreewheeling diodes.A monitoring circuit for each output transistor detects whether the particular transitor isactive and in this case prevents the corresponding source transistor (sink transistor) fromconducting in sink operation (source operation). Therefore no crossover currents canoccur.
1.6 Input Logic Truth Table
Functional Truth TableIN1 IN2 OUT1 OUT2 CommentsL L H L Motor turns clockwiseL H L H Motor turns counterclockwiseH L L L Brake; both low side transistors turned-ONH H Z Z Open circuit detection
Notes for Output StageSymbol ValueL Low side transistor is turned-ON
High side transistor is turned-OFFH High side transistor is turned-ON
Low side transistor is turned-OFFZ High side transistor is turned-OFF
Low side transistor is turned-OFF
Recommended