8/3/2019 Sebastien Le Pape et al- Novel diagnostic of low-Z shock compressed material
http://slidepdf.com/reader/full/sebastien-le-pape-et-al-novel-diagnostic-of-low-z-shock-compressed-material 1/6
Novel diagnostic of low- Z shock compressed material
Sebastien Le Pape a,b,*, Michel Koenig a, Tommaso Vinci a, Emanuelle Martinolli a,Alessandra Bennuzzi-Mounaix a, Damien Hick s b, Pravesh Patel b, Andy Mackinnon b,
Lorenzo Romagnani c, Marco Borghesi c, Sataybrata Kar c, Tom Boehly d
a UMR 7605, LULI, Ecole Polytechnique, Franceb Lawrence Livermore National Laboratory, Livermore, CA 94550, USA
c Queen’s University of Belfast, UK d Laboratory for Laser Energetic, University of Rochester, USA
Received 29 July 2005
Available online 18 January 2006
Abstract
An experiment was performed using high-energy protons, generated by an intense short laser pulse, to try to characterize in situ, the spatial
and temporal evolution of a laser-driven shock propagating through a low- Z material. Radiography of the shock propagating through the low- Z
transparent material could lead to density determination under compression. A first test of a proton radiography of the rear-side released state of
a shocked aluminum foil has also been tried.
Ó 2006 Elsevier B.V. All rights reserved.
Keywords: Laser-driven shocks; Proton radiography; Short pulses
1. Introduction
The knowledge of Equation of State (EOS) and related pa-
rameters of dense matter is important in several fields of
physics. For instance, in astrophysics the star evolution is
mainly governed by the thermodynamic properties of matter.
Planet cores EOS is also fundamental for the knowledge of
their internal structure [1]. Inertial Confinement Fusion
(ICF) success is also directly related to the understanding of
shell pellet implosion and the final core compression. Both
of these processes necessitate a precise knowledge of the mi-
croballoon material and the fuel (deuterium) EOS at very highpressures [2] (>100 GPa).
Shock-wave-EOS experiments require that two parameters,
usually the shock and fluid velocities, be measured to infer the
thermodynamic properties of the material. While a few
experiments have used X-ray radiography on low- Z materials
to determine both velocities [3], most of them [4,5] rely on the
shock velocities measurement (via optical interferometry in
transparent media or by observation of shock breakout times
on steps of known thickness in optically opaque materials).
The latter technique results in indirect EOS determinations
through a method known as impedance matching. In opaque
high/mean Z materials, it is not possible to get information
about the shock characteristics inside the sample and then to
measure fluid velocities directly. In this case, impedance
matching is the only route to get data. Moreover, in measure-
ments based on velocity determination, it is impossible to have
a good precision on such an important physical quantity as
density due to error amplification going through RankineeHugoniot relations. The development of direct probing
techniques to obtain information on another shock parameter,
such as density, would allow precise absolute EOS determina-
tions and represent a real breakthrough in this field.
A first attempt was therefore conducted using high-energy
protons, produced by the interaction of an intense laser pulse,
in a point projection imaging scheme, to characterize in situ
the spatial and temporal evolution of a laser-driven shock
propagating through a low- Z material. The particular proper-
ties of laser-driven protons beam (small source, high degree
* Corresponding author. Lawrence Livermore National Laboratory, Liver-
more, CA 94550, USA.
E-mail address: [email protected] (S. Le Pape).
1574-1818/$ - see front matter Ó 2006 Elsevier B.V. All rights reserved.
doi:10.1016/j.hedp.2005.12.001
High Energy Density Physics 2 (2006) 1e6www.elsevier.com/locate/hedp

8/3/2019 Sebastien Le Pape et al- Novel diagnostic of low-Z shock compressed material
http://slidepdf.com/reader/full/sebastien-le-pape-et-al-novel-diagnostic-of-low-z-shock-compressed-material 2/6
of collimation, short duration) make them of great interest for
radiographic applications [6]. The proton profile in the beam
should undergo due to collisional stopping power the density
profile in the crossed matter leading to the determination of
the density in the shock. Experiments similar to one described
here, but in a different context, have been conducted using
high explosives to drive a shock in a metal and a high-energyproton beam (800 MeV) from conventional accelerators to
probe it [7]. These experiments were dedicated to the study
of spallation, i.e., in a pressure regime much lower than the
one we are interested in.
2. Experimental principle and setup
The experiment was performed on the 100 TW laser facil-
ity at the Laboratoire pour l’Utilisation des Lasers Intenses
(LULI). The shock was generated by focusing a 60 J e
550 ps Gaussian pulse e at 1053 nm on a multilayer target.
To eliminate large scale spatial intensity modulations and toobtain a flat intensity profile in the focal spot, we used a phase
zone plate [8]. The resulting focal spot had a 300 mm FWHM
diameter with a 150 mm flat top profile, leading to a maximum
average intensity about 6Â 1013 W cmÿ2. The target (Fig. 1)
was composed of a low- Z ablator (4e6 mm CH) to minimise
preheating and a pusher (25 mm of aluminum). A low- Z mate-
rial sliver (Lexan, quartz, diamond, LiF) was glued on this foil.
This material was chosen to limit the protons scattering in the
sliver, which could reduce significantly the spatial resolution.
Due to the maximum intensity achievable, the ablatorepusher
thicknesses were designed to give a maximum pressure in
the pusher about 5 Mbar, as steady as possible. In order to
infer directly the shock velocity in the transparent material,
two VISAR [9] were implemented around the target chamber.
The probe laser beam was 8 ns long and we used two
colours (l¼ 1064, 532 nm) scheme as recently developed at
LULI [10].
The proton beam was generated with an ultra high intensity
short pulse 30 J e 350 fs e 1053 nm focused by an F/3 off-
axis parabola. The resulting focal spot was about 15 mm lead-
ing to an average intensity of 3 Â 1019 W cmÿ2. The proton
beam was created by irradiating a thin 15 mm aluminum foil
[11,12] and detected through a stack of several layers of radio-
chromic film. A 25 mm thick aluminum filter was placed in
front of the first radiochromic film layer giving minimumdetectable proton energy about 3e10 MeV. The proton source
was 2 mm away from the main target, the RC film being in
a position such that the magnification was about 12 (Fig. 2).
3. Shock data
Because of the too short transverse dimension of the sliver,
the shock strength (i.e. the achieved point in the phase diagram
along the principal Hugoniot curve) could not be inferred by
the VISAR. Therefore we performed several shots on alumi-
num stepped targets in order to determine the achievable
pressure and to associate the laser energy to the numerical in-
tensity used in our hydrodynamic code (MULTI [13]) to repro-
duce the data. We were therefore able to get a relation between
the shock velocity and the intensity needed in our 1D code to
get a good agreement between simulation and experiment.
For instance, in shots made on stepped target (2.5 mm CH,
8.5 mm Al, 3.7 mm Al step), the delay observed (Fig. 3) in
the shock breakouts was Dt ¼ 150 ps resulting in a shock
velocity about D¼ 23 km/s. Such a velocity corresponds to
Fig. 1. Target design: the CH layer is the ablator, the aluminum foil the pusher.
The shock generated by the long pulse beam propagates in the low- Z sliver.
Proton beam probes the shock perpendicularly as it propagates into the sliver.
Fig. 2. Experimental setup.
2 S. Le Pape et al. / High Energy Density Physics 2 (2006) 1e6

8/3/2019 Sebastien Le Pape et al- Novel diagnostic of low-Z shock compressed material
http://slidepdf.com/reader/full/sebastien-le-pape-et-al-novel-diagnostic-of-low-z-shock-compressed-material 3/6
a pressurez8 Mbar for an intensity of 6 Â 1013 W cmÿ2. We
also performed some shots on thicker targets, with the same
thickness than our ablatorepusher ones (20 mm CH, 20 mm
Al, 10 mm Al step). In that case, the shock mean velocity in
the step is lower (17 km/s) being obviously non-steady due
to the ‘‘short’’ duration of our long pulse beam. However,
we could reproduce accurately this data with the code, accord-
ing to the laser energy, so the state of the targets (Fig. 1) can be
inferred numerically with a good confidence.
4. Propagation of the shock in quartz
Among the different shots we performed on the transparent
materials, the quartz case represents a paradigm, the sliver
quality being excellent and the results corresponding to typical
trend. Fig. 4 shows a 6 MeV proton image of the shock
propagating in the quartz sliver. On this image, only half of
the proton beam is observed, the other part being cut by the
ablatorepusher part and the target holder. In the rectangular
part representing the sliver, the protons are slow down and scat-
tered by the quartz. The question is whether we could infer the
density in the shock during its propagation through the quartz
sliver or not. Protons are slowed down while they are crossing
the sliver and the beam intensity decreases at the same time.
The bright region outside the sliver acts as a reference for theoriginal beam intensity. As shown in Fig. 4, the high compres-
sion induced by the shock wave is not visible on the proton
image whatever the protons energy is (only the 6 MeV image
is presented here). The line profile (dotted line) presented in
Fig. 4b is obtained along the axis as presented in Fig. 4a. It
shows the 6 MeV protons intensity directly coming from the
proton target and crossing the quartz sliver. The profile presents
a strong decrease that corresponds to the proton propagation in
the quartz. Propagation in the quartz slows down the incoming
protons. For example 6 MeV protons will lose, due to colli-
sions, around 2 MeV while crossing 150 mm SiO2 [14]. Proton
angular distribution being highly sensitive to its energy [15],
adding the effect of the scattering in the sliver, it does explainthe important difference between the proton profile crossing the
sliver and the proton propagating on its side.
The absence of signature in the proton profile of the shock
wave could be explained by the scattering of the protons in the
sliver. Monte Carlo simulations were made using density profile
of the shock in quartz given by 1D simulations (Fig. 5). It calcu-
lates energy loss and scattering of protons while propagating
into the shocked matter. In this figure black curve represents
22 MeV proton profile and the blue curve 7 MeV proton profile
in the detector plan. It shows that the decrease in proton profile
induced by the overdensity in the shock front is visible only if
the energy proton is high enough to limit the scattering effect.Otherwise the spatial resolution is so strongly reduced than
the shock front signature in the proton profile disappears.
5. Release state of an aluminum foil
In the direct drive scheme, a precise knowledge of the state
of the expanding plasma at the backside of the imploding shell
Fig. 3. VISAR image obtained with an aluminum step target. Fringes extinc-
tion corresponds to the shock breakout. From the time difference between the
top and the bottom of the step, the mean shock velocity in aluminum is
deduced.
Fig. 4. (a) Proton image on the quartz sliver when a shock is propagating into. The square shadow corresponds to the proton absorption in the sliver, the bright
circle to the protons around it. (b) The curve corresponds to the protons profile along the white axis in (a). Distances are taken in the detector plane, including the
magnification.
3S. Le Pape et al. / High Energy Density Physics 2 (2006) 1e6

8/3/2019 Sebastien Le Pape et al- Novel diagnostic of low-Z shock compressed material
http://slidepdf.com/reader/full/sebastien-le-pape-et-al-novel-diagnostic-of-low-z-shock-compressed-material 4/6
is required. Development of instabilities is related to unifor-
mity [9] of the compression, therefore, studies have been
carried out to diagnose the effect of laser imprints on the
homogeneity of the compression at the backside of a aluminum
foil [16] and also influence of preheating on the backside
expansion of an aluminum foil [17]. During this experiment,the release of a single aluminum foil (15 mm) was probed
7 ns after the rear-side breakout (Fig. 6). A highly contrast
boundary between vacuum and the moving expanding foil is
observed. From Fig. 6, the shift of the foil was determined
by considering that the edge of the image denotes its initial
position. We found a value equal to 100 mm, which corresponds
to a mean velocity of 14 km/s.
In principle this could be caused by two effects: (1) a rapid
density jump causing proton density enhancement at the edge
[18]; (2) an electric field at the edge of the slowly expanding
plasma deflecting the protons outwards [19].
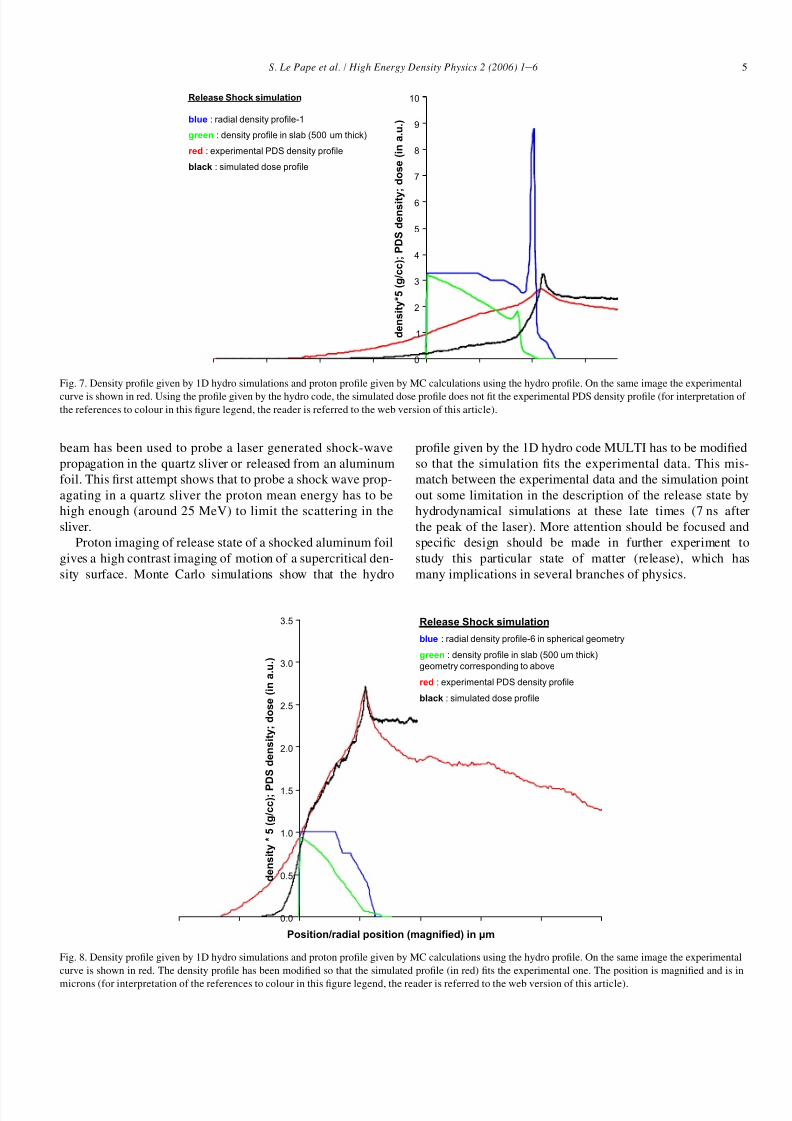
In order to discriminate between these two possible effects,
we compared the experimental results to simulations including
both 1D hydro code (for the foil status 7 ns after the pulse) and
Monte Carlo (MC) for the proton propagation in the shocked
expanding foil (Fig. 7). The large scale spatial dimensionsobserved on the proton image were consistent with the results
of the 1D hydro code. The density foil decreases from 2.7 g/cc
to about 0.5 g/cc and its width expands from 20 mm to 80 mm.
The foil position after 7 ns (100 mm) is also consistent with the
hydro calculations.
Nevertheless, the MC calculations cannot reproduce the
observed proton pile-up using the density profile given by
the hydro code. The result (Fig. 7) shows an absorption of
the proton beam due to the density jump. However, the scatter-
ing is then too low to explain the experimentally observed
phenomenon. Simulations have been made to reproduce the
experimental profile, the density shape given by hydro code
is modified so that the dose profile exhibits a pile-up. Theresults are presented in Fig. 8. In this case, the simulated
dose fits the experimental one, but the hydro profile is slightly
modified from the initial one presented in Fig. 7. The proton
profile is highly sensitive to the steepness of density gradient.
Second possibility is the existence of an electric field, for
example to a strong diffusion effect of electrons as compared
to ions due to their small mass [17]. Estimation of the electric
field at the front shock could be realized using Ref. [17].
Assuming a 5 eV temperature and a density around
1023 cmÿ3, electric field strength is in the order of 107 V/m.
Assuming that protons probe this field on a 400 mm length,
resulting deviation of the proton trajectory is 20 mmrad whichis not visible on RCF film. From the MC simulations and the
electric field estimation, we can conclude that this pile-up
observed in the proton profile is induced by a sharp density
profile that our hydro code (MULTI) cannot reproduce.
6. Conclusions
A novel diagnostic has been developed to probe highly
compressed matter. A short e 1 ps e laser generated proton
Fig. 5. Density profile in the quartz 7 ns after the long pulse peak given by 1D
simulation. MC calculation for the proton beam that propagates through the
quartz using the 1D density profile is presented in the same figure. Blue curvecorrespond to 7 MeV proton profile and the black curve to 25 MeV proton pro-
file. The decrease in the proton profile observed on the black curve correspond
to the shock front position, it is not visible on the blue curve (7 MeV proton)
because of the strongest effect of the scattering at this lower energy (for inter-
pretation of the references to colour in this figure legend, the reader is referred
to the web version of this article).
ba
1 103
2 103
3 103
0 2000 4000 6000
intensity
µm
400 µm
Initial position of the foil
Fig. 6. (a) Proton image of an aluminum foil 7 ns after the long pulse beam. (b) Distribution of the proton beam intensity along the axis shown in the left figure. The
pile-up of the protons corresponds to the position of the foil 7 ns after the long pulse interaction.
4 S. Le Pape et al. / High Energy Density Physics 2 (2006) 1e6
8/3/2019 Sebastien Le Pape et al- Novel diagnostic of low-Z shock compressed material
http://slidepdf.com/reader/full/sebastien-le-pape-et-al-novel-diagnostic-of-low-z-shock-compressed-material 5/6
beam has been used to probe a laser generated shock-wave
propagation in the quartz sliver or released from an aluminum
foil. This first attempt shows that to probe a shock wave prop-
agating in a quartz sliver the proton mean energy has to be
high enough (around 25 MeV) to limit the scattering in the
sliver.
Proton imaging of release state of a shocked aluminum foil
gives a high contrast imaging of motion of a supercritical den-
sity surface. Monte Carlo simulations show that the hydro
profile given by the 1D hydro code MULTI has to be modified
so that the simulation fits the experimental data. This mis-
match between the experimental data and the simulation point
out some limitation in the description of the release state by
hydrodynamical simulations at these late times (7 ns after
the peak of the laser). More attention should be focused and
specific design should be made in further experiment to
study this particular state of matter (release), which has
many implications in several branches of physics.
0
1
2
3
4
5
6
7
8
9
10
d e n s i t y * 5 ( g / c c ) ; P D S
d e n s i t y
; d o s e ( i n
a . u . )
Release Shock simulation
blue : radial density profile-1
green : density profile in slab (500 um thick)
red : experimental PDS density profile
black : simulated dose profile
Fig. 7. Density profile given by 1D hydro simulations and proton profile given by MC calculations using the hydro profile. On the same image the experimental
curve is shown in red. Using the profile given by the hydro code, the simulated dose profile does not fit the experimental PDS density profile (for interpretation of the references to colour in this figure legend, the reader is referred to the web version of this article).
0.0
0.5
1.0
1.5
2.0
2.5
3.0
3.5
d e n s i t y * 5 ( g / c c ) ; P D S
d e n s i t y ; d o s e ( i n
a . u . )
Release Shock simulation
blue : radial density profile-6 in spherical geometry
green : density profile in slab (500 um thick)
geometry corresponding to above
red : experimental PDS density profile
black : simulated dose profile
Position/radial position (magnified) in µm
Fig. 8. Density profile given by 1D hydro simulations and proton profile given by MC calculations using the hydro profile. On the same image the experimental
curve is shown in red. The density profile has been modified so that the simulated profile (in red) fits the experimental one. The position is magnified and is in
microns (for interpretation of the references to colour in this figure legend, the reader is referred to the web version of this article).
5S. Le Pape et al. / High Energy Density Physics 2 (2006) 1e6

8/3/2019 Sebastien Le Pape et al- Novel diagnostic of low-Z shock compressed material
http://slidepdf.com/reader/full/sebastien-le-pape-et-al-novel-diagnostic-of-low-z-shock-compressed-material 6/6
References
[1] D.J. Stevenson, Models of the earth’s core, Science 214 (Nov. 6, 1981)
611e619 (Research supported by California Institute of Technology).
[2] G.A. Collins, Science 281 (1178) (1998).
[3] R. Cauble, T.S. Perry, D.R. Bach, K.S. Budil, B.A. Hammel,
G.W. Collins, D.M. Gold, J. Dunn, P. Celliers, L.B. da Silva,
M.E. Foord, R.J. Wallace, R.E. Stewart, N.C. Woolsey, Absolute equa-tion-of-state data in the 10e40 Mbar (1e4 TPa) regime, Physical Review
Letters 80 (6) (February 9, 1998) 1248e1251.
[4] M. Koenig, B. Faral, J.M. Boudenne, D. Batani, A. Benuzzi, S. Bossi,
C. Remond, J.P. Perrine, M. Temporal, S. Atzeni, Relative consistency
of equations of state by laser driven shock waves, Physical Review
Letters 74 (12) (March 20, 1995) 2260e2263.
[5] A. Benuzzi-Mounaix, M. Koenig, G. Huser, B. Faral, D. Batani,
E. Henry, M. Tomasini, B. Marchet, T.A. Hall, M. Boustie, Th. de Resse -
guier, M. Hallouin, F. Guyot, D. Andrault, Th. Charpin, Absolute equa-
tion of state measurements of iron using laser driven shocks, Physics of
Plasmas 9 (6) (2002) 2466.
[6] M. Borghesi, A. Schiavi, D.H. Campbell, M.G. Haines, O. Willi,
A.J. MacKinnon, L.A. Gizzi, M. Galimberti, R.J. Clarke, H. Ruhl, Proton
imaging: a diagnostic for inertial confinement fusion/fast ignitor studies,
Plasma Physics and Controlled Fusion 43 (12A) (2001) 267e
276.[7] D. Holtkamp, et al., in: M.D. Firnish, et al. (Eds.), Shock Compression of
Condensed Matter, vol. 1, AIP, New York, 2003, p. 447.
[8] T.H. Bett, P. Jinks, R.M. Stevenson, C.N. Danson, D.A. Pepler, I.N. Ross,
Binary phase zone-plate arrays for laser-beam spatial-intensity distribu-
tion conversion, Applied Optics 34 (20) (July 1995) 4025.
[9] L.M. Barker, R.E. Hollenbach, Journal of Applied Physics 43 (4669)
(1972).
[10] P.M. Celliers, G.W. Collins, D.G. Hicks, M. Koenig, E. Henry,
A. Benuzzi-Mounaix, D. Batani, D.K. Bradley, L.B. da Silva,
R.J. Wallace, S.J. Moon, J.H. Eggert, K.K.M. Lee, L.R. Benedetti,
R. Jeanloz, I. Masclet, N. Dague, B. Marchet, M. Rabec Le Gloahec,
Ch. Reverdin, J. Pasley, O. Willi, D. Neely, C. Danson, Electronic conduc-
tion in shock-compressed water, Physics of Plasmas 11 (8) (2004) L41.
[11] E.L. Clark, K. Krushelnick, J.R. Davies, M. Zepf, M. Tatarakis, F.N. Beg,
A. Machacek, P.A. Norreys, M.I.K. Santala, I. Watts, A.E. Dangor, Mea-
surements of energetic proton transport through magnetized plasma from
intense laser interactions with solids, Physical Review Letters 84 (4)
(January 24, 2000) 670e673.
[12] M. Roth, M. Allen, P. Audebert, A. Blazevic, E. Brambrink, T.E. Cowan,
J. Fuchs, J.-C. Gauthier, M. Geißel, M. Hegelich, S. Karsch, J. Meyer-
ter-Vehn, H. Ruhl, T. Schlegel, R.B. Stephens, The generation of high-
quality, intense ion beams by ultra-intense lasers, Plasma Physics Control
Fusion 44 (12B) (2002) 99e108.
[13] R. Ramis, R. Schmalz, J. Meyer-ter-Vehn, MULTIe a computer code for
one-dimensional multigroup radiation hydrodynamics, Computer Physics
Communications 49 (3) (1988) 475e505.
[14] James F. Ziegler, SRIM-2003, Nuclear Instruments and Methods in
Physics Research Section B 219 (2003) 1027e1036.
[15] M. Allen, Y. Sentoku, P. Audebert, A. Blazevic, T. Cowan, J. Fuchs,
J.C. Gauthier, M. Geissel, M. Hegelich, S. Karsch, E. Morse,
P.K. Patel, M. Roth, Proton spectra from ultraintense lasereplasma inter-
action with thin foils: experiments theory and simulation, Physics of
Plasmas 10 (8) (2003) 3283.
[16] Michel Koenig, Bernard Faral, Jean Michel Boudenne, Dimitri Batani,
Alessandra Benuzzi, Simone Bossi, Optical smoothing techniques for
shock wave generation in laser-produced plasmas, Physical Review E
(1994) 10.113.
[17] Benattar, Rene, Malka, Victor, Soft x-ray imaging of laser-produced
plasmas, in: Proceedings of the SPIE, vol. 1140 (1989), pp. 73e80.
[18] D. West, A.C. Sherwood, Nature 239 (157) (1972).
[19] Y.B. Zel’dovich, Y.P. Raizer, Physics of Shock Waves and High
Temperature Hydrodynamic Phenomena, Academic Press, New York,
1967.
6 S. Le Pape et al. / High Energy Density Physics 2 (2006) 1e6
Recommended