1
Search Engine Effectiveness Metrics and Scorecarding
By Marshall Sponder SECTION 1: METRICS .................................................................................................................... 3
Measuring the Percentage of Traffic from Search Engines: ....................................................... 3 Figure 1: Search Engine Metrics from a Science Magazine Web site............................................ 4
Metric 2 – Site Stickiness ........................................................................................................... 5 Figure 2: Metric 2: Site Stickiness................................................................................................. 5
Problem with Static Site Stickiness ............................................................................................. 6 Figure 2B. Comparing Search Engine Traffic to New Subscriber Signups for a Science Magazine......................................................................................................................................... 6
Metric #3: The Number of Visits from Search Engines: ............................................................ 7 Figure 3: Visits from Search Engines ............................................................................................. 7 Figure 4: Competitive Keyword Analysis of Top Insurance Companies, Fall 2004...................... 8
Metric #4: Percentage of Visits that left the Site from a Single Page Visit (usually the Home Page) ........................................................................................................................................... 9 Metric #5, Visits to Site .............................................................................................................. 9
Figure 6: Visits to Site .................................................................................................................... 9 SECTION 2: SCORECARDING ..................................................................................................... 11
The Number of 1st Page Listings .............................................................................................. 12 Figure 7: Scorecard Report with the Number of 1st Page Listings .......................................... 12 Figure 9: Search Visibility (Top 10 Listings in Search Engines). Source: Ranking Manager, Excel ......................................................................................................................................... 13
The Number of Monthly Leads..................................................................................................... 13 Percentage of Traffic from Search Engines .................................................................................. 13 Figure 10: Search Engine Referral Traffic Source: Web Analytics Software ........................... 14 Figure 11: Liberty Mutual PageViews vs. State Farm Insurance PageViews – 1 year ................ 15 Figure 12: Search Engine Clickstream Report – IBM vs. Dell.................................................... 16 Figure 13: Actual Search Terms that Drive Traffic to Dell from Search Engines ....................... 16 Figure 13: Age Demographics: IBM vs. Dell Source: Hitwise .................................................. 17
Traffic You Could be Getting ................................................................................................... 18 Based on Traffic You Have Now.............................................................................................. 18
Figure 14: Estimated Traffic from Search Engines – Traffic Scorecard ...................................... 18 Additional Metrics ............................................................................................................................ 19 Internal Site Search Metrics.............................................................................................................. 20
Site Search Metric #1: Number of Valid No Results Queries .................................................. 20 Figure 15 - Percentage of No Results Queries.............................................................................. 20
Site Search Metric #2: Percentage of Visitors using Site Search ............................................. 21 Figure 16: Percentage of Visitors using Site Search..................................................................... 21
Site Search Metric # 3: Number of Low Click through Queries .............................................. 21 Figure 18: Click through Rate of Selected Queries ..................................................................... 21
Site Search Metric # 4: Metadata Compliance ......................................................................... 22 Site Search Metric # 5: Internal Promotions................................................................................ 22

2
Site Search Metric # 6 – GoTo URLs clicked on for a specific keyword phrase in the site search....................................................................................................................................................... 24 Summary:...................................................................................................................................... 24
3
How do we measure how well we’re succeeding at search optimization or search marketing? It’s amazing, considering the role search engines have assumed in our lives, there is no standard way to measure success in search optimization campaigns. The term “Web Metrics” covers using Web server logs and log analysis software to measure various conversion ratios, visitor behavior and intent, where visitors are coming from, what page they leave from and what they’re looking for while on the site.
SECTION 1: METRICS Measuring the Percentage of Traffic from Search Engines: Before starting a campaign, I ask to see my clients’ Web server logs, telling the clients it’s for their benefit to get the most out of our work together. Not every client values the Web log information, and some aren’t aware they have it. Most servers provide logs recording the number of visits, unique visits, referral address, browser client, session information, etc. Many sites have log analysis software such as WebTrends or Click Tracks to analyze the server logs. Traffic from search engines can be derived from server logs and is one benchmark that can be used to determine success of a search campaign. Metric 1: Percentage of Traffic from Search Engines = Traffic from Search Engines in Visits X 100 Total Traffic to Site in Visits A client of mine is a well-known science magazine. Before writing the proposal for search engine work, I asked to examine their WebTrends reports. Using the formula for metric 1, search engine traffic for April 04 was 7.36% of the total traffic to the site.
According to WebSideStory, an online analytics firm, in 2003 medium to large sites got an average of 13.6% of traffic from search engines, (http://www.internetnews.com/IAR/article.php/2108921). I decided to peg the low percentage of search engine traffic my potential client was getting to the need for my services, explaining the importance of the search traffic metric in my proposal. Sometimes, just framing an issue (ie: low search engine traffic) suggests possible solutions; the science magazine publisher realized they needed to do something right away about search optimization and hired the firm I work with. The effect of setting up metrics, by itself, can create improvement by making the client more aware; once they see a problem, they’re more willing to address it. Here’s what their last 6 months of stats look like. I measured each metric on a monthly basis; this can vary depending on reporting needs.
4
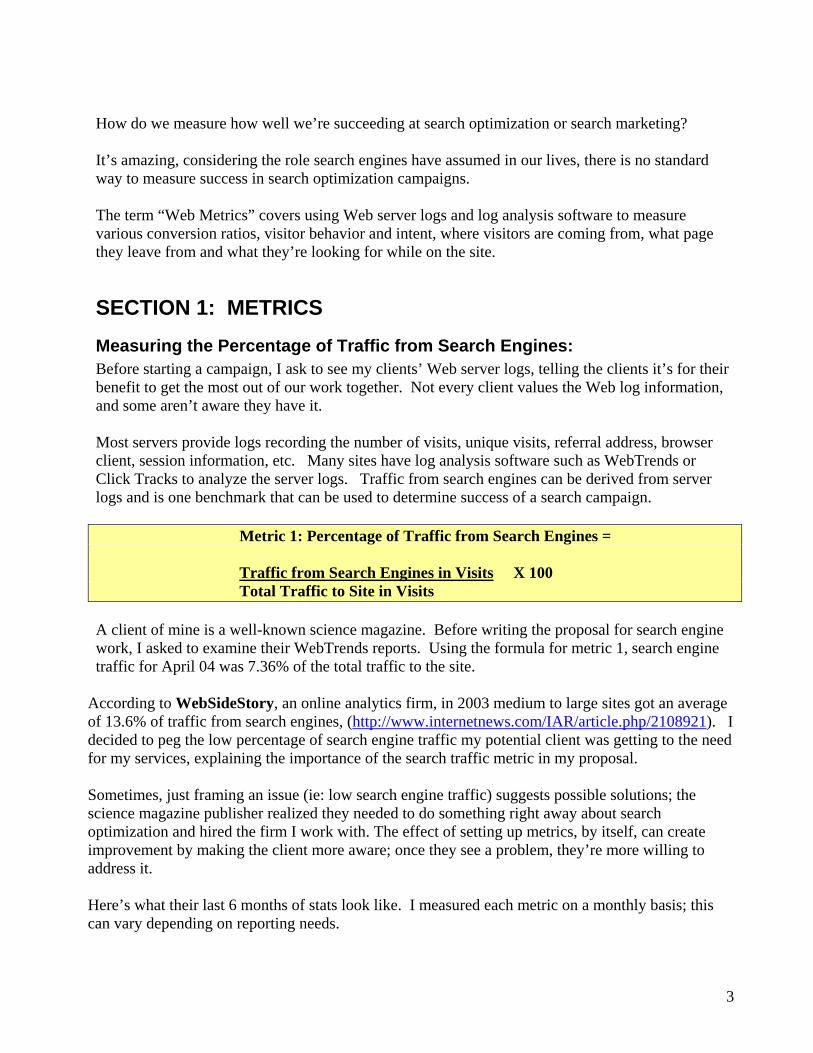
Figure 1: Search Engine Metrics from a science magazine Web site
Source: WebTrends Reports Before starting, I decided on specific metrics representative of improvement for this client; these were the metrics I tied to the campaign’s success. I benchmarked current search engine traffic at 5.30% (Aug 04). One goal going into this was: increase search engine traffic to the level of industry standard (13.6%) within 6 months. After the first month, we helped drive the traffic up to the highest point this year, so far, 8.56%. Traffic from search engines is often called “pre-qualified”; people search because they are looking (searching) to fulfill a need such as travel, information, news, technical support, product repair, etc. When you stop to think about it, most human behaviors are driven out of need; marketers understand this fundamental truth about human nature and successfully tie marketing of a product to a physical need (hunger, sex, shelter, companionship), a psychological need (be admired, be smart, be accepted), a change of life need (marriage, divorce, relocation, job change, age change, health change) etc., using a variety of demographics, psychographics and geo-demographics to match up a target audience by what their needs are (what they are searching for). Matching up the search engine query with the needs it represents allows traffic to be segmented according to the needs of the searcher. The information a searcher types into the search engine also represents a window into the state of mind and intent of the searcher. When we can get traffic from the search engines on queries such as “science news articles,” “science articles,” “science magazine,” and specific articles in the magazine, we’re getting visits from people more likely to subscribe to the science magazine than a casual visitor. Because people are actively searching, they choose what they are interested in finding or knowing about by entering a query into the search engine. When a searcher lands on a site and information in the site is organized according to the needs of the searcher, conversions should increase. The business reason to drive search engine traffic to the science magazine site is to increase subscriber signups thereby increasing revenue to the magazine (subscriber signup is considered a conversion in this case). Depending on the quality of your Web logs and Web analytic software, it’s even possible to merge Web log data with demographic, geo-demographic and psychographic information collected by
5
firms such as Claritas. Vendor firms such as Hitwise successfully correlate demographic and clickstream analysis to produce superior marketing intelligence. As a result, traffic from visits to the site, and especially visits from search engines, can be effectively tied to demographics and psychographics in ways that were not possible before, and in real time.
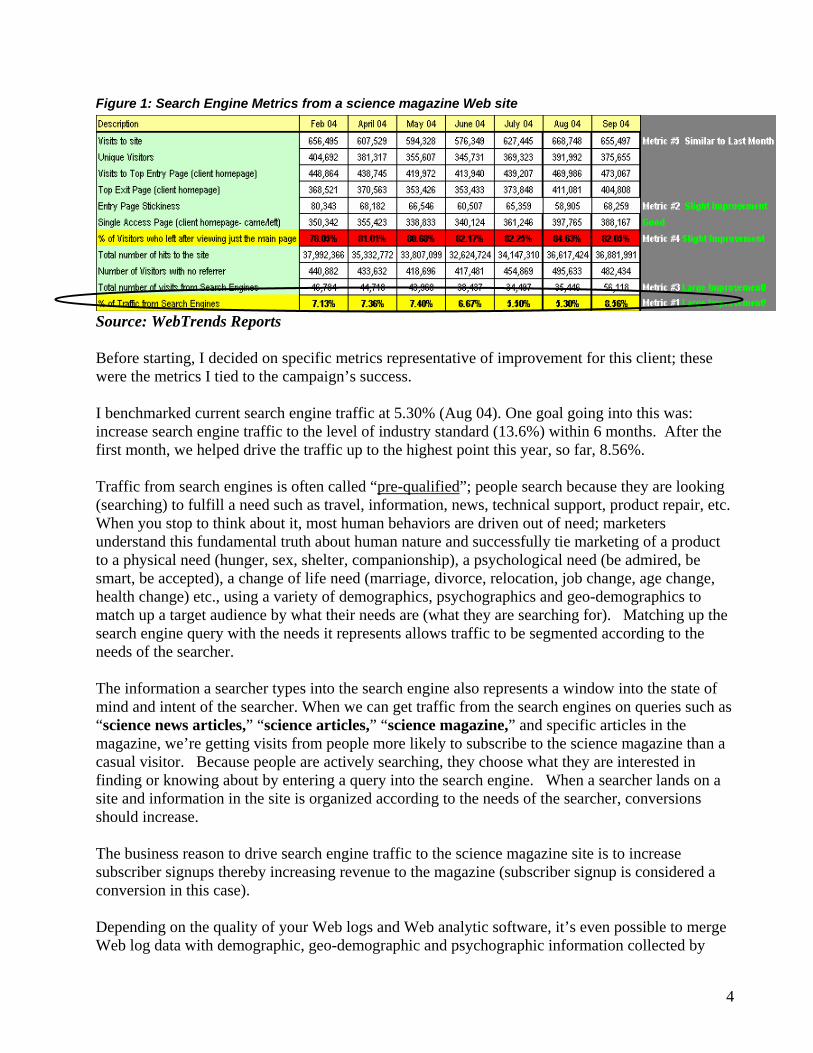
Metric 2 – Site Stickiness (Usually taken from the main page of the site as it’s almost always the most trafficked page of the site and the entry point for the majority of online visits) Site Stickiness = Number of visits to the main page of a site -- Number of exits from the main page of the site For Sept 04, Site Stickiness = (473,067 – 404,808) = 68,269 The stickiness metric measures if people are finding what they expect to find as soon as they arrive on the site. For the science magazine, they haven’t changed much in 6 months.
Figure 2: Metric 2: Site Stickiness
My client has a problem with branding, a sizable portion of visits to the site are looking for a popular credit card, a cable channel the magazine is not affiliated with, and a entirely different magazine; they all have similar names in common. I noticed a slight improvement in September’s numbers over August, but if you look at the numbers over the 7 month spread, this is probably an overstatement. Looking at top search phrases from the WebTrends report, I found 4542 visits in September 04 were the result of this type of “blurry branding.” The total visits from search engines for September 04 is 56118. Therefore, a specific metric to measure the branding problem for this client could be: Percentage Branding = Number of Visits of Mis-branded traffic X 100 blurriness Number of Visits from Search Engines (4542 / 56118) X 100 = 8.09% By focusing on this metric, we have one way to measure improvements with the branding issue by tracking the percentage of branding blurriness as an additional metric on a monthly basis. Every client is different and has issues that need to be addressed. I won’t cover the actual methodology for solving clients’ branding problems here. The client is now more aware, more receptive to possible solutions to increase branding such as PRWeb, search
6
optimized news feeds to Google and Yahoo! news of their science articles, and perhaps a domain name change if the problem is serious enough. Problem with Static Site Stickiness – My client wants to increase their subscriptions to their offline, print magazine, and the stale stickiness numbers concern me. Depending on what information the client shares (ie: the actual number of subscriptions per month), helping them with their set of issues is simplified. That’s another reason to have access to Web log information as a precondition for doing a search optimization campaign. For this client, I may take it up a notch and correlate the percentage of branding blurriness to the gain or loss of the number of monthly subscription signups. In other words, the branding blurriness metric will draw attention to the branding issue and quantify the number of subscriptions by addressing brand blurriness.
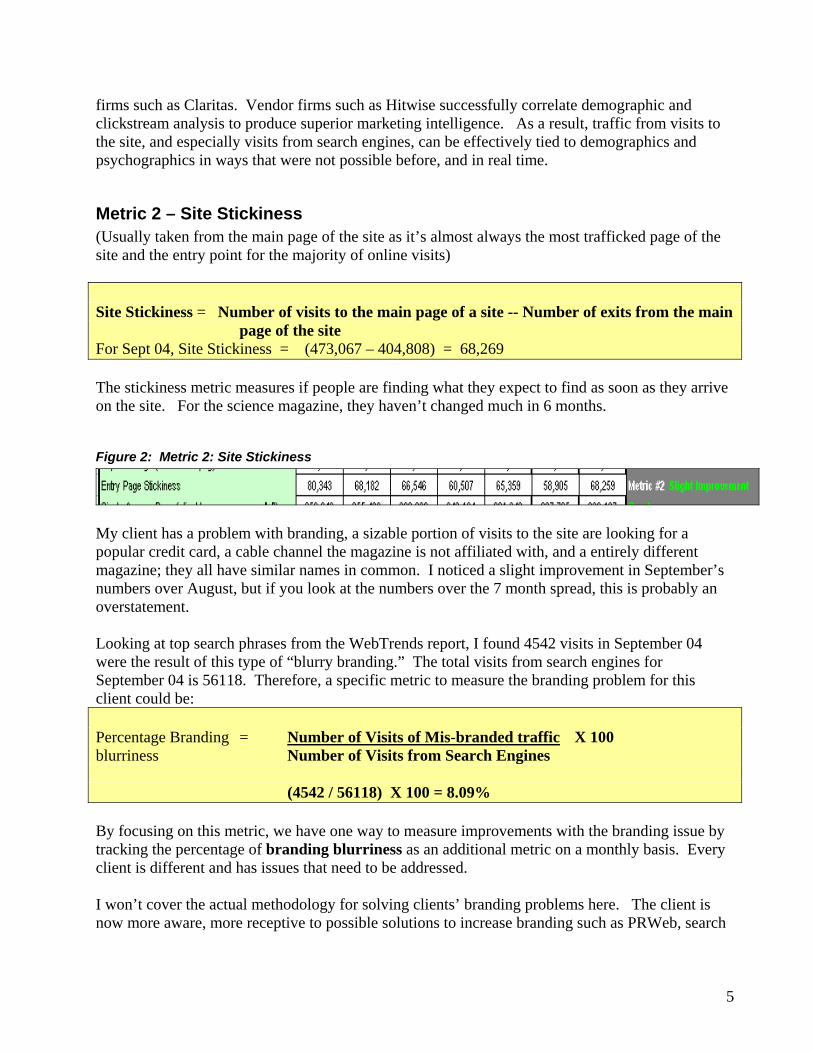
Figure 2B. Comparing Search Engine Traffic to New Subscriber Signups for a Science Magazine
Source: WebTrends, Magazine database records There’s a relationship between search engine traffic and subscriber signups, but it’s not direct, 1:1 ratio. Factors having nothing to do with traffic also effect magazine signups, such as a change in prices or site navigation. In the chart above, it’s clear that SE traffic follows the overall trend of subscription signups from May 04 till the end of September 04. For a couple weeks in October, the price of a subscription rose by 25%, which dropped the number of subscribers signing up. As a search optimizer, there’s not much I can do when the client controls the content and the pricing. However, search engine traffic can drive subscriptions provided that the content, site navigation and pricing support it. On the other hand, factors beyond our control can interfere with

7
what the search campaign is trying to do (drive traffic to increase new subscriber signups- in this case). Good metrics and scorecarding act to separate what the client is doing with the site from the SEO work being done to optimize the site. All we can do is to work towards delivering more search engine traffic, hoping that there will be more conversions. Another explanation for the chart above is the search campaign was successful in driving more traffic to the site, but the search referred visitors were not signing up for subscriptions (the site content determines how many visitors actually sign up). The client reduced the price back to the pre-October levels; we expect subscriber signups should soon move up and closely follow the percentage of search engine traffic in the following months.
Metric #3: The Number of Visits from Search Engines: Search engine traffic is a number that comes directly from your Web logs. The only caveat is to ensure whatever Web analytic software being used categorizes visitor referral traffic for all the possible search engines. Occasionally, a new search engine appears and is not characterized yet.
Figure 3: Visits from Search Engines
Another way to divide traffic is between paid and unpaid search engine traffic. The easiest way to do this, but not the most accurate, is by using the paid advertising consoles (ie: AdWords, Overture, FindWhat or any bid management software that handles all paid advertising campaigns, such as Go Toast, Maestro, etc.) to generate the overall click through rate (CTR) for the site and subtract that number from the number of visits from search engines. This metric can be useful in quantifying the amount of traffic a company is paying for vs. the amount gets from organic listings. Percentage SE Traffic from PPC = (CTR / SE Visits) / SE Visits X 100 Percentage SE Traffic from Organic = (SE Traffic – PPC) / SE Traffic X 100 Example of Metric #3, Percentage of Paid Search traffic to overall Search Engine traffic, Traffic from Search Engines = 56118 visits (the science magazine, Sept 04) Traffic from PPC = 3368 (get this from PPC consoles) Percentage of Paid SE Traffic = (3368/56118) X 100 = 6.06% You could include any traffic from Paid Directory Submissions such as Yahoo! Directory, if you can categorize it; otherwise, don’t bother as the amount of traffic is usually fairly low. Percentage of Organic SE Traffic = (56118-3368)/56118 X 100 = 93.94%
8
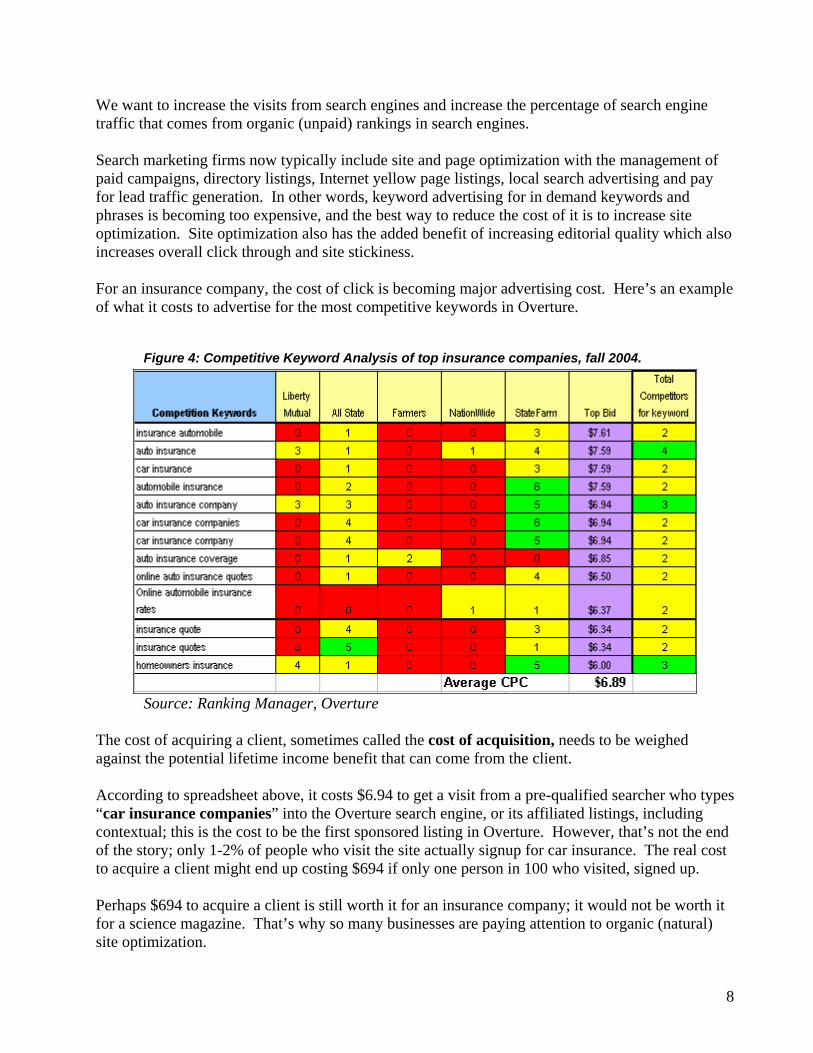
We want to increase the visits from search engines and increase the percentage of search engine traffic that comes from organic (unpaid) rankings in search engines. Search marketing firms now typically include site and page optimization with the management of paid campaigns, directory listings, Internet yellow page listings, local search advertising and pay for lead traffic generation. In other words, keyword advertising for in demand keywords and phrases is becoming too expensive, and the best way to reduce the cost of it is to increase site optimization. Site optimization also has the added benefit of increasing editorial quality which also increases overall click through and site stickiness. For an insurance company, the cost of click is becoming major advertising cost. Here’s an example of what it costs to advertise for the most competitive keywords in Overture.
Figure 4: Competitive Keyword Analysis of top insurance companies, fall 2004.
Source: Ranking Manager, Overture The cost of acquiring a client, sometimes called the cost of acquisition, needs to be weighed against the potential lifetime income benefit that can come from the client. According to spreadsheet above, it costs $6.94 to get a visit from a pre-qualified searcher who types “car insurance companies” into the Overture search engine, or its affiliated listings, including contextual; this is the cost to be the first sponsored listing in Overture. However, that’s not the end of the story; only 1-2% of people who visit the site actually signup for car insurance. The real cost to acquire a client might end up costing $694 if only one person in 100 who visited, signed up. Perhaps $694 to acquire a client is still worth it for an insurance company; it would not be worth it for a science magazine. That’s why so many businesses are paying attention to organic (natural) site optimization.
9
The main reason to quantify the percentage of paid search engine traffic vs. the amount of organic search engine traffic is for targeting goals that increase the effectiveness of the overall search campaign. The most effective campaign will be one that increases acquisition while decreasing advertising cost.
Metric #4: Percentage of Visits that left the Site from a Single Page Visit (usually the Home Page)
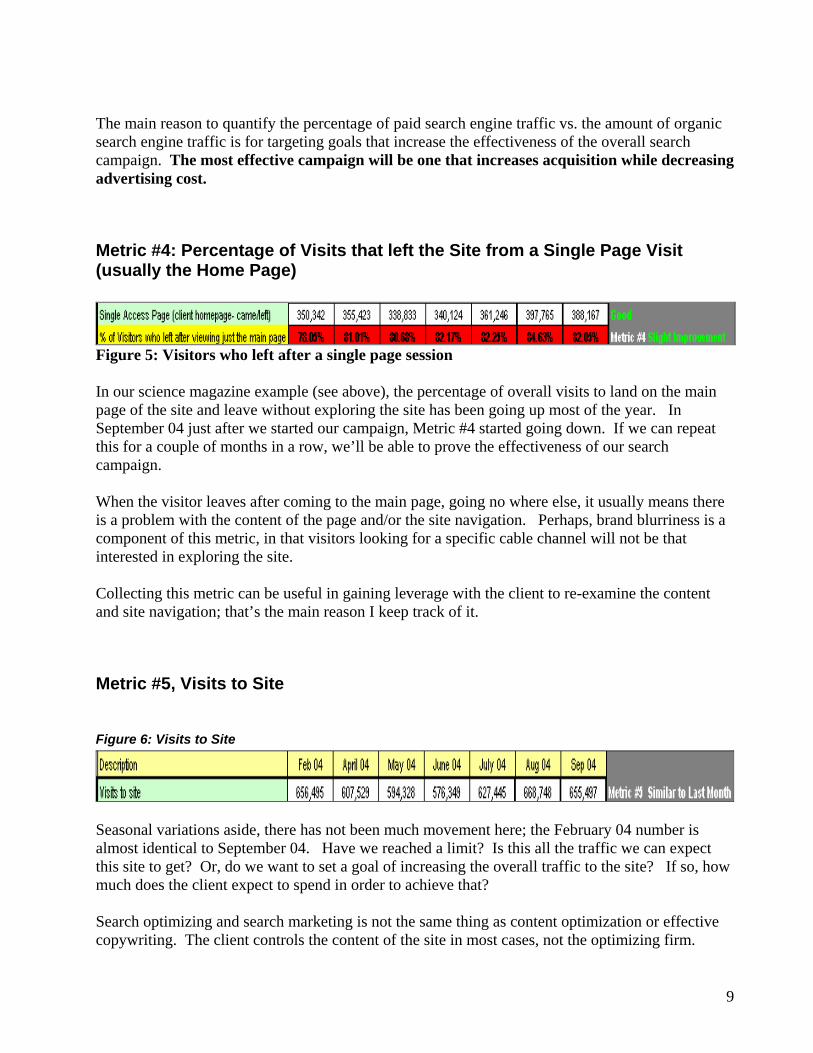
Figure 5: Visitors who left after a single page session In our science magazine example (see above), the percentage of overall visits to land on the main page of the site and leave without exploring the site has been going up most of the year. In September 04 just after we started our campaign, Metric #4 started going down. If we can repeat this for a couple of months in a row, we’ll be able to prove the effectiveness of our search campaign. When the visitor leaves after coming to the main page, going no where else, it usually means there is a problem with the content of the page and/or the site navigation. Perhaps, brand blurriness is a component of this metric, in that visitors looking for a specific cable channel will not be that interested in exploring the site. Collecting this metric can be useful in gaining leverage with the client to re-examine the content and site navigation; that’s the main reason I keep track of it.
Metric #5, Visits to Site
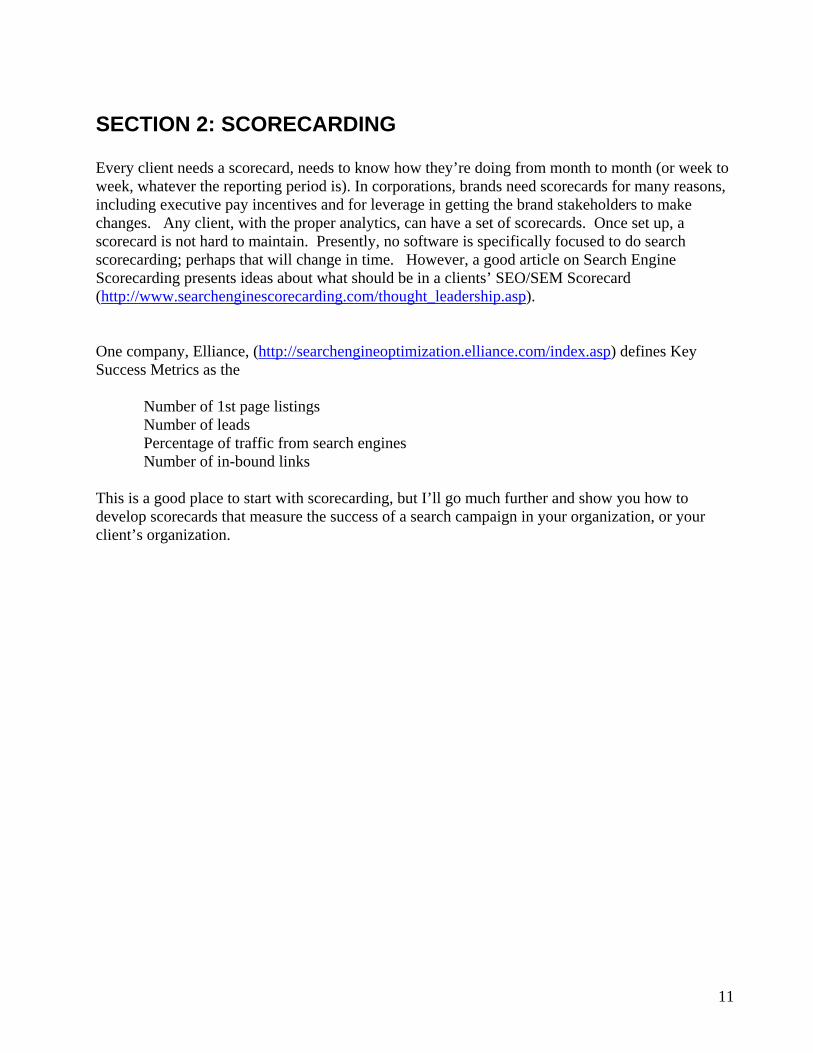
Figure 6: Visits to Site
Seasonal variations aside, there has not been much movement here; the February 04 number is almost identical to September 04. Have we reached a limit? Is this all the traffic we can expect this site to get? Or, do we want to set a goal of increasing the overall traffic to the site? If so, how much does the client expect to spend in order to achieve that? Search optimizing and search marketing is not the same thing as content optimization or effective copywriting. The client controls the content of the site in most cases, not the optimizing firm.

10
How much we can achieve for a client is a function of how willing they are to trust the advice and solutions we come up with. That’s why we need the metrics in the first place and why it’s in the interest of the client to make this information available before and during the campaign.
11
SECTION 2: SCORECARDING Every client needs a scorecard, needs to know how they’re doing from month to month (or week to week, whatever the reporting period is). In corporations, brands need scorecards for many reasons, including executive pay incentives and for leverage in getting the brand stakeholders to make changes. Any client, with the proper analytics, can have a set of scorecards. Once set up, a scorecard is not hard to maintain. Presently, no software is specifically focused to do search scorecarding; perhaps that will change in time. However, a good article on Search Engine Scorecarding presents ideas about what should be in a clients’ SEO/SEM Scorecard (http://www.searchenginescorecarding.com/thought_leadership.asp). One company, Elliance, (http://searchengineoptimization.elliance.com/index.asp) defines Key Success Metrics as the Number of 1st page listings Number of leads Percentage of traffic from search engines Number of in-bound links This is a good place to start with scorecarding, but I’ll go much further and show you how to develop scorecards that measure the success of a search campaign in your organization, or your client’s organization.
12
The Number of 1st Page Listings
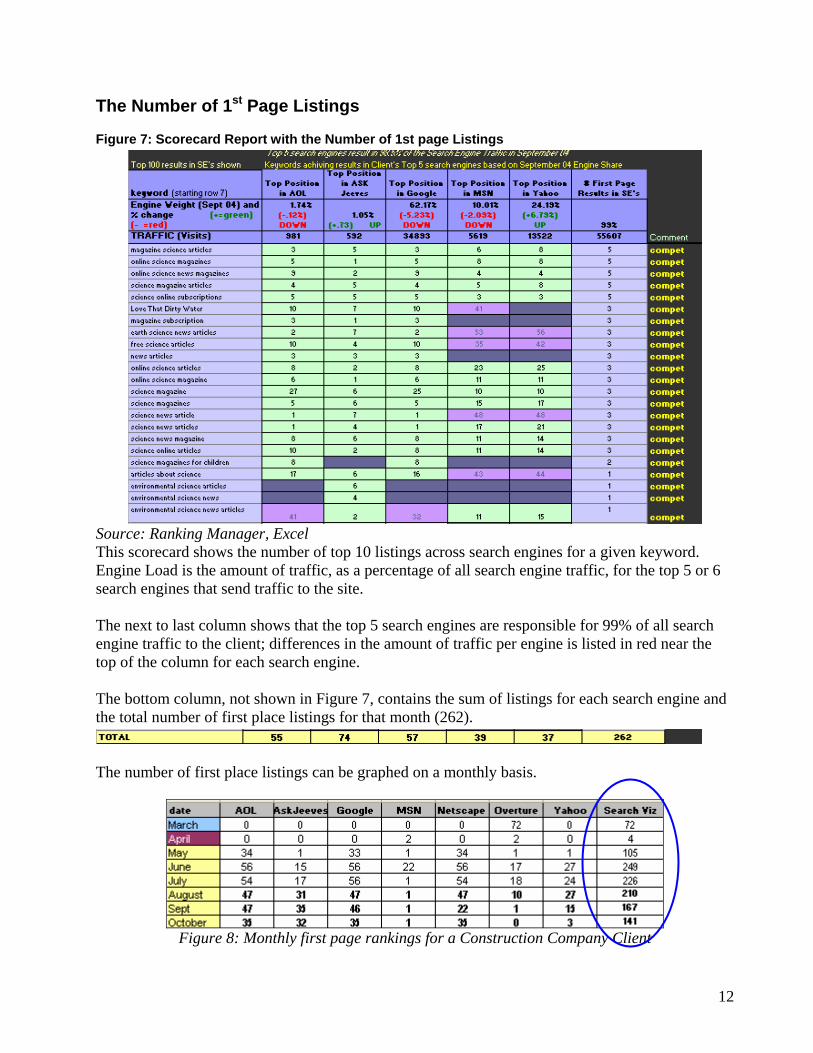
Figure 7: Scorecard Report with the Number of 1st page Listings
Source: Ranking Manager, Excel This scorecard shows the number of top 10 listings across search engines for a given keyword. Engine Load is the amount of traffic, as a percentage of all search engine traffic, for the top 5 or 6 search engines that send traffic to the site. The next to last column shows that the top 5 search engines are responsible for 99% of all search engine traffic to the client; differences in the amount of traffic per engine is listed in red near the top of the column for each search engine. The bottom column, not shown in Figure 7, contains the sum of listings for each search engine and the total number of first place listings for that month (262).
The number of first place listings can be graphed on a monthly basis.
Figure 8: Monthly first page rankings for a Construction Company Client
13
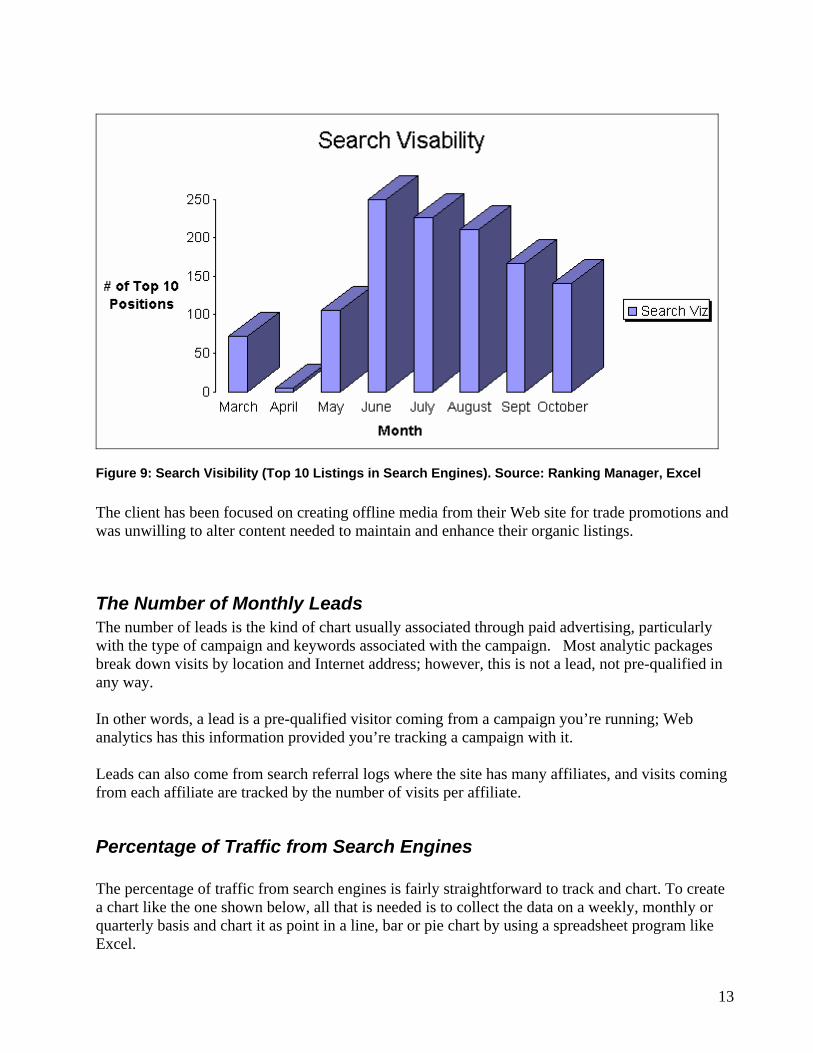
Figure 9: Search Visibility (Top 10 Listings in Search Engines). Source: Ranking Manager, Excel The client has been focused on creating offline media from their Web site for trade promotions and was unwilling to alter content needed to maintain and enhance their organic listings.
The Number of Monthly Leads The number of leads is the kind of chart usually associated through paid advertising, particularly with the type of campaign and keywords associated with the campaign. Most analytic packages break down visits by location and Internet address; however, this is not a lead, not pre-qualified in any way. In other words, a lead is a pre-qualified visitor coming from a campaign you’re running; Web analytics has this information provided you’re tracking a campaign with it. Leads can also come from search referral logs where the site has many affiliates, and visits coming from each affiliate are tracked by the number of visits per affiliate.
Percentage of Traffic from Search Engines The percentage of traffic from search engines is fairly straightforward to track and chart. To create a chart like the one shown below, all that is needed is to collect the data on a weekly, monthly or quarterly basis and chart it as point in a line, bar or pie chart by using a spreadsheet program like Excel.
14
Search engine referral traffic by engine
0
500000
1000000
1500000
2000000
2500000
3000000
3500000
Apr-04 May-04 Jun-04 Jul-04 Aug-04 Sep-04
Vis
its
10.00%
20.00%
Google MSN Yahoo Other SE referrals as % of Total Visits
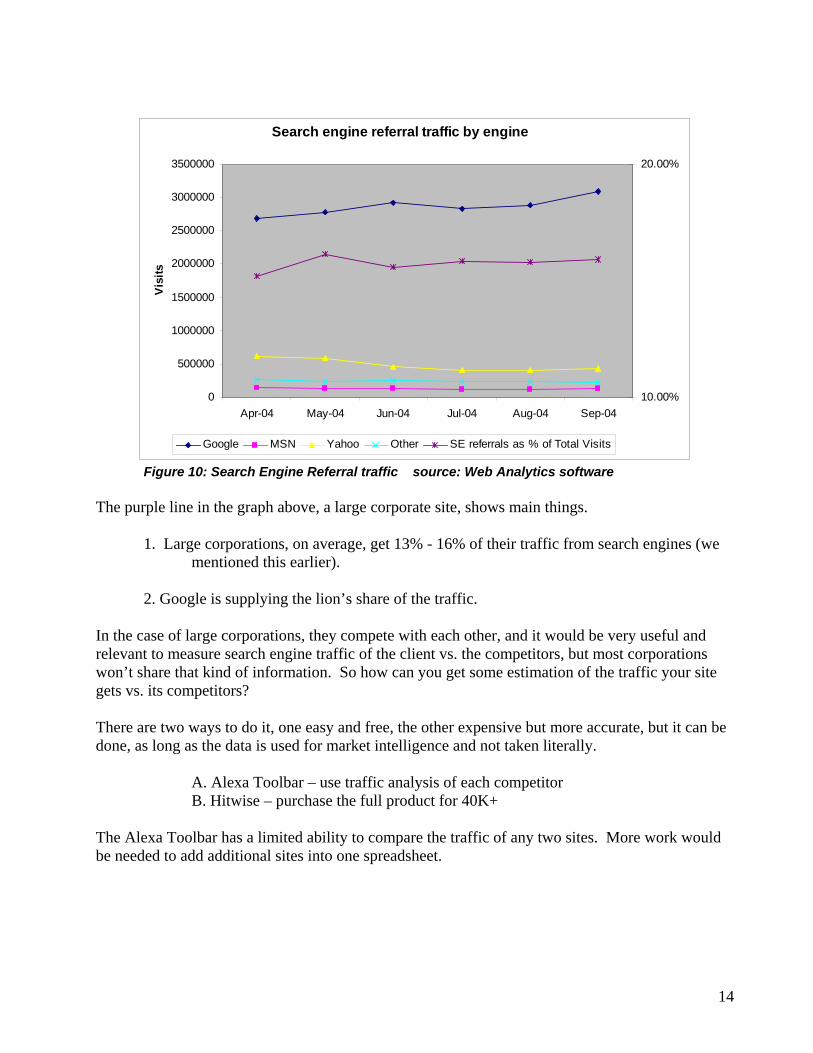
Figure 10: Search Engine Referral traffic source: Web Analytics software The purple line in the graph above, a large corporate site, shows main things. 1. Large corporations, on average, get 13% - 16% of their traffic from search engines (we mentioned this earlier). 2. Google is supplying the lion’s share of the traffic. In the case of large corporations, they compete with each other, and it would be very useful and relevant to measure search engine traffic of the client vs. the competitors, but most corporations won’t share that kind of information. So how can you get some estimation of the traffic your site gets vs. its competitors? There are two ways to do it, one easy and free, the other expensive but more accurate, but it can be done, as long as the data is used for market intelligence and not taken literally. A. Alexa Toolbar – use traffic analysis of each competitor B. Hitwise – purchase the full product for 40K+ The Alexa Toolbar has a limited ability to compare the traffic of any two sites. More work would be needed to add additional sites into one spreadsheet.
15
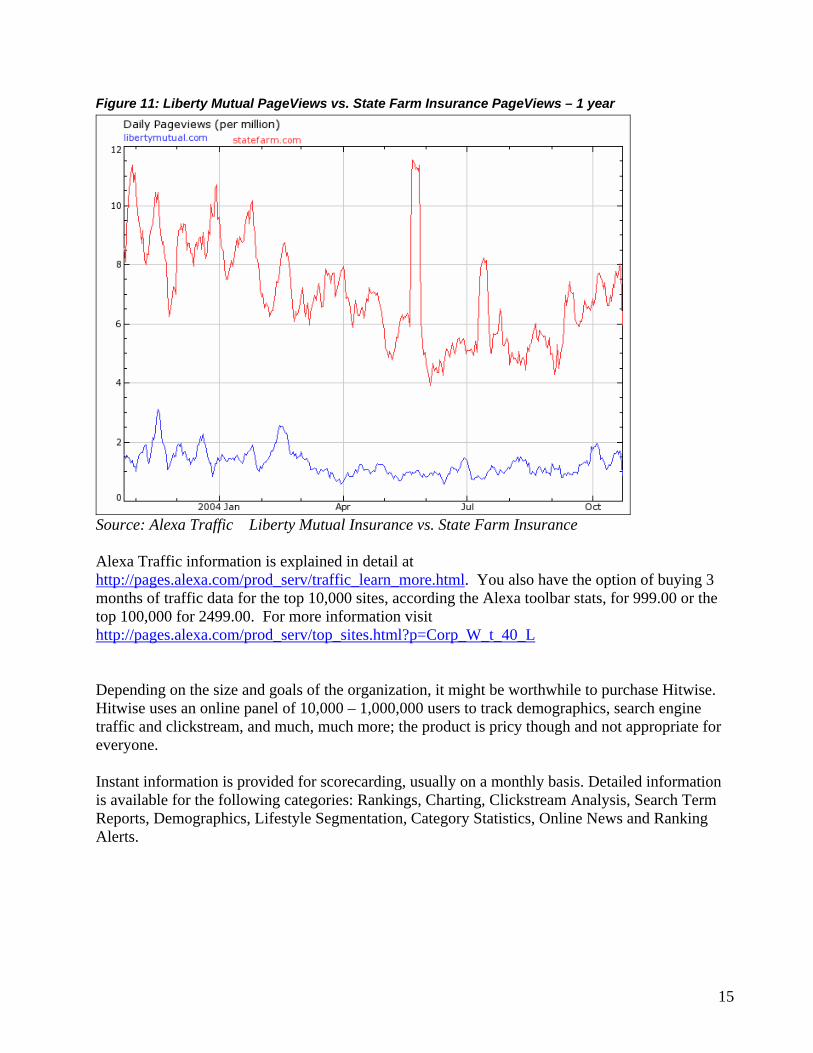
Figure 11: Liberty Mutual PageViews vs. State Farm Insurance PageViews – 1 year
Source: Alexa Traffic Liberty Mutual Insurance vs. State Farm Insurance Alexa Traffic information is explained in detail at http://pages.alexa.com/prod_serv/traffic_learn_more.html. You also have the option of buying 3 months of traffic data for the top 10,000 sites, according the Alexa toolbar stats, for 999.00 or the top 100,000 for 2499.00. For more information visit http://pages.alexa.com/prod_serv/top_sites.html?p=Corp_W_t_40_L Depending on the size and goals of the organization, it might be worthwhile to purchase Hitwise. Hitwise uses an online panel of 10,000 – 1,000,000 users to track demographics, search engine traffic and clickstream, and much, much more; the product is pricy though and not appropriate for everyone. Instant information is provided for scorecarding, usually on a monthly basis. Detailed information is available for the following categories: Rankings, Charting, Clickstream Analysis, Search Term Reports, Demographics, Lifestyle Segmentation, Category Statistics, Online News and Ranking Alerts.
16
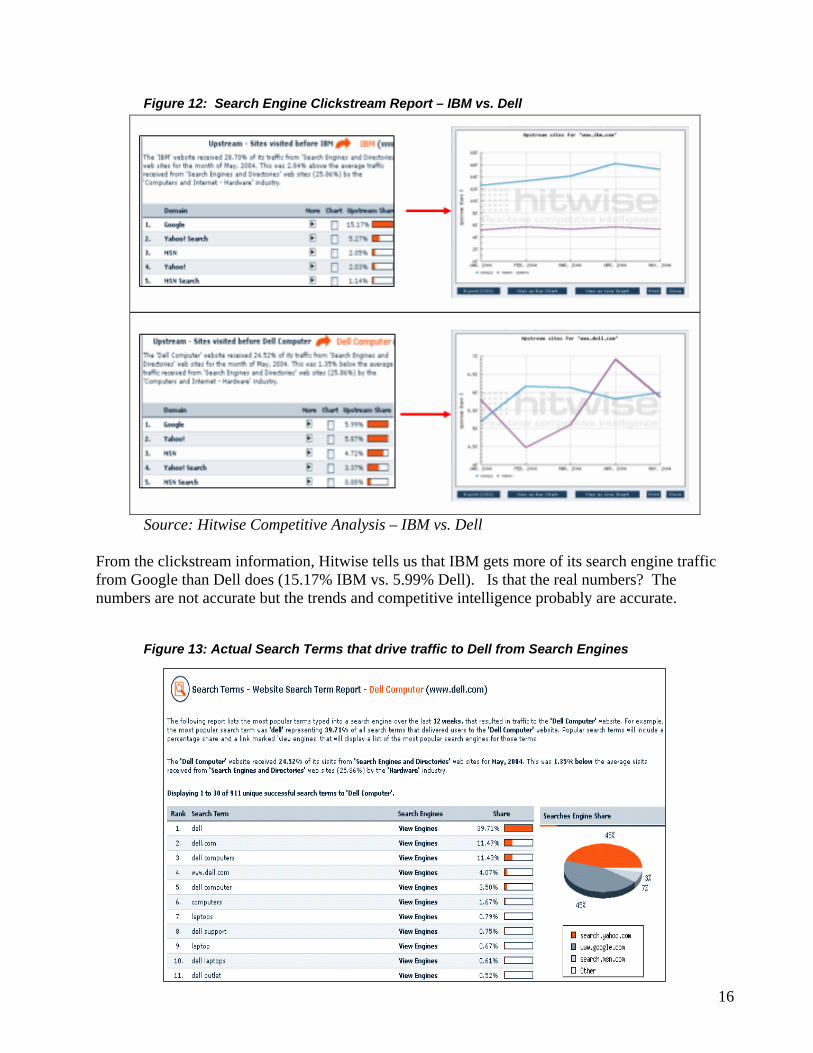
Figure 12: Search Engine Clickstream Report – IBM vs. Dell
Source: Hitwise Competitive Analysis – IBM vs. Dell From the clickstream information, Hitwise tells us that IBM gets more of its search engine traffic from Google than Dell does (15.17% IBM vs. 5.99% Dell). Is that the real numbers? The numbers are not accurate but the trends and competitive intelligence probably are accurate.
Figure 13: Actual Search Terms that drive traffic to Dell from Search Engines
17
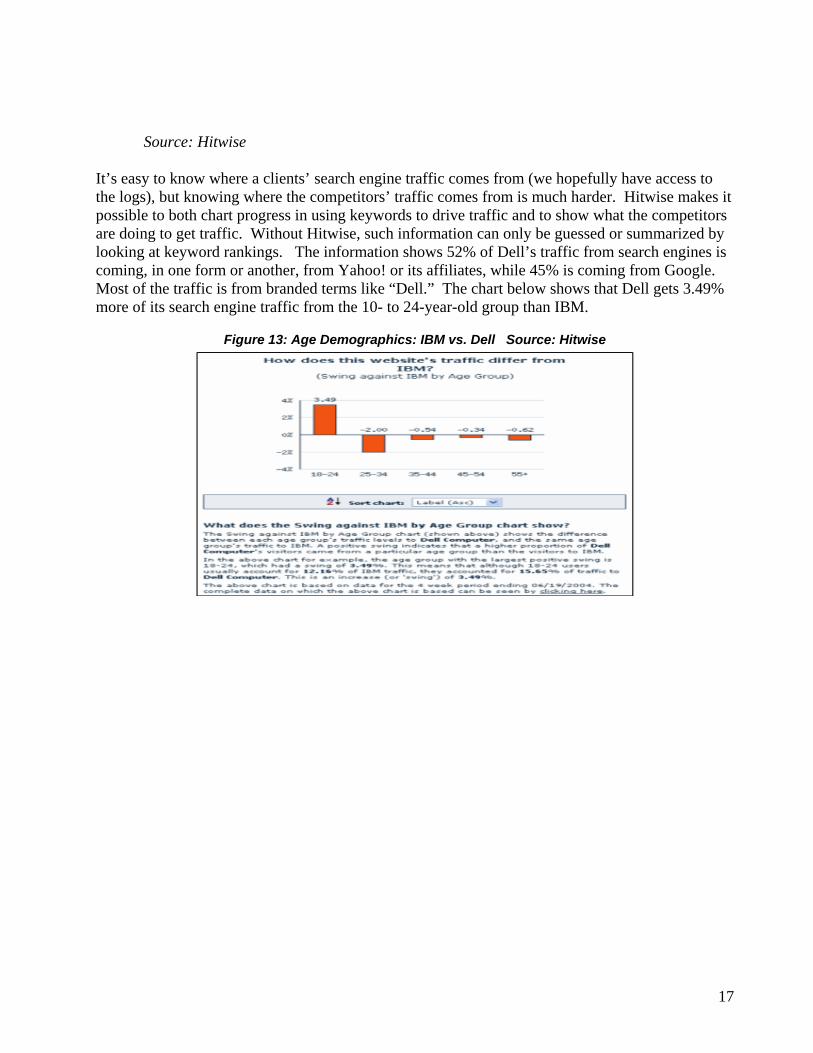
Source: Hitwise It’s easy to know where a clients’ search engine traffic comes from (we hopefully have access to the logs), but knowing where the competitors’ traffic comes from is much harder. Hitwise makes it possible to both chart progress in using keywords to drive traffic and to show what the competitors are doing to get traffic. Without Hitwise, such information can only be guessed or summarized by looking at keyword rankings. The information shows 52% of Dell’s traffic from search engines is coming, in one form or another, from Yahoo! or its affiliates, while 45% is coming from Google. Most of the traffic is from branded terms like “Dell.” The chart below shows that Dell gets 3.49% more of its search engine traffic from the 10- to 24-year-old group than IBM.
Figure 13: Age Demographics: IBM vs. Dell Source: Hitwise
18
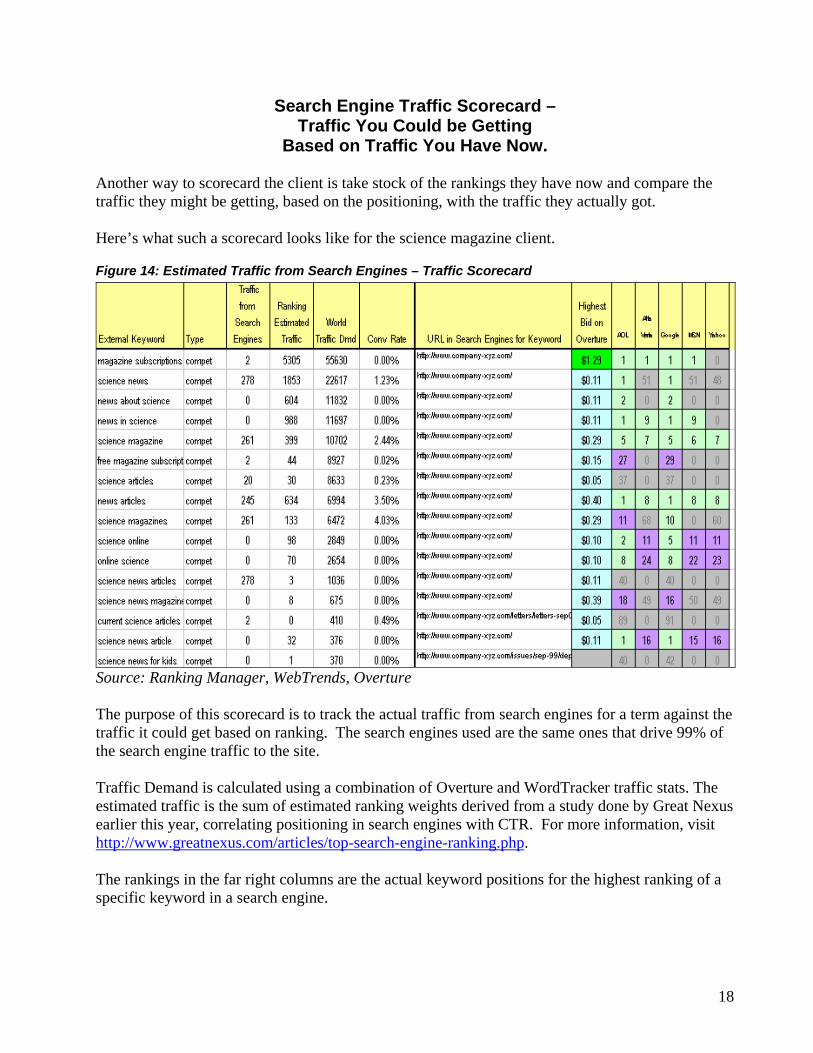
Search Engine Traffic Scorecard – Traffic You Could be Getting
Based on Traffic You Have Now. Another way to scorecard the client is take stock of the rankings they have now and compare the traffic they might be getting, based on the positioning, with the traffic they actually got. Here’s what such a scorecard looks like for the science magazine client.
Figure 14: Estimated Traffic from Search Engines – Traffic Scorecard
Source: Ranking Manager, WebTrends, Overture The purpose of this scorecard is to track the actual traffic from search engines for a term against the traffic it could get based on ranking. The search engines used are the same ones that drive 99% of the search engine traffic to the site. Traffic Demand is calculated using a combination of Overture and WordTracker traffic stats. The estimated traffic is the sum of estimated ranking weights derived from a study done by Great Nexus earlier this year, correlating positioning in search engines with CTR. For more information, visit http://www.greatnexus.com/articles/top-search-engine-ranking.php. The rankings in the far right columns are the actual keyword positions for the highest ranking of a specific keyword in a search engine.
19
The traffic scorecard shows the traffic my client got for “science news” was less than 20% of what it could have gotten. There’s probably an issue with titles and descriptions (metadata) that interfere with searchers clicking on the search engine listing.
Additional Metrics Depending on the quality and scope of the analytics package, additional information can be collected like the keywords that drive traffic to a specific page of your site. Lightweight versions of WebTrends probably don’t supply that level of information; however, I have been able to pull specific keyword information connected with a URL from IBM Surfaid. One of my client’s pages deals with Product Lifecycle Management with the main page of the site getting the lion’s share of search engine traffic. Surprising enough, the main phrase that drove traffic to the PLM site was “catia” not Product Lifecycle Management or PLM, as one would have suspected. Typical low level analytics packages would not have supplied that level of granularity. Sometimes, just knowing the number of search keywords referred to your site on a monthly basis can be used as a metric to show progress in the search optimization. Companies such as AutoBytel use this metric to quickly show progress getting site content indexed in search engines and ranking high in search results.
20
Internal Site Search Metrics Besides external search engine traffic and referrals, there’s also internal site search metrics and traffic. Internal site search is important because it’s related to goal attainment (how easily the visitor finds what they’re looking for on the site). Site search is also important as a window into the mind of searcher. When an internal search engine is used on the site, we have access to the site search query log; this log gives us the click through of the most popular terms and a record of what visitors searched for while on the site. Metrics for site search include, but are not limited to: Site Metric # 1 Number of valid no results queries Site Metric # 2 Percentage of visitors using site search Site Metric # 3 Number of low click through rate queries Site Metric # 4 Metadata Compliance (titles, descriptions, custom tags) Site Metric # 5 Site Promotions (any kind of internal paid advertising CTR) Site Metric # 6 URLs clicked on for a specific query in site search For large corporations, internal site search is a very important part of the overall site navigation. There are several vendors of high end internal search tools such as Fast Tools and Transfer, Google Search Appliance and IBM Web Fountain/OmniFind. Site Search Metric #1: Number of valid no results queries
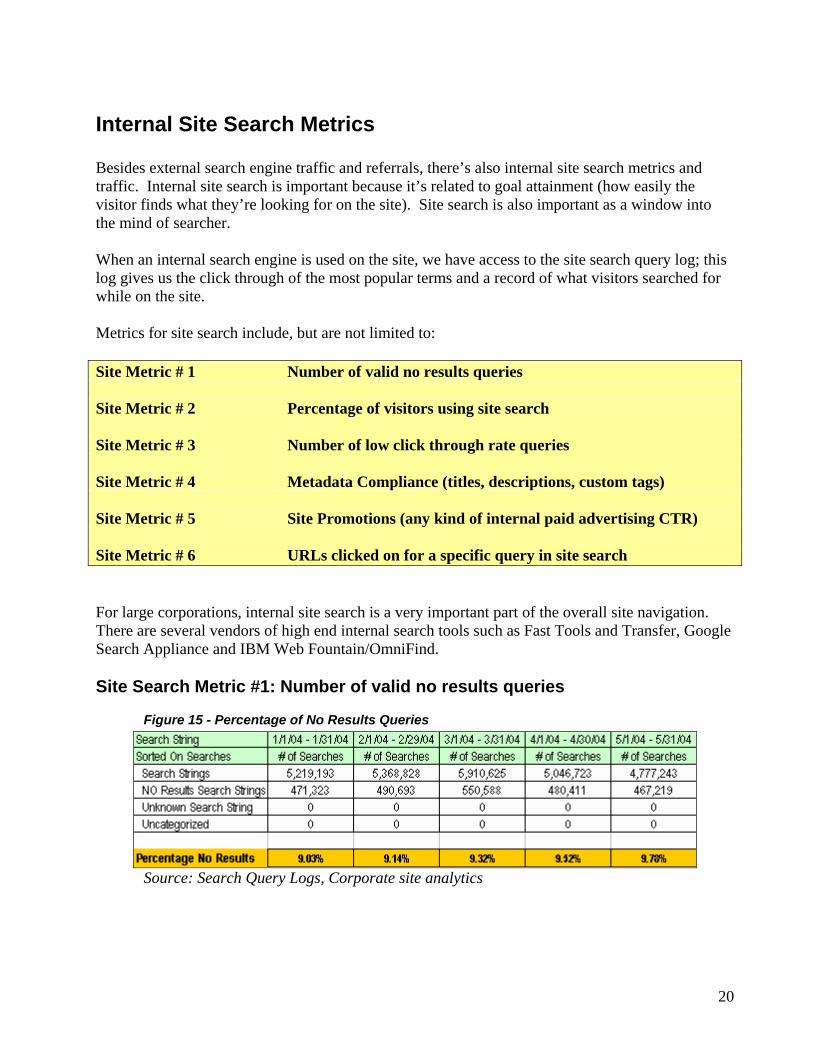
Figure 15 - Percentage of No Results Queries
Source: Search Query Logs, Corporate site analytics
21
The percentage of searches where there are no results went up steadily; in May 04, almost 10% of the internal site search queries had no results. While some of the no results might be misspellings, the majority were valid queries (ie: part numbers) where there was no content on the site. The best solution is to take the top no results queries and generate content (pages) for them on the site, when possible. Keeping the metric low should be a goal of every site that has an internal search engine.
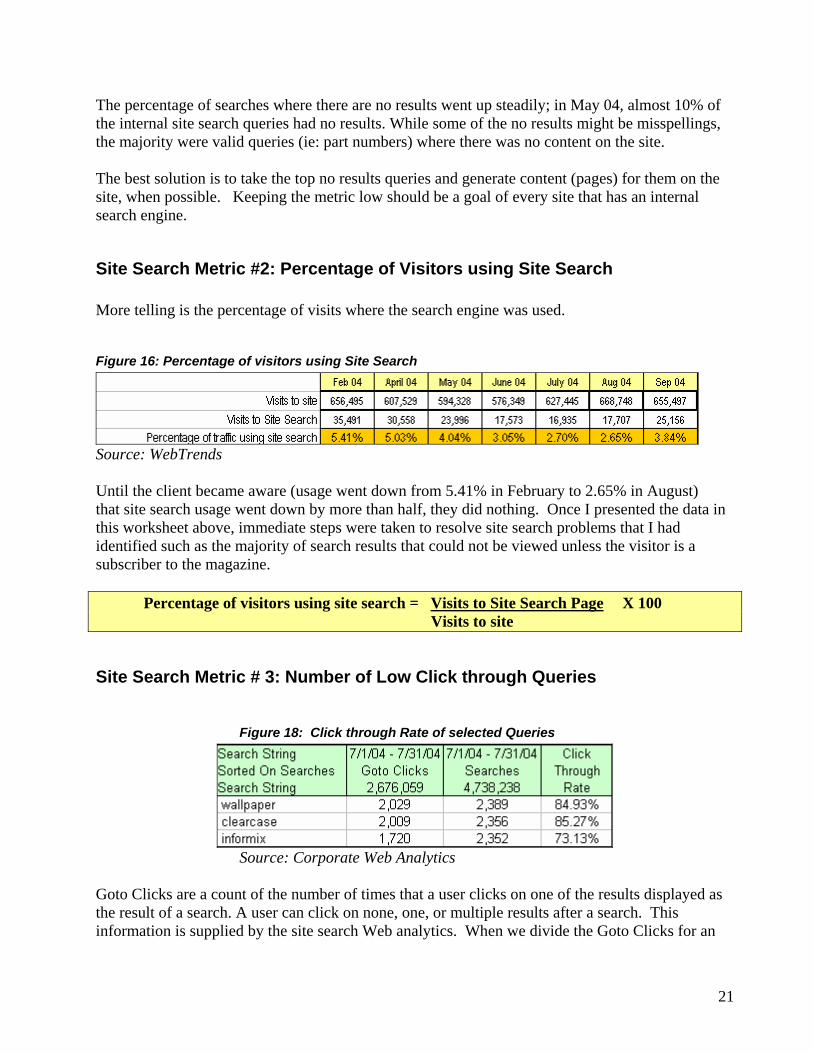
Site Search Metric #2: Percentage of Visitors using Site Search More telling is the percentage of visits where the search engine was used.
Figure 16: Percentage of visitors using Site Search
Source: WebTrends Until the client became aware (usage went down from 5.41% in February to 2.65% in August) that site search usage went down by more than half, they did nothing. Once I presented the data in this worksheet above, immediate steps were taken to resolve site search problems that I had identified such as the majority of search results that could not be viewed unless the visitor is a subscriber to the magazine. Percentage of visitors using site search = Visits to Site Search Page X 100 Visits to site
Site Search Metric # 3: Number of Low Click through Queries
Figure 18: Click through Rate of selected Queries
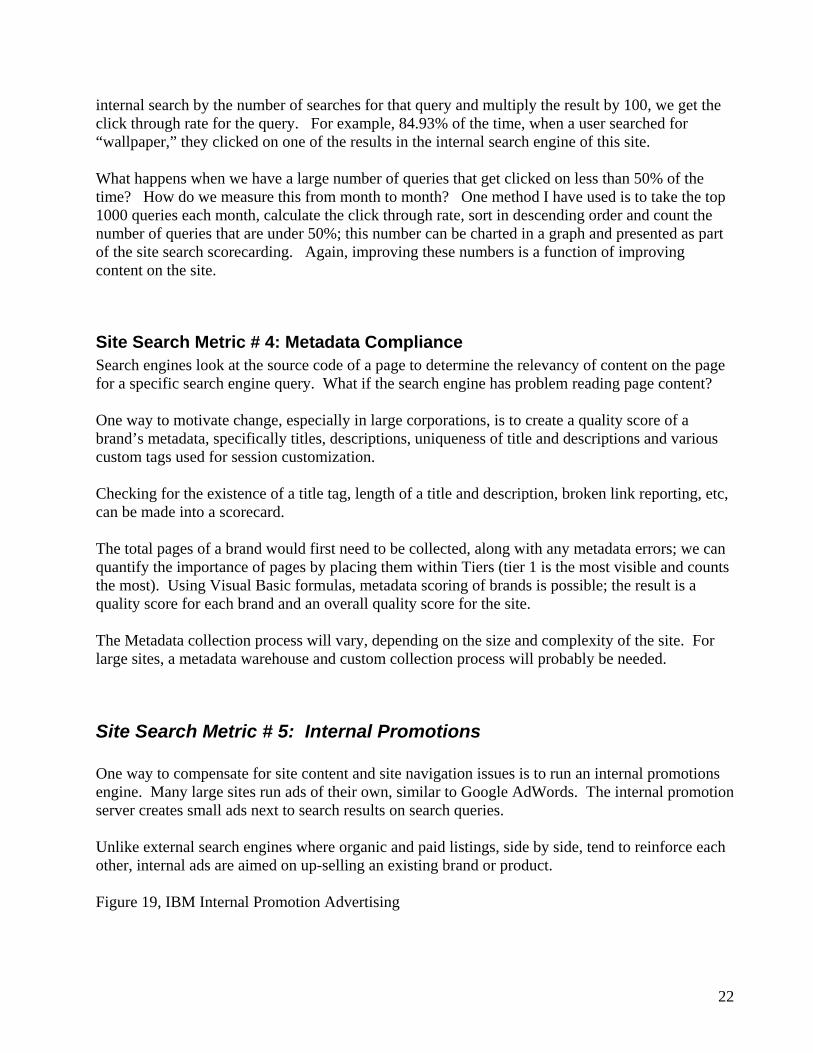
Source: Corporate Web Analytics Goto Clicks are a count of the number of times that a user clicks on one of the results displayed as the result of a search. A user can click on none, one, or multiple results after a search. This information is supplied by the site search Web analytics. When we divide the Goto Clicks for an
22
internal search by the number of searches for that query and multiply the result by 100, we get the click through rate for the query. For example, 84.93% of the time, when a user searched for “wallpaper,” they clicked on one of the results in the internal search engine of this site. What happens when we have a large number of queries that get clicked on less than 50% of the time? How do we measure this from month to month? One method I have used is to take the top 1000 queries each month, calculate the click through rate, sort in descending order and count the number of queries that are under 50%; this number can be charted in a graph and presented as part of the site search scorecarding. Again, improving these numbers is a function of improving content on the site.
Site Search Metric # 4: Metadata Compliance Search engines look at the source code of a page to determine the relevancy of content on the page for a specific search engine query. What if the search engine has problem reading page content? One way to motivate change, especially in large corporations, is to create a quality score of a brand’s metadata, specifically titles, descriptions, uniqueness of title and descriptions and various custom tags used for session customization. Checking for the existence of a title tag, length of a title and description, broken link reporting, etc, can be made into a scorecard. The total pages of a brand would first need to be collected, along with any metadata errors; we can quantify the importance of pages by placing them within Tiers (tier 1 is the most visible and counts the most). Using Visual Basic formulas, metadata scoring of brands is possible; the result is a quality score for each brand and an overall quality score for the site. The Metadata collection process will vary, depending on the size and complexity of the site. For large sites, a metadata warehouse and custom collection process will probably be needed.
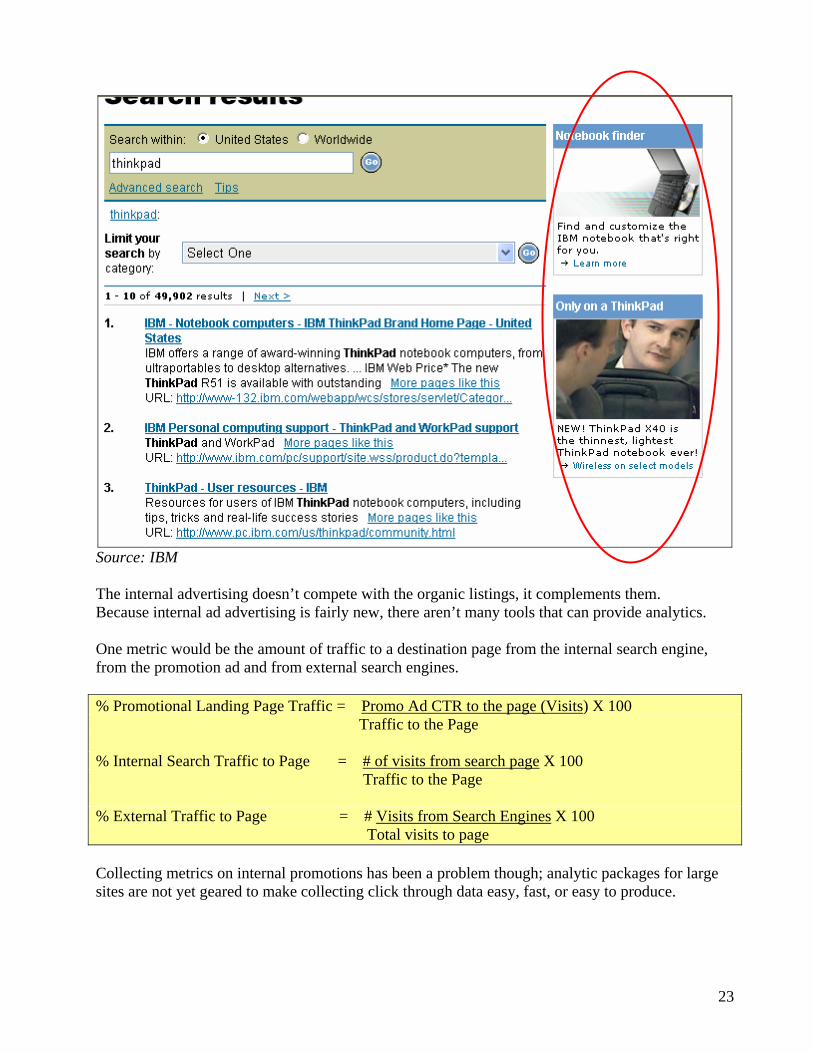
Site Search Metric # 5: Internal Promotions One way to compensate for site content and site navigation issues is to run an internal promotions engine. Many large sites run ads of their own, similar to Google AdWords. The internal promotion server creates small ads next to search results on search queries. Unlike external search engines where organic and paid listings, side by side, tend to reinforce each other, internal ads are aimed on up-selling an existing brand or product. Figure 19, IBM Internal Promotion Advertising
23
Source: IBM The internal advertising doesn’t compete with the organic listings, it complements them. Because internal ad advertising is fairly new, there aren’t many tools that can provide analytics. One metric would be the amount of traffic to a destination page from the internal search engine, from the promotion ad and from external search engines. % Promotional Landing Page Traffic = Promo Ad CTR to the page (Visits) X 100 Traffic to the Page % Internal Search Traffic to Page = # of visits from search page X 100 Traffic to the Page % External Traffic to Page = # Visits from Search Engines X 100 Total visits to page Collecting metrics on internal promotions has been a problem though; analytic packages for large sites are not yet geared to make collecting click through data easy, fast, or easy to produce.
24
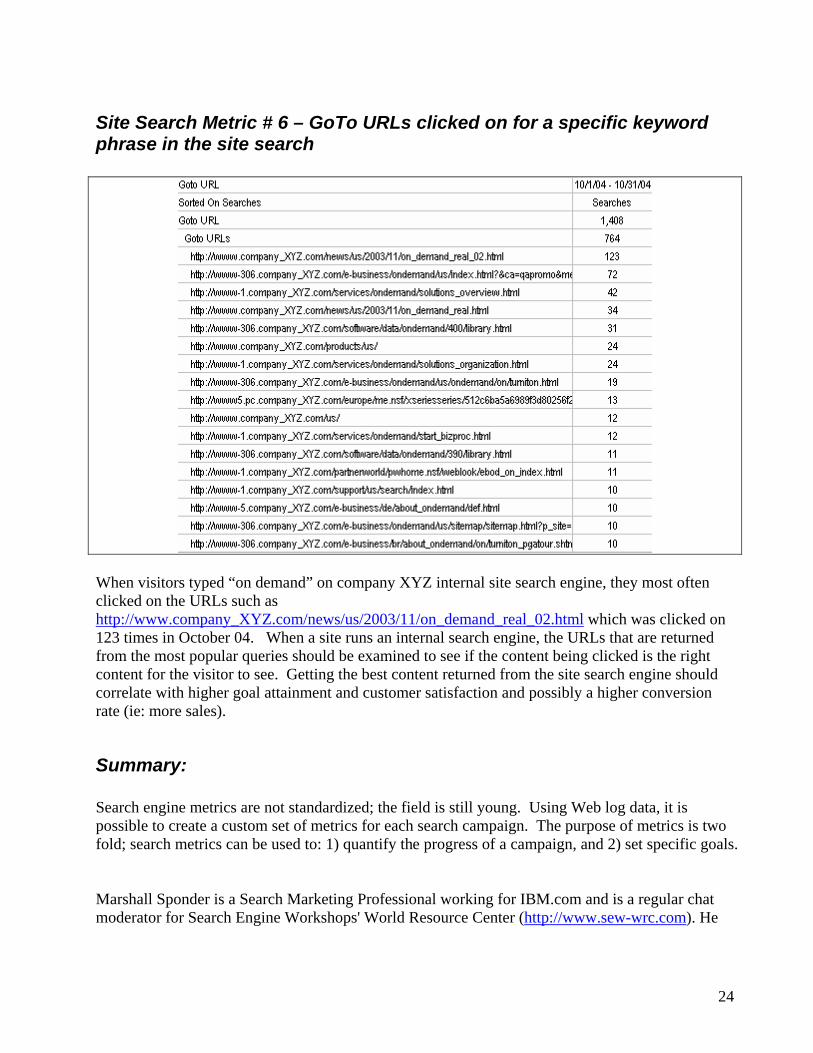
Site Search Metric # 6 – GoTo URLs clicked on for a specific keyword phrase in the site search
When visitors typed “on demand” on company XYZ internal site search engine, they most often clicked on the URLs such as http://www.company_XYZ.com/news/us/2003/11/on_demand_real_02.html which was clicked on 123 times in October 04. When a site runs an internal search engine, the URLs that are returned from the most popular queries should be examined to see if the content being clicked is the right content for the visitor to see. Getting the best content returned from the site search engine should correlate with higher goal attainment and customer satisfaction and possibly a higher conversion rate (ie: more sales).
Summary: Search engine metrics are not standardized; the field is still young. Using Web log data, it is possible to create a custom set of metrics for each search campaign. The purpose of metrics is two fold; search metrics can be used to: 1) quantify the progress of a campaign, and 2) set specific goals. Marshall Sponder is a Search Marketing Professional working for IBM.com and is a regular chat moderator for Search Engine Workshops' World Resource Center (http://www.sew-wrc.com). He

25
specializes in Search Marketing and Optimization, Search Metrics Analysis, Competitive Analysis, Keyword Optimization, Content Analysis and Link Analysis. Mr. Sponder can be reached at Now- SEO (http://www.now-seo.com) and [email protected]. Copyright 2004 Marshall Sponder. All rights reserved.
Recommended