When users search your site, they’re telling you in their own words
what they want from your organization. In Search Analytics for Your Site,
Lou Rosenfeld shows you how to harvest and analyze search query
data to improve your site’s search performance, content, navigation,
metadata, effectiveness, and overall user experience.
“If we all agree that user feedback will improve any site’s user experience, why aren’t we spending more time with the actual words our audience uses when asking us for stuff? I can’t imagine a more experienced guide than Lou Rosenfeld to help us put this amazing data to work.”
JEFFREY VEEN Founder & CEO, Typekit
“Search Analytics for Your Site lays out pretty much everything you need to know to mine your query data and convert it into a positive customer experience.”
ERIC T. PETERSON Founder and Author, Web Analytics Demystified
“Lou Rosenfeld’s Search Analytics for Your Site is a superlative work from the initial story to the final chapter on bridging web analytics and UX practice. Great book!”
CHAUNCEY WILSON Senior Manager, User Research
“This is one of those rare books that makes me pound the table with my fist and yell, ‘Yes! Exactly! Awesome!’ while I’m reading it.”
KRISTINA HALVORSON CEO, Brain Traffic and author, Content Strategy for the Web
www.rosenfeldmedia.com
MORE ON SE ARCH ANALY TICS FOR YOUR SITEwww.rosenfeldmedia.com/books/searchanalytics/
S E A R C H A N A LY T I C S F O R Y O U R S I T E Conversations with Your Customers
b y LO U I S R O S E N F E L D
forewords by Steve Krug and Avinash Kaushik
SEAR
CH
ANALY
TICS FOR
YOU
R SITE
by LOU
IS RO
SENFELD
Table Of Contents ix
TABLE OF CONTENTS
How to Use This Book ivWho Should Read This Book? ivWhat’s in This Book? ivWhat Comes with this Book? v
Frequently Asked Questions viForeword xiv
SECTION ONE Introducing Site Search Analytics
CHAPTER 1How Site Search Analytics Can Save Your Butt 1The Brake Gets Pulled 2The Brake Gets Stuck 3Measuring the Unmeasurable 4The Before-and-After Test 5The Brake Works—
Thanks to Site Search Analytics 9Moral of the Story: Be Like John 12
CHAPTER 2 Site Search Analytics in a Nutshell 13What Is Site Search Analytics? 14Why You’ll Want to Use SSA 16It Always Starts with Data 16George Kingsley Zipf, Harvard Linguist
and Hockey Star 19
x Search Analytics for Your Site
Ways to Use SSA (and This Book) 22What Gets in the Way of SSA? 23Who Is Responsible for SSA? 25Your Secret Weapon 26Summary 32
SECTION TWO Analyzing the Data
CHAPTER 3 Pattern Analysis 33Analysis as a Form of Play 34Getting Started with Pattern Analysis 36Patterns to Consider 40Finding Patterns in the Long Tail 52Anti-Pattern Analysis: Surprises and Outliers 55Summary 60
CHAPTER 4 Failure Analysis 61Study Failure with Care 62Queries That Return Zero Results 63Queries That Fail to Retrieve Useful Results 68Queries That Lead to Immediate Exits from the Site 72Beyond Generic—Evaluating Failures
That Mean the Most 74Summary 77
Table Of Contents xi
CHAPTER 5 Session Analysis 79Learning from Who Searched What and When 80Why Analyze Sessions? 83What’s a Session, Anyway? 83Analyzing a Short Session from TFANet 84Analyzing a Long Session from WW Norton 86Which Sessions Should You Analyze? 89How Granular Are Your Terms? 90Going Beyond Sessions: Looking at
Individual Searchers 92Summary 94
CHAPTER 6 Audience Analysis 95Why Segment Your Audience? 96How to Segment Your Audience 99Comparing and Contrasting Segments 104What’s Next? 106Summary 107
CHAPTER 7 Goal-Based Analysis 109Goal Tracking Is Good, but Search Metrics
Make It Better 110Determining Goals and KPIs 113Summary 119
xii Search Analytics for Your Site
SECTION THREE Improving Your Site
CHAPTER 8 Practical Tips for Improving Search 121Plugging Gaps in Your Search Engine’s Index 122Making Query Entry Easier by Fixing “the Box” 122Accommodating Strange Query Syntax 124Determining What Your Best Bets Should Be 126Helping Searchers Auto-Complete
Their Queries 127Improving a “No Results Found” Page 129Helping Searchers Revise Their Queries to
Get Better Results 130Designing Search Results Around Specialized
Query Types 132Designing Search Results Around Specialized
Content Types 137Summary 142
CHAPTER 9 Practical Tips for Improving Site Navigation and Metadata 143Improving Contextual Navigation for Specific
Content Types 144Creating a Better Site Index 148Testing and Tuning Metadata Values Important 150Summary 154
Table Of Contents xiii
CHAPTER 10 Practical Tips for Improving Content 155Determining Which Content You Should Get Rid of 156Plugging Content Gaps 156Making Relevant Content Even More Relevant 158Expanding Your Understanding of Users’
Content Interests 159Getting Marketing to Do the Right Thing 161Getting Content Owners to Do the Right Thing 162Summary 164
SECTION FOUR Coda
CHAPTER 11 Bridging Web Analytics and User Experience 165Data and Design: Never the Twain Shall Meet 166The Case for Integrated Problem Solving 168Persona Chart:
Steven (Contractor) 173
Creating a Single User Research Brain Within Your Organization 177
Site Search Analytics: The Natural Boundary Object 182
Index 185Acknowledgments 195About the Author 199
14 Chapter 2
What Is Site Search Analytics?
In the last chapter, I showed how Vanguard used (and continues to use) site search analytics to measure, monitor, and optimize its search system’s performance. Not to mention that it improves the overall user
experience, as well as saves money, promotes jobs, and avoids disaster. Now it’s your turn to give it a try. The bulk of this book will teach you the nuts and bolts of SSA. Starting with Chapter 3, “Pattern Analysis,” I’ll show you how to analyze your data, gain actionable insights, and put them to good use so your organization can enjoy some of the same benefits as Vanguard. But before we go deep, we’ll go broad. In this chapter, I’ll briefly cover the nuts-and-bolts aspects of SSA: what it is, how it works, and why you would use it. Think of this chapter as an introduction to SSA in 20 pages or fewer.
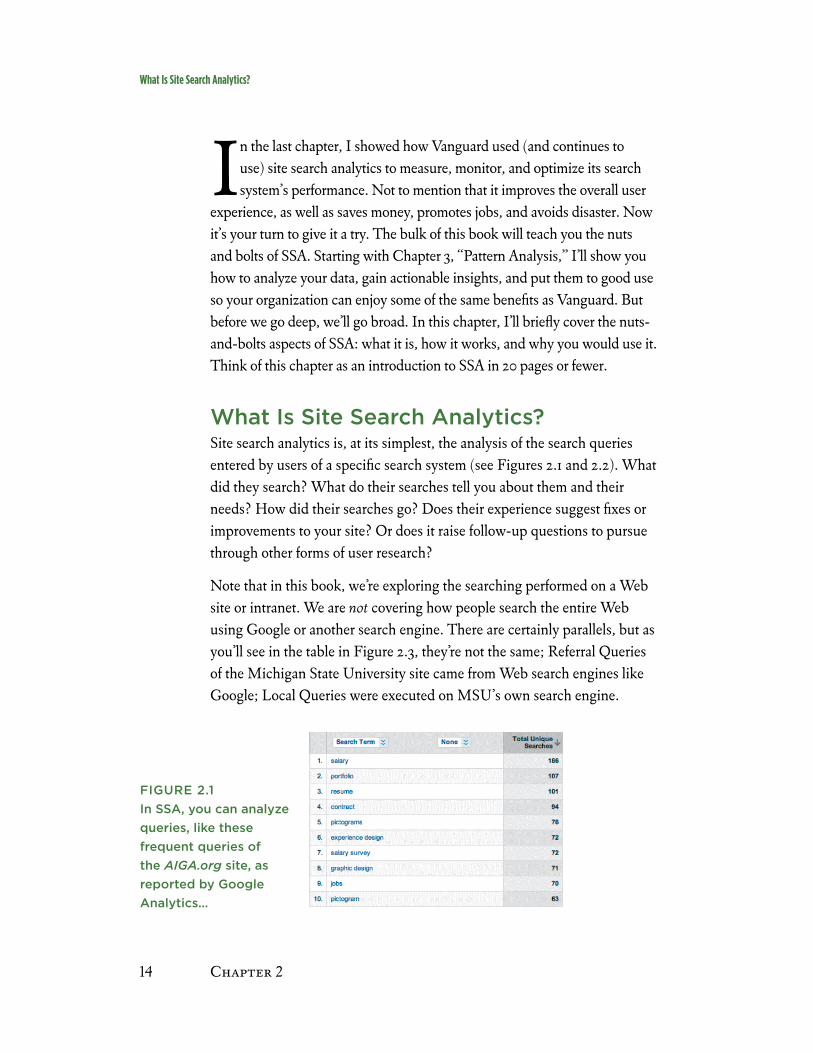
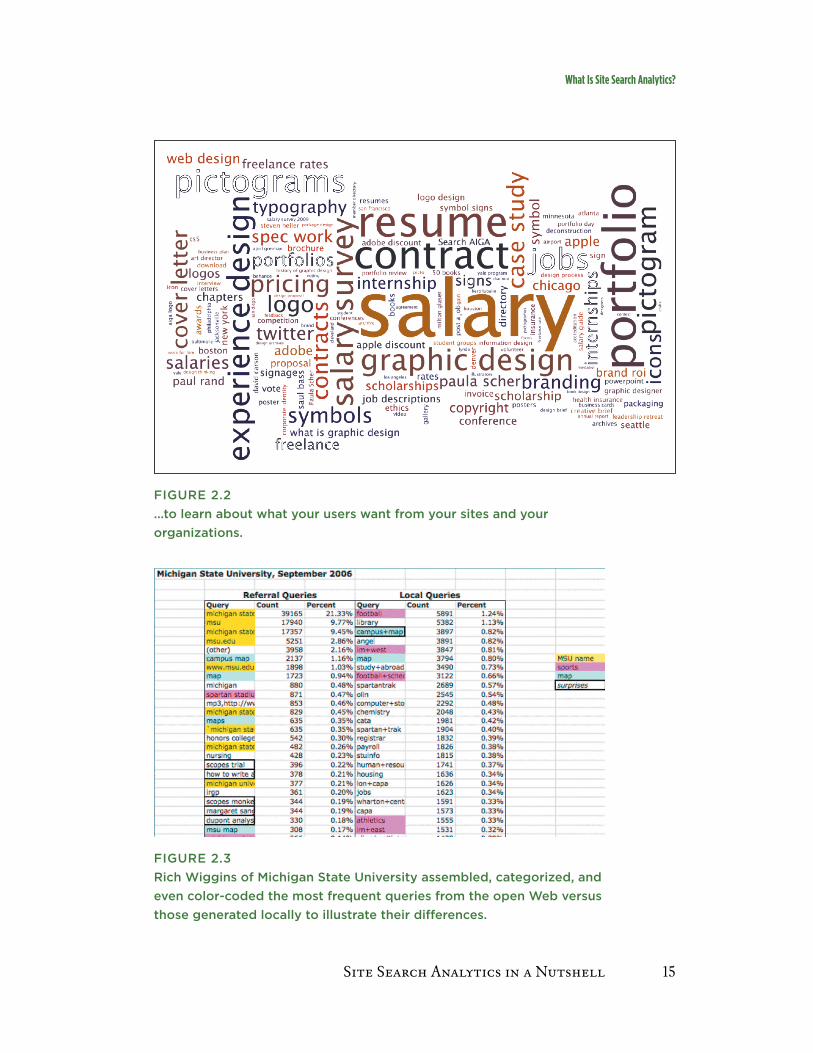
What Is Site Search Analytics?Site search analytics is, at its simplest, the analysis of the search queries entered by users of a specific search system (see Figures 2.1 and 2.2). What did they search? What do their searches tell you about them and their needs? How did their searches go? Does their experience suggest fixes or improvements to your site? Or does it raise follow-up questions to pursue through other forms of user research?
Note that in this book, we’re exploring the searching performed on a Web site or intranet. We are not covering how people search the entire Web using Google or another search engine. There are certainly parallels, but as you’ll see in the table in Figure 2.3, they’re not the same; Referral Queries of the Michigan State University site came from Web search engines like Google; Local Queries were executed on MSU’s own search engine.
FIGURE 2.1In SSA, you can analyze queries, like these frequent queries of the AIGA.org site, as reported by Google Analytics…
Site Search Analytics in a Nutshell 15
What Is Site Search Analytics?
FIGURE 2.2...to learn about what your users want from your sites and your organizations.
FIGURE 2.3Rich Wiggins of Michigan State University assembled, categorized, and even color-coded the most frequent queries from the open Web versus those generated locally to illustrate their di"erences.
16 Chapter 2
What Is Site Search Analytics?! !Why You’ll Want to Use SSA! !It Always Starts with Data
Unlike people searching the Web, your site’s searchers typically have more specific needs. They also may be familiar with your organization, its products, and its content—after all, they had to find their way to your site in order to use its search system. So the knowledge you’ll glean from SSA will be a bit different than (and complementary to) what you’ll learn from SEO (Search Engine Optimization) and SEM (Search Engine Marketing). Consider this analogy: if people searching the Web are essentially the leads you want to attract, people searching your site are the customers you hope to retain.
Why You’ll Want to Use SSA SSA is unique: there truly is nothing like studying what people want from your site. It should be in your research toolkit—not by itself, mind you—but there’s no reason for it not to be there, unless your site somehow doesn’t have a search system.
There are plenty of ways you can track and learn from users’ behaviors aside from SSA. For example, if you’re a web analytics person, you might rely on clickstream analysis; if you’re a user researcher, perhaps you perform eye-tracking studies. They’ll all tell you something about user intent.
But none of these methods will tell you what users want in their own words. SSA provides an unmatched trove of semantic richness—not just what users want, but the tone and flavor of the language they use to express those needs. And it’s without the biases introduced by testing and a lab environment. Plus, you have the data already. You certainly won’t find it anywhere else or acquire it any other way.
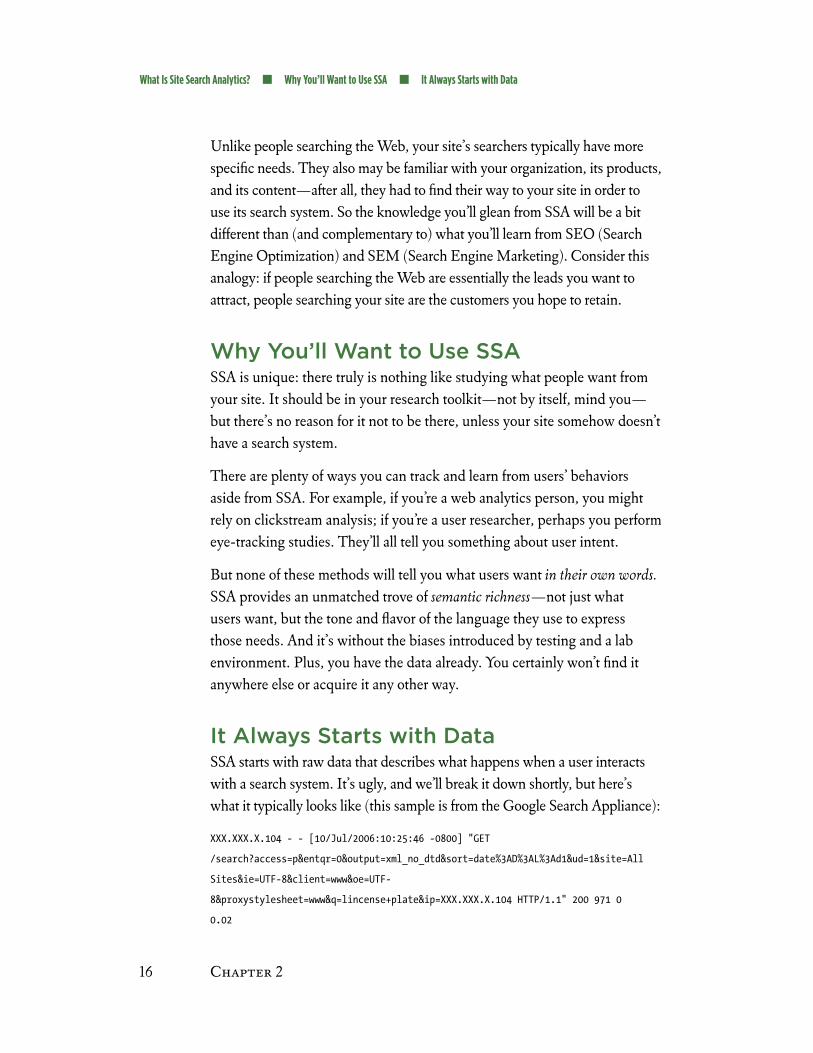
It Always Starts with Data SSA starts with raw data that describes what happens when a user interacts with a search system. It’s ugly, and we’ll break it down shortly, but here’s what it typically looks like (this sample is from the Google Search Appliance):
XXX.XXX.X.104 - - [10/Jul/2006:10:25:46 -0800] “GET
/search?access=p&entqr=0&output=xml_no_dtd&sort=date%3AD%3AL%3Ad1&ud=1&site=All
Sites&ie=UTF-8&client=www&oe=UTF-
8&proxystylesheet=www&q=lincense+plate&ip=XXX.XXX.X.104 HTTP/1.1” 200 971 0
0.02
Site Search Analytics in a Nutshell 17
It Always Starts with Data
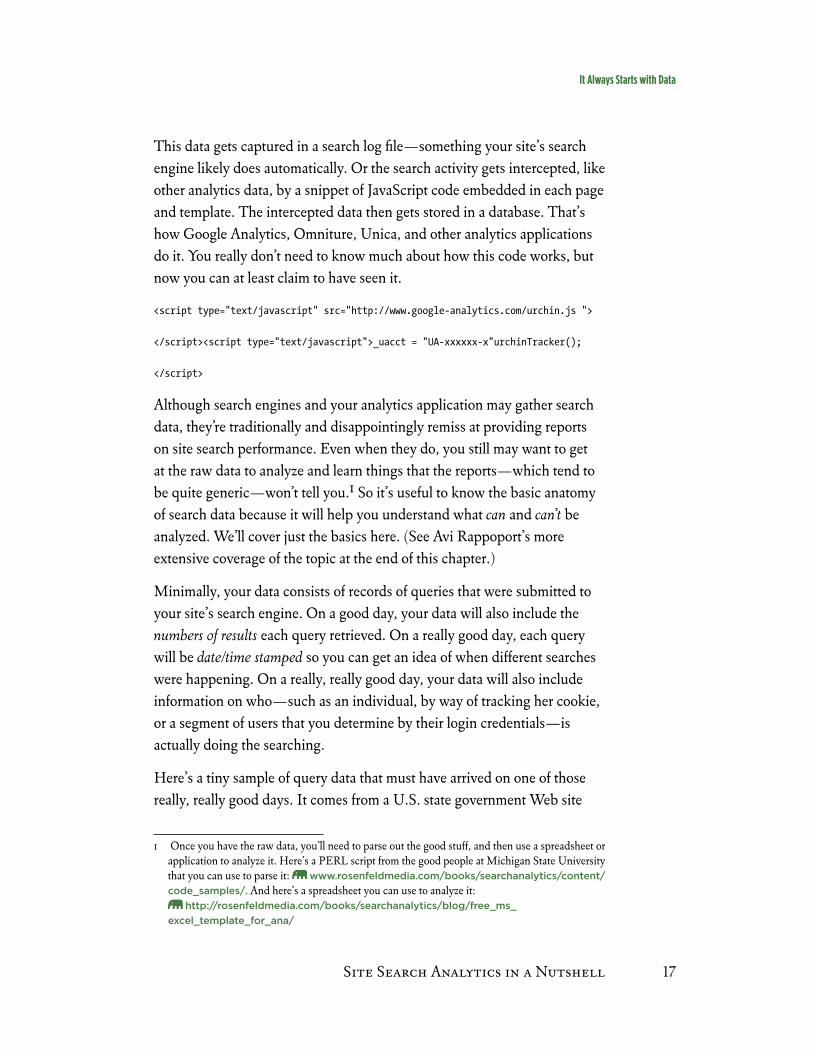
This data gets captured in a search log file—something your site’s search engine likely does automatically. Or the search activity gets intercepted, like other analytics data, by a snippet of JavaScript code embedded in each page and template. The intercepted data then gets stored in a database. That’s how Google Analytics, Omniture, Unica, and other analytics applications do it. You really don’t need to know much about how this code works, but now you can at least claim to have seen it.
<script type=”text/javascript” src=”http://www.google-analytics.com/urchin.js “>
</script><script type=”text/javascript”>_uacct = “UA-xxxxxx-x”urchinTracker();
</script>
Although search engines and your analytics application may gather search data, they’re traditionally and disappointingly remiss at providing reports on site search performance. Even when they do, you still may want to get at the raw data to analyze and learn things that the reports—which tend to be quite generic—won’t tell you.1 So it’s useful to know the basic anatomy of search data because it will help you understand what can and can’t be analyzed. We’ll cover just the basics here. (See Avi Rappoport’s more extensive coverage of the topic at the end of this chapter.)
Minimally, your data consists of records of queries that were submitted to your site’s search engine. On a good day, your data will also include the numbers of results each query retrieved. On a really good day, each query will be date/time stamped so you can get an idea of when different searches were happening. On a really, really good day, your data will also include information on who—such as an individual, by way of tracking her cookie, or a segment of users that you determine by their login credentials—is actually doing the searching.
Here’s a tiny sample of query data that must have arrived on one of those really, really good days. It comes from a U.S. state government Web site
1 Once you have the raw data, you’ll need to parse out the good stuff, and then use a spreadsheet or application to analyze it. Here’s a PERL script from the good people at Michigan State University that you can use to parse it: www.rosenfeldmedia.com/books/searchanalytics/content/code_samples/. And here’s a spreadsheet you can use to analyze it:
http://rosenfeldmedia.com/books/searchanalytics/blog/free_ms_ excel_template_for_ana/
18 Chapter 2
It Always Starts with Data
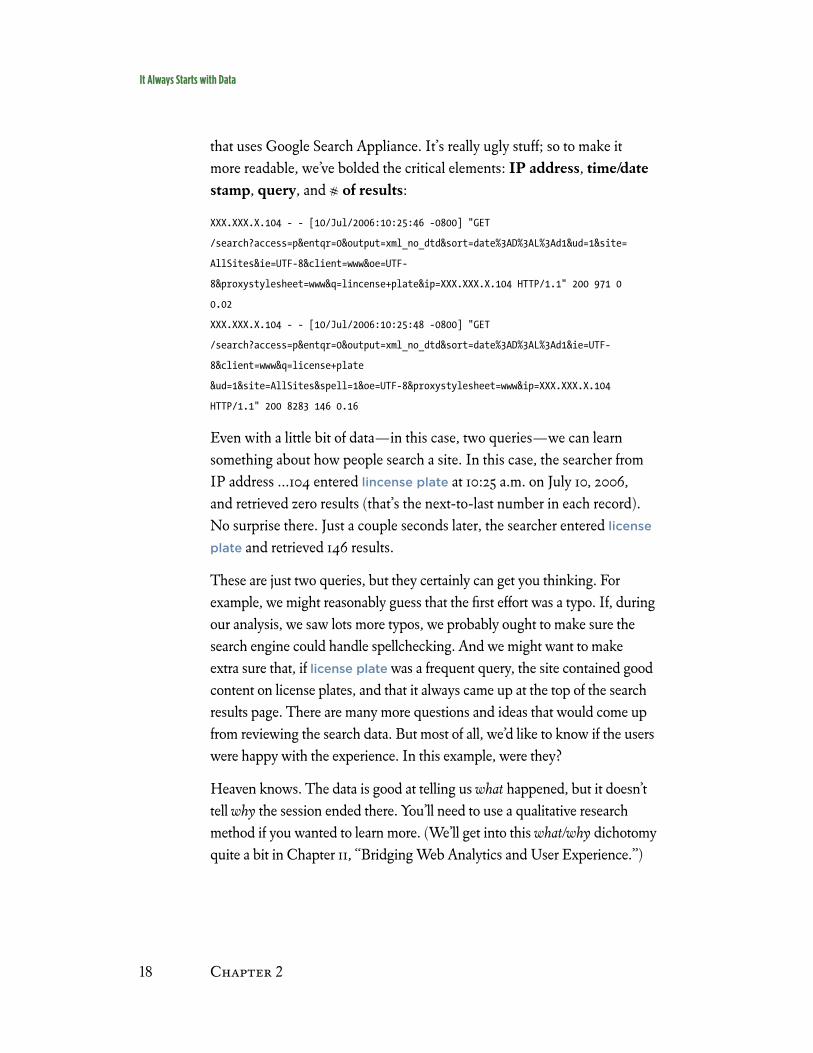
that uses Google Search Appliance. It’s really ugly stuff; so to make it more readable, we’ve bolded the critical elements: IP address, time/date stamp, query, and # of results:
XXX.XXX.X.104 - - [10/Jul/2006:10:25:46 -0800] “GET
/search?access=p&entqr=0&output=xml_no_dtd&sort=date%3AD%3AL%3Ad1&ud=1&site=
AllSites&ie=UTF-8&client=www&oe=UTF-
8&proxystylesheet=www&q=lincense+plate&ip=XXX.XXX.X.104 HTTP/1.1” 200 971 0
0.02
XXX.XXX.X.104 - - [10/Jul/2006:10:25:48 -0800] “GET
/search?access=p&entqr=0&output=xml_no_dtd&sort=date%3AD%3AL%3Ad1&ie=UTF-
8&client=www&q=license+plate
&ud=1&site=AllSites&spell=1&oe=UTF-8&proxystylesheet=www&ip=XXX.XXX.X.104
HTTP/1.1” 200 8283 146 0.16
Even with a little bit of data—in this case, two queries—we can learn something about how people search a site. In this case, the searcher from IP address …104 entered lincense plate at 10:25 a.m. on July 10, 2006, and retrieved zero results (that’s the next-to-last number in each record). No surprise there. Just a couple seconds later, the searcher entered license
plate and retrieved 146 results.
These are just two queries, but they certainly can get you thinking. For example, we might reasonably guess that the first effort was a typo. If, during our analysis, we saw lots more typos, we probably ought to make sure the search engine could handle spellchecking. And we might want to make extra sure that, if license plate was a frequent query, the site contained good content on license plates, and that it always came up at the top of the search results page. There are many more questions and ideas that would come up from reviewing the search data. But most of all, we’d like to know if the users were happy with the experience. In this example, were they?
Heaven knows. The data is good at telling us what happened, but it doesn’t tell why the session ended there. You’ll need to use a qualitative research method if you wanted to learn more. (We’ll get into this what/why dichotomy quite a bit in Chapter 11, “Bridging Web Analytics and User Experience.”)
Site Search Analytics in a Nutshell 19
It Always Starts with Data! !George Kingsley Zipf, Harvard Linguist and Hockey Star
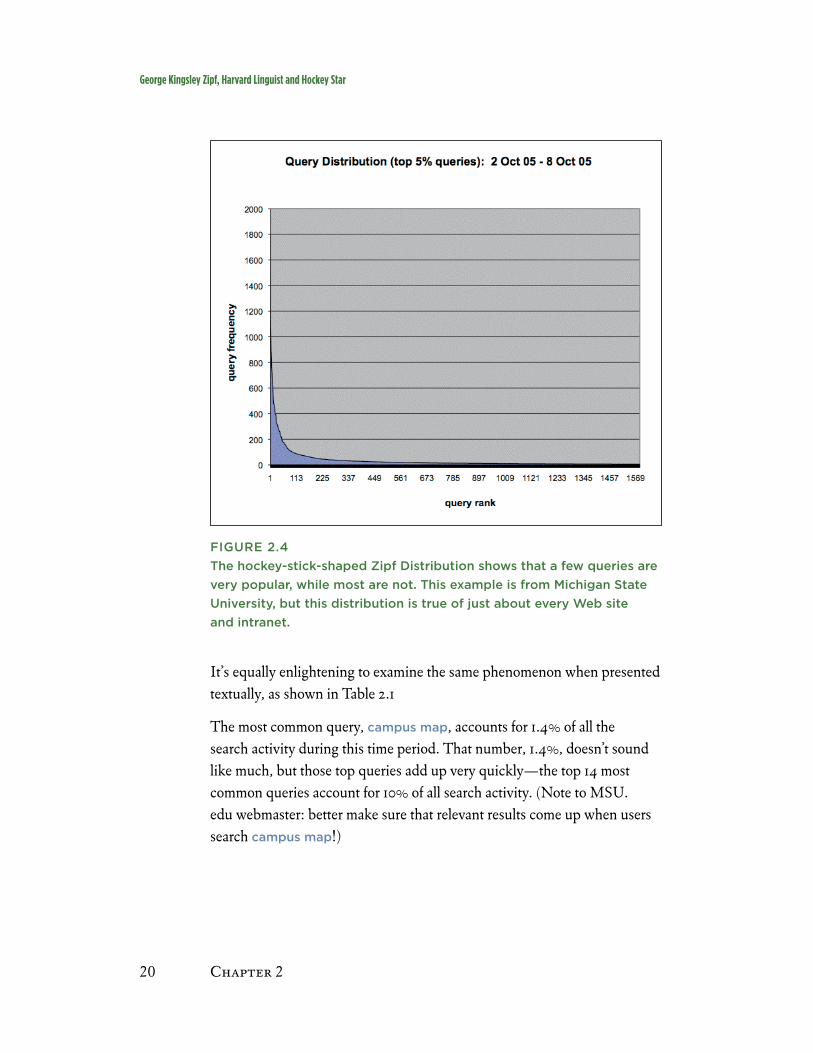
George Kingsley Zipf, Harvard Linguist and Hockey Star Of course, we’ve just been looking at a tiny slice of a search log. And as interesting as it is, the true power of SSA comes from collectively analyzing the thousands or millions of such interactions that take place on your site during a given period of time. That’s when the patterns emerge, when trends take shape, and when there’s enough activity to merit measuring—and drawing interesting conclusions.
Nowhere is the value of statistical analysis more apparent than when viewing the Zipf Distribution, named for Harvard linguist George Kingsley Zipf, who, as you’d expect from a linguist, liked to count words.2 He found that a few terms were used quite often, while many were hardly used at all. We find the same thing when tallying up queries from most to least frequent, as in Figure 2.4.
The Zipf distribution—which emerges when tallying just about any site’s search data—shows that the few most common queries account for a surprisingly large portion of all search activity during any given period. (Remember in Chapter 1, “How Search Site Analytics Can Save Your Butt,” how John Ferrara focused exclusively on those common queries.) You can see how tall and narrow what we’ll call the “short head” is, and how quickly it drops down to the “long tail” of esoteric queries (technically, described as “twosies” and “onesies”). In fact, we’re only showing the first 500 or so queries here; in reality, this site’s long tail would extend into the tens of thousands, many meters to the right of where you sit.
2 You may not have heard of Zipf, but you’ve probably heard of the 80/20 Rule, the Pareto Principle, or Power Laws. All relate to the hockey-stick curve’s dramatic dropoff from “short head” to long tail.
20 Chapter 2
George Kingsley Zipf, Harvard Linguist and Hockey Star
FIGURE 2.4 The hockey-stick-shaped Zipf Distribution shows that a few queries are very popular, while most are not. This example is from Michigan State University, but this distribution is true of just about every Web site and intranet.
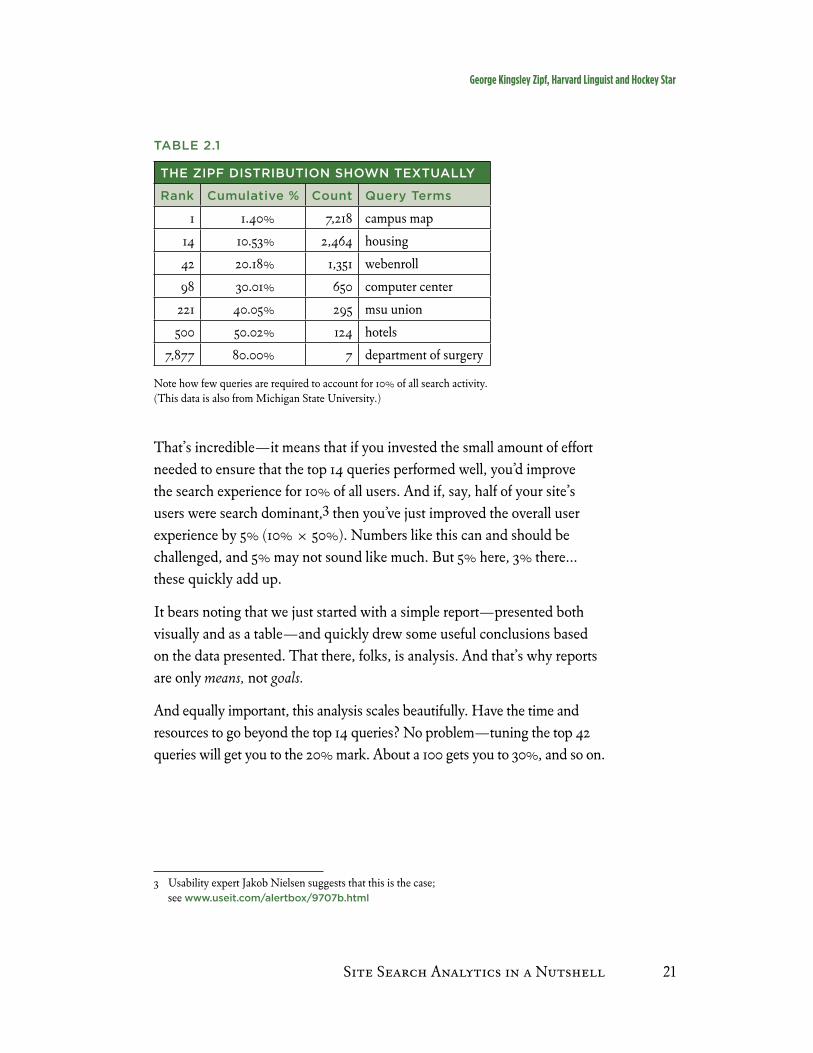
It’s equally enlightening to examine the same phenomenon when presented textually, as shown in Table 2.1
The most common query, campus map, accounts for 1.4% of all the search activity during this time period. That number, 1.4%, doesn’t sound like much, but those top queries add up very quickly—the top 14 most common queries account for 10% of all search activity. (Note to MSU.edu webmaster: better make sure that relevant results come up when users search campus map!)
Site Search Analytics in a Nutshell 21
George Kingsley Zipf, Harvard Linguist and Hockey Star
TABLE 2.1
THE ZIPF DISTRIBUTION SHOWN TEXTUALLY
Rank Cumulative % Count Query Terms
1 1.40% 7,218 campus map
14 10.53% 2,464 housing
42 20.18% 1,351 webenroll
98 30.01% 650 computer center
221 40.05% 295 msu union
500 50.02% 124 hotels
7,877 80.00% 7 department of surgery
Note how few queries are required to account for 10% of all search activity. (This data is also from Michigan State University.)
That’s incredible—it means that if you invested the small amount of effort needed to ensure that the top 14 queries performed well, you’d improve the search experience for 10% of all users. And if, say, half of your site’s users were search dominant,3 then you’ve just improved the overall user experience by 5% (10% ! 50%). Numbers like this can and should be challenged, and 5% may not sound like much. But 5% here, 3% there… these quickly add up.
It bears noting that we just started with a simple report—presented both visually and as a table—and quickly drew some useful conclusions based on the data presented. That there, folks, is analysis. And that’s why reports are only means, not goals.
And equally important, this analysis scales beautifully. Have the time and resources to go beyond the top 14 queries? No problem—tuning the top 42 queries will get you to the 20% mark. About a 100 gets you to 30%, and so on.
3 Usability expert Jakob Nielsen suggests that this is the case; see www.useit.com/alertbox/9707b.html
22 Chapter 2
Ways to Use SSA (and This Book)
Ways to Use SSA (and This Book)So what’s the message here? That SSA is an incredibly important tool for helping you understand what users want from your site. And once you have a sense of what they want, you can evaluate and improve all sorts of things that are there to help users get what they want. For instance, you can improve your site as follows:
• Search system: SSA will help you understand how people entered searches, where they were when they entered them, and how they interpreted the search results. (We cover this in Chapter 8, “Practical Tips for Improving Search.”)
• Navigation and metadata: Do certain pages generate a lot more search activity than others? What kinds of searches? And does this suggest that certain navigational options are missing or labeled in a confusing way? SSA will also give you tips on how to shore up your site’s navigation and metadata. (We cover this in Chapter 9, “Practical Tips for Improving Site Navigation and Metadata.”)
• Content: For example, you can study queries that retrieve zero results. Is this because there isn’t content on the topic? Should there be? Or is the relevant content mistitled? Or poorly written? SSA will help you determine what content is missing and what to do to existing content to make sure it gets found. (We cover this in Chapter 10, “Practical Tips for Improving Content.”)
Whatever design challenges you face, SSA—like any other data analysis—will back up your design decisions with actual facts.
Of course, as much as you’d like to make users happy, you also have to make your employers happy. They have goals—for your organization and for the site itself. (They ought to, at least.) These can be expressed and measured as KPI—Key Performance Indicators. The types of search-related metrics that you saw in Chapter 1 can serve as components to these KPIs—in fact, many organizations that are otherwise sophisticated in their measurement of performance often fall down when it comes to measuring
Site Search Analytics in a Nutshell 23
Ways to Use SSA (and This Book)! !What Gets in the Way of SSA?
findability. In Chapter 3, we’ll help you do what John Ferrara did: use goal-based analysis to measure, monitor, and optimize performance, again and again.
Finally, there are some other important ways to analyze search data:
• Pattern analysis: What patterns emerge when you “play” with the data? Can you use those patterns to determine what types of metadata and content are the most important to your searchers? Can you detect changes in seachers’ behavior and needs that are seasonal? Do you also find instructive surprises and outliers? (We cover this in Chapter 3, “Pattern Analysis.”)
• Failure analysis: When searches return no results—or poor results—what can we learn? And what can we do to fix those problems and improve performance? (We cover this in Chapter 4, “Failure Analysis.”)
• Session analysis: What happens during a specific search session? How do searchers’ needs and understanding of the content change as they search? (We cover this in Chapter 5, “Session Analysis.”)
• Audience analysis: How might we uncover the differences between audience segments and their information needs? And how might we better address those differing needs? (We cover this in Chapter 6, “Audience Analysis.”)
What Gets in the Way of SSA? So you’re wondering: if SSA is so valuable, why don’t you hear more about it? And why haven’t you been taking advantage of it?
There are a few predictable and mostly mundane reasons, such as the following:
• Lack of awareness: The idea has been around for years, but so was the Web before it took off. There’s simply a lack of critical mass behind SSA getting more attention; hence this book.
Recommended