Scleraxis and Transcription Factor 15 expression in the failing
myocardium
by
Krista L. Filomeno
A Thesis submitted to the Faculty of Graduate Studies of
The University of Manitoba
In partial fulfilment of the requirements of the degree of
MASTER OF SCIENCE
Department of Physiology and Pathophysiology
University of Manitoba
Winnipeg
Copyright © 2018 by Krista L. Filomeno

i
Abstract
There is still no specific treatment for fibrosis, a common co-morbidity to many
cardiovascular diseases. We examined the association in expression of the pro-fibrotic
protein scleraxis and its paralog transcription factor 15 (TCF15), with the myofibroblast
marker α-smooth muscle actin (α-SMA), after myocardial infarction (MI) in an
experimental model in vivo. Echocardiography revealed that the hearts of the post-infarct
rats were in a state of systolic dysfunction across all time points. Left (infarcted scar and
non-infarcted) and right cardiac ventricles from male Sprague-Dawley rats were obtained
at 2-4 days and 1-8 weeks post-MI. Western blot analysis shows that scleraxis, TCF15
and α-SMA is all increased within the infarct scar in all stages of wound healing
compared to sham-operated controls. Thus, scleraxis and TCF15 are co-expressed in the
infarct scar of post-MI hearts. Using one of these proteins as a biological target for
possible treatments may serve to limit cardiac fibrosis.
ii
Acknowledgements
First I would like to thank my supervisor Dr. Ian Dixon, for his support and
guidance not only through my training as an MSc student, but also through the years
leading up to it. My training with Ian started more than a decade ago, when I came to his
lab as a summer student after my first year at Red River College. It was in Ian’s lab that I
gained the basic skills for benchtop work and the passion for basic research which led me
on the path that I am on today. I probably would not have pursued graduate studies if not
for his encouragement during this critical point in my scientific education.
I would also like to thank my co-advisor Dr. Michael Czubryt, for his support
throughout my studies and for welcoming me into his lab for collaboration in his research
area. Over the years Mike has ensured that I felt included in lab projects and that I had
the resources I needed for success. He made sure I knew that the molecular tools in his
lab were always available to me, and has challenged me to look further than the benchtop
and to view my project from a wider perspective.
I would also like to thank the members of my committee: Dr. Elissavet Kardami,
Dr. Todd Duhamel and Dr. Barbara Triggs-Raine, for their invaluable insight and
recommendations regarding my project and for encouraging me to think critically within
my area of study.
I would also like to acknowledge both past and present members of our laboratory
throughout my training from a summer student through graduate school. Specifically, I
thank Dr, Aran Dangerfield, Kristen Bedosky and Dr. Ryan Cunnington for teaching me
foundational skills on which I’ve built my scientific career; Sunil Rattan for his technical
iii
expertise in experimental design, troubleshooting experiments and for his assistance in
excising tissue from post-surgery animals; Natalie Landry for her assistance in
troubleshooting experiments as well as teaching me bioinformatics not found in
textbooks; Mark Hnatowich for his wit and for allowing me to learn and explore the
fundamentals of genetics also not found in textbooks; Nikita Sarangal for her assistance
in data collection over the last summer; Dr. Matthew Zeglinski, Dr. Shivika Gupta, Dr.
Morvarid Kavosh, Dr. Jared Davies for just being there and making the difficult days a
little brighter. Everyone’s friendship and support throughout my education was
invaluable, I couldn’t have made it to where I am today without them.
And finally, I would like to thank my family and my husband Roland, for their
emotional support and endless supply of hugs through one diploma and two degrees.

iv
Table of Contents
List of Figures ................................................................................................................................. vi
List of Tables .................................................................................................................................. vi
List of Abbreviations ..................................................................................................................... vii
Literature Review............................................................................................................................. 1
Ischemic Heart Disease Etiology and Prevalence ........................................................................ 1
Cardiovascular Wound Healing and Fibrosis .............................................................................. 3
Myocardial Infarction .................................................................................................................. 5
Heart Failure ................................................................................................................................ 7
Extracellular Matrix ..................................................................................................................... 9
Cardiac Fibroblasts and Myofibroblasts .................................................................................... 10
α-Smooth Muscle Actin ............................................................................................................. 16
Canonical TGF-β Signaling ....................................................................................................... 17
Scleraxis ..................................................................................................................................... 20
Transcription Factor 15 .............................................................................................................. 21
Rationale and Hypothesis .............................................................................................................. 25
Materials and Methodology ........................................................................................................... 28
In Vivo Myocardial Infarction Model ........................................................................................ 28
Echocardiography ...................................................................................................................... 28
Tissue Collection ....................................................................................................................... 29
Protein Isolation from Frozen Tissue ......................................................................................... 29
Preparation of Luria-Bertani (LB) Broth ................................................................................... 30
Preparation of Scleraxis pcDNA Glycerol Stocks ..................................................................... 30
Isolation of pcDNA Vector from Glycerol Stocks ..................................................................... 35
Start-up of Cell Lines from Frozen Stocks ................................................................................ 35
Cell Passaging ............................................................................................................................ 36
Tranfection of pcDNA in HEK 293A Cells ............................................................................... 36
Protein Isolation from 6-Well Plates .......................................................................................... 37
Protein Assay ............................................................................................................................. 38
Western Analysis ....................................................................................................................... 38

v
Statistical analysis ...................................................................................................................... 40
Echocardiography of sham and post-infarction rat hearts ......................................................... 41
α-Smooth Muscle Actin is increased within the infarct scar area in vivo .................................. 41
Overexpression of scleraxis using a pcDNA vector to validate the use of a commercial
scleraxis antibody....................................................................................................................... 45
Scleraxis expression is increased in scar and infarct areas within the left ventricle, as well as
remote regions of the heart, as compared to sham-operated controls in vivo ............................ 47
TCF15 expression is increased in scar and infarct areas within the left ventricle, as well as
remote regions of the heart, as compared to sham-operated controls in vivo ............................ 50
Discussion ...................................................................................................................................... 53
Future Directions ........................................................................................................................... 62
References ...................................................................................................................................... 64
vi
List of Figures
Figure 1. Fibroblast activation to myofibroblast; transition overview ........................................... 15
Figure 2. Canonical TGF-β1 signaling cascade and crosstalk with scleraxis ................................. 19
Figure 3. Clade A of the human bHLH phylogenetic tree ............................................................. 23
Figure 4. mRNA expression of TCF15 compared to other myofibroblast markers ....................... 24
Figure 5. Gene map of the pReceiver-M12 clone with the hSCX insert ....................................... 33
Figure 6. Gene map of the empty pcDNA3 vector ........................................................................ 34
Figure 7. Assessment of cardiac function of post-MI and sham-operated animals at different time
points .............................................................................................................................................. 42
Figure 8. Expression of α-smooth muscle actin in the RV, LV, non-infarcted viable and infarct
scar tissues of the infarcted rat heart .............................................................................................. 44
Figure 9. Validation of the commercially available antibody for scleraxis ................................... 46
Figure 10. Expression of scleraxis in the infarcted rat heart .......................................................... 49
Figure 11. Expression of transcription factor 15 (TCF15) in the infarcted rat heart ..................... 52
Figure 12. Comparison of scleraxis antibodies .............................................................................. 61
List of Tables

vii
Table 1. Antibodies for Western analysis………………………………………………………………….…40
viii
List of Abbreviations
A560 Absorbance at 560 nm
ACE Inhibitors Angiotensin Converting Enzyme Inhibitors
AEBSF 4-(2-Aminoethyl) Benzenesulfonyl Fluoride Hydrochloride
ANOVA Analysis of Variance
ANP Atrial Natriuretic Peptide
AT1 Angiotensin Receptor Type 1
ATP Adenosine Triphosphate
BCA Bicinchoninic Acid
bHLH Basic Helix-Loop-Helix
BMP4 Bone Morphogenic Protein 4
BNP Brain Natriuretic Peptide
BSA Bovine Serum Albumin
CABG Coronary Artery Bypass Graft
cAMP Cyclic Adenosine Monophosphate
CCN2, CTGF Connective Tissue Growth Factor
CVD Cardiovascular Disease
DDW Double Distilled Water
DMEM Dulbecco’s Modified Eagle’s Medium
DNA Deoxyribonucleic Acid
E-box Enhancer Box
ECG Echocardiogram

ix
ECM Extracellular Matrix
EDA-FN Extra Domain A-Containing Fibronectin
EDTA Ethylene Diamine Tetraacetic Acid
eGFP Enhanced Green Fluorescent Protein
EGTA Ethylene Glycol-Bis(β-animoethyl ether)-N, N, N’, N’-Tetraacetic Acid
ELISA Enzyme Linked Immunosorbent Assay
ET-1 Endothelin-1
F-Actin Filamentous Actin
FAP Fibroblast Activation Protein
FBS Fetal Bovine Serum
FDA Food and Drug Administration
FGF-2 Fibroblast Growth Factor-2
G-Actin Globular Actin
HEK Human Embryonic Kidney
HFmrEF Heart Failure with Mid-Range Ejection Fraction
HFpEF Heart Failure with Preserved Ejection Fraction
HFrEF Heart Failure with Reduced Ejection Fraction
hSCX Human Scleraxis
IFN-γ Interferon-Gamma
IGF-1 Insulin-Like Growth Factor-1
IL-10 Interleukin-10
IL-13 Interleukin-13
IL-1β Interleukin-1beta

x
IL-4 Interleukin-4
IL-6 Interleukin-6
LAD Left Anterior Descending
LAP Latency Associated Protein
LB Broth Luria-Bertani Broth
LDL Low Density Lipoproteins
LPS Lipopolysaccharides
LTBP-1 Latent TGFβ Binding Protein 1
LV Left Ventricle
LVEF Left Ventricular Ejection Fraction
MI Myocardial Infarction
MMP Matrix Metalloproteinase
MRTF Myocardin Related Transcription Factor
NFATc Nuclear Factor of Activated T-Cells
NSTEMI Non-ST-Elevated Myocardial Infarction
NYHA New York Heart Association
ORF Open Reading Frame
PBS Phosphate-buffered Saline
PCI Percutaneous Coronary Intervention
PCR Polymerase Chain Reaction
PI3K Phosphoinositide-3 Kinase
PIIINP N-Terminal Propeptide of Type III Collagen
PINP N-Terminal Propeptide of Type I Collagen

xi
PKCε Protein Kinase C Epsilon
PLC Phospholipase C
RIPA Radioimmunoprecipitation Assay
RV Right Ventricle
SDS Sodium Dodecyl-Sulfate
SDS-PAGE Sodium Dodecyl-Sulfate -Polyacrylamide Gel Electrophoresis
SERCA Sarco/Endo-plasmic Reticulum Calcium ATPase
SOP Standard Operating Procedure
STEMI ST-Elevated Myocardial Infarction
TAE Buffer Tris-Acetate-EDTA Buffer
TBS Tris-buffered Saline
TCF15 Transcription Factor 15
TGFβ Transforming Growth Factor Beta
TIMP Tissue Inhibitor of Matrix Metalloproteinase
Tmp Tropomyosin
TNFα Tumor Necrosis Factor Alpha
TβRI Transforming Growth Factor Beta Receptor 1
TβRII Transforming Growth Factor Beta Receptor 2
WHO World Health Organization
α-SMA Alpha-Smooth Muscle Actin

1
Literature Review
Ischemic Heart Disease Etiology and Prevalence
In 2013, cardiovascular disease (CVD) was globally the most common cause of
death, accounting for 31.5% of total deaths, with ischemic heart disease being the leading
cause of death in this category [1, 2]. The direct cost of cardiovascular and
cerebrovascular disease in the United States was 189.7 billion dollars in 2012 to 2013 [1].
The world health organization (WHO) estimates that global cardiovascular deaths, with
ischemic heart disease still being the top cause of death, will reach 23.4 million people by
2030 [2]. Their plan to combat this rise in CVD is to map and monitor this epidemic,
reduce the exposure to risk factors and to facilitate equitable health care for people
already living with this condition [3]. Some examples of reducing the exposure to risk
factors include reducing the affordability of tobacco products by raising taxes, creating
by law completely smoke free environments, restricting or banning alcohol
advertisements, increasing taxes on alcoholic beverages, promoting breastfeeding, and
implementing public awareness programs on diet and physical activity [4, 5]. Although
there are cost-effective medications to manage CVD, they are still unaffordable for much
of the world’s population [1]. There is an overwhelming need for more research in this
area to establish more efficient therapies than those that are currently in use.
Atherosclerosis, the pathology in which blood vessels are significantly narrowed
due to the formation of plaque deposits, is the underlying cause of ischemic heart disease
and cerebrovascular disease [3]. In the early stages of atherosclerosis, low density
lipoproteins (LDL) are internalized in the intima and the extracellular matrix of large

2
arteries, where they become oxidized. Circulating monocytes are recruited to the area
where they differentiate into macrophages, while platelets start to adhere to the
thrombogenic area and release pro-inflammatory factors to recruit leukocytes to the
intima of the vessel. Macrophages internalize oxidized LDLs and become foam cells,
which make up fatty streaks. As this process persists, the macrophages become apoptotic
and release cholesterol into the vessel walls. The accumulation of cholesterol and
inflammatory cells along with the activation of the coagulation cascade by platelets is
what generates the thrombus, occluding the arteries and reducing blood flow (as reviewed
in [6]). Risk factors that promote atherosclerosis include tobacco use, physical inactivity,
excessive alcohol consumption, poor diet, hypertension, diabetes, blood cholesterol
levels, obesity, sex, age and genetic predisposition [3].
As the pathology progresses and blood flow to the heart is limited, the
environment of the heart becomes ischemic. If ischemia due to an incomplete blockage is
sustained for a long period of time, myocytes may undergo cell death due to a lack of
oxygen and nutrients and a myocardial infarction occurs. Myocardial infarction due to
ischemia via a complete arterial blockage is more common [7]. When blood flow is
restored to the myocardium (reperfusion), an essential step for heart survival, some
undesirable effects can also occur including increases in oxidative stress, inflammation
and injury to the heart muscle and microvasculature. This is termed ischemia-reperfusion
injury [8].

3
Cardiovascular Wound Healing and Fibrosis
Post-myocardial infarction, wound healing is divided into 3 stages; early response
or inflammation, proliferation and maturation of the scar. In the inflammatory phase,
leukocytes and neutrophils are recruited to the area of injury so that they may clear the
area of dead cells and debris [9, 10]. When debris removal is completed, cells of the
innate immune response undergo apoptosis, which are in turn are cleared by macrophages
[11, 12]. There are two types of macrophages; M1 and M2 macrophages. Macrophages
are stimulated to polarize into the M1 type by pro-inflammatory factors and cytokines,
and they clear the area of debris [13]. Examples of these pro-inflammatory factors
include tumor necrosis factor-α (TNFα), Interferon-γ (IFN-γ), Lipopolysaccharides
(LPS), interleukin-1β (IL-1β) and interleukin-6 (IL-6) [14, 15]. This stimulates the
macrophages to secrete factors such as Interleukin-10 (IL-10) and TGFβ into the
extracellular space, thereby stimulating M1 macrophages to convert to M2 macrophages,
which are anti-inflammatory and work to inhibit inflammation and to stimulate
fibroblasts to start the proliferation phase [11-13, 16]. Other factors that stimulate M1
macrophages to polarize into their M2 form include interleukin-13 (IL-13) and
interleukin-4 (IL-4) [15]. During the proliferation phase, fibroblasts migrate to the area of
injury and become activated to transition into myofibroblasts by phenoconversion. In the
area of injury, myofibroblasts secrete collagens and other extracellular matrix
components to produce a scar [9]. It has been the long-standing hypothesis that the
population of fibroblasts that become activated and participate in remodeling arise from a
variety of sources; resident cardiac fibroblasts, fibrocytes, and endothelial cells. Using
genetic lineage tracing, A relatively recent study found that resident fibroblasts already

4
present in the heart are the main source of myofibroblasts remodeling the heart after
injury, due to both an infarction or pressure overload [17]. When scar formation is
complete, myofibroblasts are removed from the area via apoptosis and collagens within
the scar cross-link in the maturation phase [16]. This is an example of asymmetrical
remodeling, where the left ventricular ejection fraction is directly proportional to the size
of the infarct area [18]. Pathological wound healing may occur when myofibroblasts fail
to be removed from the infarcted area. This results in excessive amounts of scar tissue
being deposited into the area in a process called fibrosis [9, 19].
Aside from ischemic heart disease; fibrosis within the interstitial spaces can be
caused by hypertension, valvular disease, arrhythmias and cardiomyopathies [20, 21]. In
these disease states, ventricular hypertrophy occurs as a compensatory mechanism to
pressure or mechanical overload [18, 22]. When the heart is experiencing pressure
overload, such as with chronic hypertension, ventricular wall stress is increased. The
thickness of the ventricular wall is increased by concentric hypertrophy, a widening of
the cardiomyocytes, in an attempt to minimize the increase in wall stress. When the heart
is experiencing mechanical or volume overload, such as with valvular disease, the
volume of the ventricular chamber is increased by eccentric hypertrophy; a lengthening
of the cardiomyocytes to help the heart compensate for the increased volume it must
pump out. The onset of myocardial hypertrophy is accompanied with an increase to the
surrounding extracellular matrix to support the growth of the cardiomyocytes, a process
that is physiologically distinct from the pathological over-production of ECM, termed
fibrosis (as reviewed in [23]). As the chamber dilates and the chamber radius increases,
the wall stress of the ventricle also increases. This is an example of symmetrical
5
remodeling, occurring throughout the whole hypertrophied ventricle [18]. The onset of
fibrosis may begin when hypertrophy reaches a pathological state and usually starts to
form around the vasculature, particularly around those which experience high pressures
like arterioles and metarterioles. The microvasculature in fibrotic areas is decreased 2-3
times. As interstitial fibrosis progresses, it may cause ischemic remodeling and an infarct
area in the absence of ischemic heart disease [20]. Excessive wound healing and
remodeling in all its forms stiffens the walls of the heart, reduces tissue compliance and
impedes its function, ultimately resulting in heart failure [24, 25].
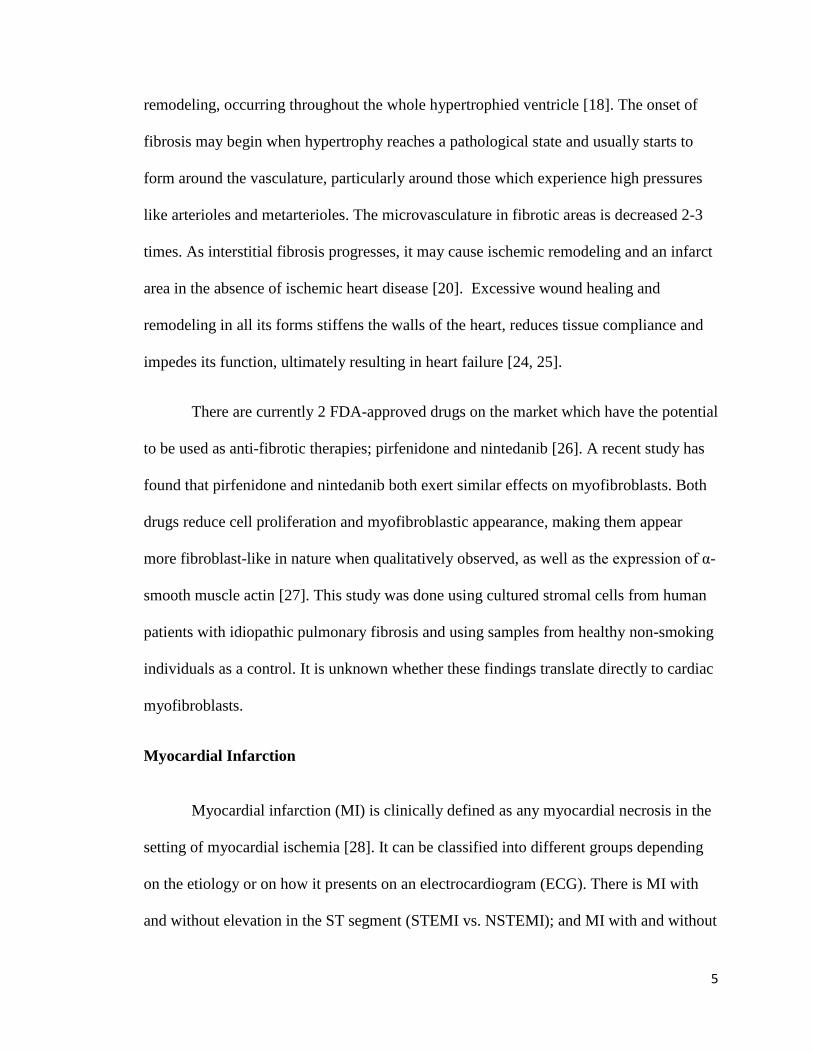
There are currently 2 FDA-approved drugs on the market which have the potential
to be used as anti-fibrotic therapies; pirfenidone and nintedanib [26]. A recent study has
found that pirfenidone and nintedanib both exert similar effects on myofibroblasts. Both
drugs reduce cell proliferation and myofibroblastic appearance, making them appear
more fibroblast-like in nature when qualitatively observed, as well as the expression of α-
smooth muscle actin [27]. This study was done using cultured stromal cells from human
patients with idiopathic pulmonary fibrosis and using samples from healthy non-smoking
individuals as a control. It is unknown whether these findings translate directly to cardiac
myofibroblasts.
Myocardial Infarction
Myocardial infarction (MI) is clinically defined as any myocardial necrosis in the
setting of myocardial ischemia [28]. It can be classified into different groups depending
on the etiology or on how it presents on an electrocardiogram (ECG). There is MI with
and without elevation in the ST segment (STEMI vs. NSTEMI); and MI with and without

6
a Q-wave (Qwave MI vs. non-Q MI) [29]. Myocardial infarction with ST-segment
elevation (STEMI) accounts for 25-40% of all MI cases [30]. The clinical classifications
by etiology type have 5 different classes. MI type I is due to ischemia caused by
atherosclerotic plaques. MI type II is due to ischemia due to increased oxygen demand or
decreased oxygen supply [31]. A recent case report by Kulathunga et al reports
development of a myocardial infarction in a healthy 21 year old male with no risk factors
for coronary artery disease. Their group found that the infarction was caused by the
epinephrine administered as a treatment for anaphalaxis, which caused an α-receptor
mediated coronary vasospasm [32]. MI type III is a sudden cardiac death that is found to
be caused by myocardial ischemia in the post-mortem examination. And types IV and V
MI is procedure-related MI, due to ischemia caused by percutaneous coronary
intervention (PCI) and coronary artery bypass grafting (CABG) respectively [31].
Symptoms of myocardial ischemia include upper extremity discomfort that is not
localized or positional, dyspnea, fatigue, diaphoresis (sweating), nausea and syncope.
However myocardial ischemia may also present as asymptomatic and is often
misdiagnosed [33]. When treating patients for MI, the goal is to decrease the time from
onset of symptoms to reperfusion as much as possible to preserve as much myocardial
tissue as possible and to limit the size of the infarct area [34]. The INTERHEART study
found that globally, the risk factors for acute MI remain consistent over many different
regions. The populations in each single region consisted of both sexes with median ages
between 52 and 63. The risk factors they outline are; abnormal lipids, smoking,
hypertension, diabetes, abdominal obesity, psychosocial factors, consumption of fruits
and vegetables (or lack thereof), consumption of alcohol and the amount of physical

7
activity done by the individual [35]. Lower socioeconomic status has been associated
with higher rates of STEMI. This has been attributed to higher rates of smoking and
obesity within the population group [36]. Conversely, the study published by Figtree et
al. indicates that 25% of STEMI patients did not have any of the modifiable risk factors
taken into account by the Framingham risk score, a commonly used scoring system to
predict a patient’s risk for coronary heart disease over the next 10 years [37, 38]. This
disparity in the literature not only underlines the importance of the study of the different
types of myocardial infarction individually, but alludes to the fact that the classes of MI
are different enough to warrant their own clinical treatment protocol. Many STEMI
patients suffer from atrial fibrillation, left ventricular systolic dysfunction or diastolic
dysfunction, which inevitably will be the cause of acute heart failure [39-41].
Heart Failure
Heart failure reflects the inability of the heart to meet functional demands and is
characterized by enlargement of the ventricle, a decline in left ventricular ejection
fraction and peak oxygen consumption and an intolerance to exercise. To compensate for
the lack of oxygen and nutrient delivery to the tissues of the body, sympathetic nervous
stimulation to the heart increases, the Frank-Starling mechanism is activated and left
ventricular remodeling occurs (as reviewed in [18]). In end-stage heart failure, the patient
experiences fatigue and dyspnea upon exertion, edema in the lower limbs and diminished
left ventricular function [42]. This disease state occurs when the heart is injured, but also
may be due to the age of the patient. There are three distinct phenotypes of heart failure
classified by left ventricular ejection fraction (LVEF). A LVEF of 50% or higher is
classified as heart failure with preserved ejection fraction (HFpEF) [43]. HFpEF is

8
usually due to hypertensive or valvular disease, and approximately half of all heart failure
cases fall into this category [44, 45]. Though HFpEF can develop into heart failure with
reduced ejection fraction (HFrEF), these two categories of heart failure are distinct
phenotypes [46]. HFpEF is more prevalent in women and generally has a higher rate of
survival [47, 48]. Physiological characteristics include cardiomyocyte hypertrophy and
interstitial fibrosis [46]. Calcium channel blockers and anticoagulants are used to treat
patients in this category [45]. A LVEF below 40% is classified as heart failure with
reduced ejection fraction (HFrEF) [43]. HFrEF usually develops following a myocardial
infarction, myocarditis or any pathology leading to a large loss of the cardiomyocyte
population [46]. It has a lower rate of survival, leads to more hospitalizations and is
characterized by pathological ventricular remodeling and impaired cell metabolism [46,
49]. It is treated with the use of angiotensin converting enzyme (ACE) inhibitors and β1-
adrenergic receptor antagonists (β-blockers) [45]. Serum BNP levels are higher in
patients with HFrEF compared to HFpEF patients, making it a possible biomarker for this
mode of heart failure [46]. A new classification of heart failure is emerging in the
literature: heart failure with mid-range ejection fraction (HFmrEF). Patients with a LVEF
between 40% and 49% are diagnosed with HFmrEF [43]. Patients that present with
HFmrEF have a phenotype that is a combination of the HFpEF and HFrEF phenotype.
The mortality rate is similar to that of HFpEF and the etiology is similar to that of HFrEF.
HFmrEF patients typically have less advanced heart failure syndrome than HFrEF
patients [50]. To date this mode of heart failure is only of theoretical importance and has
not been assigned its own plan of treatment [43].

9
Extracellular Matrix
The extracellular matrix (ECM) provides the scaffold for organ structure,
facilitates force transmission and even participates in signaling cascades for both
cardiomyocytes and non-cardiomyocytes [51]. It is composed of water, proteins and
polysaccharides, though its molecular composition changes from tissue to tissue [52]. In
the heart; non-fibrillar collagens, such as collagen IV, organize the basement membrane
[53, 54]. The main structural components to the ECM are fibrillar collagens, fibronectin
and laminins [53, 55]. Collagen I and III are the most highly expressed fibrillar collagens
in the cardiac ECM. Collagen I is found within the epimysium and the perimysium,
surrounding the bundles of cardiac muscle, while collagen III is found within the
endomysium surrounding individual cardiomyocytes [51]. Fibronectin is a glycoprotein
that is secreted into the matrix in an inactivated form and only becomes activated when it
interacts with integrins. It assembles ECM proteins and is involved in attachment of cells
to the matrix. Though it is present throughout the cardiac matrix in healthy normally
functioning tissue, fibronectin expression increases in areas undergoing active
inflammation and wound healing [52, 56]. Laminin is a glycoprotein and a major
constituent of the basement membrane surrounding cardiomyocytes. It is capable of
interacting with collagen IV, integrins and dystroglycans. It is involved in a multitude of
cellular processes including cell adhesions, differentiation, migration and resistance to
apoptotic cell death [56]. The ECM is also comprised of matricellular proteins, non-
structural matrix proteins that are involved in cell signal transduction. Members of the
CCN family (such as CCN2 or Connective tissue growth factor (CTGF)), periostin and
osteopontin are examples of important matricellular proteins in the heart [53]. Periostin

10
is a non-structural ECM protein that is secreted by cardiac fibroblasts into the matrix at
low levels and can interact with integrins, mediating cell migration [57, 58]. Upon
myocardial injury, periostin expression is upregulated in areas of active repair and is
positively correlated to myocardial fibrosis in humans [58, 59]. CTGF is highly expressed
in the developing heart, and is upregulated in response to injury [60]. It mediates
myocardial fibrosis by stimulating cardiac fibroblast activation, and it is involved in
cellular adhesions and proliferation as well as the production of ECM proteins [60, 61].
Osteopontin is a matrix protein found in bone, but it is also expressed by macrophages
upon myocardial damage and it is a mediator of the innate immune response, the body’s
non-specific response to foreign pathogens [62-64]. The ECM does not stay in a steady-
state; it is a dynamic tissue that is continuously degraded, deposited and remodeled by the
work of resident fibroblasts [65, 66]. The dysregulation of this process leads to adverse
cardiac remodeling and impaired cardiac function, the basis of many disease states [65].
Cardiac Fibroblasts and Myofibroblasts
Cardiac fibroblasts are mesenchymal cells that arise from T-box transcription
factor 18 positive (Tbx18+) progenitor cells within the proepicardial organ during
organogenesis [67, 68]. Their main purpose is to produce and maintain the extracellular
matrix in the heart [66]. They perform this duty by secreting matrix metalloproteinases
(MMPs) to breakup old matrix proteins, then secreting tissue inhibitors of MMPs
(TIMPs) as they synthesize and release new matrix proteins as a replacement. Fibroblasts
function to maintain homeostasis and to ensure stable turnover of matrix components, so
that there is no net reduction or excess production of the matrix [69]. Even though
cardiomyocytes make up the majority of cell mass in the heart, cardiac fibroblasts for a
11
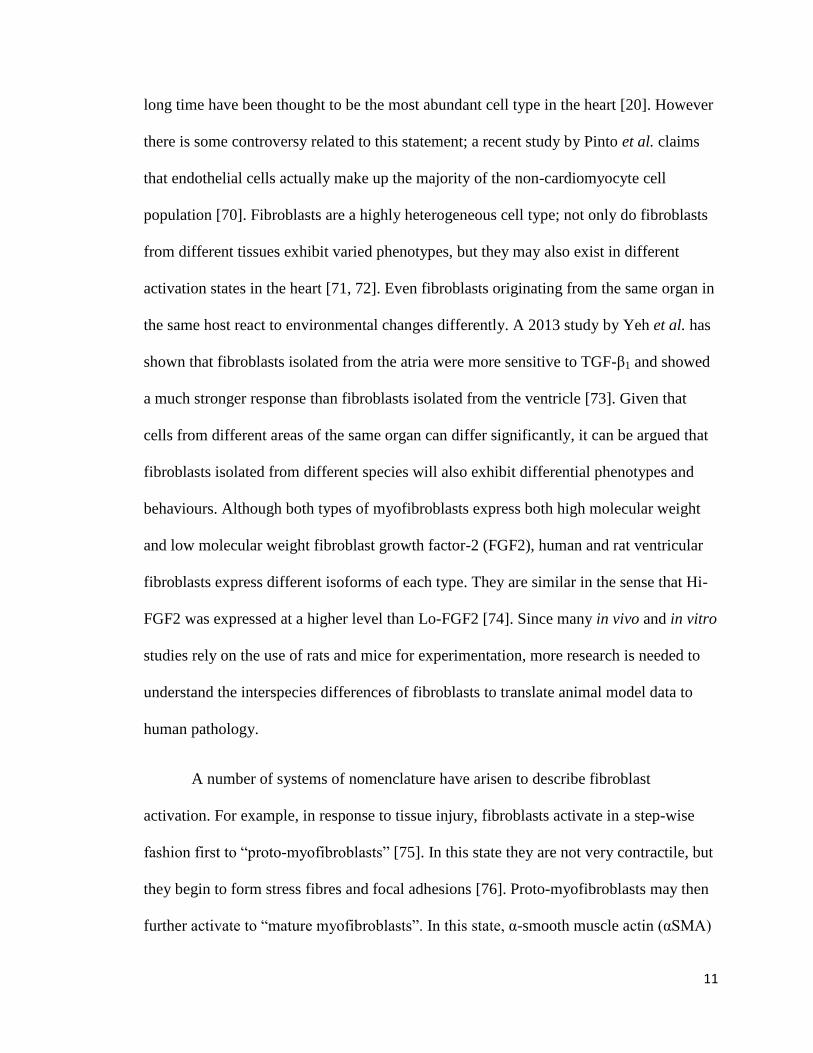
long time have been thought to be the most abundant cell type in the heart [20]. However
there is some controversy related to this statement; a recent study by Pinto et al. claims
that endothelial cells actually make up the majority of the non-cardiomyocyte cell
population [70]. Fibroblasts are a highly heterogeneous cell type; not only do fibroblasts
from different tissues exhibit varied phenotypes, but they may also exist in different
activation states in the heart [71, 72]. Even fibroblasts originating from the same organ in
the same host react to environmental changes differently. A 2013 study by Yeh et al. has
shown that fibroblasts isolated from the atria were more sensitive to TGF-β1 and showed
a much stronger response than fibroblasts isolated from the ventricle [73]. Given that
cells from different areas of the same organ can differ significantly, it can be argued that
fibroblasts isolated from different species will also exhibit differential phenotypes and
behaviours. Although both types of myofibroblasts express both high molecular weight
and low molecular weight fibroblast growth factor-2 (FGF2), human and rat ventricular
fibroblasts express different isoforms of each type. They are similar in the sense that Hi-
FGF2 was expressed at a higher level than Lo-FGF2 [74]. Since many in vivo and in vitro
studies rely on the use of rats and mice for experimentation, more research is needed to
understand the interspecies differences of fibroblasts to translate animal model data to
human pathology.
A number of systems of nomenclature have arisen to describe fibroblast
activation. For example, in response to tissue injury, fibroblasts activate in a step-wise
fashion first to “proto-myofibroblasts” [75]. In this state they are not very contractile, but
they begin to form stress fibres and focal adhesions [76]. Proto-myofibroblasts may then
further activate to “mature myofibroblasts”. In this state, α-smooth muscle actin (αSMA)

12
is incorporated into their stress fibres and they are highly contractile [71, 77]. There is an
increase in expression of focal adhesion proteins (EDA-fibronectin, paxillin, tensin), an
increase in collagen synthesis, and a decrease in cell motility (Figure 1) [71]. The
fibroblast to myofibroblast transition, or fibroblast activation, is mediated through a
multitude of different mechanisms. The most widely studied mediator of myofibroblast
activation is transforming growth factor-β1 (TGF-β1) [78, 79]. TGF-β1, also an important
cytokine in the pathogenesis of cardiac fibrosis, is secreted into the matrix in its latent
form and is activated by the proteolytic cleavage of the mature cytokine from the latency-
associated protein (LAP) [80, 81]. Integrins αvβ3 and αvβ5, expressed on the cardiac
myofibroblast cell membrane, have been found to release TGFβ1 from the LAP complex.
Instead of binding to RGD motifs in ECM proteins, they bind to the RGD motif in the
LAP where they transmit cellular forces in response to matrix remodeling. This results in
a conformational change in the LAP, which releases active TGFβ1 into the extracellular
space [82]. Other factors that mediate cardiac fibroblast activation include angiotensin II,
connective tissue growth factor (CTGF or CCN2), Endothelin-1 (ET-1), Myocardin-
Related Transcription Factor-A (MRTF-A) and collagen type IV [61, 83-87]. In addition
to secreted factors, mechanical force has also been shown to induce cardiac fibroblast
activation [88, 89]. As collagen deposition increases within the healing heart, the overall
stiffness of the ECM increases [90]. The application of tensile forces has been shown to
increase α-SMA in cardiac fibroblasts, a result that was replicated by culturing cells on
stiff substrates such as coated plastic plates [88]. Fibroblasts activate under 2-dimensional
cell culture conditions using plastic plates, a highly stiff substrate. This is therefore not an
appropriate model for study of the basal properties of inactive fibroblasts. For this reason,

13
3-dimensional cell culture techniques using “soft” substrates are growing in popularity in
the area of fibroblast research [91].
The source of fibroblasts that actively mature and mediate wound healing in the
heart has been widely debated. It has been hypothesized that fibroblasts originate from a
variety of sources in response to injury, including pericytes, endothelial cells, epithelial
cells, mesenchymal stem cells and fibrocytes [92-94]. However, a recent study has used
lineage tracing to determine that the primary source of myofibroblasts are actually the
fibroblasts that reside in the heart and maintain the basal conditions of the healthy heart
[17].
Integrins are transmembrane glycoproteins through which fibroblasts and
myofibroblasts make contact with the extracellular matrix and respond to mechanical
changes in their environment in a mechanism called mechanosensing [95]. They are
heterodimeric receptors, consisting of one α subunit and one β subunit noncovalently
bound to each other, interacting with ligands at the ECM [96]. The type and
concentration of integrins expressed on the cell plasma membrane is dependent on the
origin of the fibroblast, as different organs have varied ECM structure [97]. Though most
of the protein is located outside of the cell for extracellular matrix binding, integrins do
have a small intracellular domain to relay signaling cascades upon ligand binding [98]. In
the remodeling heart, α8β1 integrin expression is upregulated by Angiotensin II, via the
AT1 receptor, and by TGFβ1 stimulation in cardiac myofibroblasts [99, 100]. The signal
produced by AT1 receptor ligand binding to increase β1 integrin expression is transduced
by protein kinase C epsilon (PKCε). β1 integrins mediate fibroblast and myofibroblast
collagen type I adhesions, which are highly produced in the fibrotic scar and in areas of

14
active matrix remodeling [71, 101]. Collagen type IV is upregulated in the ECM in
diabetic, hypertensive and infarcted hearts. The α3 family of integrins interacts with
collagen IV and promotes fibroblast activation into myofibroblasts in a positive feedback
loop [102].
Mechanotransduction describes mechanisms in place that give cells, including fibroblasts
and myofibroblasts, the ability to turn mechanical signals and cues into biochemical
signals [95]. Using voltage-clamp analysis, it was found that the cardiac fibroblast
membrane became depolarized and hyperpolarized with lateral compression and stretch,
respectively. The mechanism for this was through the activation and inhibition of non-
selective cation channels [103]. The resting membrane potential of adult rat cardiac
fibroblasts was experimentally determined to be -37mV, regulated by potassium currents
across the membrane [104, 105]. Changes in membrane potential could possibly be a
mechanism to initiate changes inside the cell. Physically stretching cells is a popular
methodology for studying how the application of force and tension can be transduced into
such signals. In cardiac fibroblasts, stretch-induced mechanical stress resulted in
phosphorylation events on focal adhesion proteins such as paxillin, increased the activity
of phospholipase C (PLC) and decreasing cellular proliferation by the simultaneous
upregulation of p21 and downregulation of cyclin B1 [106, 107]. Mechanical stress may
also modulate factors secreted into the extracellular space. The induction of stretch-
induced mechanical stress has been shown to increase insulin-like growth factor I (IGF-I)
secretion by cardiac myofibroblasts, which in turn stimulates myocytes to produce atrial
natriuretic peptide (ANP). This effect is calcium dependent, as it is lost with the
pharmacologic inhibition of SERCA [108].

15
Figure 1. Fibroblast activation to myofibroblast; transition overview
Fibroblasts in their non-activated state are motile cells, maintaining ECM homeostasis by
systematically releasing proteases to break up old matrix proteins and secreting new
matrix proteins as a replacement. As fibroblasts become activated into myofibroblasts,
they start to form stress fibres and strong focal adhesions. They are not contractile until
they are in a mature state and α-SMA is incorporated into the stress fibres. Mature
myofibroblasts are hypersecretory for matrix proteins and highly contractile, with limited
motility as compared to their fibroblast counterparts. Recently, it has been reported that
activated myofibroblasts may transition back into relatively quiescent fibroblasts [17,
109].

16
α-Smooth Muscle Actin
α-Smooth Muscle Actin (α-SMA) is expressed in smooth muscle cells, and also in
activated myofibroblasts [110]. It is encoded by the ACTA2 gene and is one of the most
widely used markers to make a positive identification of the myofibroblast phenotype in
combination with the appearance of stress fibres [111]. As fibroblasts become activated
to myofibroblasts, cytosolic G-actin polymerizes into F-actin stress fibres [76]. When this
occurs, myocardin-related transcription factor-A (MRTF-A) (normally sequestered by G-
actin) is released, and then translocates to the nucleus where it up-regulates α-SMA
expression [86]. α-SMA partners with tropomyosins (Tpm1.6 and Tpm1.7), through
protein interaction via the N-terminal domain, to become incorporated into the F-actin
stress fibres [76, 111]. Without tropomyosin, α-SMA cannot become incorporated into F-
actin stress fibres of the myofibroblast [111]. Historically, α-SMA has been seen as the
protein that allows the myofibroblast to produce contractile forces during wound healing
[112, 113]. A recent study by Frangogiannis et al found that when fibroblasts were
cultured on collagen matrices and activated by the addition of serum, TGF-β1 or basic
fibroblast growth factor (bFGF), the contraction of the collagen matrix was not always
associated with the induction of α-SMA. They concluded that though it is involved in the
production of contractile force, it is not absolutely needed for myofibroblasts to possess
contractile ability [114]. Aside from cytosolically sequestered MRTF-A, many inducers
of the myofibroblast phenotype partially exert their effects by upregulating α-SMA
synthesis. TGF-β, the EDA splice variant of fibronectin (EDA-FN), endothelin-1, Akt1
and mechanical tension are all examples of factors that modulate the myofibroblast
phenotype through the induction of α-SMA [76, 115-117]. On the other hand, many

17
factors that inhibit myofibroblast activation have also been found to suppress α-SMA
expression. Phosri et al found that adenosine dampens α-SMA synthesis through the
cAMP/Epac/P13K/Akt signaling axis [116], while Cunnington et al found that the Ski
protein dials back the myofibroblast phenotype partially by decreasing α-SMA
expression [109].
Canonical TGF-β Signaling
Transforming Growth Factor-β1 (TGF-β1) is a pro-fibrotic growth factor that has
been implicated in wound healing post-myocardial infarction [118]. It is non-covalently
bound to its latency associated peptide (LAP) to retain TGF-β1 in its latent form. Latent
TGF-β1 is covalently bound to latent TGFβ binding protein 1 (LTBP-1) before it is
secreted into the ECM. It is the LTBP-1 that allows latent TGF-β1 to make contact with
the ECM. It has recently been found that LTBP-1 has a higher affinity for the EDA
domain of fibronectin, a highly upregulated matrix protein in remodeled tissue [119]. It is
secreted into the matrix in its latent form and interacts with latent TGFβ-binding proteins
within the ECM. Contractile forces and conformational changes to the ECM physically
releases TGF-β from its latent complex, allowing it to bind to its receptor (as reviewed in
[120]). The receptor for TGFβ is a serine/threonine kinase. When TGFβ binds to its type
II receptor (TβRII), it forms a hetero-tetramer with the type I TGFβ receptor (TβRI) and
TβRI auto-phosphorylates [121, 122]. Receptor regulated Smads (R-Smads), R-Smad2
and R-Smad3, both directly interact with TβRI and become phosphorylated [123, 124].
Co-mediator Smad4 (Co-Smad4) binds to the phosphorylated R-Smad2/3 to make a
transcriptional complex [123, 125]. The transcriptional complex is translocated into the
nucleus, where it binds to Smad binding elements (SBE) within the promoters of target

18
TGF-β responsive genes, via the MH1 domain on the Smad proteins [126-128]. TGF-β
signaling induces the expression of inhibitory Smad7 (I-Smad7), which in turn directly
binds to TβRI. This prevents the phosphorylation of R-Smad2/3, thereby inhibiting the
signaling cascade in a negative feedback mechanism [129, 130]. Thus, canonical TGF-β
signaling is implicated in the positive regulation of the expression and synthesis of matrix
proteins [118, 131, 132]. Though the two types of TGF-β receptors can form
homodimers, heterodimerization is required for the production of extracellular matrix
proteins (Figure 2) [121, 133].

19
Figure 2. Canonical TGF-β1 signaling cascade and crosstalk with scleraxis
When TGF-β1 binds to the TGF-β type II receptor (TGF-βRII), it forms a hetero-tetramer
with its type I receptor, causing it to auto-phosphorylate. The receptor hetero-tetramer
phosphorylates receptor-regulated Smads (R-Smads). R-Smads form a complex with co-
mediator Smads (Co-Smads). The complex translocates into the nucleus where they act
as transcription factors. Both inhibitory Smads (I-Smads) and Ski are intrinsic inhibitors
of this pathway. I-Smads prevent the phosphorylation of R-Smads by TGF-βRII, while
Ski prevents the R-Smad/Co-Smad complex from binding to Smad binding elements in
various promoters. Smad3 and scleraxis form a transcriptional complex, which
upregulates the expression of ECM and cytoskeletal genes; collagen type I, periostin,
fibronectin and vimentin [134-136].

20
Scleraxis
Scleraxis is part of the basic helix-loop-helix (bHLH) family of transcription
factors, which interact with enhancer box (E-box) sequences to regulate the expression of
their target genes. It was first detected in the developing mouse embryo at embryonic day
9.5 (E9.5) within mesenchymal precursor cells in regions of high cartilage and connective
tissue formation [137]. In osteoblasts, it is positively regulated by transforming growth
factor-β (TGF-β) and binds to enhancer boxes within the collagen type II, osteopontin
and aggrecan genes to upregulate their expression [138, 139]. Starting at E14.5, scleraxis
is present in mouse tendons and upregulates tenomodulin and bone morphogenic protein
4 (BMP4) in tendon lineage cells [140-142]. BMP4 modulates bone ridge formation,
providing a stable anchoring point for muscle attachment by the tendon [142]. In this
way, scleraxis is a mediator of muscle attachment to the bone [142, 143]. In tenocytes,
scleraxis forms a heterodimer with E47 and together with Nuclear Factor of Activated T-
Cells (NFATc) upregulates Collagen Col1α1 [144]. The scleraxis/E47 heterodimer also
forms a transcriptional complex with Sry-type HMG box 9 (SOX9) and p300 to activate
Col1α2 during chondrogenesis [145]. Given its regulatory role in areas high in connective
tissue and matrix proteins, it’s not surprising that scleraxis null mice are born with severe
tendon defects. Interestingly, tendons that anchor muscle to bone seem to have additional
mechanisms that compensate for the loss in scleraxis and are less affected. Force-
transmitting and intermuscular tendons are the most affected. Because of this, the
experimental animals have limited use of their paws and back muscles and absolutely no
use of their tail. On the molecular level, the extracellular matrix of affected tendons
becomes disorganized [146]. In the heart, scleraxis is upregulated at E15.5 in mice during

21
heart valve remodeling, where it positively regulates proteoglycans in response to TGF-β2
stimulation [147, 148]. Scleraxis null mice are born with abnormally thick heart valves
and a disorganized matrix within the structure [147]. In cardiac fibroblasts, scleraxis has
been found to become activated following phosphorylation events and its expression is
increased following TGF-β1 stimulation, mechanical stretch and fibroblast activation into
myofibroblasts [149-151]. Scleraxis is a regulator of extracellular matrix synthesis and
turnover; it interacts with Smad3 to form a transcriptional complex and enhances the
expression of fibrillar collagens, proteoglycans and fibronectin [134-136]. It also further
induces myofibroblast activation and upregulates DDR2, vimentin, α-SMA and periostin
expression (Figure 2) [136, 150]. In a loss-of-funtion study, scleraxis was found to
dramatically attenuate activation of fibroblasts into myofibroblasts [136]. Due to its role
in myofibroblast activation and matrix production, it may provide a novel target in the
treatment of cardiac fibrosis.
Transcription Factor 15
Transcription Factor 15 (TCF15), or paraxis, is a bHLH transcription factor that is
a paralog of scleraxis (i.e. the Tcf15 gene arose from the Scx gene in a gene duplication
event). Both scleraxis and TCF15 are phylogenically highly related members of the
bHLH clade A family, within the bHLH super-tree (Figure 3) [152]. They are near
identical in the bHLH region, but differ by quite a bit in the amino and carboxyl terminal
region of the proteins [153]. The mechanism of action for TCF15 is similar to that of
scleraxis. It forms a heterodimer with E12 and regulates transcription of its target genes
by binding to CANNTG E-box sequences [154]. During embryogenesis Wnt-signaling
from the ectoderm upregulate TCF15 expression, whose signaling transduction pathway

22
is essential for the formation of the paraxial mesoderm [154, 155]. The paraxial
mesoderm segments and gives rise to mesenchymal cells and the sclerotome [155]. Both
scleraxis and TFC15 are co-expressed in mesenchymal precursors of bone and cartilage
within the sclerotome of the developing embryo. TCF15 expression drops after the
sclerotome is formed, but scleraxis expression remains high for chondrogenesis and
tendinogenesis [153, 154]. TCF15 knockout in the developing embryo results in a
decrease in fibroblast activation protein alpha (fap), which is involved in the organization
of the extracellular matrix, thereby disrupting somite formation [156-158]. TCF15 is also
expressed in myoblasts, but is downregulated during muscle cell differentiation [159].
TCF15 knockout during embryogenesis yields a deficiency in MyoD expression within
muscle precursor cells [160]. Studies on TCF15 outside the field of embryogenesis are
limited. TCF15 is known to form heterodimers with Meox2 in the endothelial cells of the
microvasculature of the heart, mediating fatty acid uptake [161]. To date TCF15 has not
been studied in the context of cardiac fibrosis and wound healing, or within the context of
cardiac myofibroblast function. Recently our group has discovered that the increase in
Tcf15 from P0 to P2 in cultured primary adult cardiac fibroblasts is greater than that of
known myofibroblast markers: Postn (periostin), Acta2 (αSMA) and Col1α1 (the
procollagen 1α1 strand of collagen type I) (Figure 4).

23
Figure 3. Clade A of the human bHLH phylogenetic tree
A simplified representation of Clade A of the bHLH phylogenetic tree for human genes.
TCF15 and scleraxis are phylogenetically closely related genes. This figure was adapted
from a figure in a review of basic Helix-Loop-Helix transcription factors, with the
authors’ permission [152].

24
Figure 4. mRNA expression of TCF15 compared to other myofibroblast markers
A microarray assay was used to determine the expression of several mRNA markers in
P2 cultured primary cardiac myofibroblasts relative to P0 cultured primary cardiac
fibroblasts (n=1; pooled). The genes depicted are Tcf15, Postn (periostin), Acta2 (α-
SMA) and Col1α1 (the procollagen 1α1 strand of collagen type I).

25
Rationale and Hypothesis
Over the past decade, scleraxis has been found to be an activator and matrix
protein synthesis inducer in cardiac myofibroblasts [135, 136, 149]. Although some in
vivo data has been collected, this study was comprised of one time point comparing the
right ventricle and scar area itself with a sham model [149]. Active remodeling of the
myocardium can be on going for months after the initial insult [162]. Therefore in this
study, we aim to investigate scleraxis expression at both acute and chronic stages of
wound healing post-MI in a series of time-course experiments. In the search for scleraxis
primers for possible qPCR experiments, we found that many of the primers were
predicted to amplify TCF15 as well as scleraxis. This led us to research the current
literature for TCF15.
Little is known about the expression of TCF15 within the adult myocardium and
there have been no studies characterizing its expression or addressing its function in
cardiac fibroblasts and myofibroblasts. TCF15 plays a role in extracellular matrix
organization in tissues and heterodimerizes with Meox2. Previously we reported that
Meox2 is an important regulator of the cardiac myofibroblast phenotype [163]. This data
and our current data showing that Tcf15 is massively increased with myofibroblast
activation leads us to consider the possibility that TCF15 also has an important role in
fibrogenesis and myocardial remodeling [149].
Our working hypothesis is that Scleraxis and TCF15 are both involved in cardiac
wound healing and cardiac matrix remodeling in the failing myocardium after a
myocardial infarction.
26
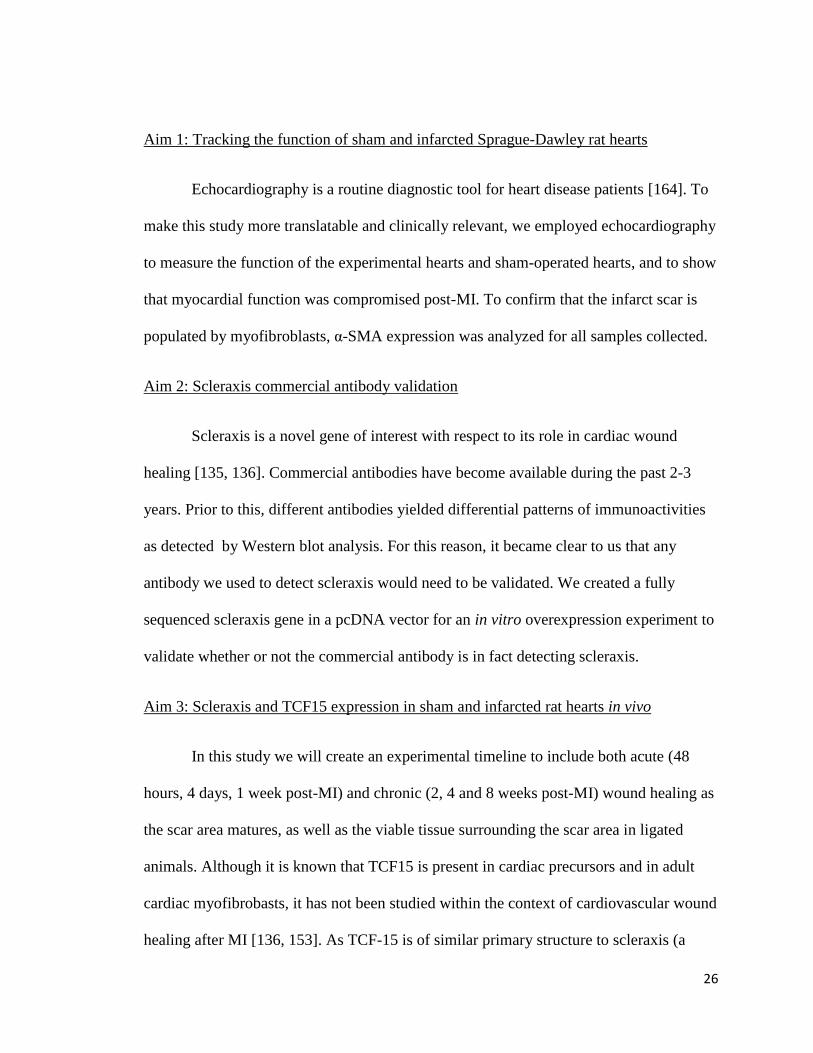
Aim 1: Tracking the function of sham and infarcted Sprague-Dawley rat hearts
Echocardiography is a routine diagnostic tool for heart disease patients [164]. To
make this study more translatable and clinically relevant, we employed echocardiography
to measure the function of the experimental hearts and sham-operated hearts, and to show
that myocardial function was compromised post-MI. To confirm that the infarct scar is
populated by myofibroblasts, α-SMA expression was analyzed for all samples collected.
Aim 2: Scleraxis commercial antibody validation
Scleraxis is a novel gene of interest with respect to its role in cardiac wound
healing [135, 136]. Commercial antibodies have become available during the past 2-3
years. Prior to this, different antibodies yielded differential patterns of immunoactivities
as detected by Western blot analysis. For this reason, it became clear to us that any
antibody we used to detect scleraxis would need to be validated. We created a fully
sequenced scleraxis gene in a pcDNA vector for an in vitro overexpression experiment to
validate whether or not the commercial antibody is in fact detecting scleraxis.
Aim 3: Scleraxis and TCF15 expression in sham and infarcted rat hearts in vivo
In this study we will create an experimental timeline to include both acute (48
hours, 4 days, 1 week post-MI) and chronic (2, 4 and 8 weeks post-MI) wound healing as
the scar area matures, as well as the viable tissue surrounding the scar area in ligated
animals. Although it is known that TCF15 is present in cardiac precursors and in adult
cardiac myofibrobasts, it has not been studied within the context of cardiovascular wound
healing after MI [136, 153]. As TCF-15 is of similar primary structure to scleraxis (a

27
paralog), it is useful to examine the full expression profiles of both genes in acute and
chronic stages of post-infarct wound healing.

28
Materials and Methodology
In Vivo Myocardial Infarction Model
The protocols for the use of experimental animals in this study were approved by
the Animal Care Committee of the University of Manitoba. The experimental animals,
male Sprague-Dawley rats, were prepared for surgery by the Burrell Lab staff in
accordance to their SOP # TP10 for “Patient Preparation for Surgery”. All animals were
approximately 125 – 150g in weight at the beginning of experimentation. Ligation of the
left anterior descending (LAD) coronary artery was completed by the Burrell Lab staff in
accordance with their SOP # MC7.01 for “Rat Coronary Ligation – Left Side Entry”.
Sham-operated (n=30) and post-MI (n=49) animals were sacrificed at the following time
points: 48 hours, 4 days, 1 week, 2 weeks, 4 weeks and 8 weeks post-surgery.
Echocardiography
After being identified and weighed, each male Sprague-Dawley rat was
anesthetized with isoflurane gas by the Burrell Lab staff in accordance to their SOP #
TP38 for “Rodent Isoflurane Inhalant Anesthesia”. The thorax of the rat was shaved from
the left sternal border to the left axillary line. A GE Vivid7/Visualsonics 2100
echocardiographic system with rat-specific software was used for acquiring all
echocardiograph data. A thin layer of acoustic gel was applied to the hairless thorax and a
10S probe was placed on the gel. The 10S probe was positioned across the left chest with
light pressure to obtain the two-dimensional parasternal long axis view. The probe was
then rotated 90 degrees to obtain the two-dimensional parasternal short axis view. In the
short axis view, M-mode was activated to obtain three different frames at the level of the

29
papillary muscle. Once the imaging was completed, the Burrell Lab staff was responsible
for the follow-up and recovery of the animal. All echocardiography was done 24 hours
prior to sacrifice for all groups. All echocardiography was done by the members of Dr.
Davinder Jassal’s lab at St. Boniface Hospital Albrechtsen Research Centre [165].
Tissue Collection
The right ventricle was collected from sham animals and served as the control for
right ventricle post-MI samples. The left ventricle was collected from sham animals, and
served as the control for the scar and viable tissues of the infarcted left ventricle. The scar
area was visually identified and excised from the left ventricle of post-MI animals. The
undamaged tissue within the left ventricle of post-MI animals was collected as a viable
tissue sample. Prior to sacrifice, each male rat was anesthetized with isoflurane gas by the
Burrell Lab staff in accordance to their SOP # TP38 for “Rodent Isoflurane Inhalant
Anesthesia”. The hearts were excised and the appropriate samples were dissected from
the heart. The dissected samples were cut into small fragments and carefully inserted into
cryogenic tubes. The tubes were flash frozen in liquid nitrogen and stored at -80°C.
Protein Isolation from Frozen Tissue
Each frozen sample was weighed and crushed in liquid nitrogen using a mortar
and pestle. The crushed samples in liquid nitrogen were decanted into a 15 mL sterile
conical tube containing 1 mL per 100 mg tissue of SDS sample buffer (125 mM Tris pH
6.8, 1% w/v [Sodium Dodecyl Sulfate] (SDS), 5% v/v Glycerol) enriched with protease
inhibitors (20 μM leupeptin, 15 μM pepstatin A, 0.80 μM aprotinin, 1.04 mM 69 [4-(2-
Aminoethyl) benzenesulfonyl fluoride hydrochloride] (AEBSF), 40 μM Bestatin, 1.4 mM

30
E-64 (Sigma-Aldrich Corporation, St. Louis, MO)) and phosphatase inhibitors (10 mM
NaF, 1.0 mM Na3VO4, and 1.0 mM EGTA). The lid was placed on the tubes after the
liquid nitrogen had evaporated from the tube and the samples were incubated on ice for 1
hour. The samples were sonicated 3 times for 10 seconds each round and the tissue lysate
was transfered to QIAshredder columns (Qiagen, Germany). The columns were
centrifuged at 16,000g for 15 minutes at 4°C. The supernatant was collected and
transferred to clean 1.5 mL Eppendorf tubes. The samples were stored at -80°C to await
protein assay.
Preparation of Luria-Bertani (LB) Broth
Solutions of LB Broth Base powder (Invitrogen Cat #12795-027; 25 g / L de-
ionized water), with and without agar (Invitrogen Cat #30391-023; 1.6 g / L de-ionized
water), were autoclaved at 121°C for 15 min. Solutions containing agar were allowed to
cool to 60°C prior to addition of carbenicillin at 50 mg / L, and then poured into Petri
dishes (~15 mL / dish). Agar plates were stored at 4°C.
Preparation of Scleraxis pcDNA Glycerol Stocks
Human scleraxis (hSCX) cDNA in pReceiver-M12 was purchased from
GeneCopoeia (Cat #EX-H1148-M12; Figure 5). To match the delivery vector to our
enhanced green fluorescent protein construct (eGFP), the hSCX ORF was excised as an
EcoRI/XhoI fragment and ligated into pcDNA3 as follows.
A 10 ug aliquot of pcDNA3 (Figure 6) was digested with EcoRI and XhoI (New
England Biolabs Cat #R0101 and #R0146, respectively) in NEB 2.1 buffer (New England

31
Biolabs Cat #B7202S) in a total reaction volume of 200 uL for 4 hr at 37°C. Following
heat-inactivation at 65°C for 20 minutes, the digested vector was treated with Antarctic
Phosphatase (New England Biolabs Cat #M0289S) and subsequently purified over a
QIAquick PCR purification column (Qiagen Cat #28104), according to manufacturer’s
instructions for both protocols. The purified product was eluted in nuclease-free water
and stored at 4°C.
A 10 ug aliquot of hSCX in pReceiver-M12 was digested with EcoRI/XhoI as
above, but following heat-inactivation, the digested material was electrophoresed on a
1% TAE:Agarose gel. The desired 618 bp product was visualized/excised under UV light
and the DNA extracted over an Ultrafree-DA column (Millipore Cat #42600) followed by
a QIAquick PCR purification column according to manufacturer’s instructions. 50 ng of
cut, de-phosphorylated, purified pcDNA3, and 17 ng of cut, purified hSCX insert
(representing an ~3:1 molar excess of insert to vector), were ligated in a total reaction
volume of 21 uL using Quick Ligation Kit (New England Biolabs Cat #M2200S)
according to manufacturer’s instructions. Vector alone and vector plus ligase controls
were included.
3 µL of the above reactions were used to transform 30 µL aliquots of NEB-5alpha
Competent E. coli (High Efficiency) cells (New England Biolabs Cat #C2987I) according
to manufacturer’s instructions. Transformed bacteria were streaked/spread onto
LB:carbenicillin agar plates and cultured overnight at 37°C. Well-isolated colonies were
streaked onto a “master plate” for short-term retrieval, as well as grown in liquid culture
overnight at 37°C for subsequent plasmid purification (QIAprep Spin Miniprep Kit;
Qiagen Cat #27104, done according to the manufacturer’s instructions). Plasmid DNA

32
samples from several clones were selected for sequence verification. A clone that bore
clear, expected sequence on both strands (including the EcoRI/XhoI cloning sites) was
considered true/proven, and subsequently used for all experiments. This clone was/is
preserved as a 16% glycerol stock at -80°C.

33
Figure 5. Gene map of the pReceiver-M12 clone with the hSCX insert
Using SnapGene® software, a map of the human scleraxis clone was prepared. The clone
was purchased from GeneCopoeia. The clone was digested with EcoRI and XhoI
restriction endonucleases to purify the scleraxis insert to be placed in the pcDNA3 vector.
The red fragment denotes the scleraxis open reading frame to be excised from the
plasmid.

34
Figure 6. Gene map of the empty pcDNA3 vector
Using SnapGene® software, a map of the human scleraxis clone was prepared. The
empty vector was digested with EcoRI and XhoI restriction endonucleases to prepare the
vector for the scleraxis insert.

35
Isolation of pcDNA Vector from Glycerol Stocks
Whenever plasmid pcDNA3_hSCX or pcDNA_eGFP DNA was required, a small
amount of the glycerol stock “ice” was streaked onto a fresh LB:carbenicillin agar plate
and grown overnight at 37°C. A well-isolated clone was selected and used to inoculate
an overnight liquid LB:carbenicillin culture. The plasmids were isolated the next day
using a QIAprep Spin Miniprep kit (Qiagen Cat #27104) and were performed according
to the manufacturer’s instructions.
Start-up of Cell Lines from Frozen Stocks
Before starting the procedure, all solutions needed were warmed in a 37°C water
bath and the biosafety cabinet was turned on with the UV lamp on for 20 minutes. A
T175 culture flask (Thermo Scientific Catalog # 130191) was labeled and 30mL of
Dulbecco’s Modified Eagle’s Medium (DMEM; Gibco Reference # 10564-011) with
10% fetal bovine serum (FBS; Gibco Reference # 12483-020) added to it was aliquoted
into the flask. A vial of the appropriate cell type was taken out of the liquid nitrogen
storage container and thawed out quickly in the hot water bath. After the vial was thawed,
it was taken into the biosafety cabinet and the whole vial (about 1mL) was added to the
T175 culture flask. The flask was rocked from side to side to disperse the cells evenly
and the flask was incubated at 37°C for 24 hours. The next day, the DMEM in the flask
was suctioned out and replaced with fresh warm DMEM with 10% FBS added to it. The
cell culture was incubated until the flask was 70% confluent, at which time the flask was
passaged into a T75 culture flask.

36
Cell Passaging
Before starting the procedure, all solutions that were needed were warmed in a
37°C water bath and the biosafety cabinet was turned on with the UV lamp on for 20
minutes. The media in the flask or plate to be passaged was washed twice with 3mL of
sterile phosphate buffered saline (PBS; 136.89 mM NaCl, 2.68 mM KCl, 10.14mM
Na2HPO4, and 1.76 mM KH2PO4). After the last wash was suctioned off, 3mL of TrypLE
Express (Gibco Reference # 12605-028) was added to the flask or plate and incubated at
37°C for 5 minutes. The flask was taken out and visualized with the microscope
(Olympus CKX41 Serial # 0C01150). If all of the cells were not lifted, the flask was
incubated again at 37°C in 1 minute increments until all of the cells had lifted off the
plate or flask. 7 mL of 10% FBS-DMEM was added to the flask to deactivate the TrypLE
and the cell suspension was transferred to a sterile 50mL conical tube. The suspension
was diluted 10-fold with 10% FBS-DMEM and the concentration of cells was found
using the automated cell counter (Orflo MoxiZ Catalog # MXZ000, Serial #
1075520040).
Tranfection of pcDNA in HEK 293A Cells
Before starting the procedure, all solutions needed were warmed in a 37°C water
bath and the biosafety cabinet was turned on with the UV lamp on for 20 minutes.
Human embryonic kidney (HEK) 293S cells were passaged and seeded into a 6-well dish
(Thermo Scientific Catalog # 140675) at 1.0x10⁵ cells/well with 10% FBS-DMEM. The
plate was incubated at 37°C until they reached 80-90% confluency (2-3 days). When the
cells reached confluency, the media was suctioned off and replaced with 2mL of Opti-

37
MEM reduced serum media (Gibco Reference # 31985-070). The cells were transfected
with 0.5 – 1 µg of pcDNA vector with the gene of interest using a Lipofectamine 3000
Transfection Kit (Invitrogen Reference # L3000-015) according to the manufacturer’s
instructions using the high concentration of lipofectamine. Transfection with 1.0 µg of
eGFP served as a transfection control. The cells were transfected at 37°C for 48 hours
before the protein was isolated from the plates.
Protein Isolation from 6-Well Plates
Radioimmunoprecipitation assay (RIPA) buffer (150 mM NaCl, 1.0%v/v NP40,
0.5% w/v Deoxycholate, 0.1% w/v SDS, 50mM Tris) was enriched with protease inhibitors
(20 μM leupeptin, 15 μM pepstatin A, 0.80 μM aprotinin, 1.04 mM 69 [4-(2-Aminoethyl)
benzenesulfonyl fluoride hydrochloride] (AEBSF), 40 μM Bestatin, 1.4 mM E-64
(Sigma-Aldrich Corporation, St. Louis, MO)) and phosphatase inhibitors (10 mM NaF,
1.0 mM Na3VO4, and 1.0 mM EGTA); this solution was used as the lysis buffer. The
lysis buffer and PBS used in this procedure were chilled at 4°C prior to use. The 6-well
plate with the transfection was taken out of the incubator and placed on a bed of ice. The
plate was washed twice with ice cold PBS. All of the PBS was suctioned off in all wells
and 50µL of lysis buffer was added to the top 3 wells. While the plate was still on ice, the
cells in the top control well were physically scraped off into the buffer using a plastic cell
scraper. The cell lysate was taken from the first well and added to the second well. The
cells in the second well were physically scraped as before and the lysate was transferred
into a 1.5 mL microfuge tube (Bio Plas Catalog # 4030) that had been placed on ice. The
other duplicate wells were scraped in the same fashion to yield 3 tubes of cell lysate for
vehicle control, eGFP transfected and hSCX transfected samples. The samples were

38
incubated on ice for 1 hour and then sonicated 3 times each for 10 seconds. The samples
were centrifuged at 14,000 rpm for 15 minutes in the cold room. The supernatant was
transferred into a clean tube and was stored at -20°C as the protein lysate until a protein
assay could be done.
Protein Assay
Protein was measured in the prepared lysates using a bicinchoninic acid (BCA)
assay. An albumin protein standard (Thermo Scientific, Rockford, IL) was diluted to final
concentrations of 0.2, 0.4, 0.6, 0.8, 1.0, 1.5 and 2.0 mg/mL and all protein samples were
diluted 10-fold in radioimmunoprecipitation assay (RIPA) buffer (150 mM NaCl, 1.0%v/v
NP40, 0.5% w/v Deoxycholate, 0.1% w/v SDS, 50mM Tris). 10µL of each standard and
sample was aliquoted into each well of a 96-well plate in triplicate. 200µL of the assay
solution (400 µL copper (II) sulfate (Sigma-Aldrich Corporation, St. Louis, MO) in
20mL bicinchoninic acid (Thermo Scientific, Rockford, IL)) was aliquoted into each well
and the plate was wrapped in parafilm. The plate was incubated at 37°C for 30 minutes
and the protein concentration was calculated from the A560 values.
Western Analysis
Protein samples (20 – 40 µg) were loaded onto a 6 – 12% polyacrylamide gel and
underwent sodium dodecylsulfate polyacrylamide gel electrophoresis (SDS-PAGE) at
120 – 150 V. The separated protein was transferred onto a polyvinylidene fluoride
(PVDF) membrane (Biorad, USA) at 300 mA for 75 minutes at 4°C using a wet transfer
with a modified tris-glycine transfer buffer (20% v/v methanol, 25 mM Tris, 191.8 mM
Glycine). After transfer was complete, the membranes were washed in double distilled

39
water (DDW) and incubated in Ponceau S stain (DGel Sciences, Montreal, QC) 10
minutes at room temperature. The excess stain was rinsed off with DDW and total protein
was measured with a densitometer using QuantityOne software. The membranes were de-
stained with 15 minute washes 3 times with TBS-T (49.94 mM Tris, 149.90 mM NaCl,
0.1% v/v Tween-20). The membranes were incubated in blocking buffer (5% w/v skim milk
in TBS-T) 1 hour at room temperature before being incubated in primary antibody diluted
in blocking buffer or 5% w/v bovine serum albumin (BSA; Alfa Aesar Cat #J64655)
overnight at 4°C. The membranes were washed 3 times for 5 minutes with 0.1% v/v TBS-
T and incubated in secondary antibody diluted in 3% w/v Milk in TBS-T 1 hour at room
temperature (Table 1). The membranes were washed 3 times for 5 minutes and treated
with Supersignal West Pico (Thermo Scientific, Rockford, IL) for 5 minutes as per
manufacturer’s instructions. The signal was visualized using RadiomatTM
B-Plus blue x-
ray films (Medlink Imaging) and the optical density for each band was measured using a
densitometer with QuantityOne software.

40
Table 1. Antibodies for Western analysis
The experimental conditions that were used for all antibodies utilized for western
analysis. Milk and bovine serum albumin (BSA) was diluted in washing buffer; 0.1% v/v
TBS-T.
Statistical analysis
All data was reported using the mean ± the standard error of the mean (SEM). For
all experimental data, the statistical significance of the differences of the means between
sham left ventricle with post-MI left ventricle (viable and scar) samples (n = 6 - 9) was
determined using one-way analysis of variance (one-way ANOVA). The in vitro scleraxis
overexpression samples (n = 9) were also analyzed using a one-way ANOVA. When the
ANOVA was p < 0.05, a Tukey’s post-hoc analysis was used to identify differences
between specific groups. The statistical significance of the differences of the means
between sham right ventricle and post-MI right ventricle samples (n = 6 - 9) was
determined using Student’s t-test with Welch’s correction. A P value less than or equal to
0.05 was considered statistically significant. All statistical analysis was done using
GraphPad Prism 7™.

41
Results
Echocardiography of sham and post-infarction rat hearts
Echocardiography was used to assess the cardiac function of experimental
animals 24 hours prior to sacrifice. The ejection fraction (figure 7-A) and fractional
shortening (figure 7-B) of post-MI hearts were significantly attenuated as compared to
sham-operated hearts. Heart rate (figure 7-C) was decreased in post-MI rats 48 hours
after surgery, but did not differ from sham-operated animals at later time points. Infarct
size was estimated visually by the technician as a percent area of the left ventricle. There
was no significant change in infarct size between time points (figure 7-D).
α-Smooth Muscle Actin is increased within the infarct scar area in vivo
The protein expression of α-SMA within the infarct scar or equivalent areas from
the sham-operated control was measured in all samples using Western analysis. α-SMA
expression was significantly increased within the infarct scar area at all time points
starting at 4 days post-MI (Figure 8).

42
48 H
ou
rs
4 D
ays
1 W
eek
2 W
eeks
4 W
eeks
8 W
eeks
0
2 0
4 0
6 0
8 0
1 0 0
E je c t io n F ra c t io n
Pe
rc
en
t (%
)
S h am
P o s t-M I
*
**
* *
*
48 H
ou
rs
4 D
ays
1 W
eek
2 W
eeks
4 W
eeks
8 W
eeks
0
2 0
4 0
6 0
F ra c t io n a l S h o r te n in g
Pe
rc
en
t (%
)
S h am
P o s t-M I
*
**
* *
*
48 H
ou
rs
4 D
ays
1 W
eek
2 W
eeks
4 W
eeks
8 W
eeks
3 0 0
3 5 0
4 0 0
4 5 0
5 0 0
5 5 0
H e a rt R a te
Be
ats
Pe
r M
inu
te (
BP
M)
S h am
P o s t-M I
*
48 H
ou
rs
4 D
ays
1 W
eek
2 W
eeks
4 W
eeks
8 W
eeks
0
1 0
2 0
3 0
4 0
5 0
In fa rc t S iz e
Pe
rc
en
t (%
)
Figure 7. Assessment of cardiac function of post-MI and sham-operated animals at
different time points
Echocardiography was performed single-blinded on both sham-operated and post-MI
animals (n = 3 – 6) at all time points 24 hours before sacrifice. Plots for ejection fraction
(A), fractional shortening (B), heart rate (C) and infarct size (D) using n = 3 – 5 were
prepared. * P < 0.05.
Figure 7-A. Figure 7-B.
Figure 7-C. Figure 7-D.

43
Sh
am
RV
Sh
am
LV
MI R
V
MI V
iab
le
MI S
car
0 .0
0 .1
0 .2
0 .3
0 .4
4 8 H o u rs p o s t-M I
Re
lati
ve
De
ns
ito
me
tric
Un
its
(
SM
A/T
ota
l P
ro
tein
)
Sh
am
RV
Sh
am
LV
MI R
V
MI V
iab
le
MI S
car
0 .0
0 .1
0 .2
0 .3
0 .4
4 D a y s p o s t-M I
Re
lati
ve
De
ns
ito
me
tric
Un
its
(
SM
A/T
ota
l P
ro
tein
)
*
Sh
am
RV
Sh
am
LV
MI R
V
MI V
iab
le
MI S
car
0 .0 0
0 .0 5
0 .1 0
0 .1 5
0 .2 0
1 W e e k p o s t-M I
Re
lati
ve
De
ns
ito
me
tric
Un
its
(
SM
A/T
ota
l P
ro
tein
)
*
Sh
am
RV
Sh
am
LV
MI R
V
MI V
iab
le
MI S
car
0 .0
0 .1
0 .2
0 .3
0 .4
2 W e e k s p o s t-M I
Re
lati
ve
De
ns
ito
me
tric
Un
its
(
SM
A/T
ota
l P
ro
tein
)
*
Sh
am
RV
Sh
am
LV
MI R
V
MI V
iab
le
MI S
car
0 .0 0
0 .0 5
0 .1 0
0 .1 5
0 .2 0
4 W e e k s p o s t-M I
Re
lati
ve
De
ns
ito
me
tric
Un
its
(
SM
A/T
ota
l P
ro
tein
)
*
Sh
am
RV
Sh
am
LV
MI R
V
MI V
iab
le
MI S
car
0 .0 0
0 .0 5
0 .1 0
0 .1 5
0 .2 0
8 W e e k s p o s t-M I
Re
lati
ve
De
ns
ito
me
tric
Un
its
(
SM
A/T
ota
l P
ro
tein
)
*
Figure 8-A.

44
Figure 8. Expression of α-smooth muscle actin in the RV, LV, non-infarcted viable
and infarct scar tissues of the infarcted rat heart
Protein was isolated from the right and left ventricles of sham-operated controls, right
ventricle as well as the viable and scar tissue of the left ventricle of post-myocardial
infarcted Sprague-Dawley rat hearts (n = 3 - 5). α-SMA protein expression was analyzed
using Western analysis. The histograms for the data obtained (A), as well as their
representative images (B), showed a significant increase in α-SMA expression within the
infarct scar at all time points with the exception of 48 hours post-MI. * P < 0.05.
Figure 8-B.

45
Overexpression of scleraxis using a pcDNA vector to validate the use of a
commercial scleraxis antibody
Human scleraxis was overexpressed in HEK 293S cells, and scleraxis expression
was visualized by Western analysis to validate whether or not the commercial scleraxis
antibody was indeed recognizing scleraxis. Scleraxis expression did not significantly
increase when compared to the enhanced green fluorescent protein (eGFP) transfection
control (Figure 9). The bands that were analyzed appeared in approximately the same
area of the quantified band from the following in vivo studies.

46
Figure 9. Validation of the commercially available antibody for scleraxis
Enhanced green fluorescent protein (eGFP) and human scleraxis (hScx) DNA constructs
were spliced into pcDNA vectors. The pcDNA constructs with the appropriate inserts
were transfected into human embryonic kidney (HEK) 293S cells (n = 9) for 48 hours.
Western analysis was used to analyze scleraxis expression in each of the samples
collected. The figure depicts the histogram derived from the experiment, as well as its
representative image.

47
Scleraxis expression is increased in scar and infarct areas within the left ventricle, as
well as remote regions of the heart, as compared to sham-operated controls in vivo
The protein expression of scleraxis was measured in all collected tissues using
Western blot analysis. Scleraxis expression was significantly increased within the
infarcted area of the heart at 1, 2, 4 and 8 weeks post-MI as compared to sham operated
control tissues as well as viable tissues within the left ventricle of infarcted hearts (Figure
10).

48
Sh
am
RV
Sh
am
LV
MI R
V
MI V
iab
le
MI S
car
0 .0 0
0 .0 2
0 .0 4
0 .0 6
0 .0 8
0 .1 0
Re
lati
ve
De
ns
ito
me
tric
Un
its
(Sc
lera
xis
/To
tal
Pro
tein
)
4 8 h o u r s
Sh
am
RV
Sh
am
LV
MI R
V
MI V
iab
le
MI S
car
0 .0
0 .1
0 .2
0 .3
Re
lati
ve
De
ns
ito
me
tric
Un
its
(Sc
lera
xis
/To
tal
Pro
tein
)
4 D a y s
Sh
am
RV
Sh
am
LV
MI R
V
MI V
iab
le
MI S
car
0 .0 0
0 .0 5
0 .1 0
0 .1 5
0 .2 0
0 .2 5
Re
lati
ve
De
ns
ito
me
tric
Un
its
(Sc
lera
xis
/To
tal
Pro
tein
)
*
*
1 W e e k
Sh
am
RV
Sh
am
LV
MI R
V
MI V
iab
le
MI S
car
0 .0
0 .1
0 .2
0 .3
Re
lati
ve
De
ns
ito
me
tric
Un
its
(Sc
lera
xis
/To
tal
Pro
tein
)
*
*
2 W e e k s
Sh
am
RV
Sh
am
LV
MI R
V
MI V
iab
le
MI S
car
0 .0
0 .1
0 .2
0 .3
Re
lati
ve
De
ns
ito
me
tric
Un
its
(Sc
lera
xis
/To
tal
Pro
tein
)
*
*
4 W e e k s
Sh
am
RV
Sh
am
LV
MI R
V
MI V
iab
le
MI S
car
0 .0 0
0 .0 5
0 .1 0
0 .1 5
0 .2 0
Re
lati
ve
De
ns
ito
me
tric
Un
its
(Sc
lera
xis
/To
tal
Pro
tein
) *
*
8 W e e k s
Figure 10-A.

49
Figure 10. Expression of scleraxis in the infarcted rat heart
Protein was isolated from the right and left ventricles of sham-operated controls, right
ventricle as well as the viable and scar tissue of the left ventricle of post-myocardial
infarcted Sprague-Dawley rat hearts. Scleraxis protein expression was analyzed using
Western analysis (n = 6 – 9). The histograms for the data obtained (A), as well as their
representative images (B); shows a significant increase in scleraxis expression within the
infarct scar at 1 week, 2 weeks, 4 weeks and 8 weeks post-MI. * P < 0.05.
Figure 10-B.

50
TCF15 expression is increased in scar and infarct areas within the left ventricle, as
well as remote regions of the heart, as compared to sham-operated controls in vivo
Protein expression of TCF15 was measured in all tissues collected using Western
analysis. TCF15 expression within the scar area was significantly increased 48 hours, 2
weeks and 8 weeks post-MI. There was a significant decrease in TCF15 within the right
ventricle at 2 weeks and 4 weeks post-MI. There is no significant change within the right
ventricle at 8 weeks post-MI. TCF15 is significantly increased within the viable tissues of
the left ventricle at 8 weeks post-MI (Figure 11).
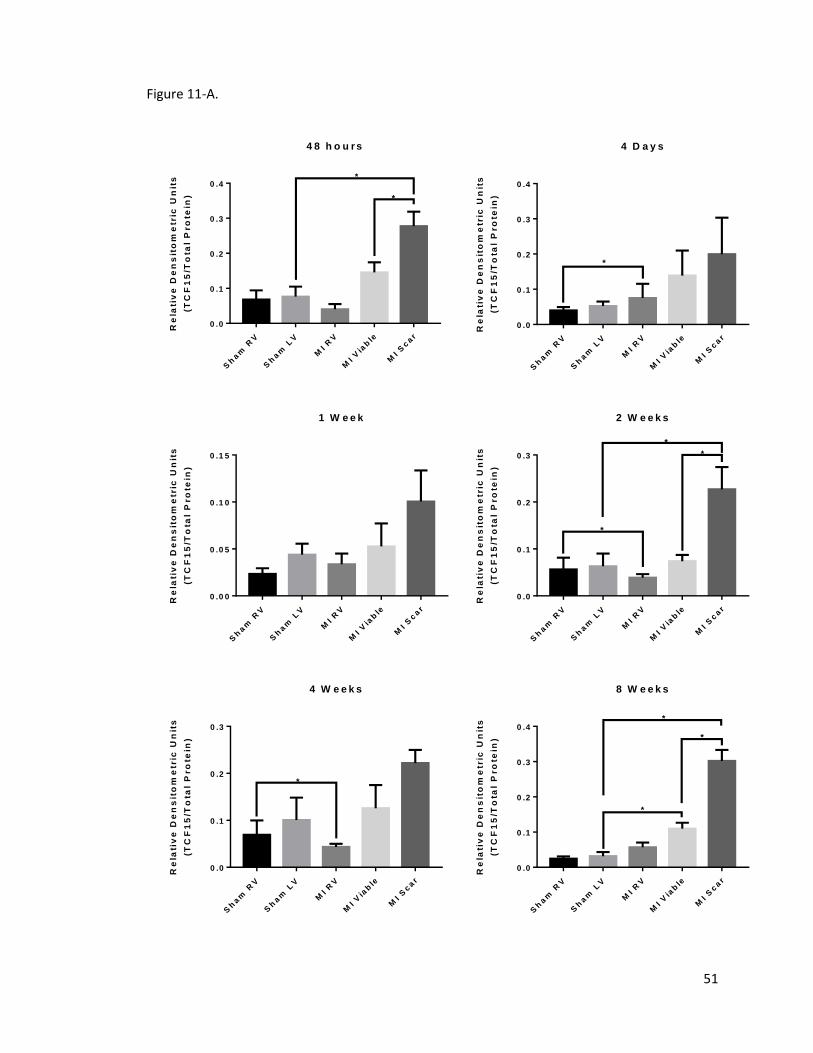
51
Sh
am
RV
Sh
am
LV
MI R
V
MI V
iab
le
MI S
car
0 .0
0 .1
0 .2
0 .3
0 .4
4 8 h o u r s
Re
lati
ve
De
ns
ito
me
tric
Un
its
(TC
F1
5/T
ota
l P
ro
tein
)*
*
Sh
am
RV
Sh
am
LV
MI R
V
MI V
iab
le
MI S
car
0 .0
0 .1
0 .2
0 .3
0 .4
4 D a y s
Re
lati
ve
De
ns
ito
me
tric
Un
its
(TC
F1
5/T
ota
l P
ro
tein
)
*
Sh
am
RV
Sh
am
LV
MI R
V
MI V
iab
le
MI S
car
0 .0 0
0 .0 5
0 .1 0
0 .1 5
1 W e e k
Re
lati
ve
De
ns
ito
me
tric
Un
its
(TC
F1
5/T
ota
l P
ro
tein
)
Sh
am
RV
Sh
am
LV
MI R
V
MI V
iab
le
MI S
car
0 .0
0 .1
0 .2
0 .3
2 W e e k s
Re
lati
ve
De
ns
ito
me
tric
Un
its
(TC
F1
5/T
ota
l P
ro
tein
)
*
*
*
Sh
am
RV
Sh
am
LV
MI R
V
MI V
iab
le
MI S
car
0 .0
0 .1
0 .2
0 .3
4 W e e k s
Re
lati
ve
De
ns
ito
me
tric
Un
its
(TC
F1
5/T
ota
l P
ro
tein
)
*
Sh
am
RV
Sh
am
LV
MI R
V
MI V
iab
le
MI S
car
0 .0
0 .1
0 .2
0 .3
0 .4
8 W e e k s
Re
lati
ve
De
ns
ito
me
tric
Un
its
(TC
F1
5/T
ota
l P
ro
tein
)
*
*
*
Figure 11-A.

52
Figure 11. Expression of transcription factor 15 (TCF15) in the infarcted rat heart
Protein was isolated from the right and left ventricles of sham-operated controls, right
ventricle as well as the viable and scar tissue of the left ventricle of post-myocardial
infarcted Sprague-Dawley rat hearts. TCF15 protein expression was analyzed using
Western analysis (n = 6 – 9). The histograms for the data obtained (A), as well as their
representative images (B); shows a significant increase in TCF15 expression within the
infarct scar at 48 hours, 2 weeks and 8 weeks. * P < 0.05.
Figure 11-B.

53
Discussion
Cardiac fibrosis is now recognized as a major contributor to progressive heart
failure [166, 167]. The ability of the left and right ventricles to relax optimally and
accept an appropriate volume of blood to preload the myocardium to optimal levels
depends on i) cardiac myocyte relaxation and ii) optimized structural arrangement of the
components of the extracellular matrix (ECM or matrix) [166]. The abnormal
accumulation and net expansion of the cardiac matrix in the cardiac interstitium is
commonly associated with post-MI cardiac dysfunction including reduction of ejection
fraction and impaired lusitropic function in various clinical heart failure-linked etiologies
and in rat experimental MI models [166, 168-170].
Cardiac fibrosis is a disease with no druggable targets for translatable cures,
despite the growing recognition of the association between cardiac fibrosis and heart
failure. Although recently pirfenidone and nintedanib have been FDA approved to treat
idiopathic pulmonary fibrosis. Although the mechanism of their antifibrotic effects is still
largely unknown, many groups have been investigating how these two drugs work [26].
A recent study has found that pirfenidone targets macrophages to favour the M1
polarization and decreases the M2 macrophage population, which promotes fibrogenesis
and tissue remodeling [171]. Another group has also shown that pirfenidone and
nintedanib both reduce myofibroblast activation into a more fibroblast-like state [27].
Both of these studies were carried out within the paradigm of idiopathic pulmonary
fibrosis. To date, there have been no publications on these two drugs with the focus of
cardiac fibrosis. Thus, while it is apparent that the need for biological therapies for the

54
treatment of cardiac fibrosis and heart failure is paramount, this field is still very much in
its infancy [172]. Further confounding this problem is the separation of acute wound
healing events vs those of chronic healing and the putative timing of antifibrotic therapy
for maximal benefit to the patient with overt cardiac fibrosis. Nonetheless, the search for
target molecules that bear relevance to the progression of cardiac fibrosis has begun to
gather momentum [109, 134-136, 150, 163]. In the present study we track the expression
of two paralog bHLH transcription factors, i.e. scleraxis and TCF-15, in experimental
heart failure. Our results indicate their significant increase in tissues of infarcted hearts
following MI. Thus we have taken a first step to demonstrate that these transcription
factors may function as players in this particular etiology of heart failure. More
specifically, we have identified TCF-15 as a putative target molecule for the treatment of
chronic fibrosis in damaged hearts. As we have previously shown that cardiac
myofibroblasts exist in the infarct scar well after the completion of wound healing, the
abnormal continued activation of these cells in the infarct scar may serve as a source of
myofibroblasts which eventually activate resident fibroblasts in the uninfarcted
myocardium, leading to diffuse interstitial fibrosis in both LV and RV [109, 163].
Echocardiography was carried out on sham-operated control and experimental
animal groups to allow us to verify the functional changes to infarcted hearts and to
provide a linkage between cardiac function and changes in expression of scleraxis and
TCF-15 (Figure 7). The infarcted area of post-MI hearts reached a maximum size at 4
days following infarction, followed by gradual reduction from 1 week to 8 weeks post-
MI. This trend confirms ongoing remodeling of the infarct scar beyond the inflammation
and proliferation phases of wound healing [9]. Further, our data confirms that the

55
maturation of the scar area starts between 4 days and 1 week, and continues out to 8
weeks post-MI [9]. The infarct scar may require a longer period of maturation in humans
[173]. Both the ejection fraction and the fractional shortening of the myocardium was
significantly decreased post-MI in all time points, revealing that all post-MI animals were
in a relatively uniform state of systolic dysfunction [174]. Diastolic function was not
measured and thus was not a focus of the current study. Aside from the decrease in heart
rate at 48 hours post-MI, there was no significant difference in heart rate compared to
sham-operated animals. Thus, the state of cardiac compensation and decompensation
could not be commented on. Following myocardial injury, there is an increase in
adrenergic stimulation to the heart to compensate for the loss of cardiac output [175,
176]. However, this mechanism only works for so long before the heart enters a state of
decompensation and heart function starts to progressively worsen [176]. We suggest that
the trending rise in heart rate is indicative of compensation by the adrenergic nervous
system and that the experimental group began to enter a decompensated state of cardiac
function at ~ 4 weeks. Clinically, decompensated cardiac performance may be defined
by exercise tolerance. Thus compensated heart failure is said to occur in patients who are
categorized with the New York Heart Association (NYHA) Class I and II heart failure,
with an unchanged or high exercise tolerance [177, 178]. Patients categorized with
NYHA Class III and IV heart failure are said to have decompensated heart failure, and
have a relatively low exercise tolerance [177, 178]. We were unable to collect data in
this mode – nevertheless the existing interspecies differences in healing phases
underscore the need for collection of similar data from animal models as it is in the clinic,

56
in order to carry out a proper comparison of clinical data and our in vivo experimental
work.
In humans, myofibroblasts have been identified within the infarct scar up to 17
years post-MI [179]. Molkentin and colleagues have investigated these cells and have
ascribed the term matrifibrocytes (personal communication). This term defines the cells
as mature matrix producers, as oppose to an immature cell type that the suffix “blast”
usually refers to. Regardless of their precise role in the infarct scar, their continuing
presence in the clinical setting is consistent with the current data that α-SMA expression
is significantly increased within the infarct scar area in all stages of wound healing and
infarct scar evolution (Figure 8). This protein is also found in other cardiac cells. For
example, during cardiogenesis, α-SMA is expressed in cardiomyocytes. As the heart fully
develops, α-SMA is replaced by adult isoforms of polymerized actin. When the heart
undergoes stress, α-SMA is again expressed with the fetal gene program in
cardiomyocytes [180]. α-SMA is also expressed in smooth muscle cells and pericytes of
the vasculature [181]. The infarct scar is devoid of cardiac myocytes, but does exhibit
limited establishment of microvascularization [182]. The use of sham-operated tissues as
experimental controls, as well as including tissue from remote regions of the heart,
should control for the levels of α-SMA from vascular tissues [182]. Thus we suggest
that the increase in α-SMA within the infarct scar is due to the presence of myofibroblasts
in the area [71], and our data clearly show that the preponderance of an elevated pattern
of expression does not change with maturation. In this case, its expression is similar to
what is seen in humans years after the initial insult [179].

57
During development in utero, TCF15 and scleraxis paralog genes are co-
expressed when somatic areas are newly forming and excessive amounts of matrix are
required to be synthesized. As the somite compartmentalizes, TCF15 expression
decreases but scleraxis expression remains high [153]. Our data shows that these two
proteins are again re-expressed within the infarct scar in both acute and chronic phases of
wound healing (Figure 10 and Figure 11); suggestive that either i) TCF15 is part of the
myofibroblast machinery allowing it to become hypersecretory for ECM proteins, well
beyond the capabilities of non-activated fibroblasts or ii) TCF15 has anti-fibrotic
properties and its expression may be part of a signaling cascade that naturally limits
fibrosis so that excessive amounts of matrix proteins are not deposited, making the heart
overly stiff. We note that a number of the E-boxes that TCF-15 binds to are similar to
those of which shared by scleraxis [154]. These data are suggestive that TCF15 and
scleraxis may have functional redundancy in the setting of post-infarct wound healing. If
this is true, then inhibition of one of these proteins may attenuate pathological fibrosis
without completely eliminating physiological wound healing and compromising the
structure of the heart. It may also have an undesired effect of upsetting wound healing, or
delaying it. On the other hand, if the two paralogs have inverse roles in the setting of
post-infarct healing and fibrosis, abrogation of TCF15 expression may lead to excessive
wound healing and an upregulation of TCF15 may work to limit pathological wound
healing. Further investigation into this mechanism for controlling cardiac wound healing
is justified.
Though it was significantly increased within the scar area at both early and late
time points, TCF15 expression was not significantly increased at 4 days, 1 week and 4
58
weeks post-MI. This could be due to the higher variability in some groups than in others,
which could affect the statistical significance even though the average expression was
increased in the scar area. Another factor that could play a role in lower statistical
significance is the strength of the strongest band. In an attempt to not underestimate the
TCF15 expression in the other samples, the band associated with the scar samples could
have become oversaturated, which could affect the measured values for those samples.
This however does not change the fact that TCF15 is significantly upregulated at both the
early and late phases of wound healing (Figure 11).
We note that commercial antibodies for bHLH transcription factors are not always
readily available, and this is especially true for both TCF15 and scleraxis. Throughout
this study, a number of different antibodies were tested to evaluate scleraxis expression in
vivo, and indeed this avenue of investigation began to dominate the experimental design.
As a subset of “specific” antibodies yielded non-specific binding (Figure 12), we sought
to verify the band pattern that we derived from our commercial antibody was indeed the
correct band. We utilized HEK 293S cells to directly transfect the pcDNA plasmid into,
as this cell type is competent, meaning it can be transformed with foreign plasmids at a
high efficiency, and lends itself to these kinds of experiments [183]. Prior to transfection,
the insert was sequenced by a third party and was verified to be the human scleraxis gene.
Although there was no statistically significant increase in scleraxis expression, the
transfection seemed to have a small but highly variable effect on scleraxis expression
(Figure 9). Further optimization of transfection conditions is required before this antibody
can be considered validated.

59
In conclusion we determined that in post-MI heart failure, both scleraxis and
TCF15 are increased in expression in the infarct scar of experimental animals. We
suggest that these two transcription factors may have redundant functions which serve to
make the cell hypersecretory for ECM proteins, or that these two transcription factors
have inverse functions which serves as a mechanism to limit wound healing before
excessive matrix deposition creates an overly stiff heart. If these two proteins have a
functional role in adult cardiac myofibroblasts at times of injury and fibrosis, one (or
both) of them may prove to be a demonstrable target for the suppression and/or disruption
of physiological wound healing in the setting of myocardial infarction. Further studies as
to the role of TCF15 and scleraxis in wound healing of post-MI hearts are warranted.
Limitations and Pitfalls. Any scientific study is subject to limitations of study
design and we acknowledge that this investigation is no exception. A significant
limitation to this study is that our expression results are limited to data collected from in
vivo experiments. We had originally set out to examine the relationship between ski and
scleraxis in cardiovascular wound healing, and the other in vitro sections to the proposed
study were completed by other personnel in the lab. As commercially available
antibodies for our target proteins became available, this investigation evolved to include
TCF15 as a target protein in a stand-alone project. A second limitation is that we did not
build a vector to overexpress TCF-15 to study first-hand the role that we hypothesized it
to play in isolated quiescent fibroblasts, and nor did we exploit its potential for Smad
protein binding. Another limitation to this study is that only a post-infarct model was
used and we suggest that using a TAC model of hypertension might yield a fibrotic heart
that displays all the classic signs of HFpEF, wherein there is a “pure” relationship

60
between diffuse interstitial cardiac fibrosis and heart failure, which would also broaden
the scope and importance of this work, especially for that of the meaning of TCF-15
overexpression. Finally, our study is limited to 8 weeks post-MI. It would be of interest to
determine whether severe heart failure stages invoke the elevated expression of either
TCF15 or scleraxis or both vs control myocardium.

61
Figure 12. Comparison of scleraxis antibodies
Representative images of the Western blot analysis of scleraxis using a lab-made
antibody (A) vs a commercial antibody (Abcam Cat# ab185940) (B). The commercial
Abcam antibody was chosen to continue our investigation.
Figure 12-A. Figure 12-B.

62
Future Directions
It is well documented that scleraxis is a pro-fibrotic effector in cardiac
myofibroblasts, but little information is available about TCF15 in these cells. This study
has led to possible new directions and novel research questions involving the function of
TCF15 in adult cardiac myofibroblasts. A future study should involve a full functional
characterization of TCF15 in cardiac fibroblasts and myofibroblasts.
First, expression levels of scleraxis and TCF15 along with common fibroblast and
myofibroblast markers, as well as the presence of stress fibres, should be carried out on
both fibroblasts and activated myofibroblasts. These two types of cellular states are
routinely achieved with culturing on differential substrate stiffness. The technique has
been optimized and validated by our research group. A culturing plate with 5 kPa
substrate stiffness mimics the conditions of healthy cardiac tissue in vivo and will
therefore keep the cells as fibroblast. A culturing plate with 100 kPa substrate stiffness
mimics the tissue stiffness of remodeled cardiac tissue, and thereby activating the
fibroblasts to myofibroblasts. These series of experiments will outline exactly how
abundant TCF15 is at specific activation states of the fibroblast or myofibroblast.
In a second series of experiments, markers of matrix production as well as
functional assays should be evaluated in gain of function studies for both scleraxis and
TCF15. This will show whether or not TCF15 expression affects the matrix production,
contractility, migration and proliferation of adult cardiac fibroblasts and myofibroblasts.
This wealth of data will provide us with the evidence needed to evaluate whether or not
TCF15 and scleraxis share similar functions in fibroblasts and activated myofibroblasts.

63
If TCF15 and scleraxis transcription factors do share similar roles in cardiac
fibroblasts, the next step will be to include an evaluation of the loss of function effects of
one of either of these two proteins in an in vivo infarct model similar to that which was
performed in this current study. Echocardiography, with an emphasis on both systolic and
diastolic function will be useful, as the endpoint of this experiment would be to test
whether the inhibition of one or both of these transcription factors will attenuate fibrosis
and improve cardiac function.
64
References
1. Benjamin, E.J., et al., Heart Disease and Stroke Statistics-2017 Update: A Report
From the American Heart Association. Circulation, 2017. 135(10): p. e146-e603.
2. Organization, W.H., The global burden of disease: 2004 update. 2004, Geneva.
146.
3. Mendis, S., P. Puska, and B. Norrving, Global atlas on cardiovascular disease
prevention and control: Polocies, stategies and interventions, ed. W.H.
Organization, W.H. Federation, and W.S. Organization. 2011, Geneva: World
Health Organization. 164.
4. Organization, W.H., Global Status Report on noncommunicable diseases 2014.
2014, Geneva: World Health Organization. 298.
5. Ordunez-Garcia, P. and C. Campillo-Artero, Regional Consultation: Priorities for
Cardiovascular Health in the Americas. Key Messages for Policymakers. 2011,
Washington, D. C.: Pan American Health Organization. 85.
6. Torres, N., et al., Nutrition and Atherosclerosis. Arch Med Res, 2015. 46(5): p.
408-26.
7. Sung, H.K., et al., Lipocalin-2 (NGAL) Attenuates Autophagy to Exacerbate
Cardiac Apoptosis Induced by Myocardial Ischemia. J Cell Physiol, 2017. 232(8):
p. 2125-2134.
8. Evonuk, K.S., et al., Myocardial ischemia/reperfusion impairs neurogenesis and
hippocampal-dependent learning and memory. Brain Behav Immun, 2017. 61: p.
266-273.
9. Czubryt, M.P., Common threads in cardiac fibrosis, infarct scar formation, and
wound healing. Fibrogenesis & Tissue Repair, 2012. 5.
10. Frangogiannis, N.G., Regulation of the inflammatory response in cardiac repair.
Circ Res, 2012. 110(1): p. 159-73.

65
11. Serhan, C.N., Pro-resolving lipid mediators are leads for resolution physiology.
Nature, 2014. 510(7503): p. 92-101.
12. Chistiakov, D.A., A.N. Orekhov, and Y.V. Bobryshev, The role of cardiac
fibroblasts in post-myocardial heart tissue repair. Exp Mol Pathol, 2016. 101(2):
p. 231-240.
13. Raggi, F., et al., Regulation of Human Macrophage M1-M2 Polarization Balance
by Hypoxia and the Triggering Receptor Expressed on Myeloid Cells-1. Front
Immunol, 2017. 8: p. 1097.
14. Cheng, Y., et al., omega-Alkynyl arachidonic acid promotes anti-inflammatory
macrophage M2 polarization against acute myocardial infarction via regulating
the cross-talk between PKM2, HIF-1alpha and iNOS. Biochim Biophys Acta,
2017.
15. Zhang, X., et al., Ginsenoside Rb1 enhances atherosclerotic plaque stability by
skewing macrophages to the M2 phenotype. J Cell Mol Med, 2017.
16. Chen, W. and N.G. Frangogiannis, Fibroblasts in post-infarction inflammation
and cardiac repair. Biochim Biophys Acta, 2013. 1833(4): p. 945-53.
17. Kanisicak, O., et al., Genetic lineage tracing defines myofibroblast origin and
function in the injured heart. Nat Commun, 2016. 7: p. 12260.
18. Cohn, J.N., Critical Review of Heart Failure: The Role of Left Ventricular
Remodeling in the Therapeutic Response. Clin Cardiol, 1995. 18.
19. Jun, J.I. and L.F. Lau, The matricellular protein CCN1 induces fibroblast
senescence and restricts fibrosis in cutaneous wound healing. Nat Cell Biol,
2010. 12(7): p. 676-85.
20. Istrătoaie, O., et al., Myocardial interstitial fibrosis - histological and
immunohistochemical aspects. Rom J Morphol Embryol, 2015. 56(4).
21. Nguyen, M.N., et al., Cardiac Fibrosis and Arrhythmogenesis. Compr Physiol,
2017. 7(3): p. 1009-1049.
66
22. Goh, V.J., et al., Novel Index of Maladaptive Myocardial Remodeling in
Hypertension. Circ Cardiovasc Imaging, 2017. 10(9).
23. Lorell, B.H. and B.A. Carabello, Left Ventricular Hypertrophy: Pathogenesis,
Detection and Prognosis. Circulation, 2000. 102(4).
24. Yu, C.M., et al., Diastolic and systolic asynchrony in patients with diastolic heart
failure: a common but ignored condition. J Am Coll Cardiol, 2007. 49(1): p. 97-
105.
25. Loffredo, F.S., et al., Heart failure with preserved ejection fraction: molecular
pathways of the aging myocardium. Circ Res, 2014. 115(1): p. 97-107.
26. Raghu, G. and M. Selman, Nintedanib and pirfenidone. New antifibrotic
treatments indicated for idiopathic pulmonary fibrosis offer hopes and raises
questions. Am J Respir Crit Care Med, 2015. 191(3): p. 252-4.
27. Lehtonen, S.T., et al., Pirfenidone and nintedanib modulate properties of
fibroblasts and myofibroblasts in idiopathic pulmonary fibrosis. Respir Res,
2016. 17: p. 14.
28. Antman, E., et al., Myocardial infarction redefined—a consensus document of
The Joint European Society of Cardiology/American College of Cardiology
committee for the redefinition of myocardial infarction. Journal of the American
College of Cardiology, 2000. 36(3): p. 959-969.
29. Thygesen, K., et al., Third universal definition of myocardial infarction.
Circulation, 2012. 126(16): p. 2020-35.
30. Mehta, R.H., et al., Association of bleeding and in-hospital mortality in black and
white patients with st-segment-elevation myocardial infarction receiving
reperfusion. Circulation, 2012. 125(14): p. 1727-34.
31. White, H.D. and D.P. Chew, Acute myocardial infarction. The Lancet, 2008.
372(9638): p. 570-584.
32. Jayamali, W.D., H. Herath, and A. Kulathunga, Myocardial infarction during
anaphylaxis in a young healthy male with normal coronary arteries- is
epinephrine the culprit? BMC Cardiovasc Disord, 2017. 17(1): p. 237.

67
33. Thygesen, K., et al., Universal definition of myocardial infarction. J Am Coll
Cardiol, 2007. 50(22): p. 2173-95.
34. Bordejevic, D.A., et al., Prognostic impact of blood pressure and heart rate at
admission on in-hospital mortality after primary percutaneous intervention for
acute myocardial infarction with ST-segment elevation in western Romania. Ther
Clin Risk Manag, 2017. 13: p. 1061-1068.
35. Yusuf, S., et al., Effect of potentially modifiable risk factors associated with
myocardial infarction in 52 countries (the INTERHEART study): case-control
study. The Lancet, 2004. 364(9438): p. 937-952.
36. Schmucker, J., et al., Socially disadvantaged city districts show a higher
incidence of acute ST-elevation myocardial infarctions with elevated
cardiovascular risk factors and worse prognosis. BMC Cardiovasc Disord, 2017.
17(1): p. 254.
37. Vernon, S.T., et al., Increasing proportion of ST elevation myocardial infarction
patients with coronary atherosclerosis poorly explained by standard modifiable
risk factors. Eur J Prev Cardiol, 2017: p. 2047487317720287.
38. Rodondi, N., et al., Framingham risk score and alternatives for prediction of
coronary heart disease in older adults. PLoS One, 2012. 7(3): p. e34287.
39. Killip, T.r. and J.T. Kimball, Treatment of myocardial infarction in a coronary
care unit. A two year experience with 250 patients. Am J Cardiol, 1967. 20(4).
40. Steg, P.G., et al., Determinants and prognostic impact of heart failure
complicating acute coronary syndromes: observations from the Global Registry
of Acute Coronary Events (GRACE). Circulation, 2004. 109(4): p. 494-9.
41. Rhyou, H.I., et al., Clinical factors associated with the development of atrial
fibrillation in the year following STEMI treated by primary PCI. J Cardiol, 2017.
42. Feldman, A.M., et al., Strategies for Pharmacologic Modulation of the Heart
Failure Phenotype. Clin Cardiol, 1995. 18.

68
43. Claeys, M.J., et al., Summary of 2016 ESC guidelines on heart failure, atrial
fibrillation, dyslipidaemia and cardiovascular prevention. Acta Cardiol, 2017: p.
1-6.
44. From, A.M. and B.A. Borlaug, Heart failure with preserved ejection fraction:
pathophysiology and emerging therapies. Cardiovasc Ther, 2011. 29(4): p. e6-21.
45. Abebe, T.B., et al., Patients with HFpEF and HFrEF have different clinical
characteristics but similar prognosis: a retrospective cohort study. BMC
Cardiovasc Disord, 2016. 16(1): p. 232.
46. Paez-Rubio, M.I., et al., Heart failure with preserved and reduced ejection
fraction: different phenotypes in old-elderly patients? Eur J Intern Med, 2013.
24(4): p. 346-8.
47. Chan, M.M. and C.S. Lam, How do patients with heart failure with preserved
ejection fraction die? Eur J Heart Fail, 2013. 15(6): p. 604-13.
48. Kontogeorgos, S., et al., Heart failure with preserved ejection fraction has a
better long-term prognosis than heart failure with reduced ejection fraction in old
patients in a 5-year follow-up retrospective study. Int J Cardiol, 2017. 232: p. 86-
92.
49. Maeder, M.T. and D.M. Kaye, Differential impact of heart rate and blood
pressure on outcome in patients with heart failure with reduced versus preserved
left ventricular ejection fraction. Int J Cardiol, 2012. 155(2): p. 249-56.
50. Pascual-Figal, D.A., et al., Mid-range left ventricular ejection fraction: Clinical
profile and cause of death in ambulatory patients with chronic heart failure. Int J
Cardiol, 2017. 240: p. 265-270.
51. Frangogiannis, N.G., The extracellular matrix in myocardial injury, repair, and
remodeling. J Clin Invest, 2017. 127(5): p. 1600-1612.
52. Frantz, C., K.M. Stewert, and V.M. Weaver, The extracellular matrix at a glance.
J Cell Sci, 2010. 123(24).
69
53. Ma, Y., et al., Myofibroblasts and the extracellular matrix network in post-
myocardial infarction cardiac remodeling. Pflugers Arch, 2014. 466(6): p. 1113-
27.
54. Shamhart, P.E. and J.G. Meszaros, Non-fibrillar collagens: key mediators of post-
infarction cardiac remodeling? J Mol Cell Cardiol, 2010. 48(3): p. 530-7.
55. Ma, Y., G.V. Halade, and M.L. Lindsey, Extracellular matrix and fibroblast
communication following myocardial infarction. J Cardiovasc Transl Res, 2012.
5(6): p. 848-57.
56. Halper, J. and M. Kjaer, Basic components of connective tissues and extracellular
matrix: elastin, fibrillin, fibulins, fibrinogen, fibronectin, laminin, tenascins and
thrombospondins. Adv Exp Med Biol, 2014. 802: p. 31-47.
57. Conway, S.J. and J.D. Molkentin, Periostin as a Heterofunctional Regulator of
Cardiac Development and Disease. Current Genomics, 2008. 9(8).
58. Landry, N.M., S. Cohen, and I.M.C. Dixon, Periostin in cardiovascular disease
and development: a tale of two distinct roles. Basic Res Cardiol, 2017. 113(1): p.
1.
59. Zhao, S., et al., Periostin expression is upregulated and associated with
myocardial fibrosis in human failing hearts. J Cardiol, 2014. 63(5): p. 373-8.
60. Ahmed, M.S., et al., Mechanisms of novel cardioprotective functions of
CCN2/CTGF in myocardial ischemia-reperfusion injury. Am J Physiol Heart Circ
Physiol, 2011. 300(4): p. H1291-302.
61. Ahmed, M.S., et al., Connective tissue growth factor--a novel mediator of
angiotensin II-stimulated cardiac fibroblast activation in heart failure in rats. J
Mol Cell Cardiol, 2004. 36(3): p. 393-404.
62. Rienks, M. and A.P. Papageorgiou, Novel regulators of cardiac inflammation:
Matricellular proteins expand their repertoire. J Mol Cell Cardiol, 2016. 91: p.
172-8.
63. Murry, C.E., et al., Macrophages Express Osteopontin during Repair of
Myocardial Necrosis. Am J Pathol, 1994. 145(6).

70
64. Chaplin, D.D., Overview of the immune response. J Allergy Clin Immunol, 2010.
125(2 Suppl 2): p. S3-23.
65. Lu, P., et al., Extracellular matrix degradation and remodeling in development
and disease. Cold Spring Harb Perspect Biol, 2011. 3(12).
66. Camelliti, P., T.K. Borg, and P. Kohl, Structural and functional characterisation
of cardiac fibroblasts. Cardiovasc Res, 2005. 65(1): p. 40-51.
67. Cai, C.L., et al., A myocardial lineage derives from Tbx18 epicardial cells.
Nature, 2008. 454(7200): p. 104-8.
68. Mikawa, T. and R.G. Gourdie, Pericardial Mesoderm Generates a Population of
Coronary Smooth Muscle Cells Migrating into the Heart along with Ingrowth of
the Epicardial Organ. Dev Biol, 1996. 174.
69. Tyagi, S.C., Physiology and homeostasis of extracellular matrix: cardiovascular
adaptation and remodeling. Pathophysiology, 2000. 7(3).
70. Pinto, A.R., et al., Revisiting Cardiac Cellular Composition. Circ Res, 2016.
118(3): p. 400-9.
71. Santiago, J.J., et al., Cardiac fibroblast to myofibroblast differentiation in vivo
and in vitro: expression of focal adhesion components in neonatal and adult rat
ventricular myofibroblasts. Dev Dyn, 2010. 239(6): p. 1573-84.
72. Hinz, B., Myofibroblasts. Exp Eye Res, 2016. 142: p. 56-70.
73. Yeh, Y.H., et al., Nicotinamide adenine dinucleotide phosphate oxidase 4
mediates the differential responsiveness of atrial versus ventricular fibroblasts to
transforming growth factor-beta. Circ Arrhythm Electrophysiol, 2013. 6(4): p.
790-8.
74. Santiago, J.J., et al., High molecular weight fibroblast growth factor-2 in the
human heart is a potential target for prevention of cardiac remodeling. PLoS
One, 2014. 9(5): p. e97281.
71
75. Bochaton-Piallat, M.L., G. Gabbiani, and B. Hinz, The myofibroblast in wound
healing and fibrosis: answered and unanswered questions. F1000Res, 2016. 5.
76. Tomasek, J.J., et al., Myofibroblasts and mechano-regulation of connective tissue
remodelling. Nat Rev Mol Cell Biol, 2002. 3(5): p. 349-63.
77. Desmouliere, A., C. Chaponnier, and F. Gabbiani, Tissue repair, contraction, and
the myofibroblast. Wound Repair Regen, 2005. 13(1).
78. Sigel, A.V., M. Centrella, and M. Eghbali-Webb, Regulation of Proliferative
Response of Cardiac Fibroblasts by Transforming Growth Factor-beta1. J Mol
Cell Cardiol, 1996. 28.
79. Desmouliere, A., et al., Transforming Growth Factor-beta1 Induces alpha-
Smooth Muscle Actin Expression in Granulation Tissue Myofibroblasts and in
Quiescent and Growing Cultured Fibroblasts. J Cell Biol, 1993. 122(1): p. 8.
80. Taipale, J. and J. Keski-Oja, Growth factors in the extracellular matrix. FASEB J,
1997. 11: p. 8.
81. Lyons, R.M., et al., Mechanism of Activation of Latent Recombinant
Transforming Growth Factor-beta1 by Plasmin. J Cell Biol, 1990. 110.
82. Sarrazy, V., et al., Integrins alphavbeta5 and alphavbeta3 promote latent TGF-
beta1 activation by human cardiac fibroblast contraction. Cardiovasc Res, 2014.
102(3): p. 407-17.
83. Watson, S., T. Burnside, and W. Carver, Angiotensin II-Stimulated Collagen Gel
Contraction By Heart Fibroblasts: Role of the AT1 Receptor and Tyrosine Kinase
Activity. J Cell Physiol, 1998. 117(2).
84. Naugle, J.E., et al., Type VI collagen induces cardiac myofibroblast
differentiation: implications for postinfarction remodeling. Am J Physiol Heart
Circ Physiol, 2006. 290(1): p. H323-30.
85. Nishida, M., et al., Galpha12/13-mediated up-regulation of TRPC6 negatively
regulates endothelin-1-induced cardiac myofibroblast formation and collagen
synthesis through nuclear factor of activated T cells activation. J Biol Chem,
2007. 282(32): p. 23117-28.
72
86. Small, E.M., et al., Myocardin-related transcription factor-a controls
myofibroblast activation and fibrosis in response to myocardial infarction. Circ
Res, 2010. 107(2): p. 294-304.
87. Roche, P.L., et al., Intracellular signaling of cardiac fibroblasts. Compr Physiol,
2015. 5(2): p. 721-60.
88. Wang, J., et al., Mechanical force regulation of myofibroblast differentiation in
cardiac fibroblasts. Am J Physiol Heart Circ Physiol, 2003. 285.
89. Papakrivopoulou, J., et al., Differential roles of extracellular signal-regulated
kinase 1/2 and p38MAPK in mechanical load-induced procollagen alpha1(I) gene
expression in cardiac fibroblasts. Cardiovasc Res, 2004. 61(4): p. 736-44.
90. Horn, M.A. and A.W. Trafford, Aging and the cardiac collagen matrix: Novel
mediators of fibrotic remodelling. J Mol Cell Cardiol, 2016. 93: p. 175-85.
91. Cukierman, E., et al., Taking Cell-Matrix Adhesions to the Third Dimension.
Science, 2001. 294.
92. Kramann, R., et al., Perivascular Gli1+ progenitors are key contributors to
injury-induced organ fibrosis. Cell Stem Cell, 2015. 16(1): p. 51-66.
93. Zeisberg, E.M., et al., Endothelial-to-mesenchymal transition contributes to
cardiac fibrosis. Nat Med, 2007. 13(8): p. 952-61.
94. Crawford, J.R., et al., Origin of developmental precursors dictates the
pathophysiologic role of cardiac fibroblasts. J Cardiovasc Transl Res, 2012. 5(6):
p. 749-59.
95. van Putten, S., Y. Shafieyan, and B. Hinz, Mechanical control of cardiac
myofibroblasts. J Mol Cell Cardiol, 2016. 93: p. 133-42.
96. Hynes, R.O., Integrins: versatility, modulation, and signaling in cell adhesion.
Cell, 1992. 69(1).

73
97. Merna, N., et al., Differential beta3 Integrin Expression Regulates the Response
of Human Lung and Cardiac Fibroblasts to Extracellular Matrix and Its
Components. Tissue Eng Part A, 2015. 21(15-16): p. 2195-205.
98. Goldsmith, E.C., et al., Myocardial fibroblast-matrix interactions and potential
therapeutic targets. J Mol Cell Cardiol, 2014. 70: p. 92-9.
99. Bouzeghrane, F., et al., Alpha8beta1 integrin is upregulated in myofibroblasts of
fibrotic and scarring myocardium. J Mol Cell Cardiol, 2004. 36(3): p. 343-53.
100. Thibault, G., et al., Upregulation of alpha(8)beta(1)-integrin in cardiac firboblast
by angiotensin II and transforming growth factor-beta1. Am J Physiol Cell
Physiol, 2001. 281(5).
101. Stawowy, P., et al., Protein kinase C epsilon mediates angiotensin II-induced
activation of beta1-integrins in cardiac fibroblasts. Cardiovasc Res, 2005. 67(1):
p. 50-9.
102. Bryant, J.E., et al., Cardiac myofibroblast differentiation is attenuated by alpha(3)
integrin blockade: potential role in post-MI remodeling. J Mol Cell Cardiol, 2009.
46(2): p. 186-92.
103. Kamkin, A., Activation and inactivation of a non-selective cation conductance by
local mechanical deformation of acutely isolated cardiac fibroblasts.
Cardiovascular Research, 2003. 57(3): p. 793-803.
104. Chilton, L., et al., K+ currents regulate the resting membrane potential,
proliferation, and contractile responses in ventricular fibroblasts and
myofibroblasts. Am J Physiol Heart Circ Physiol, 2005. 288(6): p. H2931-9.
105. Kamkin, A., I. Kiseleva, and G. Isenberg, Activation and inactivation of a non-
selective cation conductance by local mechanical deformation of acutely isolated
cardiac fibroblasts. Cardiovasc Res, 2003. 57(3): p. 793-803.
106. Ruwhof, C., et al., Signal transduction of mechanical stress in myocytes and
fibroblasts derived from neonatal rat ventricles. Neth Heart J, 2001. 9(9).

74
107. Liao, X.D., et al., Mechanical stretch induces mitochondria-dependent apoptosis
in neonatal rat cardiomyocytes and G2/M accumulation in cardiac fibroblasts.
Cell Research, 2004. 14(1).
108. Hu, B.S., et al., An analysis of the effects of stretch on IGF-I secretion from rat
ventricular fibroblasts. AJP: Heart and Circulatory Physiology, 2007. 293(1): p.
H677-H683.
109. Cunnington, R.H., et al., Antifibrotic properties of c-Ski and its regulation of
cardiac myofibroblast phenotype and contractility. Am J Physiol Cell Physiol,
2011. 300(1): p. C176-86.
110. Roy, S.G., Y. Nozaki, and S.H. Phan, Regulation of alpha-smooth muscle actin
gene expression in myofibroblast differentiation from rat lung fibroblasts. Int J
Biochem Cell Biol, 2001. 33(7).
111. Prunotto, M., et al., Stable incorporation of alpha-smooth muscle actin into stress
fibres is dependent on specific tropomyosin isoforms. Cytoskeleton (Hoboken),
2015. 72(6).
112. Hinz, B., et al., Recent developments in myofibroblast biology: paradigms for
connective tissue remodeling. Am J Pathol, 2012. 180(4): p. 1340-55.
113. Hinz, B., et al., Alpha-Smooth Muscle Actin Expression Upregulates Fibroblast
Contractile Activity. Mol Biol Cell, 2001. 12(9).
114. Shinde, A.V., C. Humeres, and N.G. Frangogiannis, The role of alpha-smooth
muscle actin in fibroblast-mediated matrix contraction and remodeling. Biochim
Biophys Acta, 2017. 1863(1): p. 298-309.
115. Hinz, B., Formation and function of the myofibroblast during tissue repair. J
Invest Dermatol, 2007. 127(3): p. 526-37.
116. Phosri, S., et al., Stimulation of Adenosine A2B Receptor Inhibits Endothelin-1-
Induced Cardiac Fibroblast Proliferation and alpha-Smooth Muscle Actin
Synthesis Through the cAMP/Epac/PI3K/Akt-Signaling Pathway. Front
Pharmacol, 2017. 8: p. 428.

75
117. Abdalla, M., et al., Akt1 mediates alpha-smooth muscle actin expression and
myofibroblast differentiation via myocardin and serum response factor. J Biol
Chem, 2013. 288(46): p. 33483-93.
118. Hao, J., et al., Elevation of Expression of Smads 2, 3, and 4, Decorin and TGF-
beta in the Chronic Phase of Myocardial Infarct Scar Healing. J Mol Cell
Cardiol, 1999. 31(3).
119. Klingberg, F., et al., The ED-A domain enhances the capacity of fibronectin to
store latent TGF-beta binding protein-1 in the fibroblast matrix. J Cell Sci, 2018.
120. Hinz, B., The extracellular matrix and transforming growth factor-beta1: Tale of
a strained relationship. Matrix Biol, 2015. 47: p. 54-65.
121. Luo, K. and H.F. Lodish, Signaling by chimeric erythropoietin-TGF-beta
receptors: homodimerization of the cytoplasmic domain of the type I TGF-beta
receptor and heterodimerization with the type II receptor are both required for
intracellular signal transduction. EMBO J, 1996. 15(17).
122. Qian, S.W., et al., Binding Affinity of Transforming Growth Factor-beta for Its
Type II Receptor Is Determined by the C-terminal Region of the Molecule. J Biol
Chem, 1996. 271(48).
123. Nakao, A., et al., TGF-beta receptor-mediated signalling through Smad2, Smad3
and Smad4. EMBO J, 1997. 16(17).
124. Macías-Silva, M., et al., MADR2 Is a Substrate of the TGFβ Receptor and Its
Phosphorylation Is Required for Nuclear Accumulation and Signaling. Cell, 1996.
87(7): p. 1215-1224.
125. Souchelnytsky, S., et al., Phosphorylation of Ser465 and Ser467 in the C
Terminus of Smad2 Mediates Interaction with Smad4 and Is Required for
Transforming Growth Factor-beta Signaling. J Biol Chem, 1997. 272(44).
126. Yingling, J.M., et al., Tumor Supressor Smad4 Is a Transforming Growth Factor-
beta Inducible DNA Binding Protein. Mol Cell Biol, 1997. 17(12).
127. Song, C.Z., T.E. Siok, and T.D. Gelehrter, Smad4/DPC4 and Smad3 Mediate
Transforming Growth Factor-beta (TGFbeta) Signaling through Direct Binding

76
to a Novel TGF-beta-responsive Element in the Human Plasminogen Activator
Inhibitor-1 Promoter. J Biol Chem, 1998. 273(45).
128. Dennler, S., et al., Direct binding of Smad3 and Smad4 to critical TGF-beta
inducible elements in the promoter of himan plasminogen activator inhibitor-type
1 gene. EMBO J, 1998. 17(11).
129. Hayashi, H., et al., The MAD-Related Protein Smad7 Associates with the TGF-
beta Receptor and Functions as an Antagonist of TGF-beta Signaling. Cell, 1997.
89(7).
130. Nakao, A., et al., Identification of Smad7, a TGF-beta-inducible antagonist of
TGF-beta signalling. Nature, 1997. 389.
131. Chen, S.J., et al., Stimulation of type I collagen transcription in human skin
fibroblasts by TGF-beta: involvement of Smad 3. J Invest Dermatol, 1999. 112(1):
p. 49-57.
132. Vindevoghel, L., et al., Smad-dependant Transcriptional Activation of Human
Type VII Collagen Gene (COL7A1) Promoter by Transforming Growth Factor-
beta. J Biol Chem, 1998. 273(21).
133. Zhao, Y., Transforming growth factor-beta (TGF-beta) type I and type II
receptors are both required for TGF-beta-mediated extracellular matrix
production in lung fibroblasts. Mol Cell Endocrinol, 1999. 150.
134. Bagchi, R.A. and M.P. Czubryt, Synergistic roles of scleraxis and Smads in the
regulation of collagen 1alpha2 gene expression. Biochim Biophys Acta, 2012.
1823(10): p. 1936-44.
135. Bagchi, R.A., et al., Regulation of fibronectin gene expression in cardiac
fibroblasts by scleraxis. Cell Tissue Res, 2016. 366(2): p. 381-391.
136. Bagchi, R.A., et al., The transcription factor scleraxis is a critical regulator of
cardiac fibroblast phenotype. BMC Biol, 2016. 14: p. 21.
137. Cserjesi, P., et al., Scleraxis: a basic helix-loop-helix protein that prefigures
skeletal formation durng mouse embryogenesis. Development, 1995. 121: p. 1099
- 1110.

77
138. Liu, Y., et al., Sclerotome-related helic-loop-helic type transcription factor
(scleraxis) mRNA is expressed in osteoblasts and its level is enhanced by type-
beta transforming growth factor. Journal of Endocrinology, 1996. 151: p. 491 -
499.
139. Liu, Y., et al., Overexpression of a single helix-loop-helix-type transcription
factor, scleraxis, enhances aggrecan gene expression in osteoblastic
osteosarcoma ROS17/2.8 Cells. Journal of Biological Chemistry, 1997. 272(47):
p. 29880 - 29885.
140. Perez, A.V., et al., Scleraxis (Scx) directs lacZ expression in tendon of transgenic
mice. Mechanisms of Development, 2003. 120(10): p. 1153-1163.
141. Shukunami, C., et al., Scleraxis positively regulates the expression of
tenomodulin, a differentiation marker of tenocytes. Dev Biol, 2006. 298(1): p.
234-47.
142. Blitz, E., et al., Bone ridge patterning during musculoskeletal assembly is
mediated through SCX regulation of Bmp4 at the tendon-skeleton junction. Dev
Cell, 2009. 17(6): p. 861-73.
143. Schweitzer, R., et al., Analysis of the tendon cell fate using Scleraxis, a specific
marker for tendons and ligaments. Development, 2001. 128: p. 3855 - 3866.
144. Lejard, V., et al., Scleraxis and NFATc regulate the expression of the pro-
alpha1(I) collagen gene in tendon fibroblasts. J Biol Chem, 2007. 282(24): p.
17665-75.
145. Furumatsu, T., et al., Scleraxis and E47 cooperatively regulate the Sox9-
dependent transcription. Int J Biochem Cell Biol, 2010. 42(1): p. 148-56.
146. Murchison, N.D., et al., Regulation of tendon differentiation by scleraxis
distinguishes force-transmitting tendons from muscle-anchoring tendons.
Development, 2007. 134(14): p. 2697-708.
147. Levay, A.K., et al., Scleraxis is required for cell lineage differentiation and
extracellular matrix remodeling during murine heart valve formation in vivo. Circ
Res, 2008. 103(9): p. 948-56.

78
148. Barnette, D.N., et al., Tgfbeta-Smad and MAPK signaling mediate scleraxis and
proteoglycan expression in heart valves. J Mol Cell Cardiol, 2013. 65: p. 137-46.
149. Espira, L., et al., The basic helix–loop–helix transcription factor scleraxis
regulates fibroblast collagen synthesis. Journal of Molecular and Cellular
Cardiology, 2009. 47: p. 188-195.
150. Roche, P.L., et al., Role of scleraxis in mechanical stretch-mediated regulation of
cardiac myofibroblast phenotype. Am J Physiol Cell Physiol, 2016. 311(2): p.
C297-307.
151. Bagchi, R.A., et al., Regulation of scleraxis transcriptional activity by serine
phosphorylation. J Mol Cell Cardiol, 2016. 92: p. 140-148.
152. Skinner, M.K., et al., Basic helix-loop-helix transcription factor gene family
phylogenetics and nomenclature. Differentiation, 2010. 80(1): p. 1-8.
153. Burgess, R., et al., Paraxis: A Basic Helix-Loop-Helix Protein Expressed in
Paraxial Mesoderm and Developing Somites. Dev Biol, 1995. 168: p. 296 - 306.
154. Wilson-Rawls, J., J.M. Rhee, and A. Rawls, Paraxis is a basic helix-loop-helix
protein that positively regulates transcription through binding to specific E-box
elements. J Biol Chem, 2004. 279(36): p. 37685-92.
155. Sosic, D., et al., Regulation of paraxis Expression and Somite Formation by
Ectoderm- and Neural Tube-Derived Signals. Dev Biol, 1997. 185: p. 229 - 243.
156. Rowton, M., et al., Regulation of mesenchymal-to-epithelial transition by
PARAXIS during somitogenesis. Dev Dyn, 2013. 242(11): p. 1332-44.
157. Barnes, G.L., et al., Cloning and Characterization of Chicken Paraxis: A
Regulator of Paraxial Mesoderm Development and Somite Formation. Dev Biol,
1997. 189: p. 95 - 111.
158. Burgess, R., et al., Requirement of the paraxis gene for somite formation and
musculoskeletal patterning. Nature, 1996. 384: p. 570 - 573.

79
159. Delfini, M. and D. Duprez, Paraxis is expressed in myoblasts during their
migration and proliferation in the chick limb bud. Mechanisms of Development,
2000. 96: p. 247 - 251.
160. Wilson-Rawls, J., et al., Differential regulation of epaxial and hypaxial muscle
development by Paraxis. Development, 1999. 126: p. 5217 - 5229.
161. Coppiello, G., et al., Meox2/Tcf15 heterodimers program the heart capillary
endothelium for cardiac fatty acid uptake. Circulation, 2015. 131(9): p. 815-26.
162. Nielsen, S.H., et al., Understanding cardiac extracellular matrix remodeling to
develop biomarkers of myocardial infarction outcomes. Matrix Biol, 2017.
163. Cunnington, R.H., et al., The Ski-Zeb2-Meox2 pathway provides a novel
mechanism for regulation of the cardiac myofibroblast phenotype. J Cell Sci,
2014. 127(Pt 1): p. 40-9.
164. Yang, H.S., Three-dimensional echocardiography in adult congenital heart
disease. Korean J Intern Med, 2017. 32(4): p. 577-588.
165. Bordun, K.A., et al., The utility of cardiac biomarkers and echocardiography for
the early detection of bevacizumab- and sunitinib-mediated cardiotoxicity. Am J
Physiol Heart Circ Physiol, 2015. 309(4): p. H692-701.
166. Schelbert, E.B., et al., Temporal Relation Between Myocardial Fibrosis and Heart
Failure With Preserved Ejection Fraction: Association With Baseline Disease
Severity and Subsequent Outcome. JAMA Cardiol, 2017. 2(9): p. 995-1006.
167. Thum, T., et al., MicroRNA-21 contributes to myocardial disease by stimulating
MAP kinase signalling in fibroblasts. Nature, 2008. 456(7224): p. 980-4.
168. Martos, R., et al., Diastolic heart failure: evidence of increased myocardial
collagen turnover linked to diastolic dysfunction. Circulation, 2007. 115(7): p.
888-95.
169. Su, M.Y., et al., CMR-verified diffuse myocardial fibrosis is associated with
diastolic dysfunction in HFpEF. JACC Cardiovasc Imaging, 2014. 7(10): p. 991-
7.

80
170. Salerno, M., Seeing the unseen fibrosis in heart failure with preserved ejection
fraction. JACC Cardiovasc Imaging, 2014. 7(10): p. 998-1000.
171. Toda, M., et al., 122 - Pirfenidone Suppresses Pulmonary Fibrosis Through
Regulation of Alveolar Macrophage Polarization. Free Radical Biology and
Medicine, 2016. 100: p. S62.
172. Taylor, D.A., The use of biologics in the management of cardiovascular diseases.
Curr Opin Pharmacol, 2017. 33: p. 76-80.
173. Cleutjens, J.P., et al., The infarcted myocardium: Simply dead tissue, or a lively
target for therapeutic interventions. Cardiovascular Research, 1999. 44(2).
174. Madan, S., et al., Outcomes After Transplantation of Donor Hearts With
Improving Left Ventricular Systolic Dysfunction. J Am Coll Cardiol, 2017.
70(10): p. 1248-1258.
175. Meerson, F.Z., Compensatory hyperfunction of the heart and cardiac
insufficiency. Circ Res, 1962. 10(3).
176. Lymperopoulos, A., G. Rengo, and W.J. Koch, Adrenergic nervous system in
heart failure: pathophysiology and therapy. Circ Res, 2013. 113(6): p. 739-53.
177. Millane, T., et al., ABC of heart failure. Acute and chronic management
strategies. BMJ, 2000. 320(7234): p. 559-62.
178. Arroyo, M., et al., Micronutrients in African-Americans with decompensated and
compensated heart failure. Transl Res, 2006. 148(6): p. 301-8.
179. Willems, I.E., et al., The alpha-Smooth Muscle Actin-Positive Cells in Healing
Human Myocardial Scars. Am J Pathol, 1994. 145(4).
180. Clement, S., et al., Expression and function of alpha-smooth muscle actin during
embryonic-stem-cell-derived cardiomyocyte differentiation. J Cell Sci, 2007.
120(Pt 2): p. 229-38.

81
181. Skalli, O., et al., Alpha-smooth muscle actin, a differentiation marker of smooth
muscle cells, is present in microfilamentous bundles of pericytes. J Histochem
Cytochem, 1989. 37(3): p. 315-21.
182. Sun, Y. and K.T. Weber, Infarct scar: a dynamic tissue. Cardiovasc Res, 2000.
46(2): p. 250-6.
183. Chan, W.T., et al., A comparison and optimization of methods and factors
affecting the transformation of Escherichia coli. Biosci Rep, 2013. 33(6).
Recommended