1
Science Research Mentoring Program
GENETICSThis course introduces students to the structure and function of the genome,
techniques in molecular biology used in Museum laboratories, and to the
generation, transmission, and study of genetic variation in the context of
evolution and species identification.
Session 1: DNA Biochemistry
Session 2: The Dogma of Molecular Biology
Session 3: Heredity and Mendelian Genetics
Session 4: What’s in the Genome?
Session 5: Mutations and the Mutation Rate
Session 6: DNA Sequence Databases
Session 7: Sequence Alignments and Sequence Divergence
Session 8: Tree-Building
Session 9: Poster Preparation
Session 10: Poster Session
Session 11: Caviar Lab: Species Identification with Molecular Methods
Session 12: Genome Sequencing, the HGP, and Bioethics
4
9
13
19
23
27
32
36
40
42
43
46

Science Research Mentoring Program GENETICS
© 2011 American Museum of Natural History. All Rights Reserved. 2
Session One: DNA Biochemistry
L E A R N I N G o B j E C T I v E S
Students should understand that DNA is common to all living organisms, know the principles of base pairing, identify and define the 5’ and 3’ ends of a DNA molecule, and name the structural features of DNA that are pertinent to its study in the laboratory.
k E y T o P I C S
• What is DNA?
• Nucleotide structure
• Hydrogen bonding, pyrimidines vs. purines, and base pairing
• Antiparallel structure of DNA
C L A S S o u T L I N E
T I M E
15 minutes
20 minutes
15 minutes
50 minutes
20 minutes
T o P I C
Assessment and Icebreaker
Tour of Sackler Lab
DNA Structure Review: Part 1
Discussion: DNA Structure Review
Introduction to the Use of DNA in Museum Research
D E S C R I P T I o N
Have all students introduce themselves, and provide one
fact about DNA.
Discuss what we do with DNA at the museum: purify,
amplify, sequence.
Divided into groups, students list everything they
know about the structure of DNA. Ask them to organize
from small to large. Give magnetic DNA models to help
brainstorm.
Map student lists on whiteboard, from the smallest
structures to the largest. Include these key points, even if
not generated by students: elements in DNA, nucleotide
structure, biochemistry of base pairing and strand
formation, hydrogen bonds in base pairing vs. covalent
bonds in backbone, antiparallel structure, chromatin.
Discussion of cladogram on 4th floor – what do trees
represent, and how does this relate to DNA? What
does genetic information contribute to the study of
evolutionary relationships?
Science Research Mentoring Program GENETICS
© 2011 American Museum of Natural History. All Rights Reserved. 3
Session One: DNA Biochemistry (continued)
M A T E R I A L S
• Magnetic molecular models of DNA
• Whiteboard markers
P R E P A R A T I o N
None required.
E x H I B I T I o N H A L L S
• Fourth Floor: Dinosaur Tree
A u D I o - v I S u A L N E E D S
None required.
H o M E W o R k
optional reading: Graham, E. 2007. DNA Reviews: Ancient DNA. Forensic Sci Med Pathol, 3:221
http://www.springerlink.com/content/k6v11122m42550w2/

Science Research Mentoring Program GENETICS
© 2011 American Museum of Natural History. All Rights Reserved. 4
Session One: DNA Biochemistry
Activity: DNA Structure Review
o v E R v I E W
This activity assesses students’ prior knowledge of DNA structure and biochemistry, and uses whiteboard mapping and DNA models to organize facts about DNA structure from the atomic to the cellular levels. It emphasizes aspects of DNA structure that are important for common laboratory techniques such as polymerase chain reaction.
T I M E F R A M E
approximately one hour
M A T E R I A L S
• molecular models of nucleotides, preferably magnetic (demonstrating hydrogen bonding
and sugar-phosphate bonding). If necessary, the activity can be done without models.
P R o C E D u R E
1. In pairs or small groups, have students brainstorm a list of everything they know
about DNA structure. Ask students to begin with the smallest unit of DNA structure or
components that they can come up with (the elements found in DNA). Then ask them to
come up with the next largest, and so on. Remind them to focus on what DNA looks like at
the molecular level, not what it does. Then ask them to choose the single most important
fact about the function of DNA (hereditary material).
2. Map these student-generated facts about DNA structure on a whiteboard, from smallest to
largest. At each step, use the magnetic models to illustrate, and ask students to draw the
structures or molecules wherever applicable.
The following should be touched on:
• Elements in DNA (C, H, o, N, P)
• Structure of a single nucleotide (sugar, phosphate, base)
• Connecting nucleotides to each other (Covalent bonds in the sugar-phosphate
backbone; Hydrogen bonds between base pairs)
• Base pairing
• Purines vs pyrimidines (What is the difference in basic structure? Why do these
always pair with each other?)
• G-C vs A-T pairs (number of hydrogen bonds)
• Antiparallel structure (5’, 3’)
• DNA in the cell (chromatin, histones, and chromosomes)
Science Research Mentoring Program GENETICS
© 2011 American Museum of Natural History. All Rights Reserved. 5
Session Two: The Dogma of Molecular Biology
L E A R N I N G o B j E C T I v E S
Students should be able to describe the distinguishing characteristics of a DNA molecule, an RNA molecule, and a protein molecule. They should also be able to explain that DNA codes for RNA, which is translated into protein, and that proteins are the major molecular players in cellular structure and function.
k E y T o P I C S
• DNA chemistry vs RNA chemistry
• Protein function and biochemistry
• Amino acid code & degeneracy
• Transcription and translation
C L A S S o u T L I N E
T I M E
30 minutes
1 hour
15 minutes
15 minutes
T o P I C
Review of the Dogma
Modeling Transcription and Translation
Model Sharing
D E S C R I P T I o N
Lecture covering basics of RNA structure, transcription,
translation, and functions of proteins.
In groups, students build candy & toothpick models of
transcription and translation.
Students explain their models to each other.
M A T E R I A L S
• toothpicks
• candy (marshmallows, M&Ms, sour patch kids, Twizzlers, etc)
• large paper to cover tables
• bowls
• markers
H o M E W o R k
optional reading: Henikoff, S. 2002 Beyond the Central Dogma. Bioinformatics, 18:223
http://www.scienceboard.net/community/perspectives.81.html

Science Research Mentoring Program GENETICS
© 2011 American Museum of Natural History. All Rights Reserved. 6
Session Two: The Dogma of Molecular Biology
Activity: Modeling Transcription and Translation
o v E R v I E W
This is a hands-on review of the process of RNA transcription and protein translation. Students use candy to build relatively detailed models of these processes, and explain their models to each other.
T I M E F R A M E
one hour, 15 minutes
M A T E R I A L S
• craft paper rolls
• assorted candies in a variety of colors, shapes, and sizes (such as marshmallows, M&Ms,
gummi anything, Twizzlers)
• toothpicks
• markers
• bowls for candy
P R o C E D u R E
1. Divide students into small groups. Cover tables with craft paper and provide students
with colored markers. Explain that they will be working in groups to make a model
that illustrates the following process: transcription and translation of a four-amino-
acid peptide. The model can be made of any materials, and will be used to explain these
processes to someone else. Tell them to make sure to distinguish between DNA and RNA
molecules, to include start and stop codons, and to label parts as necessary.
2. Let students work fairly independently as time allows.
3. Bring students together as a class and have each group explain their model to the class.

Science Research Mentoring Program GENETICS
© 2011 American Museum of Natural History. All Rights Reserved. 7
Session Three: Heredity and Mendelian Genetics
L E A R N I N G o B j E C T I v E S
Students should be able to explain the relationship and difference between alleles, genotypes, phenotypes, and traits; construct and analyze a punnet square.
k E y T o P I C S
• Mendelian inheritance
• Homozygous vs heterozygous
• Dominant, recessive, codominant
• Pedigrees
• Monogenic vs polygenic traits
C L A S S o u T L I N E
T I M E
30 minutes
1 hour
10 minutes
20 minutes
T o P I C
Lecture
Activity: Phenotype, Genotype, and Paternity
Discussion
D E S C R I P T I o N
Covering the relationships between genotype,
phenotype, traits, gene, allele, locus. Basic Mendelian
genetics (Punnet square construction, dominant,
recessive, and co-dominant alleles).
Students type a family’s “blood samples” and determine
the phenotypes and genotypes of siblings and parents
Beyond Mendel: monogenic vs polygenic traits,
epigenetics
M A T E R I A L S
• Blood typing and pedigree worksheets
• “blood” and “antigen” solutions aliquoted
• micropipetters
• pipet tips
• parafilm

Science Research Mentoring Program GENETICS
© 2011 American Museum of Natural History. All Rights Reserved. 8
Session Three: Heredity and Mendelian Genetics (continued)
P R E P A R A T I o N
Aliquot solutions for each group.
H o M E W o R k
optional reading: Crow, jF. 1993. Felix Bernstein and the First Human Marker Locus. Genetics
133:4
http://www.ncbi.nlm.nih.gov/pmc/articles/PMC1205297/?tool=pmcentrez

Science Research Mentoring Program GENETICS
© 2011 American Museum of Natural History. All Rights Reserved. 9
Session Three: Heredity and Mendelian Genetics
Activity: Phenotype, Genotype, and Paternity
o v E R v I E W
This activity illustrates the relationship between genotype and phenotype by using the principles of Mendelian inheritance to identify a family pedigree. Using a synthetic blood typing kit, students determine the phenotypes and potential genotypes of a group of siblings and their potential parents, then reconstruct the siblings’ pedigrees and actual genotypes.
T I M E F R A M E
one hour, 10 minutes
M A T E R I A L S
• worksheets
• micropipetters
• pipet tips
• Parafilm or blood typing trays
• Carolina synthetic blood Whose Baby? kit. Label aliquots of the “blood” as follows
(70 ul each), enough for one per group:
Siblings: Mother: A Potential Fathers:
1 – A 1 – AB
2 – AB 2 – o
3 – o 3 – B
4 – A
5 – B
• Aliquot approximately 500 ul of the A and B “antisera” per group
P R o C E D u R E
1. Ask students what they know about blood type. How many blood types are there? use this
knowledge about to discuss the blood alleles A, B, and o, and have the students list all the
potential genotypes for this locus. Have the students rely on prior knowledge to explain
whether each allele is dominant, recessive, or codominant. Then ask them to list the
phenotypes associated with each genotype. There are 6 possible genotypes (AA, Ao, BB,
Bo, AB, and oo) but only 4 possible phenotypes (A, B, AB, and o).

Science Research Mentoring Program GENETICS
© 2011 American Museum of Natural History. All Rights Reserved. 10
Session Three: Activity: Phenotype, Genotype, and Paternity (continued)
2. Briefly discuss the use of antiserum to determine blood type. Ask students to explain
whether this type of test describes genotype or phenotype, and when phenotype would or
would not make it possible to predict paternity.
3. Students identify the phenotype of each sample by pipetting antiserum and blood samples
onto parafilm and checking for precipitation. Next, ask them to answer the questions on
the worksheet. Note that this activity assumes that students are familiar with the use of a
micropipetter. If not, allow time for them to practice, or use the dropper bottles provided
by the kit.
Science Research Mentoring Program GENETICS
© 2011 American Museum of Natural History. All Rights Reserved. 11
Session Three: Heredity and Mendelian Genetics: WORKSHEET
Blood Type: Phenotype, Genotype, and Paternity
I N T R o D u C T I o N
Blood type is determined by co-dominant alleles with a Mendelian pattern of inheritance. There
are three alleles for human blood type: A, B, and o. A and B are co-dominant, while o is recessive.
A and B are genes involved in the production of proteins that are present on the surface of red
blood cells, and can cross-react with antibodies, or immune proteins. The o allele is a deletion
mutation, and means that the blood cell protein can’t be detected using antibodies.
How many possible genotypes are there for blood type? How many possible phenotypes are there
for blood type?
Blood type is tested by using antibodies that react with either the A or B-modified proteins. If
anti-A antibody is added to either type A or AB blood, an agglutination reaction will occur and
the blood cells will clump up in visible grains. If anti-A antibody is added to type B or o blood, no
agglutination reaction will occur, and the blood remains smooth.
Prior to the development of DNA fingerprinting technology, blood typing could be used to attempt
to determine paternity. Consider the following scenario: A family has quintuplets, who were
conceived using in vitro fertilization. The mother suspects that there was a mix-up at the clinic,
and that her husband is not their biological father.
your job is to investigate which of three possible candidates is the father of these quintuplets. you
will be given blood samples from each of the quintuplets, the mother, and three potential fathers,
as well as anti-A and anti-B antibodies. you will test each blood sample to answer the questions on
the back of the page.
P R o C E D u R E T o T E S T B L o o D S A M P L E S
1. Pipet 30 ul of each blood sample onto parafilm, or into each of two wells of a blood typing
slide (30 ul per well). If you are using parafilm, use a Sharpie to label one side “A” and one
side “B”.
2. Add 30 ul of anti-A (blue) to the well/parafilm labeled A.
3. Add 30 ul of anti-B (yellow) to the well/parafilm labeled B.
4. using the pipet tip, gently stir the blood and anti-serum drops for 30 seconds.
5. Carefully examine the films of liquid left behind. If a film remains uniform in appearance,
there is no agglutination. If the sample appears granular, agglutination has occurred.
6. Wipe the blood typing slide with a wet paper towel and dry between each use.

Science Research Mentoring Program GENETICS
© 2011 American Museum of Natural History. All Rights Reserved. 12
WORKSHEET: Blood Type: Phenotype, Genotype, and Paternity (continued)
y o u R o B S E R v A T I o N S
1. What is the phenotype of each individual?
2. What is the genotype of each parent?
3. Who is the father?
4. What is the genotype of each quintuplet?
5. The mother’s husband is potential father #2. What is the probability that their next child
will have blood type B? What is the probability that their next child will have blood type o?
Show your work.

Science Research Mentoring Program GENETICS
© 2011 American Museum of Natural History. All Rights Reserved. 13
Session Four: What is in the Genome?L E A R N I N G o B j E C T I v E S
Students should be able to explain the difference between coding and noncoding DNA, know that coding DNA makes up only a small percentage of the eukaryotic genome, and be able to name three DNA elements that define a coding region.
k E y T o P I C S
• Coding vs noncoding DNA
• What characterizes a coding region – polyadenylation, kozak sequences, oRFs
• Functional non-coding DNA – promoters, telomeres, introns
• Repetitive sequences – transposons, microsatellites, telomeres, duplications
• Identification of individuals using microsatellites – applications to pop/con bio
C L A S S o u T L I N E
T I M E
30 minutes
30 minutes
1 hour
T o P I C
Lecture
Activity: Gene Finding
Lecture
D E S C R I P T I o N
Covering definitions of coding and non-coding DNA,
genes, features of coding regions
Students use online tools to identify start/stop sites,
oRFs, kozak sequences, polyA signal sequences, etc. in
an unknown sequence. Adapted from DNA Learning
Center, http://www.dnai.org/c/index.html?m=1,1
Covering functions of noncoding DNA, repetitive
sequences, gene duplications, use of microsatellites in
pop/con bio and paternity testing
M A T E R I A L S
• Laptops w/sequence files and links to online tools
• Paper copies of sequence for annotation
P R E P A R A T I o N
Load sequence files
H o M E W o R k
optional reading: vIB (the Flanders Institute for Biotechnology). “Saved By junk DNA: vital Role
In The Evolution of Human Genome.” ScienceDaily, 30 May 2009. Web. 15 jul. 2011.

Science Research Mentoring Program GENETICS
© 2011 American Museum of Natural History. All Rights Reserved. 14
Session Five: Mutations and the Mutation Rate
L E A R N I N G o B j E C T I v E S
Students should understand the various sources of mutations, their potential consequences, and the effect of selection on the heritability of mutations and the mutation rate.
k E y T o P I C S
• Mechanisms of mutation generation
• Synonymous vs nonsynonymous mutations
• Heritability of mutations
• Mutation rates
C L A S S o u T L I N E
T I M E
30 minutes
45 minutes
45 minutes
T o P I C
Lecture
Worksheet: Mutation
Discussion
D E S C R I P T I o N
Mutations and how they occur
Students complete individual worksheets covering sense,
missense, nonsense, frameshift mutations
What affects the mutation rate? Compare b/w species,
types of DNA (coding vs. noncoding). Why is this
important when scientists use DNA to infer phylogeny?
M A T E R I A L S
• mutation worksheets, found here:
http://heredity.wikispaces.com/file/view/mutations_worksheet.pdf
H o M E W o R k
optional reading: Marris, E. Molecular clock tied to fossil record. Nature News, oct 11, 2004.
http://www.nature.com/news/2004/041011/full/news041011-2.html

Science Research Mentoring Program GENETICS
© 2011 American Museum of Natural History. All Rights Reserved. 15
Session Six: DNA Sequence Databases
L E A R N I N G o B j E C T I v E S
Students should be able to use Genbank to find and download nucleic acid or protein sequences, explain the difference between mitochondrial and nuclear DNA, and the difference between introns and exons.
k E y T o P I C S
• using Genbank and other sequence databases
• Independent project: collecting gene sequences for alignment
C L A S S o u T L I N E
T I M E
30 minutes
30 minutes
1 hour
T o P I C
Lecture and Demonstration
Activity: Genbank Game
Independent Project:
Downloading Sequences
D E S C R I P T I o N
Introducing students to the Genbank database with
sample searches. Important databases: Protein,
Nucleotide, Gene. Students can follow along on laptops.
Students compete to find facts using Genbank
Students work in pairs to decide on a question/
hypothesis for their independent project, and locate and
download DNA sequences of appropriate species/genes.
M A T E R I A L S
• Laptops with internet, worksheets for independent project

Science Research Mentoring Program GENETICS
© 2011 American Museum of Natural History. All Rights Reserved. 16
Session Six: DNA Sequence Databases
Activity: Genbank Game
o v E R v I E W
Students practice retrieving information from NCBI’s Genbank in a gameshow-style contest.
T I M E F R A M E
30 minutes
M A T E R I A L S
• Computers with internet (one per group)
• Projector and Powerpoint presentation with questions
P R o C E D u R E
(Assumes you have reviewed the Nucleotide, Protein, and Gene databases on Entrez.)
1. Assign students to internet-connected computers. (Group size will depend on how many
computers are available; students in large groups can take turns searching for answers.)
Explain that they will be doing searches for information on Genbank in head-to-head
competition – the first group to find a correct answer wins a point. offer an appropriate
prize. (For example, let the winning group choose get the first choice of taxa for the
independent project.)
2. Have the students load the Genbank main page:
http://www.ncbi.nlm.nih.gov/genbank/
3. Remind students that they need to read the questions carefully in advance: will they
need to look for a protein sequence? An mRNA sequence? Which will be the appropriate
database to search? Will they need to add any additional information besides the species
and the gene name, such as “mRNA”? Remind them that they may need to use the
scientific name of the organism in their search to get the best results.
4. Project slides with the following questions. When a group arrives at a correct answer, tally
the point and move on to the next slide. If necessary, do the first few questions as a group,
making sure to ask students what database they think they should search, and why.
NoTE: As the database is updated, you may want to doublecheck the answers to these
questions.
Science Research Mentoring Program GENETICS
© 2011 American Museum of Natural History. All Rights Reserved. 17
Session Six: Activity: Genbank Game (continued)
• From what species is the gene with accession number Gu452716?
Answer: Triticum aestivum
• How many base pairs are transcribed from the chimpanzee dopamine receptor D2 gene?
Answer: 1322
• How many exons does the human actin alpha 1 gene have?
Answer: 6
• How many amino acids does the cytochrome c oxidase subunit 1 have in Aspidosiphon
elegans?
Answer: 216
• For how many different species is there a record of a sonic hedgehog gene or gene
homolog?
Answer: 16
• What is the first amino acid in the Bos Taurus alpha-synuclein protein?
Answer: M
• How many introns does the human Lrp10 gene have?
Answer: 6
• What chromosome is the rat Mdm2 gene on?
Answer: 7
• What are the last three amino acids of the Danio rerio Wnt2 protein?
Answer: TQS
• What is the 300th nucleotide in the transcript of human neuropeptide y?
Answer: A

Science Research Mentoring Program GENETICS
© 2011 American Museum of Natural History. All Rights Reserved. 18
Session Six: DNA Sequence Databases
Activity: Independent Tree Building ProjectDay 1: Choosing a question and downloading sequences
o v E R v I E W
This independent project leads students through the construction of a phylogenetic tree, from downloading sequence data to aligning sequences to tree building. Students will compare two types of DNA to build trees of relationships of the same set of taxa, and then consider which tree is more “accurate” and why. Students will work in pairs, and present their work in the form of a scientific poster.
This activity is step one of the independent project: students choose a set of taxa to focus on from a given list, choose 2 types of DNA to compare, generate a hypothesis, and download and format the DNA sequences.
T I M E F R A M E
1 hour
M A T E R I A L S
• Computers with internet access
• Copies of reference papers for each set of taxa
• Sequence downloading worksheet
P R o C E D u R E
(Assumes you have reviewed the Nucleotide, Protein, and Gene databases on Entrez.)
1. Divide students into pairs. Give them the independent project overview handout, and have
them select a) a question, i.e., which types of DNA they will compare in this exercise, and b)
a taxa to focus on. Provide the appropriate reference paper for each taxa. Have each team
choose a number of species in the paper, and locate the gene IDs they’ll need to search for
in order to download the sequences. Important: students will need to choose an outgroup
for their tree and download the outgroup sequences as well. Appropriate outgroups can be
found in the reference papers.
2. Before downloading sequences, have each pair come up with a hypothesis as to which tree
they build will be more accurate. Have students explain what is meant by “accurate” in this
case (i.e., closest to the tree in the reference paper with the more complete dataset), and
share their hypotheses and reasoning.

Science Research Mentoring Program GENETICS
© 2011 American Museum of Natural History. All Rights Reserved. 19
Session Six: Activity: Independent Tree Building Project (continued)
3. Give students sequence downloading and formatting worksheets to follow. Each group
will need to download either 1 or 2 sequences per species. If they are comparing nuclear
introns or exons and mtDNA, they will need to download 2 separate sequences. If they
are comparing longer to shorter DNA sequences, they will only need to download one
sequence.
4. Make sure that students are formatting their sequences according to the instructions, and
that they are properly saved for the next session’s alignment activity.
R E F E R E N C E S
(students may need information provided in supplements, so be sure to include these):
Rodents: Montgelard, C et al. 2008. Suprafamilial relationships among Rodentia and the
phylogenetic effect of removing fast-evolving nucleotides in mitochondrial, exon and intron
fragments. BMC Evolutionary Biology 8:321
Turtles: Naro-Maciel, E et al. 2008. Evolutionary relationships of marine turtles: A molecular
phylogeny based on mitochondrial and nuclear genes. Molecular Phylogenetics and Evolution,
49:659
Lemurs: yoder, A and yang, Z. 2004. Divergence dates for Malagasy lemurs estimated from
multiple gene loci: geological and evolutionary context. Molecular Ecology, 13:757
Plasmodium: Perkins, S and Scholl, j. 2002. A molecular phylogeny of malarial parasites recovered
from Cytochrome b gene sequences. The journal of Parasitology 88:972

Science Research Mentoring Program GENETICS
© 2011 American Museum of Natural History. All Rights Reserved. 20
Session Six: DNA Sequence Databases: WORKSHEET
Genetics Independent Project
I N T R o D u C T I o N
Working with a partner, construct phylogenetic trees (trees depicting evolutionary relationships)
using different portions of genomic DNA (including mitochondrial DNA, nuclear DNA exons, and
nuclear DNA introns) or using different lengths of genes. This exercise will help you understand
the different mutational rates associated with diverse loci and to conceptualize how different
evolutionary relationships may be recovered using different portions or lengths of genomic DNA.
P R o j E C T o u T L I N E
Data collection for student projects will begin with this session. you and your partner will work
together over the next three sessions to construct phylogenetic trees. you will then create a poster
together, and all results will be shared during Session 10. By the end of this assignment, you will
be able to construct a tree of evolutionary relationships for its animal group, and to analyze the
results in a phylogenetic context. This is definitely beyond the scope of any “regular” high school
class, so you should be very proud of yourselves!
Here’s a brief outline of what you will accomplish during each session:
Session 6: Download Genbank DNA sequences and fix file formatting
Session 7: Alignments of sequences and divergence estimates
Session 8: Phylogenetic tree building
Session 9: Creation of Posters
Session 10: Poster Presentation/Discussion Session
The data you will collect is provided below. During Session 6, we will ask you each to pick your
favorite question, and you will then choose among the following taxa and loci for completion of
your project.

Science Research Mentoring Program GENETICS
© 2011 American Museum of Natural History. All Rights Reserved. 21
WORKSHEET: Genetics Independent Project (continued)
D A T A C o L L E C T I o N
Q u E S T I o N
Nuclear Exon (nuExon vs.
Mitochondrial (mtDNA)
Mitochondrial (mtDNA)
vs. Nuclear Intron (nuInt)
300 bp DNA vs. all
available DNA
T A x A
1. Rodents (Montgelard et al., 2008)
2. Turtles (Naro-Maciel et al., 2008)
3. Lemurs (yoder and yang, 2004)
1. Rodents (Montgelard et al., 2008)
2. Turtles (Naro-Maciel et al., 2008)
3. Lemurs (yoder and yang, 2004)
1. Rodents (Montgelard et al., 2008)
2. Turtles (Naro-Maciel et al., 2008)
3. Lemurs (yoder and yang, 2004)
4. Plasmodium (Perkins + Schall, 2002)
L o C I
vWF (nuExon), CyTB (mtDNA)
C-MoS (nuExon), 16S (mtDNA)
IRBP (nuExon), CoII (mtDNA)
CyTB (mtDNA), SPTBN (nuInt)
16S (mtDNA), R35 (nuInt)
CoII (mtDNA), Transthyretin (nuInt)
IRBP (nuExon)
RAG-1 (nuExon)
CyT-B (mtDNA)
CyT-B (mtDNA)

Science Research Mentoring Program GENETICS
© 2011 American Museum of Natural History. All Rights Reserved. 22
Session Six: DNA Sequence Databases: WORKSHEET
Downloading Sequences and File Formatting
P R o C E D u R E
1. Ingroup/outgroup Selection: Decide which taxa/individuals you would like to include in
your analysis (4-5 in the “ingroup”). The decision may depend upon on whether the project
is focused on recovering relationships between genera, or between species, or between
individuals, etc. you may want to also choose based on the geographic distribution of
taxa, in order to relate how geography may influence the shape of the tree (also known
as topology). you will also need one outgroup (to root the tree). The papers should list
appropriate outgroup taxa.
2. Accession Numbers: Find the accession numbers for these taxa/individuals in the paper.
Make sure you choose the accession numbers that correspond to the loci. (Correct loci are
provided.) Accession numbers typically look something like: “HQ130531.”
3. Genbank and Fasta Files: Find your sequences in Genbank (search nucleotides) at
http://www.ncbi.nlm.nih.gov/genbank/
4. Click “FASTA” on the upper right hand side. Copy and paste this sequence to a textedit
(MACS) or notepad (PCs) document. Go to “Format” “Make Plain Text”. Add a “>name” above
the sequence. keep this name short (less than 10 characters, if possible), but informative
enough that you can cross-reference the new names to the names in the paper. Repeat this
until you have finished copying and pasting your sequences into the correct files.
5. you should have separate files for each locus!
Save each of these files as “youRGENE.TxT”.
For example, if you were working with ND2
and RAG1, you would have two separate files:
“ND2.txt” and “RAG1.txt”. These files should
have sequences for the same taxa/individuals.
6. Everyone’s FASTA files should look exactly like
this. Don’t forget to have an outgroup! Most
groups will have two files – one for each locus.
However, groups using different lengths of one
gene will only have one file (for now).

Science Research Mentoring Program GENETICS
© 2011 American Museum of Natural History. All Rights Reserved. 23
Session Seven: Sequence Alignments and Sequence Divergence
L E A R N I N G o B j E C T I v E S
Students should: understand the reason for doing sequence alignments, be able to use BLAST and Muscle to do alignments, and be able to estimate sequence divergence by hand.
k E y T o P I C S
• Sequence alignments – why we need to do them
• Gene homology
• Software for alignments
C L A S S o u T L I N E
T I M E
20 minutes
1 hour
40 minutes
T o P I C
Lecture and Discussion
Worksheet: Alignment and Discussion
Independent Project:
Alignments
D E S C R I P T I o N
What is an alignment and why do we need to do it?
Discuss an image of a gene alignment and its features
(matches, gaps, mismatches).
Students work individually to align DNA sequences by
hand and calculate percent similarity. Share percent
similarities, and discuss why everyone got different
results. (There is no right way to do an alignment.)
Discuss the tradeoffs between mismatches and gaps.
using worksheet instructions, students use MuSCLE
online to align the sets of sequences downloaded in
the last class. They should save alignments; each group
should have two.
M A T E R I A L S
• Laptops
• Worksheets for alignment and independent projects

Science Research Mentoring Program GENETICS
© 2011 American Museum of Natural History. All Rights Reserved. 24
Session Seven: Sequence Alignments and Sequence Divergence: WORKSHEET
Alignments by Hand
P R o C E D u R E
use the directions and grid below to align the following sequences to the best of your their ability.
1. Label each sequence with its identifying number.
2. use dashes to represent gaps in the sequence.
3. The longest sequence should not have any gaps.
4. Mismatches are allowed, but not preferable. Changes between (C and T) and (G and A) are
preferred over others. Why do you think that is?
5. The goal is to maximize similarity, i.e., as many similar letters and as few gaps in each
column as possible.
1 - GAATCTGCTC
2 - GAATCCTGCCC
3 - GAAATCTCTC
4 - GAATCCTTGCTC
5 - GATCCGCTC
6. Calculate the overall percent similarity between these sequences. (Percent similarity
consists of the number of sites with identical bases/total length of longest sequence.)
Science Research Mentoring Program GENETICS
© 2011 American Museum of Natural History. All Rights Reserved. 25
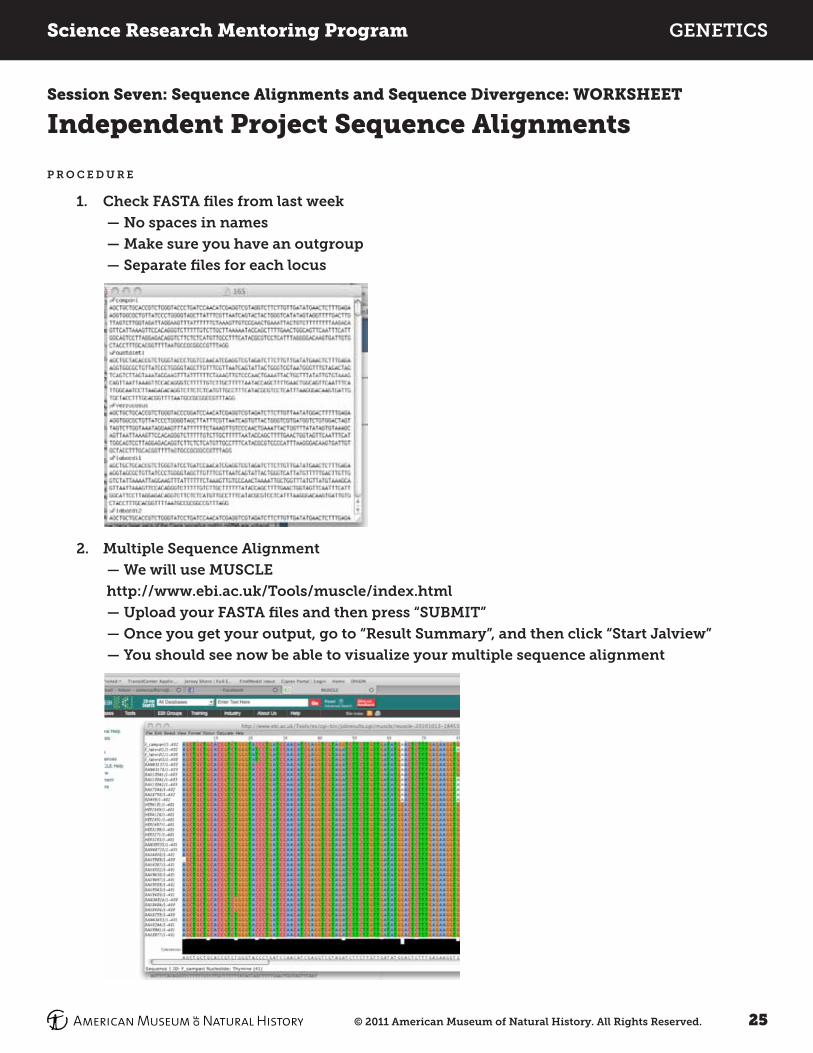
Session Seven: Sequence Alignments and Sequence Divergence: WORKSHEET
Independent Project Sequence Alignments
P R o C E D u R E
1. Check FASTA files from last week
— No spaces in names
— Make sure you have an outgroup
— Separate files for each locus
2. Multiple Sequence Alignment
— We will use MuSCLE
http://www.ebi.ac.uk/Tools/muscle/index.html
— upload your FASTA files and then press “SuBMIT”
— once you get your output, go to “Result Summary”, and then click “Start jalview”
— you should see now be able to visualize your multiple sequence alignment

Science Research Mentoring Program GENETICS
© 2011 American Museum of Natural History. All Rights Reserved. 26
WORKSHEET: Independent Project Sequence Alignments (continued)
P R o C E D u R E
3. FASTA File Formatting
— Follow these steps to get your alignment into a new FASTA file
— File > outbox to textbox > FASTA > Copy to Notepad or TextEdit
— Save as “yourgene_aligned.txt” (ex. ND2_aligned.txt)
— Fix filenames: Get rid of text following the original taxa/individual name you assigned
last week. For example, for the alignment above, I would need to delete every “/1-401”
— Correct FASTA alignment files should look similar to this:
Notice: The file is named 16S_aligned.txt, and there are no numbers behind the taxa/
individual names. Also, there are now some –‘s in your file. Ask students why those now
occur?
4. Depends on your group! For groups looking at Questions 1 and 2 (nuclear exons/
mitochondrial DNA or mitochondrial DNA/nuclear introns)
— Simply repeat the above steps with your second locus
— For groups looking at Question 3 (the different lengths exercise with one locus)
— Do alignment of whole sequences and save it as “gene_alignwhole.txt”
— Delete from either the beginning or end of the alignment so you only have about
300 bp remaining
— Do this while in jalview: highlight all of the sequences and simply press “DELETE” on
your keyboard
— Repeat Step Three, and now save this new alignment as “gene_alignshort.txt”. you
should now have two FASTA aligned documents like everyone else in the class!

Science Research Mentoring Program GENETICS
© 2011 American Museum of Natural History. All Rights Reserved. 27
Session Eight: Tree Building
L E A R N I N G o B j E C T I v E S
Students should be able to use free software to construct a tree, to explain the reason that outgroups are used in tree construction, and to understand that the genes chosen for tree construction can affect outcome.
k E y T o P I C S
• Tree building with molecular data
• Effect of outgroups
• Programs for building trees
• Analysis of trees
C L A S S o u T L I N E
T I M E
15 minutes
30 minutes
45 minutes
T o P I C
Review of Trees
Worksheet: Tree Building
Independent Project:
Tree Building
D E S C R I P T I o N
Review major features of trees in discussion.
Students build trees by hand with sequence data. Discuss
the correct tree.
Students build trees online with downloaded sequence
data.
M A T E R I A L S
• Laptops with internet connection
• Tree-building worksheets
• Independent project tree-building worksheet

Science Research Mentoring Program GENETICS
© 2011 American Museum of Natural History. All Rights Reserved. 28
Session Eight: Tree Building: WORKSHEET
Tree Building by Hand
P R o C E D u R E
1. Construct a phylogenetic tree of the species below from the following sequence data:
Sequence of kITH Gene
Species Scott (outgroup): CCGTAGTATACG
Species kevin: CCGTAGTAAACG
Species Bruce: CCCTACTAAGCC
Species Dave: CCCTAGTAAACG
2. How many characters are in this data? How many are informative? How many are
uninformative?
3. What would be the effect of changing the outgroup from Scott to Dave? If you have time,
construct this tree.

Science Research Mentoring Program GENETICS
© 2011 American Museum of Natural History. All Rights Reserved. 29
Session Eight: Tree Building: WORKSHEET
Tree Building for Independent Project
P R o C E D u R E
1. Check your alignment files. Make sure your aligned files look exactly like this one. only the
species name should be included after the >. your sequences should have some – between
your DNA bases; these signify gaps in the alignment.
2. Fill in the necessary information to create your phylogenetic tree. Go to this website:
http://indra.mullins.microbiol.washington.edu/DIvEIN/index.html and choose the option:
Phylogeny/Divergence/Diversity
— Data Input: upload your alignment file, make sure to choose the option “FASTA”
(because you still have a FASTA file), and choose your sequence data type as “DNA”
— Substitution Model: Make sure to choose the option “GTR”, other options can remain as
default
— Tree Searching: For type of tree improvement, choose “Best of NNI and SPR”, optimise
tree as “topology and branch lengths”
— Divergence/Diversity measurements: Choose to calculate divergence from “Consensus”
and Calculate divergence/diversity based on “Pairwise distance”
— Enter your email address. your results will be emailed to this address, so make sure you
type it in correctly. Then repeat this process for your second loci.
***REMEMBER: Each group should have two alignment files because you are comparing
the topologies obtained from two different loci. Therefore, you will have to submit two
separate requests, one for each loci.

Science Research Mentoring Program GENETICS
© 2011 American Museum of Natural History. All Rights Reserved. 30
WORKSHEET: Tree Building for Independent Project (continued)
3. Retrieve your phylogenetic tree. Check your email to retrieve your results. The email
should say “Please click here to receive your results.”
— Choose the option MLE tree and click “view.” A black window with your phylogenetic
tree should (hopefully) appear.
— Remember that we did not assign an outgroup when we sent in our request. Therefore,
we will have to now define your outgroup. under “click on node to,” choose the option
“root/reroot” and then click the node connected to your outgroup taxon. Play around with
the other options (for example, the option “order subtrees” might make it easier to see the
relationships in your phylogenetic tree).
— This is your phylogenetic tree for one of your loci. Complete the same task for the other
loci, and start drawing conclusions about your hypotheses. Are the trees the same? Do
they show the same relationships? How do your trees compare to the trees in the original
papers?
— Save and/or copy your trees. Check your alignment files. Make sure your aligned
files look exactly like this one. only the species name should be included after the >.
your sequences should have some – between your DNA bases; these signify gaps in the
alignment.
4. Estimate divergence. The website offers a few ways to calculate divergence estimates
(how different your sequences are from one another). In STEP oNE, we chose to calculate
the divergence from consensus (the consensus sequence of all your sequences). This is
not ideal, but it is one way to visualize how much your sequences diverge. Click “view”
for both the “Pairwise based divergence from Consensus” and “Pairwise based diversity.”
Concentrate on the mean values – do these differ much between loci? Do these values
differ between groups?

Science Research Mentoring Program GENETICS
© 2011 American Museum of Natural History. All Rights Reserved. 31
Session Nine: Poster Preparation
L E A R N I N G o B j E C T I v E S
Students should be able to: name the elements of a scientific poster, and explain how their study was designed and whether or not their hypothesis was supported.
k E y T o P I C S
• Posters as science communication
• Analysis and explanation of evolutionary trees
C L A S S o u T L I N E
T I M E
15 minutes
1 hour and 40 minutes
T o P I C
Discussion: Posters
Poster Preparation
D E S C R I P T I o N
using a scientific poster as an example, discuss the
components of scientific communication (Intro/
background, Methods, Results, Discussion)
Working in pairs, students make posters to present their
independent project.
M A T E R I A L S
• Markers
• Colored paper
• Butcher paper
• Tape
• Glue
• Printer (optional)

Science Research Mentoring Program GENETICS
© 2011 American Museum of Natural History. All Rights Reserved. 32
Session Ten: Poster Session
L E A R N I N G o B j E C T I v E S
Students should be able to present scientific data to their peers orally and visually, and answer questions about their work.
k E y T o P I C S
• Scientific communication
• Effect of gene selection on tree building
C L A S S o u T L I N E
T I M E
1 hour and
15 minutes
45 minutes
T o P I C
Poster Presentations
Class Discussion
D E S C R I P T I o N
Students orally present the results of their tree building
exercises
Students discuss findings of class overall. What makes a
gene good for tree building?
M A T E R I A L S
• Student posters
• Tape
Science Research Mentoring Program GENETICS
© 2011 American Museum of Natural History. All Rights Reserved. 33
Session Eleven: Caviar Lab: Species Identification with Molecular MethodsL E A R N I N G o B j E C T I v E S
Students should understand the purpose of using molecular information to identify species, the value of RFLP fingerprinting for species identification, the principles of gel electrophoresis, and the use and limitations of COI barcoding.
k E y T o P I C S
• Why we need to identify species with molecular data
• Gel electrophoresis
• DNA barcoding – CoI and its limitations
C L A S S o u T L I N E
T I M E
20 minutes
1 hour and 20 minutes
20 minutes
T o P I C
Lecture and Discussion
Activity: Caviar Gel Electrophoresis Lab
Wrap-Up Discussion
D E S C R I P T I o N
Covers principles of single-locus DNA barcoding, and its use in
identifying samples of known or unknown provenance.
Students use gel electrophoresis to analyze DNA from an unidentified
caviar sample to identify the species it belongs to. Introduction
to RFLPvs. DNA sequencing, a few minutes of practice with
micropipetting, loading of samples and ladder onto gels, running and
photographing gels, and class discussion of results. Lab is adapted from
AMNH Wildlife Forensics: http://www.amnh.org/education/
offering.php?print=true&audience=school_groups&id=430
Discussion of single-gene barcoding and CoI as the standard. What
characteristics should this gene have in terms of speed of molecular
evolution? Does it work across all taxa?
M A T E R I A L S
• Gel electrophoresis apparatus
• DNA samples
• Loading dye
• Agarose gels
• TAE buffer
• Molecular marker
• Micropipetters
• Pipet tips
• uv light box
P R E P A R A T I o N
Cast gels, make TAE buffer, aliquot DNA samples
and laders

Science Research Mentoring Program GENETICS
© 2011 American Museum of Natural History. All Rights Reserved. 34
Session Twelve: Genome Sequencing, the Human Genome Project, and BioethicsL E A R N I N G o B j E C T I v E S
Students will be able to name one characteristic that can be inferred from the analysis of an individual human genome, and one that cannot. They will also be able to explain how an animal is cloned, and how it does or does not differ from the animal from which it was cloned.
k E y T o P I C S
• Genome sequencing
• Ethics of genetic privacy
• Genetic engineering
• Cloning
C L A S S o u T L I N E
T I M E
30 minutes
30 minutes
15 minutes
45 minutes
T o P I C
Video: This American Life: ”If by Chance We Meet Again”
Discussion of Video
Video: NOVA Science Now: “Public Genomes”
Discussion of Video
D E S C R I P T I o N
Students watch a “This American Life” segment – first
segment of Season one, Episode 101.
Students discuss ethics of cloning as presented in the film.
What are the reasons for and against cloning animals,
including humans?
Students watch a “NovA” segment
Students discuss science behind “personal genomics” as
presented in video. Have students thoroughly explain
genetic risk. Would they have the test shown in the video?
Why or why not?
M A T E R I A L S
• Computer with internet for playing NovA video and This American Life videos
Recommended