8/7/2019 School Closing Jan 2011
http://slidepdf.com/reader/full/school-closing-jan-2011 1/14
Fiscal Brief New York City Independent Budget Office
IBO
Click here for demographic, performance, and resource data on each school proposed for closing @ www.ibo.nyc.ny.us
January 2011
Demographics, Performance, Resources:
Schools Proposed for ClosingCompared With Other City Schools
Nw Yk Cty
Independent Budget Ofce
Ronnie Lowenstein, Director
110 William St., 14th oor
Nw Yk, NY 10038
Tl. (212) 442-0632
Fx (212) 442-0350
www.ibo.nyc.ny.us
Summary
The CiTY’s DeparTmeNT oF eDuCaTioN has proposed closing 25 schools beginning in the 2011-
2012 school year, which starts in September. The list includes 14 high schools and 12 elementary
and middle schools that enrolled more tha 17,700 students last year. The closings would occur over
time, with no new students entering the schools and each grade phasing out as the current students
are promoted. The Panel for Education Policy is scheduled to vote on the proposed school closings on
Fby 1 nd Fby 3.
Schools proposed for closing are judged by the Department of Education to be low performing. This
judgment presumes that the education department can accurately measure the effect that a school
has on student performance separate from other factors that also inuence student outcomes.
IBO has compared the schools slated for closure with other schools across the city. The comparisons
include factors such as students’ race, poverty level, English language and other special needs status
outcome measures such as test scores, attendance rates, and for high schools, graduation rates; and
resource measures such as levels of teacher experience and training and school overcrowding. Based
on these comparisons, IBO has found;
• The schools the education department has targeted for closing are all schools with below averagestudent performance.
• The schools proposed for closing generally have been serving students with greater needs
compared with other schools and the share of their enrollment in some high needs categories,
such as the share of students in special education, has been increasing in recent years.
The report also notes that nearly a third of the schools proposed for closing are schools that had been
opened as new small schools—the replacement model that the education department has favored for
schools that have previously been closed. While the eight new small schools proposed for closing is
just a small share of the number that have been opened, their inclusion on the list is a reminder that
there is no guarantee that a closing school will be replaced by a more successful one.
In addition to the summary statistics provided in this report, our Web site includes tables that present
all the demographic, outcome, and resource measures we have reviewed for each of the schools
on the closing list. The report also summarizes the plans for using the space that comes available if
these schools are closed.
Schools Brief

8/7/2019 School Closing Jan 2011
http://slidepdf.com/reader/full/school-closing-jan-2011 2/14
NEW YORK CITY INDEPENDENT BUDGET OFFICE2
Introduction
The Department of Education (DOE) has released a list of 25
public schools targeted for closing beginning with the 2011-
2012 school year. Final decisions will come after a mandated
public hearing and vote of the Panel for Educational Policy.
The list is longer than in past years because a court decision
prevented DOE from closing 19 schools last year, and 15
of those schools were carried over to this year’s proposed
closing list. The complete list of schools on the closure list
(both those held over from last year and those newly added)
and the four schools for which DOE reversed last year’s
closure recommendation is on page 3.
There are 12 schools on the closing list that serve
elementary and middle school grades and 14 that serve
high school grades. One school, New Day Academy,
spans grades 6-12 and since DOE proposes to close
both its middle and high school grades, it is included asboth a middle school and a high school when we report
separately on each type of school.
The 25 schools that are on this year’s proposed closing
list were identied due to their low performance on key
measures. DOE describes the process for identifying
schools for the closure list as follows. First, the
department generates a list of schools to consider for
closure based on summary outcomes for the schools.
The list includes any school receiving a D or F on the
most recent school progress report, a school receiving three consecutive C grades and schools rated as “below
procient” on their most recent Quality Review. This broad
lt tn wnnwd dwn tg t ddtnl
steps. In step one, elementary and middle schools with
English language arts (ELA) and math scores above their
district average are removed from the list of possible
closures. Similarly, high schools with graduation rates
above the city average are also removed. Also, any
school with a Quality Review score of “well developed”
is removed as is any school that has just received its
rst ever Progress Report grade. In the second step,additional data is gathered and including data on
demand for the school through the school choice process,
data on the “talent prole” of the school, an assessment
of potential replacement schools, and an assessment
of community needs. In the third step, school and
community representatives meet with superintendents,
network leaders, or both. After this process, the nal
list of schools to be closed is presented to the Panel on
Educational Policy for a vote after public hearings.
About the Schools
The schools on the closing list are located in every borough
except Staten Island. The map on page 4 shows that the
Bronx has more schools on the list than any other borough.
The breakdown of the closing schools by borough is given
n t tbl n t g. a dtnt f t
students who would be affected is in the Bronx. Across the
city, 17,740 students were enrolled in schools last year that
would be affected by the closings.
Three schools on the proposed closing list are on campuses
where a large high school was previously phased out and
closed. The rst is the School for Community Research
and Learning, one of seven schools located on the Adlai E.
Stevenson campus, which began phasing out in the 2005-
2006 school year. Second is the Urban Assembly Academy for
History and Citizenship for Young Men, located on the William
Howard Taft campus, which was established after Taft beganphasing out in 2002-2003. The third is the Monroe Academy
for Business & Law, located on the James Monroe campus;
the original school was phased out in 1994.
Eight of the 25 schools proposed for closing (about a third)
are “new small schools.” Two of these schools opened for
the 2002-2003 school year, ve opened in 2003-2004,
and one opened in 2005-2006. Five of these “new”
schools now being closed are in the Bronx, where the
program of closing large high schools and opening small
high schools rst began in 2002-2003.
How the Study is Organized
The policy of school closures is partly premised on the
notion that DOE can accurately measure the impact that a
Number of
Students
Share of
Students in
Closing
Schools
Share of all
City
Students
Brooklyn 3,288 19% 30%
Bronx 6,707 38% 21%
Manhattan 3,461 19% 15%
Queens 4,284 24% 28%
Staten Island 0 0% 6%
TOTAL 17,740 1,038,741
Distribution of Students in Closing Schools in
2009-2010
SOURCES: IBO; Department of Education: 2009-2010
Enrollment Capacity Utilization (Blue Book) and J-form citywide
audited October 31st Register.

8/7/2019 School Closing Jan 2011
http://slidepdf.com/reader/full/school-closing-jan-2011 3/14
NEW YORK CITY INDEPENDENT BUDGET OFFICE3
school has on the performance of its students, overand above the impact of nonschool factors. Because
the closure of a school creates disruptions to both the
students and school staff, it is important that the selection
of schools for closure be based on reasonable criteria
applied consistently. In this report, IBO poses a set of
questions and provides answers about the schools on
the closure list and how those schools compare to other
schools in the city. This information can help in assessing
the choices made by the education department.
First, we will consider the student population of the 25closing schools in terms of key demographics of students’
race; poverty level; and English language, immigrant, and
special needs status. For high schools on the closure list,
we will also look at the academic level of the students
prior to their entry to high school, measured by their eighth
grade test scores. These demographic characteristics are
critical to the question of fairness, because it is widely
understood that individual schools serve students who
arrive at school with varying levels of need, and the stated
Borough School Name School Type Grades Served
Manhattan Norman Thomas High School High School 9-12
Manhattan
Academy of Environmental Science
Secondary High School Secondary School 8-12
Manhattan I.S. 195 Roberto Clemente Middle School 6-8
Manhattan Kappa II Middle School 6-8
Manhattan Academy of Collaborative Education Middle School 6-8
Bronx School for Community Research and Learning High School 9-12
Bronx
The Urban Assembly Academy for History and
Citizenship for Young Men High School 9-12
Bronx
Frederick Douglass Academy III
Secondary School Secondary School 6-12
Bronx John F. Kennedy High School High School 9-12
Bronx Christopher Columbus High School High School 9-12
Bronx Global Enterprise High School High School 9-12
Bronx P.S. 102 Joseph O. Loretan Elementary PK-5
Bronx New Day Academy Secondary School 6-12
Bronx Performance Conservatory High School High School 9-12
Bronx Monroe Academy for Business & Law High School 9-12
Brooklyn M.S. 571 Middle School 6-8
Brooklyn Metropolitan Corporate Academy High School High School 9-12
Brooklyn Paul Robeson High School High School 9-12
Brooklyn P.S. 114 Ryder Elementary Elementary PK-5
Brooklyn P.S. 260 Breuckelen Elementary PK-6
Brooklyn P.S. 332 Charles H. Houston K-8 PK-8
Queens Beach Channel High School High school 9-12
Queens P.S. 30 Queens Elementary PK-5
Queens Jamaica High School High School 9-12
Queens I.S. 231 Magnetech 2000 Middle School 6-8
Schools Dropped From 2010-2011 Closing List
Manhattan Choir Academy of Harlem Secondary School 6-12
Brooklyn
Middle School for Academic
and Social Excellence Middle School 6-8
Brooklyn
W. H. Maxwell Career and Technical
Education High School High School 9-12
Queens
Business, Computer Applications &
Entrepreneurship High School High School 9-12
Schools Proposed for Closing 2011-2012
SOURCES: IBO; Department of Education

8/7/2019 School Closing Jan 2011
http://slidepdf.com/reader/full/school-closing-jan-2011 4/14
NEW YORK CITY INDEPENDENT BUDGET OFFICE4
Schools Proposed For Closing by the Department of Education: 2011-2012 School Year
SOURCES: IBO, Department of Education
NOTE: The size of the bubbles are determined by each school’s 2011 preliminary enrollment.
Legend
Elementary School
K-8 School
MiddleSchool
Secondary School
HighSchool

8/7/2019 School Closing Jan 2011
http://slidepdf.com/reader/full/school-closing-jan-2011 5/14
NEW YORK CITY INDEPENDENT BUDGET OFFICE5
policy of the Department of Education is to compare “like
to like” by measuring schools against other schools with
similar demographic characteristics when judging a school’s
performance. We are also able to describe changes in some
of the student demographic characteristics in the years
leading up to the decision to close a school.
The education department believes that its Progress
rt tdlgy, wt t n g
comparisons, adequately accounts for differences in
school demographics when assessing school performance.
DOE creates a “demographic index” rating for all schools
as part of creating the Progress Reports; an individual
school’s peer group is dened as the 20 schools above
and below it on this demographic index. This report both
compares the demographic characteristics of schools to
citywide averages and also references peer group statistics
when discussing school performance.
Second, we will review the performance of the closing
schools in terms of measurable outcomes—student test
scores, attendance rates, and, for high schools, credit
accumulation and graduation rates. These outcome
measures are important because at the heart of DOE’s
school closure policy is the assumption that these schools
are less effective than other schools serving similar
ltn. Ft, t n tn tt Doe’
process of analyzing these results can discern differences
in student achievement levels from the measurement error
that is inherent in all measures of student outcomes. Inother words, the decision to close a school is based upon
a valid measure of the school’s impact on students, not on
measurement error or random uctuations in the data.
Finally, we will describe the resources provided to these
schools in terms of teacher characteristics and overcrowding.
In order to place the 25 closing schools in context
w wll t t f t t fllwng t g f
comparison schools:
• All schools. Using percentile ranks, we describe how
these schools compare to all other elementary/middle
schools or high schools citywide, excluding schools in
the administrative district 75 (schools serving students
with special education needs) and charter schools.
• Schools that were “reprieved” from last year’s closure
list. Last year, DOE had proposed to begin the closure
of these schools based on their 2008-2009 school
year data. However, they were prevented from doing so
as a result of legal action. As a result, and after review
of their 2009-2010 data, DOE chose to rescind its
closure decision for these four schools.
• Transformation schools—these are high schools that
DOE has placed in a federally funded “turnaround”
program, an alternative to school closure for persistently
low performing schools. These 11 high schools
each received between $750,000 to $1.8 million in
the 2010-2011 school year to fund additional staff
development, mentoring, and enhanced instruction.
Demographic, performance, and resource data for each of
the schools proposed for closing are available .
Demographics
Demographic variables were obtained from the 2008-
2009 “School Demographics and Accountability Snapshot”
from DOE’s Web site, the most recent year available. Theprociency levels for incoming ninth grade students in high
schools were obtained from the detailed Progress Reports
through 2009-2010, the most recent year available.
Demographic data are presented in the table on page 6.
How Were Schools on the Closure List Different
From All City Schools in 2008-2009?
All Closing Schools
• The 25 closing schools had a disproportionately large
share of black students and a disproportionately smallshare of white students. The average share of black
students in closing schools was 52 percent, more than
1.5 times the citywide average of 31 percent.
o Conversely, the share of white students in closing
schools was just 3 percent, much lower than the
citywide average of 14 percent.
o The share of Latino students (40 percent) was
comparable to the citywide average (41 percent).
• The share of students identied as poor (based on
qualifying for free or reduced lunch) in closing schools
was 66 percent, 4 percentage points higher than thecitywide average.
High Schools
• The percentage of students in special education
in high schools on the closure list was 1.5 times
the citywide average for high schools—18 percent
compared with 12 percent citywide.
• The percentage of students from low-income families
in high schools on the closure list was higher than

8/7/2019 School Closing Jan 2011
http://slidepdf.com/reader/full/school-closing-jan-2011 6/14
NEW YORK CITY INDEPENDENT BUDGET OFFICE6
the citywide average for high schools—63 percent
compared with 52 percent citywide.• The percentage of students classied as living in
temporary housing (including those “doubled-up” with
family members) was 1.5 times the citywide average for
high schools—6 percent compared with 4 percent citywide.
• The share of overage students in the entering class of
high schools on the closure list— those students who
may have been “left back” in earlier grades since they
are 15 years or older when they enter ninth grade—was
signicantly higher than the citywide average. Nine
percent of students in closing schools were overage,
more than double the citywide average of 4 percent.• The 2009-2010 test scores of students entering high
schools on the closure list were lower than the citywide
average. Ten of the 14 high schools on the closure list
had entering classes that scored in the lowest fth of
all entering high school classes in the city.
• The stability rate in high schools on the closure list was
lower than the citywide average for high schools—90
percent compared with 95 percent in citywide
elementary and middle schools.
2005-
2006
2006-
2007
2007-
2008
2008-
2009
2009-
2010
Special Education
Average for Closing High Schools 14% 15% 16% 18%
NYC High School Average 10% 11% 12% 12%
Average for Closing Elementary/Middle Schools 12% 12% 14% 16%
NYC Elementary/Middle School Average 12% 13% 13% 15%
English Language Learner
Average for Closing High Schools 12% 13% 12% 12%
NYC High School Average 11% 10% 11% 11%
Average for Closing Elementarym/Middle Schools 9% 9% 9% 9%
NYC Elementary/Middle School Average 15% 15% 15% 15%
Low Income
Average for Closing High Schools 69% 66% 67% 63%
NYC High School Average 51% 52% 53% 52%
Average for Closing Elementary/Middle Schools 73% 71% 71% 72%
NYC Elementary/Middle School Average 70% 69% 68% 68%
Stability
Average for Closing High Schools 92% 92% 92% 90%
NYC High School Average 95% 95% 95% 95%
Average for Closing Elementary/Middle Schools 91% 91% 90% 90%
NYC Elementary/Middle School Average 93% 93% 93% 93%
Temporary Housing
Average for Closing High Schools 1% 1% 1% 6%
NYC High School Average 1% 1% 1% 4%
Average for Closing Elem/Middle Schools 2% 2% 2% 5%
NYC Elem/Middle School Average 1% 1% 1% 4%
Overage Students in Entering Class (High School Only)
Average for Closing High Schools 8% 8% 8% 9%
NYC High School Average 5% 5% 5% 4%
Average Eighth Grade Proficiency Level for Entering Class (High School Only)
Average for Closing High Schools n.a. n.a. 2.47 2.50 2.60
NYC High School Average n.a. n.a. 2.78 2.84 2.94
NOTES: All averages are weighted by student enrollment.
The stability rate is the percent of students in a school who are not in a terminal grade that return the following year.
Select Demographics Over Time
SOURCES: IBO; Department of Education: School Demographics and Accountability Snapshots and detailed Progress Reports

8/7/2019 School Closing Jan 2011
http://slidepdf.com/reader/full/school-closing-jan-2011 7/14
NEW YORK CITY INDEPENDENT BUDGET OFFICE7
Elementary/Middle Schools
• A lower percentage of students in elementary and
middle schools on the closure list were classied
as English language learners than in the average
elementary or middle school in the city—9 percent
compared with 15 percent citywide.
• The percentage of students from low-income families
in elementary and middle schools on the closure
list was slightly higher than the citywide average for
elementary or middle schools—72 percent compared
with 68 percent citywide.
• The stability rate in elementary and middle schools on
the closure list was lower than the citywide average for
elementary and middle schools—90 percent compared
with 93 percent citywide.
How Have Closing Schools’ Students
Changed in Recent Years?
• Looking at the ve-year period of 2005-2006 through
2009-2010, there is evidence that the level of need of
students in closing high schools has been increasing
at a faster rate than the citywide average.
o Ten of the 14 closing high schools had lower
percentile rankings on the average prociency
levels of incoming students for the 2009-2010
school year than they did in 2007-2008. Jamaica
High School consistently had the highest average
prociency level for incoming students of the 14
closing high schools. In the 2007-2008 schoolyear, Jamaica ranked better than 40 percent of all
city high schools. In 2009-2010, Jamaica’s ranking
dropped, with its incoming class having performed
better than only a third of city high schools.
o High schools on the closing list have experienced
an increase in the share of special education
students that is larger than the increase for all
city high schools over the four years. The special
education population citywide remained at at 12
percent in 2008-2009, but the closing high schools
experienced an increase in the share of specialeducation students from 16 percent to 18 percent.
o Closing high schools also saw a larger increase in
t f tdnt n ty ng f
2007-2008 to 2008-2009 compared with the
average city high school. The average for closing
high schools and for the city average were both at
1 percent in 2007-2008 and while the city average
increased to 4 percent, the average for the closing
schools increased to 6 percent.
o For overage students, closing high schools saw
an increase by 1 percentage point from 8 percent
in 2007-2008 to 9 percent in 2008-2009 while
the citywide high school average fell 1 percentage
point from 5 percent to 4 percent.
• The student needs prole for elementary and middle
schools on the closing list have remained consistent
with citywide trends.
Did Individual Schools on the Closure List Stand
Out on Demographic Measures in 2008-2009?
• Nine of the 25 schools on the closure list had special
education enrollments of 20 percent or greater:
Christopher Columbus High School (25 percent);
School for Community Research and Learning (24
percent); PS 30, Queens (23 percent); I.S. 195,
Manhattan, John F. Kennedy High School, KAPPA II and
Urban Assembly Academy for History and Citizenship(all 22 percent); and Performance Conservatory High
School and MS 571, Brooklyn (both 20 percent).
• Three schools had English language learner
enrollments of 19 percent or greater: I.S. 195,
Manhattan (20 percent); and John F. Kennedy High
School and PS 102, Bronx (both 19 percent).
• Four schools had more than 10 percent of their
students living in temporary housing: PS 332,
Brooklyn (17 percent); Paul Robeson High School (13
percent); and MS 571, Brooklyn and Norman Thomas
High School (both 10 percent).• Four high schools on the closure list had more than
10 percent of its students enter the school already
overage for their grade: Paul Robeson (16 percent);
Jamaica (12 percent); and Norman Thomas and
Christopher Columbus (both 11 percent).
Performance
The schools on the closing list were evaluated on various
performance measures obtained from the detailed Progress
Reports. The data spanned four years: 2006-2007 through2009-2010, the most recent Progress Report. In addition to
reporting the current status for each performance variable
in 2009-2010, the percentile rankings against all other
schools in the city were also reported. All schools with data
in the progress reports were included, with the exception of
charter schools (for which there is limited data) and schools
in the administrative district 75 (schools serving students
with special education needs).
High Schools

8/7/2019 School Closing Jan 2011
http://slidepdf.com/reader/full/school-closing-jan-2011 8/14
NEW YORK CITY INDEPENDENT BUDGET OFFICE8
How Have Closing High Schools Performed Compared
With All City High Schools in 2009-2010?
• Student attendance at high schools on the closure
list averages 78 percent, dramatically lower than
the citywide high school average of 87 percent.
A 78 percent daily attendance rate translates to
approximately 40 days absent per school year, or eight
full weeks of instruction. Six of the 14 high schools on
the closure list had attendance rates better than a third
of the schools in their peer groups. Only 2 of the 14 had
attendance rates in the lowest 10 percent of their peers.
• Ten of the 14 closing schools ranked lower in terms of
attendance in 2009-2010 than they did in 2008-2009.
• Academic problems are evident from the start of
students’ careers in the high schools on the closure
list. On average, only 61 percent of students in these
schools earned at least 10 credits in their rst year, the minimum amount needed to keep them on track
t gdt wtn t nl f-y n. T
citywide average for this measure is 78 percent.
Eight schools on the closing list ranked in the bottom
10 percent of city high schools in terms of rst-year
students on track to graduate and the new schools
ddd t y w ng t lwt f.
Three schools on the closing list had credit completion
rates better than half of their peer schools; only three
had rates among the lowest 10 percent of their peers.
•
The pass rate on Regents exams in the high schools on the closure list is 25 percent, compared to the citywide
rate of 42 percent. All the schools proposed for closing
ranked in the bottom fth of city high schools in
Regents performance.
• Only half of students in high schools on the closure list
w bl t gdt wtn
f y f ntng g
school, compared with the
citywide rate of 71 percent. All
of the closing schools ranked
in the bottom 15 percentof city high schools. Four of
the schools had four-year
gdtn t btt tn
a third of their peer schools,
and ve had rates among the
lowest 10 percent of their
.
• The average six-year
graduation rate in 2009-
2010 was 58 percent, compared with the citywide
average of 75 percent. All but one closing school
ranked in the bottom fth of city high schools.
• Most closing schools received a grade of “Procient”
on the Quality Reviews as of 2008-2009. (T
ratings, from lowest to highest, are Underdeveloped,
Underdeveloped with procient features, Procient,
Well Developed, and Outstanding.)
• One school scored “Well Developed” while two schools
from the hold over list scored “Underdeveloped.”
How Did the High Schools on the Closure List Perform
Compared With Schools in the Transformation Program?
• When looking at the averages for transformation schools
and closing schools on the performance variables,
schools on the transformation list consistently performed
higher than schools on the closing list on all the reported
measures. Schools on the transformation list stillperformed below the average city high school on all
measures and much lower in terms of graduation rates.
• Transformation schools averaged better Quality
Review scores than closing schools, with seven getting
“Procient” and four getting “Well Developed.”
How did the High Schools on the Closure List Perform
Compared to the Three Reprieved High Schools?
• On average, the reprieved schools had equivalent or
higher performance compared to closing schools:attendance (equal); rst-year credit accumulation
(71 percent compared with 61 percent for closing
schools); Regent’ pass rate (29 percent compared
to 25 percent); four-year graduation rate (55 percent
compared to 50 percent) and six-year graduation rate
Average for
All Closing
Schools
NYC High
School
Average
Transformation
High Schools
High Schools
Reprieved from
the 2011
Closure List
(N=14) (N=400) (N=11) (N=3)
Student Attendance 78% 87% 83% 78%
Year 1 Students Earning
10+ Credits 61% 78% 70% 71%
Regents Completion Rate 25% 42% 36% 29%
Four-Year Graduation Rate 50% 71% 59% 55%
Six-Year Graduation Rate 58% 75% 64% 59%
2009-2010 Performance for High Schools
NOTE: Averages are weighted by student enrollment.
SOURCES: IBO; Department of Education: detailed Progress Report.
8/7/2019 School Closing Jan 2011
http://slidepdf.com/reader/full/school-closing-jan-2011 9/14
NEW YORK CITY INDEPENDENT BUDGET OFFICE9
(59 percent compared to 58 percent).
• One reprieved school, Choir Academy of Harlem, performed
much better than the other two in 2010, pulling the average
for reprieved schools up, especially looking at the four-year
graduation rate. The Choir Academy graduated 70 percent
of students, while the other two schools graduated just over
half—similar to the average closing school.
Have Graduation Rates Improved at the High
Schools on This Year’s Closure List?
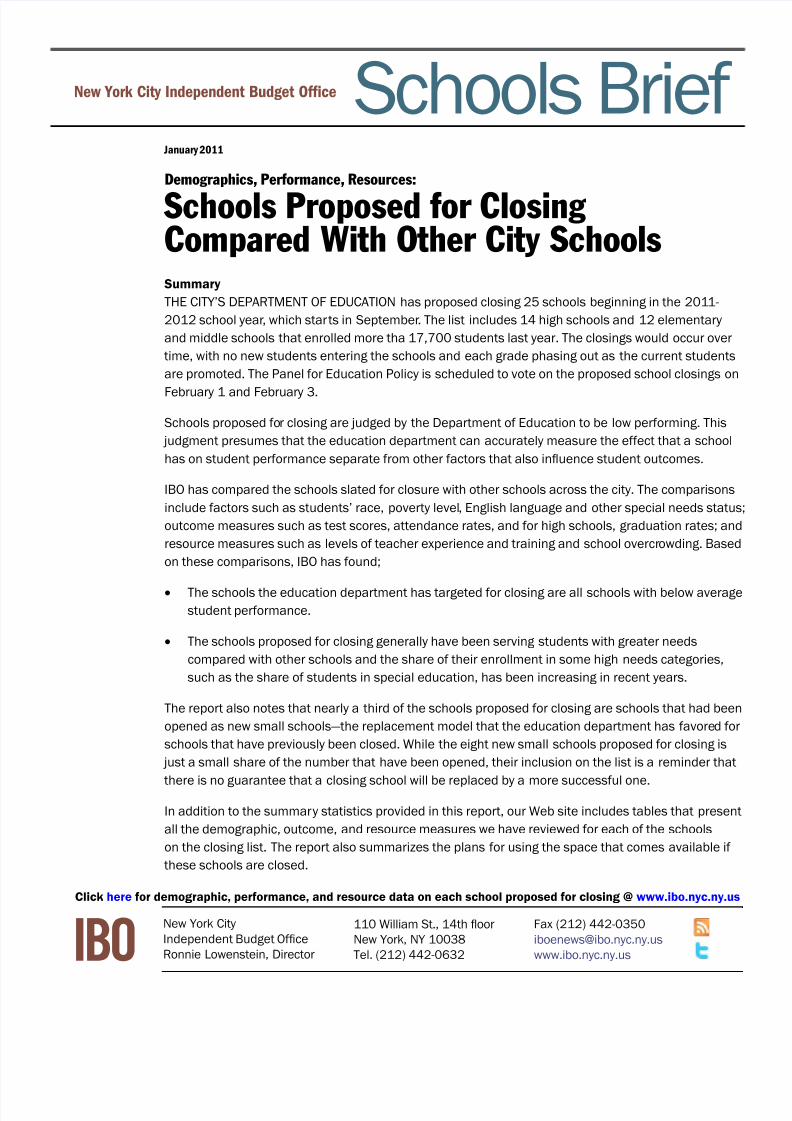
In the chart on below, 2008-2009 graduation rates are
plotted on the horizontal axis and 2009-2010 graduation
rates are plotted on the vertical axis. Each symbol is a
school. Those schools below the diagonal line are those
whose graduation rates declined from 2008-2009 to 2009-
2010; those above the line had improving graduation rates.
•
As discussed above, the four-year graduation ratesat the 14 high schools on this year’s closing list were
among the lowest in the city.
• Eight of the 14 high schools on the closing list—more
than half—saw four-year graduation rates improve
in 2009-2010 compared with 2008-2009, roughly
in line with 59 percent of all city high schools that
saw an improvement on this performance measure.
One closing high school’s four-year graduation rate
nd t n bt y.
• One school that was reprieved—Business, Computer
Applications and Entrepreneurship High School—saw
its graduation rate fall from 57 percent in 2008-2009
to 51 percent in 2009-2010.
• With one exception, the transformation schools saw
little change in their four-year graduation rates from
2008-2009 to 2009-2010.
Closing Elementary/Middle Schools
How Have Closing Elementary/Middle Schools Performed
Compared to All City Elementary/Middle Schools?
•
Student attendance in elementary and middleschools proposed for closing was 90 percent in 2009-
2010, below the city average of 93 percent. Nine
of the closing schools fell in the bottom quarter of
city elementary and middle schools in terms of the
SOURCES: IBO; Department of Education: detailed Progress Report
2 0 0 8 - 2 0 0 9 G r a d u a t i o n R a t e - P e r c e n t
Four-Year Graduation Rates 2009-2010 vs. 2008-2009
2009-2010 Graduation Rate-Percent

8/7/2019 School Closing Jan 2011
http://slidepdf.com/reader/full/school-closing-jan-2011 10/14
NEW YORK CITY INDEPENDENT BUDGET OFFICE10
on the ELA exam in closing schools compared with
67.8 percent citywide; for math, it was 49.3 percent
compared with 64.9 percent.
• All but one school fell in the lowest 30
percent of city elementary and middle schools in
terms of the progress score on the ELA exam and
all but two schools in the lowest 30 percent on the
progress score on the math exam.
• Schools that were held over from last
year’s list tended to improve their rank on ELA
progress and math progress from the 2008-2009
school year to 2009-2010 while schools that were
added tended to fall relative to last year’s score.
How Did the Elementary/Middle Schools on the
Closure List Perform Compared With the Middle
School for Academic and Social Excellence—the
Reprieved School?
• The average school on the closure list had higher
student attendance, ELA and math scores than the
school reprieved from last year’s closure list.
• Progress scores were higher in the reprieved school in
bt eLa nd t.
Profciency Rates: How Did the Elementary/Middle
Schools on This Year’s Closure List Perform?
In the charts on page 11, 2008-2009 school year
prociency rates are plotted on the horizontal axis and2009-2010 prociency rates are plotted on the vertical
axis. Each symbol is a school. Those schools below the
diagonal line are those whose prociency rates declined;
those above the line had improving prociency rates. We
plotted math and ELA prociency rates separately. Because
the state raised the cutoffs for prociency levels in 2009-
2010, almost all schools experienced lower prociency
levels in 2009-2010 relative to 2008-2009.
In order to see schools more clearly, we only present results
for schools that performed at or below the level of the highest-performing of the closing schools in 2008-2009, P.S. 114
in Brooklyn. Therefore, the graph of math prociency rates
shows about 51 percent of all elementary and middle schools
and the graph of ELA prociency shows roughly 36 percent.
• The math prociency rates for the 12 elementary and
middle schools proposed for closing fell more steeply
in the 2009-2010 school year compared with other city
elementary and middle schools.
attendance rate, and all fell in the bottom half of city
schools. Eight schools had lower attendance rates in
the 2009-2010 school year than in 2008-2009. Three
of the schools had attendance rates higher than 40
percent of their peers, and four had rates among the
lowest 10 percent of their peers.
• Scores on the New York State test of English language
arts were well below the city average, with 23 percent
of students in closing schools scoring “procient”
or higher (i.e. attaining level 3 or 4), compared to a
citywide average of 44 percent. The same is true for
overall achievement in math—24 percent compared
with 56 percent citywide. All but one of the schools fell
in the lowest 30 percent of city elementary and middle
schools in terms of ELA prociency and all schools
ranked in the bottom fth citywide in terms of math
prociency. Four schools had ELA scores higher than
a third of the schools in their peer group and four had
scores among the lowest 10 percent of their peers.
• Seven closing schools improved or remained the same
in their citywide ranking in 2009-2010 compared with
the 2008-2009 school year on their ELA prociency
rates. Five of them were schools added to the list this
year. On the other hand, all 12 schools fell or remained
the same in their citywide ranking in math prociency
in 2009-2010 compared with 2008-2009.
• Progress on the ELA and math exams in the closing
schools was also lower than the citywide average,
although the differences were not as wide as they were
on the absolute scores. The progress score—which
measures the year-over-year improvement a school
makes on its students’ prociency—was 59.4 percent
Average For All
Closing
Elementary/
Middle Schools
NYC
Elementary/
Middle School
Average
School
Reprieved from
the 2011
Closure List
(N=12) (N=1,063) (N=1)
Student Attendance 90% 93% 88%
ELA Proficiency -
Level 3 or 4 23% 44% 12%
Math Proficiency -
Level 3 or 4 24% 56% 17%
ELA - Progress
(median growth
percentile) 59.4 67.8 65.5
Math - Progress
(median growth
percentile) 49.3 64.9 63.0
2009-2010 Performance for Elementary/Middle Schools
NOTES: Averages are weighted by student enrollment.
SOURCES: IBO; Department of Education: detailed Progress Report.

8/7/2019 School Closing Jan 2011
http://slidepdf.com/reader/full/school-closing-jan-2011 11/14

8/7/2019 School Closing Jan 2011
http://slidepdf.com/reader/full/school-closing-jan-2011 12/14
NEW YORK CITY INDEPENDENT BUDGET OFFICE12
Average for
All Closing
Schools
NYC High
School
Average
Transformation
High Schools
High Schools
Reprieved from
the 2011
Closure List
(N=14) (N=390) (N=11) (N=3)
Student-Teacher Ratio 15.8 16.6 16.2 14.2
Teachers with Five+
Years Service 69% 58% 64% 74%
Teachers with Graduate
Degree 85% 82% 84% 88%
Core Courses Taught by
"Highly Qualified"
Teachers 94% 93% 93% 90%
Building Utilization Rate 85% 106% 121% 83%
Resources Available to High Schools
SOURCES: IBO; Department of Education: 2008-2009 School Demographics and Accountability
Snapshot, 2009-2010 Enrollment Capacity Utilization (Blue Book).
NOTES: Averages are weighted by student enrollment.
A “highly qualified” teacher is defined by the U.S. Department of Education as having a bachelor's
degree, full state certification, and being able to prove that they know each subject they teach.
• The reprieved school, Middle School for Academic and
Social Excellence, had a lower prociency score than all
but one closing school in 2008-2009, and lower than all
but ve closing schools in the 2009-2010 school year.
• Seven schools on the closing list saw relatively modest
declines in ELA prociency scores in 2009-2010 compared
with other schools in the sample. These seven schools also
had the highest prociency rates in both the 2008-2009
and the 2009-2010 school years among closing schools.
• The reprieved school, Middle School for Academic and
Social Excellence, had a lower prociency score than all
the closing schools in 2008-2009, and a lower score than
all but three closing schools in 2009-2010.
Resources
Data on the resources available at the schools proposed
for closing were obtained from several sources. Teacher
demographics were obtained from the 2008-2009“School Demographics and Accountability Snapshot” on
the education department’s Web site. The 2009-2010
Enrollment Capacity Utilization (Blue Book) report was used to
calculate the school-level utilization rate, taking into account
all buildings used by each school. Note that the Blue Book
data was collected before last year’s school closing plans
were announced so that the reported utilization rates do
not reect the uncertainty about the futures of the schools
on that list. Finally, per pupil allocations were calculated for
2008-2009 and 2009-2010 using Galaxy allocation data
and the reported enrollment on the Progress Reports. (Galaxyis the nancial system that the New York City Department
of Education uses to allocate funds to
schools.) Galaxy data were obtained on
December 7, 2010 for individual schools
n Doe’ Wb t. Ctywd l
allocation data were not provided in the
tables on pages 12 and 13 because
aggregate data for all schools is not
readily accessible in the Galaxy system.
Closing High Schools
What Level of Resources Has
Been Provided to High Schools
on the Closure List?
• Closing high schools had an
average student-teacher ratio of
15.8 in 2008-2009, which was
lower than the citywide average
of 16.6. The average closing high school had a higher
student-teacher ratio than the average reprieved
school and a lower student-teacher ratio than the
average transformation school.
• On average, high schools on the closing list had
teachers with more experience than the average city
high school and the average transformation school.
Teachers at closing schools were slightly more likely
to have graduate degrees than the average school
citywide, but nearly the same share of core courses
taught by “highly qualied” teachers.
• Closing schools had an average utilization rate of
85 percent, well below the citywide average of 106
percent. Thus closing schools tended to have empty
seats, indicating a lack of interest in these schools by
prospective students.
Closing Elementary/Middle Schools
What Level of Resources Has Been Provided to
Elementary/Middle Schools on the Closure List?
• Elementary and middle schools on the proposed
closing list had an average student-teacher ratio
of 12.6 in 2009, which was slightly below the city
average. The Middle School for Academic and Social
Excellence, which was reprieved from last year’s
closing list, had a student-teacher ratio much lower
than the average for closing schools.
•
Closing elementary and middle schools had fewerexperienced teachers, fewer teachers with graduate
8/7/2019 School Closing Jan 2011
http://slidepdf.com/reader/full/school-closing-jan-2011 13/14
NEW YORK CITY INDEPENDENT BUDGET OFFICE13
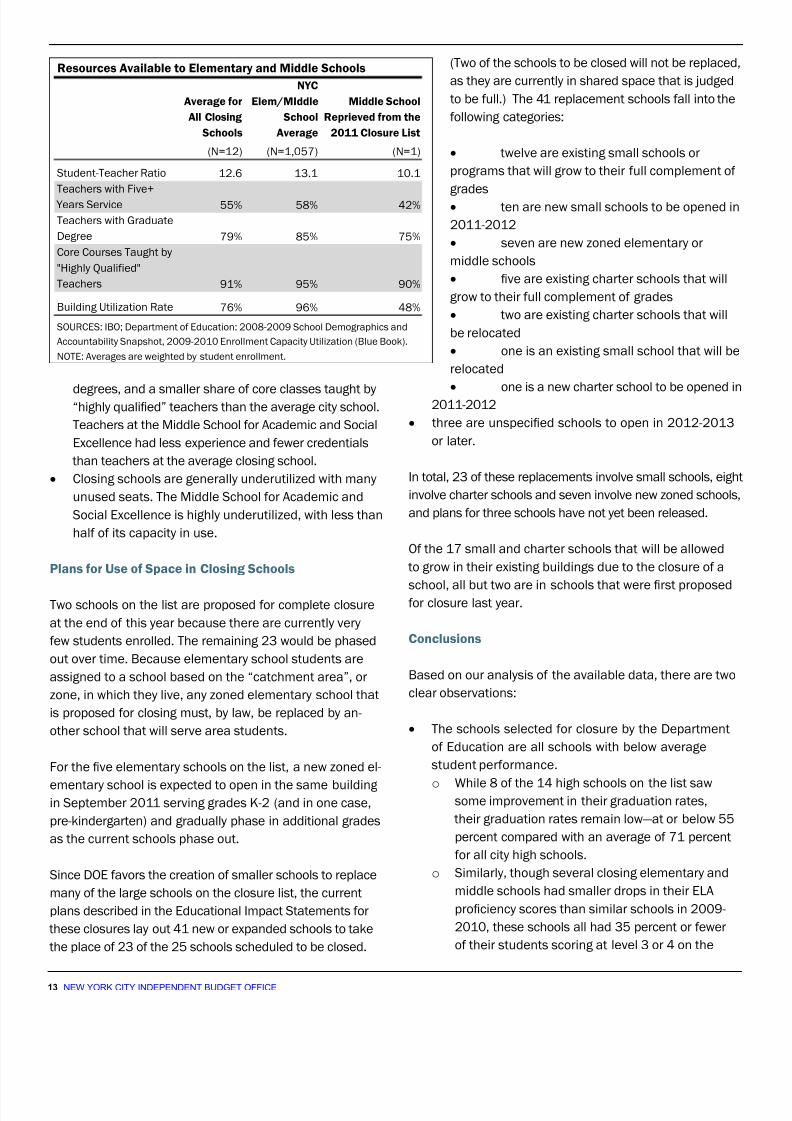
(Two of the schools to be closed will not be replaced,
as they are currently in shared space that is judged
to be full.) The 41 replacement schools fall into the
following categories:
• twelve are existing small schools or
programs that will grow to their full complement of
gd
• ten are new small schools to be opened in
2011-2012
• seven are new zoned elementary or
middle schools
• ve are existing charter schools that will
grow to their full complement of grades
• two are existing charter schools that will
be relocated
• one is an existing small school that will be
relocated
•
one is a new charter school to be opened in2011-2012
• three are unspecied schools to open in 2012-2013
lt.
In total, 23 of these replacements involve small schools, eight
involve charter schools and seven involve new zoned schools,
and plans for three schools have not yet been released.
Of the 17 small and charter schools that will be allowed
to grow in their existing buildings due to the closure of a
school, all but two are in schools that were rst proposedfor closure last year.
Conclusions
Based on our analysis of the available data, there are two
clear observations:
• The schools selected for closure by the Department
of Education are all schools with below average
student performance.
o While 8 of the 14 high schools on the list sawsome improvement in their graduation rates,
their graduation rates remain low—at or below 55
percent compared with an average of 71 percent
for all city high schools.
o Similarly, though several closing elementary and
middle schools had smaller drops in their ELA
prociency scores than similar schools in 2009-
2010, these schools all had 35 percent or fewer
of their students scoring at level 3 or 4 on the
degrees, and a smaller share of core classes taught by“highly qualied” teachers than the average city school.
Teachers at the Middle School for Academic and Social
Excellence had less experience and fewer credentials
than teachers at the average closing school.
• Closing schools are generally underutilized with many
unused seats. The Middle School for Academic and
Social Excellence is highly underutilized, with less than
half of its capacity in use.
Plans for Use of Space in Closing Schools
Two schools on the list are proposed for complete closure
at the end of this year because there are currently very
fw tdnt nlld. T nng 23 wld b d
out over time. Because elementary school students are
assigned to a school based on the “catchment area”, or
zone, in which they live, any zoned elementary school that
is proposed for closing must, by law, be replaced by an-
other school that will serve area students.
For the ve elementary schools on the list, a new zoned el-
ementary school is expected to open in the same building in September 2011 serving grades K-2 (and in one case,
-kndgtn) nd gdlly n ddtnl gd
as the current schools phase out.
Since DOE favors the creation of smaller schools to replace
many of the large schools on the closure list, the current
plans described in the Educational Impact Statements for
these closures lay out 41 new or expanded schools to take
the place of 23 of the 25 schools scheduled to be closed.
Average for
All Closing
Schools
NYC
Elem/MIddle
School
Average
Middle School
Reprieved from the
2011 Closure List
(N=12) (N=1,057) (N=1)
Student-Teacher Ratio 12.6 13.1 10.1
Teachers with Five+
Years Service 55% 58% 42%
Teachers with Graduate
Degree 79% 85% 75%
Core Courses Taught by
"Highly Qualified"
Teachers 91% 95% 90%
Building Utilization Rate 76% 96% 48%
Resources Available to Elementary and Middle Schools
SOURCES: IBO; Department of Education: 2008-2009 School Demographics and
Accountability Snapshot, 2009-2010 Enrollment Capacity Utilization (Blue Book).
NOTE: Averages are weighted by student enrollment.

8/7/2019 School Closing Jan 2011
http://slidepdf.com/reader/full/school-closing-jan-2011 14/14
test—which was also true for 45 percent of city
elementary and middle schools.
o Half of all schools on the closure list had overall
Progress Report grades among the lowest 10 percent
of schools in their peer groups. At the same time,
four of the schools had Progress Report scores
g tn t lwt qtl f t .
• It is also true that the schools on the closure list
generally have been serving students with greater
needs compared with other schools and the share of
their enrollments in some high-needs categories has
been increasing in recent years:
o The percentage of students in special education or
in temporary housing has been increasing at a faster
rate in these schools than in the city as a whole.
o The eighth grade prociency levels of the incoming
high school students in schools on the closure list
have declined relative to other city high schools;10 schools have incoming classes that rank lower
in terms of eighth grade prociency in 2009-2010
than they did in the 2007-2008 school year.
o The percentage of students entering the closing
high schools already overage for their grade has
consistently been higher than the city average and
is now over twice the norm.
In reviewing the list of schools proposed for closing we alsonote that almost a third of the schools had been opened
as new small schools—the replacement model that the
Department of Education has favored for schools that
have been closed in the past. This is an issue that bears
monitoring as greater numbers of these small schools
mature. While the number of these closing schools, eight,
is just a small share of to the number DOE has opened,
their appearance on the list serves as a reminder there is
no guarantee that a closing school will be replaced by a
more successful one.
Report prepared by Sarita Subramanian
Receive free reports by e-mail
Fllw iBo:
Twtt: twitter.com/nycibo
rss: www.ibo.nyc.ny.us/iborss.xml
Click for demographic, performance,and resource data on each school proposed
for closing
Recommended