Satellite ASTER Global Geoscience Maps
Michael Abrams, Jet Propulsion Laboratory/California Institute of Technology 2017 IGARSS July, 2017
Michael Abrams Jet Propulsion Laboratory, California Institute
of Technology, Pasadena USA
(c) 2017 California Institute of Technology. Government sponsorship acknowledged.
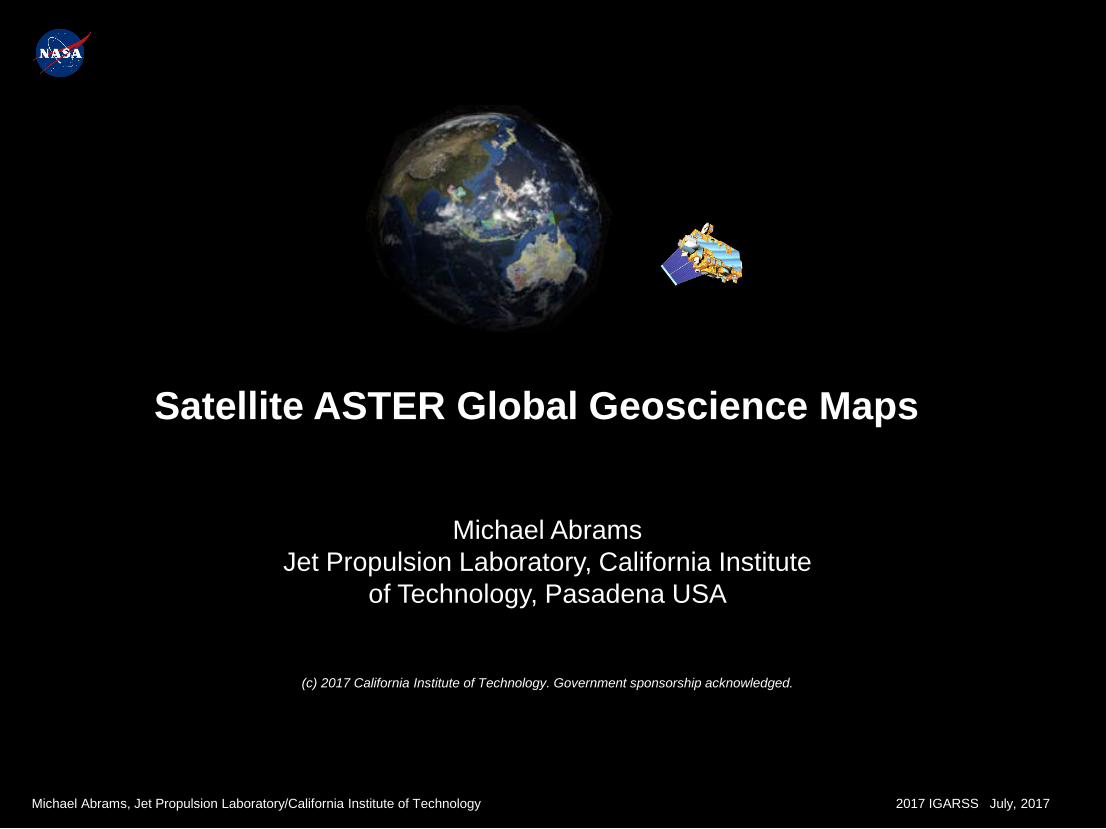
Global Maps
Global Geology
Global DEM
Global Soils
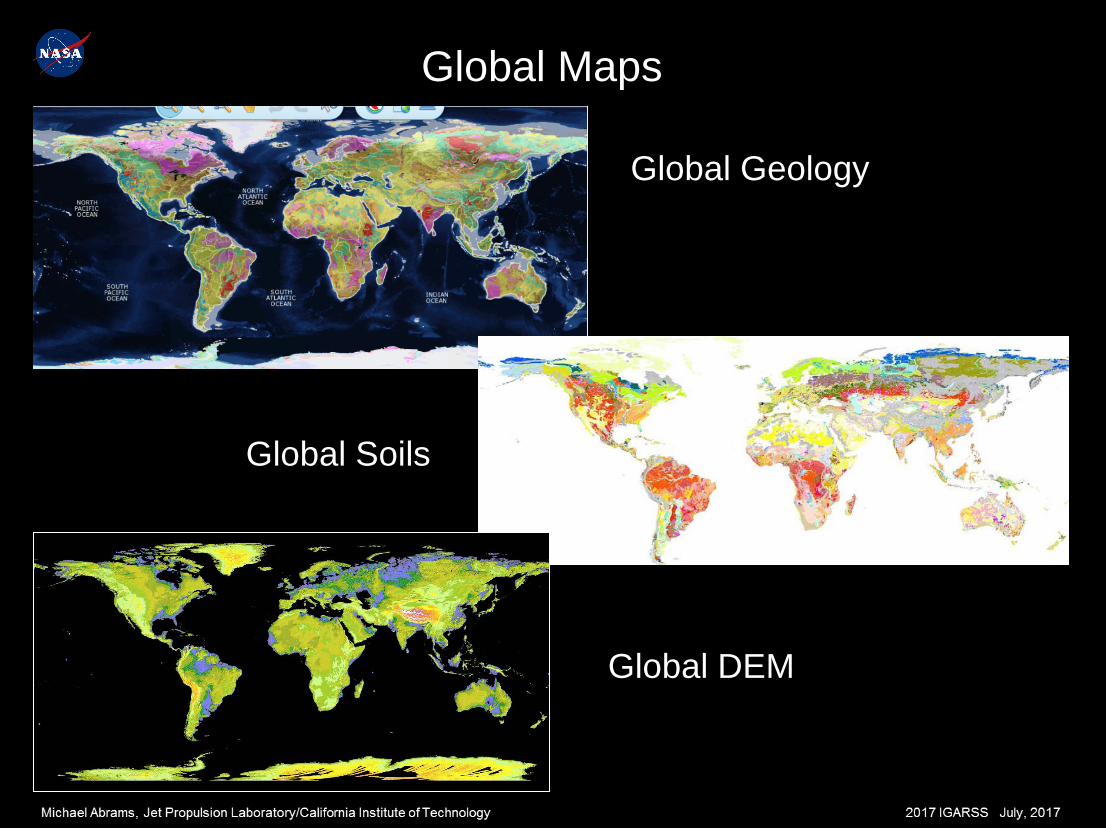
Global Maps
Land use/Land cover
GLOBAL SURFACE COMPOSITION MAP
???
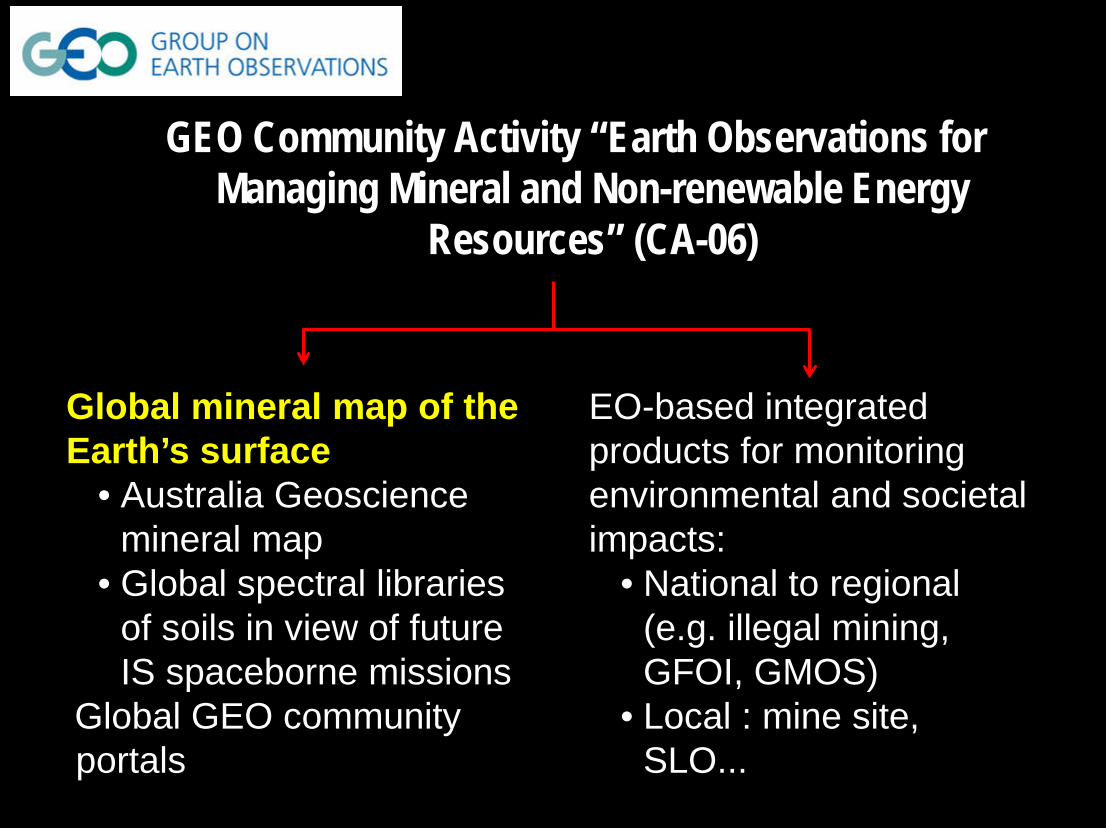
GEO Community Activity “Earth Observations for Managing Mineral and Non-renewable Energy
Resources” (CA-06) Global mineral map of the
Earth’s surface • Australia Geoscience
mineral map • Global spectral libraries
of soils in view of future IS spaceborne missions
Global GEO community portals
EO-based integrated products for monitoring environmental and societal impacts:
• National to regional (e.g. illegal mining, GFOI, GMOS)
• Local : mine site, SLO...
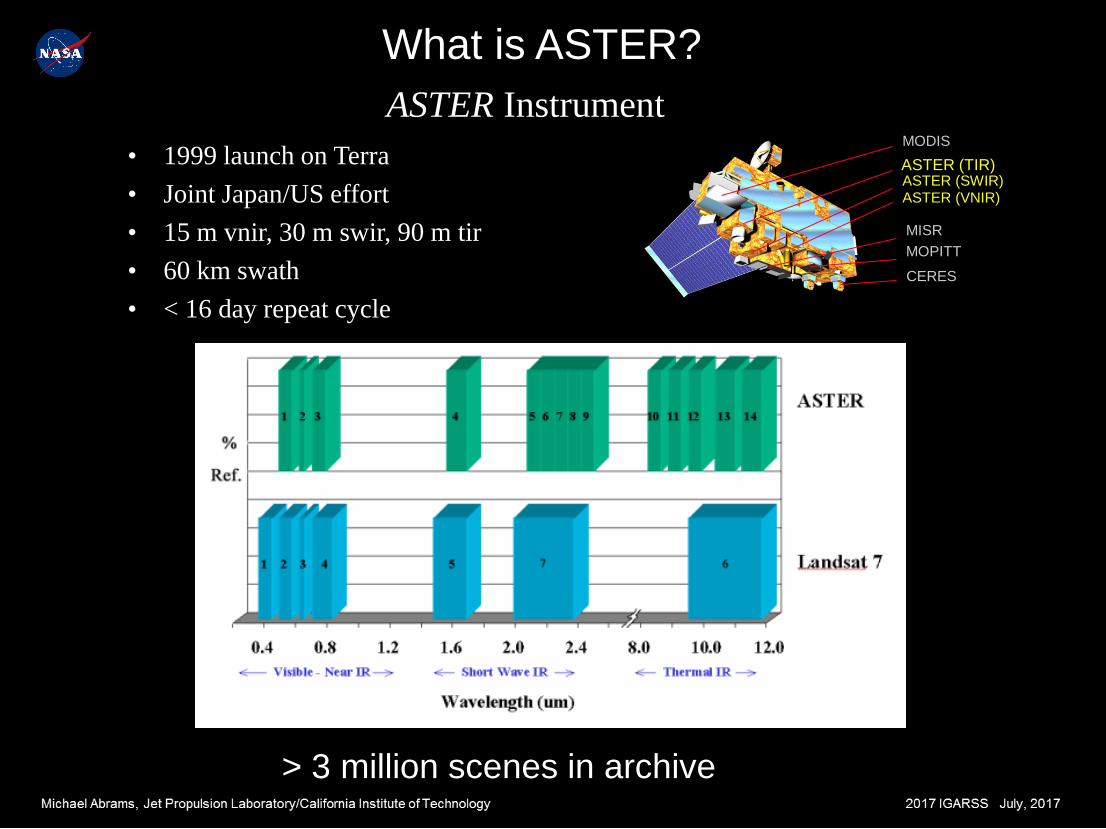
What is ASTER? ASTER Instrument
• 1999 launch on Terra • Joint Japan/US effort • 15 m vnir, 30 m swir, 90 m tir • 60 km swath • < 16 day repeat cycle
MODIS ASTER (TIR) ASTER (SWIR) ASTER (VNIR)
MISR MOPITT
CERES
> 3 million scenes in archive
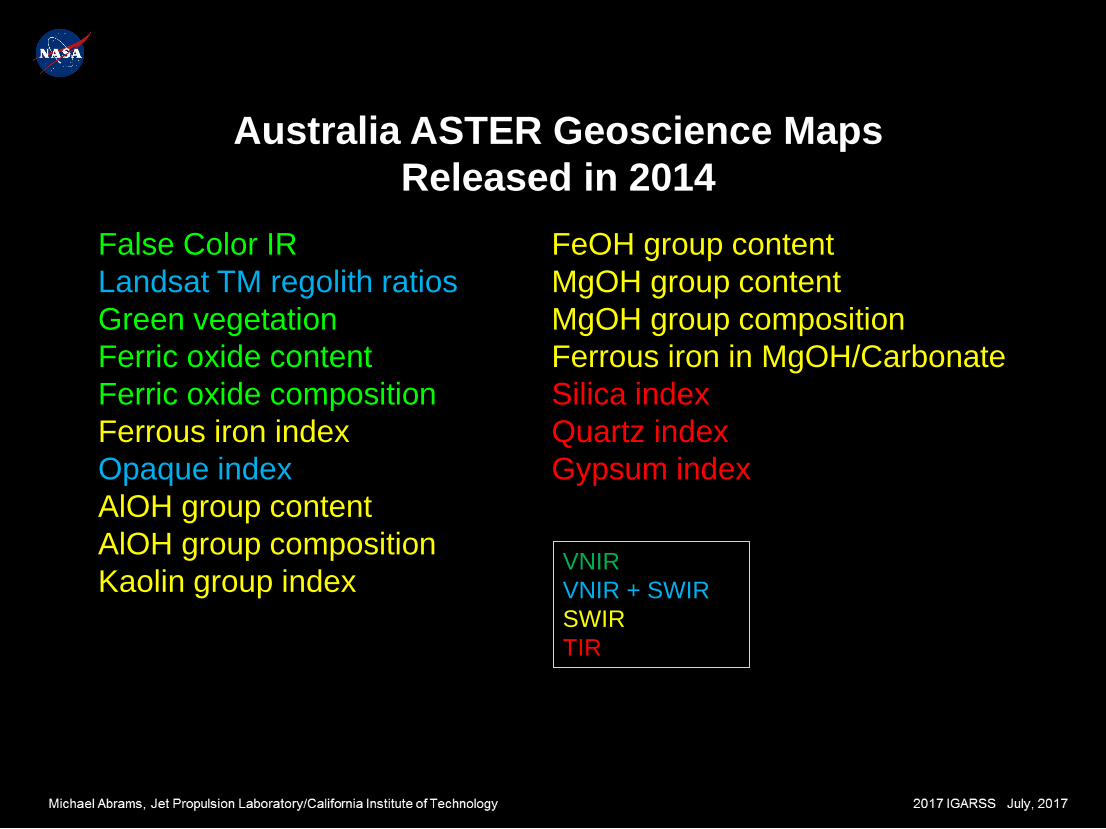
Australia ASTER Geoscience Maps Released in 2014
False Color IR Landsat TM regolith ratios Green vegetation Ferric oxide content Ferric oxide composition Ferrous iron index Opaque index AlOH group content AlOH group composition Kaolin group index
FeOH group content MgOH group content MgOH group composition Ferrous iron in MgOH/Carbonate Silica index Quartz index Gypsum index
VNIR VNIR + SWIR SWIR TIR
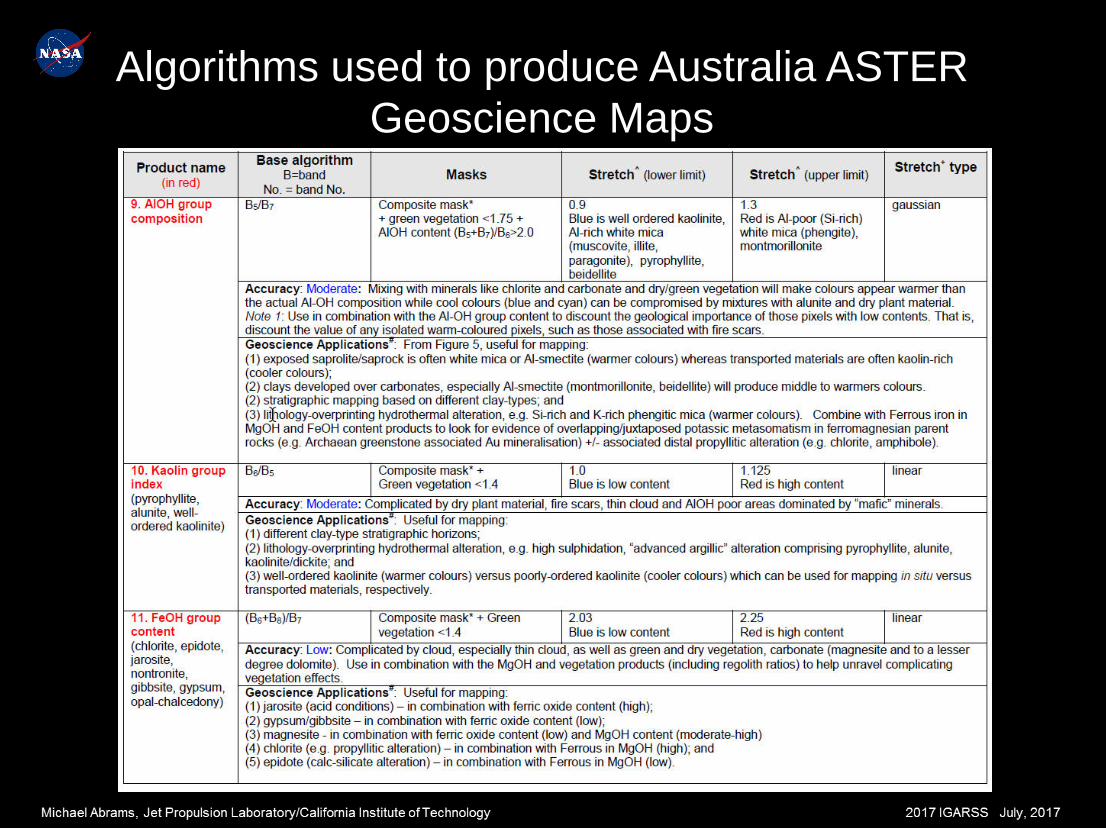
Algorithms used to produce Australia ASTER Geoscience Maps
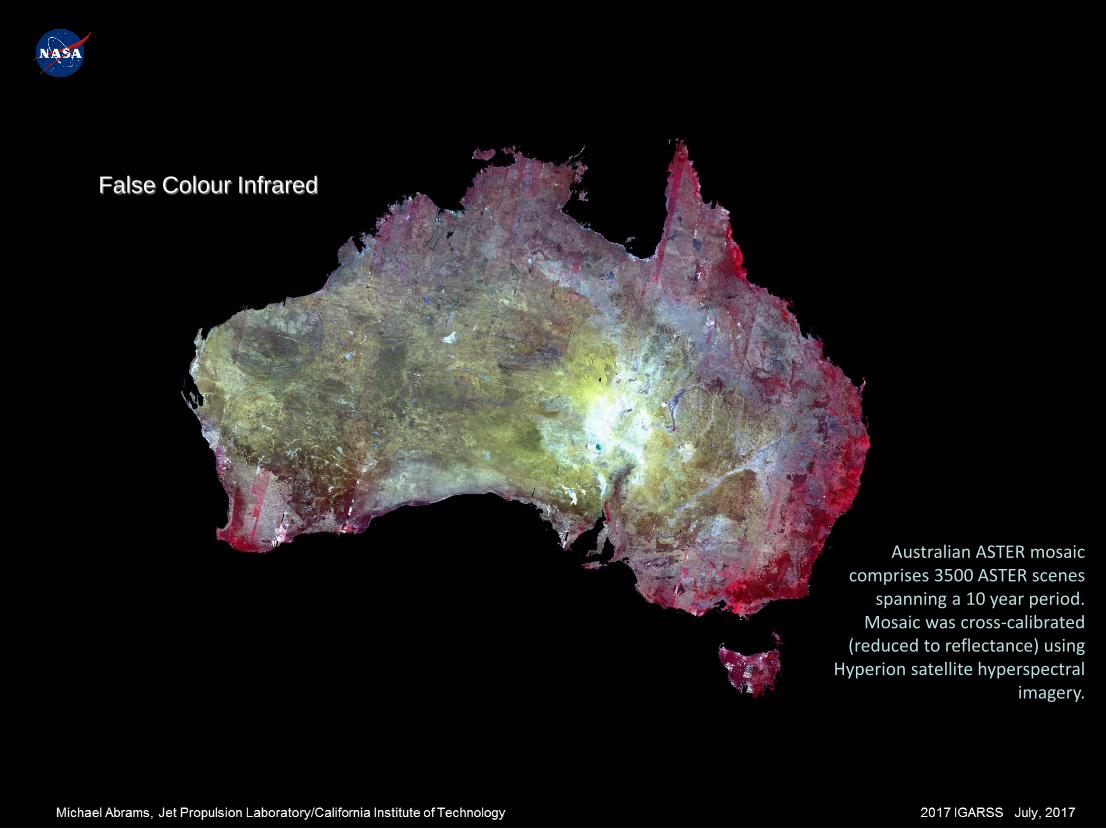
False Colour Infrared
Australian ASTER mosaic comprises 3500 ASTER scenes
spanning a 10 year period. Mosaic was cross-calibrated
(reduced to reflectance) using Hyperion satellite hyperspectral
imagery.
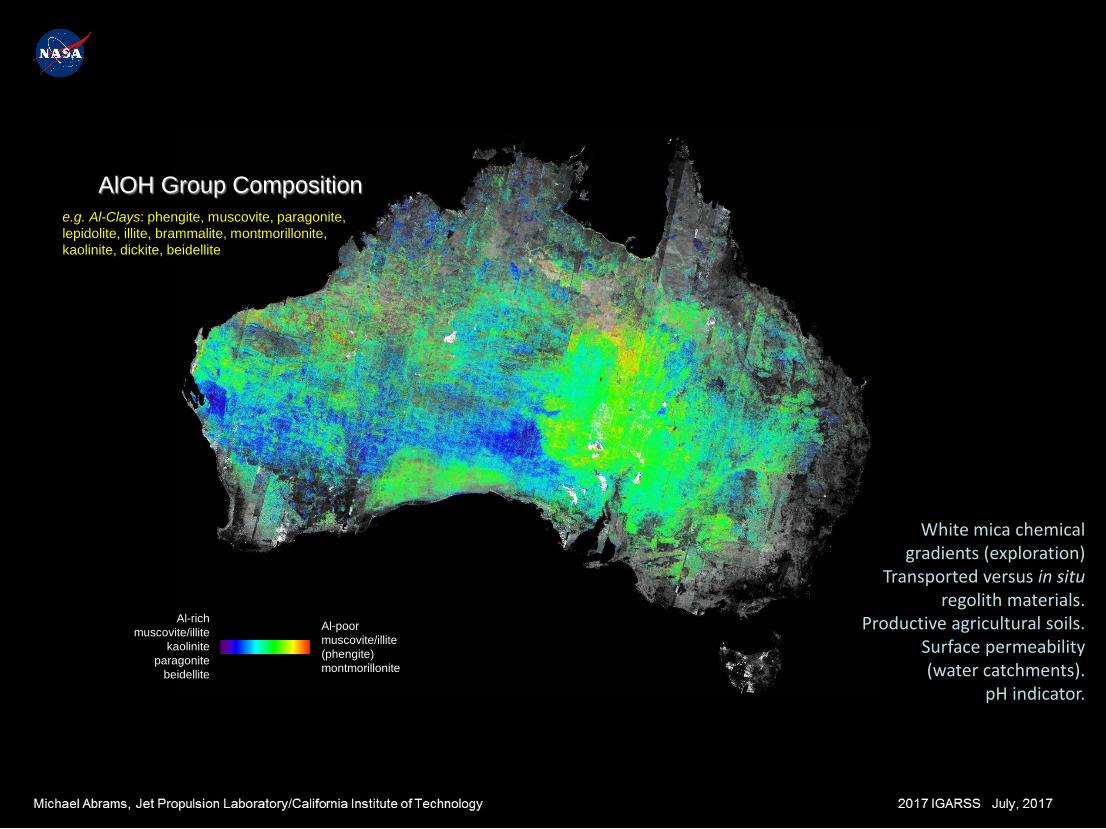
AlOH Group Composition
White mica chemical gradients (exploration)
Transported versus in situ regolith materials.
Productive agricultural soils. Surface permeability
(water catchments). pH indicator.
e.g. Al-Clays: phengite, muscovite, paragonite, lepidolite, illite, brammalite, montmorillonite, kaolinite, dickite, beidellite
Al-rich muscovite/illite
kaolinite paragonite
beidellite
Al-poor muscovite/illite (phengite) montmorillonite
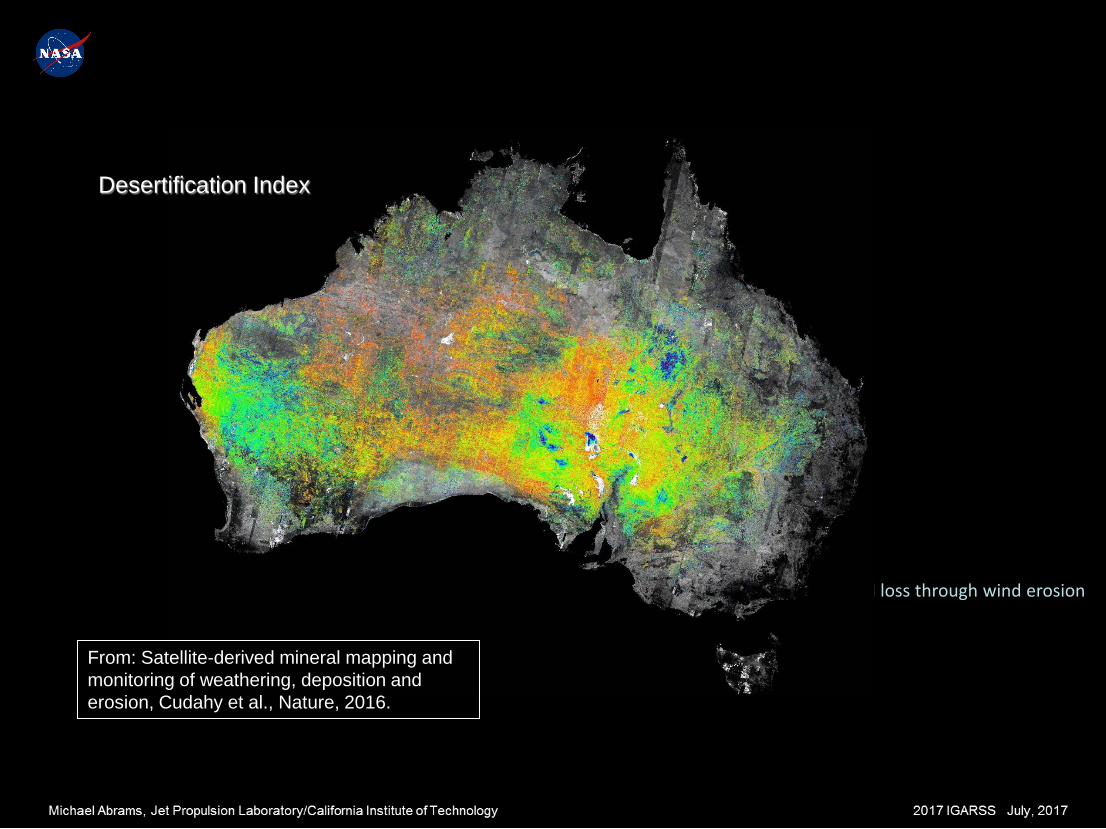
Soil loss through wind erosion
low high
Desertification Index
From: Satellite-derived mineral mapping and monitoring of weathering, deposition and erosion, Cudahy et al., Nature, 2016.
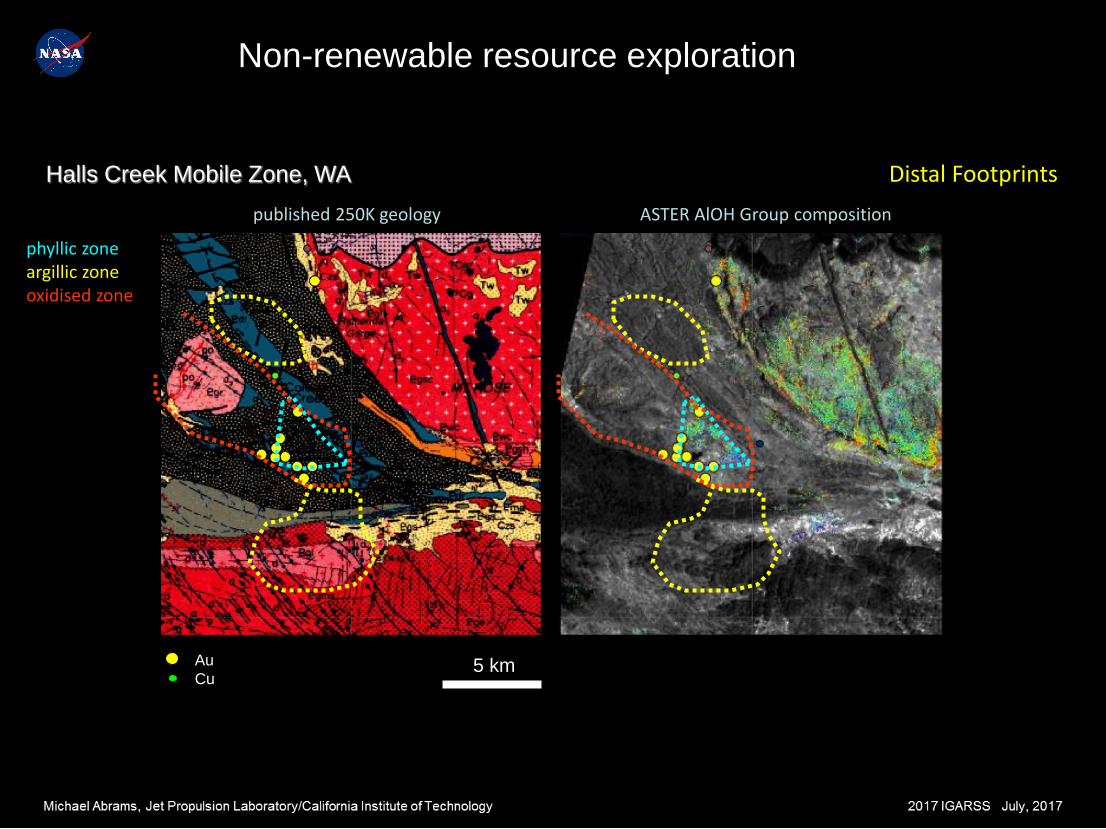
published 250K geology ASTER AlOH Group composition
Halls Creek Mobile Zone, WA
5 km Au Cu
phyllic zone argillic zone oxidised zone
Distal Footprints
Non-renewable resource exploration
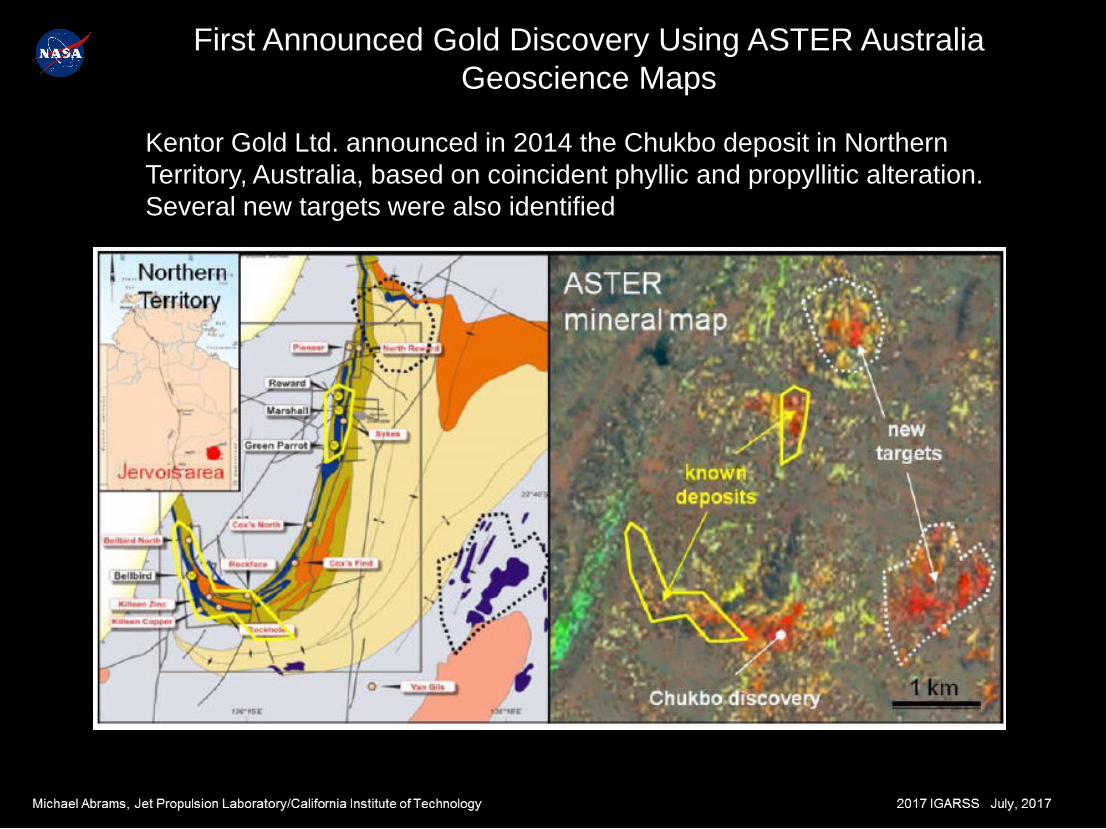
First Announced Gold Discovery Using ASTER Australia Geoscience Maps
Kentor Gold Ltd. announced in 2014 the Chukbo deposit in Northern Territory, Australia, based on coincident phyllic and propyllitic alteration. Several new targets were also identified
From ASTER Geoscience Maps of Australia
To
ASTER Global Geoscience Maps
Data Processing at JPL
Hulley (JPL) created Global Emissivity Database from all ASTER data acquired 2000-2008. Data were pre-processed to create: cloud mask and vegetation mask. All 14 ASTER bands, for 1.3 million scenes, are stored locally, with associated masks. The data are resampled to 100m for all bands.
Australian-developed Geoscience algorithms will be applied to this
data set. Processing will be done on work stations or JPL cloud computing facility.
First continent to be completed will be Australia. The continental
product will be compared to Australian Geoscience maps, and adjustments made to leverage off of CSIRO’s validation with Hyperion data and thousands of field chemical/mineralogical measurements. The other continents will follow, and be released as completed.
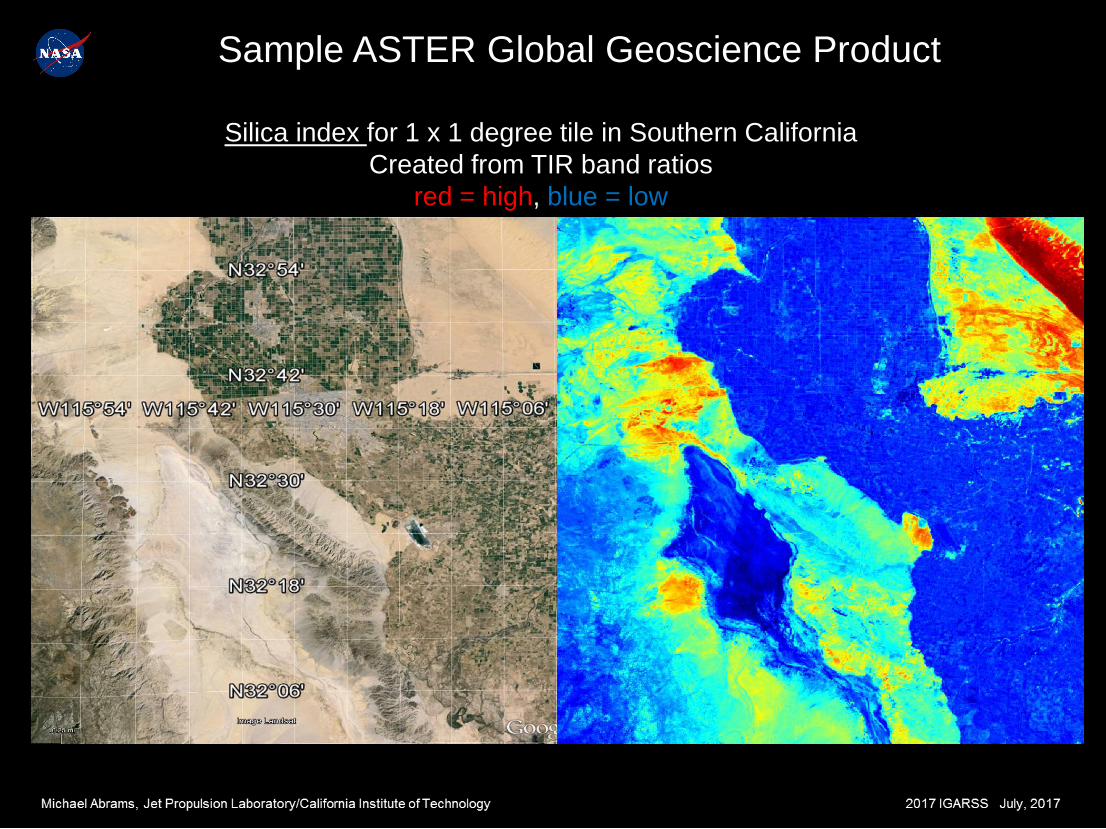
Silica index for 1 x 1 degree tile in Southern California Created from TIR band ratios
red = high, blue = low
Sample ASTER Global Geoscience Product
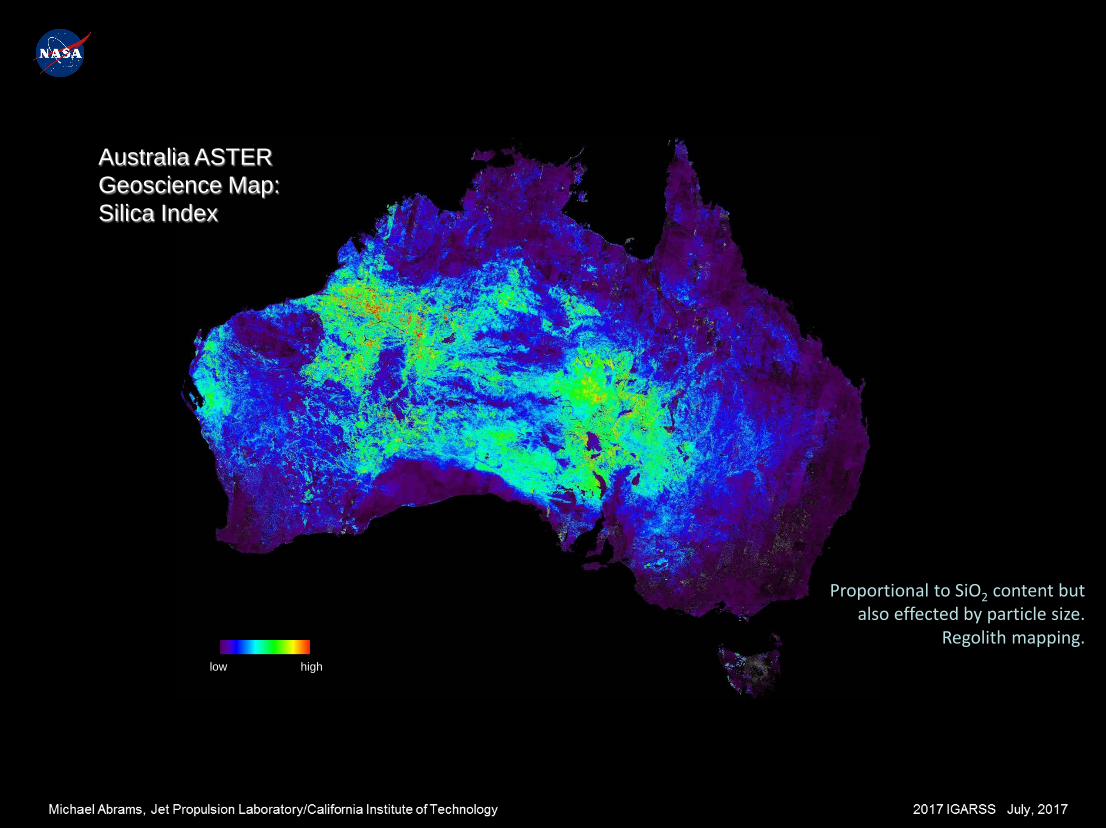
Australia ASTER Geoscience Map: Silica Index
Proportional to SiO2 content but also effected by particle size.
Regolith mapping. low high
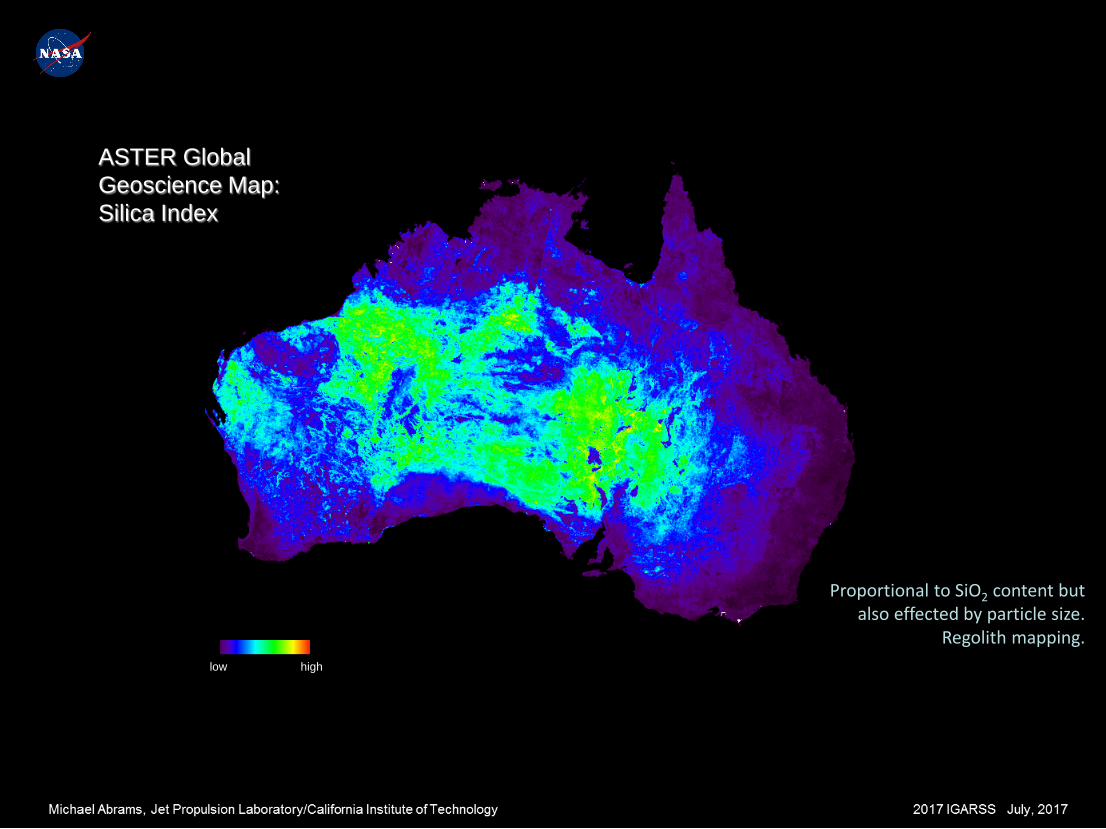
ASTER Global Geoscience Map: Silica Index
low high
Proportional to SiO2 content but also effected by particle size.
Regolith mapping.
NASA MEaSUREs RFP
• Requested proposals to create (or extend) Earth System Data Records, for example, Sea Surface Temperature
• May 2017, Abrams submitted proposal to NASA to produce ASTER Global Geoscience Products
• Funding decision expected ~September, project start December 1
• Geoscience Maps produced continent-by-continent
• All maps will be available through NASA Land Processes DAAC starting end 2018
Recommended