Saskatchewan
Construction
Association and
Saskatchewan
Ministry of
Economy
Assessment of Non-Residential
Construction Cost Drivers
Final Report
KPMG CONFIDENTIAL L
Disclaimer
The procedures we carried out in performing the work that forms the basis of this report
were not such as to constitute an audit. As such, the content of this report should not be
considered as providing the same level of assurance as an audit.
We have indicated within this report the sources of the information provided. We have not
sought to independently verify those sources unless otherwise noted within the report.
This report has been prepared by KPMG LLP (“KPMG”) for the internal use of the
Saskatchewan Construction Association and the Saskatchewan Ministry of the Economy
(“Client”) pursuant to the terms of our Agreement with Client dated May 5, 2014 (the
“Consultant Agreement”). This report is being provided to Client on a confidential basis and
may not be disclosed to or otherwise quoted or referred to, in whole or in part to any other
person or entity without the express written consent of KPMG and Client. KPMG neither
warrants nor represents that the information contained in this report is accurate, complete,
sufficient or appropriate for use by any person or entity other than Client or for any purpose
other than set out in the Consultant Agreement. This report may not be relied upon by any
person or entity other than Client, and KPMG hereby expressly disclaims any and all
responsibility or liability to any person or entity other than Client in connection with their use
of this report.
KPMG CONFIDENTIAL L
Contents
1 Executive Summary 1
2 Introduction 4
2.1 Background 4
2.2 Project Overview 4
3 Key Findings 7
3.2 Overview of Individual Cost Drivers 12
3.3 Impacts 19
3.4 Emerging Trends 21
3.5 Inter-jurisdictional Observations 21
Appendix 1 Statistical Review 23
Construction Activity Trends 23
Construction Cost Trends 32
Appendix 2 Interview Results 44
Saskatchewan 44
British Columbia 53
Alberta 54
Manitoba 55
Ontario 56
Quebec 58
North Dakota 59
KPMG CONFIDENTIAL
1
1 Executive Summary
Saskatchewan has seen strong economic and population growth in the last decade. Since 2006, the
province has been the fastest growing province in Canada based on real GDP growth. Against this
backdrop of strong growth in the economy as a whole, the non-residential construction sub-sector has
experienced even higher growth levels and an increasing share of the provincial GDP, along with sharp
increases in non-residential construction costs.
The Government of Saskatchewan is committed to meeting a vision of sustained economic growth,
responsible government and achieving better quality of life for all Saskatchewan people. Its core growth
activities include: “the investment in the infrastructure required for growth”, and “ensuring the ongoing
competitiveness of Saskatchewan’s economy”. It is in the context of these priorities that this study
takes place, as it aims to support an improved understanding and ability for the government and key
market players to ensure the ongoing competitiveness of Saskatchewan’s economy outlined as a core
growth activity.
STUDY PURPOSE
The objective of this study is to develop an understanding of key drivers of non-residential construction
costs in Saskatchewan, and their impact on economic development in the province. Study findings will
form the basis for developing:
■ An improved understanding related to how Saskatchewan cost drivers compare to other selected
jurisdictions.
■ An improved awareness of cost inflators to aid in managing cost increases.
■ An improved understanding of key factors influencing decision making related to capital construction
projects.
■ An improved ability to design policies and programs to improve Saskatchewan’s competitiveness.
SUMARY OF FINDINGS
Overall, non-residential construction costs in the province have faced exceptional yearly increases over
the past decade, in line with increased economic growth and prosperity in the province, and driven
mainly by shortages in skilled labour and specialized subcontractor availability and high concrete and
aggregate costs, with contributing factors such as fuel surcharges that are driven to logistical realities
within the province.
While the year-over-year increases in non-residential construction costs in Saskatchewan have been
exceptional, the average non-residential construction costs in the province are currently more or less
aligned with other provinces in Western Canada, placing these provinces as the more costly places for
construction in the nation.
Our research found that the supply of skilled labour has been a particular challenge for the industry as it
faces this exceptional increase in demand in Saskatchewan. Both the data analysis and the interviews
(18 interviews across the industry in Saskatchewan and in other provinces) indicate that by far, the main
driver behind year-over-year construction cost increases in the province is labour-driven.
Ten years ago, labour costs in the province were among the lowest in Canada, and while the yearly
increases were exceptionally high over the past decade, these costs are today more or less aligned with
KPMG CONFIDENTIAL
2
other Western Provinces. These costs have therefore brought Saskatchewan to a level that is
comparable to its peers. As such, in absolute terms, labour costs in Saskatchewan today are close to the
Western Canadian average.
Material costs are also contributing to higher construction costs in the province; however, these costs do
not exhibit exceptional year-over-year increases. Generally, material costs in Saskatchewan have risen
and fallen similarly to other jurisdictions, with the exception of two ‘unique to Saskatchewan’ costs:
concrete and aggregate, and fuel. The limited supply of concrete and aggregate within the province has
resulted in an inevitable hike in prices, in line with the exceptional demand. As for fuel costs, they are
due to the logistical challenges with material transportation into the province, and these surcharges are
embedded in construction costs throughout the supply chain.
While the overall competition in the sector has grown, this competition has not necessarily translated
into construction cost decreases, given that the increased number of competitors in the market was
often found to be relying on the same pool of limited specialized subcontractors and skilled labour. Skilled
and specialized labour availability relative to demand in Saskatchewan is low, and incentives for labour
relocation into the province are in competition with those from other provinces such as Alberta.
Based on an industry interview program and complementary statistical research, the key cost drivers in
the non-residential construction sector in Saskatchewan are assessed as follows:
Major Drivers
■ Labour rates: wage rate increases among the highest in Canada.
■ Labour productivity: aging demographics, declining average experience levels, and sub trade supply
and scheduling.
■ Construction activity levels: Increasing activity, especially in major projects.
■ Competition levels: Increasing competition from national/international contractors and increasing
Public Private Partnership (P3) orientation changing the competitive landscape.
Other Significant Drivers
■ Materials costs: Higher aggregate and concrete costs than in other jurisidcaitons.
■ Supply management: Longer wait times, and reduced reliability of materials/equipment delivery.
■ Construction methods: increasing use of expensive out-of-province labour and/or pre-fab construction.
Industry representatives indicated that public sector projects have tended to be less affected by
increasing costs in terms of whether they proceed, and that they more typically have been delayed or re-
scoped in response to increasing costs. On the other hand, the undertaking of private sector projects
have tended to be more sensitive to construction cost levels, and a number of private projects have been
cancelled or delayed due to increasing construction costs.
On balance, the industry consensus is that, while construction costs have increased significantly, they
have not reached prohibitive limits, where there is likely to be a sudden crash in activity levels. The
industry is forecasting slower to low increase in construction costs in 2014 and 2015 as demand for
construction is foreseen to dampen, especially compared to record levels in 2012 and 2013.
With regard to future trends, the industry expects that the demand for non-residential construction
projects is likely to remain strong into the future, but to feature a continued shift towards fewer, higher
value, and larger projects. The result is expected to be an industry with similar overall construction
KPMG CONFIDENTIAL
3
activity levels, but with a somewhat of a different landscape, notably in terms of project size and
alternative approaches to procurement.
Year-over-year construction cost increases have been generally higher in Saskatchewan than in all other
Canadian jurisdictions except Alberta. As a result, Saskatchewan has lost much of its previous
construction cost advantage over many Canadian jurisdictions. However, while construction costs remain
high in the province, any assessment of the attractiveness of the province for non-residential
construction investment should also look at the entirety of the asset and its life-cycle costs, including
land, and operation and maintenance costs. In this regard, Saskatchewan may still be among the most
favourable locations for non-residential construction in Western Canada, with land costs being relatively
competitive.
Despite the significant construction cost and scheduling pressures seen in recent years, our interviews
indicated a consensus from both within and outside the province that few, if any, Saskatchewan projects
have been relocated to other jurisdictions because of these pressures. This view reflects the location-
specific nature of many of the non-residential projects undertaken in Saskatchewan, often relating to
resource-based industrial projects and the associated commercial/institutional infrastructure projects.
KPMG CONFIDENTIAL
4
2 Introduction
2.1 Background
Saskatchewan has seen strong and steady economic and population growth in the last decade. Since
2006, the province has been the fastest growing province in Canada based on real GDP growth. In
addition, the province continues to have the lowest unemployment rate in the nation, and is among the
leading provinces in job growth, average weekly earnings, manufacturing sales, retail sales, and
investment in new housing construction1.
In addition to strong economic indicators, Saskatchewan recorded its highest population on record in
2013 with 1.1 million people. Forecasts indicate continued economic growth over the coming years and
continued population growth, with provincial planning focusing on growth to 1.2 million people by 2020.
Against this backdrop of strong economic growth in the economy as a whole, the non-residential
construction sub-sector has faced similar growth levels and an increasing share of the provincial GDP,
alongside sharp increases in non-residential construction costs. This research aims to investigate the
drivers behind these increases in non-residential construction costs in the province.
2.2 Project Overview
The Government of Saskatchewan is committed to meeting a vision of sustained economic growth,
responsible government and achieving better quality of life for all Saskatchewan people, and among its
core growth activities, are: “the investment in the infrastructure required for growth”, and “ensuring the
ongoing competitiveness of Saskatchewan’s economy”. It is against this background that this study
takes place, as it aims to support an improved understanding and ability for the government and key
market players to ensure the ongoing competitiveness of Saskatchewan’s economy.
Both the Saskatchewan Construction Association (SCA) and the Saskatchewan Ministry of the Economy
(MoE) share an interest in establishing an environment that is competitive and attracts major industrial
and commercial projects to the province.
About the Saskatchewan Construction Association (SCA)
The SCA is a member-driven association governed by a Board of Directors and led by a President/CEO.
The SCA represents the collective interests of industrial, commercial, heavy, and institutional
construction companies in Saskatchewan, representing general contractors; trades contractors; and
construction suppliers.
About the Ministry of the Economy
The MoE advances economic growth to generate wealth and opportunity in Saskatchewan. Its core lines
of business include advancing and regulating responsible resource development; developing, attracting
and retaining a skilled workforce; and enhancing economic growth and competitiveness. Because of the
impact of capital investment on economic growth, the MoE has a keen interest in ensuring that the right
environment is in place to support the development of major commercial and industrial projects.
1 http://www.finance.gov.sk.ca/PlanningandReporting/2014-15/GovernmentDirection1415.pdf
KPMG CONFIDENTIAL
5
Project Objectives
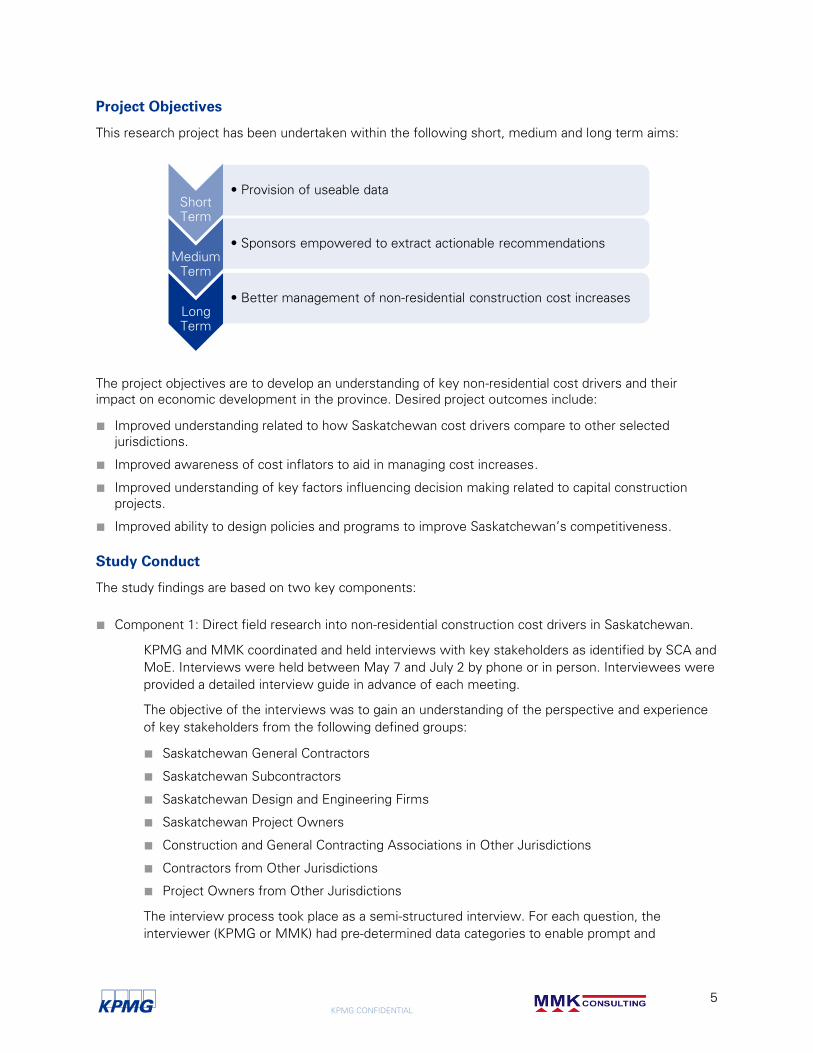
This research project has been undertaken within the following short, medium and long term aims:
The project objectives are to develop an understanding of key non-residential cost drivers and their
impact on economic development in the province. Desired project outcomes include:
■ Improved understanding related to how Saskatchewan cost drivers compare to other selected
jurisdictions.
■ Improved awareness of cost inflators to aid in managing cost increases.
■ Improved understanding of key factors influencing decision making related to capital construction
projects.
■ Improved ability to design policies and programs to improve Saskatchewan’s competitiveness.
Study Conduct
The study findings are based on two key components:
■ Component 1: Direct field research into non-residential construction cost drivers in Saskatchewan.
KPMG and MMK coordinated and held interviews with key stakeholders as identified by SCA and
MoE. Interviews were held between May 7 and July 2 by phone or in person. Interviewees were
provided a detailed interview guide in advance of each meeting.
The objective of the interviews was to gain an understanding of the perspective and experience
of key stakeholders from the following defined groups:
■ Saskatchewan General Contractors
■ Saskatchewan Subcontractors
■ Saskatchewan Design and Engineering Firms
■ Saskatchewan Project Owners
■ Construction and General Contracting Associations in Other Jurisdictions
■ Contractors from Other Jurisdictions
■ Project Owners from Other Jurisdictions
The interview process took place as a semi-structured interview. For each question, the
interviewer (KPMG or MMK) had pre-determined data categories to enable prompt and
Short
Term
• Provision of useable data
Medium
Term
• Sponsors empowered to extract actionable recommendations
Long
Term
• Better management of non-residential construction cost increases
KPMG CONFIDENTIAL
6
systematic recording of key information. To maintain interviewee confidentiality, all responses
were consolidated and presented anonymously.
Interviews focused on gathering opinions related to key project cost drivers, and anecdotal
evidence of the impact of these cost drivers. Focus was placed on gathering an understanding of
the current state, rather than identifying future opportunities for improvement. Overall 18
interviews were held with a total of 19 individuals.
Care was taken in ensuring that the pool of interviewees of Saskatchewan contractors
represented a mix of major commercial and industrial contractors, as well as smaller and local
contractors. In addition, interviews were held with a major design and consulting firm and with
subcontractors. Project owners included representation from development and manufacturing
industries, with interviewees including both urban and rurally based companies. Finally,
interviews were also held with industry associations in all selected jurisdictions, as well as with
project owners and contractors where possible.
■ Component 2: Desk research into construction cost trends in Saskatchewan, including selected
interprovincial and inter-jurisdictional comparisons.
Previous relevant studies, construction industry information sources and statistical information
were gathered and reviewed to identify key non-residential construction cost trends. Data was
carefully analyzed and normalized to compare and contrast trends in Saskatchewan to other
jurisdictions.
Due to differences in data collection and definitions in Canada and the United States,
comparisons were carefully considered and in some circumstances shown in separate charts to
accommodate differences in data definitions.
KPMG CONFIDENTIAL
7
3 Key Findings
3.1.1 Overall Context
KPMG International’s 2013 Global Construction Survey illustrates that after several years of falling
backlogs and tight margins, economic recovery is stimulating manufacturing globally, while growing
urbanization is driving a continued demand for infrastructure in all forms.
This trend is also being experienced in Canada as the nation sees economic growth following the
recession. The Western Provinces are seeing relatively strong and continued economic prosperity and
population growth, with growing manufacturing, resource extraction, agricultural, and construction
sectors.
According to the National Research Council, the construction sector in Canada is a $171 billion industry
that employs 1.24 million people, consuming 40% of the country’s energy and 50% of its primary
resources2. This sector contributes both directly and indirectly to the economic prosperity of the nation.
Directly, it contributes as a key economic generator; while indirectly, it supports nearly all other industries
and sectors in providing and sustaining necessary infrastructure.
As indicated earlier, Saskatchewan has been the fastest growing province in Canada based on real GDP
growth for the past decade. In addition, the province continues to have the lowest unemployment rate in
the nation, and is among the leading provinces in job growth, average weekly earnings, manufacturing
sales, retail sales, and investment in new housing construction3. In addition to strong economic
indicators, Saskatchewan recorded its highest population on record in 2013 with 1.1 million people.
Forecasts indicate continued economic and population growth over the coming years.
The construction sector in Saskatchewan is among the leading generators of economic activity, with an
average annual increase of about 8.9% since 2007.
3.1.2 Non-Residential Construction Sector
Strong demand for infrastructure following the recession, combined with demand in the energy and
resources sectors has resulted in a steady increase in non-residential construction activity nationally, and
in particular in Western Canada and Saskatchewan.
In addition to strong demand, many regions in Canada have also seen a shift toward development in
more rural and remote regions, especially in the energy and resources sectors. Strong commodity prices
have supported considerable growth in the oil and gas and mining sectors and these industries are
heavily dependent on particular geographic locations. Non-residential construction projects have
therefore followed geographical resource availability and in many instances are located in areas that are
difficult to access for the movement of supplies, as well as labour.
2 http://www.nrc-cnrc.gc.ca/eng/rd/construction/index.html
3 http://www.finance.gov.sk.ca/PlanningandReporting/2014-15/GovernmentDirection1415.pdf
KPMG CONFIDENTIAL
8
In addition to changes in demand, the sector has experienced changes in supply, as contractors of all
types and sizes have expanded their reach within Canada and the Western Canadian provinces in
particular. This perspective was validated in KPMG’s 2013 Construction Survey.
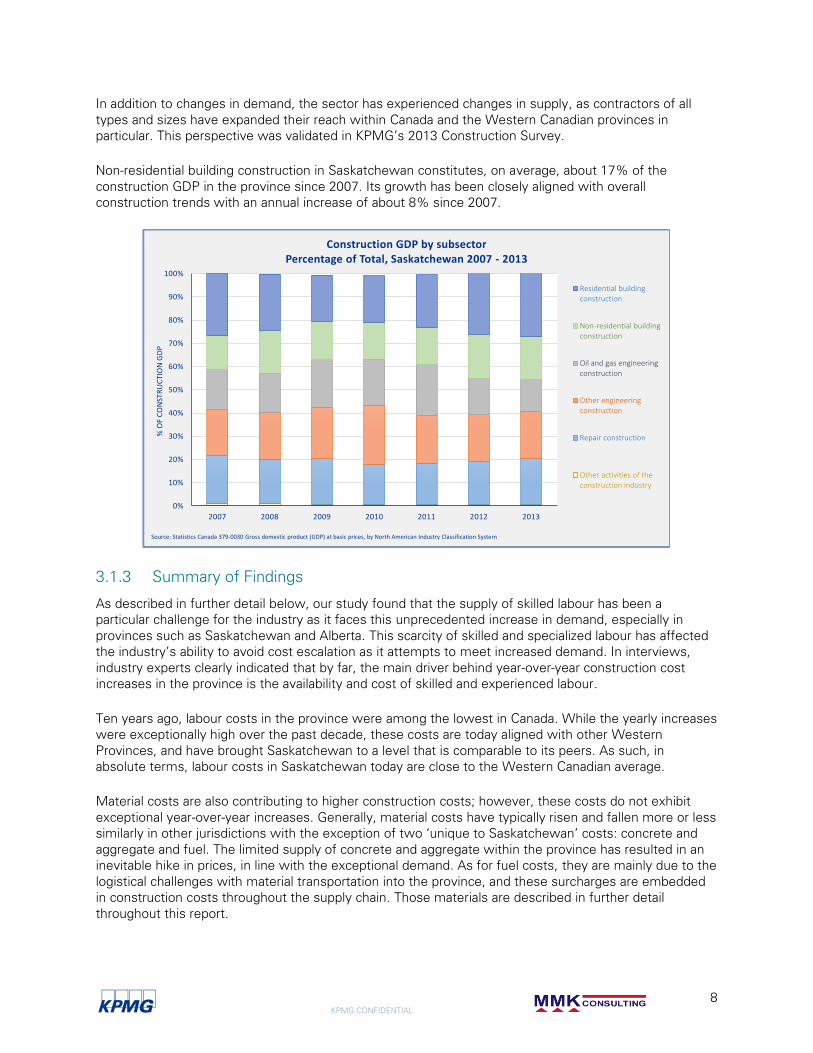
Non-residential building construction in Saskatchewan constitutes, on average, about 17% of the
construction GDP in the province since 2007. Its growth has been closely aligned with overall
construction trends with an annual increase of about 8% since 2007.
3.1.3 Summary of Findings
As described in further detail below, our study found that the supply of skilled labour has been a
particular challenge for the industry as it faces this unprecedented increase in demand, especially in
provinces such as Saskatchewan and Alberta. This scarcity of skilled and specialized labour has affected
the industry’s ability to avoid cost escalation as it attempts to meet increased demand. In interviews,
industry experts clearly indicated that by far, the main driver behind year-over-year construction cost
increases in the province is the availability and cost of skilled and experienced labour.
Ten years ago, labour costs in the province were among the lowest in Canada. While the yearly increases
were exceptionally high over the past decade, these costs are today aligned with other Western
Provinces, and have brought Saskatchewan to a level that is comparable to its peers. As such, in
absolute terms, labour costs in Saskatchewan today are close to the Western Canadian average.
Material costs are also contributing to higher construction costs; however, these costs do not exhibit
exceptional year-over-year increases. Generally, material costs have typically risen and fallen more or less
similarly in other jurisdictions with the exception of two ‘unique to Saskatchewan’ costs: concrete and
aggregate and fuel. The limited supply of concrete and aggregate within the province has resulted in an
inevitable hike in prices, in line with the exceptional demand. As for fuel costs, they are mainly due to the
logistical challenges with material transportation into the province, and these surcharges are embedded
in construction costs throughout the supply chain. Those materials are described in further detail
throughout this report.
0%
10%
20%
30%
40%
50%
60%
70%
80%
90%
100%
2007 2008 2009 2010 2011 2012 2013
% O
F C
ON
STR
UC
TIO
N G
DP
Construction GDP by subsectorPercentage of Total, Saskatchewan 2007 - 2013
Residential buildingconstruction
Non-residential buildingconstruction
Oil and gas engineeringconstruction
Other engineeringconstruction
Repair construction
Other activities of theconstruction industry
Source: Statistics Canada 379-0030 Gross domestic product (GDP) at basic prices, by North American Industry Classification System
KPMG CONFIDENTIAL
9
The sector is experiencing changes in competition and supply levels due to both new companies
entering the market, as well as considerable effort towards growth and diversification of existing
companies with a presence in Saskatchewan. As such, many of these existing companies have engaged
in significant efforts for recruitment of skilled workers.
However, our research found that while the overall competition in the sector has grown, this competition
has not necessarily resulted in construction cost decreases given that the increased number of
competitors in the market was often found to be relying on the same pool of limited specialized
subcontractors and skilled labour. This has been especially true in those provinces such as Saskatchewan
where skilled and specialized labour availability is low, and where incentives for labour relocation into the
province are in competition with those from other provinces such as Alberta.
Overall, non-residential construction costs in the province have faced exceptional yearly increases over
the past decade, in line with increased economic growth and prosperity in the province. These costs
have been driven mainly by skilled labour and specialized subcontractor availability and high concrete and
aggregate costs, with secondary contributing factors such as fuel surcharges due to logistical realities
within the province.
While the year-over-year increases in non-residential construction costs in Saskatchewan have been
exceptional, in absolute terms, the average non-residential construction costs are more or less aligned
with other provinces in Western Canada, placing these provinces as the costlier places for construction in
the nation.
Any assessment of construction costs should also look at the entirety of the asset and its life-cycle costs,
including land, and operation and maintenance costs. In this regard, Saskatchewan may still be among
the most favourable locations for non-residential construction in Western Canada, with land costs being
relatively competitive.
3.1.4 Sources of Cost Escalation
Construction projects share common elements, such as requiring a combination of labour and materials.
The proportion of these basic inputs varies greatly for each project based on the design, complexity and
requirements of the project type and its owner’s preferences.
In assessing the relative contribution of various sources of cost escalation, we relied on some of the
findings of our study. In terms of labour, and as this report indicates, efforts have been undertaken to
recruit and train skilled workers to meet critical shortages in Saskatchewan, with short term
improvements realized through international recruitment efforts, increased training efforts, and wage
increases. However, these efforts have not resolved challenges such as high retirement rates and
employee retention issues.
Material costs typically account for about half of construction costs in commercial and industrial projects.
The composition of these costs varies widely from project to project, with both the overall proportion
compared to labour, as well as the composition of materials potentially varying dramatically (such as
concrete, steel, lumber, glazing, equipment, etc.).
With the majority of materials being resource based, cost increases and decreases are often based on
market forces, with some being more volatile than others. These changing material costs create
challenges and risks for contractors and project owners as they try to accurately forecast and estimate
project costs. At a national scale, these costs have typically risen and fallen similarly in other jurisdictions
as well. Interviewees shared this perspective with the exception of two ‘unique to Saskatchewan’ costs:
concrete and aggregate, and fuel. These materials are described in further detail throughout this report.
KPMG CONFIDENTIAL
10
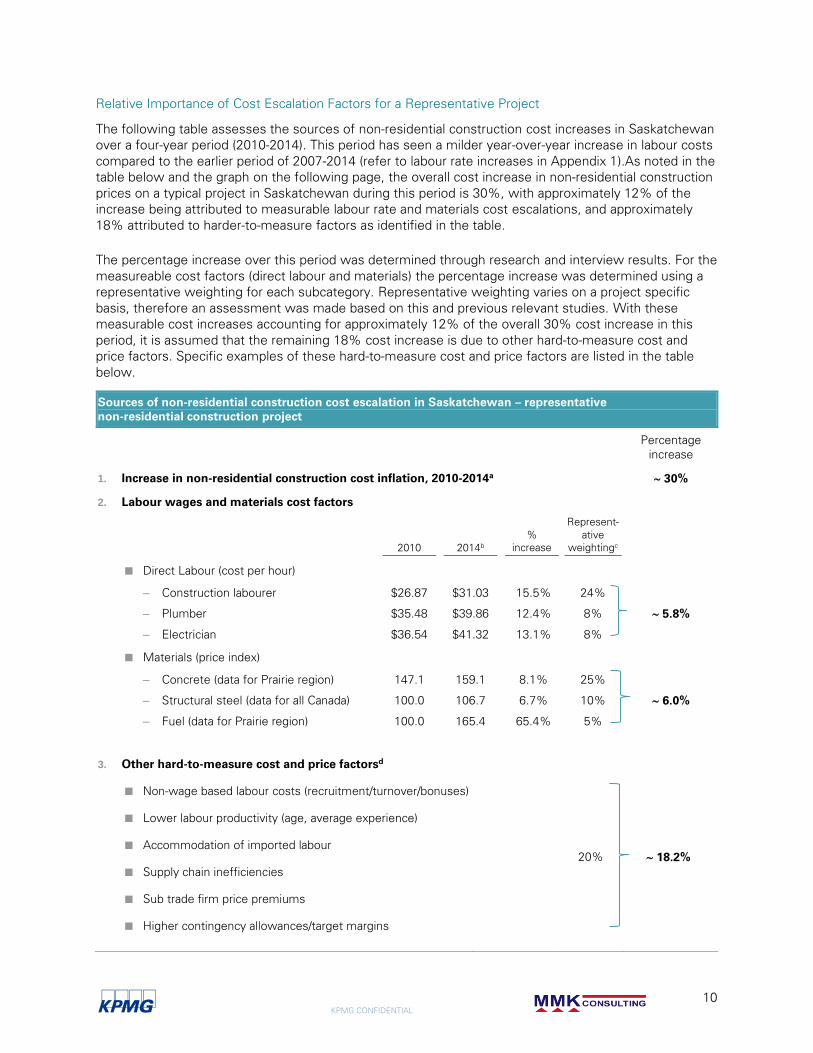
Relative Importance of Cost Escalation Factors for a Representative Project
The following table assesses the sources of non-residential construction cost increases in Saskatchewan
over a four-year period (2010-2014). This period has seen a milder year-over-year increase in labour costs
compared to the earlier period of 2007-2014 (refer to labour rate increases in Appendix 1).As noted in the
table below and the graph on the following page, the overall cost increase in non-residential construction
prices on a typical project in Saskatchewan during this period is 30%, with approximately 12% of the
increase being attributed to measurable labour rate and materials cost escalations, and approximately
18% attributed to harder-to-measure factors as identified in the table.
The percentage increase over this period was determined through research and interview results. For the
measureable cost factors (direct labour and materials) the percentage increase was determined using a
representative weighting for each subcategory. Representative weighting varies on a project specific
basis, therefore an assessment was made based on this and previous relevant studies. With these
measurable cost increases accounting for approximately 12% of the overall 30% cost increase in this
period, it is assumed that the remaining 18% cost increase is due to other hard-to-measure cost and
price factors. Specific examples of these hard-to-measure cost and price factors are listed in the table
below.
Sources of non-residential construction cost escalation in Saskatchewan – representative
non-residential construction project
Percentage
increase
1. Increase in non-residential construction cost inflation, 2010-2014a 30%
2. Labour wages and materials cost factors
2010 2014b
%
increase
Represent-
ative
weightingc
■ Direct Labour (cost per hour)
– Construction labourer $26.87 $31.03 15.5% 24%
5.8% – Plumber $35.48 $39.86 12.4% 8%
– Electrician $36.54 $41.32 13.1% 8%
■ Materials (price index)
– Concrete (data for Prairie region) 147.1 159.1 8.1% 25%
6.0% – Structural steel (data for all Canada) 100.0 106.7 6.7% 10%
– Fuel (data for Prairie region) 100.0 165.4 65.4% 5%
3. Other hard-to-measure cost and price factorsd
■ Non-wage based labour costs (recruitment/turnover/bonuses)
20% 18.2%
■ Lower labour productivity (age, average experience)
■ Accommodation of imported labour
■ Supply chain inefficiencies
■ Sub trade firm price premiums
■ Higher contingency allowances/target margins
KPMG CONFIDENTIAL
11
Sources of non-residential construction cost escalation in Saskatchewan – representative
non-residential construction project
a KPMG/MMK estimate based on (1) interview results, (2) Statistics Canada index data, and (3) KPMG Competitive Alternatives.
b 2014 represents data from January – April 2014.
c Representative weighting of total construction prices by KPMG/MMK – will vary on a project specific basis. Assumed 2010 weighting of 40% labour, 40% materials,
20% other.
d KPMG/MMK assessment based on this and previous relevant studies.
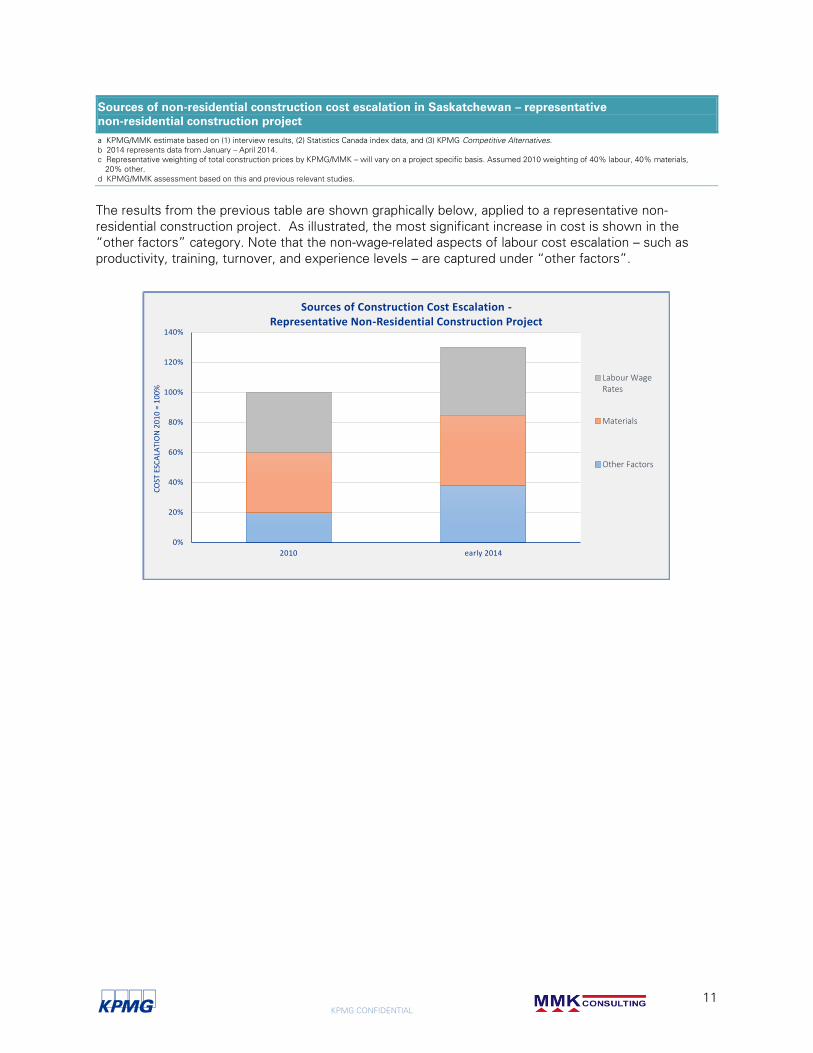
The results from the previous table are shown graphically below, applied to a representative non-
residential construction project. As illustrated, the most significant increase in cost is shown in the
“other factors” category. Note that the non-wage-related aspects of labour cost escalation – such as
productivity, training, turnover, and experience levels – are captured under “other factors”.
0%
20%
40%
60%
80%
100%
120%
140%
2010 early 2014
CO
ST E
SCA
LATI
ON
20
10
= 1
00
%
Sources of Construction Cost Escalation -Representative Non-Residential Construction Project
Labour WageRates
Materials
Other Factors
KPMG CONFIDENTIAL
12
3.2 Overview of Individual Cost Drivers
3.2.1 Primary non-residential cost drivers and their relative importance
The key construction cost drivers identified for Saskatchewan may be summarized in the following table,
in general order of importance.
Summary of Key Findings
Cost driver Comments
Major Drivers
■ Labour rates ■ Wage rate increases among the highest in Canada
■ Labour productivity and
availability
■ Aging demographics, declining average experience levels
■ Sub trade supply and scheduling
■ Construction activity levels ■ Increasing activity, especially in major projects
■ Driven primarily by industrial construction in 2013
■ Softening of demand in the first half of 2014
■ Competition levels ■ Increasing competition from national/international contractors
■ Increasing P3 orientation changing competitive landscape
■ Sub trades benefitting from strong markets
■ Other Significant Drivers
■ Materials costs ■ Higher aggregate and concrete costs than in other jurisidcaitons
■ Supply management ■ Longer wait times, reduced reliability of materials/equipment
delivery
■ Construction methods ■ Increasing use of out-ot-province labour, pre-fab services
Labour rates
As indicated earlier, and further detailed in the appendices, industry representatives interviewed for this
project have unanimously identified labour costs as a significant cost driver of non-residential
construction costs in Saskatchewan in recent years.
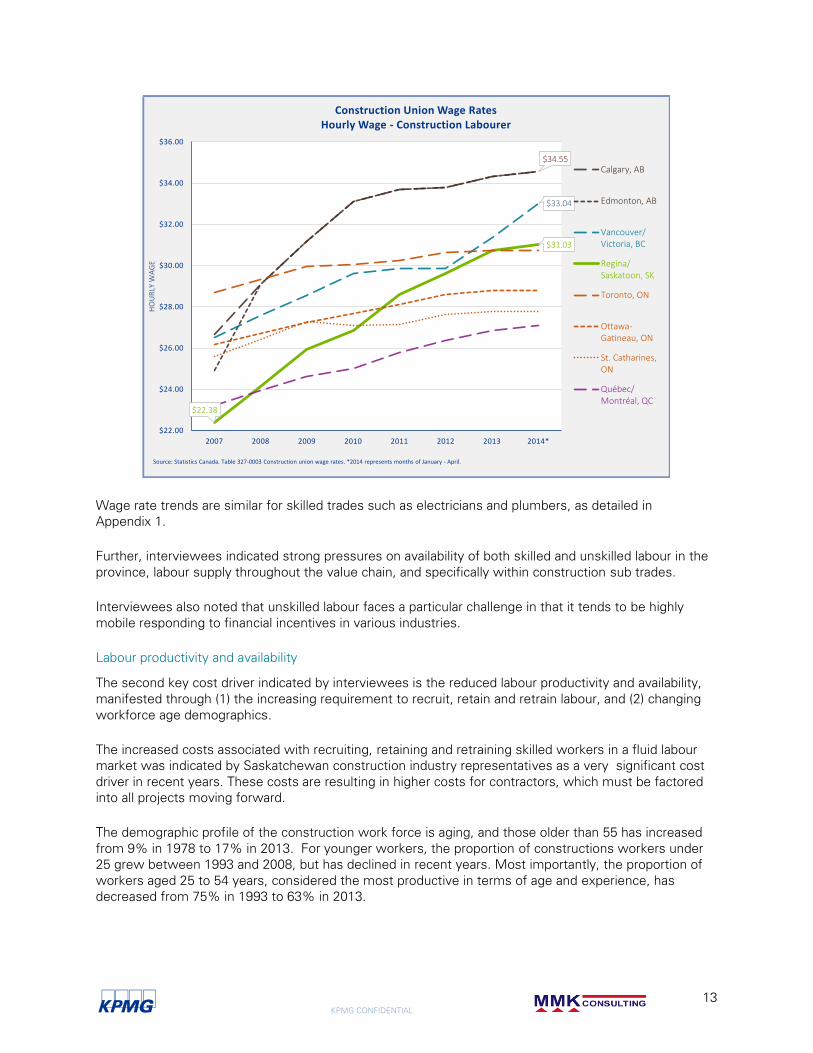
In 2007, Saskatchewan’s union wage rates for construction labourers were among the lowest in Canada.
In 2014, they have grown to become the third highest in the country, after Alberta and BC. Since 2010,
union wage rates for construction workers have increased more in Regina/Saskatoon than in any other
sizable Canadian city.
Labour costs on a construction project typically represent up to 40% or more of project costs, and the
39% increase in union wage rates for construction labourers since 2007 has had a significant impact on
non-residential construction costs. This increase reflects the growing demand for construction labour in
Saskatchewan relative to supply, and the resulting closer alignment of construction wage rates in
Saskatchewan with those in other Canadian jurisdictions.
KPMG CONFIDENTIAL
13
Wage rate trends are similar for skilled trades such as electricians and plumbers, as detailed in
Appendix 1.
Further, interviewees indicated strong pressures on availability of both skilled and unskilled labour in the
province, labour supply throughout the value chain, and specifically within construction sub trades.
Interviewees also noted that unskilled labour faces a particular challenge in that it tends to be highly
mobile responding to financial incentives in various industries.
Labour productivity and availability
The second key cost driver indicated by interviewees is the reduced labour productivity and availability,
manifested through (1) the increasing requirement to recruit, retain and retrain labour, and (2) changing
workforce age demographics.
The increased costs associated with recruiting, retaining and retraining skilled workers in a fluid labour
market was indicated by Saskatchewan construction industry representatives as a very significant cost
driver in recent years. These costs are resulting in higher costs for contractors, which must be factored
into all projects moving forward.
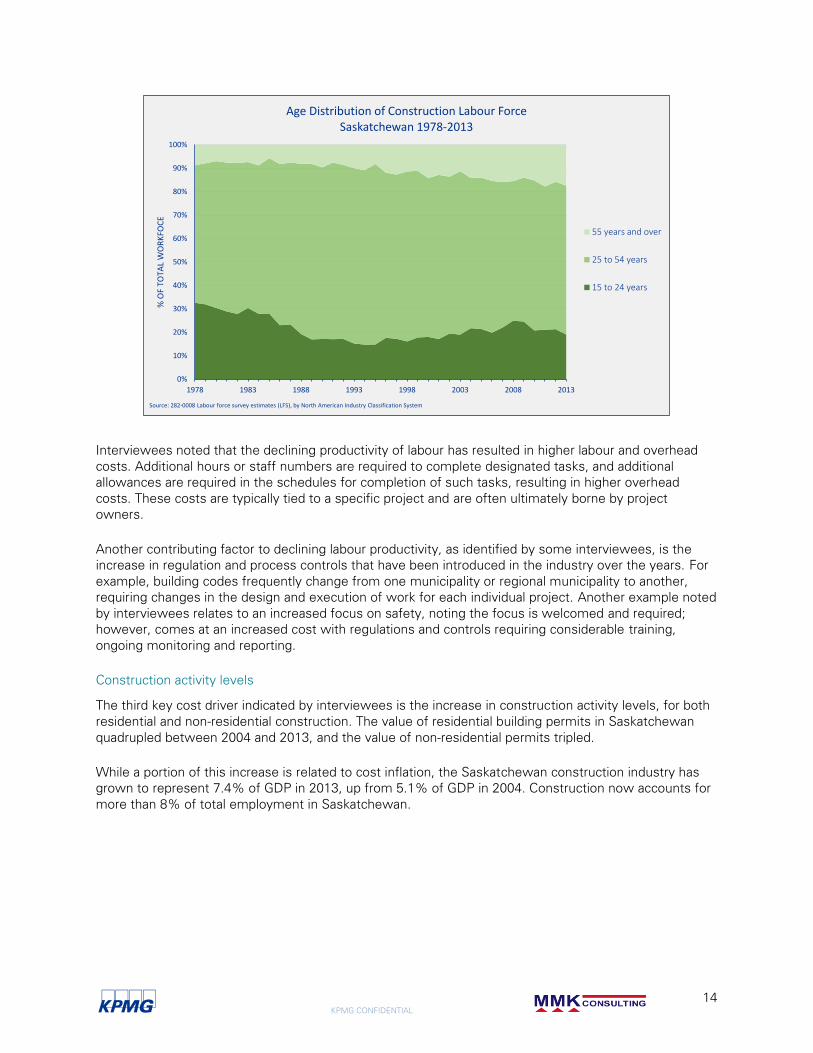
The demographic profile of the construction work force is aging, and those older than 55 has increased
from 9% in 1978 to 17% in 2013. For younger workers, the proportion of constructions workers under
25 grew between 1993 and 2008, but has declined in recent years. Most importantly, the proportion of
workers aged 25 to 54 years, considered the most productive in terms of age and experience, has
decreased from 75% in 1993 to 63% in 2013.
$34.55
$33.04
$22.38
$31.03
$22.00
$24.00
$26.00
$28.00
$30.00
$32.00
$34.00
$36.00
2007 2008 2009 2010 2011 2012 2013 2014*
HO
UR
LY W
AG
E
Construction Union Wage RatesHourly Wage - Construction Labourer
Calgary, AB
Edmonton, AB
Vancouver/Victoria, BC
Regina/Saskatoon, SK
Toronto, ON
Ottawa-Gatineau, ON
St. Catharines,ON
Québec/Montréal, QC
Source: Statistics Canada. Table 327-0003 Construction union wage rates. *2014 represents months of January - April.
KPMG CONFIDENTIAL
14
Interviewees noted that the declining productivity of labour has resulted in higher labour and overhead
costs. Additional hours or staff numbers are required to complete designated tasks, and additional
allowances are required in the schedules for completion of such tasks, resulting in higher overhead
costs. These costs are typically tied to a specific project and are often ultimately borne by project
owners.
Another contributing factor to declining labour productivity, as identified by some interviewees, is the
increase in regulation and process controls that have been introduced in the industry over the years. For
example, building codes frequently change from one municipality or regional municipality to another,
requiring changes in the design and execution of work for each individual project. Another example noted
by interviewees relates to an increased focus on safety, noting the focus is welcomed and required;
however, comes at an increased cost with regulations and controls requiring considerable training,
ongoing monitoring and reporting.
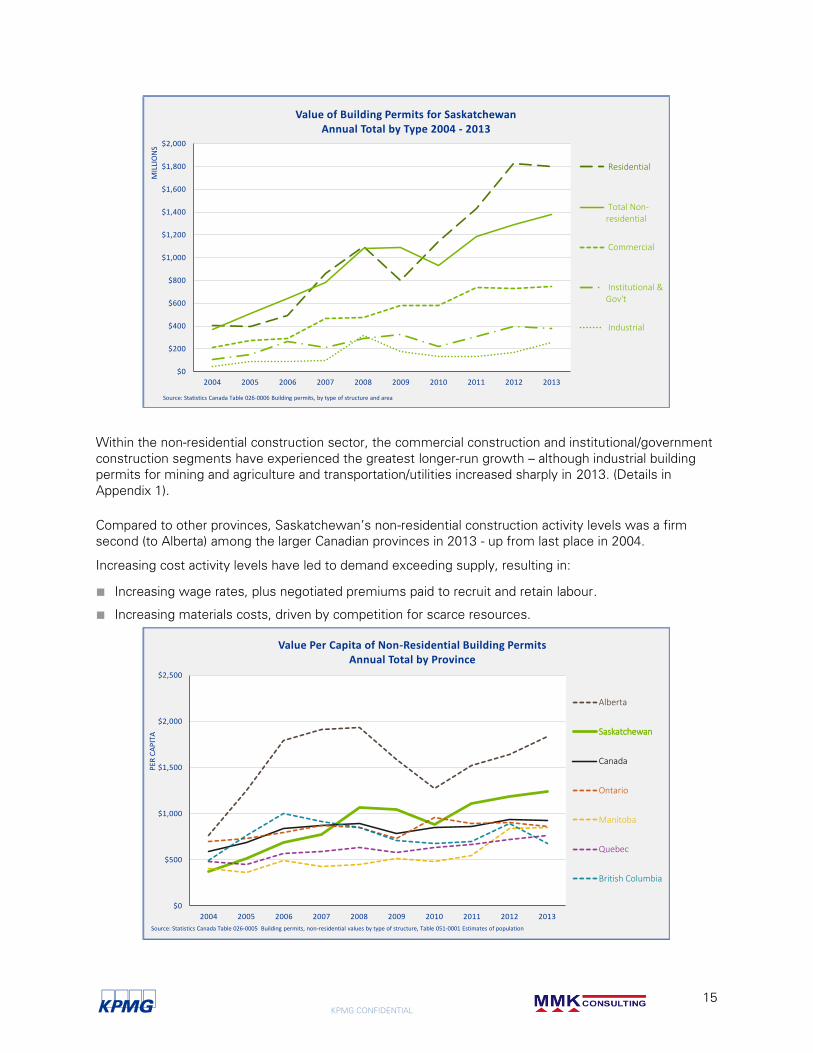
Construction activity levels
The third key cost driver indicated by interviewees is the increase in construction activity levels, for both
residential and non-residential construction. The value of residential building permits in Saskatchewan
quadrupled between 2004 and 2013, and the value of non-residential permits tripled.
While a portion of this increase is related to cost inflation, the Saskatchewan construction industry has
grown to represent 7.4% of GDP in 2013, up from 5.1% of GDP in 2004. Construction now accounts for
more than 8% of total employment in Saskatchewan.
0%
10%
20%
30%
40%
50%
60%
70%
80%
90%
100%
1978 1983 1988 1993 1998 2003 2008 2013
% O
F TO
TAL
WO
RK
FOC
E
Age Distribution of Construction Labour ForceSaskatchewan 1978-2013
55 years and over
25 to 54 years
15 to 24 years
Source: 282-0008 Labour force survey estimates (LFS), by North American Industry Classification System
KPMG CONFIDENTIAL
15
Within the non-residential construction sector, the commercial construction and institutional/government
construction segments have experienced the greatest longer-run growth – although industrial building
permits for mining and agriculture and transportation/utilities increased sharply in 2013. (Details in
Appendix 1).
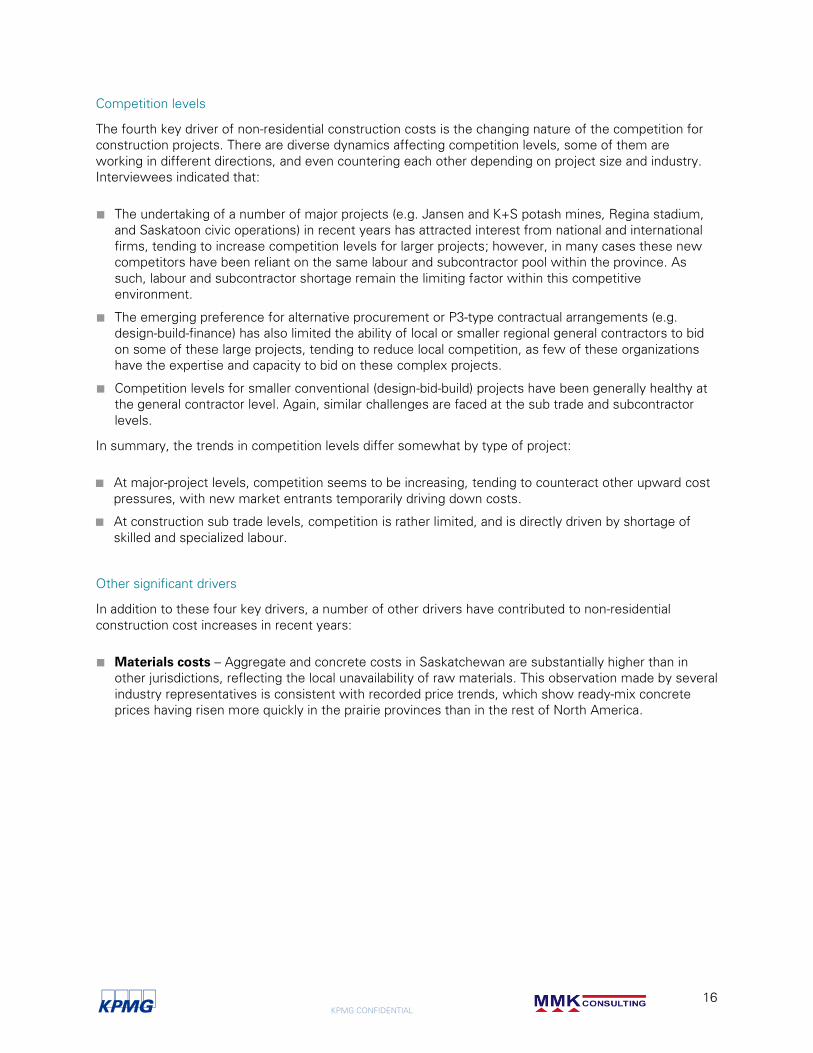
Compared to other provinces, Saskatchewan’s non-residential construction activity levels was a firm
second (to Alberta) among the larger Canadian provinces in 2013 - up from last place in 2004.
Increasing cost activity levels have led to demand exceeding supply, resulting in:
■ Increasing wage rates, plus negotiated premiums paid to recruit and retain labour.
■ Increasing materials costs, driven by competition for scarce resources.
$0
$200
$400
$600
$800
$1,000
$1,200
$1,400
$1,600
$1,800
$2,000
2004 2005 2006 2007 2008 2009 2010 2011 2012 2013
MIL
LIO
NS
Value of Building Permits for SaskatchewanAnnual Total by Type 2004 - 2013
Residential
Total Non-residential
Commercial
Institutional &Gov't
Industrial
Source: Statistics Canada Table 026-0006 Building permits, by type of structure and area
$0
$500
$1,000
$1,500
$2,000
$2,500
2004 2005 2006 2007 2008 2009 2010 2011 2012 2013
PER
CA
PIT
A
Value Per Capita of Non-Residential Building PermitsAnnual Total by Province
Alberta
Saskatchewan
Canada
Ontario
Manitoba
Quebec
British Columbia
Source: Statistics Canada Table 026-0005 Building permits, non-residential values by type of structure, Table 051-0001 Estimates of population
KPMG CONFIDENTIAL
16
Competition levels
The fourth key driver of non-residential construction costs is the changing nature of the competition for
construction projects. There are diverse dynamics affecting competition levels, some of them are
working in different directions, and even countering each other depending on project size and industry.
Interviewees indicated that:
■ The undertaking of a number of major projects (e.g. Jansen and K+S potash mines, Regina stadium,
and Saskatoon civic operations) in recent years has attracted interest from national and international
firms, tending to increase competition levels for larger projects; however, in many cases these new
competitors have been reliant on the same labour and subcontractor pool within the province. As
such, labour and subcontractor shortage remain the limiting factor within this competitive
environment.
■ The emerging preference for alternative procurement or P3-type contractual arrangements (e.g.
design-build-finance) has also limited the ability of local or smaller regional general contractors to bid
on some of these large projects, tending to reduce local competition, as few of these organizations
have the expertise and capacity to bid on these complex projects.
■ Competition levels for smaller conventional (design-bid-build) projects have been generally healthy at
the general contractor level. Again, similar challenges are faced at the sub trade and subcontractor
levels.
In summary, the trends in competition levels differ somewhat by type of project:
■ At major-project levels, competition seems to be increasing, tending to counteract other upward cost
pressures, with new market entrants temporarily driving down costs.
■ At construction sub trade levels, competition is rather limited, and is directly driven by shortage of
skilled and specialized labour.
Other significant drivers
In addition to these four key drivers, a number of other drivers have contributed to non-residential
construction cost increases in recent years:
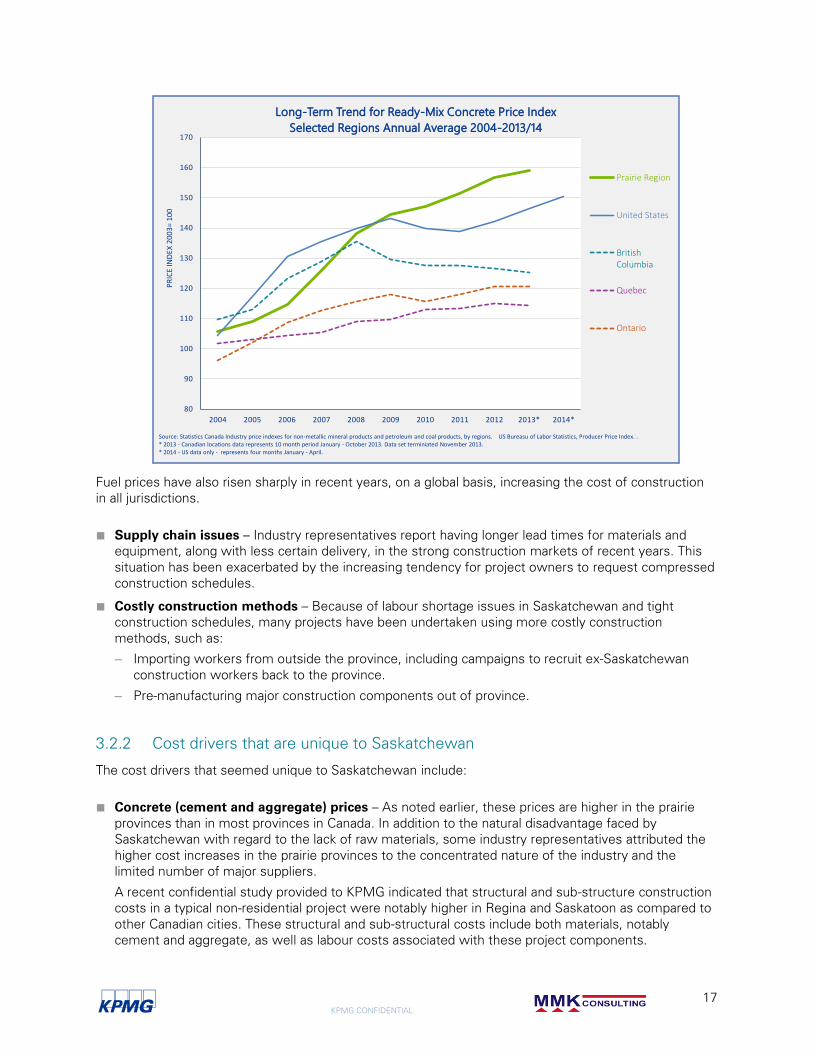
■ Materials costs – Aggregate and concrete costs in Saskatchewan are substantially higher than in
other jurisdictions, reflecting the local unavailability of raw materials. This observation made by several
industry representatives is consistent with recorded price trends, which show ready-mix concrete
prices having risen more quickly in the prairie provinces than in the rest of North America.
KPMG CONFIDENTIAL
17
Fuel prices have also risen sharply in recent years, on a global basis, increasing the cost of construction
in all jurisdictions.
■ Supply chain issues – Industry representatives report having longer lead times for materials and
equipment, along with less certain delivery, in the strong construction markets of recent years. This
situation has been exacerbated by the increasing tendency for project owners to request compressed
construction schedules.
■ Costly construction methods – Because of labour shortage issues in Saskatchewan and tight
construction schedules, many projects have been undertaken using more costly construction
methods, such as:
– Importing workers from outside the province, including campaigns to recruit ex-Saskatchewan
construction workers back to the province.
– Pre-manufacturing major construction components out of province.
3.2.2 Cost drivers that are unique to Saskatchewan
The cost drivers that seemed unique to Saskatchewan include:
■ Concrete (cement and aggregate) prices – As noted earlier, these prices are higher in the prairie
provinces than in most provinces in Canada. In addition to the natural disadvantage faced by
Saskatchewan with regard to the lack of raw materials, some industry representatives attributed the
higher cost increases in the prairie provinces to the concentrated nature of the industry and the
limited number of major suppliers.
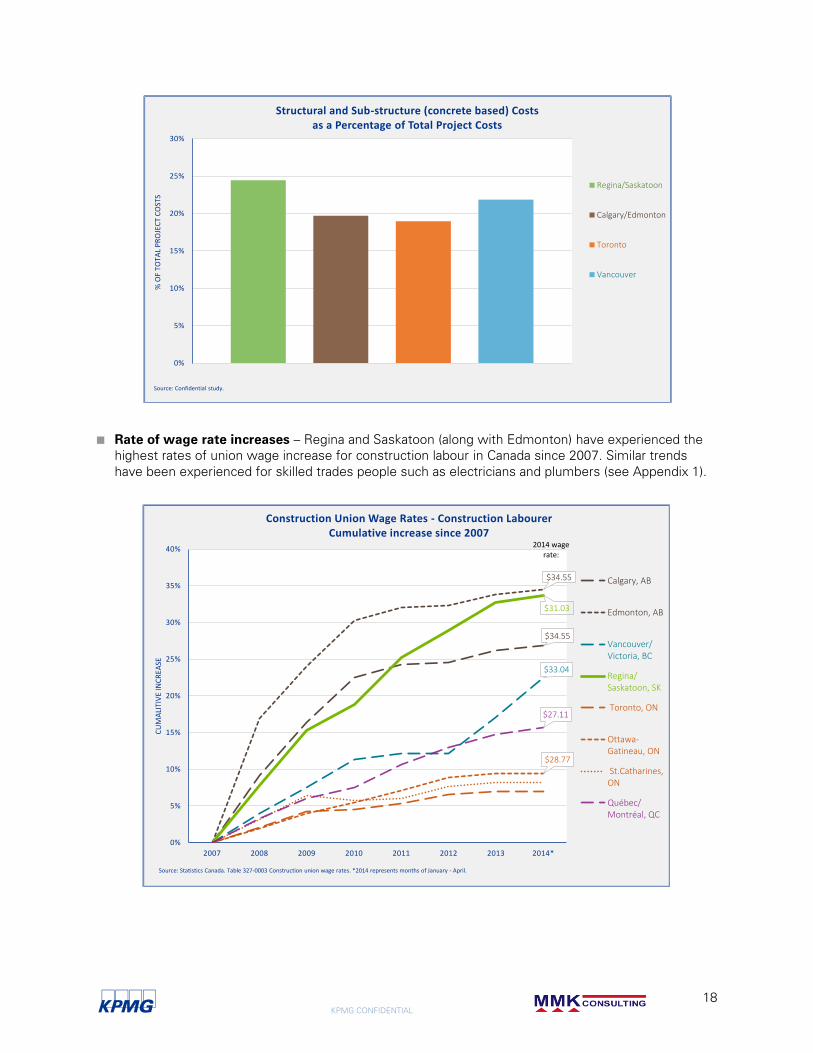
A recent confidential study provided to KPMG indicated that structural and sub-structure construction
costs in a typical non-residential project were notably higher in Regina and Saskatoon as compared to
other Canadian cities. These structural and sub-structural costs include both materials, notably
cement and aggregate, as well as labour costs associated with these project components.
80
90
100
110
120
130
140
150
160
170
2004 2005 2006 2007 2008 2009 2010 2011 2012 2013* 2014*
PR
ICE
IND
EX 2
00
3=
10
0
Long-Term Trend for Ready-Mix Concrete Price Index
Selected Regions Annual Average 2004-2013/14
Prairie Region
United States
BritishColumbia
Quebec
Ontario
Source: Statistics Canada Industry price indexes for non-metallic mineral products and petroleum and coal products, by regions. US Bureasu of Labor Statistics, Producer Price Index. . * 2013 - Canadian locations data represents 10 month period January - October 2013. Data set terminiated November 2013.* 2014 - US data only - represents four months January - April.
KPMG CONFIDENTIAL
18
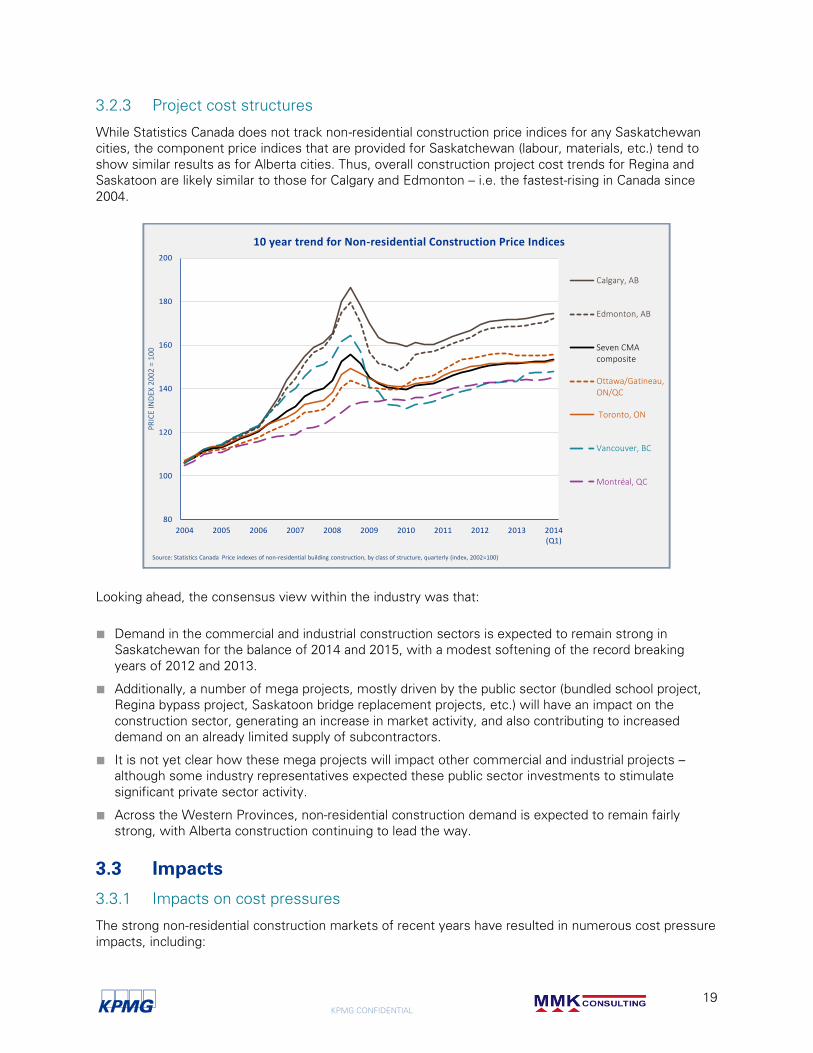
■ Rate of wage rate increases – Regina and Saskatoon (along with Edmonton) have experienced the
highest rates of union wage increase for construction labour in Canada since 2007. Similar trends
have been experienced for skilled trades people such as electricians and plumbers (see Appendix 1).
0%
5%
10%
15%
20%
25%
30%
% O
F TO
TAL
PR
OJE
CT
CO
STS
Structural and Sub-structure (concrete based) Costs as a Percentage of Total Project Costs
Regina/Saskatoon
Calgary/Edmonton
Toronto
Vancouver
Source: Confidential study.
$34.55
$34.55
$33.04
$31.03
$28.77
$27.11
0%
5%
10%
15%
20%
25%
30%
35%
40%
2007 2008 2009 2010 2011 2012 2013 2014*
CU
MA
LITI
VE
INC
REA
SE
Construction Union Wage Rates - Construction LabourerCumulative increase since 2007
Calgary, AB
Edmonton, AB
Vancouver/Victoria, BC
Regina/Saskatoon, SK
Toronto, ON
Ottawa-Gatineau, ON
St.Catharines,ON
Québec/Montréal, QC
Source: Statistics Canada. Table 327-0003 Construction union wage rates. *2014 represents months of January - April.
2014 wage rate:
KPMG CONFIDENTIAL
19
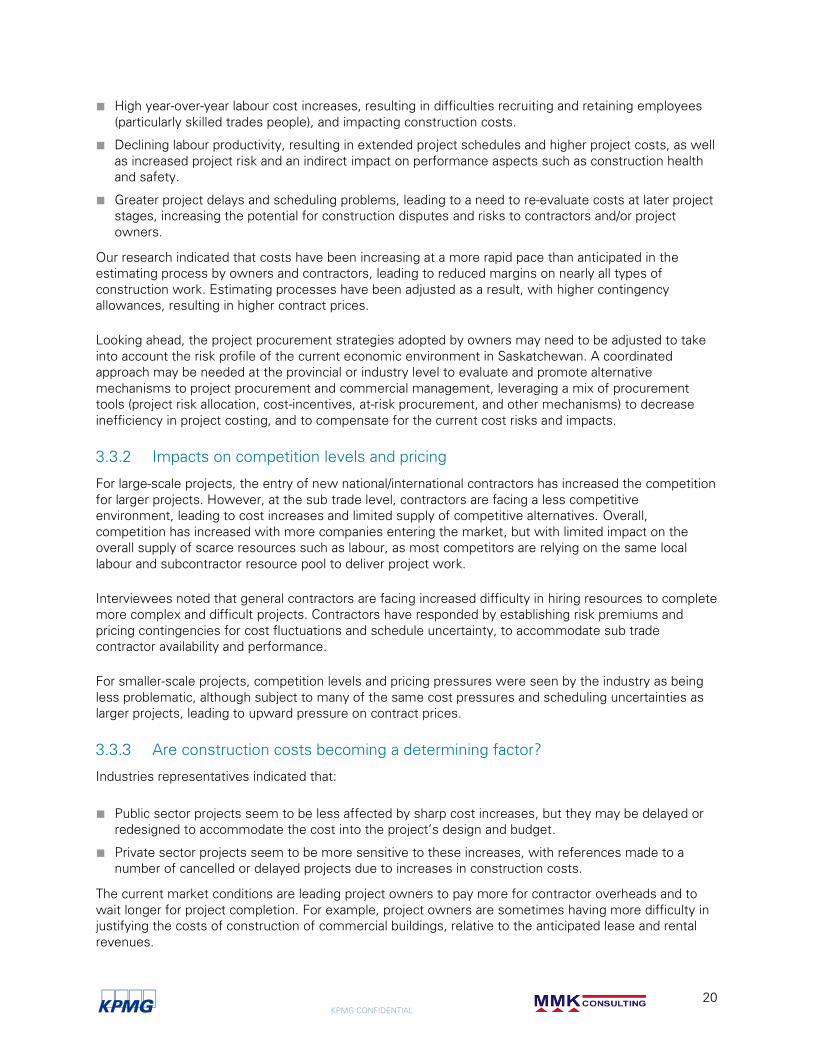
3.2.3 Project cost structures
While Statistics Canada does not track non-residential construction price indices for any Saskatchewan
cities, the component price indices that are provided for Saskatchewan (labour, materials, etc.) tend to
show similar results as for Alberta cities. Thus, overall construction project cost trends for Regina and
Saskatoon are likely similar to those for Calgary and Edmonton – i.e. the fastest-rising in Canada since
2004.
Looking ahead, the consensus view within the industry was that:
■ Demand in the commercial and industrial construction sectors is expected to remain strong in
Saskatchewan for the balance of 2014 and 2015, with a modest softening of the record breaking
years of 2012 and 2013.
■ Additionally, a number of mega projects, mostly driven by the public sector (bundled school project,
Regina bypass project, Saskatoon bridge replacement projects, etc.) will have an impact on the
construction sector, generating an increase in market activity, and also contributing to increased
demand on an already limited supply of subcontractors.
■ It is not yet clear how these mega projects will impact other commercial and industrial projects –
although some industry representatives expected these public sector investments to stimulate
significant private sector activity.
■ Across the Western Provinces, non-residential construction demand is expected to remain fairly
strong, with Alberta construction continuing to lead the way.
3.3 Impacts
3.3.1 Impacts on cost pressures
The strong non-residential construction markets of recent years have resulted in numerous cost pressure
impacts, including:
80
100
120
140
160
180
200
2004 2005 2006 2007 2008 2009 2010 2011 2012 2013 2014(Q1)
PR
ICE
IND
EX 2
00
2 =
10
0
10 year trend for Non-residential Construction Price Indices
Calgary, AB
Edmonton, AB
Seven CMAcomposite
Ottawa/Gatineau,ON/QC
Toronto, ON
Vancouver, BC
Montréal, QC
Source: Statistics Canada Price indexes of non-residential building construction, by class of structure, quarterly (index, 2002=100)
KPMG CONFIDENTIAL
20
■ High year-over-year labour cost increases, resulting in difficulties recruiting and retaining employees
(particularly skilled trades people), and impacting construction costs.
■ Declining labour productivity, resulting in extended project schedules and higher project costs, as well
as increased project risk and an indirect impact on performance aspects such as construction health
and safety.
■ Greater project delays and scheduling problems, leading to a need to re-evaluate costs at later project
stages, increasing the potential for construction disputes and risks to contractors and/or project
owners.
Our research indicated that costs have been increasing at a more rapid pace than anticipated in the
estimating process by owners and contractors, leading to reduced margins on nearly all types of
construction work. Estimating processes have been adjusted as a result, with higher contingency
allowances, resulting in higher contract prices.
Looking ahead, the project procurement strategies adopted by owners may need to be adjusted to take
into account the risk profile of the current economic environment in Saskatchewan. A coordinated
approach may be needed at the provincial or industry level to evaluate and promote alternative
mechanisms to project procurement and commercial management, leveraging a mix of procurement
tools (project risk allocation, cost-incentives, at-risk procurement, and other mechanisms) to decrease
inefficiency in project costing, and to compensate for the current cost risks and impacts.
3.3.2 Impacts on competition levels and pricing
For large-scale projects, the entry of new national/international contractors has increased the competition
for larger projects. However, at the sub trade level, contractors are facing a less competitive
environment, leading to cost increases and limited supply of competitive alternatives. Overall,
competition has increased with more companies entering the market, but with limited impact on the
overall supply of scarce resources such as labour, as most competitors are relying on the same local
labour and subcontractor resource pool to deliver project work.
Interviewees noted that general contractors are facing increased difficulty in hiring resources to complete
more complex and difficult projects. Contractors have responded by establishing risk premiums and
pricing contingencies for cost fluctuations and schedule uncertainty, to accommodate sub trade
contractor availability and performance.
For smaller-scale projects, competition levels and pricing pressures were seen by the industry as being
less problematic, although subject to many of the same cost pressures and scheduling uncertainties as
larger projects, leading to upward pressure on contract prices.
3.3.3 Are construction costs becoming a determining factor?
Industries representatives indicated that:
■ Public sector projects seem to be less affected by sharp cost increases, but they may be delayed or
redesigned to accommodate the cost into the project’s design and budget.
■ Private sector projects seem to be more sensitive to these increases, with references made to a
number of cancelled or delayed projects due to increases in construction costs.
The current market conditions are leading project owners to pay more for contractor overheads and to
wait longer for project completion. For example, project owners are sometimes having more difficulty in
justifying the costs of construction of commercial buildings, relative to the anticipated lease and rental
revenues.
KPMG CONFIDENTIAL
21
3.3.4 Are construction costs reaching prohibitive limits?
The industry consensus was that, while construction costs have increased significantly, they have not
reached the stage where there is likely to be a sudden crash in activity levels. The industry expected a
“soft landing” in 2014/15, as demand for construction eases somewhat over 2012/13 record levels.
3.4 Emerging Trends
Recent and emerging industry trends include:
■ Alternate construction methods – Some contractors have developed creative construction methods
and approaches, such as prefab construction outside the province to overcome local labour shortages
and to achieve target schedules. Prefab construction helps to meet project schedules, but also
encourages job creation and economic development opportunities to take place outside of the
province.
■ Sub trade labour from out of province – Sub trades are generally considered to be less mobile than
the overall contracting community, and out of province recruitment has been increasing in recent
years. Concerns were raised by interviewees related to the capacity at the trades level to deliver all
of the mega projects that are envisaged for Saskatchewan as few companies have the required labour
resources to meet the demand and complexity of these projects.
With regard to future construction cost trends, the industry expectations were that:
■ Non-residential construction demand is likely to remain strong into the future, but to continue to shift
towards fewer, but larger projects. This is driven by the national and international trends towards
aggregation in procurement of projects. These trends tend to favour a shift towards an industry with
similar overall annual construction values, but with a different landscape in terms of competition and
company size within Saskatchewan.
■ The requirements for bidding on those larger projects (including P3 projects) entail significant
experience, upfront investment and risk taking by the bidders. Hence, such projects are likely to
favour larger bidders with previous experience on contracts of such magnitude and complexity, and
will likely exclude a number of small or medium Saskatchewan-based companies. This being said,
these larger projects also offer opportunities for well-positioned local companies to grow, prosper and
achieve transfer of knowledge through partnership with larger national contractors.
■ Despite the increased national and international contractor interest in large projects, such contractors
may eventually face similar constraints to local contractors in terms of securing the necessary local
labour to successfully deliver on project commitments. This being said, large organizations such as
national general contractors may be able to leverage or tap into resources in other provinces to
alleviate such shortages. Further, the size of their projects and their approach to bidding for a portfolio
of projects in Saskatchewan may enable some of them to justify the introduction of alternative
methods for project delivery that circumvent local labour scarcity. Such approaches, however, might
also come at a steep price, either in terms of project cost, or in terms of margin and profit for those
contractors.
3.5 Inter-jurisdictional Observations
3.5.1 Construction cost trends
As detailed in Appendix 1, construction costs trends have been generally higher in Saskatchewan than in
all other Canadian jurisdictions, except Alberta. At the same time, land prices in Saskatchewan have
remained competitive.
KPMG CONFIDENTIAL
22
Industry representatives noted some recent differences in construction demand and cost trends in
Regina compared to Saskatoon. Commercial construction demand has remained relatively strong in
Regina in recent months, while Saskatoon has experienced a slowdown. Major industrial projects are
expected in the Saskatoon area in the near future, including projects such as the Jansen potash mine,
which is anticipated to also fuel demand in other sectors.
The economy in Saskatchewan is still relatively small compared to other markets, and therefore heats up
and slows down quickly. Additionally, the commodity driven nature of the Saskatchewan economy
naturally means some level of volatility in the non-residential construction market.
3.5.2 Vulnerability of relocation of Saskatchewan construction projects
Despite the significant cost and scheduling pressures seen in recent years, the industry consensus was
that few if any Saskatchewan construction projects have been relocated to other jurisdictions because of
these pressures. This conclusion reflects the location-specific nature of many of the non-residential
projects undertaken in Saskatchewan, often relating to resource-based commodities.
At the same time, a number of industry sectors (e.g. administrative services support centres) are known
to be sensitive to construction and operating costs structures. Saskatchewan has lost much of its former
construction cost advantages over other Canadian jurisdictions in this respect.
Looking ahead, the Saskatchewan non-residential construction industry generally saw the potential future
impacts of tight construction markets as being the delay of public sector projects and
cancellation/deferral of private sector projects, rather than losing projects to other jurisdictions.
* * *
Further details of the statistical review and interview results underlying these findings and conclusions
are contained in Appendices 1 and 2.
KPMG CONFIDENTIAL
23
Appendix 1 Statistical Review
Construction Activity Trends
Growth in the Saskatchewan Construction Industry
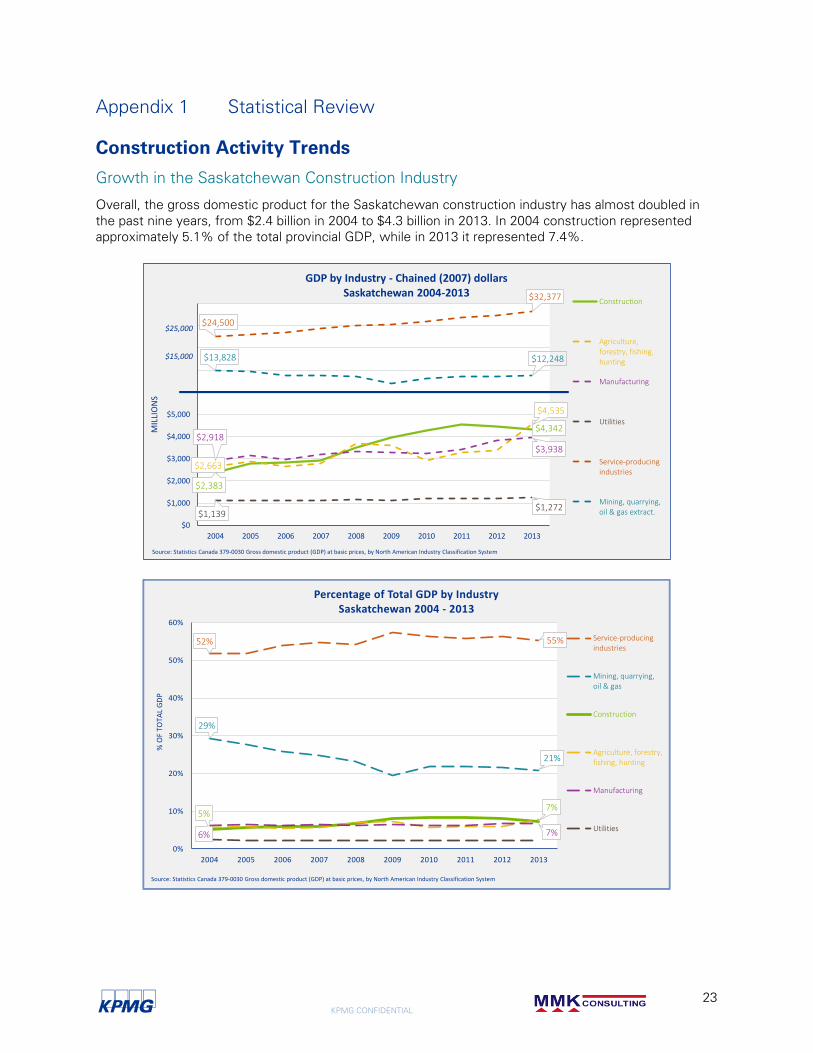
Overall, the gross domestic product for the Saskatchewan construction industry has almost doubled in
the past nine years, from $2.4 billion in 2004 to $4.3 billion in 2013. In 2004 construction represented
approximately 5.1% of the total provincial GDP, while in 2013 it represented 7.4%.
$2,383
$4,342
$2,663
$4,535
$2,918$3,938
$1,139$1,272
$24,500
$32,377
$13,828 $12,248
$0
$1,000
$2,000
$3,000
$4,000
$5,000
$6,000
$7,000
$8,000
$9,000
$10,000
2004 2005 2006 2007 2008 2009 2010 2011 2012 2013
MIL
LIO
NS
GDP by Industry - Chained (2007) dollarsSaskatchewan 2004-2013
Construction
Agriculture,forestry, fishing,hunting
Manufacturing
Utilities
Service-producingindustries
Mining, quarrying,oil & gas extract.
Source: Statistics Canada 379-0030 Gross domestic product (GDP) at basic prices, by North American Industry Classification System
$15,000
$25,000
52% 55%
29%
21%
5%7%
6% 7%
0%
10%
20%
30%
40%
50%
60%
2004 2005 2006 2007 2008 2009 2010 2011 2012 2013
% O
F TO
TAL
GD
P
Percentage of Total GDP by Industry Saskatchewan 2004 - 2013
Service-producingindustries
Mining, quarrying,oil & gas
Construction
Agriculture, forestry,fishing, hunting
Manufacturing
Utilities
Source: Statistics Canada 379-0030 Gross domestic product (GDP) at basic prices, by North American Industry Classification System
KPMG CONFIDENTIAL
24
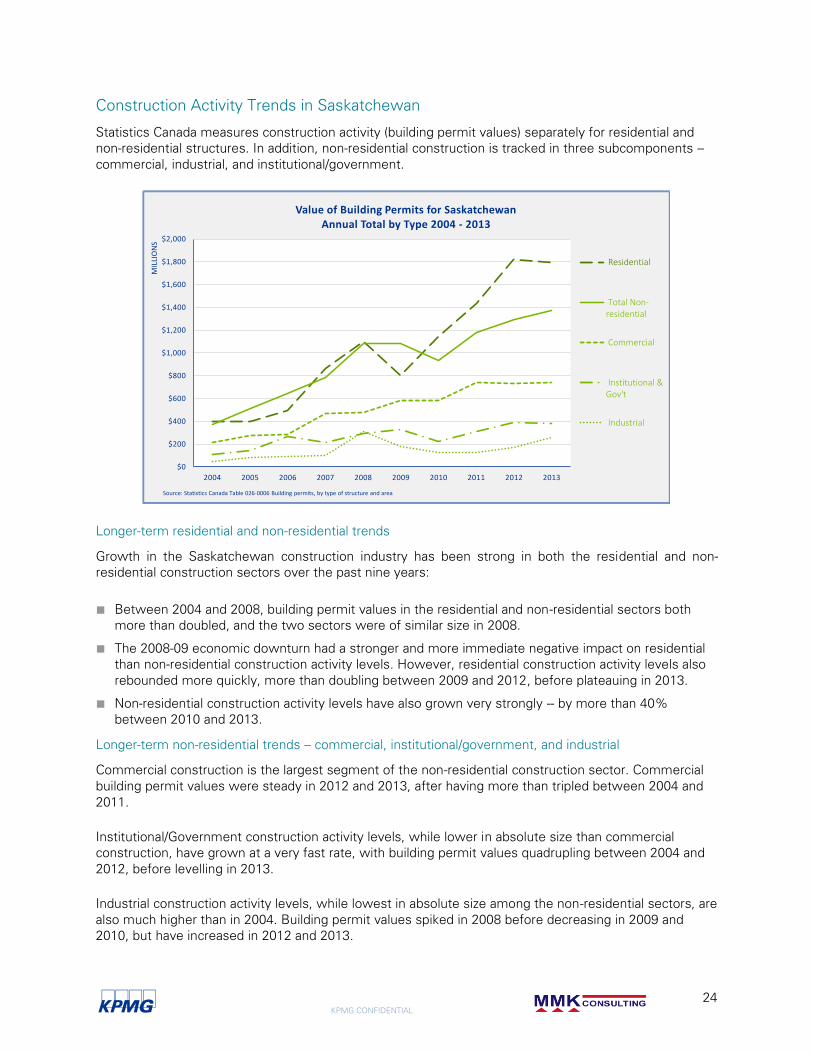
Construction Activity Trends in Saskatchewan
Statistics Canada measures construction activity (building permit values) separately for residential and
non-residential structures. In addition, non-residential construction is tracked in three subcomponents –
commercial, industrial, and institutional/government.
Longer-term residential and non-residential trends
Growth in the Saskatchewan construction industry has been strong in both the residential and non-
residential construction sectors over the past nine years:
■ Between 2004 and 2008, building permit values in the residential and non-residential sectors both
more than doubled, and the two sectors were of similar size in 2008.
■ The 2008-09 economic downturn had a stronger and more immediate negative impact on residential
than non-residential construction activity levels. However, residential construction activity levels also
rebounded more quickly, more than doubling between 2009 and 2012, before plateauing in 2013.
■ Non-residential construction activity levels have also grown very strongly -- by more than 40%
between 2010 and 2013.
Longer-term non-residential trends – commercial, institutional/government, and industrial
Commercial construction is the largest segment of the non-residential construction sector. Commercial
building permit values were steady in 2012 and 2013, after having more than tripled between 2004 and
2011.
Institutional/Government construction activity levels, while lower in absolute size than commercial
construction, have grown at a very fast rate, with building permit values quadrupling between 2004 and
2012, before levelling in 2013.
Industrial construction activity levels, while lowest in absolute size among the non-residential sectors, are
also much higher than in 2004. Building permit values spiked in 2008 before decreasing in 2009 and
2010, but have increased in 2012 and 2013.
$0
$200
$400
$600
$800
$1,000
$1,200
$1,400
$1,600
$1,800
$2,000
2004 2005 2006 2007 2008 2009 2010 2011 2012 2013
MIL
LIO
NS
Value of Building Permits for SaskatchewanAnnual Total by Type 2004 - 2013
Residential
Total Non-residential
Commercial
Institutional &Gov't
Industrial
Source: Statistics Canada Table 026-0006 Building permits, by type of structure and area
KPMG CONFIDENTIAL
25
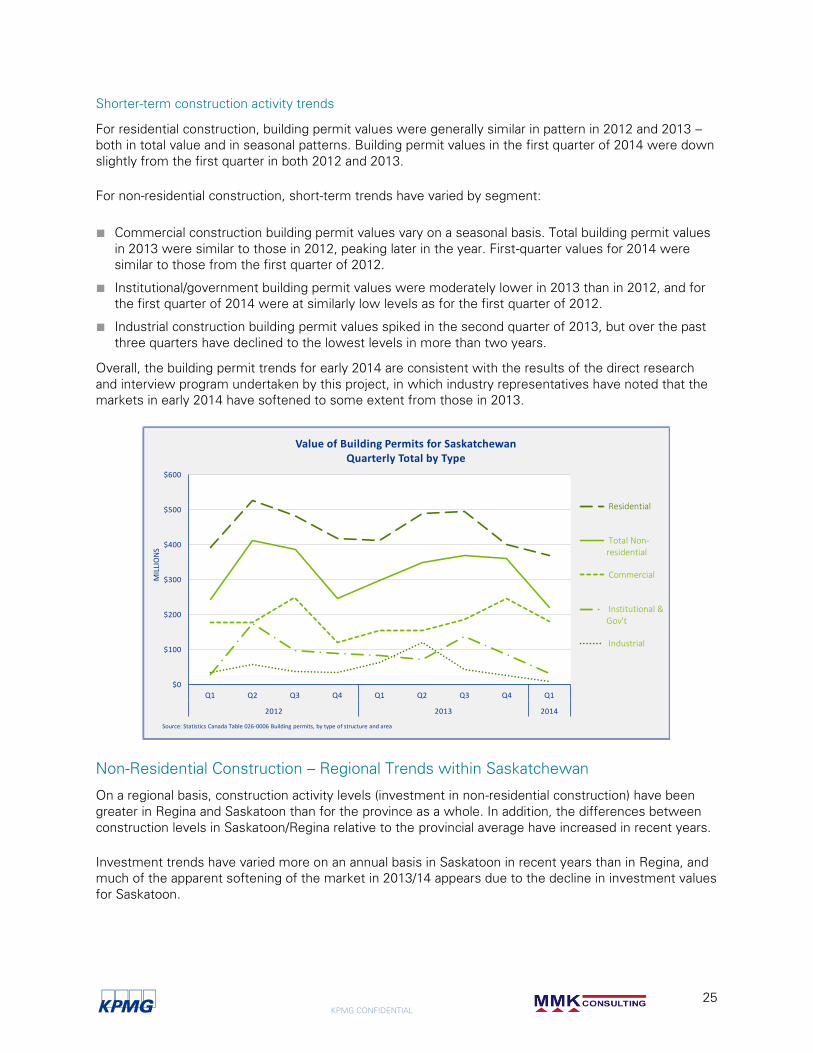
Shorter-term construction activity trends
For residential construction, building permit values were generally similar in pattern in 2012 and 2013 –
both in total value and in seasonal patterns. Building permit values in the first quarter of 2014 were down
slightly from the first quarter in both 2012 and 2013.
For non-residential construction, short-term trends have varied by segment:
■ Commercial construction building permit values vary on a seasonal basis. Total building permit values
in 2013 were similar to those in 2012, peaking later in the year. First-quarter values for 2014 were
similar to those from the first quarter of 2012.
■ Institutional/government building permit values were moderately lower in 2013 than in 2012, and for
the first quarter of 2014 were at similarly low levels as for the first quarter of 2012.
■ Industrial construction building permit values spiked in the second quarter of 2013, but over the past
three quarters have declined to the lowest levels in more than two years.
Overall, the building permit trends for early 2014 are consistent with the results of the direct research
and interview program undertaken by this project, in which industry representatives have noted that the
markets in early 2014 have softened to some extent from those in 2013.
Non-Residential Construction – Regional Trends within Saskatchewan
On a regional basis, construction activity levels (investment in non-residential construction) have been
greater in Regina and Saskatoon than for the province as a whole. In addition, the differences between
construction levels in Saskatoon/Regina relative to the provincial average have increased in recent years.
Investment trends have varied more on an annual basis in Saskatoon in recent years than in Regina, and
much of the apparent softening of the market in 2013/14 appears due to the decline in investment values
for Saskatoon.
$0
$100
$200
$300
$400
$500
$600
Q1 Q2 Q3 Q4 Q1 Q2 Q3 Q4 Q1
2012 2013 2014
MIL
LIO
NS
Value of Building Permits for SaskatchewanQuarterly Total by Type
Residential
Total Non-residential
Commercial
Institutional &Gov't
Industrial
Source: Statistics Canada Table 026-0006 Building permits, by type of structure and area
KPMG CONFIDENTIAL
26
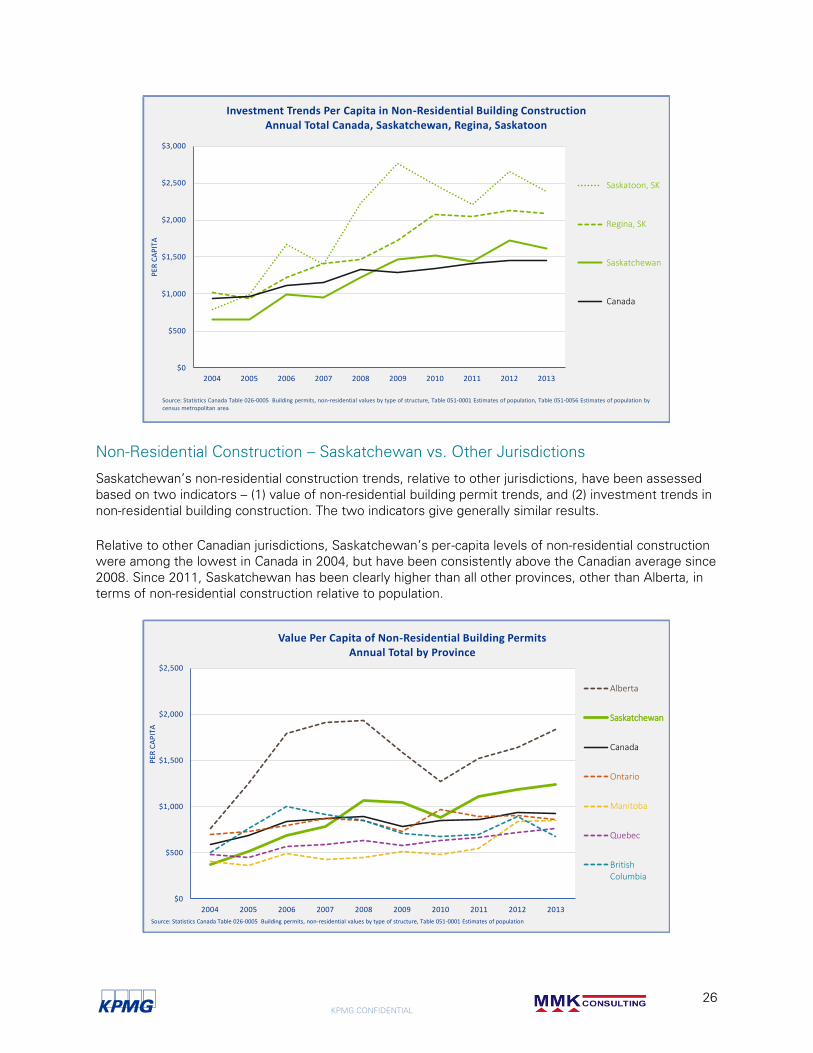
Non-Residential Construction – Saskatchewan vs. Other Jurisdictions
Saskatchewan’s non-residential construction trends, relative to other jurisdictions, have been assessed
based on two indicators – (1) value of non-residential building permit trends, and (2) investment trends in
non-residential building construction. The two indicators give generally similar results.
Relative to other Canadian jurisdictions, Saskatchewan’s per-capita levels of non-residential construction
were among the lowest in Canada in 2004, but have been consistently above the Canadian average since
2008. Since 2011, Saskatchewan has been clearly higher than all other provinces, other than Alberta, in
terms of non-residential construction relative to population.
$0
$500
$1,000
$1,500
$2,000
$2,500
$3,000
2004 2005 2006 2007 2008 2009 2010 2011 2012 2013
PER
CA
PIT
A
Investment Trends Per Capita in Non-Residential Building Construction Annual Total Canada, Saskatchewan, Regina, Saskatoon
Saskatoon, SK
Regina, SK
Saskatchewan
Canada
Source: Statistics Canada Table 026-0005 Building permits, non-residential values by type of structure, Table 051-0001 Estimates of population, Table 051-0056 Estimates of population by census metropolitan area
$0
$500
$1,000
$1,500
$2,000
$2,500
2004 2005 2006 2007 2008 2009 2010 2011 2012 2013
PER
CA
PIT
A
Value Per Capita of Non-Residential Building PermitsAnnual Total by Province
Alberta
Saskatchewan
Canada
Ontario
Manitoba
Quebec
BritishColumbia
Source: Statistics Canada Table 026-0005 Building permits, non-residential values by type of structure, Table 051-0001 Estimates of population
KPMG CONFIDENTIAL
27
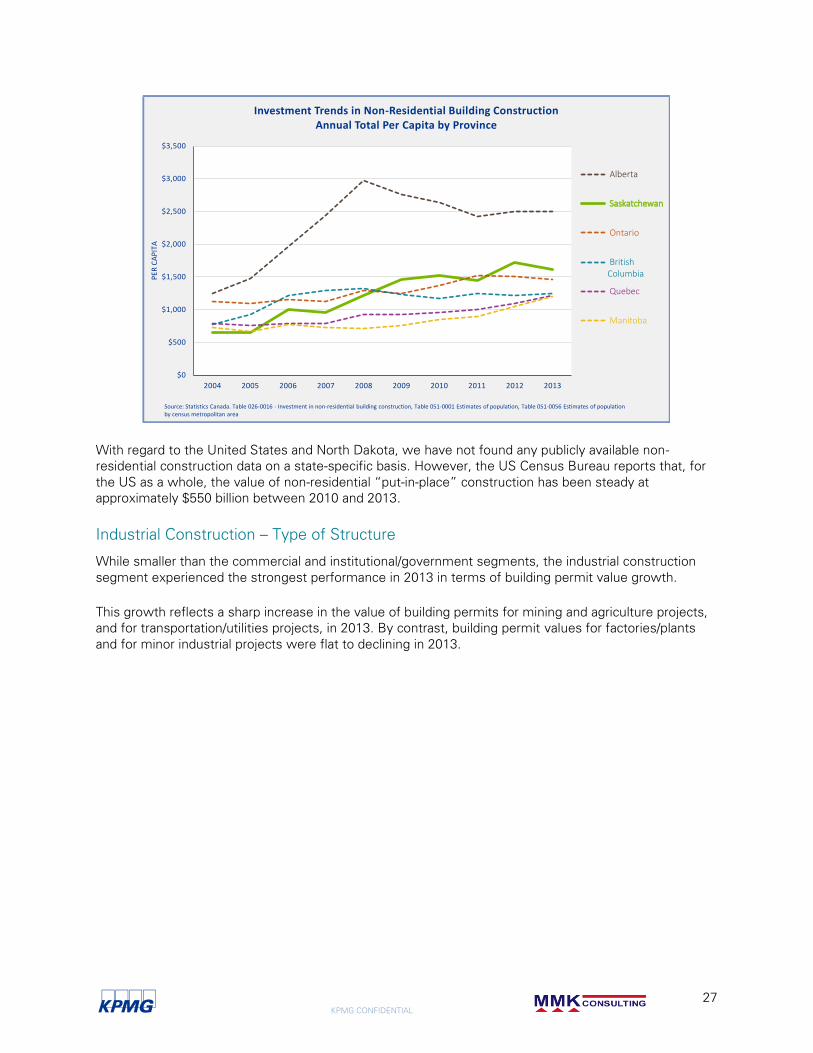
With regard to the United States and North Dakota, we have not found any publicly available non-
residential construction data on a state-specific basis. However, the US Census Bureau reports that, for
the US as a whole, the value of non-residential “put-in-place” construction has been steady at
approximately $550 billion between 2010 and 2013.
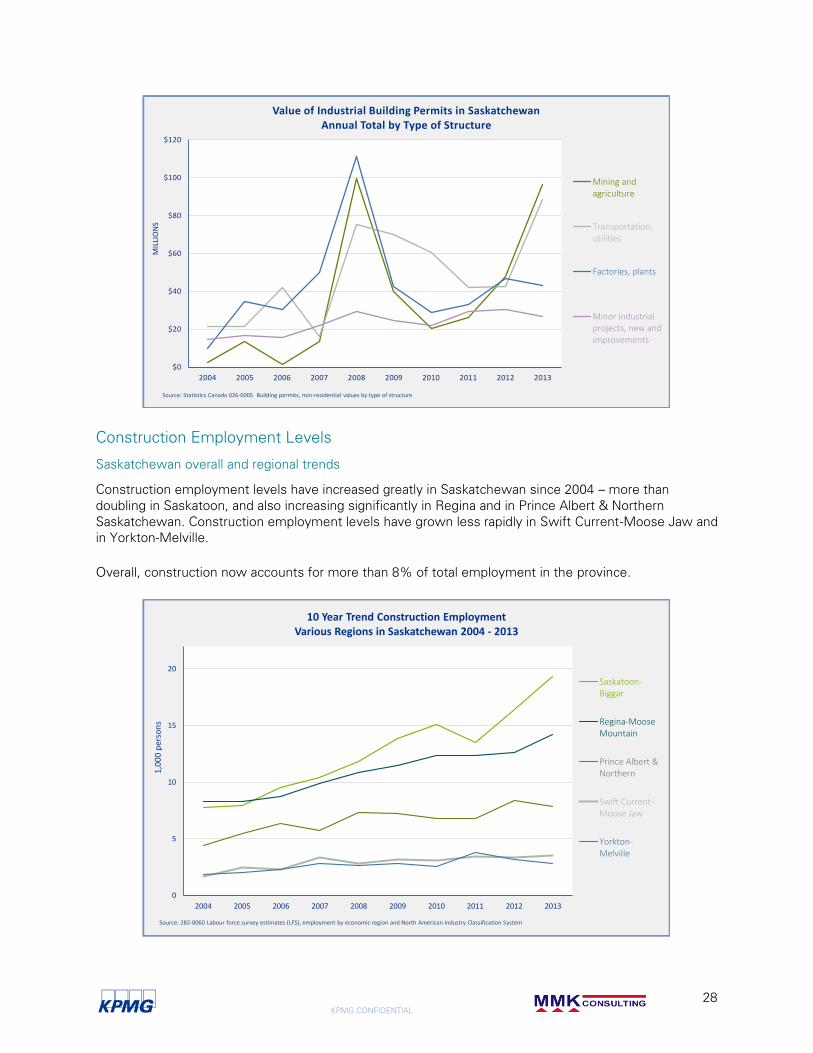
Industrial Construction – Type of Structure
While smaller than the commercial and institutional/government segments, the industrial construction
segment experienced the strongest performance in 2013 in terms of building permit value growth.
This growth reflects a sharp increase in the value of building permits for mining and agriculture projects,
and for transportation/utilities projects, in 2013. By contrast, building permit values for factories/plants
and for minor industrial projects were flat to declining in 2013.
$0
$500
$1,000
$1,500
$2,000
$2,500
$3,000
$3,500
2004 2005 2006 2007 2008 2009 2010 2011 2012 2013
PER
CA
PIT
A
Investment Trends in Non-Residential Building Construction Annual Total Per Capita by Province
Alberta
Saskatchewan
Ontario
BritishColumbia
Quebec
Manitoba
Source: Statistics Canada. Table 026-0016 - Investment in non-residential building construction, Table 051-0001 Estimates of population, Table 051-0056 Estimates of population by census metropolitan area
KPMG CONFIDENTIAL
28
Construction Employment Levels
Saskatchewan overall and regional trends
Construction employment levels have increased greatly in Saskatchewan since 2004 – more than
doubling in Saskatoon, and also increasing significantly in Regina and in Prince Albert & Northern
Saskatchewan. Construction employment levels have grown less rapidly in Swift Current-Moose Jaw and
in Yorkton-Melville.
Overall, construction now accounts for more than 8% of total employment in the province.
$0
$20
$40
$60
$80
$100
$120
2004 2005 2006 2007 2008 2009 2010 2011 2012 2013
MIL
LIO
NS
Value of Industrial Building Permits in SaskatchewanAnnual Total by Type of Structure
Mining andagriculture
Transportation,utilities
Factories, plants
Minor industrialprojects, new andimprovements
Source: Statistics Canada 026-0005 Building permits, non-residential values by type of structure
0
5
10
15
20
2004 2005 2006 2007 2008 2009 2010 2011 2012 2013
1,0
00
per
son
s
10 Year Trend Construction EmploymentVarious Regions in Saskatchewan 2004 - 2013
Saskatoon-Biggar
Regina-MooseMountain
Prince Albert &Northern
Swift Current-Moose Jaw
Yorkton-Melville
Source: 282-0060 Labour force survey estimates (LFS), employment by economic region and North American Industry Classification System
KPMG CONFIDENTIAL
29
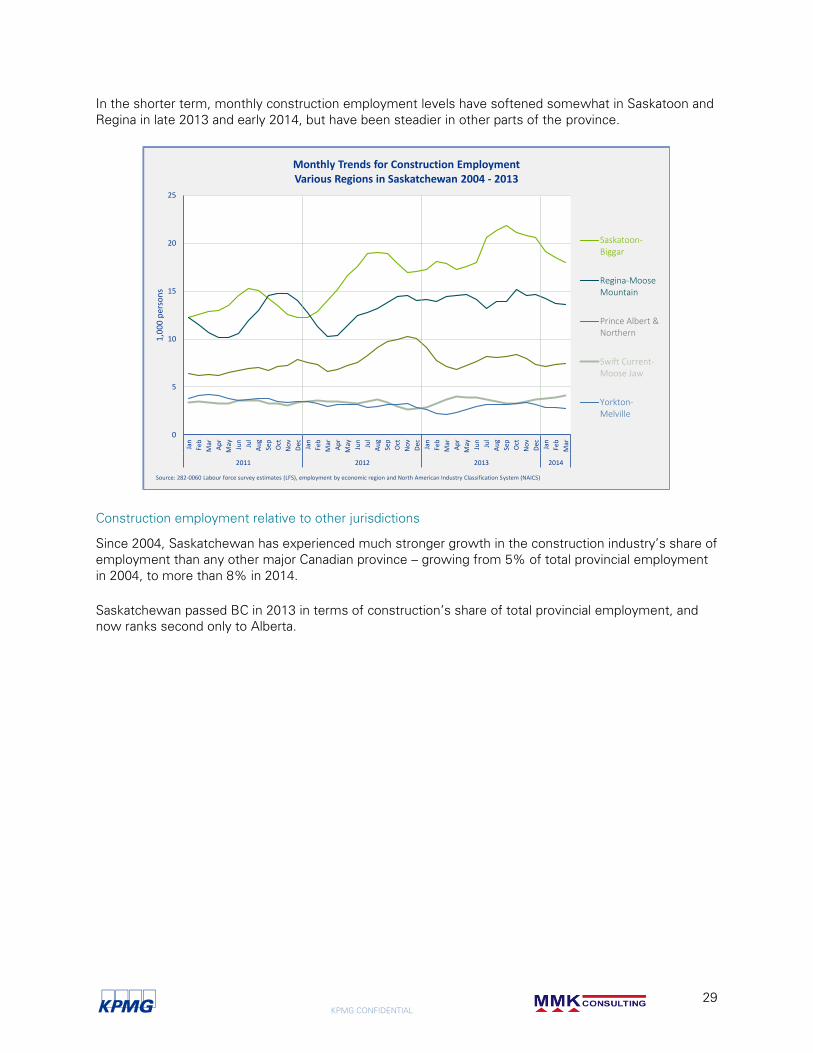
In the shorter term, monthly construction employment levels have softened somewhat in Saskatoon and
Regina in late 2013 and early 2014, but have been steadier in other parts of the province.
Construction employment relative to other jurisdictions
Since 2004, Saskatchewan has experienced much stronger growth in the construction industry’s share of
employment than any other major Canadian province – growing from 5% of total provincial employment
in 2004, to more than 8% in 2014.
Saskatchewan passed BC in 2013 in terms of construction’s share of total provincial employment, and
now ranks second only to Alberta.
0
5
10
15
20
25Ja
n
Feb
Mar
Ap
r
May Jun
Jul
Au
g
Sep
Oct
No
v
Dec Jan
Feb
Mar
Ap
r
May Jun
Jul
Au
g
Sep
Oct
No
v
Dec Jan
Feb
Mar
Ap
r
May Jun
Jul
Au
g
Sep
Oct
No
v
Dec Jan
Feb
Mar
2011 2012 2013 2014
1,0
00
per
son
sMonthly Trends for Construction EmploymentVarious Regions in Saskatchewan 2004 - 2013
Saskatoon-Biggar
Regina-MooseMountain
Prince Albert &Northern
Swift Current-Moose Jaw
Yorkton-Melville
Source: 282-0060 Labour force survey estimates (LFS), employment by economic region and North American Industry Classification System (NAICS)
KPMG CONFIDENTIAL
30
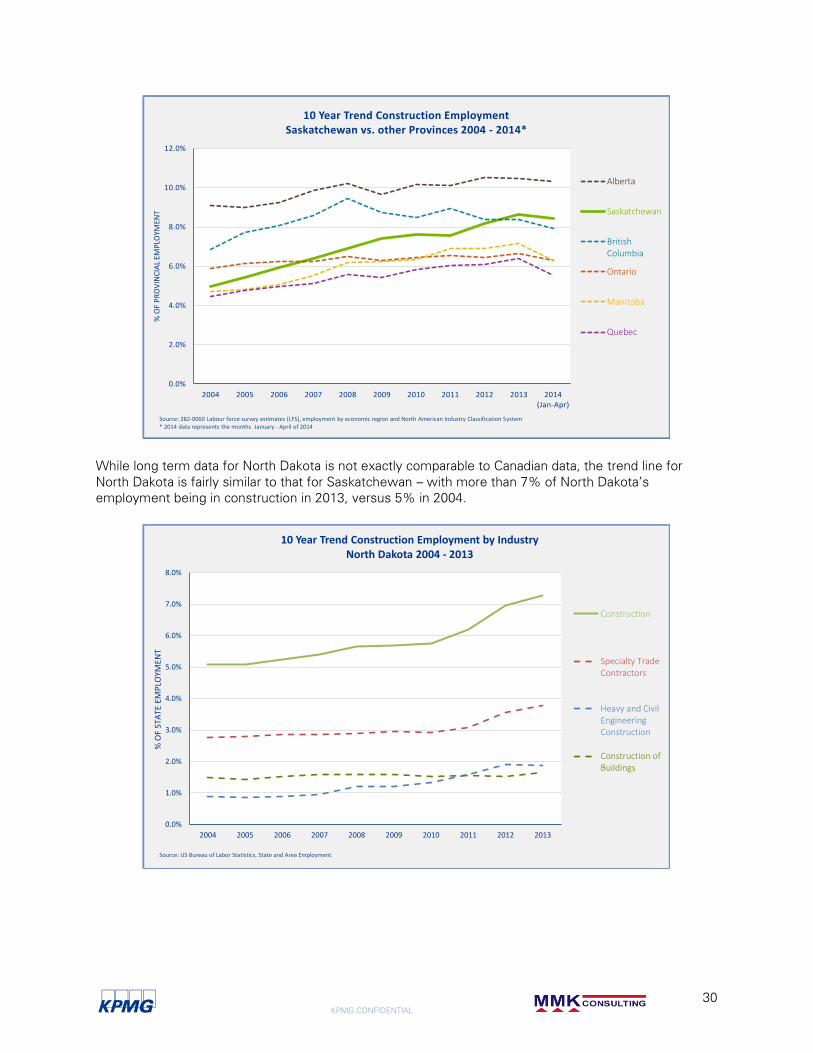
While long term data for North Dakota is not exactly comparable to Canadian data, the trend line for
North Dakota is fairly similar to that for Saskatchewan – with more than 7% of North Dakota’s
employment being in construction in 2013, versus 5% in 2004.
0.0%
2.0%
4.0%
6.0%
8.0%
10.0%
12.0%
2004 2005 2006 2007 2008 2009 2010 2011 2012 2013 2014(Jan-Apr)
% O
F P
RO
VIN
CIA
L EM
PLO
YMEN
T
10 Year Trend Construction EmploymentSaskatchewan vs. other Provinces 2004 - 2014*
Alberta
Saskatchewan
BritishColumbia
Ontario
Manitoba
Quebec
Source: 282-0060 Labour force survey estimates (LFS), employment by economic region and North American Industry Classification System* 2014 data represents the months January - April of 2014
0.0%
1.0%
2.0%
3.0%
4.0%
5.0%
6.0%
7.0%
8.0%
2004 2005 2006 2007 2008 2009 2010 2011 2012 2013
% O
F ST
ATE
EM
PLO
YMEN
T
10 Year Trend Construction Employment by IndustryNorth Dakota 2004 - 2013
Construction
Specialty TradeContractors
Heavy and CivilEngineeringConstruction
Construction ofBuildings
Source: US Bureau of Labor Statistics, State and Area Employment
KPMG CONFIDENTIAL
31
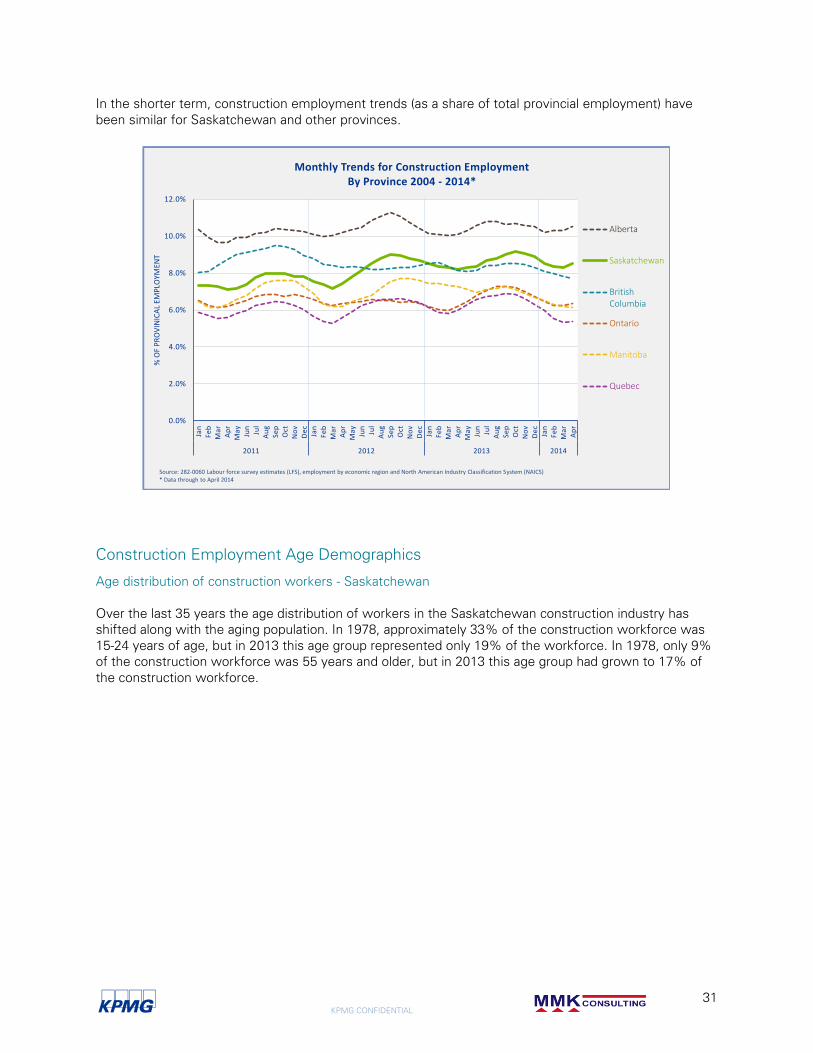
In the shorter term, construction employment trends (as a share of total provincial employment) have
been similar for Saskatchewan and other provinces.
Construction Employment Age Demographics
Age distribution of construction workers - Saskatchewan
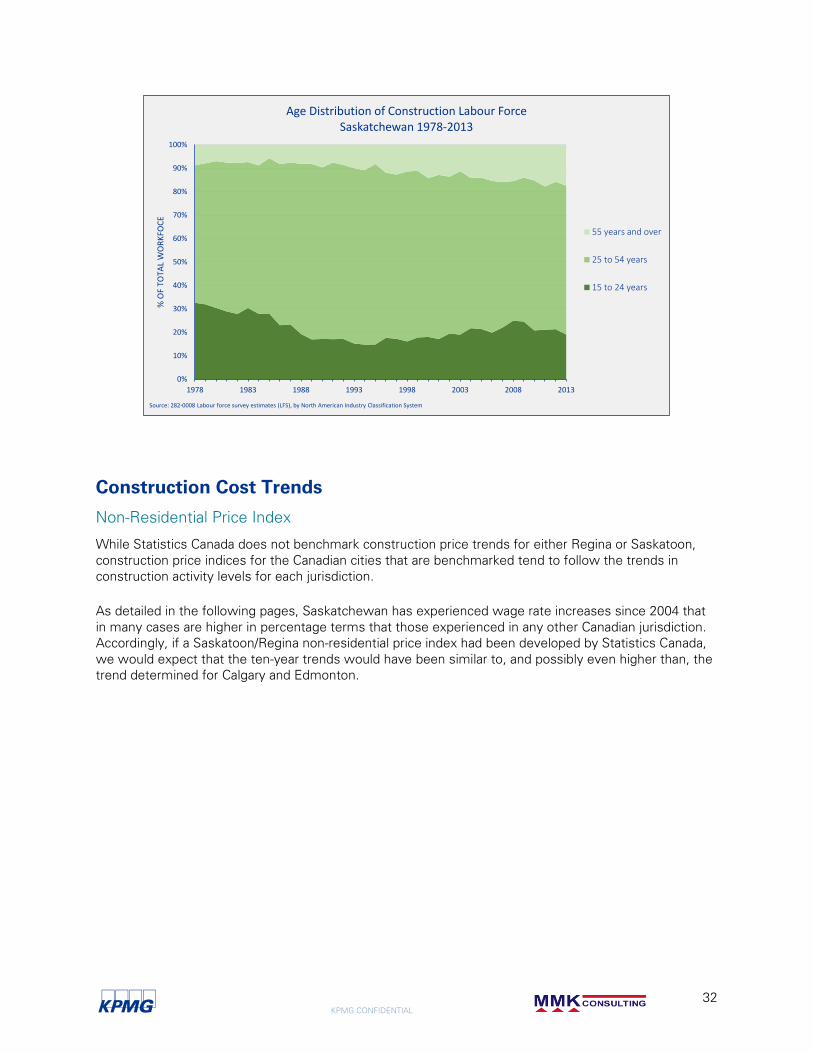
Over the last 35 years the age distribution of workers in the Saskatchewan construction industry has
shifted along with the aging population. In 1978, approximately 33% of the construction workforce was
15-24 years of age, but in 2013 this age group represented only 19% of the workforce. In 1978, only 9%
of the construction workforce was 55 years and older, but in 2013 this age group had grown to 17% of
the construction workforce.
0.0%
2.0%
4.0%
6.0%
8.0%
10.0%
12.0%Ja
nFe
bM
ar
Ap
rM
ay
Jun
Jul
Au
gSe
pO
ctN
ov
De
cJa
nFe
bM
ar
Ap
rM
ay
Jun
Jul
Au
gSe
pO
ctN
ov
De
cJa
nFe
bM
ar
Ap
rM
ay
Jun
Jul
Au
gSe
pO
ctN
ov
De
cJa
nFe
bM
ar
Ap
r
2011 2012 2013 2014
% O
F P
RO
VIN
ICA
L EM
PLO
YMEN
T
Monthly Trends for Construction EmploymentBy Province 2004 - 2014*
Alberta
Saskatchewan
BritishColumbia
Ontario
Manitoba
Quebec
Source: 282-0060 Labour force survey estimates (LFS), employment by economic region and North American Industry Classification System (NAICS)* Data through to April 2014
KPMG CONFIDENTIAL
32
Construction Cost Trends
Non-Residential Price Index
While Statistics Canada does not benchmark construction price trends for either Regina or Saskatoon,
construction price indices for the Canadian cities that are benchmarked tend to follow the trends in
construction activity levels for each jurisdiction.
As detailed in the following pages, Saskatchewan has experienced wage rate increases since 2004 that
in many cases are higher in percentage terms that those experienced in any other Canadian jurisdiction.
Accordingly, if a Saskatoon/Regina non-residential price index had been developed by Statistics Canada,
we would expect that the ten-year trends would have been similar to, and possibly even higher than, the
trend determined for Calgary and Edmonton.
0%
10%
20%
30%
40%
50%
60%
70%
80%
90%
100%
1978 1983 1988 1993 1998 2003 2008 2013
% O
F TO
TAL
WO
RK
FOC
E
Age Distribution of Construction Labour ForceSaskatchewan 1978-2013
55 years and over
25 to 54 years
15 to 24 years
Source: 282-0008 Labour force survey estimates (LFS), by North American Industry Classification System
KPMG CONFIDENTIAL
33
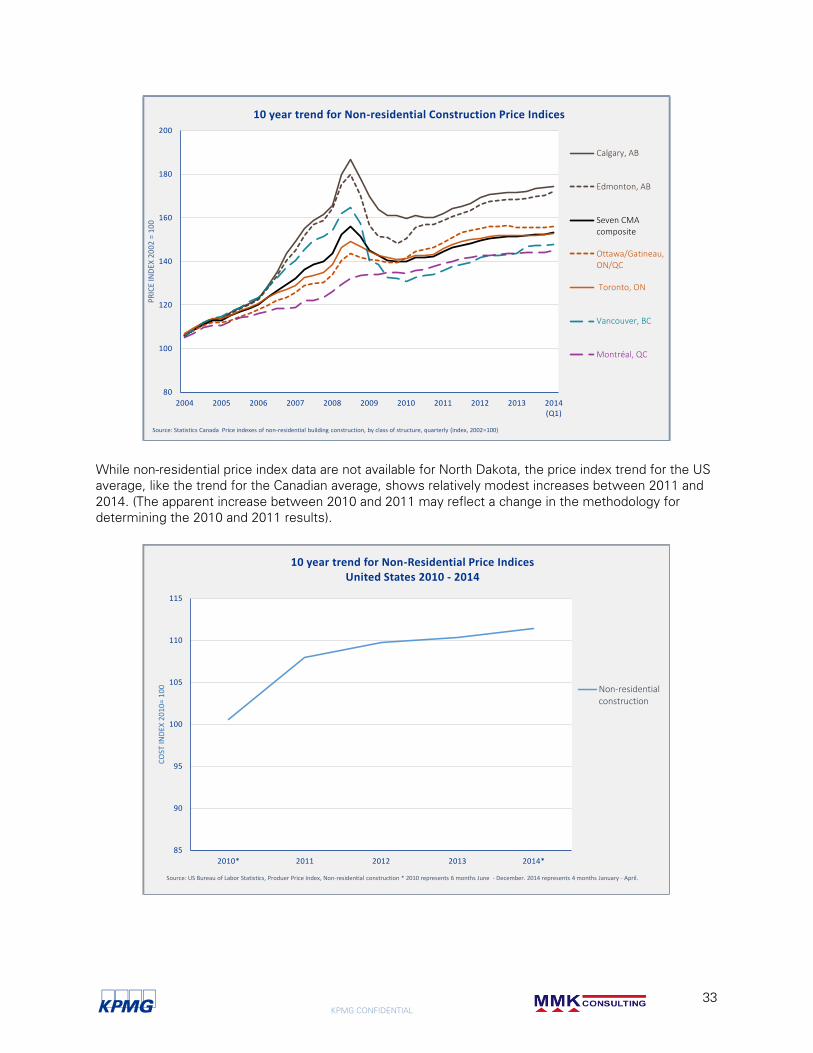
While non-residential price index data are not available for North Dakota, the price index trend for the US
average, like the trend for the Canadian average, shows relatively modest increases between 2011 and
2014. (The apparent increase between 2010 and 2011 may reflect a change in the methodology for
determining the 2010 and 2011 results).
80
100
120
140
160
180
200
2004 2005 2006 2007 2008 2009 2010 2011 2012 2013 2014(Q1)
PR
ICE
IND
EX 2
00
2 =
10
0
10 year trend for Non-residential Construction Price Indices
Calgary, AB
Edmonton, AB
Seven CMAcomposite
Ottawa/Gatineau,ON/QC
Toronto, ON
Vancouver, BC
Montréal, QC
Source: Statistics Canada Price indexes of non-residential building construction, by class of structure, quarterly (index, 2002=100)
85
90
95
100
105
110
115
2010* 2011 2012 2013 2014*
CO
ST IN
DEX
20
10
= 1
00
10 year trend for Non-Residential Price IndicesUnited States 2010 - 2014
Non-residentialconstruction
Source: US Bureau of Labor Statistics, Produer Price Index, Non-residential construction * 2010 represents 6 months June - December. 2014 represents 4 months January - April.
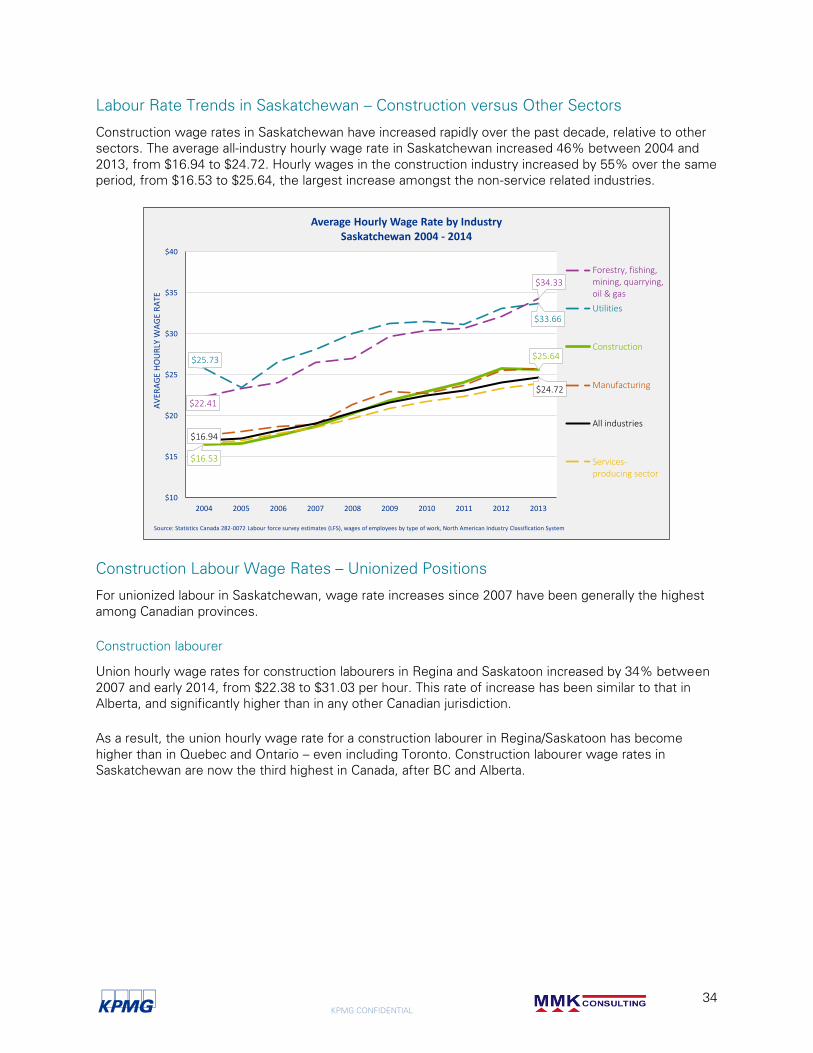
KPMG CONFIDENTIAL
34
Labour Rate Trends in Saskatchewan – Construction versus Other Sectors
Construction wage rates in Saskatchewan have increased rapidly over the past decade, relative to other
sectors. The average all-industry hourly wage rate in Saskatchewan increased 46% between 2004 and
2013, from $16.94 to $24.72. Hourly wages in the construction industry increased by 55% over the same
period, from $16.53 to $25.64, the largest increase amongst the non-service related industries.
Construction Labour Wage Rates – Unionized Positions
For unionized labour in Saskatchewan, wage rate increases since 2007 have been generally the highest
among Canadian provinces.
Construction labourer
Union hourly wage rates for construction labourers in Regina and Saskatoon increased by 34% between
2007 and early 2014, from $22.38 to $31.03 per hour. This rate of increase has been similar to that in
Alberta, and significantly higher than in any other Canadian jurisdiction.
As a result, the union hourly wage rate for a construction labourer in Regina/Saskatoon has become
higher than in Quebec and Ontario – even including Toronto. Construction labourer wage rates in
Saskatchewan are now the third highest in Canada, after BC and Alberta.
$22.41
$34.33
$25.73
$33.66
$16.53
$25.64
$16.94
$24.72
$10
$15
$20
$25
$30
$35
$40
2004 2005 2006 2007 2008 2009 2010 2011 2012 2013
AV
ERA
GE
HO
UR
LY W
AG
E R
ATE
Average Hourly Wage Rate by IndustrySaskatchewan 2004 - 2014
Forestry, fishing,mining, quarrying,oil & gas
Utilities
Construction
Manufacturing
All industries
Services-producing sector
Source: Statistics Canada 282-0072 Labour force survey estimates (LFS), wages of employees by type of work, North American Industry Classification System
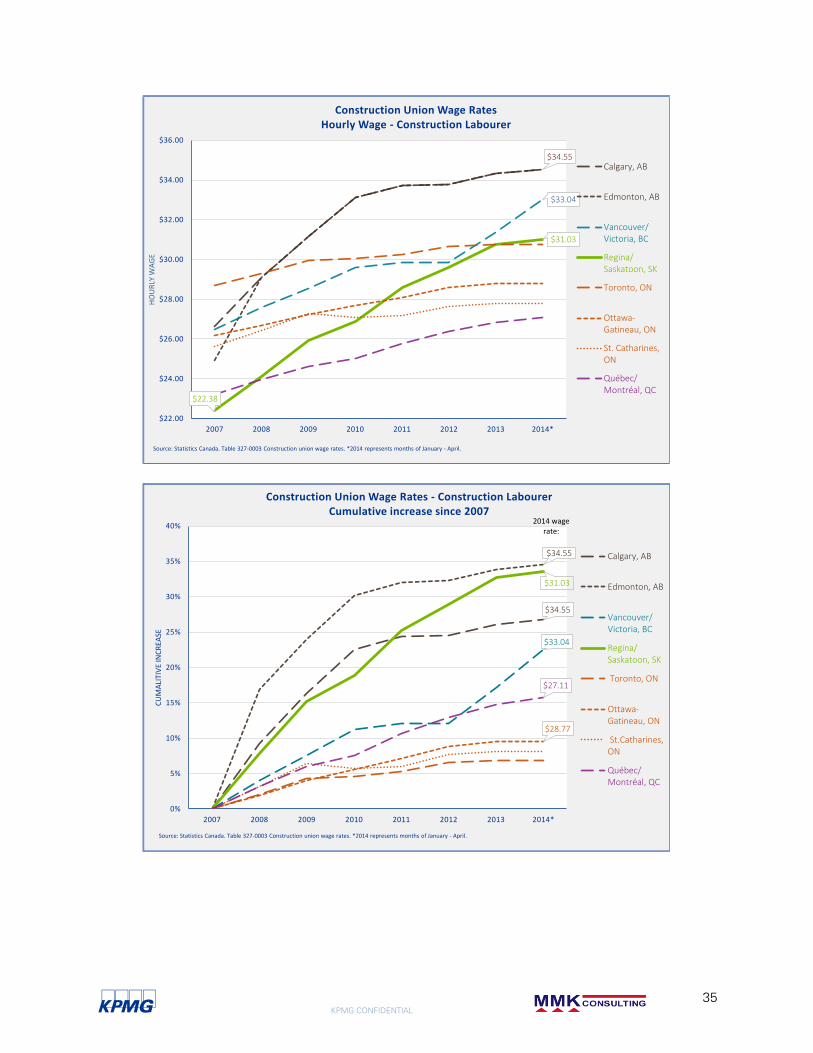
KPMG CONFIDENTIAL
35
$34.55
$33.04
$22.38
$31.03
$22.00
$24.00
$26.00
$28.00
$30.00
$32.00
$34.00
$36.00
2007 2008 2009 2010 2011 2012 2013 2014*
HO
UR
LY W
AG
E
Construction Union Wage RatesHourly Wage - Construction Labourer
Calgary, AB
Edmonton, AB
Vancouver/Victoria, BC
Regina/Saskatoon, SK
Toronto, ON
Ottawa-Gatineau, ON
St. Catharines,ON
Québec/Montréal, QC
Source: Statistics Canada. Table 327-0003 Construction union wage rates. *2014 represents months of January - April.
$34.55
$34.55
$33.04
$31.03
$28.77
$27.11
0%
5%
10%
15%
20%
25%
30%
35%
40%
2007 2008 2009 2010 2011 2012 2013 2014*
CU
MA
LITI
VE
INC
REA
SE
Construction Union Wage Rates - Construction LabourerCumulative increase since 2007
Calgary, AB
Edmonton, AB
Vancouver/Victoria, BC
Regina/Saskatoon, SK
Toronto, ON
Ottawa-Gatineau, ON
St.Catharines,ON
Québec/Montréal, QC
Source: Statistics Canada. Table 327-0003 Construction union wage rates. *2014 represents months of January - April.
2014 wage rate:
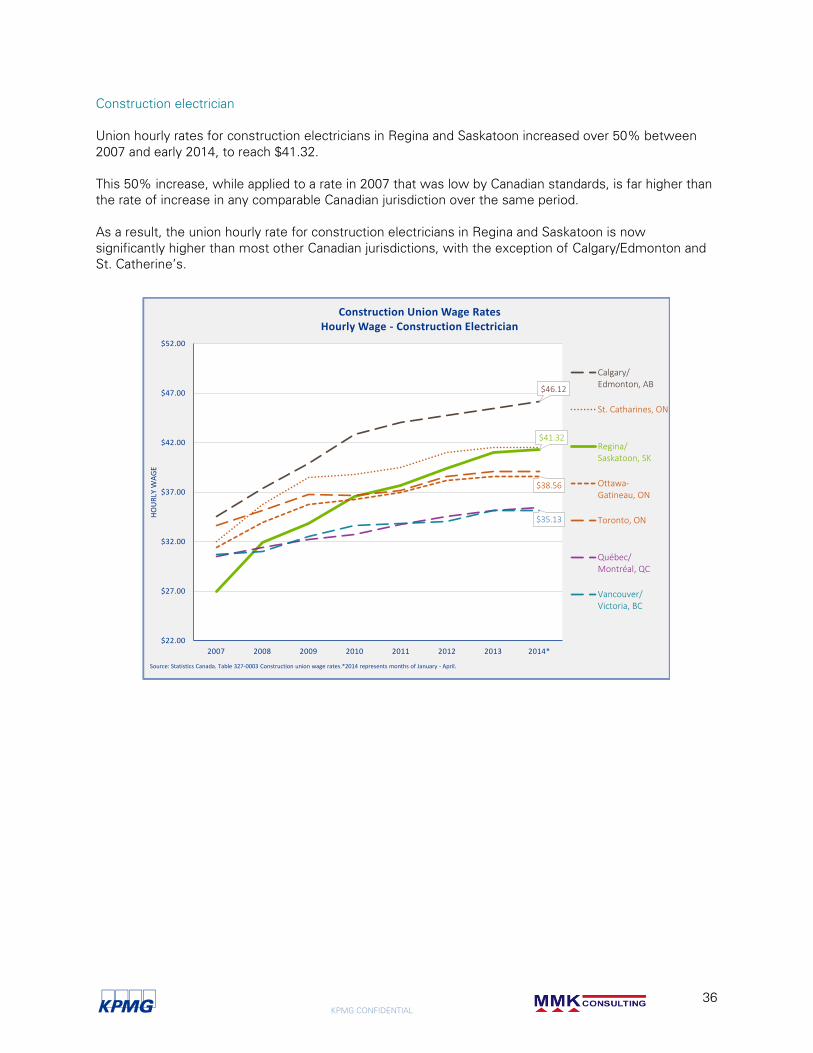
KPMG CONFIDENTIAL
36
Construction electrician
Union hourly rates for construction electricians in Regina and Saskatoon increased over 50% between
2007 and early 2014, to reach $41.32.
This 50% increase, while applied to a rate in 2007 that was low by Canadian standards, is far higher than
the rate of increase in any comparable Canadian jurisdiction over the same period.
As a result, the union hourly rate for construction electricians in Regina and Saskatoon is now
significantly higher than most other Canadian jurisdictions, with the exception of Calgary/Edmonton and
St. Catherine’s.
$46.12
$41.32
$38.56
$35.13
$22.00
$27.00
$32.00
$37.00
$42.00
$47.00
$52.00
2007 2008 2009 2010 2011 2012 2013 2014*
HO
UR
LY W
AG
E
Construction Union Wage RatesHourly Wage - Construction Electrician
Calgary/Edmonton, AB
St. Catharines, ON
Regina/Saskatoon, SK
Ottawa-Gatineau, ON
Toronto, ON
Québec/Montréal, QC
Vancouver/Victoria, BC
Source: Statistics Canada. Table 327-0003 Construction union wage rates.*2014 represents months of January - April.
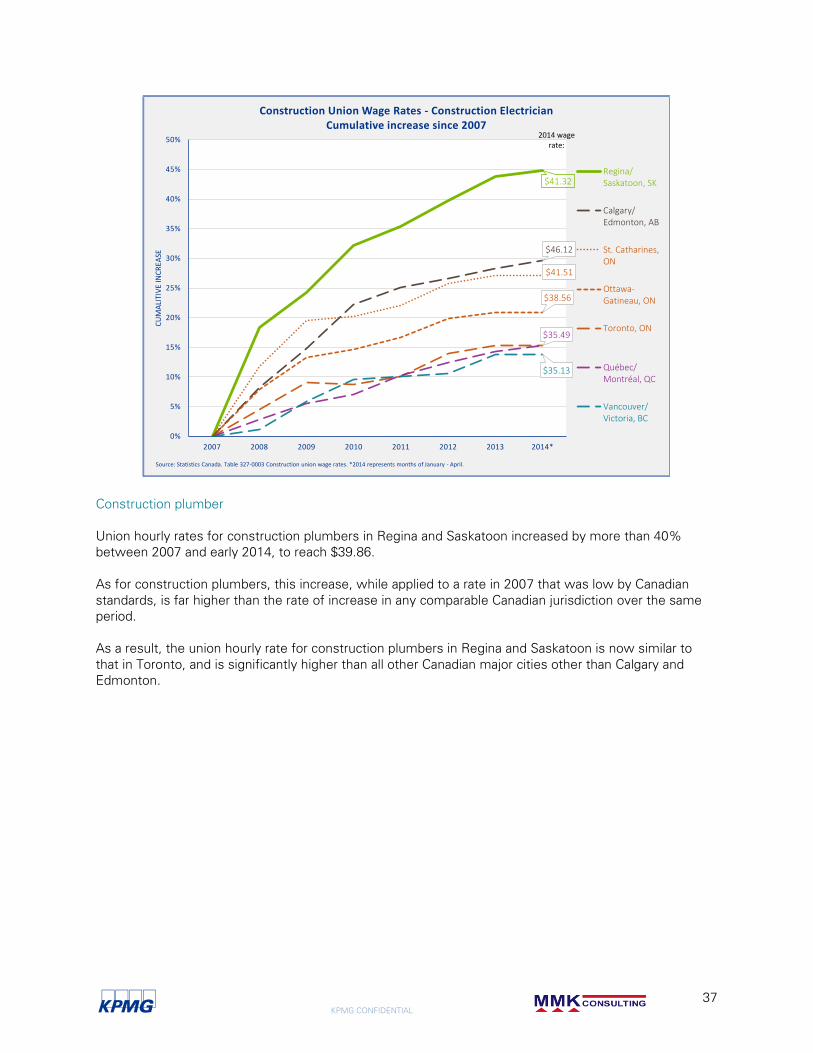
KPMG CONFIDENTIAL
37
Construction plumber
Union hourly rates for construction plumbers in Regina and Saskatoon increased by more than 40%
between 2007 and early 2014, to reach $39.86.
As for construction plumbers, this increase, while applied to a rate in 2007 that was low by Canadian
standards, is far higher than the rate of increase in any comparable Canadian jurisdiction over the same
period.
As a result, the union hourly rate for construction plumbers in Regina and Saskatoon is now similar to
that in Toronto, and is significantly higher than all other Canadian major cities other than Calgary and
Edmonton.
$41.32
$46.12
$41.51
$38.56
$35.49
$35.13
0%
5%
10%
15%
20%
25%
30%
35%
40%
45%
50%
2007 2008 2009 2010 2011 2012 2013 2014*
CU
MA
LITI
VE
INC
REA
SE
Construction Union Wage Rates - Construction ElectricianCumulative increase since 2007
Regina/Saskatoon, SK
Calgary/Edmonton, AB
St. Catharines,ON
Ottawa-Gatineau, ON
Toronto, ON
Québec/Montréal, QC
Vancouver/Victoria, BC
Source: Statistics Canada. Table 327-0003 Construction union wage rates. *2014 represents months of January - April.
2014 wage rate:
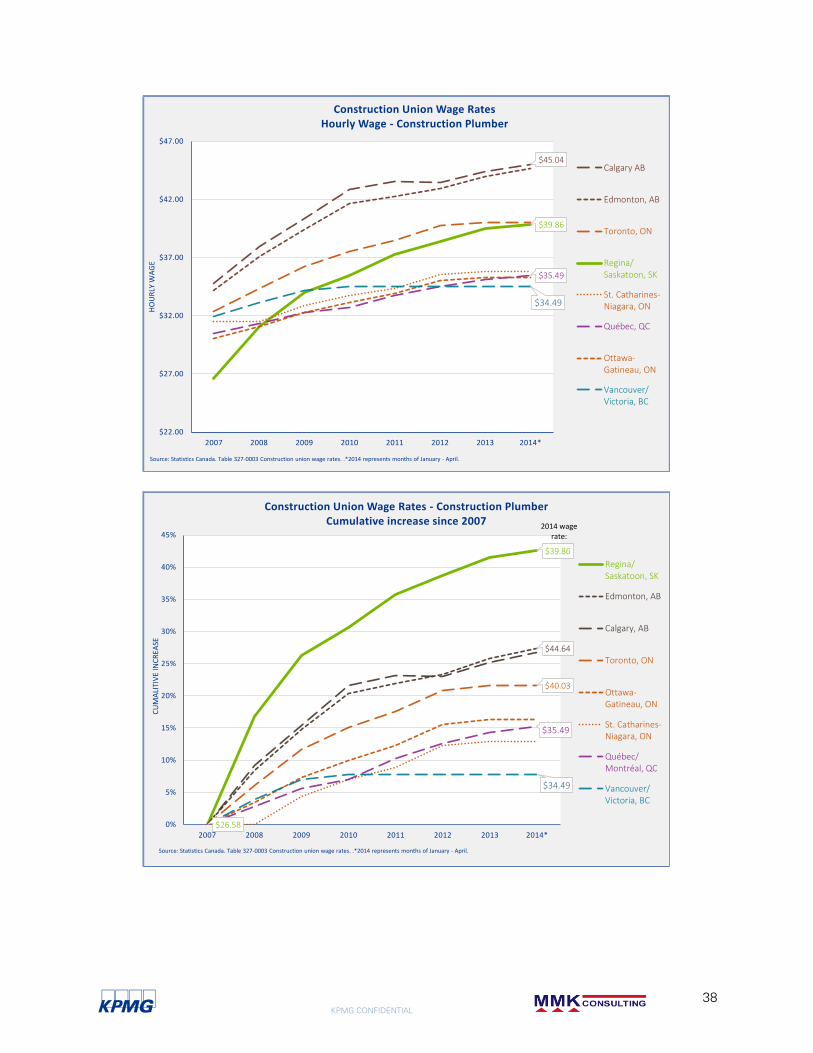
KPMG CONFIDENTIAL
38
$45.04
$39.86
$35.49
$34.49
$22.00
$27.00
$32.00
$37.00
$42.00
$47.00
2007 2008 2009 2010 2011 2012 2013 2014*
HO
UR
LY W
AG
E
Construction Union Wage RatesHourly Wage - Construction Plumber
Calgary AB
Edmonton, AB
Toronto, ON
Regina/Saskatoon, SK
St. Catharines-Niagara, ON
Québec, QC
Ottawa-Gatineau, ON
Vancouver/Victoria, BC
Source: Statistics Canada. Table 327-0003 Construction union wage rates. .*2014 represents months of January - April.
$26.58
$39.86
$44.64
$40.03
$35.49
$34.49
0%
5%
10%
15%
20%
25%
30%
35%
40%
45%
2007 2008 2009 2010 2011 2012 2013 2014*
CU
MA
LITI
VE
INC
REA
SE
Construction Union Wage Rates - Construction PlumberCumulative increase since 2007
Regina/Saskatoon, SK
Edmonton, AB
Calgary, AB
Toronto, ON
Ottawa-Gatineau, ON
St. Catharines-Niagara, ON
Québec/Montréal, QC
Vancouver/Victoria, BC
Source: Statistics Canada. Table 327-0003 Construction union wage rates. .*2014 represents months of January - April.
2014 wage rate:
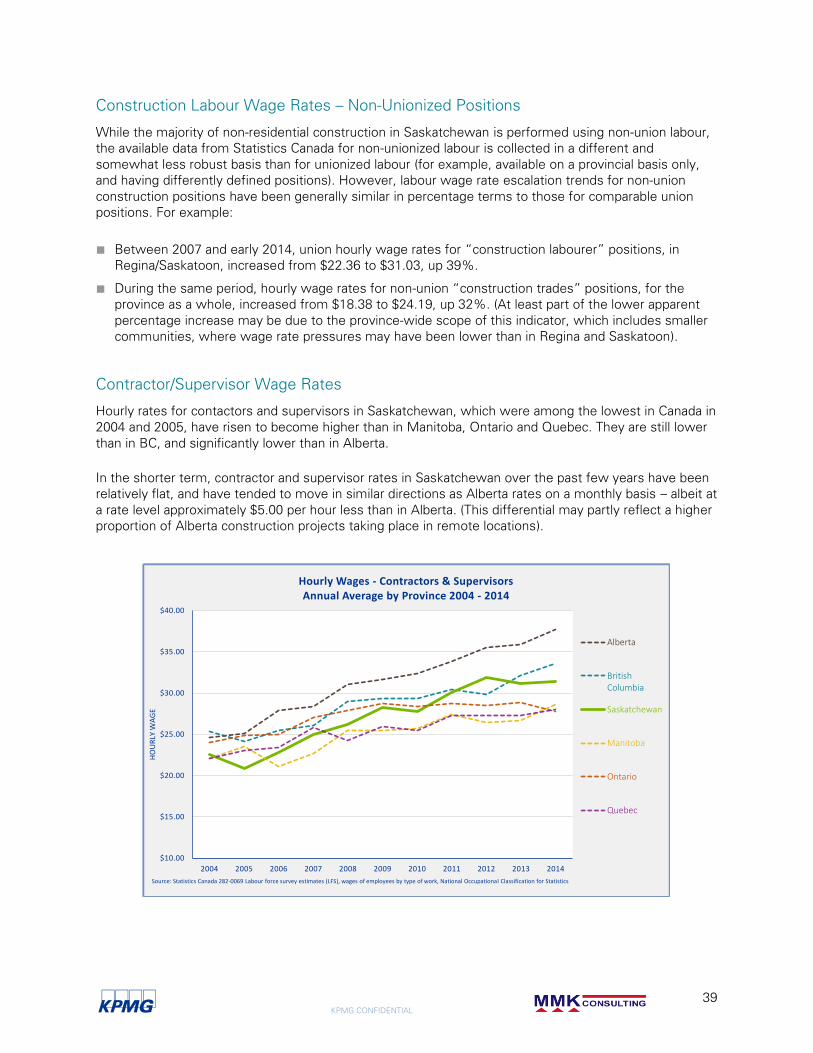
KPMG CONFIDENTIAL
39
Construction Labour Wage Rates – Non-Unionized Positions
While the majority of non-residential construction in Saskatchewan is performed using non-union labour,
the available data from Statistics Canada for non-unionized labour is collected in a different and
somewhat less robust basis than for unionized labour (for example, available on a provincial basis only,
and having differently defined positions). However, labour wage rate escalation trends for non-union
construction positions have been generally similar in percentage terms to those for comparable union
positions. For example:
■ Between 2007 and early 2014, union hourly wage rates for “construction labourer” positions, in
Regina/Saskatoon, increased from $22.36 to $31.03, up 39%.
■ During the same period, hourly wage rates for non-union “construction trades” positions, for the
province as a whole, increased from $18.38 to $24.19, up 32%. (At least part of the lower apparent
percentage increase may be due to the province-wide scope of this indicator, which includes smaller
communities, where wage rate pressures may have been lower than in Regina and Saskatoon).
Contractor/Supervisor Wage Rates
Hourly rates for contactors and supervisors in Saskatchewan, which were among the lowest in Canada in
2004 and 2005, have risen to become higher than in Manitoba, Ontario and Quebec. They are still lower
than in BC, and significantly lower than in Alberta.
In the shorter term, contractor and supervisor rates in Saskatchewan over the past few years have been
relatively flat, and have tended to move in similar directions as Alberta rates on a monthly basis – albeit at
a rate level approximately $5.00 per hour less than in Alberta. (This differential may partly reflect a higher
proportion of Alberta construction projects taking place in remote locations).
$10.00
$15.00
$20.00
$25.00
$30.00
$35.00
$40.00
2004 2005 2006 2007 2008 2009 2010 2011 2012 2013 2014
HO
UR
LY W
AG
E
Hourly Wages - Contractors & SupervisorsAnnual Average by Province 2004 - 2014
Alberta
BritishColumbia
Saskatchewan
Manitoba
Ontario
Quebec
Source: Statistics Canada 282-0069 Labour force survey estimates (LFS), wages of employees by type of work, National Occupational Classification for Statistics
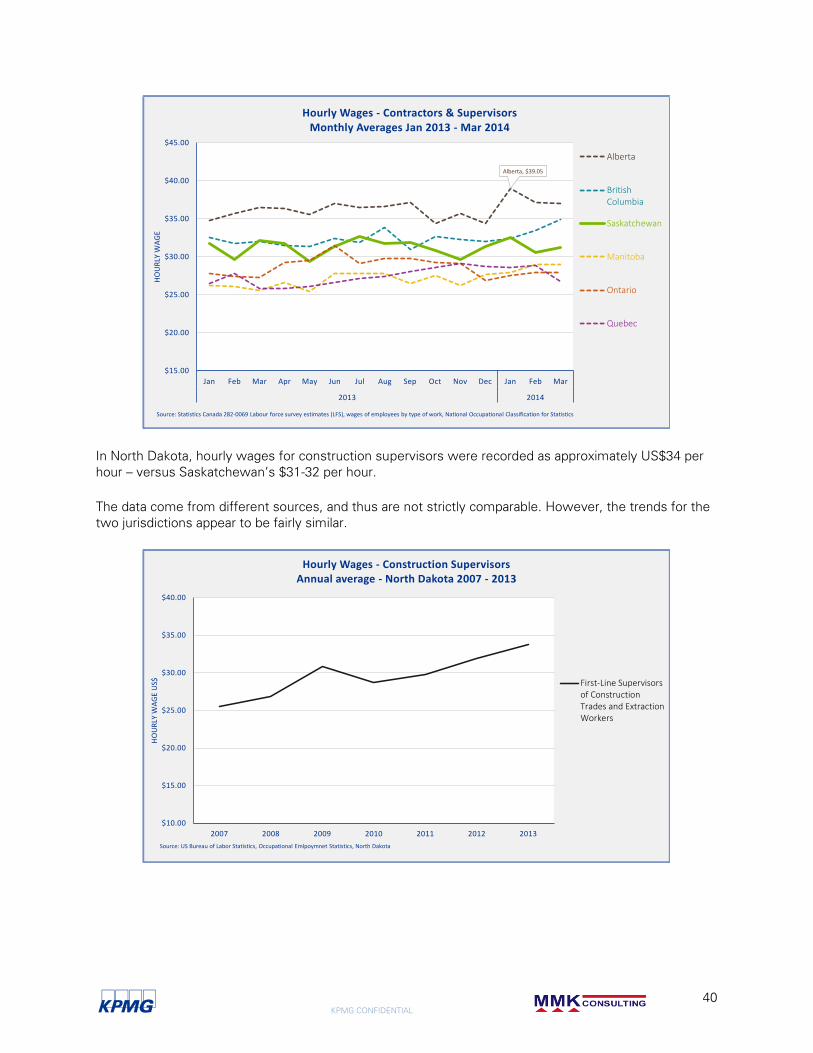
KPMG CONFIDENTIAL
40
In North Dakota, hourly wages for construction supervisors were recorded as approximately US$34 per
hour – versus Saskatchewan’s $31-32 per hour.
The data come from different sources, and thus are not strictly comparable. However, the trends for the
two jurisdictions appear to be fairly similar.
Alberta, $39.05
$15.00
$20.00
$25.00
$30.00
$35.00
$40.00
$45.00
Jan Feb Mar Apr May Jun Jul Aug Sep Oct Nov Dec Jan Feb Mar
2013 2014
HO
UR
LY W
AG
E
Hourly Wages - Contractors & SupervisorsMonthly Averages Jan 2013 - Mar 2014
Alberta
BritishColumbia
Saskatchewan
Manitoba
Ontario
Quebec
Source: Statistics Canada 282-0069 Labour force survey estimates (LFS), wages of employees by type of work, National Occupational Classification for Statistics
$10.00
$15.00
$20.00
$25.00
$30.00
$35.00
$40.00
2007 2008 2009 2010 2011 2012 2013
HO
UR
LY W
AG
E U
S$
Hourly Wages - Construction SupervisorsAnnual average - North Dakota 2007 - 2013
First-Line Supervisorsof ConstructionTrades and ExtractionWorkers
Source: US Bureau of Labor Statistics, Occupational Emlpoymnet Statistics, North Dakota
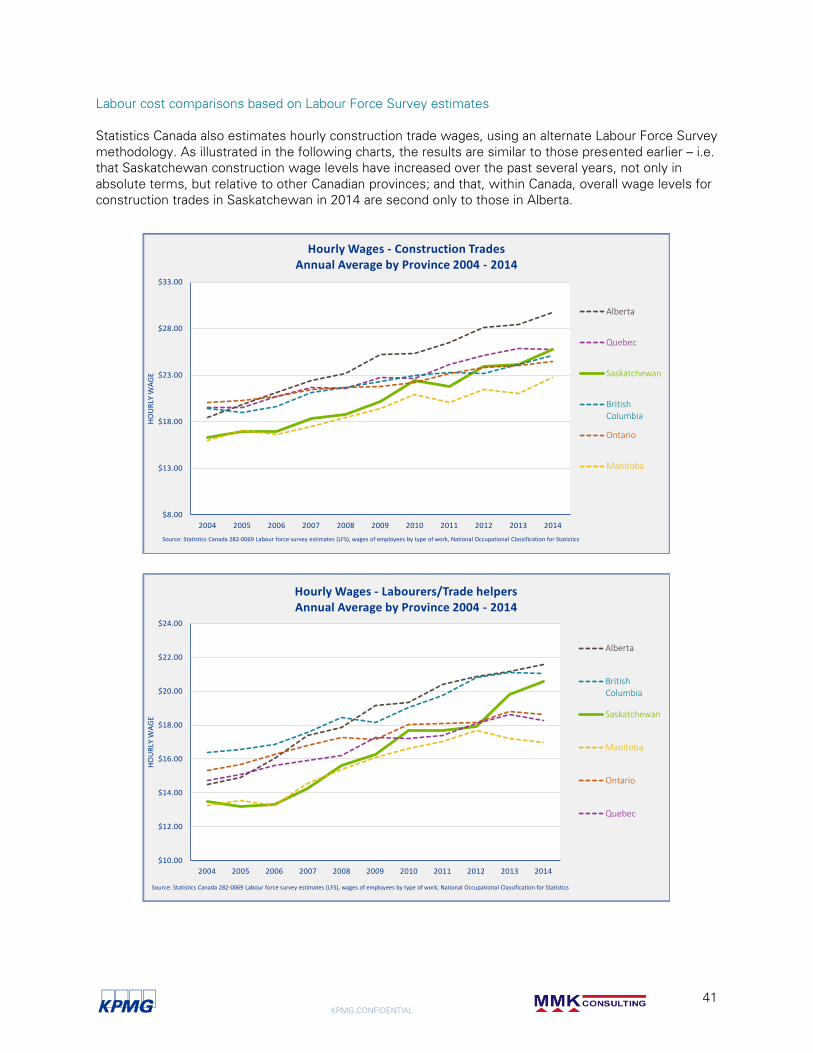
KPMG CONFIDENTIAL
41
Labour cost comparisons based on Labour Force Survey estimates
Statistics Canada also estimates hourly construction trade wages, using an alternate Labour Force Survey
methodology. As illustrated in the following charts, the results are similar to those presented earlier – i.e.
that Saskatchewan construction wage levels have increased over the past several years, not only in
absolute terms, but relative to other Canadian provinces; and that, within Canada, overall wage levels for
construction trades in Saskatchewan in 2014 are second only to those in Alberta.
$8.00
$13.00
$18.00
$23.00
$28.00
$33.00
2004 2005 2006 2007 2008 2009 2010 2011 2012 2013 2014
HO
UR
LY W
AG
E
Hourly Wages - Construction TradesAnnual Average by Province 2004 - 2014
Alberta
Quebec
Saskatchewan
BritishColumbia
Ontario
Manitoba
Source: Statistics Canada 282-0069 Labour force survey estimates (LFS), wages of employees by type of work, National Occupational Classification for Statistics
$10.00
$12.00
$14.00
$16.00
$18.00
$20.00
$22.00
$24.00
2004 2005 2006 2007 2008 2009 2010 2011 2012 2013 2014
HO
UR
LY W
AG
E
Hourly Wages - Labourers/Trade helpersAnnual Average by Province 2004 - 2014
Alberta
BritishColumbia
Saskatchewan
Manitoba
Ontario
Quebec
Source: Statistics Canada 282-0069 Labour force survey estimates (LFS), wages of employees by type of work, National Occupational Classification for Statistics
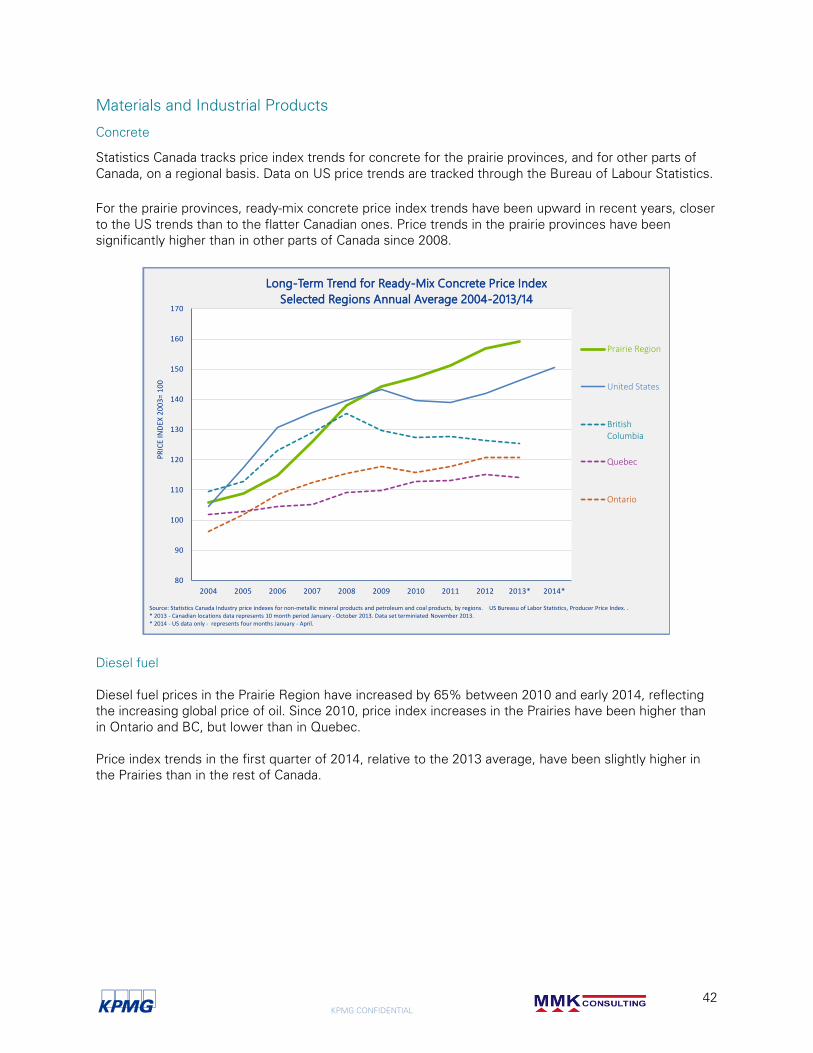
KPMG CONFIDENTIAL
42
Materials and Industrial Products
Concrete
Statistics Canada tracks price index trends for concrete for the prairie provinces, and for other parts of
Canada, on a regional basis. Data on US price trends are tracked through the Bureau of Labour Statistics.
For the prairie provinces, ready-mix concrete price index trends have been upward in recent years, closer
to the US trends than to the flatter Canadian ones. Price trends in the prairie provinces have been
significantly higher than in other parts of Canada since 2008.
Diesel fuel
Diesel fuel prices in the Prairie Region have increased by 65% between 2010 and early 2014, reflecting
the increasing global price of oil. Since 2010, price index increases in the Prairies have been higher than
in Ontario and BC, but lower than in Quebec.
Price index trends in the first quarter of 2014, relative to the 2013 average, have been slightly higher in
the Prairies than in the rest of Canada.
80
90
100
110
120
130
140
150
160
170
2004 2005 2006 2007 2008 2009 2010 2011 2012 2013* 2014*
PR
ICE
IND
EX 2
00
3=
10
0
Long-Term Trend for Ready-Mix Concrete Price Index
Selected Regions Annual Average 2004-2013/14
Prairie Region
United States
BritishColumbia
Quebec
Ontario
Source: Statistics Canada Industry price indexes for non-metallic mineral products and petroleum and coal products, by regions. US Bureasu of Labor Statistics, Producer Price Index. . * 2013 - Canadian locations data represents 10 month period January - October 2013. Data set terminiated November 2013.* 2014 - US data only - represents four months January - April.
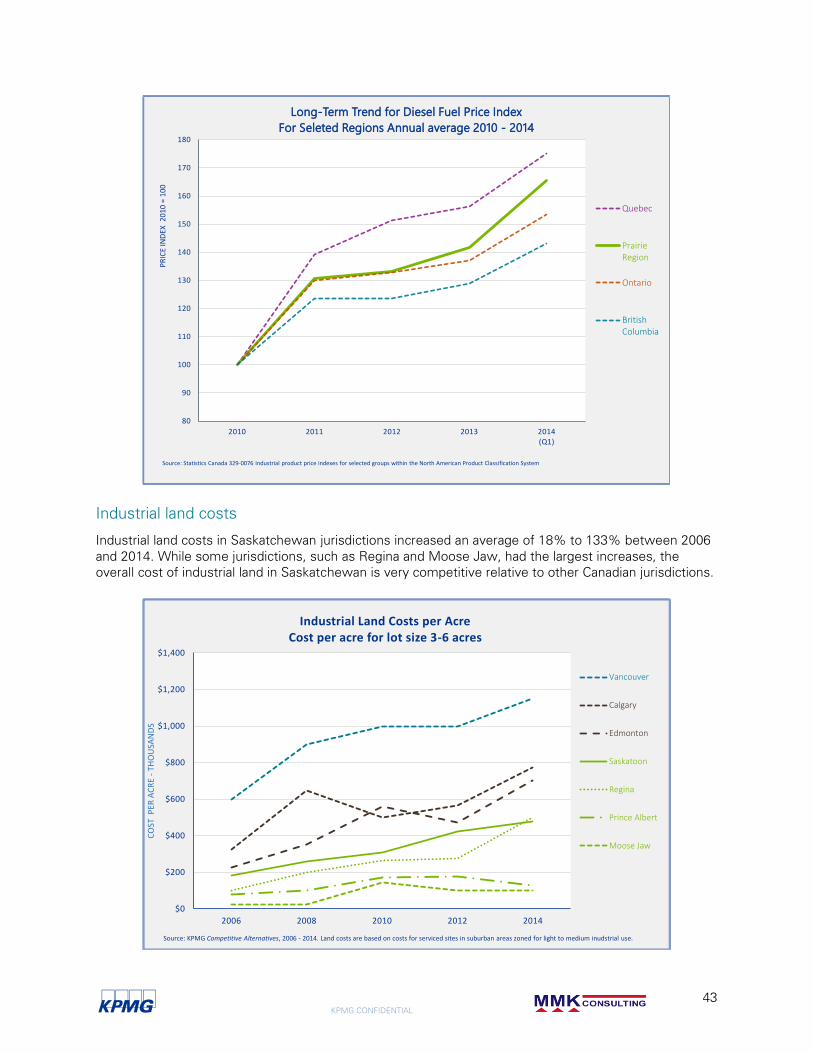
KPMG CONFIDENTIAL
43
Industrial land costs
Industrial land costs in Saskatchewan jurisdictions increased an average of 18% to 133% between 2006
and 2014. While some jurisdictions, such as Regina and Moose Jaw, had the largest increases, the
overall cost of industrial land in Saskatchewan is very competitive relative to other Canadian jurisdictions.
80
90
100
110
120
130
140
150
160
170
180
2010 2011 2012 2013 2014(Q1)
PR
ICE
IND
EX 2
01
0 =
10
0
Long-Term Trend for Diesel Fuel Price Index
For Seleted Regions Annual average 2010 - 2014
Quebec
PrairieRegion
Ontario
BritishColumbia
Source: Statistics Canada 329-0076 Industrial product price indexes for selected groups within the North American Product Classification System
$0
$200
$400
$600
$800
$1,000
$1,200
$1,400
2006 2008 2010 2012 2014
CO
ST P
ER A
CR
E -
THO
USA
ND
S
Industrial Land Costs per AcreCost per acre for lot size 3-6 acres
Vancouver
Calgary
Edmonton
Saskatoon
Regina
Prince Albert
Moose Jaw
Source: KPMG Competitive Alternatives, 2006 - 2014. Land costs are based on costs for serviced sites in suburban areas zoned for light to medium inudstrial use.
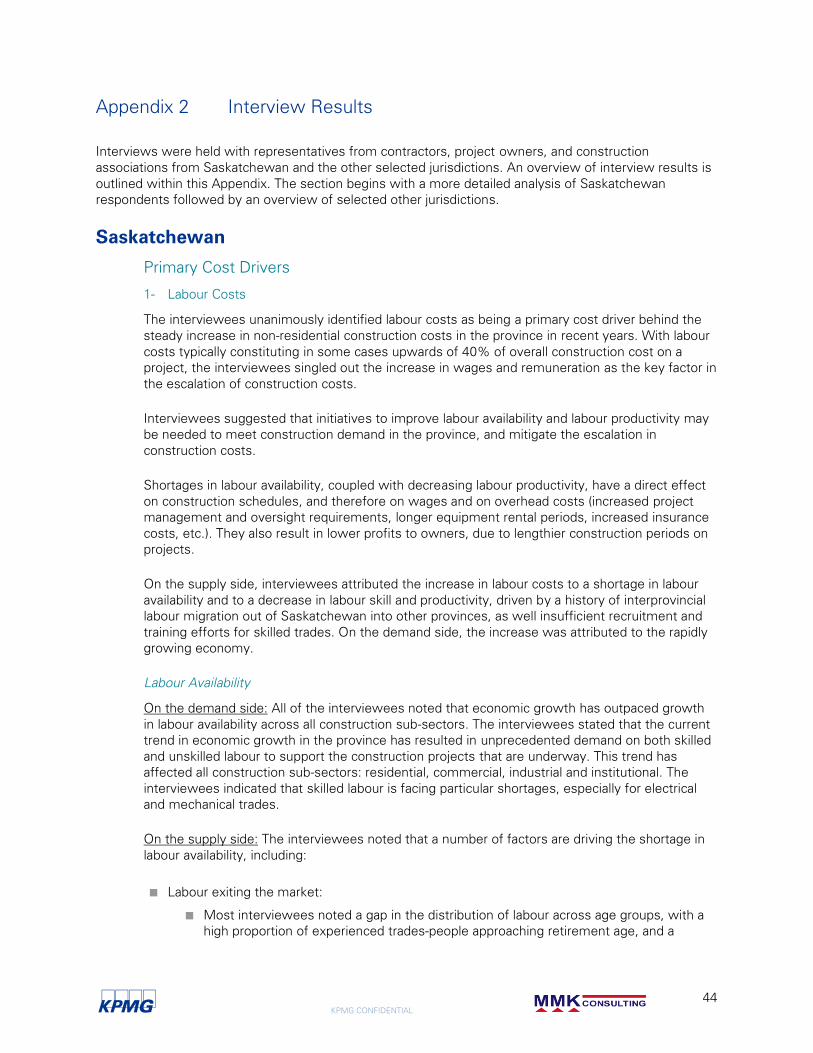
KPMG CONFIDENTIAL
44
Appendix 2 Interview Results
Interviews were held with representatives from contractors, project owners, and construction
associations from Saskatchewan and the other selected jurisdictions. An overview of interview results is
outlined within this Appendix. The section begins with a more detailed analysis of Saskatchewan
respondents followed by an overview of selected other jurisdictions.
Saskatchewan
Primary Cost Drivers
1- Labour Costs
The interviewees unanimously identified labour costs as being a primary cost driver behind the
steady increase in non-residential construction costs in the province in recent years. With labour
costs typically constituting in some cases upwards of 40% of overall construction cost on a
project, the interviewees singled out the increase in wages and remuneration as the key factor in
the escalation of construction costs.
Interviewees suggested that initiatives to improve labour availability and labour productivity may
be needed to meet construction demand in the province, and mitigate the escalation in
construction costs.
Shortages in labour availability, coupled with decreasing labour productivity, have a direct effect
on construction schedules, and therefore on wages and on overhead costs (increased project
management and oversight requirements, longer equipment rental periods, increased insurance
costs, etc.). They also result in lower profits to owners, due to lengthier construction periods on
projects.
On the supply side, interviewees attributed the increase in labour costs to a shortage in labour
availability and to a decrease in labour skill and productivity, driven by a history of interprovincial
labour migration out of Saskatchewan into other provinces, as well insufficient recruitment and
training efforts for skilled trades. On the demand side, the increase was attributed to the rapidly
growing economy.
Labour Availability
On the demand side: All of the interviewees noted that economic growth has outpaced growth
in labour availability across all construction sub-sectors. The interviewees stated that the current
trend in economic growth in the province has resulted in unprecedented demand on both skilled
and unskilled labour to support the construction projects that are underway. This trend has
affected all construction sub-sectors: residential, commercial, industrial and institutional. The
interviewees indicated that skilled labour is facing particular shortages, especially for electrical
and mechanical trades.
On the supply side: The interviewees noted that a number of factors are driving the shortage in
labour availability, including:
■ Labour exiting the market:
■ Most interviewees noted a gap in the distribution of labour across age groups, with a
high proportion of experienced trades-people approaching retirement age, and a
KPMG CONFIDENTIAL
45
shortage in numbers of experienced mid-career trades-people. (KPMG’s review of the
demographic data has confirmed these anecdotal observations).
The remaining workforce tends to be quite young (55% of trades labour numbers are
in the 15-34 years-old age group), and in many cases lacks the experience and
mentorship abilities that come from rigorous training and apprenticeship.
■ The historic trend of labour migration out of the province, exacerbated by the
unprecedented economic growth in other Canadian provinces, notably Alberta.
■ The significant growth in residential construction, causing labour lateral migration from
non-residential construction towards residential construction. Some interviewees
noted a trend whereby experienced trades people are leaving their salaried positions
and establishing small contracting businesses, to independently provide services to the
single unit residential construction market.
■ The pace of replenishment seems insufficient due to a number of reasons including:
■ Seemingly insufficient training programs for new skilled labour with the number of
available training seats not achieving required industry growth and retirement
replacement needs.
■ Insufficient national or international recruitment efforts.
■ Inadequate, uncoordinated, or insufficient incentives: Interviewees referred to a
number of incentives being undertaken to mitigate the shortage, but noted that many
of them have been insufficient or ineffective.
For example, inviting new competitors from other provinces into the sub trade
marketplace has largely proven unsuccessful, given that these new businesses found
themselves competing for the same local labour pool as the existing businesses.
Essentially, the limiting factor in the sub trade market is mainly labour availability, and
to a much lesser extent, availability of competition in the sub trade business.
Some general contractors noted that a "living out" allowance is being offered to labour
being recruited for projects in Regina and Saskatoon. This allowance, over and above
the standard wages, aims to incent labour to relocate to these cities. Such allowances
have contributed to the increasing labour costs to the contractor.
Further, general contractors and project owners noted that labour availability is
particularly challenging on projects located outside of major centres (Regina and
Saskatoon) and for projects involving construction tasks that are perceived as being
more demanding and time consuming.
Labour Productivity
In addition to limited availability, interviewees noted a concern relating to the trends in the level
of productivity of their labour resources. Some general contractors indicated that their
quantitative measurements of labour productivity clearly show that the quality of workmanship
and efficiency of labour has been in a steady decline over the past decade.
Interviewees indicated that labour productivity has been diminished by the sharply increasing
market demand for labour, the growing workforce, and the resulting knowledge and experience
gap. Interviewees noted that many of the experienced trades-people are gradually reaching
retirement age, and that there is a strong shortage in experienced mid-career trades-people.
Much of the workforce tends to be quite young, and lacks the experience or mentorship that
comes from rigorous training and apprenticeship. This gap is believed to limit the transfer of
knowledge between the retiring baby boomers and a new, younger labour pool.
KPMG CONFIDENTIAL
46
Interviewees noted that this decrease in labour productivity has a direct impact on construction
costs, resulting in extended construction schedules and lower efficiency on construction sites.
When asked about the driving factors behind reduced labour productivity, interviewees identified
similar factors to those affecting labour availability:
■ High turn-over of skilled labour on projects, and movement of workers to higher paying
opportunities.
■ Migration of labour away from the province, especially with the higher compensation levels
in Alberta attracting workers from Saskatchewan, other provinces and internationally.
■ Ongoing retirement of the baby boomer generation, and the loss of the vast store of
knowledge and experience.
■ Lack of rigorous training of young recruits and apprentices.
■ Migration of workers into the residential construction sector.
■ Limited recruitment success into the skilled trades.
■ Difficulties attracting labour into the province, especially given Saskatchewan’s smaller cities
and lower population density.
2- Material Costs
Approximately half of Saskatchewan contractors interviewed have indicated that the costs of
construction materials rank within their top four cost drivers impacting non-residential
construction costs in the province, and contribute to an overall higher price tag for construction in
Saskatchewan.
Unlike labour costs, these costs are not seen as increasing disproportionately year-over-year;
however, in absolute terms, these costs are significantly higher in Saskatchewan than in other
provinces. This price difference was believed to directly impact the overall construction cost for
new projects in the province, and therefore, affect the province’s competitive profile.
A particular emphasis was placed in the following materials in the order presented: concrete,
sand and gravel aggregate, and fuel. Interviewees indicated that material costs continue to
increase at an estimated average rate of approximately 3.5 - 5% per annum. Each of these
materials is discussed in further detail below.
Concrete
Concrete was noted as significantly more costly in Saskatchewan than in other major Canadian
jurisdictions. Some general contractors noted that on average, the cost of concrete in urban
centres in Saskatchewan exceeds that of their other Canadian branches by at least 10%. They
noted that concrete costs in Regina can be up to 75% higher than in Toronto, and 25% higher
than in Vancouver. (These figures are based on verbal statements from interviewees, but are
generally consistent with statistical data).
Nearly all interviewees shared the view that concrete is the single highest driver for increased
construction costs among construction materials. They noted that the increase in concrete costs
is a function of limited local supply, and the requirement to transport materials from further
away. In addition, some participants noted that limited competition existed in the concrete
supply industry, as two large companies control the majority of the market, with small start-ups
being quickly acquired.
KPMG CONFIDENTIAL
47
Sand and Gravel Aggregate
Similar to concrete, interview participants noted that the cost of aggregate in Saskatchewan is
disproportionately higher than in other jurisdictions, being in limited supply locally, and requiring
transportation over long distances.
Participants noted that aggregate is one of the few materials that is sourced in limited quantities
locally, and faces serious logistical challenges limiting transportation from outside of the
province. The limited available options or substitutes for aggregate result in its cost being
inelastic.
Fuel
Due to Saskatchewan’s expansive geography and dispersed population, materials often require
transportation across significant distances, and fuel costs are a pervasive factor influencing the
overall costs of construction materials in the province. Many interviewees noted that any
fluctuations in fuel costs are felt across the supply chain, and result in direct escalation of
material prices on construction sites.
Steel
Although interviewees indicated that steel prices have risen significantly in the past (most
notably in the period of 2006-2008), none believed that the costs were proportionately higher
than other jurisdictions.
Most references to steel costs related to the significant spikes in prices witnessed during the
2006-2008 period, when prices had risen at an estimated rate of over 8% annually, in line with
international increases in steel costs.
3- Competition
Economic growth in Saskatchewan has resulted in opportunities for some local contractors to
expand and develop their businesses. It has also proven to be attractive to new market players,
such as national and international contractors establishing local representation and competing for
a portion of the economic opportunity in Saskatchewan.
All the interviewees indicated that rising competition in the construction sector, especially at the
general contractor level, has had somewhat of a dampening effect on the increasing costs of
non-residential construction in the province. Many did not believe this impact would be
sustainable in the long term without lasting solutions to the shortage in labour availability to
sustain increased market activity and support a greater number of competitors as they
differentiate and specialize.
However, the interviewees also indicated that despite some recent progress, the sub trade
market still lacks competitive pressure, and they attributed this lack to the availability of skilled
and specialized sub trade labour in the province. As such, interviewees attributed a portion of the
rising non-residential construction costs to the lack of competition (and labour availability) at the
sub trade level. Interviewees in the subcontractor market indicated that new competitors have
begun moving into the marketplace; however in many circumstances they are partnering on joint
ventures with local companies to facilitate labour requirements and ensure that unique local
considerations are accommodated. Additionally, interviewees noted that due to limited labour
supply, subcontractors must be more targeted with the work they pursue.
KPMG CONFIDENTIAL
48
The general rise in competition among general contractors was noted across all scales and
project types, and is unanimously seen as a welcome development in the sector. The impacts of
competition are detailed below:
National General Contractors
At the large general contractor level, interviewees indicated that increased competition has
resulted in a pressure on general contractors to reduce their construction margins, offering
greater opportunities for project owners to reduce their project costs. This reduction is notably
driven by a number of national contractors that previously did not have a permanent presence in
Saskatchewan but are now established in the province. These new businesses have driven
margins and costs down, as they compete for new projects in the province.
However, as previously noted, some interviewees believed that the increased competition in the
market will not be sustainable, given that larger general contractors are still competing for the
same pool of local skilled and unskilled labour as well as subcontractors, and that most
contractors will continue to face similar challenges with availability and cost of materials.
All of the Saskatchewan participants interviewed believed that a sufficient level of competition
exists at the large general contract level.
Regional/Local General Contractors
Interview participants believed that a sufficient level of competition exists among regional/local
general contractors although some of these contractors are beginning to face new challenges, as
they do not have the capacity to bid on projects that adopt new procurement models such as
P3s, and on some of the recently-announced ‘mega projects’.
At the more local level, interviewees indicated that sufficient competition exists at the small-
business general contractor level, with many new entrants in recent years. These contractors fill
niche roles or take on less complex, smaller jobs, and play an important role across the province.
Sub Trades
Most interviewees indicated that construction activity and industry competition levels in the sub
trade sector are facing increasing challenges, and attempts for competitors to enter the market
have been stifled by the limited availability of local skilled labour.
New entrants to the sub trade sector have therefore been limited to very small businesses,
focused on smaller projects, many of which are in the residential sector or partnering
arrangements with local companies. Interviewees noted that most new entrants do not have the
capacity and expertise to support the major projects underway or those new projects announced
in Saskatchewan.
Interviewees believed the lack of competition and skilled labour availability in the sub trade
market to be critical issues directly affecting non-residential construction costs, notably in the
electrical and mechanical sub trades. One interviewee noted that this is especially critical on
industrial projects, as specialized labour often accounts for a greater proportion of project costs.
4- Schedule Pressures
Interviewees also indicated that schedule pressures are a factor in increasing project costs.
These pressures are considered to be driven by a number of factors including: changing
KPMG CONFIDENTIAL
49
expectations of project owners in relation to schedule whereby owners are demanding
increasingly shorter and sometimes unachievable timeframes for project delivery; harsh and
unpredictable weather in Saskatchewan delaying projects and therefore increasing costs; and a
perceived lack of productivity due to labour shortage and increased process controls, which
dictates longer schedules and directly conflicts with owner’s requests for tighter schedules.
While these requirements are not unique to Saskatchewan, interviewees believed that these
pressures, combined with the current labour constraints, will continue to cause a cost premium
on non-residential construction in the province, as they exacerbate the labour issues in the
market, and result in costly compensation measures being taken.
For example, the shortage in labour availability and lower labour productivity directly affects
project pricing and overhead costs, resulting in increased project management and oversight
requirements, longer equipment rental periods, increased insurance costs, etc. Similarly,
pressures to complete a project in a compressed timeframe result in a need to rely on a greater
number of resources concurrently, creating risk to complete necessary dependencies and ensure
that any unforeseen delays can be accommodated. This increased risk in a compressed schedule
may also result in increased costs passed on to the project owner.
Changing Schedule Demands
Interviewees believed that demands to complete projects within shorter timeframes are driven
by two factors:
■ Demands from owners to deliver projects within unprecedented timeframes, in order for
projects to become operational and commence generating income to their owners.
■ Internal pressure within the contracting business to maximize profitability, by completing
projects within unprecedented timeframes, and transition into other committed work.
These factors are resulting in increasing pressures on productivity, including measures to
maximize the construction period into the colder months and beyond daylight hours, through
additional heating, hoarding and lighting.
One example offered by an interviewee included paying a ‘live in’ fee to employees, even in
major centres (Regina and Saskatoon), to attract the required labour to meet the schedule
demands. This is a cost that typically would not be required for such projects, and is passed on
to project owners through increased labour costs.
Harsh Weather and Changing Climate
Several interviewees indicated that Saskatchewan’s long, harsh winters are a contributing factor
for increased construction costs in the province. To continue to progress construction through
these months, contractors and project owners face significant costs to adequately hoard and
heat projects.
One interviewee noted that a recent project required $500,000 in additional heating and
hoarding, and that these costs were borne by the owner. Interviewees noted that non-residential
construction projects are significantly impacted by both power and natural gas utility costs,
especially during the harsh winter months.
Additionally, the changing climate, with unprecedented fluctuations such as unusually strong
spring runoff and excessive rain, have also had an impact on project costs, with contractors
allowing for these increasing risks as part of their overall costs on projects.
KPMG CONFIDENTIAL
50
One contractor noted that the flooding that occurred in the province in recent years had affected
several of their projects. While flooding and torrential rain are a rare occurrence, several
contractors indicated that they consider this type of risk while estimating project costs and
timelines, and these risk premiums are passed on to project owners.
Secondary Cost Drivers
In addition to the primary cost drivers identified by interviewees, a number of secondary cost
drivers were identified as having an impact on non-residential construction costs. This
information has been included to ensure completeness of our report, despite being not unique to
Saskatchewan and/or raised by very few interviewees. They included:
■ Drivers that are not unique to Saskatchewan.
■ Drivers that have been inconsistently identified among interviewees.
■ Drivers that have a minor impact on construction costs.
Permitting
Permitting was noted by one interviewee as a significant and rising cost related to non-residential
construction projects. At an estimated cost of $8 fee per $1000 of project cost, permitting is
seen as a contributing factor to increased costs borne by project owners.
Additionally, the interviewee noted that some municipalities have been slow to respond to
demand on construction permits, resulting in longer timeframes to process permits, and
increased costs due to schedule changes on projects.
Quality, Safety and Environment Standards
Some interviewees noted that compliance requirements, the complexity of contract delivery
models, and changes as the industry matures and becomes more sophisticated have led to
increased costs on projects.
Although noted as an important component of the construction process and one that
Saskatchewan may have been slower to adapt to than other jurisdictions, these compliance
regulations generate increased costs on projects, and these costs are passed on from
contractors to project owners.
Accommodation and Mobilization in Remote Areas
Some participants indicated that worker accommodation and other mobilization costs, especially
in rural areas, is a significant cost driver for projects in remote areas of the province. These
projects tend to be industrial projects in less populated areas, for which labour must be
accommodated on a short term basis to support construction.
Soil Conditions
One interviewee noted that the soil conditions in many parts of the province also contribute to
higher construction costs. In areas like Regina, expansive clays have limited bearing value and
therefore require more expensive foundations. Additionally, the interviewee indicated that the
cost has increased over time as design and engineering has become more conservative to
reduce risk.
KPMG CONFIDENTIAL
51
Provincial Sales Tax
One participant noted that Saskatchewan has both advantages and disadvantages related to
Provincial Sales Tax. In comparing Saskatchewan to Alberta, project owners pay a 5% premium
on most materials. However, Saskatchewan has a lower Provincial Sales Tax than any other
province.
Impacts
Project Owners
During our interviews with general contractors, a number of them reported having witnessed
owners downsizing or cancelling new projects or project expansions, due to the fact that
construction costs in the province were found to be unexpectedly high, especially as compared
with other provinces.
On the other hand, interviews with private sector project owners indicated that construction
costs present challenges; but are not considered to be delaying or cancelling capital construction
projects for businesses currently active in the province. The interviewees noted that in many
cases the projects being considered are reliant on a specific geographic location. In these cases,
owners are forced to consider alternate or innovative approaches to construction to optimize
investment in capital construction. For example, due to high concrete prices, and challenges
related to logistics in rural locations, owners have considered alternate approaches such as
relying on alternative, more economical materials such as wood, for their project structures. The
interviewees noted that locating in the province presents significant opportunities, but may also
come with additional costs, with construction costs being one example. These costs place
additional pressures when considering expansion and growth in Saskatchewan.
Construction Contractors
Construction contractors noted that while they are experiencing significant construction cost
challenges, the biggest impacts are being felt by project owners to whom the costs are
ultimately transferred. Contractors interviewed offered some of the following impacts on their
businesses:
■ Reduced margins are being realized on nearly all types of work.
■ Costs are increasing at a more rapid pace than anticipated in the estimating process;
therefore, the estimating process has had to be altered to build in higher cost escalation
allowances.
■ Projects are more difficult to accurately estimate and forecast, as cost drivers are more
unpredictable than in past years. This is exacerbated by the fact that Saskatchewan is a small
construction market, and is more vulnerable to the business cycle than other markets,
making it difficult to predict cost in advance, which is generating higher risk to project pricing
by contractors.
■ Projects are considering conservative, longer contracts (i.e. schedule buffers) to
accommodate labour availability and labour productivity.
■ Alternate approaches are being considered including prefab construction out of province to
reduce costs, labour challenges, and shorten schedules.
KPMG CONFIDENTIAL
52
Emerging Trends
Major Projects
Most interviewees have noted a shift in the types of projects coming to market. Saskatchewan
has seen significant growth in the number of major projects ($50M+) coming to market. These
projects include various procurement approaches including P3s. Interviewees noted a number of
anticipated impacts from the evolving project types including those listed below.
■ The level of competition is reduced on mega projects in the province, since few contractors
are able to deliver projects of the size and complexity required. Although they attract both
national and international contractor interest, there are challenges related to acquiring the
necessary local resources to successfully deliver the project. The reduced competition may
result in premium costs being borne by project owners.
■ The size of projects coming to market may push out small and mid-sized contractors in
favour of large contractors with the ability to complete major projects.
■ Sub trades are considered to be less mobile than the contracting community, and as such;
concerns were raised by interviewees related to the capacity and competition at the trades’
level to deliver mega projects in Saskatchewan. Interviewees believed that only a few major
local trades companies (maximum of 2-3 in each trade) have the capacity to support and
successfully deliver projects of the size and complexity being brought to market, which may
result in premium costs.
■ Interviewees indicated that they believe non-residential construction demand will remain
strong into the future, but will feature a continued shift towards fewer, high value projects –
resulting in a similar overall construction value, but with a different industry structure.
Commercial and Industrial Demand
Interviewees indicated that demand in the commercial and industrial sectors is expected to
remain stable, although somewhat reduced from record breaking years in 2012/13. It was
believed that a slowdown is occurring in the commercial and industrial projects this year and will
continue in future years. Thus the high level of demand is believed to remain challenging, but
more manageable than has been experienced in the past few years. Contractors indicated that
challenges will remain as the level of demand across the Western provinces is likely to remain
fairly constant, with Alberta construction levels remaining very strong. Additionally, the
introduction of mega projects mostly driven by the public sector (schools, stadium, bypass
project, etc.) will have an impact on the institutional/government construction sector. However it
is not yet clear how these projects will impact other projects in the commercial and industrial
sector.
Interviewees also indicated that although many projects are ‘in the pipeline’ and expected in the
near future, recent project cancellation and delays make it challenging to forecast future
construction demands. Additionally, ambiguity over P3 projects in the province was noted as a
challenge by Saskatchewan contractors.
Interviewees also noted some recent differences between construction demand trends in
Regina compared to Saskatoon. Commercial construction demand appears to remaining quite
strong in Regina, while Saskatoon has seen some slowdown. Major industrial projects are
expected in the Saskatoon area in the near future, including projects such as the Jansen potash
mine, which is anticipated to fuel demand in other sectors. For example, one interviewee noted a
trend that introduction of industrial projects and increased industrial demand tends to lead to
increased commercial demand to meet the newly introduced industrial activities.
KPMG CONFIDENTIAL
53
British Columbia
Cost Drivers
Key cost drivers identified by interviewees from British Columbia, including both primary and
secondary drivers, are outlined below.
Labour
Labour was ranked by interviewees as a very significant construction cost driver in British
Columbia (although not to the same extent as in Saskatchewan). Interviewees noted
concerns related to both labour shortages as well as skills shortages. In relation to labour
shortage, the availability of labour is believed to be driving costs through both premium costs
and schedule changes. From a skills shortage perspective, concerns were raised related to
an aging demographic, and the need for specialized skills and experience to support
increasingly complex projects.
Concrete and Steel
Concrete and steel were ranked by interviewees as the highest impact construction cost
driver in British Columbia.
Fuel
Fuel was ranked by interviewees as another high impact construction cost driver in British
Columbia. The fluctuations in the cost of fuel are believed to result in a direct escalation on
construction costs as this affects most fuel dependent materials.
Secondary Cost Drivers
In addition to the primary cost drivers noted above, interviewees indicated the following cost
drivers are also having an impact on non-residential construction projects in British Columbia,
Technology
Technological changes such as the use of online bidding systems are seen as a
powerful force for maintaining a competitive market and controlling construction
costs.
Major Infrastructure Project Demand
A number of current and proposed major projects, especially in Northern areas of the
province are believed to be having an impact on construction costs. They affect the
scarcity of supply and the increase in demand in the province, and have a direct
impact on both material and labour availability and costs.
Environmental and Green Building Initiatives
A shift towards innovative solutions to improve the environmental sustainability of
buildings is resulting in changing costs. In some circumstances, additional capital
costs are invested to improve value over the life cycle of the project through lower
operating costs.
Material Availability and Cost in Remote Regions
In rural and remote areas of the province, the scarcity and costs of construction
materials results is a contributing factor to higher construction costs.
Competition
Interviewees noted that a number of national and international industrial contractors
are beginning to establish a presence in the British Columbia marketplace, thereby
limiting the upward pressures on non-residential construction costs in the province.
KPMG CONFIDENTIAL
54
Impacts
Interviewees indicated that they did not believe increases in non-residential construction costs
were resulting in significant amounts of delayed or cancelled projects in the province in recent
years (unlike the situation during the BC boom years of 2004 through 2007).
Emerging Trends
Non-residential construction demands in the province are anticipated to continue to increase,
especially given the number of anticipated major projects expected in the near future. These
projects are expected to alter the marketplace, and increase demand for labour and material
supply, especially in Metro Vancouver and Northern British Columbia.
Alberta
Cost Drivers
Key cost drivers identified by interviewees from Alberta are outlined below.
Labour
Interviewees ranked construction demand exceeding available supply as the most significant
cost driver in the province. This demand is creating challenges in forecasting and managing
demand to align with the ability of the industry to build its skilled labour force.
Interviewees indicated that the boom and bust nature of resource dependent economies,
such as in Alberta and Saskatchewan, exacerbate demand – combining both demand due to
population growth as well as demand for investment in infrastructure.
Business Practices
Business practices were ranked by interviewees as another impactful cost driver in Alberta,
citing examples such as adversarial relationships leading to inefficiency in costing.
Interviewees also indicated that practices among contracting parties, and procurement
practices generally adopted in the non-residential construction sector may not be well suited
to the unique characteristics of each project or the market, resulting in inefficient pricing and
procurement strategies being adopted on projects. For example, owners don’t take full
advantage of mechanisms to incentivize contractors to keep costs low, share the risks with
those contractors, and adopt alternative procurement models such as design build.
Interviewees also cited incomplete project specifications or drawings as being a driver
behind the uncertainty (and therefore the risk) being borne by contractors at procurement,
which translates into higher construction costs.
Impacts
Demand exceeding supply, especially related to skilled trades-people, is believed to have
resulted in innovative approaches being used to complete projects on schedule and within
budgets. This includes approaches such as prefabricated construction off site, more collaborative
contract arrangements, lean practices, and greater adoption of Building Information Modeling,
which is a software based 3D model-based process for planning, design, construction, and
management of buildings and infrastructure.
Much of the very strong construction demand is related to the energy and resources sector.
These projects are dependent on a particular geography, and therefore less susceptible to
relocation. Interviewees identified that supporting industries such as upgrading and refining
projects are vulnerable to relocation outside of the province.
KPMG CONFIDENTIAL
55
Emerging Trends
Emerging and future trends that are believed to potentially impact the Alberta construction sector
include changes to Temporary Foreign Worker and immigration programs that may expand or
further limit access to or availability of skilled labour.
Also, procurement processes that limit innovation and improper allocation of risk to contractors
are important trends that were noted by interviewees.
Manitoba
Cost Drivers
Key cost drivers identified by interviewees from Manitoba, including both primary and secondary
drivers are outlined below.
Location and Geotechnical Requirements
Location and geotechnical requirements were ranked as having the highest relative impact
on construction costs in Manitoba. Like Saskatchewan, soil conditions in the province vary
dramatically requiring significant exploratory and assessment work related to geotechnical
conditions.
Additionally, following this due diligence, projects commonly require additional engineering
and structural work to accommodate limited soil bearing value. This may include piling
caissons, which may not be required in a similar construction project in an alternate
jurisdiction.
Climate
Climate and weather conditions were ranked as having the second highest relative impact on
construction costs in Manitoba. Similar to Saskatchewan, Manitoba faces significant variance
in temperatures from less than -30 to greater than +35 degrees Celsius. Structures built in
the province must be able to accommodate this range in temperature introducing additional
costs that may not be required in other jurisdictions.
Further, this climate has a direct implication on construction methods, schedules, overhead
and operating costs, as well as risk and contingency allocations.
Tax Rate
Taxes were noted as the third highest relative impact on construction costs. These taxes
include an 8% provincial sales tax which applies to construction equipment and materials. In
recent years this tax has been expanded to also apply to mechanical and electrical labour.
With mechanical and electrical labour accounting for a significant portion of project costs, this
expanded scope to taxes has had a significant impact on overall construction costs. In
addition to provincial sales taxes, a payroll tax of 2.1% applies within the province,
introducing an additional cost to employers.
Secondary Cost Drivers
Underpinning the three primary cost drivers noted above, interviewees indicated the
following cost drivers are also having an impact on non-residential construction projects in
Manitoba.
Labour Supply
Labour supply was noted as a challenge in some parts of the province; however it
was not noted as a particular key cost driver. Labour costs were noted as significantly
KPMG CONFIDENTIAL
56
lower than Alberta and slightly lower than Saskatchewan, with shop rates being quite
consistent across industries in Manitoba.
Competition
Competition in Manitoba at the general contractor level was believed to have
increased in recent years, with major national contractors entering the province and
establishing a strong presence, resulting in a softening effect on construction costs
increases.
Similar to Saskatchewan, competition in some sectors is more limited, such as
mechanical contractors, which may be resulting in higher costs in those sectors.
Impacts
Interviewees indicated that increases in non-residential construction costs are a concern,
affecting the attractiveness of Manitoba as a place to start or expand a business.
This concern is mostly valid in commercial construction, and less so in industrial development.
This concern is also geographically dependent, and the development of commercial office space
appears to be impacted, with some recent projects reported as delayed or cancelled.
However, interviewees also noted that the costs of commercial construction are secondary to a
more important factor, leading to delays or cancellations: low demand for leasing of commercial
space, and therefore lower rental income from such projects. The return on investment for
leased commercial space, particularly in Winnipeg, was seen as low compared to others
jurisdictions, and a barrier development of new construction projects.
Emerging Trends
Similar to other jurisdictions, interviewees noted that changing procurement models, the quality
of construction documents, and increasing construction demand are key emerging trends within
the Manitoba marketplace.
The procurement model being utilized was believed to be having an important impact on
construction costs, in some cases reducing costs and in others increasing those costs.
Interviewees noted that approaches such as construction management appear to be more
successful in managing and reducing costs than traditional lump sum tendering approaches
(given they allow for a number of risks to be retained by the owner, and therefore not being
embedded in bid costs).
The quality of construction documents was also noted as trend that may be increasing overall
construction costs across the project phases, from planning to design through to construction.
Documents were noted as often incomplete or lacking the required detail to limit costly changes.
Finally, interviewees noted that a strong and growing pipeline of anticipated projects exists in the
province. Numerous major projects have been announced, and are anticipated to impact costs as
resources, especially skilled labour, are stretched to meet growing market demand.
Ontario
Cost Drivers
Key cost drivers identified by interviewees from Ontario are outlined below.
KPMG CONFIDENTIAL
57
Insurance
One interviewee indicated that the cost of workplace safety insurance is an estimated six
times more than the cost for similar insurance in Alberta.
Energy Costs
Energy costs were noted as a deterrent for businesses looking to start or expand a business
in Ontario. This was noted to include high costs comparable to other jurisdictions in both the
construction and operating phases. Interviewees noted that this is particularly concerning to
the existing manufacturing sector in considering expanding or relocating.
Labour
Labour was noted as a key challenge, in terms of both the cost of labour, and the availability
of professionally trained employees in the construction sector. Unlike other jurisdictions,
Ontario is believed to feature a shortage of professionally trained skilled labour such as
project managers and estimators, rather than a shortage in the trades.
One interviewee noted that a focus on the trades sector has resulted in less focus being
placed on this group of critical workers, and therefore key shortages are being realized that
are impacting overall project costs. Although the cost of these professional skilled workers
accounts for only a small portion of the construction project costs, interviewees noted that
the impact of poor project planning, execution and project management may result in
significant increases to other project components. For example, if the estimating or design
work is not completed effectively, then costs may be much higher than budgeted, or
schedules may be extended.
Competition
Decreased demand in the construction sector in Ontario is believed to have resulted in high
competition which may be reducing construction costs in the marketplace. One interviewee
noted that non-residential construction demand has gone down 8% last year and 1.6% the
year previous. Demand is believed to have been particularly reduced in midsized projects
($50-$100M).
Impacts
Interviewees believed that non-residential construction costs are impacting on those considering
starting, relocating or expanding a business in Ontario.
One interviewee indicated that delays and cancellations are being realized across all industries
noting a large refinery proposed approximately five years ago that was cancelled due to high
construction costs.
Emerging Trends
Similar to other jurisdictions, interviewees noted that changing procurement models, and a shift
towards environmentally conscious construction practices, are anticipated to continue to impact
costs.
The type of procurement models being utilized is believed to be impacting the competitive pool
of suitable contractors, either by limiting or expanding the competitive pressures in the market.
This variable competitive environment includes alternative procurement approaches such as P3s
as well as bundling of construction projects.
KPMG CONFIDENTIAL
58
With a highly competitive marketplace, contractors are investing significant upfront costs to
meet procurement requirements with a limited chance of success, and these costs are either
passed on to future projects or forcing companies to leave the marketplace.
The non-residential construction sector in Ontario, similar to other jurisdictions around the world,
has seen a continual movement towards green building approaches. These innovative
approaches may be resulting in higher construction costs, especially in the short term. As these
construction methods become tried and tested, costs may be reduced. Additionally, in many
circumstances these approaches may result in higher upfront costs with a lower ongoing
operating cost to result in an overall positive return on investment to the project owner over a
longer time period.
Quebec
Cost Drivers
Key cost drivers identified by interviewees from Quebec are outlined below.
Economic Activity
Interviewees indicated that costs are driven up or down based on the provincial or regional
economy. In a heated economy prices rise, while in a period of slow growth a plateau is
experienced. The province is currently believed to be in a plateau with costs remaining
relatively stable.
Mobility of Labour
Interviewees indicated that it is more challenging to attract labour outside of major centres.
Difficulty attracting labour was believed to result in increased project costs in those regions,
as contractors need to increase compensation to ensure staffing is available to meet required
schedules.
Regulations
Regulation and compliance requirements, especially in the province’s largest cities, place an
additional burden on construction projects. Complying with these regulations results in
higher project costs, and also limits competition within these cities.
Contractual Requirements
Risk allocation and the procurement approach were noted by interviewees as a determinant
of project costs. The more risk is transferred to the contractor, the higher the resulting
project costs.
Schedule Pressures
Interviewees noted that owners are requesting more aggressive construction schedules,
which has a direct impact on project costs. Interviewees noted that project owners are often
unaware of the cost implications of exceptionally short schedules, and hold a belief that
shorter schedules result in improved value rather than substantially higher costs.
Secondary Cost Drivers
In addition to the primary cost drivers noted above, interviewees indicated that the following
cost drivers are also having an impact on non-residential construction projects in Quebec.
Labour
Labour challenges are being faced related to an aging population and declines in
productivity. In addition, there are potentially outdated contracts with unions, which
are limiting industry’s ability to respond to project needs in a cost effective manner.
KPMG CONFIDENTIAL
59
Corruption, Transparency, Accountability
Interviewees noted that major questions about corruption are affecting the public
perception of the contracting industry, and are casting doubt over the industry's
standards and governance. This is indirectly affecting the construction market, and
keeping new potential competition from relocating or establishing itself in the
province.
Impacts
The issues being faced today in Quebec are not believed to directly affect construction costs,
however, they do affect the image of the construction industry as a whole. Both reputational
challenges driven by corruption charges within the province, as well as labour issues faced
across all subsectors are resulting in the market operating below its levels of optimal efficiency.
While the costs are plateauing across the province due to a relatively stable market, it may be
safe to assume that the market could achieve better efficiency and lower costs had these issues
not arisen.
As noted above, however, there are several advantages generated by the current market reality
in Quebec, including labour retention within the province, as well as their levels of skill and
training.
Emerging Trends
The interviewees noted that current trends are not directly affected by, and do not directly affect,
construction costs in the province.
North Dakota
Cost Drivers
Key cost drivers identified by interviewees from North Dakota are outlined below.
Labour
Labour is indicated as the most significant cost driver in North Dakota, as noted by
interviewees. Similar to Saskatchewan, shortages are being experienced across all types of
labour, both skilled and unskilled.
One interviewee noted that collective bargaining contracts in the construction sector in the
state settled on increases of 5-6% annually. This wage increase is nearly three times the
industry average in the United States of approximately 2% annually.
Construction Demand
North Dakota is currently leading the United States in economic growth, which is having a
significant impact on construction demand. Key sectors driving growth include natural
resources (oil and gas) and agriculture, which are both heavily dependent on appropriate
infrastructure.
In addition to economic growth, the state is experiencing population growth and with it
demand for additional municipal and social infrastructure.
Labour Accommodation
The rapid pace of growth being experienced in the state has resulted in a shortage of housing
and accommodations to support a growing workforce. This shortage is believed to be driving
increased non-residential construction mobilization and overhead costs, as employers are
forced to consider various alternatives to secure suitable accommodations – such as
KPMG CONFIDENTIAL
60
purchasing apartment complexes, renting campers or RVs during the warmer seasons, and
paying higher per diems and housing subsidies to reflect higher market costs. One
interviewee noted that Williston North Dakota was recently reported as having the highest
rental rates in the nation based on a study of rental rates across the United States.
Impacts
According to interviewees, construction costs are not believed to be resulting in project delays or
cancellations in North Dakota.
Emerging Trends
Construction demand and labour supply challenges are believed to be trends that will continue in
the foreseeable future, given the strong economic prospects of the state of North Dakota.
Assuming that no major policy changes are made that may impact these key sectors (such as
environmental policies related to hydraulic fracking) the interviewees believed that labour will
remain the primary factor driving construction cost increases, even as housing and
accommodations in the state improve.
KPMG CONFIDENTIAL
The information contained herein is of a general nature and is not intended to address the
circumstances of any particular individual or entity. Although we endeavour to provide
accurate and timely information, there can be no guarantee that such information is
accurate as of the date it is received or that it will continue to be accurate in the future. No
one should act on such information without appropriate professional advice after a thorough
examination of the particular situation.
© 2013 KPMG LLP, a Canadian limited liability partnership and a member firm of the KPMG
network of independent member firms affiliated with KPMG International Cooperative
(“KPMG International”), a Swiss entity. All rights reserved.
The KPMG name, logo and “cutting through complexity” are registered trademarks or
trademarks of KPMG International Cooperative (“KPMG International”).
Contact us
David Belof
Management Consulting
T (306) 791-1226
Gary Webster
Infrastructure Advisory
T +1 604 646 6367
Stuart MacKay
MMK Consulting
T (604) 484-4621
kpmg.ca

Recommended