Sampling Distributions and Hypothesis Testing
2
Major Points
An example Sampling distribution Hypothesis testing
The null hypothesis Test statistics and their distributions The normal distribution and testing
Important concepts
3
The chance that something can happen may depend on…
Fate Probability Gambling Error Likelihood Expected variability in a sample
4
Media Violence
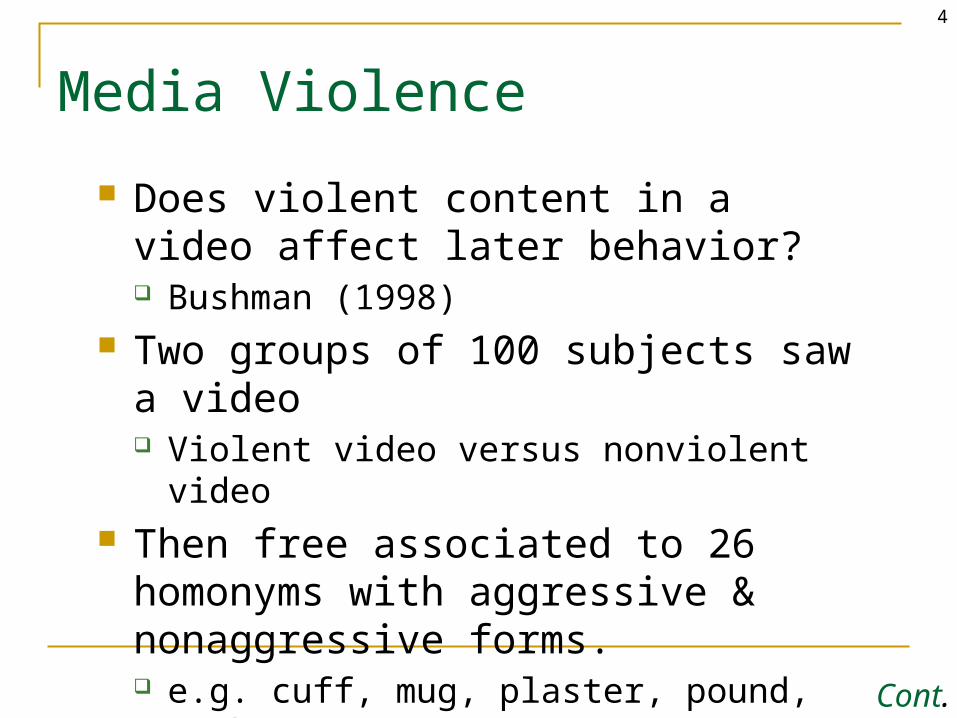
Does violent content in a video affect later behavior? Bushman (1998)
Two groups of 100 subjects saw a video Violent video versus nonviolent video
Then free associated to 26 homonyms with aggressive & nonaggressive forms. e.g. cuff, mug, plaster, pound, sock
Cont.
5
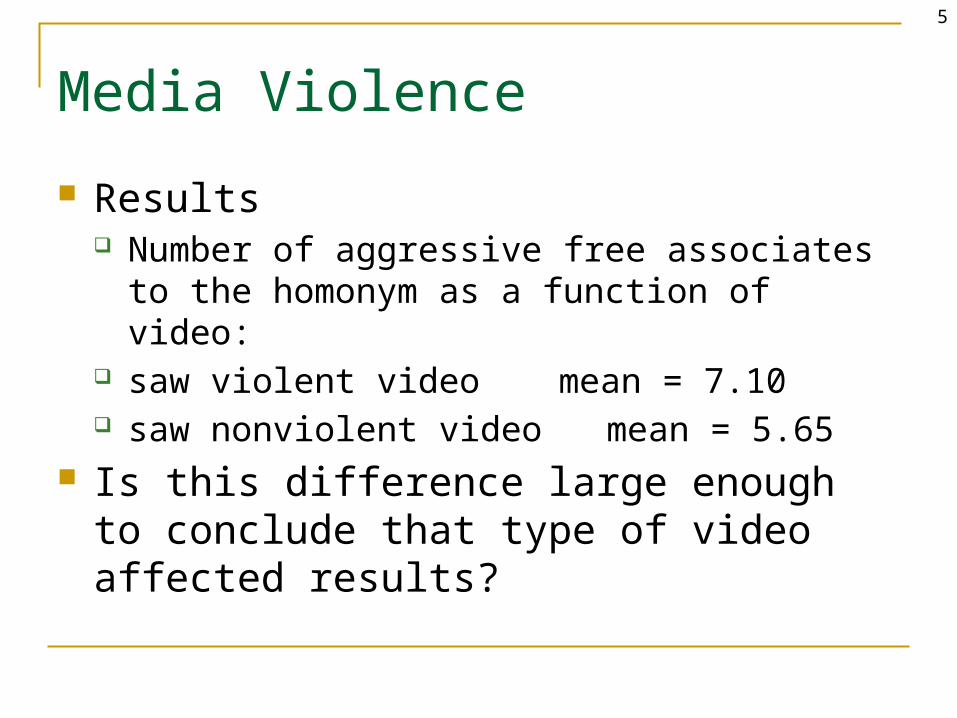
Media Violence
Results Number of aggressive free associates to the
homonym as a function of video: saw violent video mean = 7.10 saw nonviolent video mean = 5.65
Is this difference large enough to conclude that type of video affected results?
6
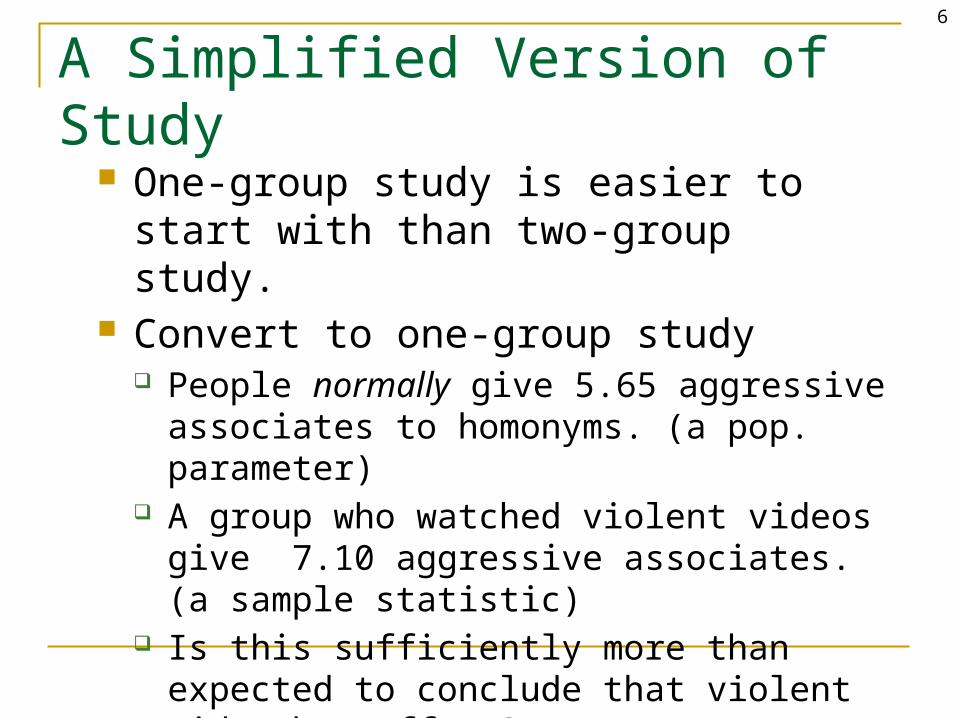
A Simplified Version of Study One-group study is easier to start with
than two-group study. Convert to one-group study
People normally give 5.65 aggressive associates to homonyms. (a pop. parameter)
A group who watched violent videos give 7.10 aggressive associates. (a sample statistic)
Is this sufficiently more than expected to conclude that violent video has effect?
7
What is the Question?
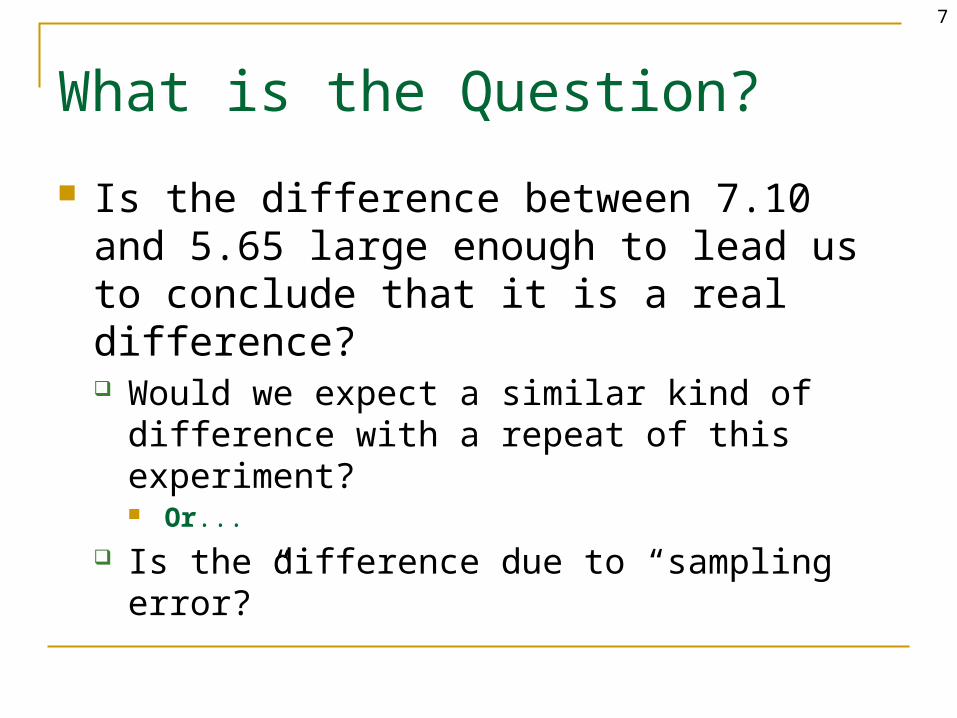
Is the difference between 7.10 and 5.65 large enough to lead us to conclude that it is a real difference? Would we expect a similar kind of difference with
a repeat of this experiment? Or...
Is the difference due to “sampling error?”

8
Sampling Error = variability due to chance The normal variability that we would expect
to find from one sample to another, or one study to another
Random variability among observations or statistics that is just due to chance
9
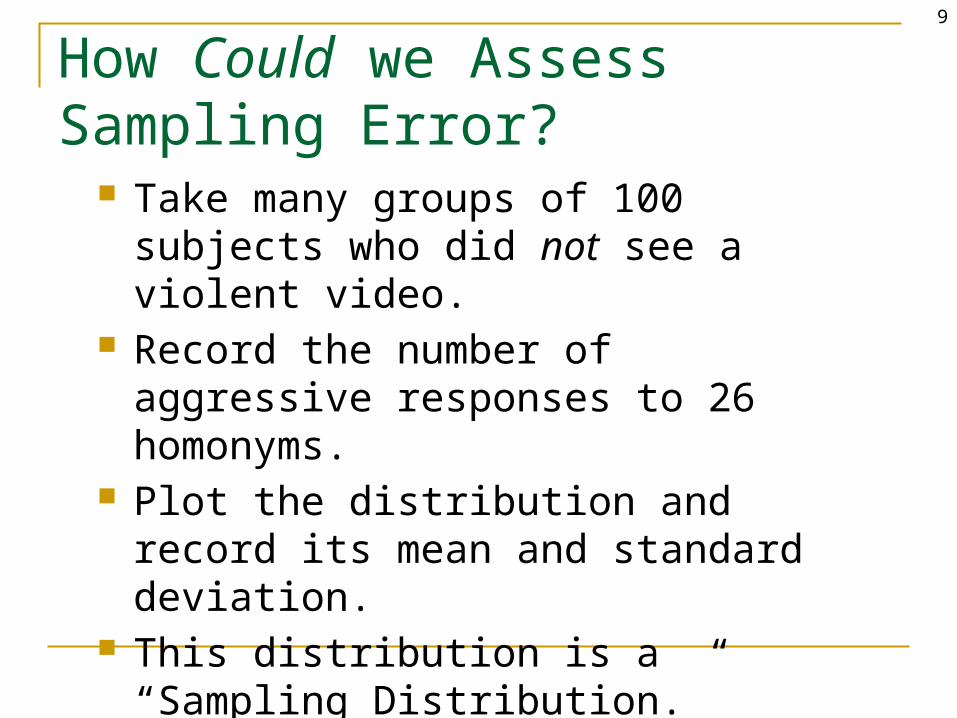
How Could we Assess Sampling Error?
Take many groups of 100 subjects who did not see a violent video.
Record the number of aggressive responses to 26 homonyms.
Plot the distribution and record its mean and standard deviation.
This distribution is a “Sampling Distribution.”
10
Sampling Distribution
The distribution of a statistic over repeated sampling from a specified population.
Possible result for this example. See next slide. Shows the kinds of means we expect to find when
people don’t view a violent video.
11
Mean Number Aggressive Associates
7.257.00
6.756.50
6.256.00
5.755.50
5.255.00
4.754.50
4.254.00
3.75
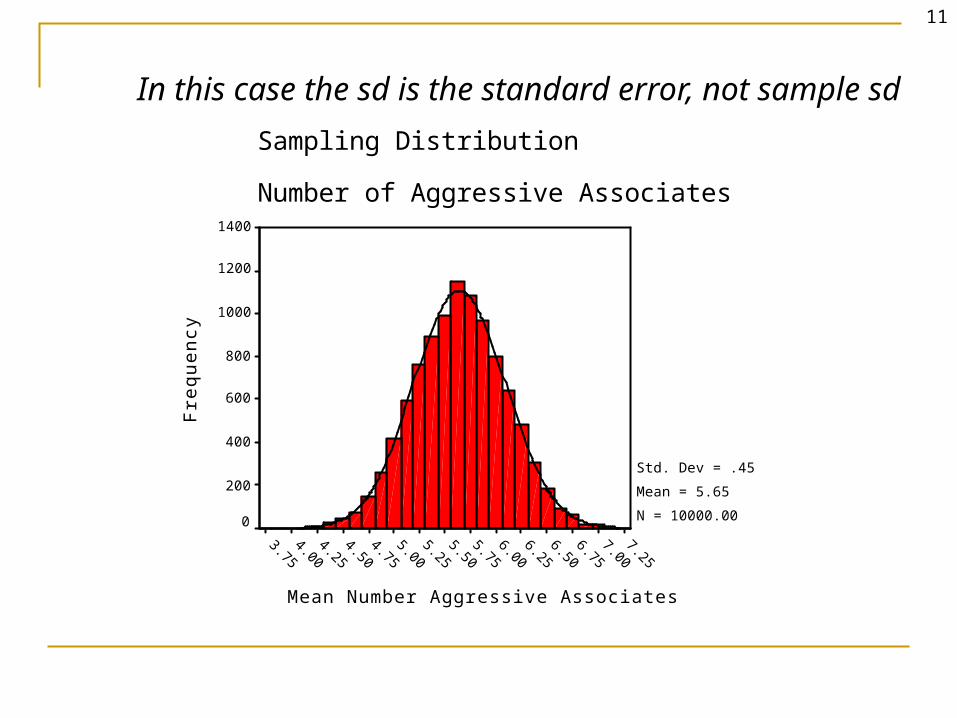
Sampling Distribution
Number of Aggressive AssociatesF
req
ue
nc
y
1400
1200
1000
800
600
400
200
0
Std. Dev = .45
Mean = 5.65
N = 10000.00
In this case the sd is the standard error, not sample sd
12
What Do We Conclude?
When people don’t view violent video, they average between about 4.5 and 6.5 aggressive interpretations of homonyms.
Our violent video group averaged 7.10 aggressive interpretations. Our subjects’ responses were not like normal.
Conclude that the violent video increased aggressive associations.
13
Hypothesis Testing A formal way of doing what we just did, compare sample statistic to
population parameters State research question Assumptions Null and Alternative Hypotheses Sampling Distribution of Test Statistic Decision Rule Sample and Test Statistic Decision
Start with hypothesis that subjects are normal. The null hypothesis:
The is no difference…. There is no association….
Find what normal subjects do. Compare our subjects to that standard.
14
The Null Hypothesis
The hypothesis that our subjects came from a population of normal responders.
The hypothesis that watching a violent video does not change mean number of aggressive interpretations.
The hypothesis we usually want to reject.
15Chapter 8 Sampling Distributions
Steps in Hypothesis Testing condensed: p. 151 Define the null hypothesis. (because we can rarely
test the research H) Sample and decide what you would expect to find if
the null hypothesis were true (given random sampling, what is the sampling distribution).
Look at what you actually found and compare to the sampling distribution. What’s the probability of getting that statistic by chance?
Reject the null if what you found is not what you expected given the sampling distribution.

16
Important Concepts
Concepts critical to hypothesis testing Decision Type I error Type II error Critical values One- and two-tailed tests
17
Decisions
When we test a hypothesis we draw a conclusion; either correct or incorrect. Type I error
Reject the null hypothesis when it is actually correct. Type II error
Retain the null hypothesis when it is actually false.
18
Type I Errors
Assume violent videos really have no effect on associations
Assume we conclude that they do. This is a Type I error
Probability set at alpha () usually at .05
Therefore, probability of Type I error = .05
19
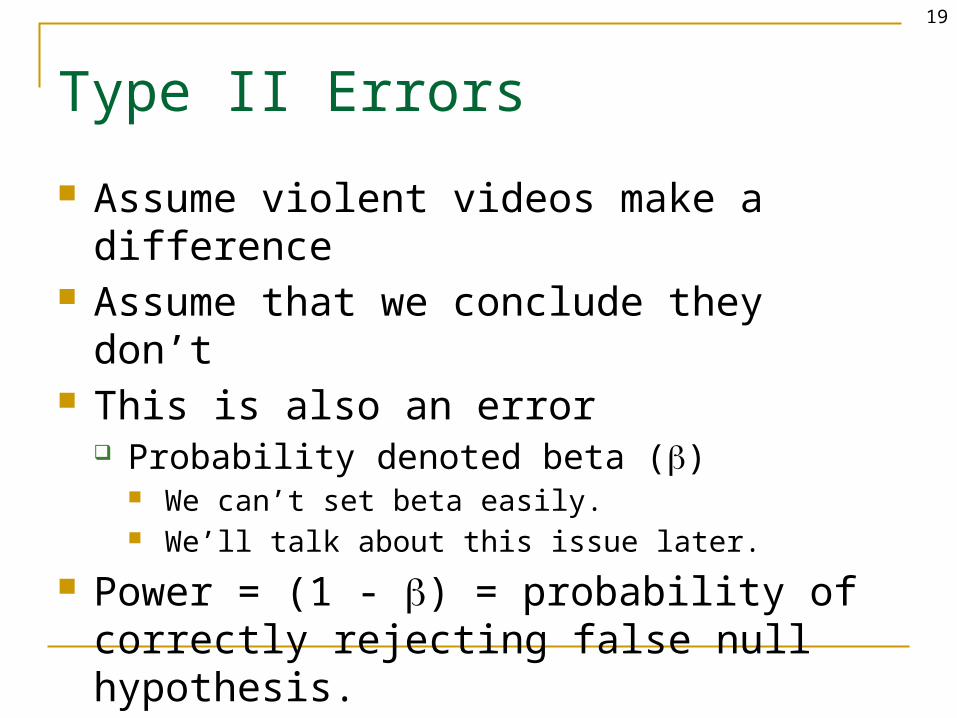
Type II Errors
Assume violent videos make a difference Assume that we conclude they don’t This is also an error
Probability denoted beta () We can’t set beta easily. We’ll talk about this issue later.
Power = (1 - ) = probability of correctly rejecting false null hypothesis.
20
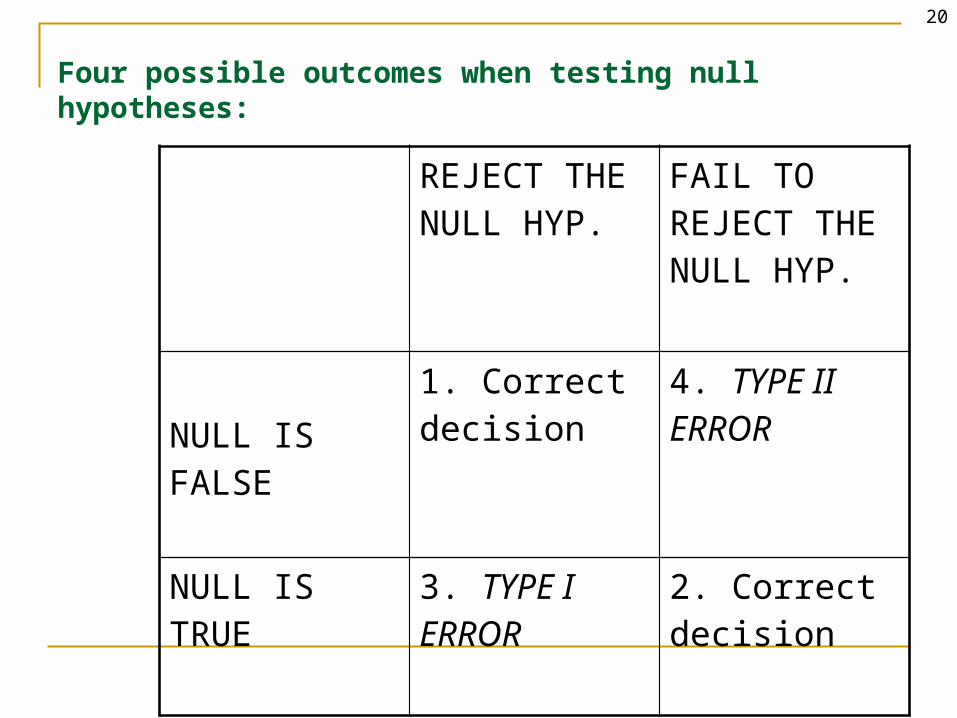
REJECT THE NULL HYP.
FAIL TO REJECT THE NULL HYP.
NULL IS FALSE
1. Correct decision
4. TYPE II ERROR
NULL IS TRUE
3. TYPE I ERROR
2. Correct decision
Four possible outcomes when testing null hypotheses:
21
Critical Values
These represent the point at which we decide to reject null hypothesis.
e.g. We might decide to reject null when (p|null) < .05. Our test statistic has some value with p = .05 We reject when we exceed that value. That value is the critical value.
22
One- and Two-Tailed Tests
Two-tailed test rejects null when obtained value too extreme in either direction Decide on this before collecting data.
One-tailed test rejects null if obtained value is too low (or too high) We only set aside one direction for rejection.
Cont.
23
One- & Two-Tailed Example
One-tailed test Reject null if violent video group had too many
aggressive associates Probably wouldn’t expect “too few,” and therefore no
point guarding against it.
Two-tailed test Reject null if violent video group had an extreme
number of aggressive associates; either too many or too few.
24
Review Questions
Define a sampling distribution. How would you create sampling distribution
of mean number of aggressive associates if the null were true?
What is sampling error? What does sampling error have to do with all
of this?
Cont.

25
Review Questions--cont.
What are the steps in hypothesis testing? What is the probability we’d conclude violent
videos cause aggression if they really don’t? Distinguish between Type I and Type II
errors. Distinguish between one-tailed and two-tailed
tests.
Recommended