Employment and Unemployment in Egypt: Conventional Problems, Unconventional Remedies Samir Radwan Working Paper No. 70 August 2002
Samir Radwan is advisor to the Director General of the International Labor Organization. The author would like to express his gratitude to Ahmed Galal for his encouragement to write this paper, as well as for the insightful discussion during the “Employment and Unemployment in Egypt” conference held by ECES in January 2002. The author warmly acknowledges research assistance by Noha Sherif. The usual disclaimers apply.
ECES-WP70/ Radwan/ August 2002
Abstract
The debate on employment and unemployment in Egypt has been a major feature of public
policy for the last few years. With unemployment reaching double-digit figures, the social
actors have realized that it is time to confront the problem.
This paper argues that the implementation of unconventional policies and the creation of
institutions are necessary to achieve the objective of “full employment,” which has been
illusive so far. It makes case for a paradigm shift away from partial solutions to a coherent
plan of action. The three major components of this plan are: expansionary macroeconomic
policy, enhancing the productivity of the labor force, and the reform of the civil service. All,
of course, are subject to political will to design and implement a coherent and coordinated
policy that goes beyond temporary palliatives.
ملخص
أثارت قضية التشغيل والبطالة في مصر، خالل السنوات القليلة الماضية، جدال واسع النطاق بين واضعي
هذا، وقد أدى االرتفاع الملموس في معدالت البطالة مؤخرا إلى اقتناع األطراف الفاعلة . السياسة العامة للدولة
. بأن الوقت قد حان لمواجهة هذه المشكلة
، ترى هذه الدراسة ضرورة تبني سياسات وأطر مؤسسية غير تقليدية من أجل تحقيق وفي هذا السياق
أهمية التحول من كما تؤكد على . ، وهو الهدف الذي طالما شغل بال صانعي السياسات"التوظف الكامل"
اتباع سياسة كلية توسعية، : الحلول الجزئية إلى اتباع خطة عمل متكاملة تضم ثالثة عناصر رئيسية وهي
وفي النهاية، تشير هذه الورقة إلى أن نجاح هذه . وزيادة إنتاجية قوة العمل، وإصالح القطاع اإلداري الحكومي
ة السياسية لتصميم وتنفيذ سياسات متكاملة دون االعتماد على الخطة يتوقف في المقام األول على توافر اإلراد
.المسكنات المؤقتة
ECES-WP70/ Radwan/ August 2002
1
I. Introduction
The Egyptian Center for Economic Studies (ECES) has posed a challenge to revisit the
problem of employment and unemployment in Egypt. This is a conventional problem that has
occupied policy makers, academia, the media, and most importantly, every household in
Egypt. Yet it is a problem that continues to frustrate all. Thus, it is most fitting that ECES has
not only asked for a description of the problem and identification of its causes, but also to
“outline a clear strategy for dealing with job creation and reduction of unemployment.”
It is from this perspective that this paper will address a single issue: what determines the
economy’s ability to create sufficient employment to absorb the increase in the labor force
under decent conditions? This is the time-honored objective of “full employment,” addressed
notably by John Maynard Keynes after the Great Depression, which has come to center stage
as a result of the global downturn that began in 1999 and has been compounded by the impact
of the September 11 events. Leading economists are talking about the “return of depression
economics,” and creating employment has emerged at the top of the agenda of developed and
developing countries alike. The recent events in Argentina, the third largest economy in Latin
America, after Brazil and Mexico, provide sobering lessons to both economists and policy
makers. Despite the recent optimism about the performance of the global economy and the
slowdown that has begun to bottom out,1 there is concern that the volatility of the global
economy should leave no place for complacency and that better management in support of
robust growth on a world scale is badly needed.
Four years ago, the same issue was discussed in a paper entitled “Towards Full
Employment: Egypt in the 21st Century.” 2 The main conclusion was that Egypt was “at a
crossroads and sound choices must be made. The country must build upon the success of
stabilization and resumption of growth. Entering the 21st century, Egypt must take the ’high
road to growth’ with the objective of achieving full employment.” The paper outlined the
main elements of an “employment-intensive growth strategy,” and argued that such a strategy
was viable “provided a consistent and mutually reinforcing set of policies at the macro,
sectoral, and micro levels is implemented within the framework of an overall long-term
1 IMF (2002), World Economic Outlook, April. 2 Radwan, Samir (1998), “Towards Full Employment: Egypt in the 21st Century,” Distinguished Lecture Series no. 10, The Egyptian Center for Economic Studies.
ECES-WP70/ Radwan/ August 2002
2
strategy for sustainable growth with equitable distribution.” The assumption underlying such
optimism was that Egypt’s macroeconomic performance was bearing fruits on almost all
fronts: controlling inflation, reducing balance of payments and budget deficits, and
accumulating reserves; except one – employment creation. The prognosis was that, provided
economic reforms were deepened to sustain growth, policies and institutions needed to be put
in place in order to enhance the economy’s capacity for job creation. The focus was on
emergency employment schemes, skill formation and training, and strengthening labor market
institutions.3
By 2001, the objectives of “full employment” remained as illusive as ever and the
problem of unemployment rose to the top of the agenda for the country as a whole. Today, the
questions are: what has gone wrong and why; and how do we get out of this situation? The
purpose of this paper is to tackle these questions within the constraints impost by the
notorious lack of data on employment and unemployment.4 The basic argument is that while
the diagnosis of the problem and its causes are well-known, unconventional policies and
institutions are required if the present trends are to be reversed.
II. The Problem and its Dimensions
As mentioned earlier, the diagnosis of the problem of employment and unemployment is only
too well-known. This paper attempts to present the “stylized facts” in a way that will help
focus attention on areas for policy interventions. Parting with the traditional method of
providing detailed descriptions based on statistical artifacts which pretend the accuracy of
data, this paper makes a number of statements that in their totality provide a profile of the
problem.
Statement one: Labor force growth has outstripped the demand for labor
Demographic trends partly explain the increase in labor supply over demand. During 1988-
1998, the labor force increased at an average of 523,000 workers per year while according to
official estimates, employment increased by 435,000 on average, leaving a deficit of 88,000
3 For details see Radwan, Samir (2000), “Job Creation in Egypt: Some Strategic Orientations,” UNDP, Cairo, Egypt. 4 Researchers are indebted to the excellent efforts by ERF for making available a compendium of comparative data based on the 1988 Labor Force Sample Survey and the 1998 Labor Market Survey prepared by Ragui Assaad.
ECES-WP70/ Radwan/ August 2002
3
workers annually to join the ranks of the unemployed. These trends are likely to continue in
the near future as the labor supply is forecast to grow at 2.6 percent for 2001–2010.5 For the
next ten years, the average number of new job seekers will increase to 638,000 per year
compared to the capacity of the Egyptian economy to create 435,000 jobs annually over the
last decade.
A more significant measure of labor supply should take into account the output of the
educational system, as well as the dropouts who join the labor market every year as job
seekers – an estimated 896,000 persons in 1999/2000.6 Assuming that the domestic economy
generates 435,000 jobs and that 90,000 migrate annually, the total labor absorption amounts
to only 58.6 percent of supply or a deficit of 371,000 jobs a year.
Statement two: Labor market imbalances account for labor surplus
A major characteristic of the Egyptian labor market has been the dislocation between supply
and demand. Educational and training systems continue to churn out graduates taking little or
no account of the actual demand for labor. An analysis of the results of a survey on expected
demand over 2001–20057 compared to the present structure of supply has revealed a number
of serious imbalances in the labor market, the most important of which are outlined below.
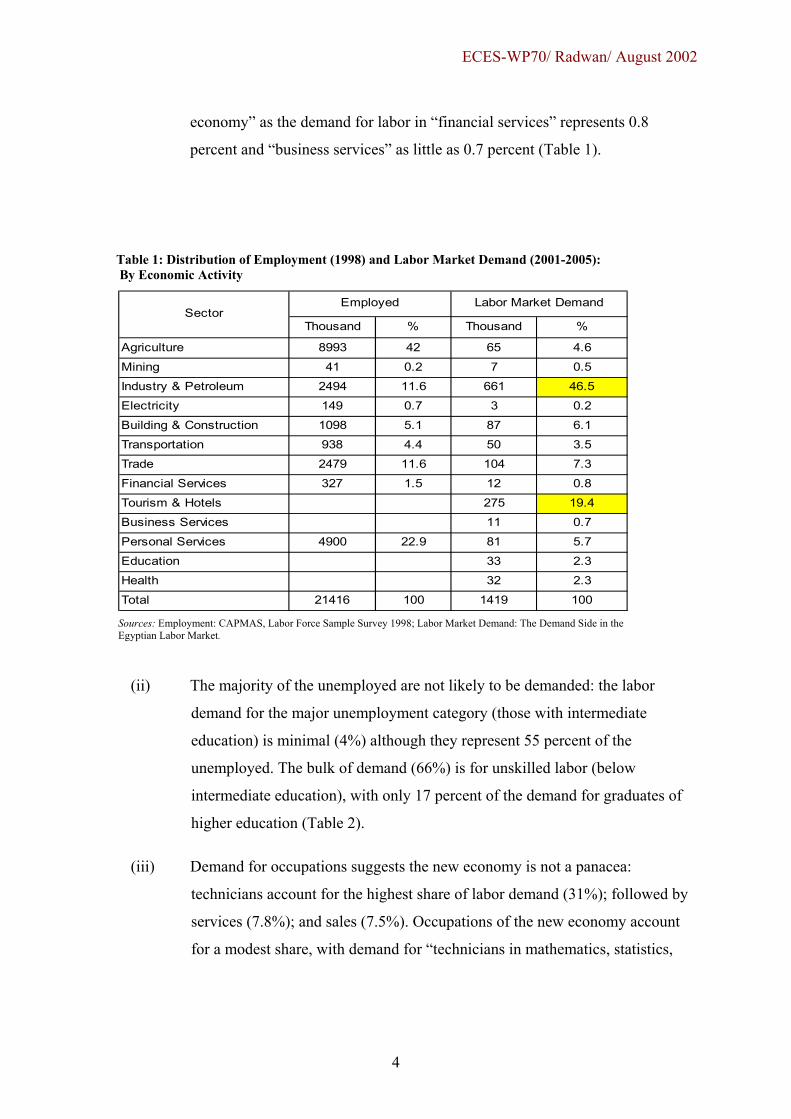
(i) Labor demand conforms to existing sectoral structure of employment:
agriculture, the main employer which provides 42 percent of the employed
with jobs, generates very little new demand (less than 5%); industry accounts
for the highest demand (46.5%); followed by services (28.1%); and trade
(7.3%). It is surprising that the construction sector accounts for 6.1 percent of
total new demand, which is almost equal to its share in employment (5.1%).
More surprising perhaps is the modest share of the sectors of the “new
5 World Bank (2001), Egypt, Social and Structural Review, p. 57. 6 The present government has to be credited for making the distinction between the demographic increase in labor supply and the actual increase by taking into account the total outputs from the educational system, plus dropouts, minus those who opt voluntarily out of the labor market, estimated at 20 percent of female graduates; see Tarek Noueir (2001), “Estimating the Volume of New Entrants to the Labor Market for 1998/99,” IDSC, Cairo, Egypt. 7 Prime Minister’s Office (2001), “The Demand Side in the Egyptian Labor Market,” June, Cairo, Egypt. This report is based on a survey, carried out by CAPMAS and financed by the Social Fund, covering 43,000 establishments employing 5 and more persons outside government, but includes a 20 percent sample of the informal sector employing 5-9 persons.
ECES-WP70/ Radwan/ August 2002
4
economy” as the demand for labor in “financial services” represents 0.8
percent and “business services” as little as 0.7 percent (Table 1).
Table 1: Distribution of Employment (1998) and Labor Market Demand (2001-2005): By Economic Activity
Sources: Employment: CAPMAS, Labor Force Sample Survey 1998; Labor Market Demand: The Demand Side in the Egyptian Labor Market.
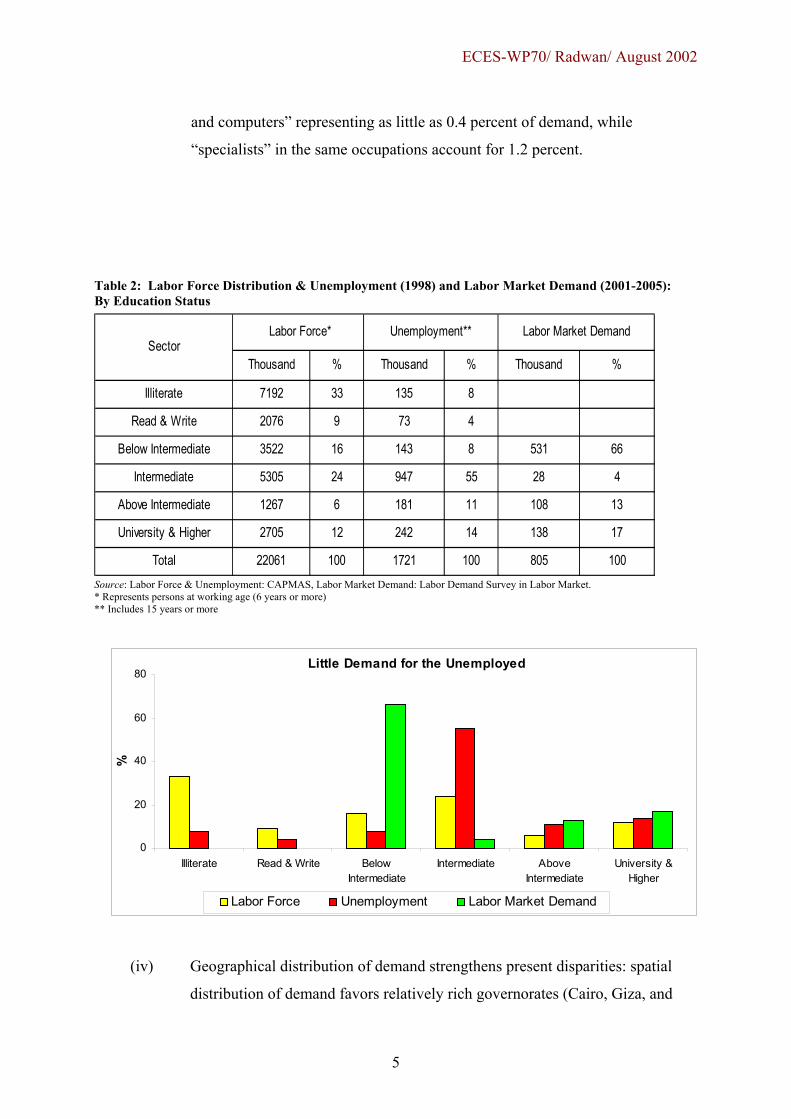
(ii) The majority of the unemployed are not likely to be demanded: the labor
demand for the major unemployment category (those with intermediate
education) is minimal (4%) although they represent 55 percent of the
unemployed. The bulk of demand (66%) is for unskilled labor (below
intermediate education), with only 17 percent of the demand for graduates of
higher education (Table 2).
(iii) Demand for occupations suggests the new economy is not a panacea:
technicians account for the highest share of labor demand (31%); followed by
services (7.8%); and sales (7.5%). Occupations of the new economy account
for a modest share, with demand for “technicians in mathematics, statistics,
Thousand % Thousand %
Agriculture 8993 42 65 4.6
Mining 41 0.2 7 0.5
Industry & Petroleum 2494 11.6 661 46.5
Electricity 149 0.7 3 0.2
Building & Construction 1098 5.1 87 6.1
Transportation 938 4.4 50 3.5
Trade 2479 11.6 104 7.3
Financial Services 327 1.5 12 0.8
Tourism & Hotels 275 19.4
Business Services 11 0.7
Personal Services 4900 22.9 81 5.7
Education 33 2.3
Health 32 2.3
Total 21416 100 1419 100
Employed Labor Market DemandSector
ECES-WP70/ Radwan/ August 2002
5
and computers” representing as little as 0.4 percent of demand, while
“specialists” in the same occupations account for 1.2 percent.
Table 2: Labor Force Distribution & Unemployment (1998) and Labor Market Demand (2001-2005): By Education Status
Source: Labor Force & Unemployment: CAPMAS, Labor Market Demand: Labor Demand Survey in Labor Market. * Represents persons at working age (6 years or more) ** Includes 15 years or more
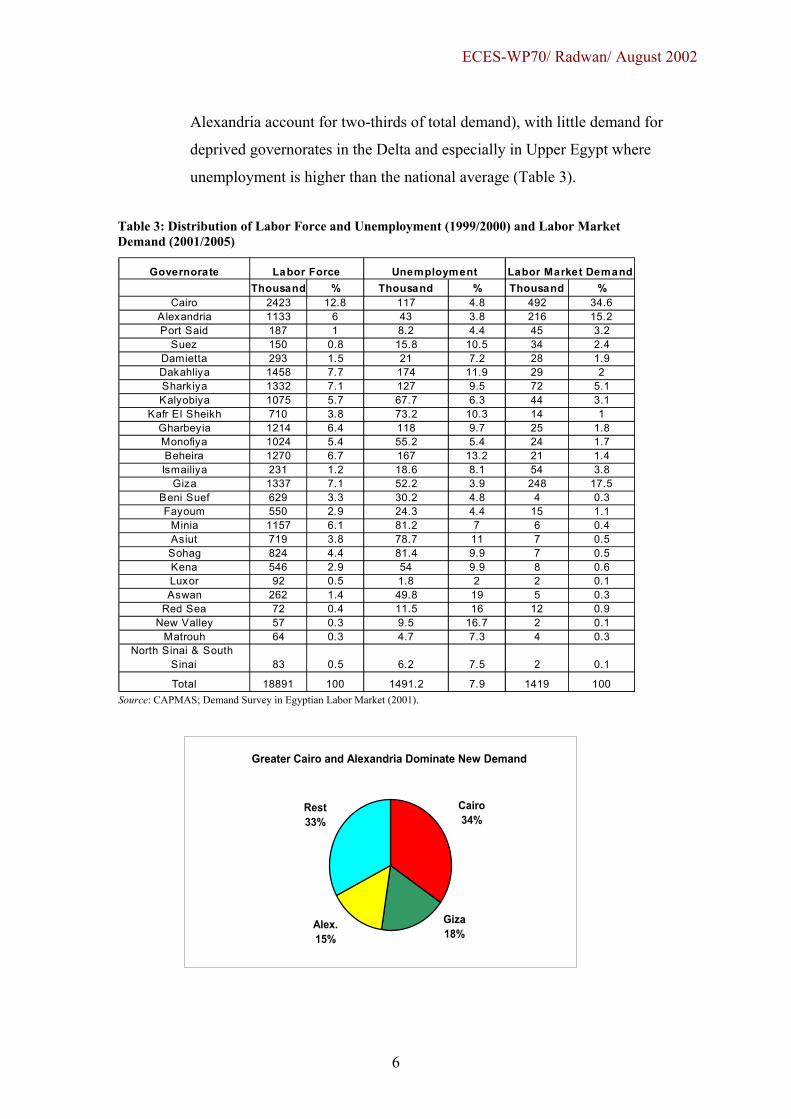
(iv) Geographical distribution of demand strengthens present disparities: spatial
distribution of demand favors relatively rich governorates (Cairo, Giza, and
Thousand % Thousand % Thousand %
Illiterate 7192 33 135 8
Read & Write 2076 9 73 4
Below Intermediate 3522 16 143 8 531 66
Intermediate 5305 24 947 55 28 4
Above Intermediate 1267 6 181 11 108 13
University & Higher 2705 12 242 14 138 17
Total 22061 100 1721 100 805 100
Sector Labor Force* Unemployment** Labor Market Demand
Little Demand for the Unemployed
0
20
40
60
80
Illiterate Read & Write BelowIntermediate
Intermediate AboveIntermediate
University &Higher
%
Labor Force Unemployment Labor Market Demand
ECES-WP70/ Radwan/ August 2002
6
Alexandria account for two-thirds of total demand), with little demand for
deprived governorates in the Delta and especially in Upper Egypt where
unemployment is higher than the national average (Table 3).
Table 3: Distribution of Labor Force and Unemployment (1999/2000) and Labor Market Demand (2001/2005)
Source: CAPMAS; Demand Survey in Egyptian Labor Market (2001).
Greater Cairo and Alexandria Dominate New Demand
Alex.15%
Cairo34%
Rest33%
Giza18%
GovernorateThousand % Thousand % Thousand %
Cairo 2423 12.8 117 4.8 492 34.6Alexandria 1133 6 43 3.8 216 15.2Port Said 187 1 8.2 4.4 45 3.2
Suez 150 0.8 15.8 10.5 34 2.4Damietta 293 1.5 21 7.2 28 1.9Dakahliya 1458 7.7 174 11.9 29 2Sharkiya 1332 7.1 127 9.5 72 5.1Kalyobiya 1075 5.7 67.7 6.3 44 3.1
Kafr El Sheikh 710 3.8 73.2 10.3 14 1Gharbeyia 1214 6.4 118 9.7 25 1.8Monofiya 1024 5.4 55.2 5.4 24 1.7Beheira 1270 6.7 167 13.2 21 1.4Ismailiya 231 1.2 18.6 8.1 54 3.8
Giza 1337 7.1 52.2 3.9 248 17.5Beni Suef 629 3.3 30.2 4.8 4 0.3Fayoum 550 2.9 24.3 4.4 15 1.1
Minia 1157 6.1 81.2 7 6 0.4Asiut 719 3.8 78.7 11 7 0.5Sohag 824 4.4 81.4 9.9 7 0.5Kena 546 2.9 54 9.9 8 0.6Luxor 92 0.5 1.8 2 2 0.1Aswan 262 1.4 49.8 19 5 0.3
Red Sea 72 0.4 11.5 16 12 0.9New Valley 57 0.3 9.5 16.7 2 0.1
Matrouh 64 0.3 4.7 7.3 4 0.3North Sinai & South
Sinai 83 0.5 6.2 7.5 2 0.1
Total 18891 100 1491.2 7.9 1419 100
Labor Market DemandLabor Force Unemployment
ECES-WP70/ Radwan/ August 2002
7
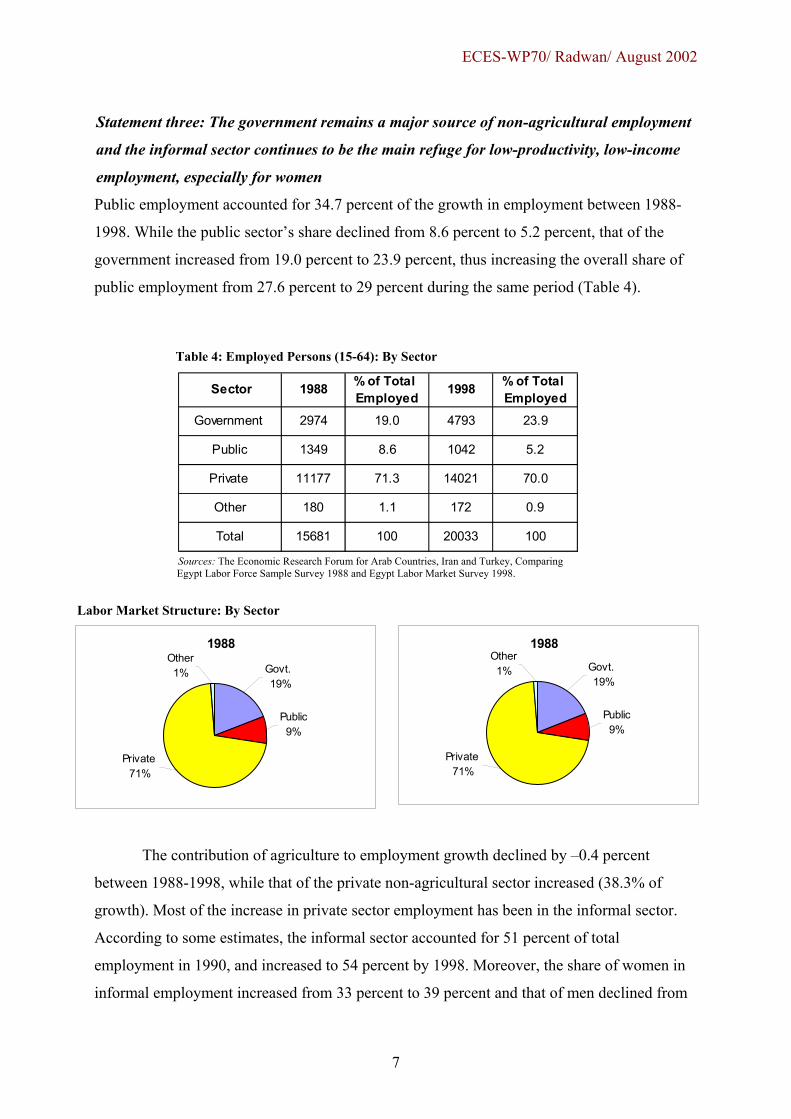
Statement three: The government remains a major source of non-agricultural employment
and the informal sector continues to be the main refuge for low-productivity, low-income
employment, especially for women
Public employment accounted for 34.7 percent of the growth in employment between 1988-
1998. While the public sector’s share declined from 8.6 percent to 5.2 percent, that of the
government increased from 19.0 percent to 23.9 percent, thus increasing the overall share of
public employment from 27.6 percent to 29 percent during the same period (Table 4).
Table 4: Employed Persons (15-64): By Sector
Sources: The Economic Research Forum for Arab Countries, Iran and Turkey, Comparing Egypt Labor Force Sample Survey 1988 and Egypt Labor Market Survey 1998.
Labor Market Structure: By Sector
The contribution of agriculture to employment growth declined by –0.4 percent
between 1988-1998, while that of the private non-agricultural sector increased (38.3% of
growth). Most of the increase in private sector employment has been in the informal sector.
According to some estimates, the informal sector accounted for 51 percent of total
employment in 1990, and increased to 54 percent by 1998. Moreover, the share of women in
informal employment increased from 33 percent to 39 percent and that of men declined from
Sector 1988 % of Total Employed
1998 % of Total Employed
Government 2974 19.0 4793 23.9
Public 1349 8.6 1042 5.2
Private 11177 71.3 14021 70.0
Other 180 1.1 172 0.9
Total 15681 100 20033 100
1988
Public9%
Govt. 19%
Private 71%
Other1%
1988
Public9%
Govt. 19%
Private 71%
Other1%
ECES-WP70/ Radwan/ August 2002
8
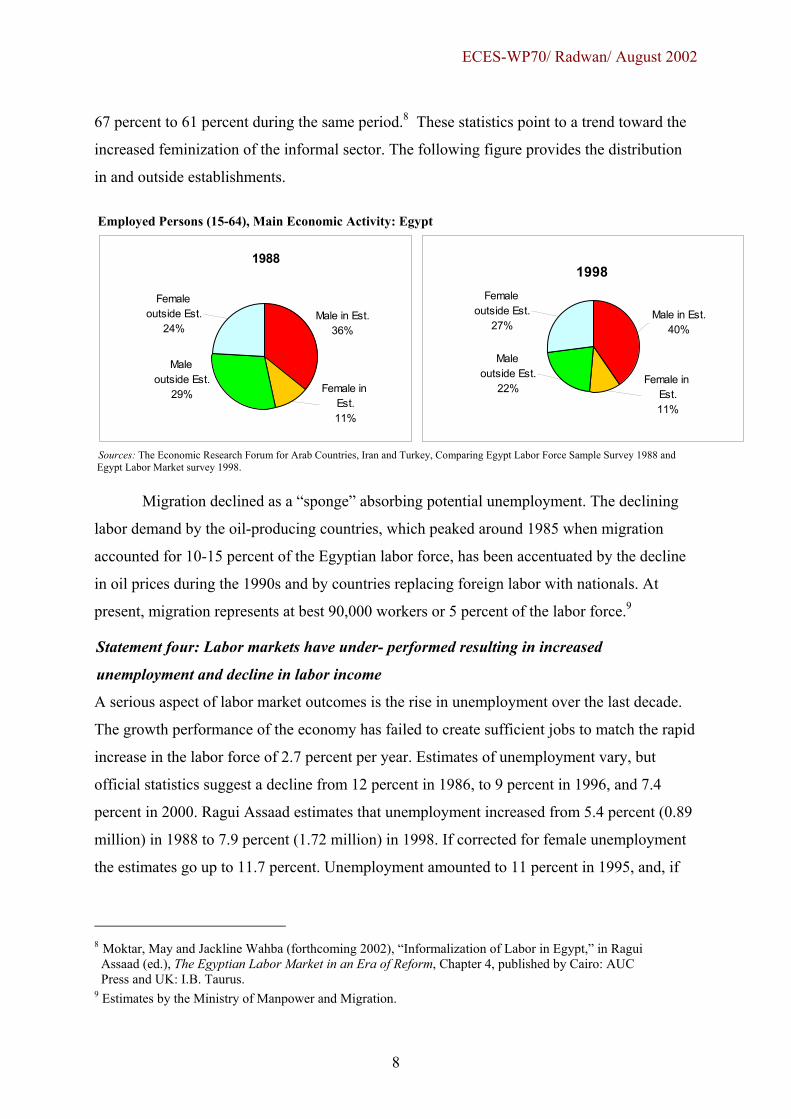
67 percent to 61 percent during the same period.8 These statistics point to a trend toward the
increased feminization of the informal sector. The following figure provides the distribution
in and outside establishments.
Employed Persons (15-64), Main Economic Activity: Egypt
Sources: The Economic Research Forum for Arab Countries, Iran and Turkey, Comparing Egypt Labor Force Sample Survey 1988 and Egypt Labor Market survey 1998.
Migration declined as a “sponge” absorbing potential unemployment. The declining
labor demand by the oil-producing countries, which peaked around 1985 when migration
accounted for 10-15 percent of the Egyptian labor force, has been accentuated by the decline
in oil prices during the 1990s and by countries replacing foreign labor with nationals. At
present, migration represents at best 90,000 workers or 5 percent of the labor force.9
Statement four: Labor markets have under- performed resulting in increased
unemployment and decline in labor income
A serious aspect of labor market outcomes is the rise in unemployment over the last decade.
The growth performance of the economy has failed to create sufficient jobs to match the rapid
increase in the labor force of 2.7 percent per year. Estimates of unemployment vary, but
official statistics suggest a decline from 12 percent in 1986, to 9 percent in 1996, and 7.4
percent in 2000. Ragui Assaad estimates that unemployment increased from 5.4 percent (0.89
million) in 1988 to 7.9 percent (1.72 million) in 1998. If corrected for female unemployment
the estimates go up to 11.7 percent. Unemployment amounted to 11 percent in 1995, and, if
8 Moktar, May and Jackline Wahba (forthcoming 2002), “Informalization of Labor in Egypt,” in Ragui Assaad (ed.), The Egyptian Labor Market in an Era of Reform, Chapter 4, published by Cairo: AUC Press and UK: I.B. Taurus. 9 Estimates by the Ministry of Manpower and Migration.
1988
Male in Est.36%
Female in Est.11%
Female outside Est.
24%
Male outside Est.
29%
1998
Male in Est.40%
Male outside Est.
22%
Female outside Est.
27%
Female in Est.11%
ECES-WP70/ Radwan/ August 2002
9
corrected, to 14-15 percent or 2.5 million compared to 1.5 million reported by the 1996
census.10 Regardless of the estimates, the fact remains that unemployment is on the rise.
More relevant than the rates, especially in an economy dominated by informal employment, is
the profile of unemployment, the main salient features of which are:
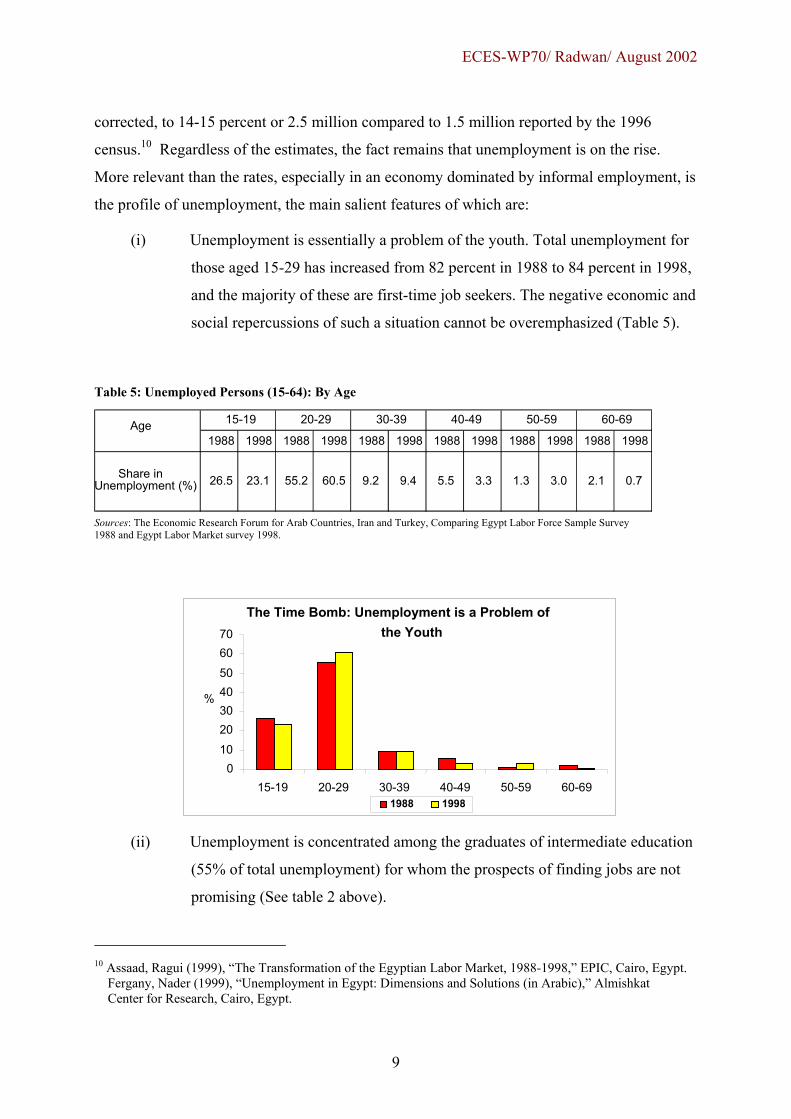
(i) Unemployment is essentially a problem of the youth. Total unemployment for
those aged 15-29 has increased from 82 percent in 1988 to 84 percent in 1998,
and the majority of these are first-time job seekers. The negative economic and
social repercussions of such a situation cannot be overemphasized (Table 5).
Table 5: Unemployed Persons (15-64): By Age
Sources: The Economic Research Forum for Arab Countries, Iran and Turkey, Comparing Egypt Labor Force Sample Survey 1988 and Egypt Labor Market survey 1998.
(ii) Unemployment is concentrated among the graduates of intermediate education
(55% of total unemployment) for whom the prospects of finding jobs are not
promising (See table 2 above).
10 Assaad, Ragui (1999), “The Transformation of the Egyptian Labor Market, 1988-1998,” EPIC, Cairo, Egypt. Fergany, Nader (1999), “Unemployment in Egypt: Dimensions and Solutions (in Arabic),” Almishkat Center for Research, Cairo, Egypt.
1988 1998 1988 1998 1988 1998 1988 1998 1988 1998 1988 1998
Share in Unemployment (%) 26.5 23.1 55.2 60.5 9.2 9.4 5.5 3.3 1.3 3.0 2.1 0.7
15-19 20-29 30-39 40-49Age 50-59 60-69
The Time Bomb: Unemployment is a Problem of the Youth
010
20304050
6070
15-19 20-29 30-39 40-49 50-59 60-69
%
1988 1998
ECES-WP70/ Radwan/ August 2002
10
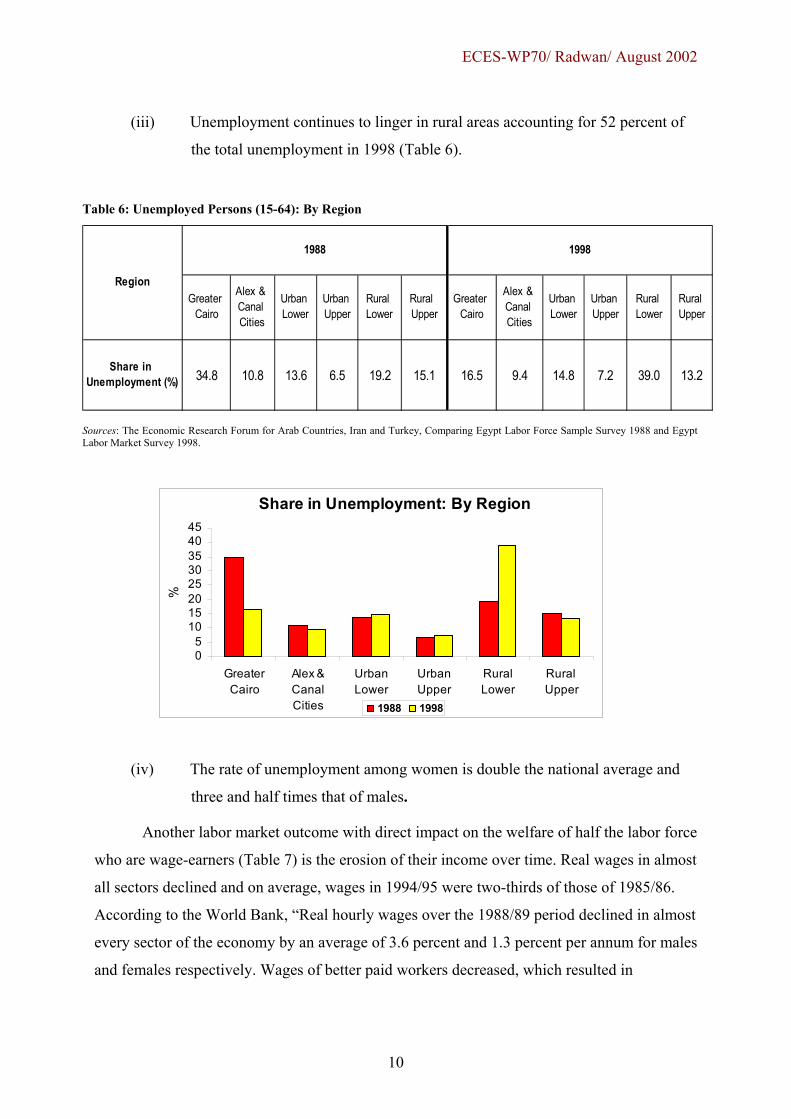
(iii) Unemployment continues to linger in rural areas accounting for 52 percent of
the total unemployment in 1998 (Table 6).
Table 6: Unemployed Persons (15-64): By Region
Sources: The Economic Research Forum for Arab Countries, Iran and Turkey, Comparing Egypt Labor Force Sample Survey 1988 and Egypt Labor Market Survey 1998.
(iv) The rate of unemployment among women is double the national average and
three and half times that of males.
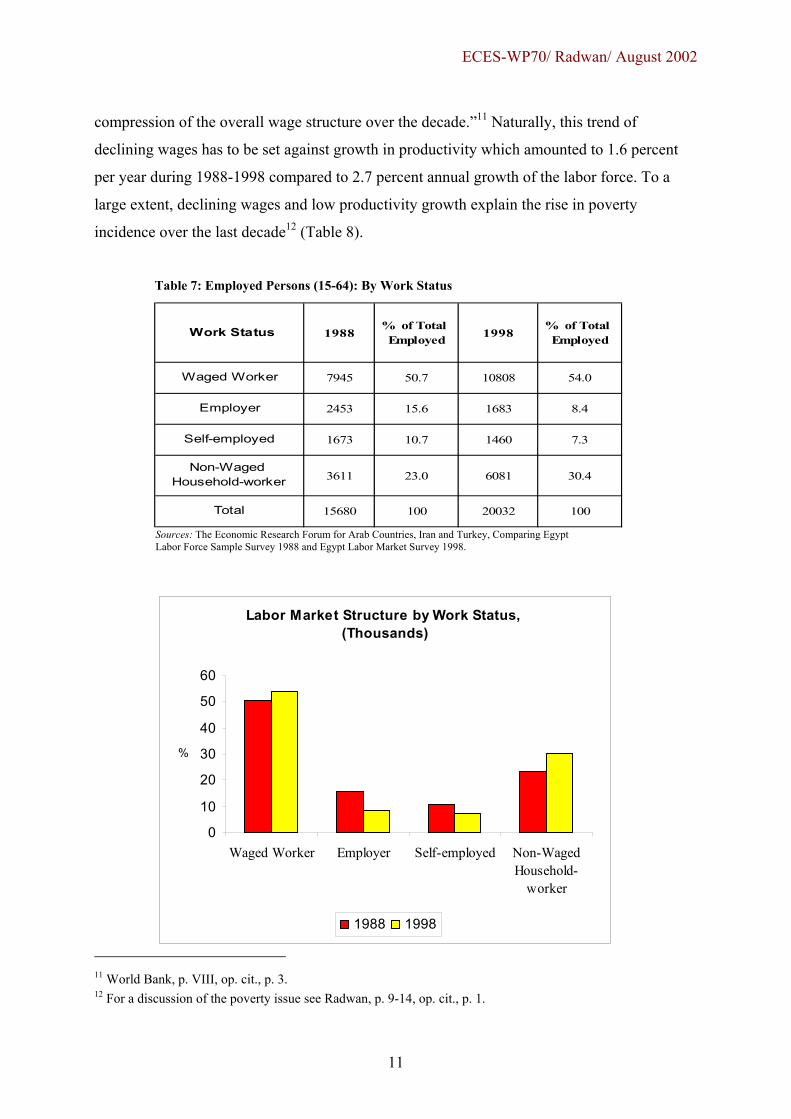
Another labor market outcome with direct impact on the welfare of half the labor force
who are wage-earners (Table 7) is the erosion of their income over time. Real wages in almost
all sectors declined and on average, wages in 1994/95 were two-thirds of those of 1985/86.
According to the World Bank, “Real hourly wages over the 1988/89 period declined in almost
every sector of the economy by an average of 3.6 percent and 1.3 percent per annum for males
and females respectively. Wages of better paid workers decreased, which resulted in
Greater Cairo
Alex & Canal Cities
Urban Lower
Urban Upper
Rural Lower
Rural Upper
Greater Cairo
Alex & Canal Cities
Urban Lower
Urban Upper
Rural Lower
Rural Upper
Share in Unemployment (%) 34.8 10.8 13.6 6.5 19.2 15.1 16.5 9.4 14.8 7.2 39.0 13.2
1988 1998
Region
Share in Unemployment: By Region
05
1015202530354045
GreaterCairo
Alex &CanalCities
UrbanLower
UrbanUpper
RuralLower
Rural Upper
%
1988 1998
ECES-WP70/ Radwan/ August 2002
11
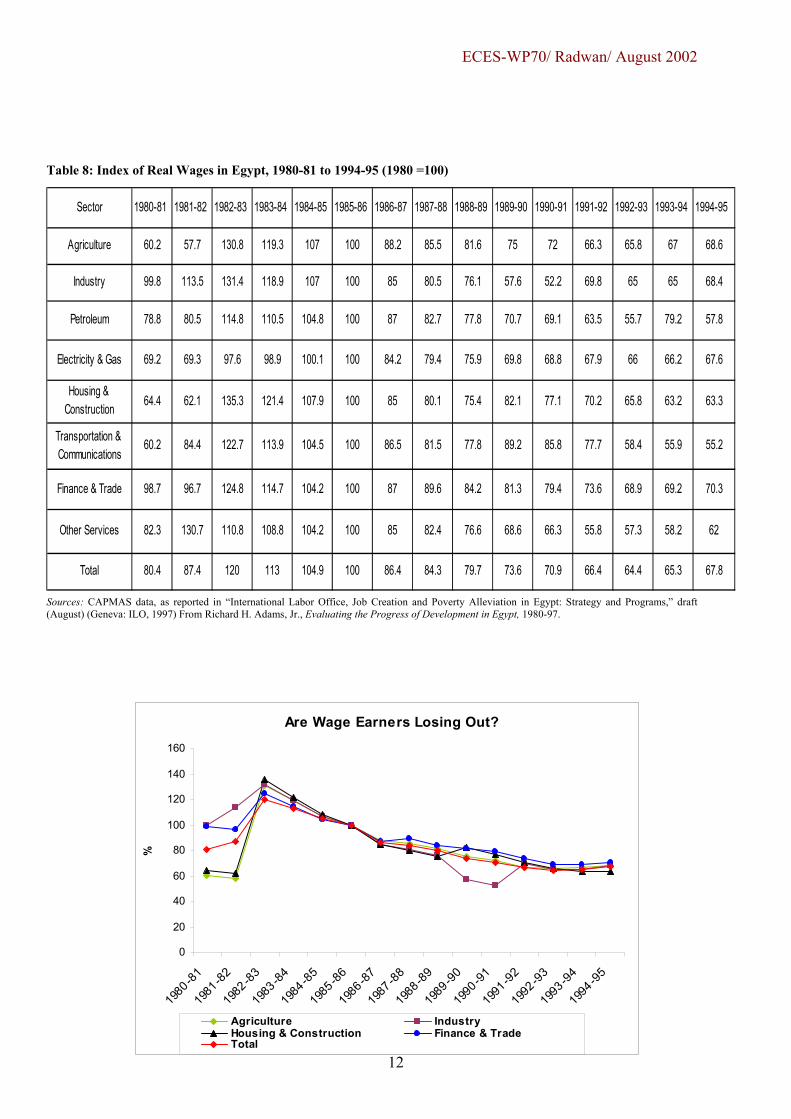
compression of the overall wage structure over the decade.”11 Naturally, this trend of
declining wages has to be set against growth in productivity which amounted to 1.6 percent
per year during 1988-1998 compared to 2.7 percent annual growth of the labor force. To a
large extent, declining wages and low productivity growth explain the rise in poverty
incidence over the last decade12 (Table 8).
Table 7: Employed Persons (15-64): By Work Status
Sources: The Economic Research Forum for Arab Countries, Iran and Turkey, Comparing Egypt Labor Force Sample Survey 1988 and Egypt Labor Market Survey 1998.
11 World Bank, p. VIII, op. cit., p. 3. 12 For a discussion of the poverty issue see Radwan, p. 9-14, op. cit., p. 1.
Work Status 1988% of Total Employed 1998
% of Total Employed
Waged Worker 7945 50.7 10808 54.0
Employer 2453 15.6 1683 8.4
Self-employed 1673 10.7 1460 7.3
Non-Waged Household-worker 3611 23.0 6081 30.4
Total 15680 100 20032 100
Labor Market Structure by Work Status, (Thousands)
0
10
20
30
40
50
60
Waged Worker Employer Self-employed Non-WagedHousehold-
worker
%
1988 1998
ECES-WP70/ Radwan/ August 2002
12
Table 8: Index of Real Wages in Egypt, 1980-81 to 1994-95 (1980 =100)
Sources: CAPMAS data, as reported in “International Labor Office, Job Creation and Poverty Alleviation in Egypt: Strategy and Programs,” draft (August) (Geneva: ILO, 1997) From Richard H. Adams, Jr., Evaluating the Progress of Development in Egypt, 1980-97.
Sector 1980-81 1981-82 1982-83 1983-84 1984-85 1985-86 1986-87 1987-88 1988-89 1989-90 1990-91 1991-92 1992-93 1993-94 1994-95
Agriculture 60.2 57.7 130.8 119.3 107 100 88.2 85.5 81.6 75 72 66.3 65.8 67 68.6
Industry 99.8 113.5 131.4 118.9 107 100 85 80.5 76.1 57.6 52.2 69.8 65 65 68.4
Petroleum 78.8 80.5 114.8 110.5 104.8 100 87 82.7 77.8 70.7 69.1 63.5 55.7 79.2 57.8
Electricity & Gas 69.2 69.3 97.6 98.9 100.1 100 84.2 79.4 75.9 69.8 68.8 67.9 66 66.2 67.6
Housing & Construction 64.4 62.1 135.3 121.4 107.9 100 85 80.1 75.4 82.1 77.1 70.2 65.8 63.2 63.3
Transportation & Communications
60.2 84.4 122.7 113.9 104.5 100 86.5 81.5 77.8 89.2 85.8 77.7 58.4 55.9 55.2
Finance & Trade 98.7 96.7 124.8 114.7 104.2 100 87 89.6 84.2 81.3 79.4 73.6 68.9 69.2 70.3
Other Services 82.3 130.7 110.8 108.8 104.2 100 85 82.4 76.6 68.6 66.3 55.8 57.3 58.2 62
Total 80.4 87.4 120 113 104.9 100 86.4 84.3 79.7 73.6 70.9 66.4 64.4 65.3 67.8
Are Wage Earners Losing Out?
0
20
40
60
80
100
120
140
160
1980
-81
1981
-82
1982
-83
1983
-84
1984
-85
1985
-86
1986
-87
1987
-88
1988
-89
1989
-90
1990
-91
1991
-92
1992
-93
1993
-94
1994
-95
%
Agriculture IndustryHousing & Construction Finance & TradeTotal
ECES-WP70/ Radwan/ August 2002
13
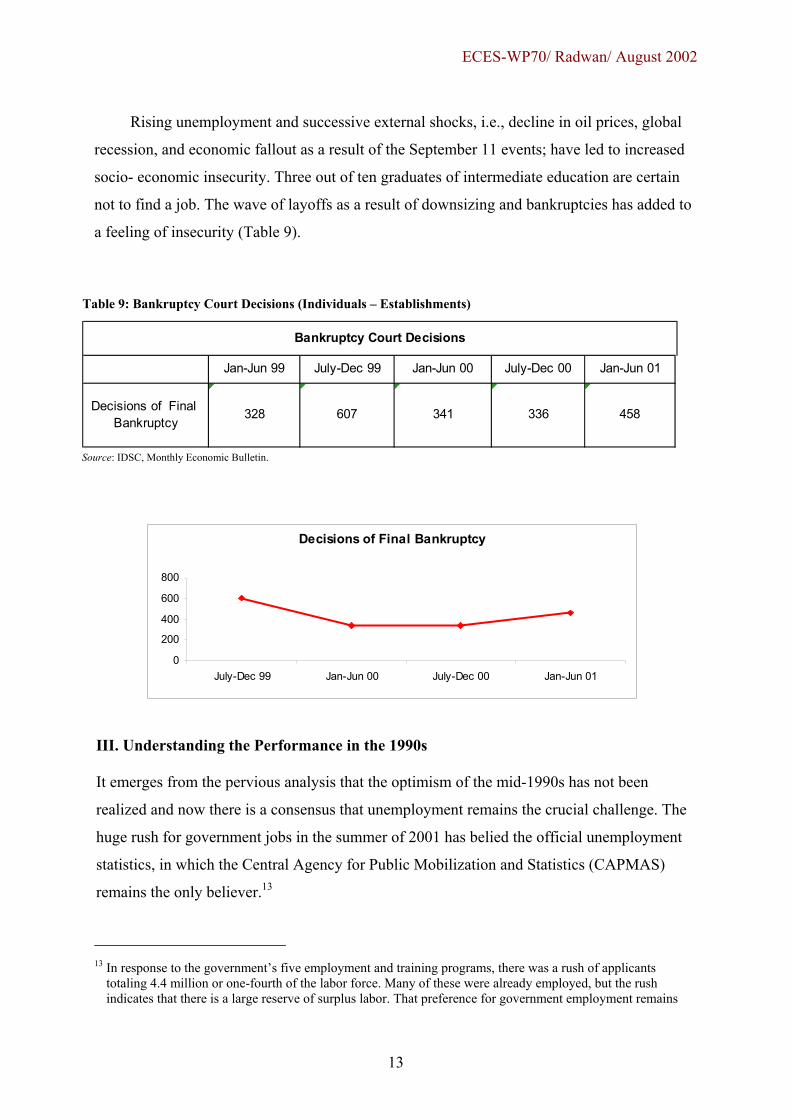
Rising unemployment and successive external shocks, i.e., decline in oil prices, global
recession, and economic fallout as a result of the September 11 events; have led to increased
socio- economic insecurity. Three out of ten graduates of intermediate education are certain
not to find a job. The wave of layoffs as a result of downsizing and bankruptcies has added to
a feeling of insecurity (Table 9).
Table 9: Bankruptcy Court Decisions (Individuals – Establishments)
Source: IDSC, Monthly Economic Bulletin.
III. Understanding the Performance in the 1990s It emerges from the pervious analysis that the optimism of the mid-1990s has not been
realized and now there is a consensus that unemployment remains the crucial challenge. The
huge rush for government jobs in the summer of 2001 has belied the official unemployment
statistics, in which the Central Agency for Public Mobilization and Statistics (CAPMAS)
remains the only believer.13
13 In response to the government’s five employment and training programs, there was a rush of applicants
totaling 4.4 million or one-fourth of the labor force. Many of these were already employed, but the rush indicates that there is a large reserve of surplus labor. That preference for government employment remains
Jan-Jun 99 July-Dec 99 Jan-Jun 00 July-Dec 00 Jan-Jun 01
Decisions of Final Bankruptcy
328 607 341 336 458
Bankruptcy Court Decisions
Decisions of Final Bankruptcy
0
200
400
600
800
July-Dec 99 Jan-Jun 00 July-Dec 00 Jan-Jun 01
ECES-WP70/ Radwan/ August 2002
14
The government is fully aware of this problem and since late 1999 the issue of
unemployment has been at the top of its agenda. The first “Government Program” stated that
all efforts should be directed at increasing incomes, sustaining this increase, ensuring equality
in its distribution, and creating maximum employment opportunities.”14 Since then, various
measures have been taken with this objective in mind. Basically, the government’s response
to the situation followed two tracks: (a) macroeconomic management focused mainly on
monetary and fiscal policies to achieve stability and protect the local currency; and (b)
launching an employment program to absorb the 896,000 new entrants to the labor market
though government jobs, training, Social Fund programs, local development, and the private
sector. Despite these efforts, the unemployment problem continues to vex policy makers and
society at large. Three sets of factors seem to be responsible for the present impasse:
(i) Slow economic growth: a recent IMF report summed up the situation as
follows: “During most of the 1990s, Egypt made considerable progress in
macroeconomic stabilization and structural reform. These advances
contributed to rising investment and stronger real GDP growth. In the late
1990s however, macroeconomic performance weakened as a result of a
combination of policy and external factors. On the policy side, credit growth
remained rapid and structural reform slowed, while measures of the fiscal
deficit were revised upward, though the deficit of the general government was
still low at the end of the decade. At the same time, tourism experienced a
temporary downturn, global financing tightened after the Asian crisis, and the
pound continued to appreciate as a result of the strengthening of the US dollar
to which it remained pegged. Together, these developments resulted in sizable
official reserve losses. Following monetary tightening in 1999/2000, private
credit slowed significantly from earlier sustainable rates. This helped stabilize
official reserves toward end-2000, but was associated with a marked
slowdown in economic growth from 5 percent based on official data in
1999/2000, to preliminary estimates in the 3-3.5 percent range for 2000/01.”15
popular, in many cases as some sort of social insurance. 14 The “Government Program” submitted by the Prime Minister to Parliament on December 18, 1999, p. 45. 15 World Bank (2001), “Egypt in Brief,” October, p. 2, at http:inweb18-worldbank.org/mena/mena.ns.
ECES-WP70/ Radwan/ August 2002
15
There is no doubt that external factors such as the global downturn and the impact of
September 11 have played a major role in triggering the present slowdown, but reliance on
contractionary monetary and fiscal policies must have added to their impact. Significant
leakage of potential investment through capital flight was also detrimental to growth
performance. Savings continued more or less at 21 percent of GDP, compared to 27-35
percent achieved in East Asian economies which was necessary to sustain growth. Moreover,
exports were still growing slower than expected, covering only 29 percent of imports on
average during 1990-2000. At the same time, export structure was still concentrated on a
single commodity – oil, which accounted for 36 percent of exports in 1999/2000 and
therefore, was too vulnerable to exogenous movements in price and production.
(ii) Domestic effective demand declined as a result of the general recession as well
as the wage compression noted earlier.
(iii) Labor productivity gains were modest growing by 1.4 percent per year during
1991-99.
To sum up, the response to the unfavorable internal and external factors has focused
on monetary and fiscal policies, as well as direct intervention in the labor market. While these
policies may buy time, they are not likely to provide long-term solutions to the problems of
growth and unemployment.
Slow economic growth, decline in effective demand, and low total factor productivity
(TFP) growth partially explain the regress in economic performance. A point worth making is
the behavior of the labor market in response to such a situation. Unlike previous periods, we
can not postulate that the public sector is the wage setter. There is a situation where public
employment continues to be the “reference base” where public sector jobs are regarded as
“employment of the last resort” or some sort of social safety net. This explains why public
sector employment continues to be attractive. Private sector employment remains relatively
weak to affect wages. In such a situation where public employment acts as a social security
payment, private sector is weak, and migration is no longer important, domestic labor markets
are basically saturated and any sign of flexibility comes as a response to the increase in the
cost of living irrespective of any gains in productivity. This leads to a situation where labor
markets are unable to function properly, and the way out is either rigidity or decline in
demand, i.e. unemployment.
ECES-WP70/ Radwan/ August 2002
16
IV. Recovery and Employment: The Need for a Coherent Strategy A pertinent question on this issue is: What is to be done to reverse the present trends of
recession and rising unemployment?
Partial solutions may provide palliatives in the short run, but for the long-term there is
no alternative to the introduction of unconventional policies and innovative institutions within
a coherent strategy capable of sustaining growth and creating employment. It is time that the
objective of employment creation is treated as an indigenous component of the socioeconomic
policy.
Other crucial questions include: What should such a recovery and employment
strategy look like; and how different should it be from traditional policies? Elsewhere, the
elements have been outlined for what was called an “employment-intensive growth strategy”
which was based on sustained growth that maximizes demand for labor.16 The launch of a
National Employment Program (NEP) has also been suggested which would comprise five
components: (a) emergency employment schemes; (b) creating a national training fund; (c)
reforming labor market institutions, especially employment services; (d) implementing an
informal sector strategy; and (e) strengthening labor market information system. This paper
does not dwell on this program, especially as some parts of it are being implemented in one
form or another.17 Instead, the case is made for a paradigm shift from partial solutions to a
coherent strategy for recovery and employment. It is proposed that such a strategy has three
major components: expansionary macroeconomic policy, enhancing the productivity of the
labor force, and the reform of the civil service.
Before discussing each of these in turn, it must be emphasized that this attempt should
be seen as an invitation to review, rethink, and reorient the policies of the past. Such
rethinking must be based on two premises: (a) labor should be regarded as a potential and not
a problem, this has the advantage of focusing attention on the continuous need to invest in
human capital which is essential for future growth and competitiveness; and (b) there is a
16 Radwan, op. cit., p. 2. 17 The government has launched a short-term training program for graduates and is planning to establish a National Employment Agency to reform labor offices.
ECES-WP70/ Radwan/ August 2002
17
need for a new approach to employment policy, an approach which makes employment an
overarching goal for macroeconomic policies. Employment should not be seen as a sectoral
policy but as a successful coordination of all policies, macroeconomic as well as structural.
The Need for Expansionary Macroeconomic Policy
It is proposed that current contractionary policies be replaced by more aggressive
expansionary ones. Traditional contractionary macroeconomic policies have always viewed
the situation in terms of a tradeoff between employment and inflation. The prescription is
generally in favor of controlling inflation, in view of its negative effect on growth, even if it
leads to unemployment. As a result, monetary and fiscal policies are designed to contain
inflation. There is an emerging consensus that this argument should be turned on its head by
making employment the central objective of macroeconomic policies. Experience with
downturns (with close to 100 countries facing crises in the last quarter-century), has
strengthened the view that monetary and fiscal policies should be “the linchpin of social
policy.”18 This does not mean that we should not fight inflation, but rather give precedence to
employment even at the cost of some inflationary pressure. It has been argued that “inflation
is not a genie that once out of the bottle cannot be put back in…we know that inflation can be
controlled if we begin to see it accelerating and we need to move toward full employment, as
full as we possibly can.”19
Similarly, government deficits are not necessarily bad all the time. The views of
Keynes are still valid in the sense that, if consumers and business are not spending or
investing enough to maintain adequate aggregate demand, government will be justified to step
in. This is particularly appropriate in situations of global contraction as the one we are facing
at present.
The situation in Egypt is such that growth is slowing, but monetary and fiscal policies
are generally pro-cyclical in the sense that they lead to further contraction. At present, the rate
of inflation remains low (5% in 2000), the budget deficit is manageable (1.9% of GDP), and
the reserves, though lower than before (US$ 14 billion), are not a major cause for concern. It
is true that the international environment is not very favorable due to the global downturn and
the impact of September 11, but there are powerful arguments for an expansionary policy to
18 Reich, Robert (2001), speech at the Global Employment Forum, p. 2, ILO. 19 Reich, p. 3, op. cit., p. 17.
ECES-WP70/ Radwan/ August 2002
18
regenerate growth. Joseph Stiglitz, the 2001 Noble Laureate, has strongly advocated such a
policy. He argued that “In framing macroeconomic policies, we need to keep our eyes on the
ultimate objectives, and not on intermediate variables; on employment, growth, living
standards, not interest rates, inflation rates, or exchange rates – variables which are important
only to the extent that they affect the variables of fundamental importance.”20
The variables of “fundamental importance” are what macroeconomic policies in Egypt
should focus on. In this respect, a recent World Bank report was right in emphasizing that
“unemployment remains as a crucial challenge. Solving the employment problem through
growth is critical not only for the economy, but also for social stability. Current official
estimates place unemployment at about 8 percent, and the labor force is growing at about 3
percent annually. Egypt will need to achieve a sustained real GDP growth rate of at least 6
percent annually for unemployment to decline to more manageable levels.” The report goes
on to point out that “to achieve and sustain these levels of growth, Egypt faces the challenges
of low levels of domestic savings and investment, and increasing efficiency and competition
in the domestic economies. On the external side, it needs to improve export performance and
rely less on external resources that are vulnerable to shocks, such as remittances, oil and gas
exports, and foreign aid. Also, if Egypt can attract increased levels of FDI, it will facilitate the
country’s integration into global trade patterns and technology transfers.” 21
In charting this policy, Egypt can benefit from international experience. It is clear
what should be avoided: the meltdown in Argentina. Alternatively, the experience of Asian
countries that emerged from the 1978 crisis is instructive. For instance, both Malaysia and
Korea took different routes to recovery, but both succeeded. Korea, with a more mature
economy, carried out an IMF-style reform from an early stage, pumping IMF money into the
economy, but floated exchange rates, closed troubled banks, and undertook a range of other
structural reforms. Malaysia took a different path. It introduced sweeping controls on capital
account transactions, fixed the exchange rate, cut interest rate, and embarked on a policy of
reflation. Both crises-resolution strategies succeeded, the first because of discipline, and the
20 Stiglitz, Joseph (2001), “Employment, Social Justice and Social Well-Being,” Keynote address to the Global Employment Forum, p. 9, ILO, Geneva. 21 World Bank, p. 1, op. cit., p. 14.
ECES-WP70/ Radwan/ August 2002
19
second because of restrictions on capital flight, and because the real economy was strong
enough to counterbalance the impact of financial collapse.22
Finally, it must be pointed out that expansionary policies, like all policies, are not
without risk. The question is: Who bears those risks? For this policy to succeed, redistribution
should take place in favor of the social groups who are likely to spend what they get and
spend it domestically. Evidence shows that in Egypt, “expenditures of the bottom half of the
population appear to be fairly compressed. In 1996, the bottom 60 percent of the population at
most had expenditures per capita 30 percent above the poverty line. Thus, small shifts in
income could have large implications for the population’s welfare.” 23
It can hardly be overemphasized that there is a need for a second wave of reform to
complement that of the early 1990s. Reform is required to redress issues in both fiscal and
monetary policies that enable the Egyptian economy to be competitive in the global economy.
That is a fact the economy has to face and time is of the essence in this respect.
Macroeconomic reform has to be complemented by reform at the microeconomic
level. This would require a coherent labor market policy which, so far, does not exist.
Moreover, it would necessitate the reform of factor markets and of institutions in order to
enable markets to function. Finally, the issue of competitiveness of the Egyptian economy
hangs on two types of reform: (a) upgrading the quality of the labor force; and (b) creating
our “enabling environment” by reducing the “transaction cost” which results from an
inefficient and rent-seeking civil service. Thus, the reform of the civil service becomes an
integral part of institutional reform necessary to enable markets to function in an efficient and
equitable way.
Enhancing the Productivity of the Labor Force
It was argued above that full employment, as full as we can get, is a critically important social
policy and that the major vehicles are fiscal and monetary policies. Over the longer term
however, these policies alone will not be sufficient and will have to be complemented by
other microeconomic policies that enable people not only to have jobs, but decent jobs. These
include adequate education, adequate training, and a certain degree of labor market flexibility.
22 Kaplan, Ethan and Dani Rodrik (2001), “Did the Malaysian Capital Control Work?” Harvard University. 23 World Bank, p. 6, op. cit., p. 3.
ECES-WP70/ Radwan/ August 2002
20
This paper focuses on one aspect only – skill acquisition, not because other active labor
market policies are not important, but because skills are at the cutting-edge in defining returns
to labor and the economy’s competitiveness at large.
Egypt, compared to other developing countries, has one of the oldest and most
extensive educational and training systems. Yet, the potential of the labor force is far from
being fulfilled as a result of low productivity (by international standards) and misallocation of
human capital that diverted it from employment in growth-enhancing activities. This has been
reflected in the slow growth of TFP observed in Egypt (as well as the rest of the MENA
region) during the 1980s and 1990s.24
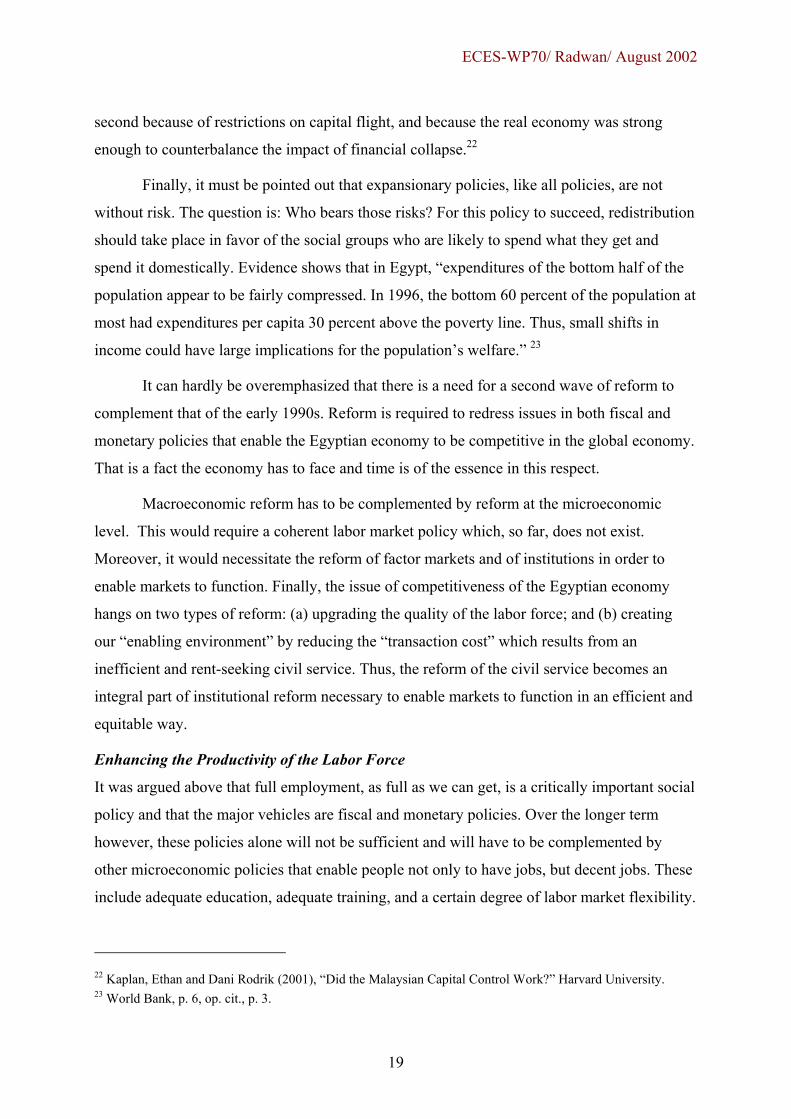
In Table 10, a number of international comparisons illustrate the present situation and
point out possible areas of improvement:
Table 10: Comparative Data on Competitiveness
Source: UNIDO, World Industrial Development Report 2002, forthcoming. Courtesy of Professor Sanjaya Lall.
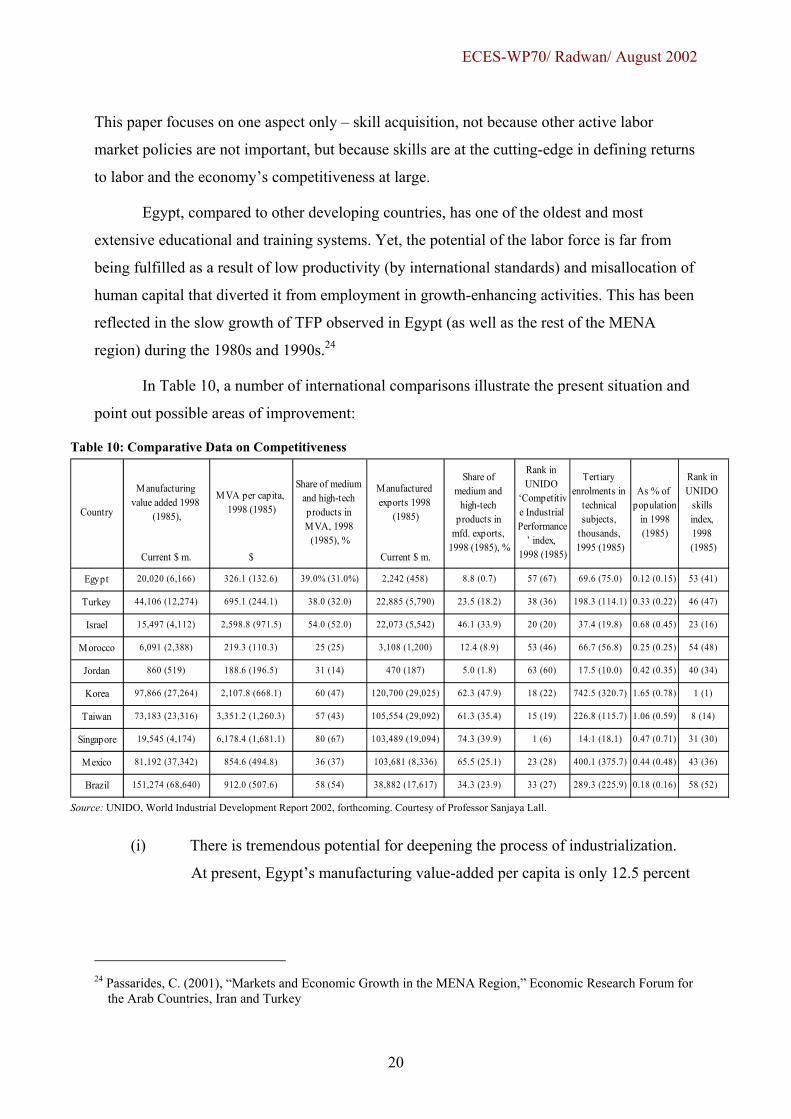
(i) There is tremendous potential for deepening the process of industrialization.
At present, Egypt’s manufacturing value-added per capita is only 12.5 percent
24 Passarides, C. (2001), “Markets and Economic Growth in the MENA Region,” Economic Research Forum for the Arab Countries, Iran and Turkey
Egypt 39.0% (31.0%) 8.8 (0.7) 57 (67) 69.6 (75.0) 0.12 (0.15) 53 (41)
Turkey 38.0 (32.0) 23.5 (18.2) 38 (36) 198.3 (114.1) 0.33 (0.22) 46 (47)
Israel 54.0 (52.0) 46.1 (33.9) 20 (20) 37.4 (19.8) 0.68 (0.45) 23 (16)
Morocco 25 (25) 12.4 (8.9) 53 (46) 66.7 (56.8) 0.25 (0.25) 54 (48)
Jordan 31 (14) 5.0 (1.8) 63 (60) 17.5 (10.0) 0.42 (0.35) 40 (34)
Korea 60 (47) 62.3 (47.9) 18 (22) 742.5 (320.7) 1.65 (0.78) 1 (1)
Taiwan 57 (43) 61.3 (35.4) 15 (19) 226.8 (115.7) 1.06 (0.59) 8 (14)
Singapore 80 (67) 74.3 (39.9) 1 (6) 14.1 (18.1) 0.47 (0.71) 31 (30)
Mexico 36 (37) 65.5 (25.1) 23 (28) 400.1 (375.7) 0.44 (0.48) 43 (36)
Brazil 58 (54) 34.3 (23.9) 33 (27) 289.3 (225.9) 0.18 (0.16) 58 (52)151,274 (68,640) 912.0 (507.6) 38,882 (17,617)
19,545 (4,174) 6,178.4 (1,681.1) 103,489 (19,094)
81,192 (37,342) 854.6 (494.8) 103,681 (8,336)
97,866 (27,264) 2,107.8 (668.1) 120,700 (29,025)
73,183 (23,316) 3,351.2 (1,260.3) 105,554 (29,092)
6,091 (2,388) 219.3 (110.3) 3,108 (1,200)
860 (519) 188.6 (196.5) 470 (187)
44,106 (12,274) 695.1 (244.1) 22,885 (5,790)
15,497 (4,112) 2,598.8 (971.5) 22,073 (5,542)
20,020 (6,166) 326.1 (132.6) 2,242 (458)
Rank in UNIDO
‘Competitive Industrial Performance
’ index, 1998 (1985)
Tertiary enrolments in
technical subjects,
thousands, 1995 (1985)
As % of population
in 1998 (1985)
Rank in UNIDO
skills index, 1998 (1985)
Share of medium and high-tech products in MVA, 1998
(1985), %
Manufactured exports 1998
(1985)
Current $ m.
Share of medium and
high-tech products in
mfd. exports, 1998 (1985), %
Country
Manufacturing value added 1998
(1985),
Current $ m.
MVA per capita, 1998 (1985)
$
ECES-WP70/ Radwan/ August 2002
21
of Israel’s and 15.5 percent of Korea’s, but 14 percent higher than that of
China.
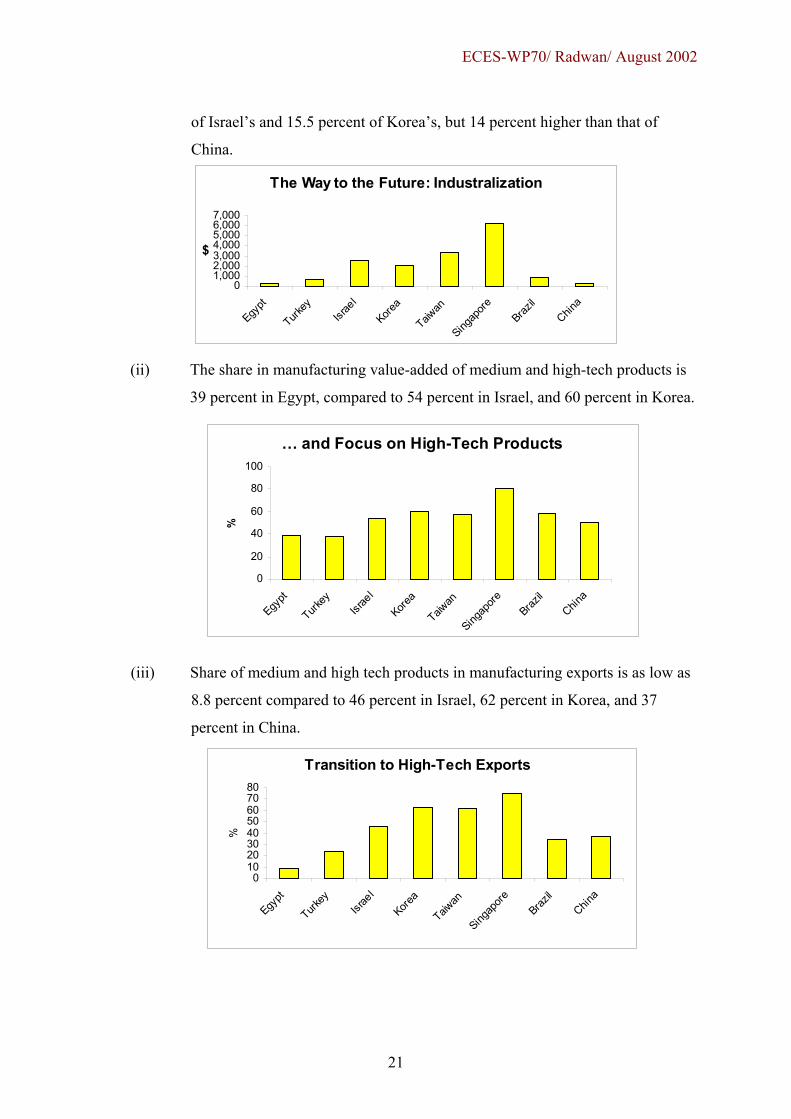
(ii) The share in manufacturing value-added of medium and high-tech products is
39 percent in Egypt, compared to 54 percent in Israel, and 60 percent in Korea.
(iii) Share of medium and high tech products in manufacturing exports is as low as
8.8 percent compared to 46 percent in Israel, 62 percent in Korea, and 37
percent in China.
The Way to the Future: Industralization
01,0002,0003,0004,0005,0006,0007,000
Egypt
Turkey
Israe
l
Korea
Taiwan
Singap
oreBraz
ilChin
a
$
… and Focus on High-Tech Products
0
20
40
60
80
100
Egypt
Turkey
Israe
l
Korea
Taiwan
Singap
oreBraz
ilChin
a
%
Transition to High-Tech Exports
01020304050607080
Egypt
Turkey
Israe
l
Korea
Taiwan
Singap
oreBraz
ilChin
a
%
ECES-WP70/ Radwan/ August 2002
22
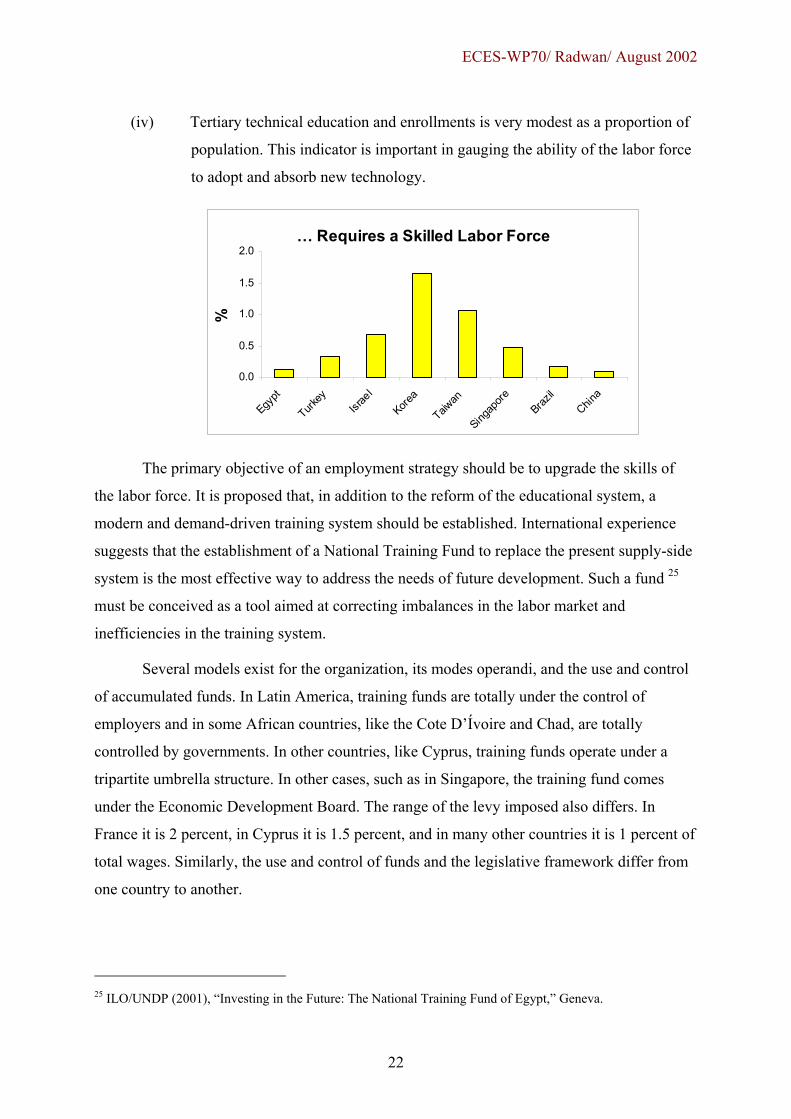
(iv) Tertiary technical education and enrollments is very modest as a proportion of
population. This indicator is important in gauging the ability of the labor force
to adopt and absorb new technology.
The primary objective of an employment strategy should be to upgrade the skills of
the labor force. It is proposed that, in addition to the reform of the educational system, a
modern and demand-driven training system should be established. International experience
suggests that the establishment of a National Training Fund to replace the present supply-side
system is the most effective way to address the needs of future development. Such a fund 25
must be conceived as a tool aimed at correcting imbalances in the labor market and
inefficiencies in the training system.
Several models exist for the organization, its modes operandi, and the use and control
of accumulated funds. In Latin America, training funds are totally under the control of
employers and in some African countries, like the Cote D’Ívoire and Chad, are totally
controlled by governments. In other countries, like Cyprus, training funds operate under a
tripartite umbrella structure. In other cases, such as in Singapore, the training fund comes
under the Economic Development Board. The range of the levy imposed also differs. In
France it is 2 percent, in Cyprus it is 1.5 percent, and in many other countries it is 1 percent of
total wages. Similarly, the use and control of funds and the legislative framework differ from
one country to another.
25 ILO/UNDP (2001), “Investing in the Future: The National Training Fund of Egypt,” Geneva.
… Requires a Skilled Labor Force
0.0
0.5
1.0
1.5
2.0
Egypt
Turkey
Israe
l
Korea
Taiwan
Singap
oreBraz
ilChin
a
%
ECES-WP70/ Radwan/ August 2002
23
The establishment of a semi-autonomous National Training Fund in Egypt has been
proposed, where the private sector (the major source of demand) would have a major say. The
proposal includes a levy on enterprises ranging from 0.5 percent to 2 percent of wages
according to their size that would be financed from government budget allocations, and states
that the fund should start with four sectors; manufacturing, tourism, construction, and
transport. The establishment of such a fund has become a priority more than ever before,
especially as a result of the increased competition following the WTO agreement. The Reform of the Civil Service
Civil service reform has been a long-standing objective that dates to the 1950s. Successive
governments have struggled to introduce such reforms, but their efforts were frustrated
mainly due to pressures to absorb new graduates in public employment. In fact, a major
component of the government’s employment drive at present is to recruit 170,000 into civil
service, thus maintaining the state’s role as a major employer. The downside of what Ragui
Assaad calls the “entrapment” of graduates in public sectors,26 is the detrimental effect on
productivity as a result of a misallocation of human capital to low pay, low productivity
public service jobs. In 1998, some 52 percent of males and 63 percent of females with
secondary education and above were employed in the public sector. This “suggests that the
education system in Egypt is effectively geared toward meeting the demands of the
bureaucracy.”27
A long-term employment strategy should aim at a steady shift of labor force away
from public service. With the transition to a high productivity economy, there is a need for
lean-but-efficient civil service which will be the essential arm of a modern government. A
prominent economist recently evoked the experience of France in preparing highly-skilled
civil servants through the “Higher School of Administration that trained most political leaders
in the country.”28 Another, and perhaps closer model, is that of the Civil Service Examination
in India, which is a tough screening mechanism to ensure high quality of public employees. It
26 Assaad, Ragui (Forthcoming 2002), “Microeconomics of Growth in Egypt: The Role of Households and Institutions,” Research Report, Economic Research Forum for the Arab Countries, Iran and Turkey; Cairo, Egypt. 27 Assaad, op. cit., p. 23 28 El-Biblawy, Hazem (2001), “What About the Future of Public Service,” Al-Ahram Daily, December 23.
ECES-WP70/ Radwan/ August 2002
24
is proposed that a similar system be applied in Egypt, perhaps on pilot basis, to prepare higher
quality and higher paid civil servants.
V. Conclusion
The major objective of this paper is not to add to the multitude of literature on employment
and unemployment. It is an invitation to review, rethink, and reorient policies that determine
the economy’s capacity to emerge from recession and to ensure the absorption of the
burgeoning labor force. It has been argued that there are compelling reasons to depart from
traditional polices in favor of unconventional ones. Labor has to be viewed as a potential, not
a problem. Macro and micro economic policies should be geared to realize this potential. A
crucial question remains as to the creation of conditions to achieve such objectives.
The choice of policy regimes requires the mobilization of support for these policies
from interest groups. The best way to achieve this is to ensure the engagement of the
stakeholders in the process of reform: policymakers, consumers, and investors. A long-term
strategy for full employment can only succeed if it is owned by a broad spectrum of the
population.
Both Egyptian policy makers and other social partners have a common challenge to
face; how to enable the economy to realize its potential in a competitive world. This is all the
more important in view of the pressing need to fight poverty and to enhance the
competitiveness of the Egyptian economy.
Recommended