Safety Analysis Tool for Six-Lane
and One-Way Urban Streets
Traffic Safety ConferenceJune 8, 2016
Background NCHRP Project 17-58
• “Safety Prediction Models for Six-Lane and One-Way Urban and Suburban Arterials”
• PI: Dominique Lord
• Co-PI: Kay Fitzpatrick
• Key products
• Predictive method for 6+ lane and one-way street arterial facilities to be included in the revised HSM Chapter 12
• Software implementation of method
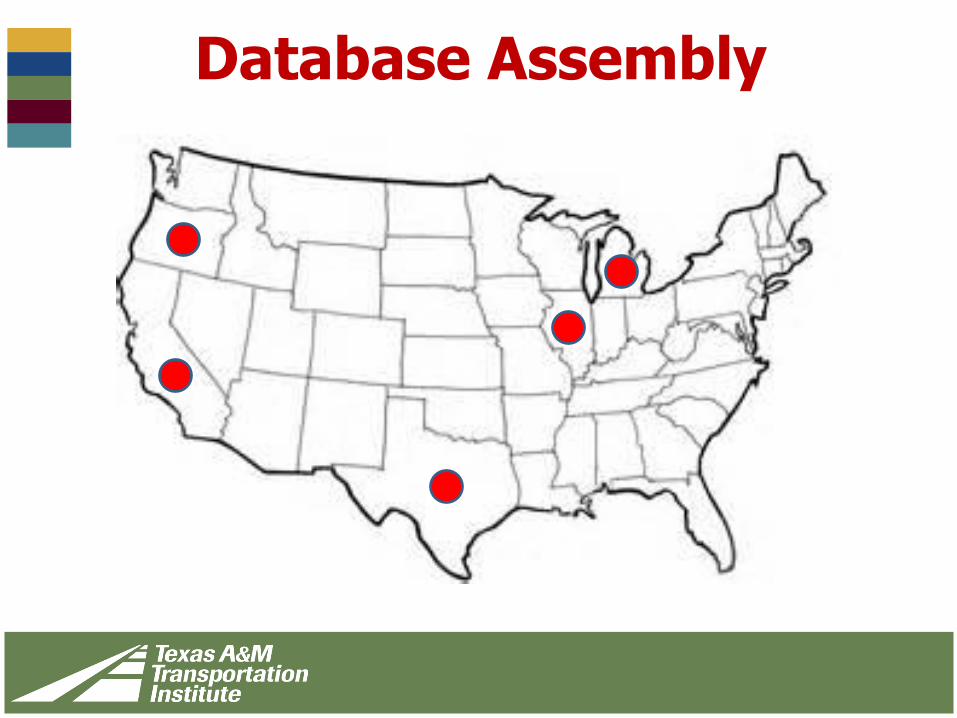
Database Assembly
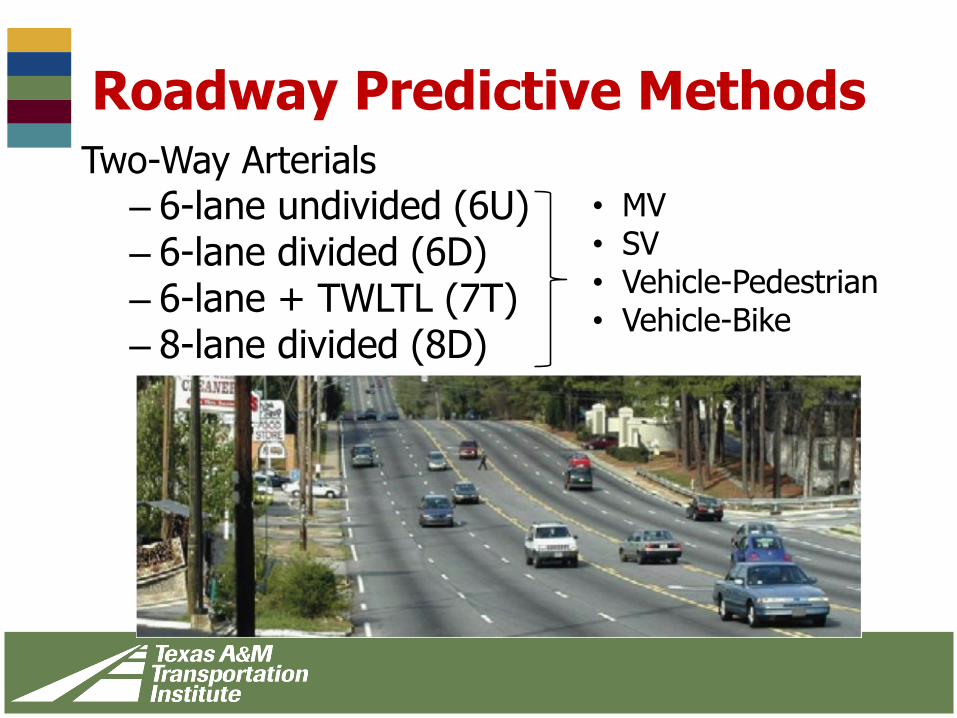
Roadway Predictive MethodsTwo-Way Arterials
– 6-lane undivided (6U)– 6-lane divided (6D)– 6-lane + TWLTL (7T)– 8-lane divided (8D)
• MV • SV• Vehicle-Pedestrian• Vehicle-Bike
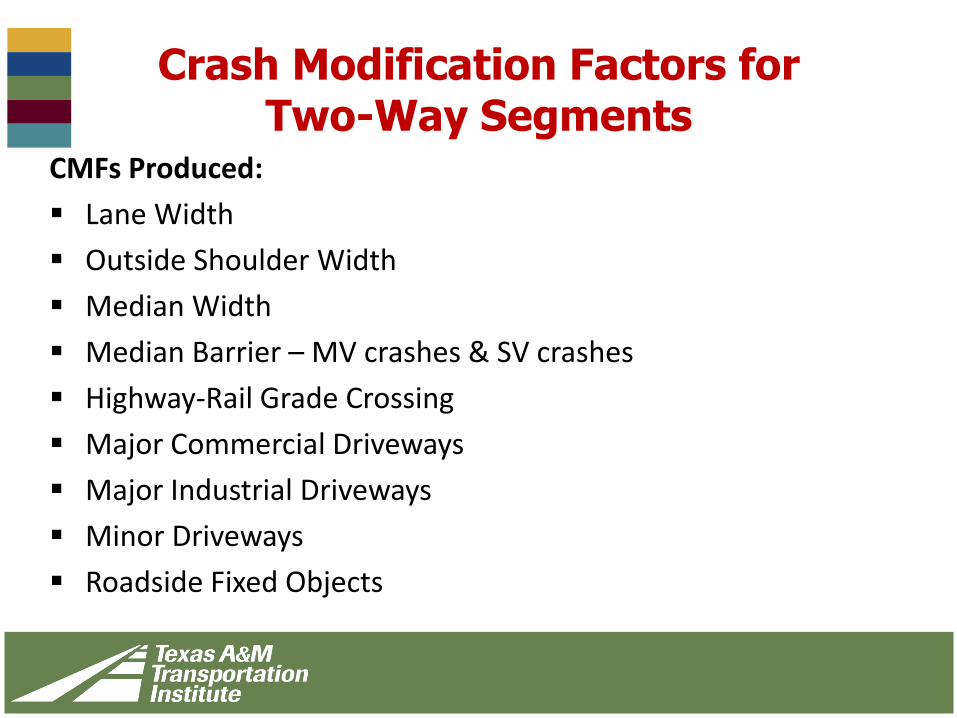
Crash Modification Factors for Two-Way Segments
CMFs Produced:
Lane Width
Outside Shoulder Width
Median Width
Median Barrier – MV crashes & SV crashes
Highway-Rail Grade Crossing
Major Commercial Driveways
Major Industrial Driveways
Minor Driveways
Roadside Fixed Objects
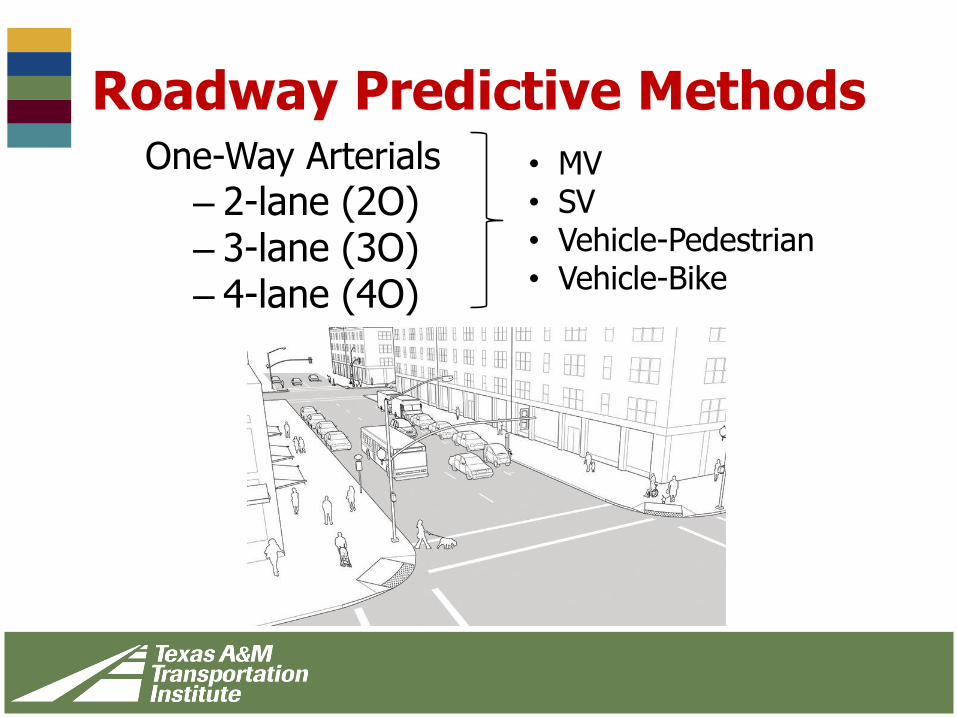
Roadway Predictive MethodsOne-Way Arterials
– 2-lane (2O)– 3-lane (3O)– 4-lane (4O)
• MV • SV• Vehicle-Pedestrian• Vehicle-Bike
Crash Modification Factors for One-Way Segments
CMFs Produced:
Right Shoulder Width
On-street Parking - Parallel and Angle
Major Commercial Driveway
Minor Driveway
Roadside Fixed Objects
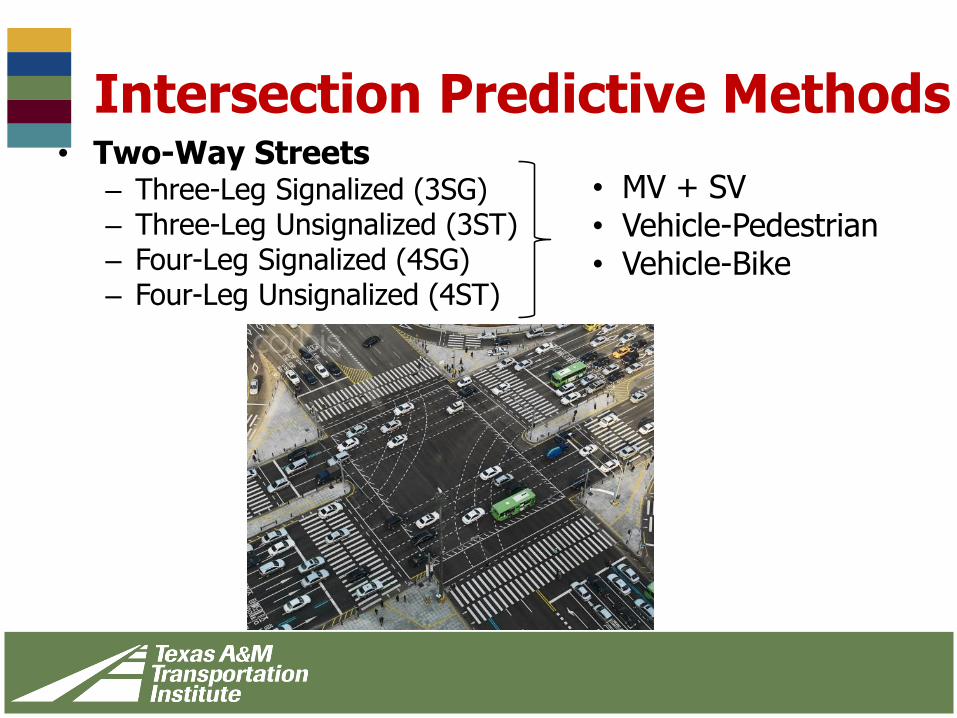
Intersection Predictive Methods• Two-Way Streets
– Three-Leg Signalized (3SG)– Three-Leg Unsignalized (3ST)– Four-Leg Signalized (4SG)– Four-Leg Unsignalized (4ST)
• MV + SV• Vehicle-Pedestrian• Vehicle-Bike
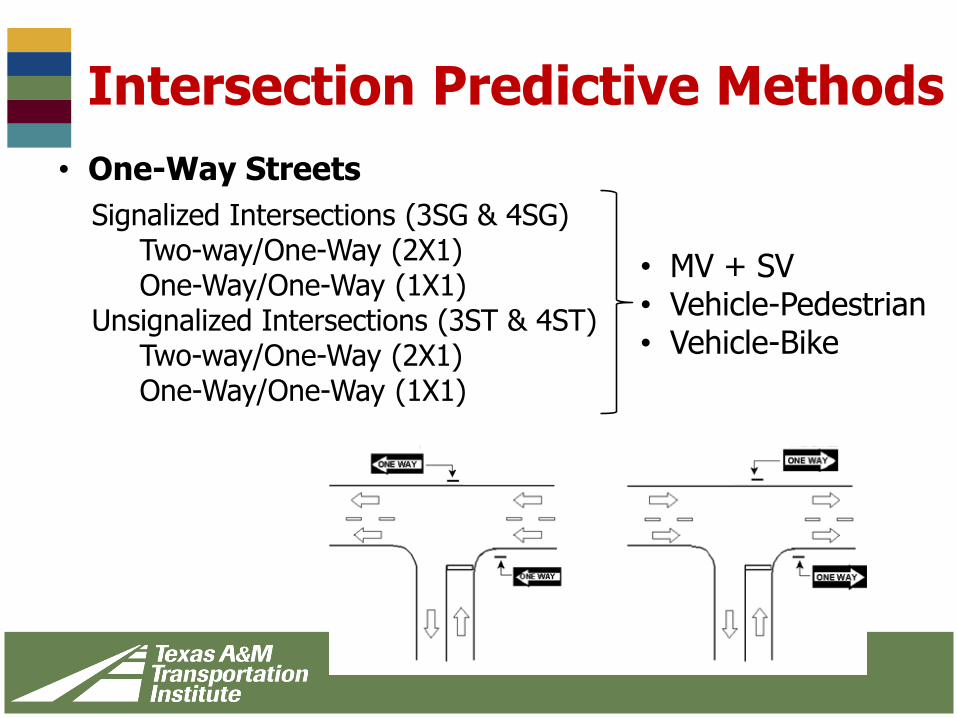
Intersection Predictive Methods
• One-Way Streets
Signalized Intersections (3SG & 4SG)Two-way/One-Way (2X1)One-Way/One-Way (1X1)
Unsignalized Intersections (3ST & 4ST)Two-way/One-Way (2X1)One-Way/One-Way (1X1)
• MV + SV• Vehicle-Pedestrian• Vehicle-Bike
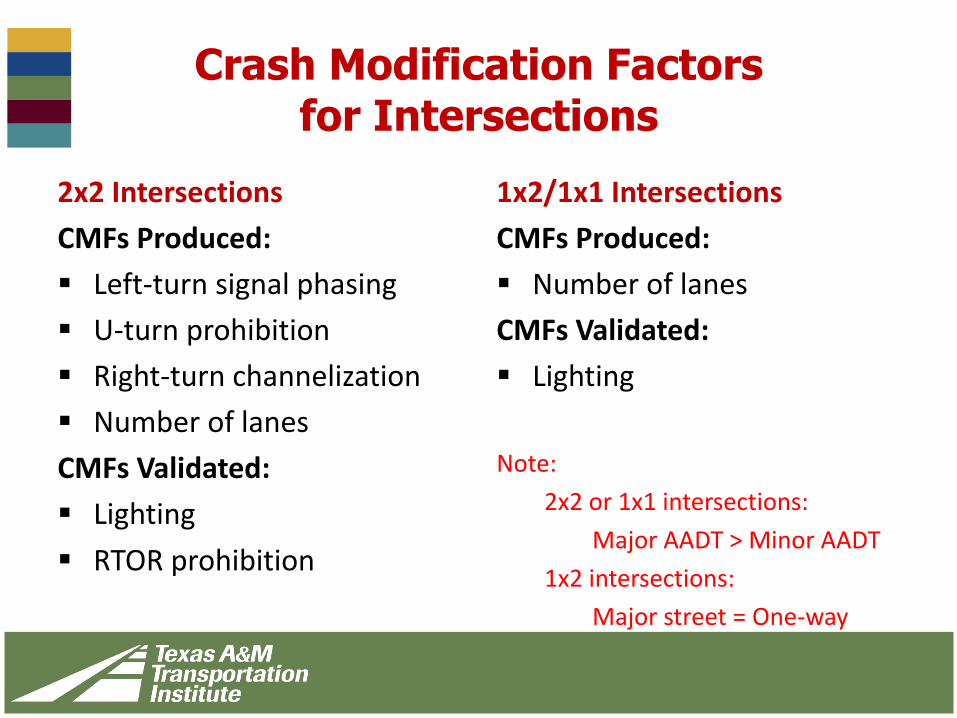
Crash Modification Factors for Intersections
2x2 Intersections
CMFs Produced:
Left-turn signal phasing
U-turn prohibition
Right-turn channelization
Number of lanes
CMFs Validated:
Lighting
RTOR prohibition
1x2/1x1 Intersections
CMFs Produced:
Number of lanes
CMFs Validated:
Lighting
Note:
2x2 or 1x1 intersections:
Major AADT > Minor AADT
1x2 intersections:
Major street = One-way
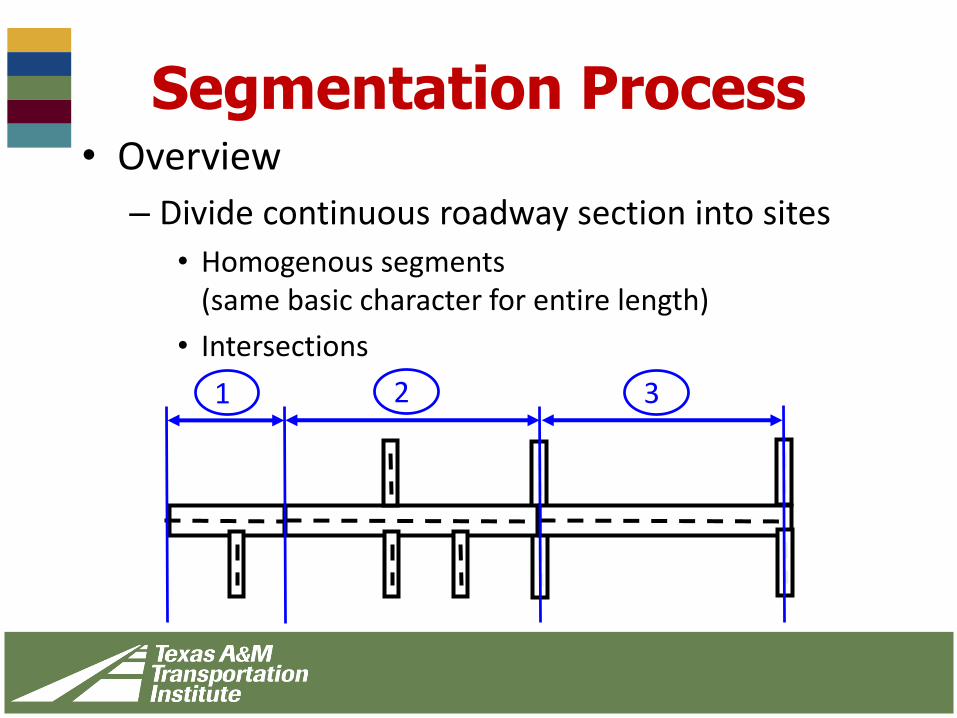
Segmentation Process• Overview
– Divide continuous roadway section into sites
• Homogenous segments (same basic character for entire length)
• Intersections
1 2 3
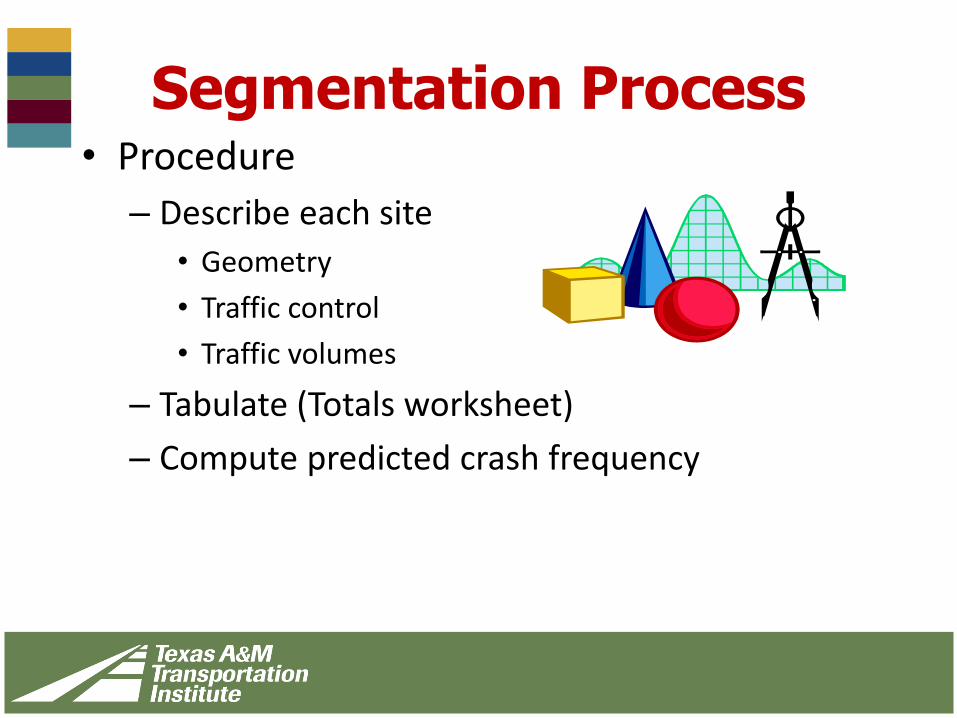
Segmentation Process• Procedure
– Describe each site
• Geometry
• Traffic control
• Traffic volumes
– Tabulate (Totals worksheet)
– Compute predicted crash frequency
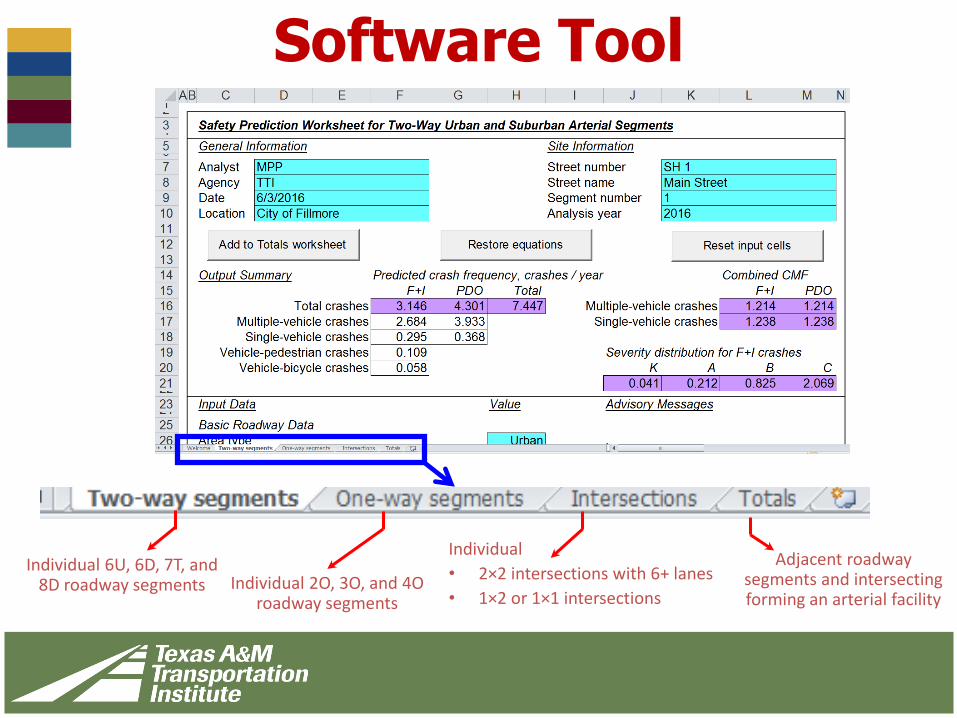
Software Tool
Individual 6U, 6D, 7T, and 8D roadway segments Individual 2O, 3O, and 4O
roadway segments
Individual
• 2×2 intersections with 6+ lanes
• 1×2 or 1×1 intersections
Adjacent roadway segments and intersecting forming an arterial facility
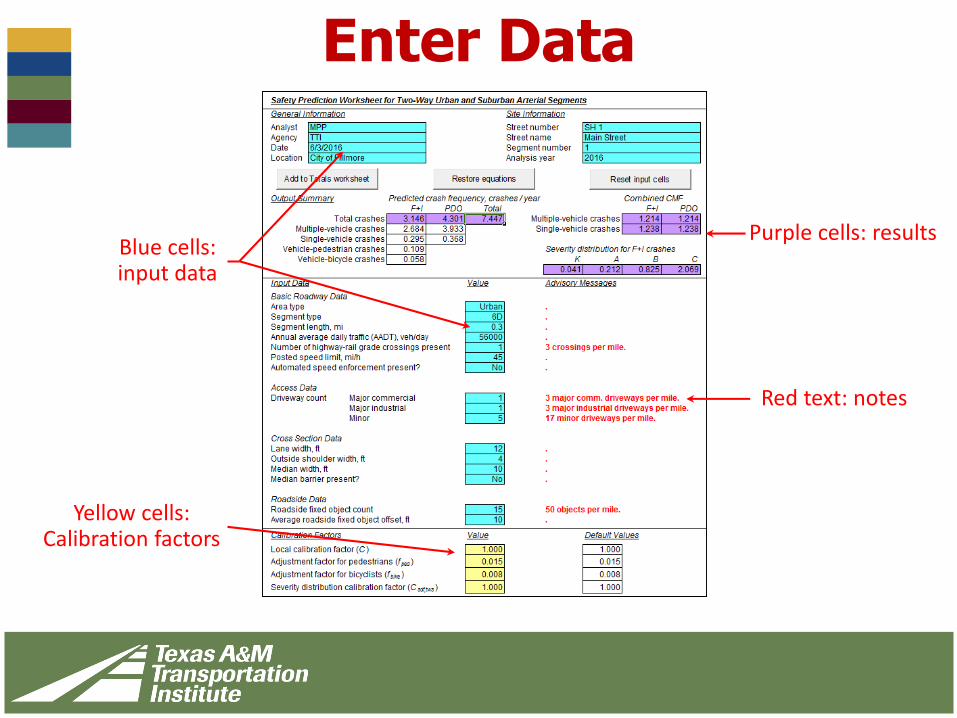
Enter Data
Blue cells: input data
Purple cells: results
Red text: notes
Yellow cells: Calibration factors
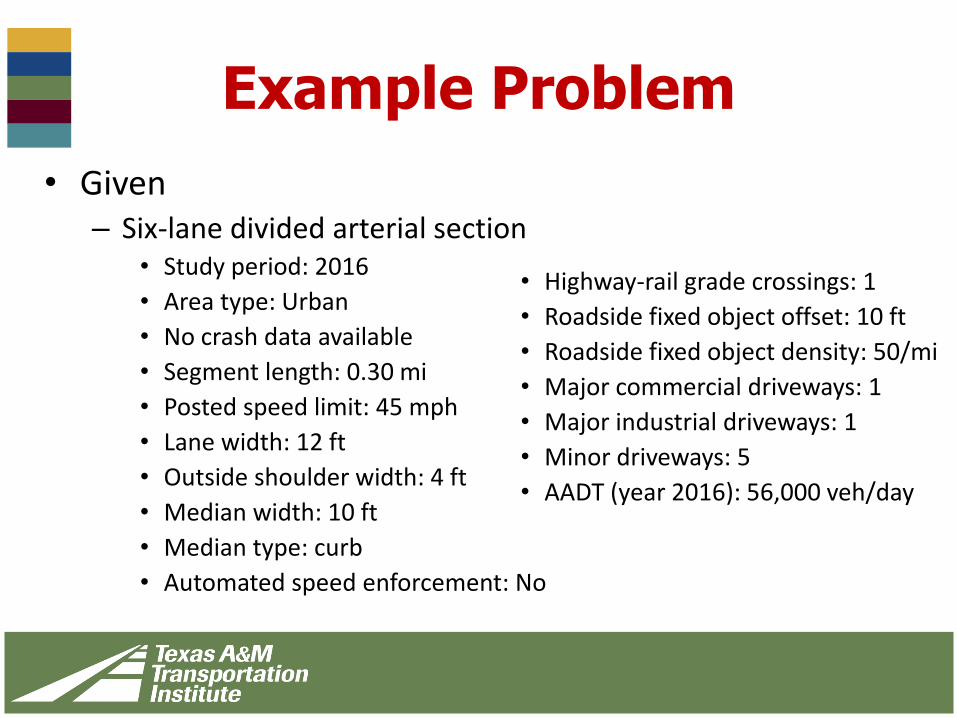
Example Problem
• Given– Six-lane divided arterial section
• Study period: 2016
• Area type: Urban
• No crash data available
• Segment length: 0.30 mi
• Posted speed limit: 45 mph
• Lane width: 12 ft
• Outside shoulder width: 4 ft
• Median width: 10 ft
• Median type: curb
• Automated speed enforcement: No
• Highway-rail grade crossings: 1
• Roadside fixed object offset: 10 ft
• Roadside fixed object density: 50/mi
• Major commercial driveways: 1
• Major industrial driveways: 1
• Minor driveways: 5
• AADT (year 2016): 56,000 veh/day
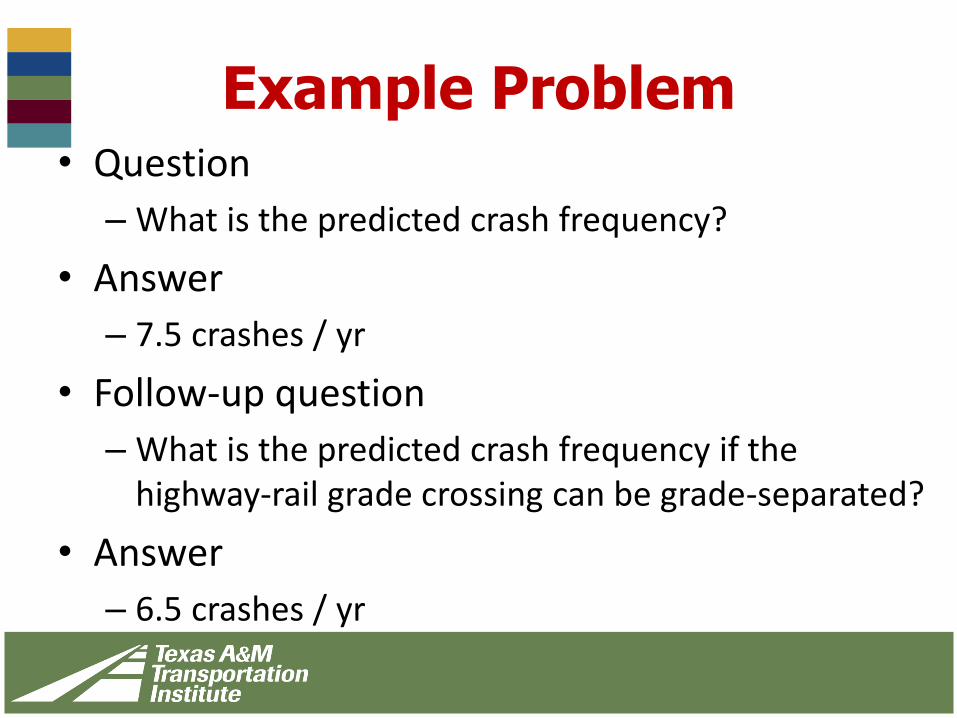
Example Problem• Question
– What is the predicted crash frequency?
• Answer
– 7.5 crashes / yr
• Follow-up question
– What is the predicted crash frequency if the highway-rail grade crossing can be grade-separated?
• Answer
– 6.5 crashes / yr

Questions – Comments?
Recommended