SAE 2015 NVH ConferenceStructure Borne NVH Workshop
Alan DuncanAlan Duncan Siemens PLM @ HondaNVH Simulation Specialist
2015 SAE NVC Structure Borne NVH Workshopwww.AutoAnalytics.com
Slide 1Slide 1
NVH Simulation Specialist
Greg GoetchiusGreg Goetchius AtievaSr Technical Specialist, NVH
Jianmin GuanJianmin Guan Altair Engineering NVH Manager
Contact Email: [email protected]
Contact Email: [email protected]
Contact Email: [email protected]

Structure Borne NVH WorkshopWorkshop Objectives -1. Review Basic Concepts of Automotive Structure Bor ne Noise.
2. Propose Generic Targets.
3. Present New Technology Example.
2015 SAE NVC Structure Borne NVH Workshopwww.AutoAnalytics.com
Slide 2Slide 2
Intended Audience –• New NVH Engineers.
• “Acoustics” Engineers seeking new perspective.
• “Seasoned Veterans” seeking to brush up skills.

Structure Borne NVH Workshop• Introduction
• Low Frequency Basics
•LIVE Noise Attenuation Demo
2015 SAE NVC Structure Borne NVH Workshopwww.AutoAnalytics.com
Slide 3Slide 3
•LIVE
• Mid Frequency Basics
• New Technology
An Overview of Stochastic Simulation
• Closing Remarks

Structure Borne NVH Workshop• Introduction
• Low Frequency Basics
• LIVE Noise Attenuation Demo
2015 SAE NVC Structure Borne NVH Workshopwww.AutoAnalytics.com
Slide 4Slide 4
• Mid Frequency Basics
• New Technology
An Overview of Stochastic Simulation
• Closing Remarks

Rideand
Handling
ImpactCrashWorthiness
Competing Vehicle Design Disciplines
2015 SAE NVC Structure Borne NVH Workshopwww.AutoAnalytics.com
Slide 5Slide 5
NVH Durability

Automotive Engineering Objectives are Timeless
2015 SAE NVC Structure Borne NVH Workshopwww.AutoAnalytics.com
Slide 6Slide 6


Structure Borne Noise and Vibration
Vibrating
Source
2015 SAE NVC Structure Borne NVH Workshopwww.AutoAnalytics.com
Slide 8Slide 8
Frequency Range: up to 1000 Hz
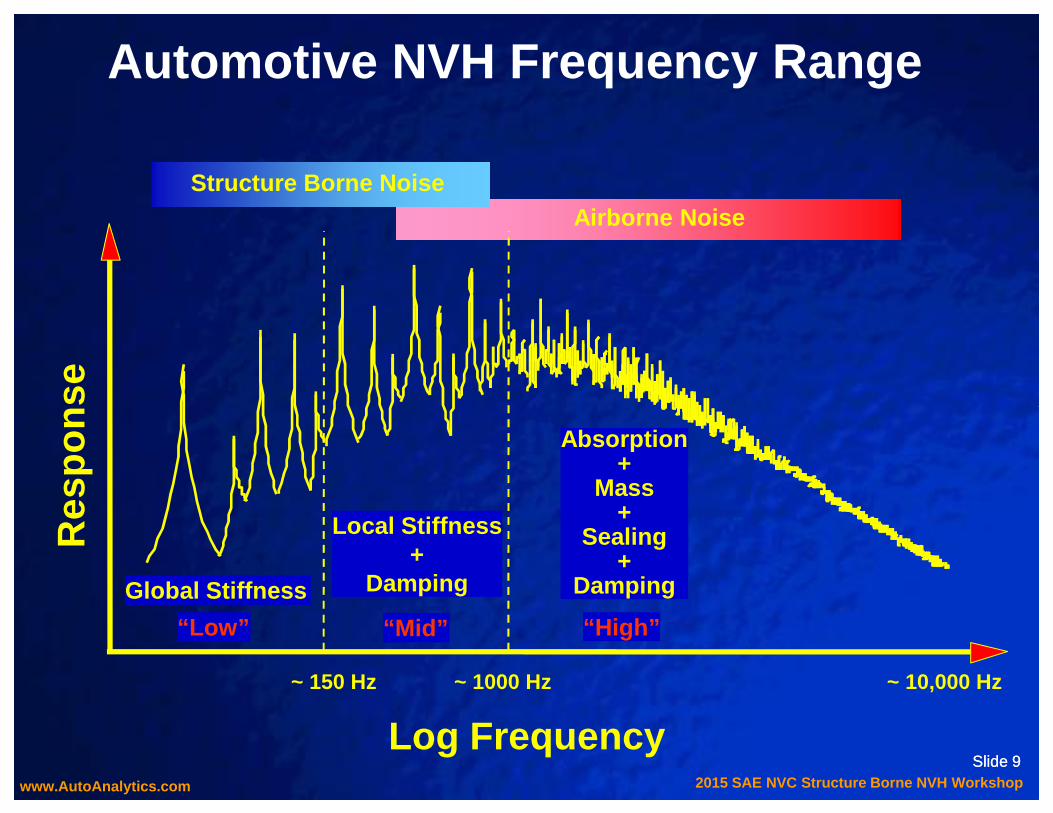
System Characterization• Source of Excitation
• Transmission through Structural Paths
• “Felt” as Vibration
• “Heard” as Noise
Structure Borne NoiseAirborne Noise
Res
pons
eAutomotive NVH Frequency Range
2015 SAE NVC Structure Borne NVH Workshopwww.AutoAnalytics.com
Slide 9Slide 9
Res
pons
e
Log Frequency
“Low”
Global Stiffness
“Mid”
Local Stiffness+
Damping
“High”
Absorption+
Mass+
Sealing+
Damping
~ 150 Hz ~ 1000 Hz ~ 10,000 Hz

Low Frequency Basics• Source -Path-Receiver Concept
• Single DOF System Vibration
• NVH Source Considerations
• Receiver Considerations
2015 SAE NVC Structure Borne NVH Workshopwww.AutoAnalytics.com
Slide 10Slide 10
• Receiver Considerations
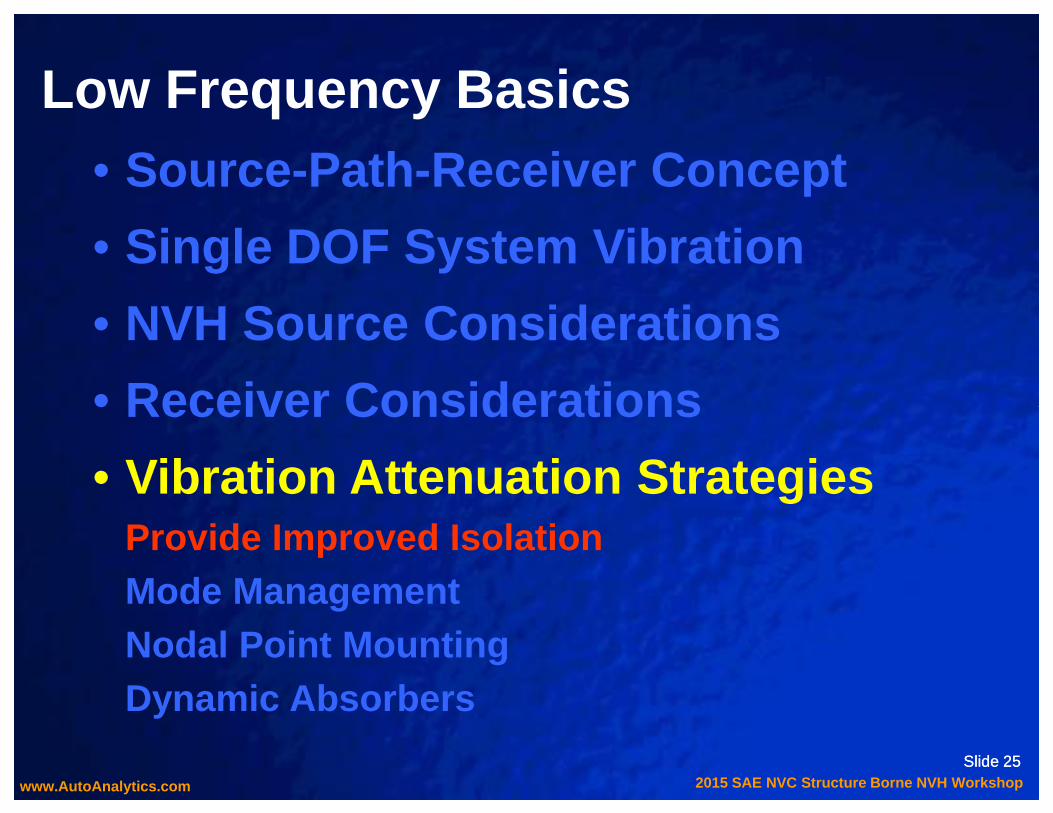
• Vibration Attenuation StrategiesProvide Improved IsolationMode ManagementNodal Point MountingDynamic Absorbers

Low Frequency Basics• Source -Path-Receiver Concept
• Single DOF System Vibration
• NVH Source Considerations
• Receiver Considerations
2015 SAE NVC Structure Borne NVH Workshopwww.AutoAnalytics.com
Slide 11Slide 11
• Receiver Considerations
• Vibration Attenuation StrategiesProvide Improved IsolationMode ManagementNodal Point MountingDynamic Absorbers
RECEIVER
Structure Borne NVH Basics
2015 SAE NVC Structure Borne NVH Workshopwww.AutoAnalytics.com
Slide 12Slide 12
PATH
SOURCE

Low Frequency Basics• Source -Path-Receiver Concept
• Single DOF System Vibration
• NVH Source Considerations
• Receiver Considerations
2015 SAE NVC Structure Borne NVH Workshopwww.AutoAnalytics.com
Slide 13Slide 13
• Receiver Considerations
• Vibration Attenuation StrategiesProvide Improved IsolationMode ManagementNodal Point MountingDynamic Absorbers

APPLIED FORCE
F = FO sin 2 π f t
TR = F / F
Single Degree of Freedom Vibration
2n)ff(21 ζ+=
2015 SAE NVC Structure Borne NVH Workshopwww.AutoAnalytics.com
Slide 14Slide 14
m
k c FT
TR = FT / F
TransmittedForce
= fraction of critical damping
fn = natural frequency
f = operating frequency
( )2n
22n
2n
ff2)ff(1)ff(21ζ
ζ+−
+=
ζmk

3
4
Tran
smis
sibi
lity
Rat
ioVibration Isolation Principle
m
APPLIED FORCE
F = FO sin 2 π f t
k c F
TR = FT / F0.25
0.15
0.1
2015 SAE NVC Structure Borne NVH Workshopwww.AutoAnalytics.com
Slide 15Slide 15
0 1 2 3 4 50
1
2
Tran
smis
sibi
lity
Rat
io
1.414Frequency Ratio (f / fn)
k c FTTransmitted
Force
Isolation Region
1.0
0.5
0.375

Low Frequency Basics• Source -Path-Receiver Concept
• Single DOF System Vibration
• NVH Source Considerations
• Receiver Considerations
2015 SAE NVC Structure Borne NVH Workshopwww.AutoAnalytics.com
Slide 16Slide 16
• Receiver Considerations
• Vibration Attenuation StrategiesProvide Improved IsolationMode ManagementNodal Point MountingDynamic Absorbers
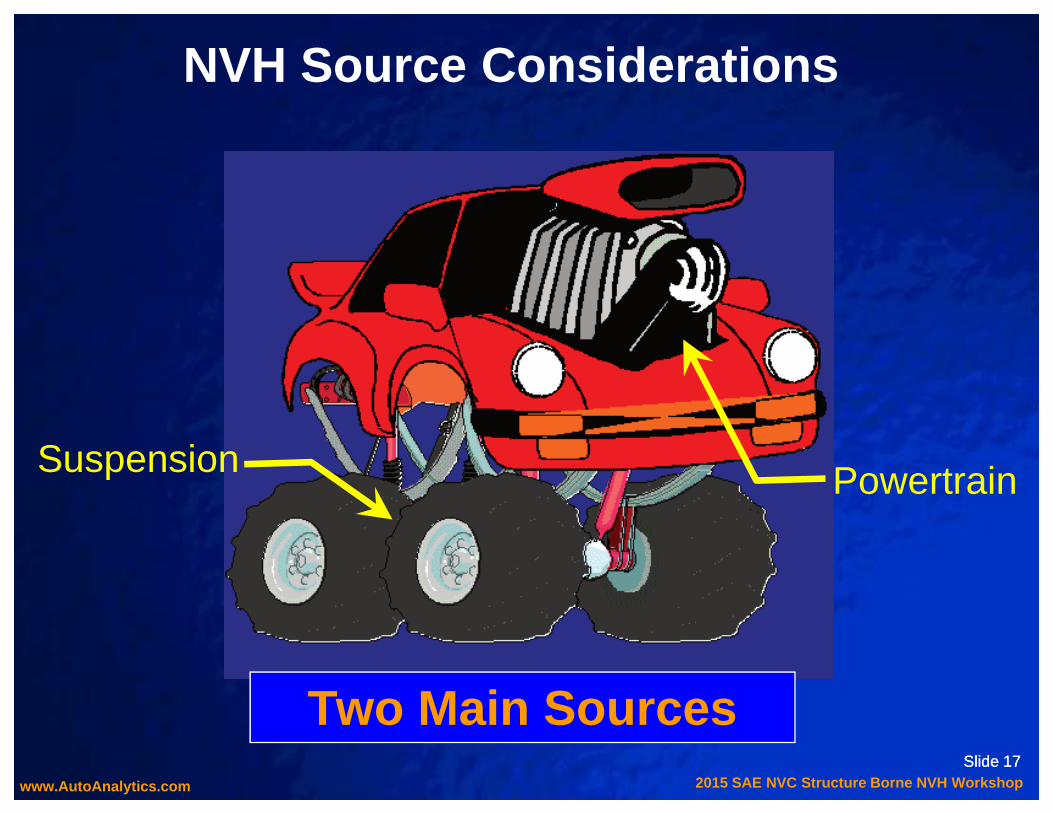
NVH Source Considerations
2015 SAE NVC Structure Borne NVH Workshopwww.AutoAnalytics.com
Slide 17Slide 17
Two Main Sources
Suspension Powertrain

Typical NVH Pathways to the Passenger
2015 SAE NVC Structure Borne NVH Workshopwww.AutoAnalytics.com
Slide 18Slide 18
PATHS FOR
STRUCTURE BORNE
NVH

Structure Borne NVH Sources
2015 SAE NVC Structure Borne NVH Workshopwww.AutoAnalytics.com
Slide 19Slide 19

Structure Borne NVH Sources
Primary Consideration:
Reduce the Source first as much as possible because whatever enters the
2015 SAE NVC Structure Borne NVH Workshopwww.AutoAnalytics.com
Slide 20Slide 20
possible because whatever enters the structure is transmitted through multiple paths to the receiver.
Transmission through multiple paths is more subject to variability.

Low Frequency Basics• Source -Path-Receiver Concept
• Single DOF System Vibration
• NVH Source Considerations
• Receiver Considerations
2015 SAE NVC Structure Borne NVH Workshopwww.AutoAnalytics.com
Slide 21Slide 21
• Receiver Considerations
• Vibration Attenuation StrategiesProvide Improved IsolationMode ManagementNodal Point MountingDynamic Absorbers

Receiver ConsiderationsSubjective to Objective Conversions
Subjective NVH Ratings are typically based on a 10 Point Scale resulting from Ride Testing
A 2 ≈≈≈≈ 1/2 A 1
Receiver Sensitivity is a Key Consideration
2015 SAE NVC Structure Borne NVH Workshopwww.AutoAnalytics.com
Slide 22Slide 22
A 2 ≈≈≈≈ 1/2 A 1
Represents 1.0 Rating Change
TACTILE: 50% reduction in motion
SOUND : 6.dB reduction in sound pressure level ( long standing rule of thumb )
� � � � � � � � � �

6.0
1.0
5.0
Human Sensitivity to Tactile Vibration
2015 SAE NVC Structure Borne NVH Workshopwww.AutoAnalytics.com
6.0
10 Pt Tactile Rating
Equation:
Standard Rating =
8.19 - 4.34 * LOG10(V)
V; Velocity in mm/sec
5.0
6.0
Sou
nd P
ress
ure
Leve
l -
dB
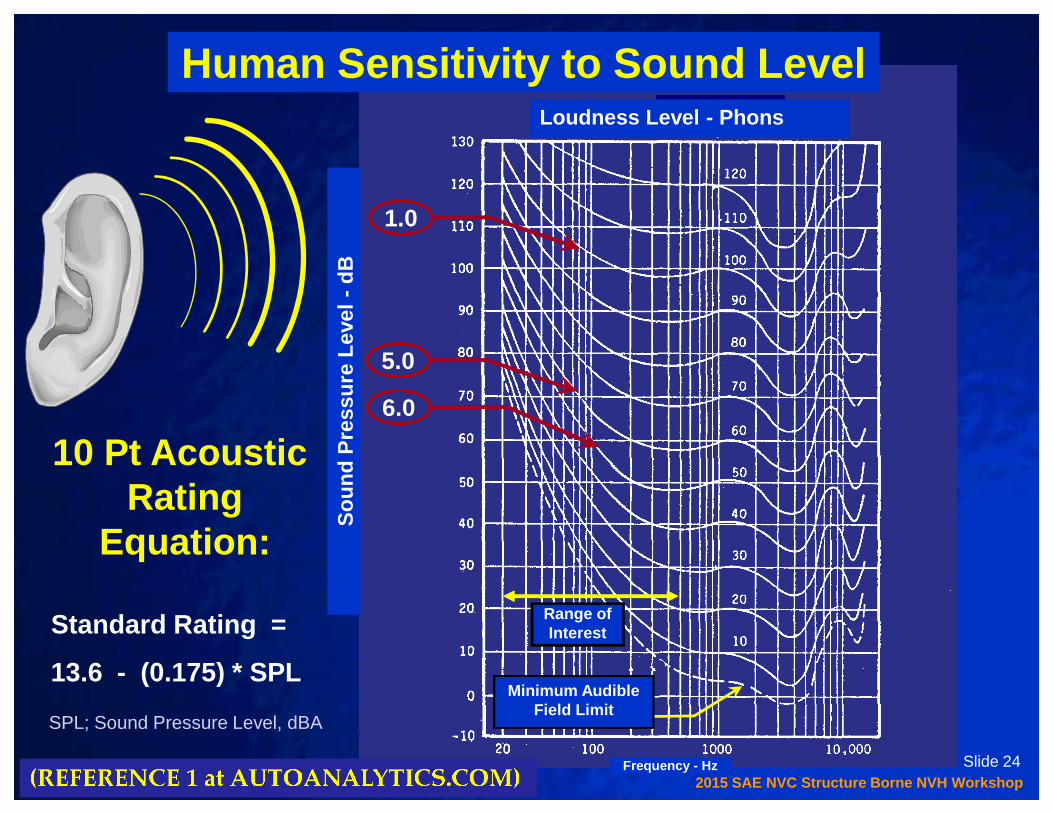
Loudness Level - Phons
Human Sensitivity to Sound Level
1.0
2015 SAE NVC Structure Borne NVH Workshopwww.AutoAnalytics.com
Slide 24
6.0
Frequency - Hz
Sou
nd P
ress
ure
Leve
l
Range ofInterest
Minimum AudibleField Limit
10 Pt AcousticRating
Equation:
Standard Rating =
13.6 - (0.175) * SPL
SPL; Sound Pressure Level, dBA
� � � � � � � � � � � � � � � � � � � � � � � � � � �
Low Frequency Basics• Source -Path-Receiver Concept
• Single DOF System Vibration
• NVH Source Considerations
• Receiver Considerations
2015 SAE NVC Structure Borne NVH Workshopwww.AutoAnalytics.com
Slide 25Slide 25
• Receiver Considerations
• Vibration Attenuation StrategiesProvide Improved IsolationMode ManagementNodal Point MountingDynamic Absorbers

Symbolic Model of Unibody Passenger Car8 Degrees of Freedom
318
2 4
5
2015 SAE NVC Structure Borne NVH Workshopwww.AutoAnalytics.com
Slide 26Slide 26
Total 2178.2 Kg (4800LBS)Mass Sprung 1996.7 Kg
Unsprun g 181.5 Kg (8.33% of Total)Powertrain 181.5 Kg
Tires 350.3 N/mmKF 43.8 N/mmKR 63.1 N /mmBeam mass lumped on grids like a beam M2,3,4 =2 * M1,5
From Reference 6
316 7
5

1 2 4 5
8
3
Suspension
Engine Mass
EngineIsolator
Flexible Beam for Body
8 Degree of Freedom Vehicle NVH Model
2015 SAE NVC Structure Borne NVH Workshopwww.AutoAnalytics.com
Slide 27Slide 27
6 7
Tires
Wheels
SuspensionSprings

8 Degree of Freedom Vehicle NVH ModelForce Applied to Powertrain Assembly
Feng
1 2 4 5
8
3
2015 SAE NVC Structure Borne NVH Workshopwww.AutoAnalytics.com
Slide 28Slide 28
Forces at Powertrain could represent a First OrderRotating Imbalance
6 7

Engine Isolation Example
Response at M id Car
0.0100
0.1000
1.0000
Vel
ocity
(m
m/s
ec)
Constant Force Load; F ~ A 15.9 Hz
8.5 Hz
7.0 Hz
2015 SAE NVC Structure Borne NVH Workshopwww.AutoAnalytics.com
Slide 29Slide 29
0.0001
0.0010
0.0100
5.0 10.0 15.0 20.0
Frequency Hz
Vel
ocity
(m
m/s
ec)
700 Min. RPM First Order UnbalanceOperation Range of Interest
318
2
6
4
753311
8822
66
44
7755

Engine Isolation Example
Response at M id Car
0.0100
0.1000
1.0000
Vel
ocity
(m
m/s
ec)
Constant Force Load; F ~ A
Engine Idle Speed Operating Shapes
15.9 Hz
8.5 Hz
2015 SAE NVC Structure Borne NVH Workshopwww.AutoAnalytics.com
Slide 30Slide 30
0.0001
0.0010
0.0100
5.0 10.0 15.0 20.0
Frequency Hz
Vel
ocity
(m
m/s
ec)
700 Min. RPM First Order UnbalanceOperation Range of Interest
318
2
6
4
753311
8822
66
44
7755
Operating Shapes at 700 RPM 7.0 Hz

Concepts for Increased Isolation“Double” isolation is the typical strategy for further improving isolation of a given vehicle design.
Second Level of Isolation is at Subframe
2015 SAE NVC Structure Borne NVH Workshopwww.AutoAnalytics.com
Slide 31Slide 31
Suspension Bushing is first level
Subframe is Intermediate Structure
Isolation is at Subframe to Body Mount

8 Degree of Freedom Vehicle NVH ModelRemoved Double Isolation Effect
1 2 4 5
8
3
2015 SAE NVC Structure Borne NVH Workshopwww.AutoAnalytics.com
Slide 32Slide 32
WheelMass
Removed6 7

Double Isolation ExampleVertical Response at DOF3
3.0E+00
4.0E+00
5.0E+00
6.0E+00
Vel
ocity
(m
m/s
ec)
Base Model
Without Double_ISO
318
2
6
4
753311
8822
66
44
7755
2015 SAE NVC Structure Borne NVH Workshopwww.AutoAnalytics.com
Slide 33Slide 33
0.0E+00
1.0E+00
2.0E+00
3.0E+00
5.0 10.0 15.0 20.0
Frequency Hz
Vel
ocity
1.414*fn

Low Frequency Basics• Source -Path-Receiver Concept
• Single DOF System Vibration
• NVH Source Considerations
• Receiver Considerations
2015 SAE NVC Structure Borne NVH Workshopwww.AutoAnalytics.com
Slide 34Slide 34
• Receiver Considerations
• Vibration Attenuation StrategiesProvide Improved IsolationMode ManagementNodal Point MountingDynamic Absorbers

Mode Management Chart
0 5 10 15 20 25 30 35 40 45 50HzFirst Order Wheel/Tire Unbalance V8 Idle
Hot - Cold
EXCITATION SOURCESInherent Excitations (General Road Spectrum, Recipr ocating Unbalance, Gas Torque, etc.)Process Variation Excitations (Engine, Driveline, A ccessory, Wheel/Tire Unbalances)
CHASSIS/POWERTRAIN MODESSuspension Hop and Tramp Modes
2015 SAE NVC Structure Borne NVH Workshopwww.AutoAnalytics.com
Slide 35Slide 35
Hz
Hz0 5 10 15 20 25 30 35 40 45 50
0 5 10 15 20 25 30 35 40 45 50
Ride ModesPowertrain Modes
Suspension Longitudinal ModesExhaust Modes
BODY/ACOUSTIC MODES
Body First Bending First Acoustic Mode
Steering Column First Vertical BendingBody First Torsion
(See Ref. 1)

8 Degree of Freedom Vehicle NVH ModelBending Mode Frequency Separation
Beam Stiffness was
1 2 4 5
8
3
2015 SAE NVC Structure Borne NVH Workshopwww.AutoAnalytics.com
Slide 36Slide 36
Beam Stiffness was adjusted to align Bending
Frequency with Suspension Modes and then
progressively separated back to Baseline.
6 7

Response at Mid Car
10.00
100.00
Vel
ocity
(mm
/sec
)
18.2 Hz Bending
13.Hz Bending
10.6 Bending
8 DOF Mode Separation Example
18.2 Hz
13.0 Hz
10.6 Hz318
2
6
4
753311
8822
66
44
7755
2015 SAE NVC Structure Borne NVH Workshopwww.AutoAnalytics.com
Slide 37Slide 37
0.10
1.00
5 10 15 20Frequency Hz
Vel
ocity
(mm
/sec
)

Response at Mid Car
10.00
100.00
Vel
ocity
(mm
/sec
)
18.2 Hz Bending
13.Hz Bending
10.6 Bending
8 DOF Mode Separation Example
318
2
6
4
753311
8822
66
44
7755
Bending @ 10.6 Hz
Bending @ 13.0 Hz
2015 SAE NVC Structure Borne NVH Workshopwww.AutoAnalytics.com
Slide 38Slide 38
0.10
1.00
5 10 15 20Frequency Hz
Vel
ocity
(mm
/sec
)
All Operating Shapes at 10.6 Hz Bending
@ 18.2 Hz

Low Frequency Basics• Source -Path-Receiver Concept
• Single DOF System Vibration
• NVH Source Considerations
• Receiver Considerations
2015 SAE NVC Structure Borne NVH Workshopwww.AutoAnalytics.com
Slide 39Slide 39
• Receiver Considerations
• Vibration Attenuation StrategiesProvide Improved IsolationMode ManagementNodal Point MountingDynamic Absorbers

First Bending : Nodal Point Mounting ExampleMount at Nodal Point
2015 SAE NVC Structure Borne NVH Workshopwww.AutoAnalytics.com
Slide 40Slide 40
Front input forces Rear input forces
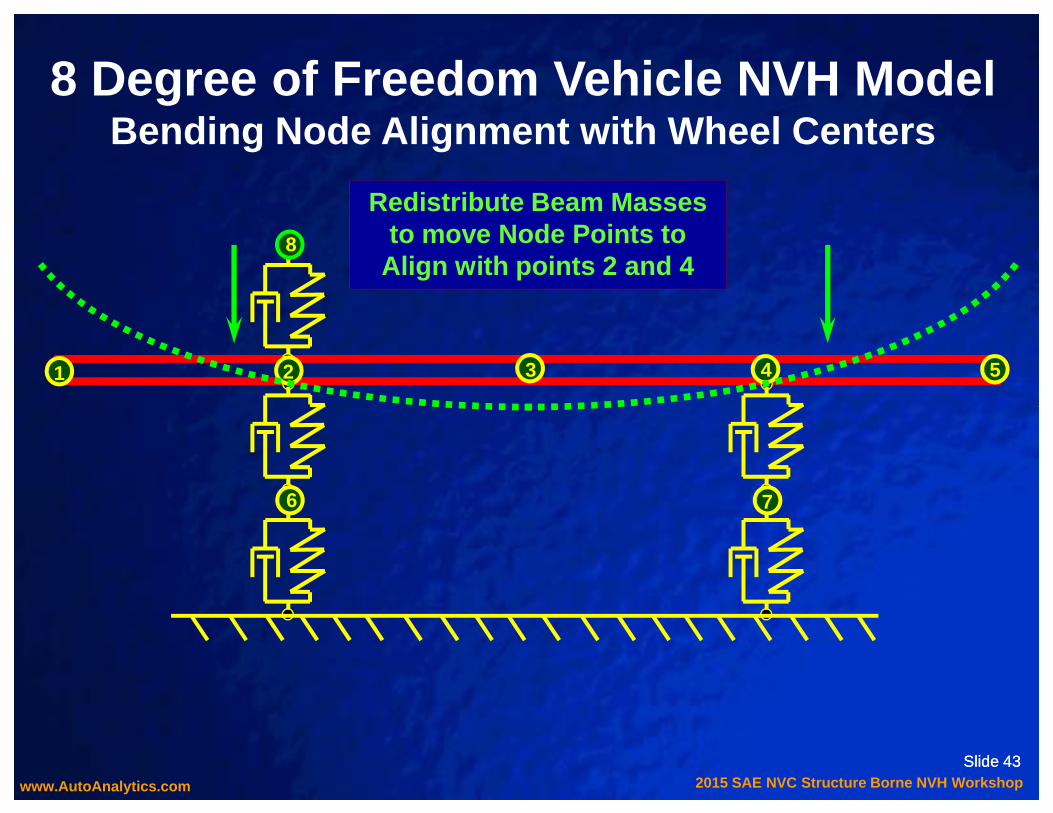
Locate wheel centers at node points of the first be nding modeshape to prevent excitation coming from suspension input motion.

Side View
First Torsion: Nodal Point Mounting ExamplesMount at Nodal Point
2015 SAE NVC Structure Borne NVH Workshopwww.AutoAnalytics.com
Slide 41Slide 41
Passenger sits at node point for First Torsion.
Side View
Transmission Mount of a3 Mount N-S P/T is nearthe Torsion Node.
Rear View
Engine
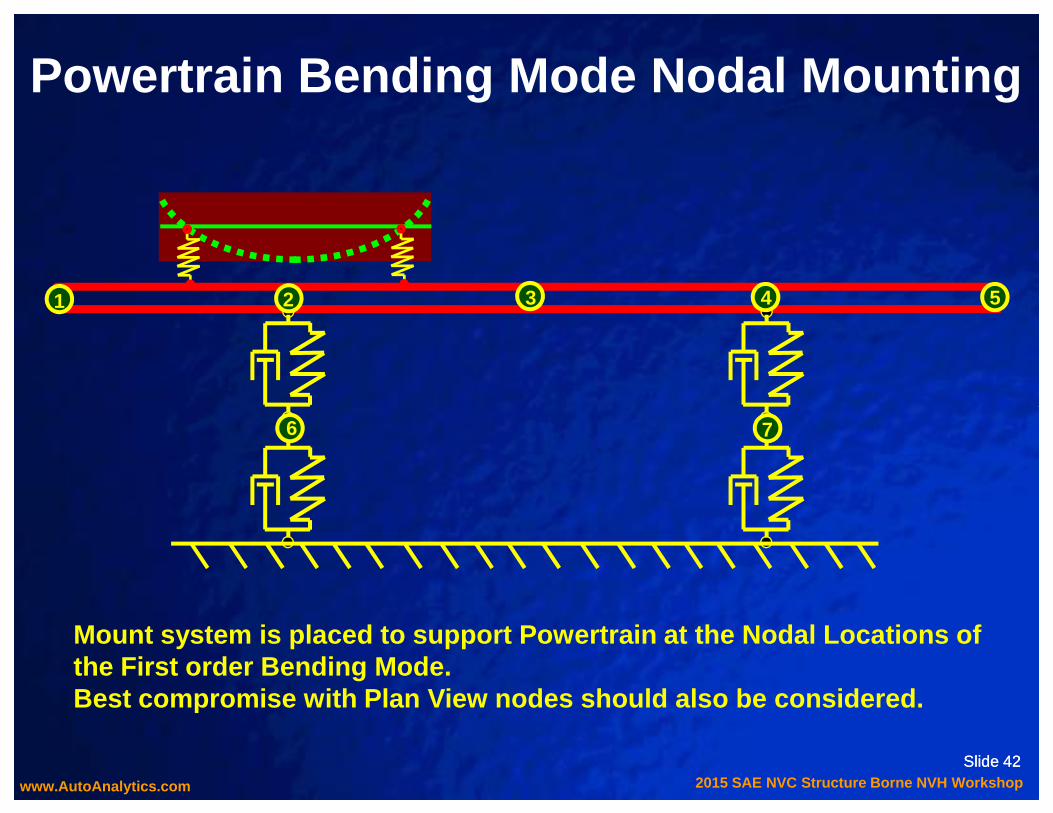
Powertrain Bending Mode Nodal Mounting
1 2 4 53
2015 SAE NVC Structure Borne NVH Workshopwww.AutoAnalytics.com
Slide 42Slide 42
Mount system is placed to support Powertrain at the Nodal Locations of the First order Bending Mode. Best compromise with Plan View nodes should also be considered.
6 7
1 2 4 5
8
3
8 Degree of Freedom Vehicle NVH ModelBending Node Alignment with Wheel Centers
Redistribute Beam Masses to move Node Points to
Align with points 2 and 4
2015 SAE NVC Structure Borne NVH Workshopwww.AutoAnalytics.com
Slide 43Slide 43
6 7

Response at Mid-Car
2.0E+00
3.0E+00
4.0E+00
Vel
ocity
(m
m/s
ec)
Node ShiftedBase Model
First Bending Nodal Point Alignment
318
2
6
4
753311
8822
66
44
7755
2015 SAE NVC Structure Borne NVH Workshopwww.AutoAnalytics.com
Slide 44Slide 44
0.0E+00
1.0E+00
5.0 10.0 15.0 20.0Frequency Hz
Vel
ocity

Response at Mid-Car
2.0E+00
3.0E+00
4.0E+00
Vel
ocity
(m
m/s
ec)
Node ShiftedBase Model
First Bending Nodal Point Alignment
318
2
6
4
753311
8822
66
44
7755
Operating Shapes at
18.2 Hz
2015 SAE NVC Structure Borne NVH Workshopwww.AutoAnalytics.com
Slide 45Slide 45
0.0E+00
1.0E+00
5.0 10.0 15.0 20.0Frequency Hz
Vel
ocity
Node Shifted Model

Diagnosis: Increase at 10.2 Hz
2015 SAE NVC Structure Borne NVH Workshopwww.AutoAnalytics.com
Slide 46
Response at Mid-Car
0.0E+00
1.0E+00
2.0E+00
3.0E+00
4.0E+00
5.0 10.0 15.0 20.0Frequency Hz
Vel
ocity
(m
m/s
ec)
Node ShiftedBase Model

Motion Experienced when Bending is Present
Motion Experienced when Bending is Removed
Diagnosis: Increase at 10.2 HzUp Position
2015 SAE NVC Structure Borne NVH Workshopwww.AutoAnalytics.com
Slide 47
Center - Undeformed Position
Down Position
Low Frequency Basics• Source -Path-Receiver Concept
• Single DOF System Vibration
• NVH Source Considerations
• Receiver Considerations
2015 SAE NVC Structure Borne NVH Workshopwww.AutoAnalytics.com
Slide 48Slide 48
• Receiver Considerations
• Vibration Attenuation StrategiesProvide Improved IsolationMode ManagementNodal Point MountingDynamic Absorbers

YO
xSDOF
Dynamic Absorber Concept
M
YO
x
Auxiliary Spring-Mass-Damperm = M / 10
2DOFM
2015 SAE NVC Structure Borne NVH Workshopwww.AutoAnalytics.com
Slide 49Slide 49

Powertrain Example of Dynamic Absorber
Anti-Node Identifiedat end of Powerplant
2015 SAE NVC Structure Borne NVH Workshopwww.AutoAnalytics.com
Slide 50Slide 50
k c
Absorber attached at anti-node acting in the Vertical and Lateral plane.
Tuning Frequency = √√√√ k/m
m
[Figure Courtesy of DaimlerChrysler Corporation][Figure Courtesy of DaimlerChrysler Corporation][Figure Courtesy of DaimlerChrysler Corporation][Figure Courtesy of DaimlerChrysler Corporation]

Baseline Sound Level63 Hz Dynamic Absorber63 + 110 Hz Absorbers
10 dB
2015 SAE NVC Structure Borne NVH Workshopwww.AutoAnalytics.com
Slide 51Slide 51[Figure Courtesy of DaimlerChrysler Corporation][Figure Courtesy of DaimlerChrysler Corporation][Figure Courtesy of DaimlerChrysler Corporation][Figure Courtesy of DaimlerChrysler Corporation]

Low Frequency Basics - Review• Source -Path-Receiver Concept
• Single DOF System Vibration
• NVH Source Considerations
• Receiver Considerations
2015 SAE NVC Structure Borne NVH Workshopwww.AutoAnalytics.com
Slide 52Slide 52
• Receiver Considerations
• Vibration Attenuation StrategiesProvide Improved IsolationMode ManagementNodal Point MountingDynamic Absorbers
Presentation and References at www.AutoAnalytics.com DOWNLOAD Link

Structure Borne NVH Workshop• Introduction
• Low Frequency Basics
•Live Noise Attenuation Demo
2015 SAE NVC Structure Borne NVH Workshopwww.AutoAnalytics.com
Slide 53Slide 53
•Live
• Mid Frequency Basics
• New Technology
An Overview of Stochastic Simulation
• Closing Remarks
GregGoetchius


Toolbox Demo Noise Test Results
85
61
68
63
70
80
90
SP
L (d
BA
)Tool Box Demo Test Results
85
6168
63
2015 SAE NVC Structure Borne NVH Workshopwww.AutoAnalytics.com
61 63
55
47
39
30
40
50
60
1) Baseline:Imbalance, No
Isolation
2) Imbalance +Isolation
3) No Imbalance,No Isolation
4) No Imbalance,No Isolation +
Damping
5) No Imbalance +Isolation +Damping
6) #5 + Absorption 7) #6 + InsulatorMat
SP
L (d
BA
) 6155
47
39

Structure Borne NVH Workshop• Introduction
• Low Frequency Basics
•LIVE Noise Attenuation Demo
2015 SAE NVC Structure Borne NVH Workshopwww.AutoAnalytics.com
Slide 58
•LIVE
• Mid Frequency Basics
• New Technology
Uncertainty and NVH Scatter
• Closing Remarks
Alan Duncan

Mid Frequency NVH Fundamentals
2015 SAE NVC Structure Borne NVH Workshopwww.AutoAnalytics.com
Slide 59
This looks familiar!Frequency Range of Interest has changed to
150 Hz to 1000 Hz

Typical NVH Pathways to the Passenger
2015 SAE NVC Structure Borne NVH Workshopwww.AutoAnalytics.com
Slide 60
PATHS FOR
STRUCTURE BORNE
NVHNoise Paths are thesame as Low
Frequency Region

Mid-Frequency Analysis CharacterStructure Borne Noise
Airborne Noise
High modal densityand coupling in
source, path andreceiver
� Body Mode separation is less practical in the Mid-Frequency range
� Mode separation in the Chassis is still possiblefor 1 st Order modes.
� NEW STRATEGY: Control Interaction betweenSource and Receiver ( Chassis and Body )
2015 SAE NVC Structure Borne NVH Workshopwww.AutoAnalytics.com
Slide 61
Res
pons
e
Log Frequency
“Low”
Global Stiffness
“Mid”
Local Stiffness+
Damping
“High”
Absorption+
Mass+
Sealing
~ 150 Hz ~ 1000 Hz ~ 10,000 Hz

Mid-Frequency Analysis Character
Control Measures for Mid Frequency Concerns
Effective Isolation
2015 SAE NVC Structure Borne NVH Workshopwww.AutoAnalytics.com
Slide 62
Attenuation along Key Noise Paths

Mid-Frequency Analysis Character
Control Measures for Mid Frequency Concerns
Effective Isolation
2015 SAE NVC Structure Borne NVH Workshopwww.AutoAnalytics.com
Slide 63
Attenuation along Key Noise Paths

Classical SDOF: Rigid Source and Receiver
“Real Structure”Flexible (Mobile)Source and Receiver
Isolation Effectiveness
1.0
2015 SAE NVC Structure Borne NVH Workshopwww.AutoAnalytics.com
Slide 64
1.0 1.414 10.0
f / f n
Effectiveness deviates from the classical developme nt as resonances occur in the receiver structure and in the foundati on of the source.
Isolation Region

Mobility• Mobility is the ratio of velocity response at the excitation point on structure
to the force applied in the direction of the veloci ty
Mobility =Velocity
Force
• Mobility, related to Admittance , characterizes Dynamic Stiffness of the structure at load application point
2015 SAE NVC Structure Borne NVH Workshopwww.AutoAnalytics.com
Slide 65
the structure at load application point
Mobility =Frequency * Displacement
Force
=Frequency
Dynamic Stiffness

• The isolation effectiveness can be quantified by a theoretical model based on analysis of mobilities of receiver, isolator and so urce
• Transmissibility ratio is used to objectively defin e measure of isolation
TR =Force from source without isolator
Force from source with isolator
Isolation
V rReceiverV rReceiverV
V
2015 SAE NVC Structure Borne NVH Workshopwww.AutoAnalytics.com
Slide 66
V ir
V is
F r
F ir
Source
F is
Fs V s
Isolator
VF s =
Y i + Y r + Y s
V r
F r
Receiver
Source
F s V s
VF s =
Y r + Y s
(See Ref. 8)
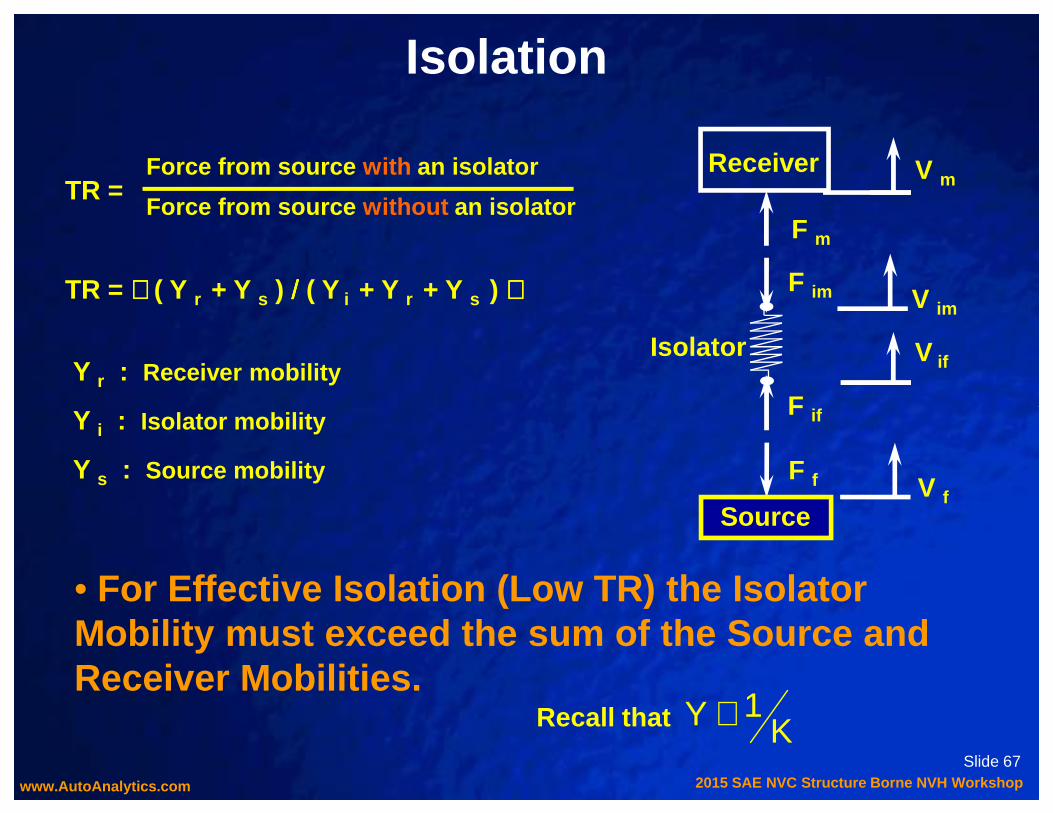
TR = ( Y r + Y s ) //// ( Y i + Y r + Y s )
Y r : Receiver mobility
Y :
V m
V im
V if
F m
F im
Receiver
F if
Isolator
TR =Force from source without an isolator
Force from source with an isolator
Isolation
2015 SAE NVC Structure Borne NVH Workshopwww.AutoAnalytics.com
Slide 67
• For Effective Isolation (Low TR) the Isolator Mobility must exceed the sum of the Source and Receiver Mobilities.
Y s : Source mobility
Y i : Isolator mobility
Source
F if
F f V f
Recall that K 1Y ∝

TR = ( ) //// ( ) K body
1K source
1+
K body
1+
K iso
1K source
1+
K iso
K sourceK body
K iso1.0 5.0 20.0
1.0 0.67 0.55 0.51
Designing Noise Paths
2015 SAE NVC Structure Borne NVH Workshopwww.AutoAnalytics.com
Slide 68
5.0
20.0
0.55 0.29 0.20
0.51 0.20 0.09
Generic targets:body to bushing stiffness ratio of at least 5.0source to bushing stiffness ratio of at least 20.0

Body -to-Bushing Stiffness RatioRelationship to Transmissibility
Tran
smis
sibi
lity
Rat
io T
R
0.3
0.4
0.5
0.6
Target Min. = 5 gives TR = .20
For a source ratio of 20
2015 SAE NVC Structure Borne NVH Workshopwww.AutoAnalytics.com
Slide 69
Stiffness Ratio; K body / K iso
Tran
smis
sibi
lity
Rat
io T
R
0
0.1
0.2
0.3
1 2 3 4 5 6 7 8 9 10
gives TR = .20
Mid-Frequency Analysis Character
Control Measures for Mid Frequency Concerns
Effective Isolation
2015 SAE NVC Structure Borne NVH Workshopwww.AutoAnalytics.com
Slide 70
Attenuation along Key Noise Paths

Identifying Key NVH PathsKey NVH paths are identified by Transfer Path Analy sis (TPA)
Fi
TactileTransfer
AcousticTransfer
Break the system at the points where the forces
2015 SAE NVC Structure Borne NVH Workshopwww.AutoAnalytics.com
Slide 71
Operating loads Operating loads
points where the forces enter the body (Receiver)
Total Acoustic Response is summation of partial res ponses over all noise paths
Pt = ΣΣΣΣ paths [P i ]

Identifying Key NVH Paths
Fi Operating loads createForces (F i) into body atAll noise paths
F F
F FF
F F
P = ΣΣΣΣ [P ]
P/V
(Kbody )V/F P/F
= ΣΣΣΣ [ F * (P/F) ]
2015 SAE NVC Structure Borne NVH Workshopwww.AutoAnalytics.com
Slide 72
Pt = ΣΣΣΣ paths [P i ]
Key NVH Measures of Interest
PiPt = f ( (V/F)iFi (P/F)i )
= ΣΣΣΣ paths [ F i * (P/V) i * (V/F)i]
= ΣΣΣΣ paths [ F i * (P/F) i ]

Identifying Key NVH PathsTPA Example: Dominant Paths over Frequencies
Pi
2015 SAE NVC Structure Borne NVH Workshopwww.AutoAnalytics.com
Slide 73
P/T Load
Crank torque

Identifying Key NVH PathsTPA Example: Contribution at One Transfer Path
Partial response from a particular path: P i = (P/F)i * Fi
P/T Load
Crank torque
Pt
Pi Peak at 91 Hz
2015 SAE NVC Structure Borne NVH Workshopwww.AutoAnalytics.com
Slide 74
(P/F)i
�
Fi
�
Pi
*
Peak at 91 Hz
High Forces

Ranking Key NVH PathsTPA Example: Sum of Key Transfer Paths at One Peak
Total Response: P t = ΣΣΣΣ paths [P i ]
TO
TA
L SO
UN
D
2015 SAE NVC Structure Borne NVH Workshopwww.AutoAnalytics.com
Slide 75
P/T Load
Crank torqueP/T Load
Crank torque
TO
TA
L SO
UN
D
Path N
o. 3
Path N
o. 1
Path N
o. 2
REMAINING PATHS

Recall for Acoustic Response Pt
Pt = ΣΣΣΣ paths [P i ] = ΣΣΣΣ paths [ F i * (P/V) i * (V/F)i]
“ Downstream ” Effects: Body Panels
(P/V)i ���� “Downstream” (Body Panel) System Dynamics: Three Co ncepts:
1. Panel Acoustic Contribution
Defines “the where”(End of the Structural Path)
Increased Stiffness
2. Panel StiffnessIncreasing Stiffness
2015 SAE NVC Structure Borne NVH Workshopwww.AutoAnalytics.com
Slide 76
(End of the Structural Path)
Increased Damping
3. Panel DampingIncreasing Damping

Generic Noise Path Targets
K iso
K body
> 5.0K iso
K source
> 20.0
StructuralMobility < 0.2 to 0.3 mm/sec/N
2015 SAE NVC Structure Borne NVH Workshopwww.AutoAnalytics.com
Slide 77
AcousticSensitivity
< 50 - 60dBL/N
Panel Damping Loss Factor
> .10 - .20
Primary : Minimize the Source Force
< 1.0 N
Final Remarks on Mid Frequency Analysis
• Effective isolation at dominant noise paths is crit ical• Effective isolation at dominant noise paths is crit ical
• Reduced mobilities at body & source and softenedbushing are key for effective isolation
• Reduced mobilities at body & source and softenedbushing are key for effective isolation
• Mode Separation remains a valid strategy as modes• Mode Separation remains a valid strategy as modes
2015 SAE NVC Structure Borne NVH Workshopwww.AutoAnalytics.com
Slide 78
• Other means of dealing with high levels of response[@ Source: Tuned dampers & Isolator
placement at nodal locations ] and[@ Receiver: damping treatments] are effective
• Other means of dealing with high levels of response[@ Source: Tuned dampers & Isolator
placement at nodal locations ] and[@ Receiver: damping treatments] are effective
• Mode Separation remains a valid strategy as modesin the source structure start to participate
• Mode Separation remains a valid strategy as modesin the source structure start to participate

Structure Borne NVH: Concepts Summary
• Source -Path-Receiver as a system1. Reduce Source
2. Rank and Manage Paths
3. Subjective Response: Human Sensitivity
• Mode Management
• Source -Path-Receiver as a system1. Reduce Source
2. Rank and Manage Paths
3. Subjective Response: Human Sensitivity
• Mode Management
2015 SAE NVC Structure Borne NVH Workshopwww.AutoAnalytics.com
Slide 79
• Mode Management
• Nodal Point Placement
• Effective Isolation (Source and Receiver)
• “Downstream” (Body Panel) Considerations
• Mode Management
• Nodal Point Placement
• Effective Isolation (Source and Receiver)
• “Downstream” (Body Panel) Considerations


This presentation is an extension to the ‘NVH Scatter and Uncertainty’ topic from the 2013 workshop.
• Conceptual review of select Stochastic
Simulation studies
An Overview of Stochastic Simulation
2015 SAE NVC Structure Borne NVH Workshopwww.AutoAnalytics.com
Slide 81
• Implications of Stochastic Simulation
• Approaches to Stochastic Simulation

• Conceptual review of select Stochastic
Simulation studies
• Implications of Stochastic Simulation
An Overview of Stochastic Simulation
2015 SAE NVC Structure Borne NVH Workshopwww.AutoAnalytics.com
Slide 82
• Approaches to Stochastic Simulation
Two categories of Stochastic Simulation:• A typical stochastic simulation process
Review of Stochastic Simulation
2015 SAE NVC Structure Borne NVH Workshopwww.AutoAnalytics.com
Slide 83

• Quantify noise factors in loads
• Quantify noise factors in design
• Identify control factors
• Perform Monte-Carlo simulation
• Evaluate vehicle population based
metrics
A Typical Stochastic Simulation Process
Noise Factors
2015 SAE NVC Structure Borne NVH Workshopwww.AutoAnalytics.com
Slide 84
metrics
• Optimize vehicle tuning
Applying Six Sigma Tools to the Rear Driveline Syst em for Improved Vehicle Level NVH Performance, Amit Zutshi, etc.
Response SpreadParameter Effects

Two categories of Stochastic Simulation:• A typical stochastic simulation process• Capturing worst case combinations of ‘error
states’ – loads variations� Driveline imbalance� Wheel/Tire force variations
Review of Stochastic Simulation
2015 SAE NVC Structure Borne NVH Workshopwww.AutoAnalytics.com
Slide 85
� Wheel/Tire force variations

Capturing the ‘Worst Case’ in DrivelineImbalance
An Application of Variation Simulation – Predicting Interior Driveline Vibration Based on Production Va riation of Imbalance and Runout, Glenn A. Meinhardt, etc.
2015 SAE NVC Structure Borne NVH Workshopwww.AutoAnalytics.com
Slide 86
Planes of Imbalance Phasing of Imbalance
Imbalance Distribution ‘Worst Case’ Response

Capturing the ‘Worst Case’ in Wheel/Tire Force Variations
Determination of Interior NVH Levels from Tire Whee l Variations using a Monte Carlo Process, M. Qatu, etc
2015 SAE NVC Structure Borne NVH Workshopwww.AutoAnalytics.com
Slide 87
Types of Forces Application of Forces
Distribution of Variation‘Worst Case’ Response
Comments:• The ‘Worst Case’ response cannot be found from te sting prototypes • It can be found only thru stochastic simulation b y analyzing sufficient no. of samples
Two categories of Stochastic Simulation:• A typical stochastic simulation process• Capturing worst case combinations of ‘error
states’ – loads variations� Driveline imbalance� Wheel/Tire force variations
Review of Stochastic Simulation
2015 SAE NVC Structure Borne NVH Workshopwww.AutoAnalytics.com
Slide 88
� Wheel/Tire force variations
• Capturing experimentally observed response spread – design variations
� Parametric modeling� Non-parametric modeling

Magnitude of 99 Structure Borne Noise Transfer Func tions for Rodeo’s at the Driver MicrophoneMeasurements from Kompella and Bernhard ( Ref. 8 ) 1993 Society of Automotive Engineers, Inc.
Review of Slides from the 2013 WS
2015 SAE NVC Structure Borne NVH Workshopwww.AutoAnalytics.com
Slide 89
Frequency ( Hz )

12 dB Variation
Freymann, BMW NVH Scatter Results
Review of Slides from the 2013 WS
2015 SAE NVC Structure Borne NVH Workshopwww.AutoAnalytics.com
Slide 90
Frequency ( Hz )
Acoustic Scatter from Simulation of the vibroacoustic behavior of a vehicle due to possible tolerances in the component area and in the production process.
© 2000 Society of Automotive Engineers, Inc.Reproduced with permission from paperby Freymann, et. Al. (Ref. 9)
Experimentally detected Scatter in low frequency vibroacoustic behavior of production vehicles.• Scatter is the “Physics”
• NVH is unique in this hyper-sensitive behavior to small variations

Capturing the Response Spread Parametric Study
2015 SAE NVC Structure Borne NVH Workshopwww.AutoAnalytics.com
Slide 91
Comments: • Limited to Few Discrete Variations around the Loc al Design Change• Brute Force – Full Vehicle Runs to Produce Bands

P/T Load2nd Order
95% UprNominal 50% Mean95% Lwr
� � � � � � � � � � � � � � � � � � � � � � � � � � � � � � � � � � � � � � � � � � � � � � � � � � � � � � �
Capturing the Response Spread Non-Parametric Study
2015 SAE NVC Structure Borne NVH Workshopwww.AutoAnalytics.com
Slide 92
� � � � � � � � � ! " # $ % � & % � ' ( ) * % ( � + ) " % ( $ + + � ! , ( " ( $ � & " - � . * - # * % , - ( % / $ ( ) ( ) * * 0 ! * # $ * & ( % ' � # ( ) * 1 � � $ & 2
& � $ % * � � # " ! ) % � ' ( ) * � . , - $ � ' ( ) * � 3 � % $ & . 4 5 6 7 % + " - * 8 * 0 ! * # $ * & ( % ' � # ( ) * � � + " # % 5 ( ) $ & 2 # " 9 - $ & * % 7 : * " &
; " - , * � ' ( ) * * 0 ! * # $ * & ( % 5 ( ) $ + < 2 # " 9 - $ & * 7 : = * " & + � ! , ( " ( $ � & " - � . * - 5 . " % ) * . - $ & * 7 : = * " & ; " - , * � ' ( ) *
# " & . � # * % ! � & % * 5 $ . ( ) $ & % � - $ . - $ & * 7 : > ? @ + � & ' $ . * & + * # * 2 $ � & 8 ( ) * , ! ! * # " & . - � / * # * & ; * - � ! * % " # * ( ) * , ! ! * #
" & . - � / * # ( ) $ + < % � - $ . - $ & * % �
95% Lwr
NOTE: The Method has Quantified the Model and Manufacturi ng Combined Uncertainty.
Comments:• The 95% Confidence Bands encapsulate the Measured Scatter of 20 Vehicles.• Half-Bandwidth Scatter (between Mean and Upr 95%) is similar to K-B results.

Two categories of Stochastic Simulation:• A typical stochastic simulation process• Capturing worst case combinations of ‘error
states’ – loads variations� Driveline imbalance� Wheel/Tire force variations
Review of Stochastic Simulation
2015 SAE NVC Structure Borne NVH Workshopwww.AutoAnalytics.com
Slide 93
� Wheel/Tire force variations
• Capturing experimentally observed response spread – design variations
� Parametric modeling� Non-parametric modeling
Many OEMS are actively pursuing some form of stochastic simulation

• Conceptual review of select Stochastic
Simulation studies
• Implications of Stochastic Simulation
An Overview of Stochastic Simulation
2015 SAE NVC Structure Borne NVH Workshopwww.AutoAnalytics.com
Slide 94
• Implications of Stochastic Simulation
• Approaches to Stochastic Simulation

• Implications to CAE model validation
• Implications to CAE driven design
decision making
Implications of Stochastic Simulation
2015 SAE NVC Structure Borne NVH Workshopwww.AutoAnalytics.com
Slide 95
• Implications to CAE based problem
diagnostics

• Implications to CAE model validation
• Implications to CAE driven design
decision making
Implications of Stochastic Simulation
2015 SAE NVC Structure Borne NVH Workshopwww.AutoAnalytics.com
Slide 96
• Implications to CAE based problem
diagnostics

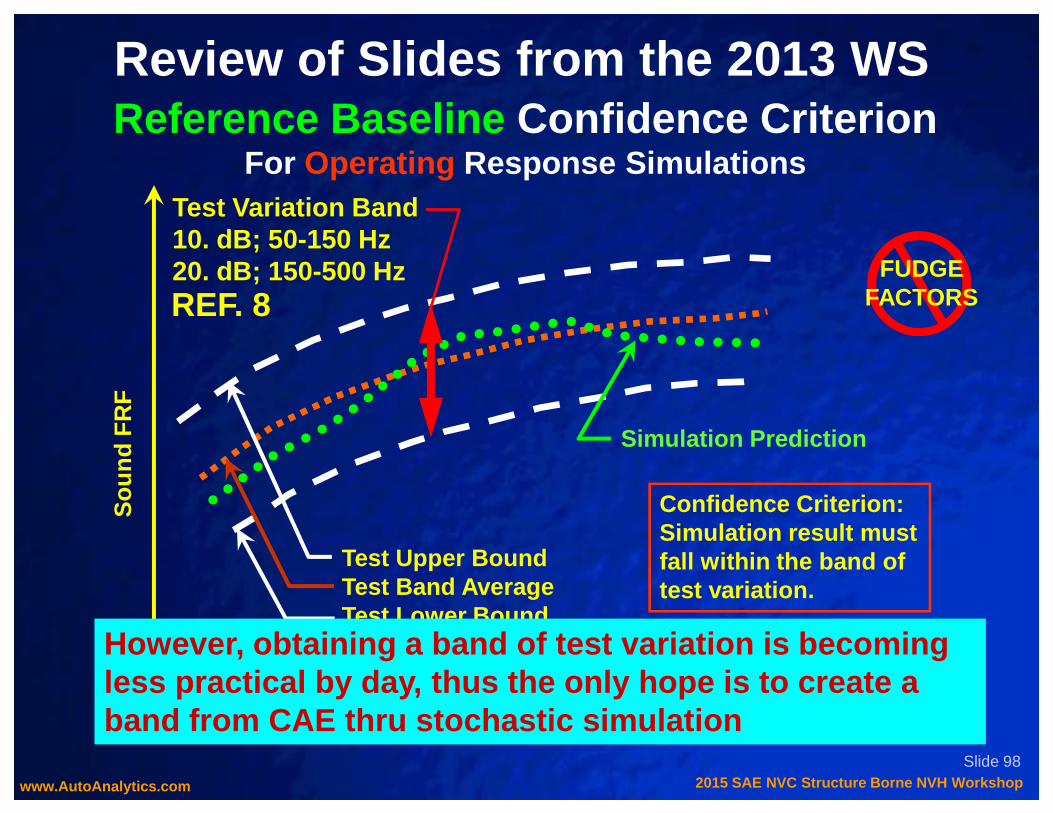
Test Variation Band10. dB; 50-150 Hz20. dB; 150-500 Hz
Reference Baseline Confidence CriterionFor Operating Response Simulations
REF. 8FUDGE
FACTORS
Sou
nd F
RF
Review of Slides from the 2013 WS
2015 SAE NVC Structure Borne NVH Workshopwww.AutoAnalytics.com
Slide 98
Test Upper BoundTest Band AverageTest Lower Bound
Confidence Criterion:Simulation result mustfall within the band oftest variation.
Simulation Prediction
Sou
nd F
RF
Frequency Hz
However, obtaining a band of test variation is beco ming less practical by day, thus the only hope is to cre ate a band from CAE thru stochastic simulation
� � � � � � � � � � � � � � � � � � � � � � � � � � � � � � � � � � � � � � � � � � � � � � � � � � � � � � �
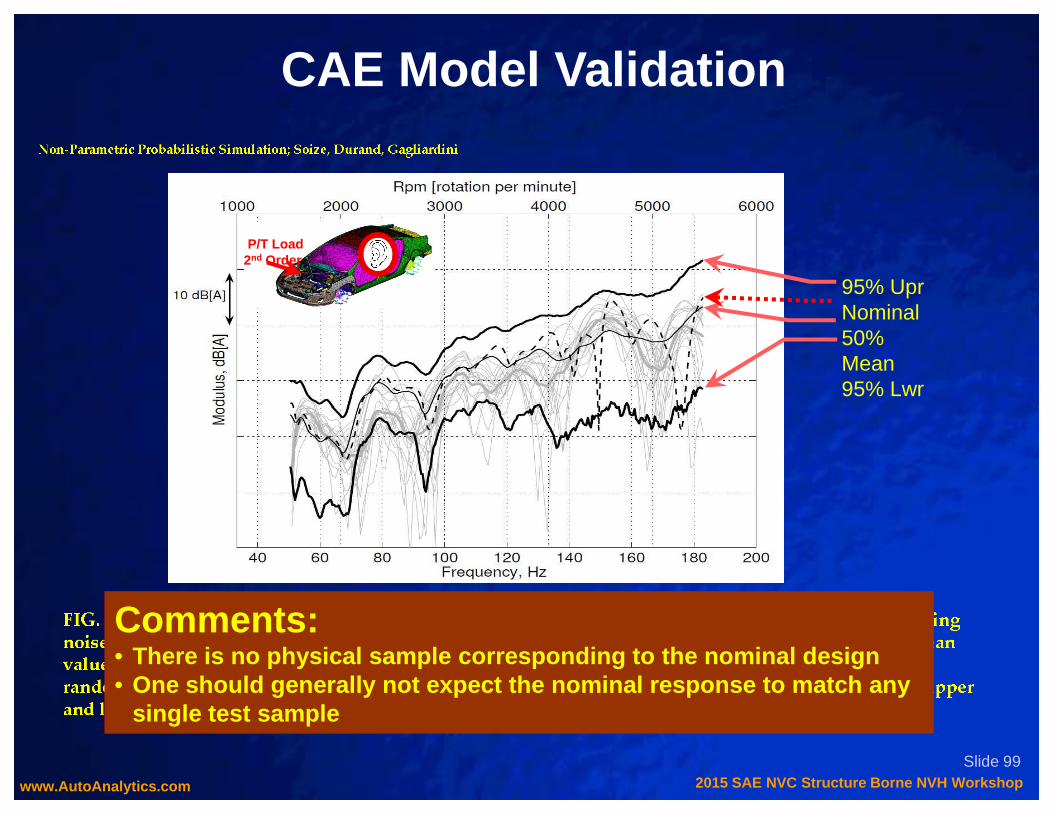
CAE Model Validation
P/T Load2nd Order
95% UprNominal 50% Mean95% Lwr
2015 SAE NVC Structure Borne NVH Workshopwww.AutoAnalytics.com
Slide 99
� � � � � � � � � ! " # $ % � & % � ' ( ) * % ( � + ) " % ( $ + + � ! , ( " ( $ � & " - � . * - # * % , - ( % / $ ( ) ( ) * * 0 ! * # $ * & ( % ' � # ( ) * 1 � � $ & 2
& � $ % * � � # " ! ) % � ' ( ) * � . , - $ � ' ( ) * � 3 � % $ & . 4 5 6 7 % + " - * 8 * 0 ! * # $ * & ( % ' � # ( ) * � � + " # % 5 ( ) $ & 2 # " 9 - $ & * % 7 : * " &
; " - , * � ' ( ) * * 0 ! * # $ * & ( % 5 ( ) $ + < 2 # " 9 - $ & * 7 : = * " & + � ! , ( " ( $ � & " - � . * - 5 . " % ) * . - $ & * 7 : = * " & ; " - , * � ' ( ) *
# " & . � # * % ! � & % * 5 $ . ( ) $ & % � - $ . - $ & * 7 : > ? @ + � & ' $ . * & + * # * 2 $ � & 8 ( ) * , ! ! * # " & . - � / * # * & ; * - � ! * % " # * ( ) * , ! ! * #
" & . - � / * # ( ) $ + < % � - $ . - $ & * % �
Comments:• There is no physical sample corresponding to the no minal design• One should generally not expect the nominal respons e to match any
single test sample

� � � � � � � � � � � � � � � � � � � � � � � � � � � � � � � � � � � � � � � � � � � � � � � � � � � � � � �
CAE Model Validation
P/T Load2nd Order
95% UprNominal 50% Mean95% Lwr
TestMeasurement
2015 SAE NVC Structure Borne NVH Workshopwww.AutoAnalytics.com
Slide 100
� � � � � � � � � ! " # $ % � & % � ' ( ) * % ( � + ) " % ( $ + + � ! , ( " ( $ � & " - � . * - # * % , - ( % / $ ( ) ( ) * * 0 ! * # $ * & ( % ' � # ( ) * 1 � � $ & 2
& � $ % * � � # " ! ) % � ' ( ) * � . , - $ � ' ( ) * � 3 � % $ & . 4 5 6 7 % + " - * 8 * 0 ! * # $ * & ( % ' � # ( ) * � � + " # % 5 ( ) $ & 2 # " 9 - $ & * % 7 : * " &
; " - , * � ' ( ) * * 0 ! * # $ * & ( % 5 ( ) $ + < 2 # " 9 - $ & * 7 : = * " & + � ! , ( " ( $ � & " - � . * - 5 . " % ) * . - $ & * 7 : = * " & ; " - , * � ' ( ) *
# " & . � # * % ! � & % * 5 $ . ( ) $ & % � - $ . - $ & * 7 : > ? @ + � & ' $ . * & + * # * 2 $ � & 8 ( ) * , ! ! * # " & . - � / * # * & ; * - � ! * % " # * ( ) * , ! ! * #
" & . - � / * # ( ) $ + < % � - $ . - $ & * % �
Measurement
Author:Focus of Correlation Effort
All Test Peaks in Band: Results imply test and CAE results are consistent
Comments:• Test CAE comparison can be properly understood only in the context of
a population based analysis• The population context is key to avoid falling into the trap of thinking in
overly simplistic terms about CAE model confidence

• Sample to sample validation• At the vehicle level, one CAE sample cannot be expe cted to
match one random test sample
• Model updating to test - leads to a model of the tes t sample
CAE Model Validation
2015 SAE NVC Structure Borne NVH Workshopwww.AutoAnalytics.com
Slide 101

• Sample to sample validation• At the vehicle level, one CAE sample cannot be expe cted to
match one random test sample
• Model updating to test - leads to a model of the tes t sample
• Population to population validation
CAE Model Validation
2015 SAE NVC Structure Borne NVH Workshopwww.AutoAnalytics.com
Slide 102
• Population to population validation• Population based validation – CAE population to a
reasonable number of test samples
• What if the populations don’t match? – need to start from the
ground up (See Dascotte Ref. #20)• Components – less affected by variation
• Subsystem and vehicle – more and more affected by va riation

• Implications to CAE model validation
• Implications to CAE driven design
decision making
Implications of Stochastic Simulation
2015 SAE NVC Structure Borne NVH Workshopwww.AutoAnalytics.com
Slide 103
• Implications to CAE based problem
diagnostics

� � � � � � � � � � � � � � � � � � � � � � � � � � � � � � � � � � � � � � � � � � � � � � � � � � � � � � �
CAE Driven Design Decision Making
P/T Load2nd Order
95% UprNominal 50% Mean95% Lwr
TestMeasurement
2015 SAE NVC Structure Borne NVH Workshopwww.AutoAnalytics.com
Slide 104
� � � � � � � � � ! " # $ % � & % � ' ( ) * % ( � + ) " % ( $ + + � ! , ( " ( $ � & " - � . * - # * % , - ( % / $ ( ) ( ) * * 0 ! * # $ * & ( % ' � # ( ) * 1 � � $ & 2
& � $ % * � � # " ! ) % � ' ( ) * � . , - $ � ' ( ) * � 3 � % $ & . 4 5 6 7 % + " - * 8 * 0 ! * # $ * & ( % ' � # ( ) * � � + " # % 5 ( ) $ & 2 # " 9 - $ & * % 7 : * " &
; " - , * � ' ( ) * * 0 ! * # $ * & ( % 5 ( ) $ + < 2 # " 9 - $ & * 7 : = * " & + � ! , ( " ( $ � & " - � . * - 5 . " % ) * . - $ & * 7 : = * " & ; " - , * � ' ( ) *
# " & . � # * % ! � & % * 5 $ . ( ) $ & % � - $ . - $ & * 7 : > ? @ + � & ' $ . * & + * # * 2 $ � & 8 ( ) * , ! ! * # " & . - � / * # * & ; * - � ! * % " # * ( ) * , ! ! * #
" & . - � / * # ( ) $ + < % � - $ . - $ & * % �
Measurement
Comments:• Performance of the nominal design often does not fo llow the mean• Nominal performance is a poor representation of pop ulation characteristics• Nominal response curve misses peaks present in the population

� � � � � � � � � � � � � � � � � � � � � � � � � � � � � � � � � � � � � � � � � � � � � � � � � � � � � � � �
DETERMINISTIC MODEL –Nominal Response
STOCHASTIC MODEL –Mean Response
. Amplitude Range = 15 dB
. Decision is Clearer that both Designs are Equal Performers
Blue: New Design
Green: Base
Population Based Metrics
2015 SAE NVC Structure Borne NVH Workshopwww.AutoAnalytics.com
Slide 105
� � � � � 8 4 � � $ & 2 & � $ % * $ & % $ . * " + " # ; % # ! �
� ( � + ) " % ( $ + � . * - - $ & 2 � � � ! " # $ % � & � ' ( ) * * . $ " &
; " - , * � ' " 1 " % * - $ & * + � & ' $ 2 , # " ( $ � & 5 2 # * * & 7 / $ ( ) "
� . $ ' $ + " ( $ � & % * ( 5 1 - , * 1 � - . 7
P/T Load2nd Order
� � � � � 8 4 � � $ & 2 & � $ % * $ & % $ . * " + " # ; % # ! �
' * ( * # $ & $ % ( $ + � . * - % � � � ! " # $ % � & � ' " 1 " % * - $ & *
+ � & ' $ 2 , # " ( $ � & 5 2 # * * & 7 / $ ( ) " � . $ ' $ + " ( $ � & % * ( 5 1 - , *
1 � - . 7 �
. Amplitude Range = 30 dB
. Need Tradeoff Judgment
Performers
Comments:• Population based metrics, such as Mean or 95% Upper Bound are more stable• They can be directly related to the percentage of c ustomers experiencing
unacceptable NVH response

• Implications to CAE model validation
• Implications to CAE driven design
decision making
Implications of Stochastic Simulation
2015 SAE NVC Structure Borne NVH Workshopwww.AutoAnalytics.com
Slide 106
• Implications to CAE based problem
diagnostics

P/T Load2nd Order
95% UprNominal 50% Mean95% Lwr
� � � � � � � � � � � � � � � � � � � � � � � � � � � � � � � � � � � � � � � � � � � � � � � � � � � � � � �
Multiple Sample Analysis
2015 SAE NVC Structure Borne NVH Workshopwww.AutoAnalytics.com
Slide 107
� � � � � � � � � ! " # $ % � & % � ' ( ) * % ( � + ) " % ( $ + + � ! , ( " ( $ � & " - � . * - # * % , - ( % / $ ( ) ( ) * * 0 ! * # $ * & ( % ' � # ( ) * 1 � � $ & 2
& � $ % * � � # " ! ) % � ' ( ) * � . , - $ � ' ( ) * � 3 � % $ & . 4 5 6 7 % + " - * 8 * 0 ! * # $ * & ( % ' � # ( ) * � � + " # % 5 ( ) $ & 2 # " 9 - $ & * % 7 : * " &
; " - , * � ' ( ) * * 0 ! * # $ * & ( % 5 ( ) $ + < 2 # " 9 - $ & * 7 : = * " & + � ! , ( " ( $ � & " - � . * - 5 . " % ) * . - $ & * 7 : = * " & ; " - , * � ' ( ) *
# " & . � # * % ! � & % * 5 $ . ( ) $ & % � - $ . - $ & * 7 : > ? @ + � & ' $ . * & + * # * 2 $ � & 8 ( ) * , ! ! * # " & . - � / * # * & ; * - � ! * % " # * ( ) * , ! ! * #
" & . - � / * # ( ) $ + < % � - $ . - $ & * % �
Comments:• Better ability to capture performance problems with multiple simulation samples• NVH diagnostics based on the worse case sample is s imilar to diagnostics
using hardware

• Conceptual review of select Stochastic
Simulation studies
• Implications of Stochastic Simulation
An Overview of Stochastic Simulation
2015 SAE NVC Structure Borne NVH Workshopwww.AutoAnalytics.com
Slide 108
• Implications of Stochastic Simulation
• Approaches to Stochastic Simulation
• Parametric approach
• Non-parametric approach
• Hybrid approach
Approaches to Stochastic Simulation
2015 SAE NVC Structure Borne NVH Workshopwww.AutoAnalytics.com
Slide 109
• Hybrid approach
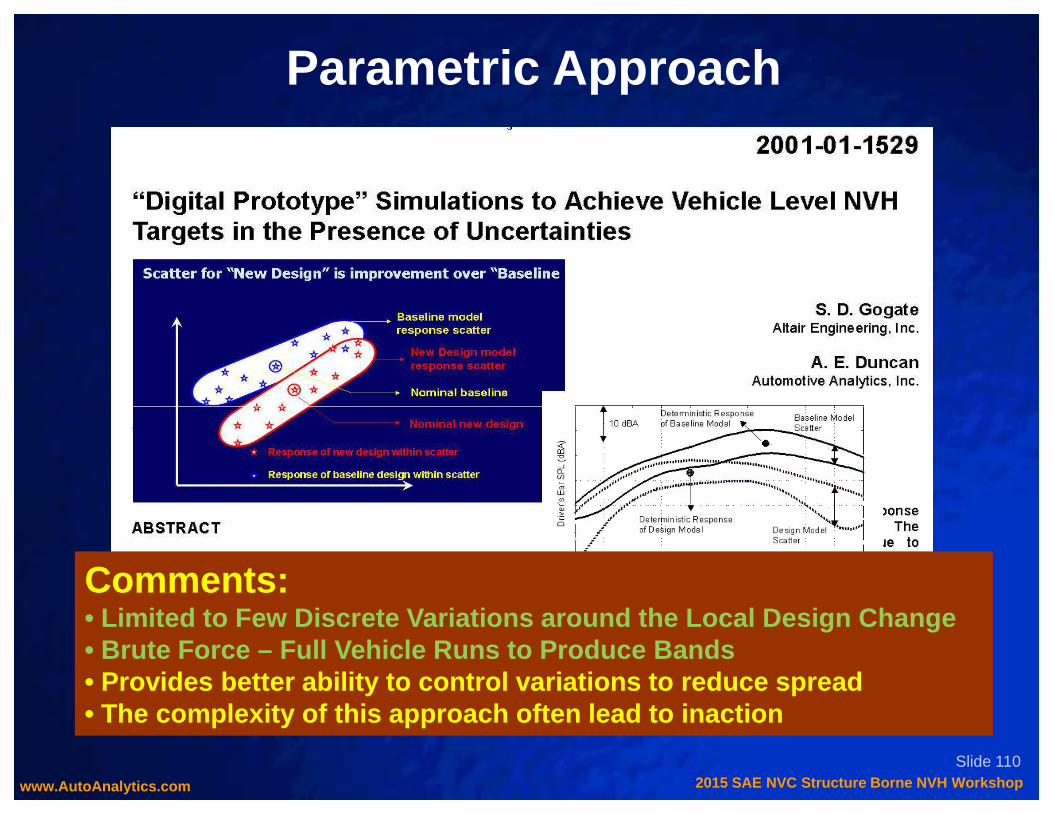
Parametric Approach
2015 SAE NVC Structure Borne NVH Workshopwww.AutoAnalytics.com
Slide 110
Comments: • Limited to Few Discrete Variations around the Loc al Design Change• Brute Force – Full Vehicle Runs to Produce Bands • Provides better ability to control variations to reduce spread• The complexity of this approach often lead to ina ction

� � � � � � � � � � � � � � � � � � � � � � � � � � � � � � � � � � � � � � � � � � � � �
� � � � � � � � � �
Standard Eqn. forStructural-Acoustic Coupling Modal Model
Typical Derivation for creating the randomized Dynamic Matrix with Gaussian Distribution.Non-Parametric : Direct Changes in Modal
Non-Parametric Approach
2015 SAE NVC Structure Borne NVH Workshopwww.AutoAnalytics.com
Slide 111
Changes in Modal Matrices.
The scatter created is a function of:Dispersion Parameter: �
Once determined, � is a constant controlling the amplitude level of scatter.
7 Dispersion Constants are needed:
3 for Structure: M, D, K
3 for Acoustics: M, D, K
1 for Coupling: C n,m
Comments: • This example is inspirational – it shows there is a way forward even when lacking sufficient knowledge on variations• The challenge is to find a way to control the spr ead

• Non-parametric – to decompose vehicle level spread t o subsystem level variations
• Decomposition methods, such as modal participation and TPA,
have been widely used in NVH
Hybrid Approach
2015 SAE NVC Structure Borne NVH Workshopwww.AutoAnalytics.com
Slide 112

• Non-parametric - decomposition to subsystem level• Decomposition methods, such as modal participation and TPA,
have been widely used in NVH
• It would be very beneficial to be able to decompose the vehicle
response spread to contributions from the subsystem level
Hybrid Approach
2015 SAE NVC Structure Borne NVH Workshopwww.AutoAnalytics.com
Slide 113
• Parametric – subsystem and component level
• Much reduced no. of variations
• Possibility to reduce vehicle level spread by contr olling variation in critical subsystems and components


How is stochastic simulation going to change the perception?
Conclusions
� It fails to correlate with test data
� It fails to capture problems at the early upfront stage
Today, many people consider relying on simulation in early upfront design is ‘very risky’ due to real or perceived problems:
� Ensure proper CAE population to samples of test comparison
� Use of multiple simulation sample analysis can capture more peaks
2015 SAE NVC Structure Borne NVH Workshopwww.AutoAnalytics.com
Slide 115
the early upfront stage
� CAE derived design fixes do not always fix the vehicle and can sometimes make the problem worse
� CAE predicted performance can mysteriously change significantly after a model update that cannot be explained by the physical design differences
analysis can capture more peaks
� Understanding that simulation sample to test sample difference could be the cause – multiple sample test data will be helpful
� Use population based metrics, which are much more stable than nominal results, can help us better relate to the impact to the customer

Primary References (Workshop Basis: 4 Papers)
1. A. E. Duncan, et. al., “Understanding NVH Basics”, IBEC, 1996
2. A. E. Duncan, et. al., “MSC/NVH_Manager Helps Chrysler Make
Quieter Vibration-free Vehicles”, Chrysler PR Article,
March 1998.
3. B. Dong, et. al., “Process to Achieve NVH Goals: Subsystem
Structure Borne NVH References
2015 SAE NVC Structure Borne NVH Workshopwww.AutoAnalytics.com
116
3. B. Dong, et. al., “Process to Achieve NVH Goals: Subsystem
Targets via ‘Digital Prototype’ Simulations”, SAE 1999-01-1692,
NVH Conference Proceedings, May 1999.
4. S. D. Gogate, et. al., “’Digital Prototype’ Simulations to Achieve
Vehicle Level NVH Targets in the Presence of
Uncertainties’”,
SAE 2001-01-1529, NVH Conference Proceedings, May
2001
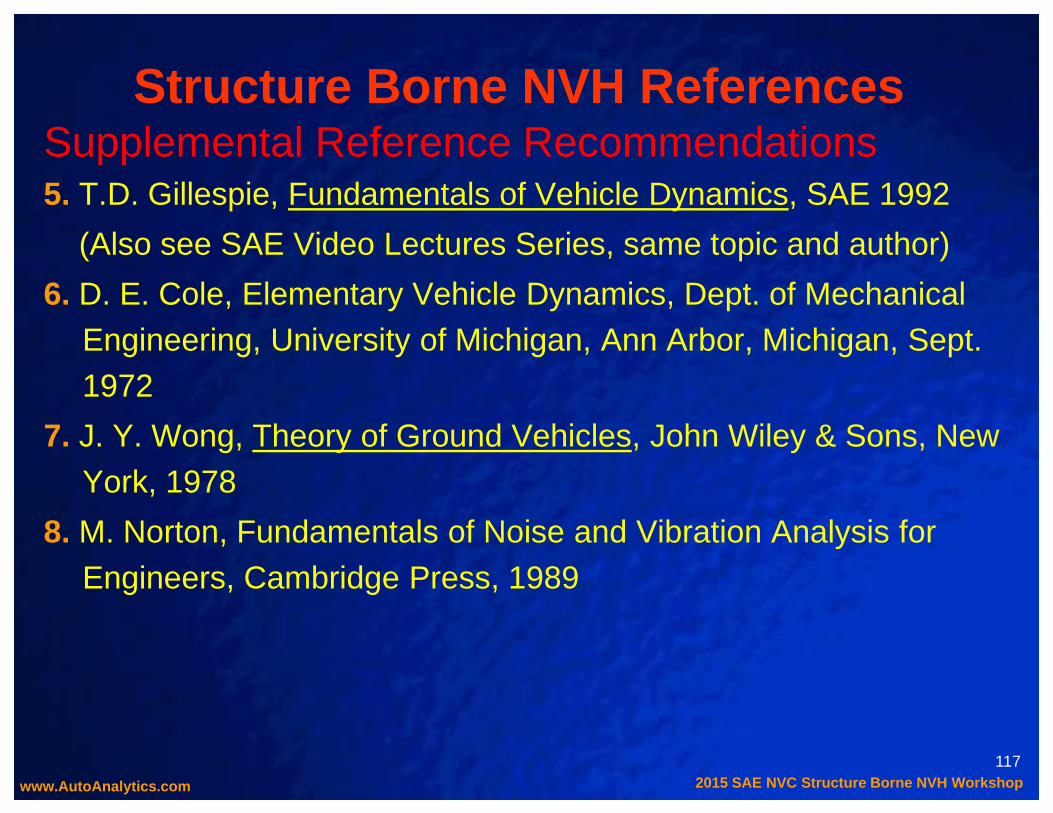
Supplemental Reference Recommendations5. T.D. Gillespie, Fundamentals of Vehicle Dynamics, SAE 1992
(Also see SAE Video Lectures Series, same topic and author)
6. D. E. Cole, Elementary Vehicle Dynamics, Dept. of Mechanical Engineering, University of Michigan, Ann Arbor, Michigan, Sept. 1972
Structure Borne NVH References
2015 SAE NVC Structure Borne NVH Workshopwww.AutoAnalytics.com
117
7. J. Y. Wong, Theory of Ground Vehicles, John Wiley & Sons, New York, 1978
8. M. Norton, Fundamentals of Noise and Vibration Analysis for Engineers, Cambridge Press, 1989

New Technology References (2013 NVH Workshop)
9. Sol, A.; Van Herpe, F.; “Numerical Prediction of a Whole Car Vibro-Acoustic
Behavior at Low Frequencies”; SAE # 2001-01-1521
10. Durand, J.; Gagliardini, L.; Soize, C.; “Nonparametric Modeling of the
Variability of Vehicle Vibroacoustic Behavior”; SAE # 2005-01-2385; SAE 2005
Noise and Vibration Conference Proceedings.
11. Durand, J.; Gagliardini, L.; Soize, C.; “Structural-acoustic modeling of
Structure Borne NVH References
2015 SAE NVC Structure Borne NVH Workshopwww.AutoAnalytics.com
Slide 118
automotive vehicles in presence of uncertainties and experimental identification
and validation”; Journal of the Acoustical Society of America 24, p 1513-1525
12. Jund, A.; Gagliardini, L.; et.al.; “AN INDUSTRIAL IMPLEMENTATION OF
NON-PARAMETRIC STOCHASTIC MODELLING OF VEHICLE
VIBROACOUSTIC RESPONSE” CONVEBONOV Workshop, University of
Sussex, Brighton, UK, March 27-28 2012
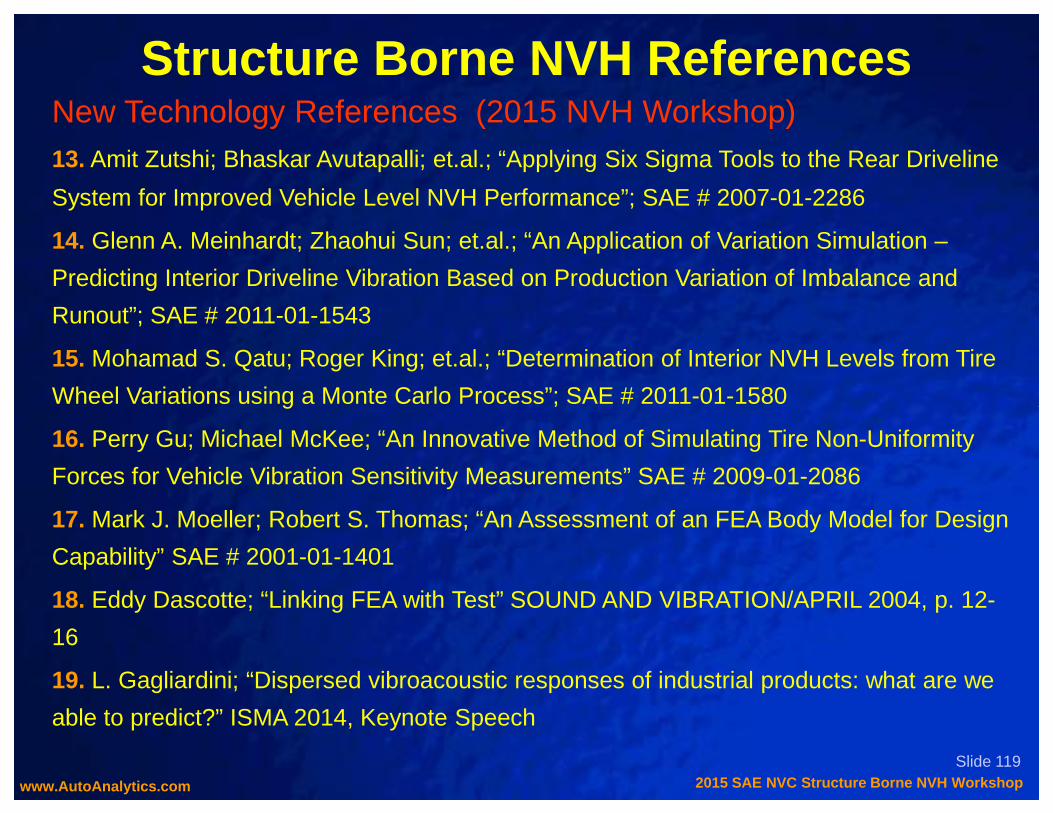
New Technology References (2015 NVH Workshop)13. Amit Zutshi; Bhaskar Avutapalli; et.al.; “Applying Six Sigma Tools to the Rear Driveline
System for Improved Vehicle Level NVH Performance”; SAE # 2007-01-2286
14. Glenn A. Meinhardt; Zhaohui Sun; et.al.; “An Application of Variation Simulation –
Predicting Interior Driveline Vibration Based on Production Variation of Imbalance and
Runout”; SAE # 2011-01-1543
15. Mohamad S. Qatu; Roger King; et.al.; “Determination of Interior NVH Levels from Tire
Wheel Variations using a Monte Carlo Process”; SAE # 2011-01-1580
Structure Borne NVH References
2015 SAE NVC Structure Borne NVH Workshopwww.AutoAnalytics.com
Slide 119
Wheel Variations using a Monte Carlo Process”; SAE # 2011-01-1580
16. Perry Gu; Michael McKee; “An Innovative Method of Simulating Tire Non-Uniformity
Forces for Vehicle Vibration Sensitivity Measurements” SAE # 2009-01-2086
17. Mark J. Moeller; Robert S. Thomas; “An Assessment of an FEA Body Model for Design
Capability” SAE # 2001-01-1401
18. Eddy Dascotte; “Linking FEA with Test” SOUND AND VIBRATION/APRIL 2004, p. 12-
16
19. L. Gagliardini; “Dispersed vibroacoustic responses of industrial products: what are we
able to predict?” ISMA 2014, Keynote Speech
Recommended