Rural Non-Farm Employment:A Study in Uttar Pradash
IAMR Report No. 1/2013

Rural Non-Farm Employment:
A Study in Uttar Pradash
Institute of Applied Manpower Research Planning Commission, Government of India


Acknowledgements
The Institute of Applied Manpower Research (IAMR) is thankful to the members of the Standing Committee on Research Programme (SCRP) of IAMR for approving the study on Rural Non-farm Employment (RNFE) and giving its valuable guidance to conduct the study. The study was organised in four states Uttar Pradesh, Gujarat, Tamil Nadu and Punjab in close collaboration with Giri Institute of Development Studies, Lucknow; Centre for Research in Rural and Industrial Development (CRRID), Chandigarh; Institute of Development Alternatives, Chennai, and Gujarat Institute of Development Research, Ahmedabad. IAMR is grateful to all of them for making valuable contributions.
Institute’s faculty Dr. Rashmi Agrawal, Director (overall in-charge), Dr. Shachi Joshi, Dy. Director, Dr. G. P. Joshi, Dy. Director and Dr. Partha Saha, Dy. Director, were involved in coordinating with the state teams in finalization of survey methods, development of tools, sampling and organising fieldwork and focus group discussions at various places across the states. They were also involved in preparing a framework for report writing. The institute put on records sincere gratitude to all of them.
Besides the above faculty, Dr P. K. Saxena, Joint Director, Shri D. Indrakumar, Asst. Director, Shri Radhey Shyam, Asstt. Director and Shri Sanjay Kumar, Young Professional, were also involved in supervising the data collection at field level. Special thanks to all the staff of IAMR who played important roles in completing the primary survey.
Thanks are also due to Sh. Sudershan Kumar for providing the secretarial assistance and Mrs. Dipika Sen for editing the reports. Shri Dipayan Nandi, Mrs. Shagum Barwal and Mrs. Vaishali Rana, Asstt. Systems Analysts helped in developing software, guiding state teams and in the analysis of data. We are thankful to all of them for their efforts.


Contents
Page No.
Executive Summary xiii
Chapter I Objectives and Methodology
1.1 Background 1
1.2 Objectives 2
1.3 Hypothesis 2
1.4 Methodology 3
Chapter II Growth and Structure of Rural Non-Farm Workers in UP
2.1 Introduction 5
2.2 Trends in RNFE 5
2.3 Shifts in Sectoral Composition of RNFE 8
2.4 Gender Composition of RNFE 9
2.5 Regional Variations 10
2.6 Determinants of RNFE 11
2.7 Poverty Levels in the Rural Non-Farm Sector 12
2.8 Conclusion 13
Chapter III Background of the Villages Surveyed
3.1 Caste Composition 16
3.2 Religion 16
3.3 Literacy Level 17
3.4 Types of Houses 18
3.5 Sources of Drinking Water 18
3.6 Toilet Facilities 19
3.7 Distribution of Households by Land Size 19
3.8 Connectivity to Nearest Town 20
3.9 Distance from Various Facilities 21
3.10 Milk Collection Centres 22
3.11 Occupational Pattern 22
3.12 Villages with Commercial Establishment 23
vi
3.13 Details of Craftsmen and Skilled Workers 23
3.14 Self Help Groups 26
3.15 Migration Pattern 26
3.16 Wage Rates 27
3.17 Government Programmes 28
3.18 Emerging Non-Farm Activities 28
3.19 Conclusions 29
Chapter IV Socio-Economic Characteristics of Sample Households
4.1 Distribution by Social Groups 32
4.2 Distribution by Religion 32
4.3 Household Size 33
4.4 Occupational Pattern 34
4.5 Land Ownership 34
4.6 Main Crops Grown 35
4.7 Age and Sex Distribution of Household Members 36
4.8 Educational Level 38
4.9 Household Assets 42
4.10 Conclusion 44
Chapter V Dynamics of Rural Non-Farm Employment
5.1 Workforce Participation 45
5.2 Shifts in Occupational Pattern 46
5.3 Subsidiary Occupation 50
5.4 Non-Agricultural Labour 51
5.5 Self Employed Workers in Non-Agriculture 56
5.6 Distribution by Earning Levels 62
5.7 Employment in Mahatma Gandhi National Employment Guarantee Scheme 64
5.8 Migrant Workers 66
5.9 Female Employment 68
5.10 Conclusion 71

vii
Chapter VI Characteristics of Village Enterprises
6.1 Type of Enterprises 74
6.2 Year of Establishment 74
6.3 No. of Employees 75
6.4 Average Monthly Earnings 77
6.5 Marketing of Produce 78
6.6 Reasons for Opening the Enterprise 80
6.7 Constraints Faced 80
6.8 Conclusion 81
Chapter VII Rural Non-Farm Employment: Some Correlates
7.1 Sex Composition 83
7.2 Caste and RNFE 84
7.3 Education and RNFE 84
7.4 Education and Employment 86
7.5 Land Size and RNFE 88
7.6 Earnings in Agriculture and Non-Agricultural Sectors 89
7.7 Age and RNFE Employment 89
7.8 Occupational Shifts in Cultivating Households 90
7.9 RNFE and Distance From Town 91
7.10 Conclusion 92
Chapter VIII Findings Based on Focus Group Discussions
8.1 FGD at Meerut 94
8.2 FGD at Varanasi 96
8.3 FGD at Kannauj 98
8.4 FGD at Gonda 100
8.5 Main Conclusions 103
Chapter IX Main Findings and Suggestions 9.1 Growth and Structure of Rural Non-Farm Workers in U.P. 106 9.2 Background of the Surveyed Villages 107 9.3 Socio-Economic Characteristics of Sample Households 109

viii
9.4 Dynamics of RNFE 110
9.5 Characteristics of Village Enterprises 112
9.6 Correlates of RNFE 113
9.7 Findings Based on Focus Group Discussions 114
9.8 Suggestions 115
Bibliography 117
List of Tables
1 List of Villages Surveyed by Districts 3-4
2.1 Sector-wise Growth of Rural Main Workers in UP, 1971-2001 5
2.2 Rural Non-Agricultural Workers in UP and India (UPSS) As Percent of Total Rural Workers
6
2.3 Growth of Rural Workers by Sex according to NSS Rounds 7
2.4 Growth of Rural Workers (UPSS) By Sectors 7
2.5 Shift in Structure of Rural Workforce by Sex: 1993-94 to 2009-10 8
2.6 Shift in Structure of Rural Workforce (Persons): 1993-94 to 2009-10 9
2.7 Share of Male and Female Workers in Total Rural Workers (percent) 9
2.8 Percentage of Non-Agricultural Workers (Main plus Marginal) to Total Rural Workers By Regions in Uttar Pradesh, 2001
10
2.9 Percent Distribution of Rural Workers (UPSS) by Regions, 1999-2000 11
2.10 Results of Linear Multiple Regression Model, 1981 11
2.11 Incidence of Poverty in Rural Uttar Pradesh and India by Occupation Groups (percent)
13
3.1 Distribution of Total Households by Social Groups 16
3.2 Distribution of Total Population of Sample Villages by Religion 17
3.3 Literacy Rates in the Sample Villages by Sex (percent) 17-18
3.4 Distribution of Households by Type of Houses 18
3.5 Distribution of Villages by Source of Drinking Water 19
3.6 Households with Toilet Facility at Home 19
3.7 Distribution of Households by Size of Landholdings 20

ix
3.8 Distribution of Villages by Distance from Nearest Town 20
3.9 Distribution of Villages by Type of Connectivity of Roads with Block HQ 21
3.10 Distance of Facilities from the Village 21-22
3.11 Villages having Poultry Farms and Milk Collection Centres (Nos.) 22
3.12 Distribution of Households in Sample Villages by Main Occupation (percent) 23
3.13 Villages having Different Types of Commercial Establishments (Nos.) 23
3.14 Villages having Different Types of Craftsmen and Skilled Workers (Nos.) 24
3.15 Number of Households involved in Craftsman Activity 25
3.16 Distribution of villages according to Change in the Number of Households of Craftsmen and Skilled Workers
26
3.17 Villages having SHGs (Nos.) 26
3.18 Number of Sample Villages reporting Immigrants during Last Year 27
3.19 Number of Sample Villages reporting Emigrants during Last Year 27
3.20 Distribution of Villages by Level of Average Wage Rate (Nos.) 28
3.21 Number of Villages reporting Implementation of Government Schemes 28
3.22 Emerging Non-Farm Activities in the Surveyed Villages (Nos.) 29
4.1 Distribution of Sample Households by Social Groups 32
4.2 Distribution of Sample Households by Religion 33
4.3 Distribution of Sample Households by Size 33
4.4 Distribution of Households by Principal Occupation 34
4.5 Distribution of Households by Land Ownership 35
4.6 Details of Land Owned and Leased per Sample Household (in acres) 35
4.7 Main Crops Grown by Sample Households 36
4.8 Distribution of Household Members by Age and Gender (Nos.) 37
4.9 Distribution of Household Members by Age and Gender (percent) 38
4.10 Distribution of Household Members by Educational Level (Nos.) 39
4.11 Distribution of Household Members by Educational Level (percent) 40
4.12 Distribution of Household Members by Technical Education (Nos.) 41
4.13 Distribution of Household Members by Technical Education (percent) 42
4.14 Productive Assets owned per Sample Households by District (in ‘000 Rs.) 43
5.1 Workforce Participation Rates (percent) 45

x
5.2 Distribution of Workers by Primary Occupation 46
5.3 Distribution of Household Workers by Primary Occupation Five Years Ago 47
5.4 Distribution of Household Workers by Primary Occupation Ten Years Ago 47-48
5.5 Percent Change in Workers by Sectors during the Last Ten years 48
5.6 Sectoral Shifts in the Employment Pattern during the Last Ten Years 49
5.7 Distribution of Workers by Reasons of Occupational Shift 49-50
5.8 Distribution of Household Members by Subsidiary Occupation 50-51
5.9 Number and Proportion of Non-Agricultural Labour by District 51
5.10 Distribution of Non-Agricultural Labour by Sector 51
5.11 Distribution of Non-Agricultural Labour by Place of Work and Sector 52
5.12 Distribution of Non-Agricultural Labour by Place of Work and District 53
5.13 Distribution of Non-Agricultural Labour by Distance of Workplace 53
5.14 Distribution of Non-Agricultural Labour by Days of Employment 54
5.15 Distribution of Non-Agricultural Labour by Work Hours 54
5.16 Distribution of Non-Agricultural Labour by District and Type of Contract 55
5.17 Distribution of Non-Agricultural Labour by District and Mode of Payment 55
5.18 Average Annual Earnings of Non-Agricultural Labour by Sector (Rs.) 56
5.19 Average Annual Earnings of Non-Agricultural Labour by Social Groups (Rs.)
56
5.20 Distribution of Self-Employed in Non-Agriculture by District 57
5.21 Distribution of Self-Employed in Non-Agriculture by Sector 57
5.22 Distribution of Self-Employed in Non-Agriculture by Activity and Workplace
58
5.23 Distribution of Self-Employed in Non-Agriculture by District and Workplace 58
5.24 Distribution of Self-Employed in Non-Agriculture Five Years Ago 59
5.25 Change in the Self-Employed in Non-Agriculture During Last Five Years 59-60
5.26 Average Annual Net Earnings of Self-Employed in Non-Agriculture by District and Activity (Rs.)
60
5.27 Average Annual Net Earnings of Self-Employed in Non-Agriculture by Social Groups (Rs.)
60

xi
5.28 Workers Employed in Services by District (Nos.) 61
5.29 Workers Employed in Services by Nature of Employment 61
5.30 Average Annual Earning per Person in Service by District (Rs.) 61
5.31 Average Annual Earning per Person in Service by Nature of Employment (Rs.)
62
5.32 Proportion of Salaried Persons receiving Different Type of Benefits (percent) 62
5.33 Distribution of Persons by Range of Annual Earnings by Category of Work 63
5.34 Distribution of Persons Who Got Work in MNREGS by Social Group 64
5.35 Average Days of Employment per Worker in NREGA by Social Group 65
5.36 Average Earnings per Worker in NREGA by District and Social Group (Rs.) 65
5.37 Number of Migrant Workers by District 66
5.38 Distribution of Migrants according to Destination of Migration 66
5.39 Distribution of Migrants according to Period of Migration 67
5.40 Distribution of Migrants by Sector of Employment 67
5.41 Annual Remittance Sent by Migrants (Rs.) 68
5.42 Distribution of Adult Female Members by District and Activity 68-69
5.43 Average Days of Employment of Adult Female Members by Activity 69
5.44 Distribution of Adult Female Members by District and Sector of Employment
70
5.45 Distribution of Adult Female Members by District and Workplace 70
5.46 Problems related to Work faced by Adult Female Members by District 71
6.1 Number of Enterprises by Type of Enterprise 74
6.2 Distribution of Enterprises by Year of Establishment 75
6.3 Number of Employees per Enterprise 76
6.4 Distribution of Employees by Nature of Employment 76-77
6.5 Distribution of Employees by Place of Origin 77
6.6 Average Net Earning er Month by Type of Enterprise (Rs.) 78
6.7 Distribution of Enterprises by Place of Marketing of Their Product 79
6.8 Distribution of Enterprises by Mode of Marketing 79
6.9 Reasons for Establishing the Enterprises in the Village 80
6.10 Constraints faced by Enterprises in running the Establishment 81

xii
7.1 Number of Persons in RNFE Activities by Gender 83
7.2 Number and Proportion of People involved in RNFE Activities by Gender 84
7.3 Number and Proportion of People involved in RNFE Activities by Social Groups
84
7.4 Proportion of Total Workers engaged in Agriculture by Level of Education (%)
85
7.5 Distribution of RNFE Workers by Level of Education (percent) 86
7.6 Number of Days employed in RNFE Activities as Non-Agricultural Labour by Level of Education
87
7.7 Number of Days employed in RNFE Activities as Self-employed in Non-Agriculture by Level of Education
88
7.8 Distribution of RNFE Workers by Size of Land Holdings (percent) 88-89
7.9 Per Worker Annual Earning in Agriculture and Non-Agriculture Sectors (Rs.)
89
7.10 Distribution of Agricultural and Non-Agricultural Workers by Age 90
7.11 Distribution of Workers in Agricultural Household by Main Occupation 91
7.12 Proportion of RNFE Workers in Villages according to Distance from nearest Town (percent)
92
Executive Summary
Diversification of the rural economy is regarded as an essential component of rural transformation. An expanding non-farm sector contributes to higher rural incomes by providing additional opportunities for employment and income in the rural areas. It also helps in raising income levels of the remaining workers in the agricultural sector by reducing population pressure on land as well as through its impact on the agricultural wages. The growth of the non-agricultural sector is rightly regarded as an important element of the strategy for alleviation of rural poverty. Rural households themselves greatly value non-farm employment opportunities as additional or alternative sources of income and employment. It is in this context that the present study was undertaken to look into the situation of RNFE in Uttar Pradesh.
Objectives of the Study
(1) To map the RNFE activities in sample rural areas; (2) To examine the differences across caste and gender in the RNFE; (3) To assess the number of days of employment in RNFE; (4) To study the income levels of various RNFE activities in the select villages; (5) To analyse the factors which encourage employment in rural non-farm sector and (6) To examine the constraints that inhibits the growth of rural non-farm sector. Methodology and Sampling Technique
The study was mainly based on primary data. For the purpose of the survey two districts each were selected from the two major agro-climatic regions of the state, namely Upper Gangetic Plain and Eastern Plain. Meerut and Varanasi were selected to represent the high RNFE districts and Kannauj and Gonda to represent the low RNFE districts. From each selected district five villages were selected (3 villages near the town with good connectivity and 2 villages from remote areas). A complete house listing was done in the village. All the households were then divided into various groups based on principal occupation and social groups. About 20 percent of the households in each subgroup were selected for detailed interview, subject to a maximum of 100 households per village. Thus, total sample size consisted of 4 districts, 20 villages and 1643 households. An enterprise survey was also conducted in the sampled villages. Focus Group discussions were organized at the district headquarters in all the four districts with different stakeholders to understand the dynamics of RNFE.
Major Findings of the Study
The study found out that there is a considerable amount of variations in the proportion of non-farm workers across districts and regions of the state according to 2001 census. The pace of diversification towards non-farm activities has been much faster in the western and central

xiv
regions during the period 1981 and 2001. In the other two regions, the proportion of non-agricultural workers remains more or less the same as it was in 1981.
The analysis of secondary data also revealed that the dynamics of change seem to be different in different regions. It also reveals that there has been a gradual shift in workers away from the agricultural sector during the past decade. Agriculture and animal husbandry employed 58.2 percent workers ten years ago. This proportion declined to 48.1 percent five years ago and presently stands at 43.5 percent. The proportion of agricultural labourers has remained stable at around 3 percent during the decade. The main reasons reported for occupational shifts were small size of land holdings and search for new employment opportunity. Low income in agriculture propelled shift to other sectors. More than half of the non-agricultural labourers were employed in the construction activity and few non-agricultural labourers were employed in manufacturing, trade and hotel and restaurants. However, paradoxically it was found that the non-farm workers are generally employed in the low paid informal sector activities. Hence, the distress hypothesis with respect to rural diversification seems to be working in case of UP. Only in case of services it is found that the level of earning per person is substantially higher than in agriculture or other non-farm activities.

1
CHAPTER I
Objectives and Methodology
1.1 Background
Diversification of the rural economy is regarded as an essential component of rural
transformation. An expanding non-farm sector contributes to higher rural incomes by providing
additional opportunities for employment and income opportunities in the rural areas. It also helps
in raising income levels of the remaining workers in the agricultural sector by reducing
population pressure on land as well as through its impact on the agricultural wages (World Bank,
2002, p. 98). The growth of the non-agricultural sector is rightly regarded as an important
element of the strategy for alleviation of rural poverty. Rural households themselves greatly
value non-farm employment opportunities as additional or alternative sources of income and
employment.
Earlier studies have brought out the positive role of agricultural development, mechanisation of
agriculture and availability of infrastructure, particularly rural infrastructure in promoting the
growth of the rural non-farm employment (Singh, 1994). Papola also finds that the performance
of the rural industrial sector in different states is broadly related to the levels of agricultural
productivity and more closely with the growth rate of agricultural output, mainly through the
general development of the area accompanying fast agricultural growth (Papola, 1987).
Similarly, Mathur and Chattopadhyay, in their inter-state analysis, also find that rural industrial
growth is significantly related to the overall rural development embracing infrastructure and
agricultural technology (Mathur and Chattopadhyay, 1997; pp. 227-229). Micro-studies of
Sharma also reinforce these findings (Sharma, 1994).
The pace of structural transformation in favour of non-agricultural activities in the rural areas in
the country picked up markedly during the post-Green Revolution period. However, the rate of
rural diversification was not uniform across different states and regions. Nor were the factors
associated with this process identical. The impact of the process of diversification on rural
incomes and poverty levels was also uneven. In some regions, the growth of the rural non-farm
sector (RNFS) was associated with the dynamic forces operating in the rural economy leading to
higher rural incomes and declining poverty levels. But in other regions, this shift reflected what
has been called ‘distress diversification’ (Vaidyanathan, 1986). Moreover, these changes have
affected different components of the non-agricultural sector of the rural economy differently,
with some sectors even experiencing a decline. The above divergences in the process of rural
diversification call for regionally and sectorally disaggregated analyses of the phenomenon in
different parts of the country for a better understanding of the underlying processes as well as
their consequences.

2
The rural non-farm employment has been increasing steadily so much so that there are frequent
complaints from the farmers that they face a real crunch in terms of labour availability in
agriculture. This had combined with the MGNREGA to raise the opportunity wages of the rural
workers. The diversification of occupation in employment is intensifying in the State of Uttar
Predesh (UP) during the same period and the younger rural population tries to find a foothold in
the non-agricultural sector. Agriculture growth is a contributing factor. Moreover, the kind of
urban pattern which is fairly widespread in the state and the better connectivity with road
network and various modes of transport also facilitates the increase in rural non-farm
employment (RNFE) in UP. We propose to look into the RNFE in the state in this overall
context.
1.2 Objectives
1. To map the RNFE activities in sample rural areas;
2. To assess the extent of RNFE as compared to the agricultural employment;
3. To assess the differences across caste and gender in the RNFE;
4. To assess the number of days of employment in RNFE;
5. To assess the wage income levels of various RNFE activities in the select villages;
6. To assess the resource endowment of the households and the nature of RNFE;
7. To assess the activity status of all the women in each of the households;
8. To analyse the source of demand for rural non-farm activities and their forward and
backward linkages in the rural economy;
9. To analyse the factors which encourage employment in rural non-farm sector;
10. To analyse the constraints that inhibit the growth of rural non-farm sector.
1.3 Hypotheses
1. RNFE activities would be related to caste and gender;
2. Higher the level of education, higher will be the days of employment in non-farm
activities;
3. Wages and earnings will be higher in rural non-farm activities as compared to that in
agricultural sector;
4. Better infrastructure (roads, communication, power) leads to diversification in RNFE;
5. Low/high agricultural productivity leads to high/low diversification in RNFE;
6. Participation of women in RNFE is lower than that of men
7. Poorer households would be diversifying more into non-farm activities as compared to
richer households.

3
1.4 Methodology
The following methodology has been used for the study. There are four regions as per the
National Sample Survey Organization classification in UP, which can be grouped in two major
regions i. e. upper Ganges plain (Northern and Southern) and Eastern plain. The former region is
agriculturally and industrially more advanced than the later. Districts in these two regions have
been stratified in two categories – one with high RNFE activities and another with low RNFE
activities taking the state average as the cut of point.
From these two categories one district each has been selected on random basis from both the
regions. Thus, a total of four districts have been selected as indicated below:
1. Upper Ganges Plain
High RNFE District- Meerut
Low RNFE District – Kannauj
2. Eastern Plain
High RNFE District - Varanasi
Low RNFE District – Gonda
From each district we selected five villages – 3 villages near the town with good connectivity
and 2 villages from remote areas. A complete house listing was done in the village to identify
various economic activities in the villages All the households were then divided into various
groups based on principal occupation and social groups (such as houses with farm activities and
houses with non-farm activities). About 20 percent of the households in each sub-group were
selected for detailed interview subject to a maximum of 100 households per village. Thus, total
sample size consisted of 4 districts, 20 villages and 1643 households. The list of villages
surveyed in different districts is given below:
Table 1: List of Villages surveyed by Districts
District
Village
No. of Households
in the Village
No. of Sample
Households
Percent of
Sample
Households High RNFE Districts
Meerut
Alampur Bujurg 308 62 20.1
Murlipur phool 577 100 17.3
Atmadnagar Allipur 724 100 13.8
Pillona 334 90 26.9
Aminabad Urf Bara Gaon 454 68 15.0
Total 2397 420 17.5
Varanasi
Sultanpur 406 81 20.0
Koraut 360 72 20.0
Bhathi dhanipur 561 100 17.8
Todarpur 561 100 17.8
Tari 302 61 20.2
Total 2190 414 18.9
High RNFE Total 4587 834 18.2

4
Low RNFE Districts
Kannuaj
Rasulpur 296 60 20.3
Mehndi Pur 320 64 20.0
Udhampur 516 100 19.4
Dedaura Khurd 273 60 22.0
Matauli 534 100 18.7
Total 1939 384 19.8
Gonda
Pure shiva bakhtawar 585 100 17.1
Mohna 380 78 20.5
Susela 319 63 19.7
Beripur Ramnath 422 84 19.9
Pakdi 543 100 18.4
Total 2249 425 18.9
Low RNFE Total 4188 809 19.3
All districts 8775 1643 18.7
Source: Primary Data Survey
An enterprise survey was also conducted in the sampled villages.
Focused Group Discussions were also organized at the district headquarters with different
stakeholders to understand the dynamics of RNFE.

5
CHAPTER II
Growth and Structure of Rural Non-Farm Workers in UP
2.1 Introduction
In this chapter we have analysed some of the features of the process of growth of RNFS in the
state of Uttar Pradesh. The paper discusses the growth in non-farm rural employment (RNFE) in
the state during the last four decades. It also looks at the sectoral and gender distribution of non-
farm rural employment. The regional differences in the dynamics of rural diversification within
the state have also been briefly discussed.
2.2 Trends in RNFE
The rural workforce in UP is much less diversified and the process of diversification towards
non-agricultural employment has been much slower as compared to several other states of the
country (Chadha, 1997 and 2001). The share of non-agricultural workers in the total number of
rural workers has increased from 12.9 per cent in 1971 to 15.5 per cent in 1991 according to the
Census data (Table 2). The number of non-agricultural rural workers in UP increased by 19.8
per cent during 1971-81. But during 1981-91, the increase was as high as 42.9 per cent.
The 1980s, it may be added, had witnessed a relatively high growth of the agricultural sector in
the state, which also pushed up the growth of non-agricultural activities. 2001 Census indicates a
quickening of this trend with an increase of 57.5 per cent in rural non-agricultural workers
against an increase of 35.8 percent in agricultural workers (Table 2.1).
Table 2.1: Sector-wise Growth of Rural Main Workers in UP, 1971-2001
(Nos. in 000s)
Year Agricultural Workers Non-agricultural
Workers
Total Workers
1971
1981
1991
2001
Per cent Increase
1971-81
1981-91
1991-01
20821 (87.1)
23329 (86.3)
28746 (84.5)
39046 (73.4)
12.0
23.2
35.8
3085 (12.9)
3697 (13.7)
5282 (15.5)
8321 (26.6)
19.8
42.9
57.5
23906 (100.0)
27026 (100.0)
34028 (100.0)
47367 (100.0)
13.1
25.9
39.2 Notes: 1. Figures in parentheses show percent to total workers.
2. Figures for 2001 are for main plus marginal workers and are hence not strictly comparable with earlier
figures.
Source: Census Reports
NSS data, which capture the workforce, especially female workforce, more accurately, reveal a
higher degree of rural diversification as compared to the census data (Table 2.1). The proportion
of rural male workers in the non-agricultural sector to the total number of rural male workers
increased modestly, according to NSS data, till 1987-88, rising from 18.1 per cent in 1972-73 to

6
21.1 percent in 1987-88. Since then, the pace of rural diversification has picked up and the
proportion of rural male non- agricultural workers went up to 23.7 per cent in 1993-94 and
further to 28.2 per cent in 1999-2000. Similarly, the proportion of rural female workers in UP
has also registered a steady increase during this period, unlike the slight decline which took place
at the national level. Thus, NSS data reveal a faster pace of transformation of the rural work
force in UP during the 1990s as compared to the preceding two decades. Significantly, the pace
of diversification of the rural workforce during the period 1987-2000 has been faster in UP as
compared to that in India as a whole.
Table 2.2: Rural Non-Agricultural Workers in UP and India (UPSS) As Percent of
Total Rural Workers
Year Male Workers Female Workers
Uttar Pradesh India Uttar Pradesh India
1972-73 18.1 16.7
1977-78 19.7 19.5
1983 22.1 23.2
1987-88 21.1 25.5 8.7 15.3
1993-94 23.7 26.0 10.0 13.8
1999-00 28.2 28.6 12.5 14.6
2004-05 33.7 13.5
2009-10 39.1 37.1 26.3 20.6
Source: NSS Reports
The process of structural shift of rural workers in favour of non-agricultural sector has continued
at a faster pace in the last decade. The proportion of rural male non-agricultural workers have
gone up from 28.2 percent in 1999-00 to 39.1 percent in 2009-10, while the proportion of rural
female non-agricultural workers jumped from 12.5 per cent to 26.3 per cent during the same
period (Table 2.2).
The growth rate of rural workforce has been fluctuating from period to period. Growth rates
picked up during 1987-94, but went down significantly in the next round. The first
quinquennium of the present century saw a very high growth of rural workers in UP; but the
second quinquinnium saw a negative growth, mainly on account of the large decline in the
number of female workforce (Table 2.3). Growth rates of male workers also slowed down during
this period. It will be observed from the table that growth of female workers picks up when male
workers are growing at fast pace, but goes down when growth of male workers slows down.
It suggests that when employment opportunities shrink women workers are first to withdraw.
7
Table 2.3: Growth of Rural Workers by Sex according to NSS Rounds
Sex
1983 1987-88 1993-94 1999-00 2004-05 2009-10
Number of Workers in lakh
Male 266.85 287.16 327.11 339.51 386.73 407.80
Female 115.25 107.78 121.93 128.15 171.75 127.54
Persons 381.01 394.40 447.86 463.74 554.74 530.49
Compound Annual Growth Rates Over Previous Period (percent)
Male
1.48 2.64 0.62 2.64 1.07
Female
-1.33 2.50 0.83 6.03 -5.78
Persons
0.69 2.57 0.58 3.65 -0.89
Source: NSSO Survey Rounds
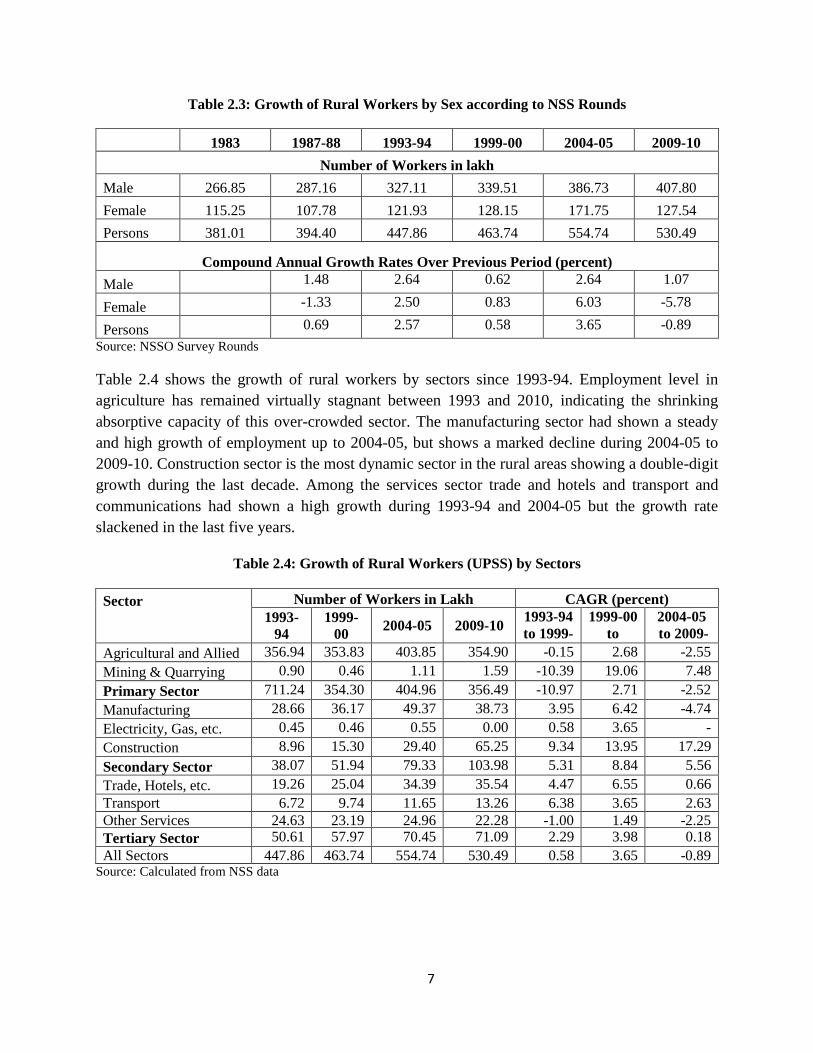
Table 2.4 shows the growth of rural workers by sectors since 1993-94. Employment level in
agriculture has remained virtually stagnant between 1993 and 2010, indicating the shrinking
absorptive capacity of this over-crowded sector. The manufacturing sector had shown a steady
and high growth of employment up to 2004-05, but shows a marked decline during 2004-05 to
2009-10. Construction sector is the most dynamic sector in the rural areas showing a double-digit
growth during the last decade. Among the services sector trade and hotels and transport and
communications had shown a high growth during 1993-94 and 2004-05 but the growth rate
slackened in the last five years.
Table 2.4: Growth of Rural Workers (UPSS) by Sectors
Sector
Number of Workers in Lakh CAGR (percent)
1993-
94
1999-
00 2004-05 2009-10
1993-94
to 1999-
00
1999-00
to
2004-05
2004-05
to 2009-
10
Agricultural and Allied 356.94 353.83 403.85 354.90 -0.15 2.68 -2.55
Mining & Quarrying 0.90 0.46 1.11 1.59 -10.39 19.06 7.48
Primary Sector 711.24 354.30 404.96 356.49 -10.97 2.71 -2.52
Manufacturing 28.66 36.17 49.37 38.73 3.95 6.42 -4.74
Electricity, Gas, etc. 0.45 0.46 0.55 0.00 0.58 3.65 -
Construction 8.96 15.30 29.40 65.25 9.34 13.95 17.29
Secondary Sector 38.07 51.94 79.33 103.98 5.31 8.84 5.56
Trade, Hotels, etc. 19.26 25.04 34.39 35.54 4.47 6.55 0.66
Transport
Communication etc.
6.72 9.74 11.65 13.26 6.38 3.65 2.63
Other Services 24.63 23.19 24.96 22.28 -1.00 1.49 -2.25
Tertiary Sector 50.61 57.97 70.45 71.09 2.29 3.98 0.18
All Sectors 447.86 463.74 554.74 530.49 0.58 3.65 -0.89 Source: Calculated from NSS data

8
2.3 Shifts in Sectoral Composition of RNFE
The structure of rural workforce has been undergoing marked changes in favour of the
non-agricultural activities. There has been a continuous and steady decline in the proportion of
agricultural workers both for males and females in successive NSS rounds. Thus, the proportion
of male agricultural workers to total male rural workers has declined from 76 percent in 1993-94
to only 61 percent in 2009-10 (Table 2.5). The women workforce is much less diversified and the
rate of decline in the share of agricultural workers was also slower. The biggest gains have been
registered by construction followed by manufacturing. In services sector, main shifts have taken
place in favour of trade and hotels. The share of other services has gone done both for males and
females.
Table 2.5: Shift in Structure of Rural Workforce by Sex: 1993-94 to 2009-10
Sector
Percent of Total Rural Workers Employed in the Sector
Male Female
1993-
94
1999-
00
2004-
05
2009-
10
1993-
94
1999-
00
2004-
05
2009-
10
Agricultural and Allied 76.0 71.8 66.3 60.9 89.5 87.5 86.5 85.4
Mining & Quarrying 0.2 0.2 0.2 0 0.0 0.0 02 0.0
Primary Sector 76.2 72.0 66.5 60.9 89.5 87.5 86.7 85.4
Manufacturing 7.0 8.3 9.6 7.7 4.8 6.4 7.4 6.3
Electricity, Gas, etc. 0.2 0.2 0.1 0 0.0 0 0.0 0.0
Construction 2.6 4.4 7.4 15.6 0.2 0.5 0.6 2.0
Secondary Sector 9.8 12.9 17.1 23.3 8.0 8.3
Trade, Hotels, etc. 5.1 6.7 8.2 8.0 2.1 1.9 1.8 2.6
Transport,
Communication, etc. 2.1 2.9 3.0 3.2 0.0 0.0 0.1 0.1
Other Services 6.5 5.5 5.1 4.1 2.9 3.7 3.2 3.4
Tertiary Sector 13.7 15.1 16.3 15.3 5.0 5.6 5.1 6.1
All Sectors 100.0 100.0 100.0 100.0 100.0 100.0 100.0 100.0
Source: Computed from various NSS rounds
Looking at the total rural workers we find that the share of agricultural workers has gone down
from 79.7 percent in 1993-94 to 66.9 percent in 2009-10 (Table 2.6). The pace of shift was
fastest during the period 2004-05 to 2009-10 reflecting the declining absorptive capacity of the
agricultural sector. The manufacturing sector registered a continuous increase in its share till
2004-05, but shows a decline in the latest round. But there has been a remarkable increase in the
share of construction workers. Within the tertiary sector largest gain was made by trade and
hotels, followed by transport and communication. But other services show a decline in their
share.

9
Table 2.6: Shift in Structure of Rural Workforce (Persons): 1993-94 to 2009-10
Sector Percent of Total Rural Workers Employed in the Sector
1993-94 1999-00 2004-05 2009-10
Agricultural and Allied 79.7 76.3 72.8 66.9
Mining & Quarrying 0.2 0.1 0.2 0.3
Primary Sector 79.9 76.4 73.0 67.2
Manufacturing 6.4 7.8 8.9 7.3
Electricity, Gas, etc. 0.1 0.1 0.1 0.0
Construction 2.0 3.3 5.3 12.3
Secondary Sector 8.5 11.2 14.3 19.6
Trade, Hotels, etc. 4.3 5.4 6.2 6.7
Transport, Communication, etc. 1.5 2.1 2.1 2.5
Other Services 5.5 5.0 4.5 4.2
Tertiary Sector 11.3 12.5 12.7 13.4
All Sectors 100.0 100 100.0 100.0
Source: NSS Various Rounds
2.4 Gender Composition of RNFE
Female workers constituted only 23 percent of the rural workers in 2009-10. Their share was 30
percent in agriculture and allied activities, 19 percent in manufacturing, 25 percent in other
services and 8.6 percent in trade and hotels (Table 2.7). Overtime, the proportion of women
workers shows a decline – from 27.15 percent in 1993-94 to 23.13 in 2009-10. There has been a
marked decline in share of female workers over this period in secondary sector and trade and
hotels. The share of women in manufacturing also shows a decline. However, in other services
the share of women has increased.
Table 2.7: Share of Male and Female Workers in Total Rural Workers (percent)
Sector
1993-94 2009-10
Male Female Male Female
Agricultural and Allied 69.49 30.51 69.98 30.02
Mining & Quarrying 100.00 0.00 100.00 0.00
Primary Sector 69.55 30.45 69.67 30.33
Manufacturing 79.64 20.36 81.08 18.92
Electricity, Gas, etc. 100.00 0.00 100.00 0.00
Construction 97.21 2.79 97.50 2.50
Secondary Sector 84.02 15.98 91.38 8.62
Trade, Hotels, etc. 86.69 13.31 91.79 8.21
Transport, Communication, etc. 100.00 0.00 98.40 1.60
Other Services 85.74 14.26 75.04 24.96
Tertiary Sector 88.03 11.97 87.77 12.23
All Sectors 72.85 27.15 76.87 23.13
Source: Computed from NSS data

10
2.5 Regional Variations
There are considerable variations in the proportion of non-farm workers across districts and
regions of the state (Papola, 1982; Singh, 1994). This proportion was 29.3 percent in the hill
region, 15.0 percent in the western region, 19.6 per cent in the eastern region, 9.1 per cent in the
central region and 11.1 percent in Bundelkhand in 1981 according to Census data. The pattern of
growth of the number of non-farm workers also varied across the districts. In general,
agricultural workers show a relatively high rate of growth in the western and central regions,
while the other three regions show a relatively faster growth of the non-agricultural workers
indicating the operation of the residual sector hypothesis in the backward regions (Singh, 1994).
The 2001 Census shows that the pace of diversification towards non-farm activities has been
much faster in the western and central regions during the last two decades (Table 11). In the
other three regions, the proportion of non-agricultural workers remains more or less the same as
it was in 1981. The proportion of female workers in the non-agricultural sectors to the total
number of rural female workers is markedly higher in the western region as compared to other
regions.
Table 2.8: Percentage of Non-Agricultural Workers (Main plus Marginal) to Total Rural
Workers by Regions in Uttar Pradesh, 2001
Region Persons Males Females
Western 27.28 24.88 40.80
Central 17.39 17.53 16.88
Eastern 21.51 25.51 13.16
Bundelkhand 13.91 17.23 8.04
Uttaranchal 28.50 40.92 11.48
Uttar Pradesh 22.61 24.11 18.60
U.P. Plains 22.29 18.15 13.16
Source: Census of India, 2001
55th
round NSS (1999-2000) data also show that the proportion of non-agricultural workers is
much higher in the western region as compared to that in the other regions, among which
differences in this proportion are not marked (Table 2.9). The sectoral pattern of non-agricultural
employment also shows important regional variations. Thus, a relatively higher proportion of
rural workers is found in the manufacturing sector in the western and eastern regions.
The proportion of construction workers is markedly higher in the hill region and in Bundelkhand.

11
Table 2.9: Percent Distribution of Rural Workers (UPSS) by Regions, 1999-2000
Source: NSS 55th
Round
2.6 Determinants of RNFE
Multiple regression analysis across districts in U.P. and its regions for 1981 highlights the role of
factors like income inequality, use of electricity per hectare of net sown area (showing
modernization of agriculture), agricultural workers per 100 hectares of the net sown area
(showing population pressure on land and its absorptive capacity) and the degree of urbanisation.
These four variables are able to explain around half the variation in the proportion of non-
agricultural rural workers at the district level (Table 2.10).
Table 2.10: Results of Linear Multiple Regression Model, 1981
Note: * Significant at 5 per cent level
Source: Singh (1994)
The nature of the relationship seems to differ according to different regions. Inequality in rural
consumption expenditure (which was found to be positively associated with levels of per capita
Sectors Himalayan Western Central Eastern Southern Uttar
Pradesh Agricultural and
Allied
79.29 73.08 79.78 76.62 77.66 76.25
Mining &
Quarrying
0.00 0.13 0.04 0.07 1.13 0.13
Manufacturing 3.89 8.78 6.31 8.65 2.59 7.79
Electricity, Gas,
etc.
0.25 0.24 0.18 0.01 0.02 0.12
Construction 7.61 4.01 2.46 1.90 9.84 3.26
Trade, Hotels, etc. 2.06 5.67 5.61 5.46 4.82 5.37
Transport,
Communication,
etc.
2.01 3.02 1.73 1.73 1.09 2.11
Financial Services,
etc.
0.53 0.30 0.32 0.34 0.07 0.32
Other Services 4.36 4.78 3.58 5.21 2.78 4.65
All Sectors 100.00 100.00 100.00 100.00 100.00 100.00
Variables Uttar Pradesh Western
Region
Central
Region
Eastern
Region
Constant 1.8448 26.4568 -2.2358 7.0042
X1Gini Coefficient of Consumer
Expenditure
30.6069
(1.21)
25.0835
(0.7524)
11.9380
(0.3803)
45.9126
(0.9795)
X2 Electricity Consumption per hectare 0.0310*
(4.84)
0.0314*
(4.6866)
0.0219
(1.4600)
0.0391*
(2.5389)
X3 Agricultural Workers per 100
Hectare of Net Sown Area
0.0037
(0.13)
-0.1727*
(3.0512)
-0.0067
(0.2012)
-0.0808
(0.7447)
X4 Percentage of Urban to Total
Percentage
-0.0463
(0.91)
-0.7820*
(1.4644)
0.1757*
(2.5337)
0.0452
(0.3437)
R2
0.4848 0.7510 0.5233 0.4905
F 10.6304 14.3223 2.9460 4.1198

12
rural consumption expenditure) was positively related to the proportion of non-farm employment
in all the regions, though the value of the regression coefficient was statistically weak. The use of
electricity consumption per hectare (which was strongly correlated with other indicators of
agricultural mechanisation like the use of tractors and pump-sets) is positively related with the
proportion of non-farm employment in all the regions. A higher labour/land ratio (showing lower
absorptive capacity of agriculture) is negatively associated with non-farm employment in all the
regions, suggesting the operation of the distress migration hypothesis. The impact of urbanisation
shows a mixed result. In the western region, the relationship is negative, though it is positive but
not very significant in the relatively backward regions of central and eastern UP.
The dynamics of change seem to be different in different regions. In the agriculturally dynamic
western region, the process of diversification in favour of non-agricultural activities is more
closely related to the internal dynamic of the agricultural sector. Linkages between agricultural
and non-agricultural sectors appear to be stronger in this region. In the other two regions, namely
central and eastern UP overcrowding of agriculture coupled with low productivity is forcing
workers to seek non-agricultural employment in low income generating activities in the informal
sector.
Non-agricultural enterprises located in the more developed regions are found to generate higher
incomes. Significant differences have been found to exist in the capital intensity, use of hired
labour, productivity per worker and marketing pattern in the rural industries located in the
agriculturally prosperous western region and those located in depressed areas like the eastern
region (Papola, 1982). Thus, the units located in Muzaffarnagar district in the western region
provided reasonable income and were carried out as the sole or main occupation in a much larger
proportion than in Balia district in eastern region where quite a number of members of industrial
households had to look for other sources of income as industrial units do not provide sufficient
income (Papola, 1982).
2.7 Poverty Levels in the Rural Non-farm Sector
An expanding non-farm sector provides opportunities for additional income and employment on
a full- or part-time basis to the large rural population dependent on the agricultural sector. It can,
thus, have both direct and indirect effects on rural poverty levels. A lot, however, depends on the
type of activities in the non-farm sector and the level of earnings as well as the regional setting in
which these changes take place. In highly populated regions with low agricultural productivity,
income levels in the non-farm sector also tend to be low. Thus, high incidence of poverty is
found to occur in the non-farm sector. Most of the rural diversification in U.P. appears to be of
this type.
Studies based on NSS consumption data indicate the prevalence of high poverty levels in the
rural non-farm sector in UP (Bhalla, 2000). In services like trade, transport and other services,
which are usually dominated by informal enterprises, around one-third of the persons were found

13
to subsist below the poverty line in 1993-94 (Table 2.11). Poverty levels in rural manufacturing
and construction are found to be still higher, viz. 43.19 percent and 54.04 percent respectively.
It however needs to be added that the incidence in poverty in all the non-farm sectors is distinctly
lower than poverty levels for agricultural labourers. We find a much lower poverty ratio only in
the case of health and educational services, where regular paid jobs in the public sector
dominate. Poverty levels in the agricultural as well as non-agricultural sectors in U.P. are also
found to be higher than the national average, indicating low earning levels in non-farm activities.
This is reflective of the distress diversification in rural areas of the state, though there are
significant inter-regional differences in the situation.
Table 2.11: Incidence of Poverty in Rural Uttar Pradesh and India by Occupation Groups (percent)
Sector Uttar Pradesh India
1987-88 1993-94 1987-88 1993-94
1. Agriculture
(a) Cultivators
(b) Agricultural Labour
36.05
32.75
62.92
37.04
31.06
62.78
36.88
28.25
57.86
35.96
26.35
54.65
2. Services
(a) Health and Education
(b) Other Services
25.17
14.10
34.75
27.45
16.24
32.40
19.81
10.77
25.91
17.79
8.41
23.91
3. Manufacturing 38.27 43.19 33.33 32.24
4. Construction 35.34 54.04 44.25 42.42
5. Trade 30.40 32.04 24.88 24.85
6. Transport 29.41 35.38 26.83 27.64
Source: Bhalla, Sheila (2000), Behind Poverty: The Qualitative Deterioration of Employment Prospects for Rural
Indians, Working Paper No.7, Institute for Human Development, New Delhi.
2.8 Conclusion
The above analysis has revealed a modest growth of RNFS in Uttar Pradesh in the past two
decades, though the process seems to have accelerated in the 1990s. The major contributory
factors behind this trend have been the process of agricultural modernization and the expansion
of government employment especially during the seventies and the eighties. It was also found
that many of the traditional household industries are declining with changes in consumers’ tastes
and competition from factory made products from outside. Some of the traditional exports like
carpets are also facing stagnation through increasing competition and ban on use of child labour.
But some traditional industries, which have modernized in terms of use of material, design, etc.,
have experienced high growth, for instance chikan industry of Lucknow.
The Chikan industry was traditionally confined to Lucknow city and a few nearby villages and
mostly catered to the local demand. In the last two decades this industry has registered a
phenomenal growth and has now reported to have spread over a much larger area covering
several neighbouring districts. Major contributory factors in the growth of this industry have

14
been the changes introduced in type of material used, design, type of products, etc. The entry of
new entrepreneurs and NGOs like Sewa has played a leading role in this process, expanding the
market of chikan products to other parts of the country as well as to abroad. The growth of
chikan industry has generated rural employment in the surrounding region of Lucknow,
particularly among the poorer section and women. Even women of the poor Hindu families are
now taking up chikan work, which was almost exclusively practiced by Muslim families earlier.
One, however, needs to add that the gains of this growth have largely gone to the traders selling
the products, while wage/income levels have remained nearly static for the workers, who belong
to the poorest rural strata.
Our analysis also reveals that the participation of women in RNFS in U.P. is very low and that
they are mostly employed in low income activities like the household industry, construction, etc.
The regional dynamics of growth also appear to be different in different parts of the state. In the
relatively prosperous region of western UP, the income levels in the non-agricultural activities
are higher. But in poorer regions like eastern UP, the growth of RNFS reflects distress
employment, with low income levels. The evidence about the impact of urbanisation is also not
very clear, though in general it is found to be helpful in promoting the growth of RNFS. In the
very small towns, which predominate in UP, employment opportunities also tend to be fewer.
But medium and large towns are able to attract workers from the surrounding rural areas on a
considerable scale.
Much of the process of diversification to non-farm employment is of the distress type.
High levels of poverty are found to prevail in the RNFS of the state, particularly in the
manufacturing and construction sectors. In general, self-employed workers have lower income
levels as compared to the workers in regular paid jobs.
The gist of the above discussion is that in order to examine the role of RNFS in rural
transformation we have to carry out the analysis at a disaggregated level in terms of sub-sectors,
gender and regions. It is very important to keep in mind the regional setting in which the process
of rural transformation is taking place. Data gaps in this respect are formidable. Data are
available only for employment levels by major sectors. Data are required at a disaggregated level
on various related aspects such as income and wage levels, and regularity, and the duration and
type of employment. Another important data gap is related to the location of the activities. Many
of the rural workers, who are reported to be employed in the non-farm sector, are actually
residing in the rural areas, but go to work in the nearby towns. Only detailed empirical studies in
different regions can throw light on these dimensions.
No doubt, diversification of the rural economy through the promotion of RNFS is urgently
required for raising income and employment levels, and for reducing poverty. It, however, needs
to be mentioned that this is related to the overall process of the development of the rural
economy, in general and agriculture, in particular. In improvement in rural infrastructure in terms

15
of roads, electricity and credit facilities is, of course, a necessary condition for the growth of both
the rural farm and non-farm sectors. At the same time, careful attention needs to be paid to the
specific requirements of different types of rural non-farm activities in different regions in terms
of technology, skill formation, credit support, marketing facilities, etc. This would require a
much more pro-active policy support from the government than has been seen in the past as well
as the active participation of Non-governmental Organisations (NGOs) on a much larger scale.

16
CHAPTER III
Background of the Villages Surveyed
In this chapter we have discussed the socio-economic features of the villages surveyed and the
availability of infrastructure in the villages.
3.1 Caste Composition
OBCs were the most numerous castes in the surveyed villages constituting 47.7 percent of the
households. SC households were the next dominant group with 29.3 percent share in population.
The proportion of Other social groups was 22.4 percent. A few ST households were found in
Varanasi district. Important differences in caste composition were observed in different villages.
Thus, SC households were the most numerous group in Meerut, while OBC were the largest
group in Varanasi and others dominated in Gonda district (Table 3.1).
Table 3.1: Distribution of Total Households by Social Groups
Social
groups
High RNFE Districts Low RNFE Districts All
Districts Meerut Varanasi Total Kannauj Gonda Total
Frequency
ST 0 55 55 0 0 0 55
SC 1053 483 1536 582 451 1033 2569
OBCs 993 1378 2371 1023 797 1820 4191
Others 351 272 623 339 1001 1340 1963
Total 2397 2188 4585 1944 2249 4193 8778
Percentages
ST 0.0 2.5 1.2 0.0 0.0 0.0 0.6
SC 43.9 22.1 33.5 29.9 20.1 24.6 29.3
OBCs 41.4 63.0 51.7 52.6 35.4 43.4 47.7
Others 14.6 12.4 13.6 17.4 44.5 32.0 22.4
Total 100.0 100.0 100.0 100.0 100.0 100.0 100.0
Source: Primary survey, 2012
3.2 Religion
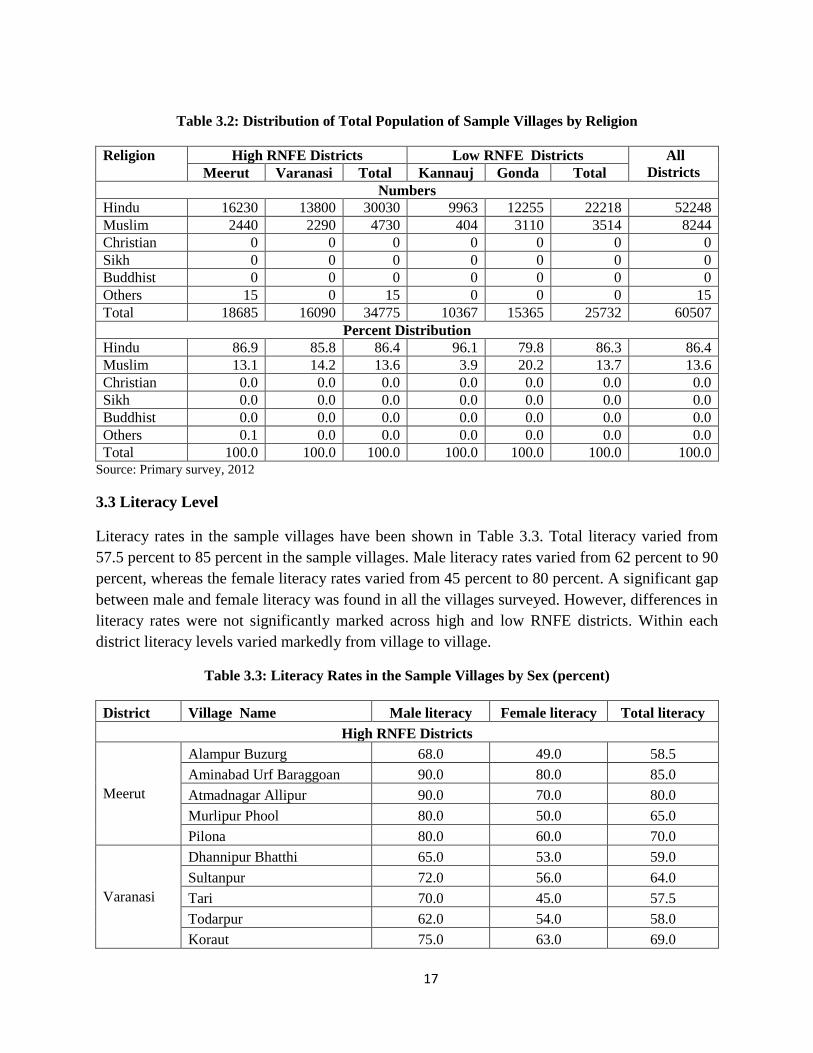
Nearly 86.4 percent of the population of the village belonged to Hindu households and 13.6
percent to Muslim Households. The proportion of Muslim households was only 4 percent in
Kannauj district and 20 percent in Gonda district (Table 3.2). No other religious group was found
in the surveyed villages.
17
Table 3.2: Distribution of Total Population of Sample Villages by Religion
Religion High RNFE Districts Low RNFE Districts All
Districts Meerut Varanasi Total Kannauj Gonda Total
Numbers
Hindu 16230 13800 30030 9963 12255 22218 52248
Muslim 2440 2290 4730 404 3110 3514 8244
Christian 0 0 0 0 0 0 0
Sikh 0 0 0 0 0 0 0
Buddhist 0 0 0 0 0 0 0
Others 15 0 15 0 0 0 15
Total 18685 16090 34775 10367 15365 25732 60507
Percent Distribution
Hindu 86.9 85.8 86.4 96.1 79.8 86.3 86.4
Muslim 13.1 14.2 13.6 3.9 20.2 13.7 13.6
Christian 0.0 0.0 0.0 0.0 0.0 0.0 0.0
Sikh 0.0 0.0 0.0 0.0 0.0 0.0 0.0
Buddhist 0.0 0.0 0.0 0.0 0.0 0.0 0.0
Others 0.1 0.0 0.0 0.0 0.0 0.0 0.0
Total 100.0 100.0 100.0 100.0 100.0 100.0 100.0 Source: Primary survey, 2012
3.3 Literacy Level
Literacy rates in the sample villages have been shown in Table 3.3. Total literacy varied from
57.5 percent to 85 percent in the sample villages. Male literacy rates varied from 62 percent to 90
percent, whereas the female literacy rates varied from 45 percent to 80 percent. A significant gap
between male and female literacy was found in all the villages surveyed. However, differences in
literacy rates were not significantly marked across high and low RNFE districts. Within each
district literacy levels varied markedly from village to village.
Table 3.3: Literacy Rates in the Sample Villages by Sex (percent)
District Village Name Male literacy Female literacy Total literacy
High RNFE Districts
Meerut
Alampur Buzurg 68.0 49.0 58.5
Aminabad Urf Baraggoan 90.0 80.0 85.0
Atmadnagar Allipur 90.0 70.0 80.0
Murlipur Phool 80.0 50.0 65.0
Pilona 80.0 60.0 70.0
Varanasi
Dhannipur Bhatthi 65.0 53.0 59.0
Sultanpur 72.0 56.0 64.0
Tari 70.0 45.0 57.5
Todarpur 62.0 54.0 58.0
Koraut 75.0 63.0 69.0

18
Low RNFE Districts
Kannauj
Dedaura Khurd 74.0 50.0 62.0
Matouli 75.0 57.0 66.0
Mehandipur 70.0 45.0 57.5
Rasulpur 79.0 45.0 62.0
Udhampur 72.0 55.0 63.5
Gonda
Susaila 80.0 60.0 70.0
Pure Shiva Bakhtawar 85.0 60.0 72.5
Baripur Ramnath 75.0 60.0 67.5
Pakadi 80.0 60.0 70.0
Mohana 65.0 50.0 57.5 Source: Primary survey, 2012
3.4 Type of Houses
Type of houses is indicative of the economic conditions of the household. In our sample 85.5
percent houses were pacca and 14.5 percent were kaccha houses. However, the proportion of
pacca houses was more than 90 percent in Meerut and Kannauj. But this proportion was only
around 75 percent in Varanasi and Gonda where relative poverty is more (Table 3.4).
Table 3.4: Distribution of Households by Type of Houses
Type of
houses
High RNFE Districts Low RNFE Districts All
Districts Meerut Varanasi Total Kannauj Gonda Total
Frequency
Pucca 2363 1688 4051 1805 1651 3456 7507
Kutcha 34 500 534 139 598 737 1271
Total 2397 2188 4585 1944 2249 4193 8778
Percentages
Pucca 98.6 77.1 88.4 92.8 73.4 82.4 85.5
Kutcha 1.4 22.9 11.6 7.2 26.6 17.6 14.5
Total 100.0 100.0 100.0 100.0 100.0 100.0 100.0 Source: Primary survey, 2012
3.5 Sources of Drinking Water
Table 3.5 shows the distribution of villages by source of drinking water. In 10 out of the 20 villages
wells were the main source of drinking water. In 3 villages hand pumps were the main source of
drinking water. In 9 villages hand pump along with wells or tube wells were used for drinking
water, while in one village drinking water was drawn from ponds. Thus, it is clear that the
provision of safe drinking water has not been made in the villages so far.

19
Table 3.5: Distribution of Villages by Source of Drinking Water
Source of water High RNFE Districts Low RNFE Districts All
Districts Meerut Varanasi Total Kannuaj Gonda Total
Hand pump 0 2 2 1 0 1 3
Well 4 1 5 0 5 5 10
Tube well 0 0 0 0 0 0 0
Pond 1 0 1 0 0 0 1
Hand pump and well 0 1 1 2 0 2 3
Hand pump, well and tube
well 0 1 1 0 0 0 1
Hand pump, well and ponds 0 0 0 2 0 2 2
Total 5 5 10 5 5 10 20
Source: Primary survey, 2012
3.6 Toilet Facilities
Only 41 percent of households had toilet facility at home. The proportion of households with
toilet facility at home was only 31.6 percent in low RNFE districts as compared to 59.6 percent
in high RNFE districts (Table 3.6).
Table 3.6: Households with Toilet Facility at Home
Toilet
facility at
home
High RNFE Districts Low RNFE Districts All
Districts Meerut Varanasi Total Kannuaj Gonda Total
Numbers
Yes 1251 1021 2272 661 665 1326 3598
No 1146 1167 2313 1283 1584 2867 5180
Total 2397 2188 4585 1944 2249 4193 8778
Percentages
Yes 52.2 46.7 49.6 34.0 29.6 31.6 41.0
No 47.8 53.3 50.4 66.0 70.4 68.4 59.0
Total 100.0 100.0 100.0 100.0 100.0 100.0 100.0 Source: Primary survey, 2012
3.7 Distribution of Households by Land Size
The ownership of land provides security of livelihood in rural areas. In our sample
villages about 58 percent of the household owned land, while 42 percent were landless.
The proportion of households owning land was much higher in the low RNFE districts than in
the high RNFE districts (Table 3.7). This is reflective of higher degree of diversification in the
latter districts, which are also more urbanised. Nearly half of the households were small farmers
with less than 5 acres of land. This proportion was 60 percent in low RNFE districts and 38.5
percent in high RNFE districts. Less than 10 percent of households belonged to the category of
medium (5 to 10 acres) or large farmers (above 10 acres).

20
Table 3.7: Distribution of Households by Size of Landholdings
Size of
land
holdings
High RNFE Districts Low RNFE Districts All
Districts Meerut Varanasi Total Kannuaj Gonda Total
Frequency
Landless 1410 1063 2473 536 690 1226 3699
Small 759 1007 1766 1227 1286 2513 4279
Medium 155 84 239 132 173 305 544
Large 73 34 107 49 100 149 256
Total 2397 2188 4585 1944 2249 4193 8778
Percentages
Landless 58.8 48.6 53.9 27.6 30.7 29.2 42.1
Small 31.7 46.0 38.5 63.1 57.2 59.9 48.7
Medium 6.5 3.8 5.2 6.8 7.7 7.3 6.2
Large 3.0 1.6 2.3 2.5 4.4 3.6 2.9
Total 100.0 100.0 100.0 100.0 100.0 100.0 100.0 Source: Primary survey, 2012
3.8 Connectivity to Nearest Town
Location plays an important role in rural diversification. Villages with close connectivity with
nearby towns are expected to be more diversified. Out of the 20 surveyed villages 4 were located
within 5 km of the town, while another 10 were located within 6 to 10 km. The number of
villages located at a distance of more than 10 km from the town was more in case of the two high
RNFE districts (Table 3.8).
Table 3.8: Distribution of Villages by Distance from Nearest Town
Distance from
nearest town in
km
High RNFE Districts Low RNFE Districts All
districts Meerut Varanasi Total Kannuaj Gonda Total
0-5 1 0 1 1 2 3 4
6-10 2 2 4 3 3 6 10
11-15 2 1 3 1 0 1 4
16-20 0 1 1 0 0 0 1
21 & above 0 1 1 0 0 0 1
Total 5 5 10 5 5 10 20
Source: Primary survey, 2012
Though in most of the cases distance of the town was not high, but the quality of road was not
good. Only 5 out of the 20 surveyed villages were connected with metalled roads to the Block
HQ. Rest were linked through kuchha road (Table 3.9).

21
Table 3.9: Distribution of Villages by Type of Connectivity of Roads with Block HQ
Type of road High RNFE Districts Low RNFE Districts All
districts Meerut Varanasi Total Kannuaj Gonda Total
Metalled 2 1 3 1 0 1 4
Kuchha 3 4 7 4 5 9 16
Total 5 5 10 5 5 10 20 Source: Primary survey, 2012
3.9 Distance from Various Facilities
Table 3.10 shows the distance of villages from main infrastructural and other facilities like
banks, schools, colleges, hospitals, bus stand, etc. It will be observed from the table that most of
the villages had access to different types of facilities within 10 km and in many cases within 5
km. No marked differences in the access to facilities were observed between high and low RNFE
districts.
Table 3.10: Distance of Facilities from the Village
Facilities
High RNFE districts
(Meerut and Varanasi)
Low RNFE Districts
(Kannauj and Gonda) All
distri
cts
1-5
km
6-10
km
11-20
km
21-30
km
30-
50
km Total
1 -
5
km
6-10
km
11-20
km
21-30
km
30-
50
km Total
Anganvadi 0 0 0 0 0 0 1 0 0 0 0 1 1
Bank 4 2 0 0 0 6 7 1 1 0 0 9 15
Bus stand 2 2 1 1 0 6 3 4 1 1 1 10 16
Coop credit
society 4 0 0 0 0 4 5 1 0 0 0 6 10
College 6 2 1 0 0 9 6 2 0 0 0 8 17
Drinking water 0 0 0 0 0 0 1 0 0 0 0 1 1
Fair price shop 0 0 0 0 0 0 1 0 0 0 0 1 1
Flour mill 1 0 0 2 1 4 4 0 0 2 1 7 11
Community
centre 4 2 2 0 0 8 3 5 1 0 1 10 18
Hat/ bazaar 5 2 0 0 0 7 5 2 0 0 0 7 14
Govt. Hospital 3 3 1 0 0 7 4 2 0 0 0 6 13
Private Hospital 2 1 3 1 0 7 3 5 0 1 1 10 17
Industrial
cluster 1 1 2 4 0 8 1 3 0 3 2 9 17
Major town 3 2 2 0 0 7 3 5 1 0 0 9 16
Milk collection
center 3 1 3 0 0 7 4 2 0 0 1 7 14
Oil mill 4 1 0 2 1 8 3 1 0 2 1 7 15
Panchayat office 0 2 0 0 0 2 0 0 0 0 0 0 2
Post office 4 1 0 0 0 5 4 1 0 0 1 6 11
Primary health
centre 4 3 1 0 0 8 5 4 0 0 0 9 17
Primary school 1 0 0 0 0 1 0 1 0 0 0 1 2
Pucca road 1 0 0 0 0 1 0 0 0 0 0 0 1
Railway station 2 2 3 1 1 9 4 2 0 2 2 10 19
Rice mill 5 1 1 2 1 10 3 2 0 1 1 7 17

22
Secondary
school 4 0 0 0 0 4 2 0 0 0 0 2 6
Technical
school 1 4 2 2 0 9 3 1 1 4 1 10 19
Technical
training center 0 1 3 2 0 6 2 0 3 2 3 10 16
Wholesale
market 4 3 2 0 0 9 4 3 1 0 2 10 19 Source: Primary survey, 2012
3.10 Milk Collection Centres
Though animal husbandry is an important allied activity to agriculture in rural areas, the support
infrastructure is not well developed. Only 6 villages out of 20 had milk collection centre. Poultry farms
existed only in 7 villages. Four of these villages were in Varanasi (Table 3.11).
Table 3.11: Villages having Poultry Farms and Milk Collection Centres (Nos.)
Type of
establishment
High RNFE Districts Low RNFE Districts All
district Meerut Varanasi Total Kannuaj Gonda Total
Poultry farm 1 4 5 0 2 2 7 Milk
collection
centres 3 0 3 2 1 3 6 Total 4 4 8 2 3 5 13
Source: Primary survey, 2012
3.11 Occupational Pattern
Occupational pattern of households in the sample villages is shown in Table 3.12. The largest
proportion (42 percent) was engaged in rural labour. 27 percent of the households in the sample
villages were engaged in agriculture and allied activities. About 19 percent were engaged in self-
employment in non-agricultural activities mostly without hired labourers. About 11 percent were
employed in services. The proportion of households in agriculture and allied activities was
higher in low RNFE districts as compared to high RNFE districts.
Important variations in occupational pattern were observed across all the districts.
The proportion of households engaged in agriculture varied from 19.8 percent in Varanasi to
34.5 percent in Kannauj. In Gonda and Varanasi nearly 50 percent households reported rural
labour as their main occupation. In Kannauj the proportion of self-employed in non-agriculture
was very low.

23
Table 3.12: Distribution of Households in Sample Villages by Main Occupation (percent)
Districts
Agricul
ture
and
Allied
Rural
Labour
Self
Employment
in non-
agriculture
with hired
labour
Self
Employment
In non-
agriculture
without hired
labour
Service Other Total
High RNFE Districts
Meerut 25.4 37.9 3.1 19.0 11.8 2.8 100.0
Varanasi 19.8 49.5 2.5 17.8 10.4 0.0 100.0
Total 22.7 43.4 2.8 18.4 11.1 1.4 100.0
Low RNFE Districts
Kannauj 34.5 50.6 0.0 6.8 8.1 0.1 100.0
Gonda 29.3 32.2 4.0 21.6 11.5 1.3 100.0
Total 31.7 40.8 2.2 14.7 9.9 0.7 100.0
All
districts 27.0 42.2 2.5 16.7 10.6 1.1 100.0 Source: Primary survey, 2012
3.12 Villages with Commercial Establishments
Details about commercial establishments of different types are given in Table 3.13. Grocery
shops existed in 90 percent villages surveyed. 75 percent of the villages had tea stall and 65
percent had repair shops.
Table 3.13: Villages having Different Types of Commercial Establishments (Nos.)
Type of
commercial
establishments
High RNFE Districts Low RNFE Districts All
district Meerut Varanasi Total Kannuaj Gonda Total
Numbers
Repair shop 2 3 7 2 4 6 13
Grocery shop 5 5 10 4 4 8 18
Tea stall 2 5 7 4 4 8 15
Other shops 3 0 3 2 4 6 9
Percent
Repair shop 20 30 70 20 40 60 65
Grocery shop 50 50 100 40 40 80 90
Tea stall 20 50 70 40 40 80 75
Other shops 30 0 30 20 40 60 45 Source: Primary survey, 2012
3.13 Details of Craftsmen and Skilled Workers
Table 3.14 shows the number of villages having different types of craftsmen and skilled workers.
Tailors, masons and drivers were found in every village. All villages except three also had grain
miller. Carpenter and blacksmiths were reported in 75 percent of the villages. Other types of
traditional workers were less widespread. Potters were reported in all the villages in Gonda and

24
weavers in all the villages of Varanasi. About one-fourth of the villages reported having
goldsmith, leather workers and bamboo makers.
Table 3.14: Villages having Different Types of Craftsmen and Skilled Workers (Nos.)
Type of craftsmen High RNFE Districts Low RNFE Districts All
districts Meerut Varanasi Total Kannua
j Gonda Total
Tailors 5 5 10 5 5 10 20
Drivers 5 5 10 4 5 9 19
Masons 5 5 10 4 5 9 19
Grain miller 5 3 8 4 5 9 17
Carpenters 5 3 8 3 3 6 14
Blacksmiths 5 4 9 1 5 6 15
Potters 1 2 3 1 5 6 9
Spinners, Weavers Knitters
and dyers 1 5 6 1 0 1 7
Leather workers 1 2 3 1 1 2 5
Goldsmiths 1 1 2 1 1 2 4
Bamboo Workers 1 2 3 0 2 2 4
Stone cutters and carvers 1 0 1 0 1 2 2
Agricultural Product
Processors 0 2 2 0 0 0 2
Crushing and Processing of
Oilseeds 0 1 1 1 0 1 2
Tobacco product preparers 0 0 0 0 0 9 0
Diamond Processing 0 0 0 0 0 0 0
Others 4 0 4 0 1 1 5
Total 40 40 80 26 37 63 143
Source: Primary survey, 2012
Table 3.15 shows the number of households of craftsmen and skilled workers in the sample
villages. On the whole, there were 84 such households in every village. Their number was
relatively higher in the two high RNFE districts, but quite low in Kannauj. In terms of numbers
the most numerous group was that of masons, followed by drivers, spinners and weavers, leather
workers and tailors. Some specialisation was also observed across the districts. Thus, there was a
concentration of weavers and spinners in Varanasi, leather workers in Meerut and carpenters in
Gonda district.

25
Table 3.15: Number of Households involved in Craftsman Activity
Type of craftsman High Rural Non-Farm
Employment Districts
Low Rural Non-Farm
Employment Districts
All
District
s Meerut Varanasi Total Kannua
j
Gonda Total
Spinners, Weavers
Knitters and dyers 1 200 201 20 0 20 221
Carpenters 13 16 29 15 47 62 91
Blacksmiths 9 13 22 3 13 16 38
Leather workers 180 3 183 10 5 15 198
Tobacco product
preparers 0 0 0 0 0 0 0
Stone cutters and
carvers 0 0 0 0 1 1 1
Goldsmiths 1 10 11 2 5 7 18
Diamond Processing 0 0 0 0 0 0 0
Potters 1 40 41 1 19 20 61
Tailors 22 33 55 27 27 54 109
Drivers 135 38 173 22 165 187 360
Bamboo Workers 0 23 23 0 1 1 24
Masons 103 168 271 46 112 158 429
Agricultural Product
Processors 0 6 6 0 0 0 6
Grain milling 20 7 27 13 18 31 58
Crushing and
Processing of
Oilseeds
0 1 1 1 0 1 2
Others 81 0 81 0 0 0 81
Total 566 558 1124 160 413 573 1697
Households of
Craftsmen Per
Village 113 112 112 32 83 57
84
Source: Primary survey, 2012
The number of households of handicraftsmen and skilled workers was reported to have increased
or remained static in most of the villages during the last five years (Table 3.16). An increase was
reported particularly in the case of drivers, masons, carpenters and tailors. But, in some villages
it was reported that the number of households belonging to blacksmiths, carpenters, potters and
tailors had declined.

26
Table 3.16: Distribution of Villages according to Change in the Number of Households of
Craftsmen and Skilled Workers (Nos.)
Type of craftsman Increased Decreased Remained Same
Total
Spinners, Weavers Knitters and
dyers 2 4 1 7
Carpenters 4 4 6 14
Blacksmiths 2 2 11 15
Leather workers (including tanners
and leather goods makers) 2 1 2 5
Tobacco product preparers 0 0 0 0
Stone cutters and carvers 0 0 1 1
Goldsmiths 1 1 2 4
Diamond Processing 0 0 0 0
Potters 1 3 5 9
Tailors 11 3 6 20
Drivers 16 1 2 19
Bamboo Workers 0 1 2 3
Masons 17 0 2 19
Agricultural Product Processors 1 0 1 2
Grain milling 8 1 8 17
Crushing and Processing of Oilseeds 1 0 1 2
Others 2 2 0 4
Total 68 23 50 141
Source: Primary survey, 2012
3.14 Self Help Groups
Self Help Groups (SHG) movement in UP has remained weak. In our sample only 7 out of 20
villages reported having SHG. While in Varanasi and Kannauj 3 out of 5 villages reported
having an SHG, only 1 village in Meerut had a SHG. There was no SHG in the villages surveyed
in Gonda district (Table 3.17).
Table 3.17: Villages having SHGs (Nos.)
Villages
having
SHGs
High RNFE Districts Low RNFE Districts All
Districts Meerut Varanasi Total Kannauj Gonda Total
Yes 1 3 4 3 0 3 7
No 4 2 6 2 5 7 13 Source: Primary survey, 2012
3.15 Migration Pattern
Two villages each in Kannauj and Gonda reported immigration of agricultural workers.
Three villages in Meerut and one in Varanasi reported immigration of non-agricultural workers
(Table 3.18). The immigration of agricultural workers was mostly for 2 to 4 months.
Immigration of non-agricultural workers in Meerut was on daily basis.

27
Table 3.18: Number of Sample Villages reporting Immigrants during Last Year
Purpose of
immigration
High Rural Non-Farm Employment
Districts
Low Rural Non-Farm Employment
Districts
All
Districts
Meerut Varanasi Total Kannauj Gonda Total
Type of Workers
Agri. works 0 0 0 2 2 4 4
Non-agri. works 3 1 4 0 0 0 4
Total 3 1 4 2 2 4 8
Duration of Stay
Daily 3 0 3 0 0 0 3
Up to 2 months 0 0 0 2 0 2 2
3-4 months 0 0 0 0 2 2 2
5-6 months 0 0 0 0 0 0 0
7 months &
above 0 1 1 0 0 0 1
Total 3 1 4 2 2 4 8 Source: Primary survey, 2012
Out migration in search of work was reported in 16 out of 20 villages. In majority of villages
out-migration was mainly for agricultural work (Table 3.19). Mostly out-migration was for 3 to 6
months.
Table 3.19: Number of Sample Villages reporting Emigrants during Last Year
Purpose of
immigration
High Rural Non-Farm
Employment Districts
Low Rural Non-Farm
Employment Districts
All
Districts
Meerut Varanasi Total Kannauj Gonda Total
Type of Worker
Agri. works 4 2 6 5 1 6 12
Non-agri. works 0 0 0 0 4 4 4
Total 4 2 6 5 5 10 16
Duration of Stay
Daily 2 0 2 0 0 0 2
Up to 2 months 0 1 1 1 0 1 2
3-4 months 1 0 1 2 1 3 4
5-6 months 1 0 1 1 4 5 6
7 months &
above 0 1 1 1 0 1 2
Total 4 2 6 5 5 10 16 Source: Primary survey, 2012
3.16 Wage Rates
In majority of villages daily wage rates for agricultural workers were reported to be less than
Rs. 100. However, in a few villages daily wages were between Rs. 101 to 200 and in village over
Rs. 200 (Table 3.20). Daily wages of non-agricultural labour were reported between Rs. 100 and
200 in most of the villages. The number of villages reporting higher wages was more in high
RNFE districts especially Meerut.
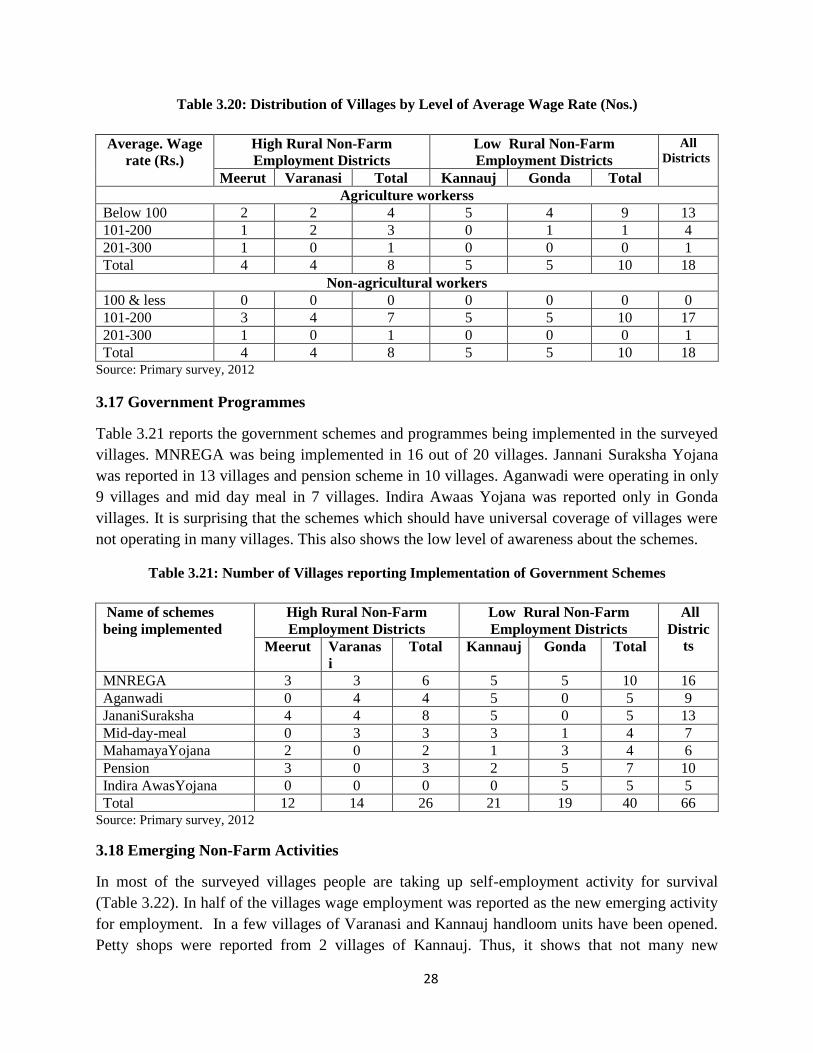
28
Table 3.20: Distribution of Villages by Level of Average Wage Rate (Nos.)
Average. Wage
rate (Rs.)
High Rural Non-Farm
Employment Districts
Low Rural Non-Farm
Employment Districts
All
Districts
Meerut Varanasi Total Kannauj Gonda Total
Agriculture workerss
Below 100 2 2 4 5 4 9 13
101-200 1 2 3 0 1 1 4
201-300 1 0 1 0 0 0 1
Total 4 4 8 5 5 10 18
Non-agricultural workers
100 & less 0 0 0 0 0 0 0
101-200 3 4 7 5 5 10 17
201-300 1 0 1 0 0 0 1
Total 4 4 8 5 5 10 18 Source: Primary survey, 2012
3.17 Government Programmes
Table 3.21 reports the government schemes and programmes being implemented in the surveyed
villages. MNREGA was being implemented in 16 out of 20 villages. Jannani Suraksha Yojana
was reported in 13 villages and pension scheme in 10 villages. Aganwadi were operating in only
9 villages and mid day meal in 7 villages. Indira Awaas Yojana was reported only in Gonda
villages. It is surprising that the schemes which should have universal coverage of villages were
not operating in many villages. This also shows the low level of awareness about the schemes.
Table 3.21: Number of Villages reporting Implementation of Government Schemes
Name of schemes
being implemented
High Rural Non-Farm
Employment Districts
Low Rural Non-Farm
Employment Districts
All
Distric
ts Meerut Varanas
i
Total Kannauj Gonda Total
MNREGA 3 3 6 5 5 10 16
Aganwadi 0 4 4 5 0 5 9
JananiSuraksha 4 4 8 5 0 5 13
Mid-day-meal 0 3 3 3 1 4 7
MahamayaYojana 2 0 2 1 3 4 6
Pension 3 0 3 2 5 7 10
Indira AwasYojana 0 0 0 0 5 5 5
Total 12 14 26 21 19 40 66 Source: Primary survey, 2012
3.18 Emerging Non-Farm Activities
In most of the surveyed villages people are taking up self-employment activity for survival
(Table 3.22). In half of the villages wage employment was reported as the new emerging activity
for employment. In a few villages of Varanasi and Kannauj handloom units have been opened.
Petty shops were reported from 2 villages of Kannauj. Thus, it shows that not many new
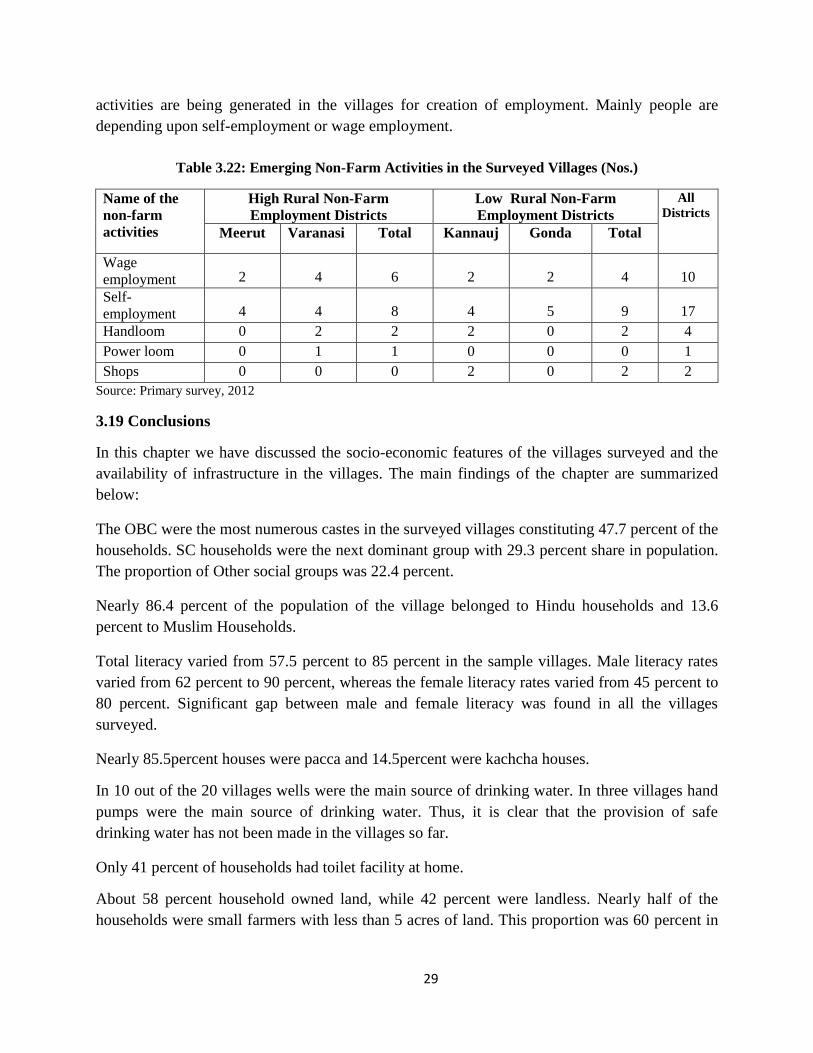
29
activities are being generated in the villages for creation of employment. Mainly people are
depending upon self-employment or wage employment.
Table 3.22: Emerging Non-Farm Activities in the Surveyed Villages (Nos.)
Name of the
non-farm
activities
High Rural Non-Farm
Employment Districts
Low Rural Non-Farm
Employment Districts
All
Districts
Meerut Varanasi Total Kannauj Gonda Total
Wage
employment 2 4 6 2 2 4 10
Self-
employment 4 4 8 4 5 9 17
Handloom 0 2 2 2 0 2 4
Power loom 0 1 1 0 0 0 1
Shops 0 0 0 2 0 2 2
Source: Primary survey, 2012
3.19 Conclusions
In this chapter we have discussed the socio-economic features of the villages surveyed and the
availability of infrastructure in the villages. The main findings of the chapter are summarized
below:
The OBC were the most numerous castes in the surveyed villages constituting 47.7 percent of the
households. SC households were the next dominant group with 29.3 percent share in population.
The proportion of Other social groups was 22.4 percent.
Nearly 86.4 percent of the population of the village belonged to Hindu households and 13.6
percent to Muslim Households.
Total literacy varied from 57.5 percent to 85 percent in the sample villages. Male literacy rates
varied from 62 percent to 90 percent, whereas the female literacy rates varied from 45 percent to
80 percent. Significant gap between male and female literacy was found in all the villages
surveyed.
Nearly 85.5percent houses were pacca and 14.5percent were kachcha houses.
In 10 out of the 20 villages wells were the main source of drinking water. In three villages hand
pumps were the main source of drinking water. Thus, it is clear that the provision of safe
drinking water has not been made in the villages so far.
Only 41 percent of households had toilet facility at home.
About 58 percent household owned land, while 42 percent were landless. Nearly half of the
households were small farmers with less than 5 acres of land. This proportion was 60 percent in
30
low RNFE districts and 38.5 percent in high RNFE districts. Less than 10 percent of the
households belonged to the category of medium (5 to 10 acres) or large farmers (above 10 acres).
Out of the 20 surveyed villages, 4 were located within 5 km of the town, while another 10 were
located within 6-10 km. Although in most of the cases distance of the town was not high, but the
quality of road was not good. Only 5 out of the 20 surveyed villages were connected with
metalled roads to the Block Headquarters.
Most of the villages had access to different types of facilities within 10 km and in many cases
within 5 km. No marked differences in the access to facilities were observed between high and
low RNFE districts.
Around 42 percent of the village households were engaged in rural labour and 27 percent of the
households were engaged in agriculture and allied activities. About 19 percent were engaged in
self-employment in non-agricultural activities and about 11 percent were employed in services.
The proportion of households in agriculture and allied activities was higher in low RNFE
districts as compared to high RNFE districts. The proportion of households engaged in
agriculture varied from 19.8 percent in Varanasi to 34.5 percent in Kannauj. In Gonda and
Varanasi nearly 50 percent households reported rural labour as their main occupation.
In Kannauj the proportion of self-employed in non-agriculture was very low.
Grocery shops existed in 90percent of the villages surveyed. 75 percent had tea stall and 65
percent had repair shops. Tailors, masons and drivers were found in every village. All villages
except three also had grain miller. Carpenter and blacksmiths were reported in 75 percent of the
villages. Other types of traditional workers were less widespread.
The number of households of handicraftsmen and skilled workers was reported to have increased
or remained static in most of the villages during the last five years. An increase was reported
particularly in the case of drivers, masons, carpenters and tailors. But, in some of the villages it
was reported that the number of households belonging to blacksmiths, carpenters, potters and
tailors had declined.
Only 7 out of 20 villages reported having SHG.
Migration was found to be low. Two villages each in Kannauj and Gonda reported immigration
of agricultural workers. Three villages in Meerut and one in Varanasi reported immigration of
non-agricultural workers. The immigration of agricultural workers was mostly for 2 to 4 months.
Out-migration in search of work was reported in 16 out of 20 villages. In majority of villages
out-migration was mainly for agricultural work. Mostly out-migration was for 3 to 6 months.
In majority of the villages daily wage rates for agricultural workers were reported to be less than
Rs. 100. Daily wages of non-agricultural labour were reported between Rs. 100 and 200 in most
of the villages. The number of villages reporting higher wages was more in high RNFE districts
especially Meerut.

31
MNREGA was being implemented in 16 out of 20 villages. Jannani SurakshaYojana was
reported in 13 villages and pension scheme in 10 villages. Aganwadis were operating in only 9
villages and MDM in 7 villages. Indira Awas Yojana was reported only in Gonda villages. It is
surprising that the schemes which should have universal coverage of villages were not operating
in many villages. This also shows the low level of awareness about the schemes.
In half of the villages wage employment was reported as the new emerging activity for
employment. In a few villages of Varanasi and Kannauj handloom units have been opened. Petty
shops were reported from 2 villages of Kannauj. Thus, it shows that not many new activities are
being generated in the villages for creation of employment. Mainly people are depending upon
self-employment or wage employment.

32
CHAPTER IV
Socio-Economic Characteristics of Sample Households
Information was collected from 1,643 rural households from the four districts covering various
demographic and employment related aspects. In the present chapter we have discussed the
household characteristics and employment pattern of the household members.
4.1 Distribution by Social Groups
About 22.5 percent of sample households belonged to SC category, 45.8 percent were OBC and
31.2 percent others (Table 4.1). The ST households were only 0.5 percent. The proportion of SC
households was distinctly higher in Meerut as compared to other districts. It was lowest in
Varanasi. The proportion of OBC households varied from 25.2 percent in Gonda to 63.8 percent
in Varanasi. The proportion of other castes was much higher in Gonda district.
Table 4.1: Distribution of Sample Households by Social Groups
Social
groups
High Rural Non-Farm
Employment Districts
Low Rural Non-Farm
Employment Districts
All
Districts
Meerut Varanasi Total Kannauj Gonda Total
Frequency
SC 126 53 179 92 98 190 369
ST 1 6 7 2 0 2 9
OBCs 192 264 456 189 107 296 752
Others 101 91 192 101 220 321 513
Total 420 414 834 384 425 809 1643
Percentage
SC 30.0 12.8 21.5 24.0 23.1 23.5 22.5
ST 0.2 1.4 0.8 0.5 0.0 0.2 0.5
OBCs 45.7 63.8 54.7 49.2 25.2 36.6 45.8
Others 24.0 22.0 23.0 26.3 51.8 39.7 31.2
Total 100.0 100.0 100.0 100.0 100.0 100.0 100.0 Source: Primary survey, 2012
4.2 Distribution by Religion
Nearly 91.7 percent of sample households belonged to Hindu community and 8.2 percent
to Muslim community. The proportion of Muslim households was slightly higher in Meerut and
Gonda districts and lowest in Kannauj (Table 4.2).
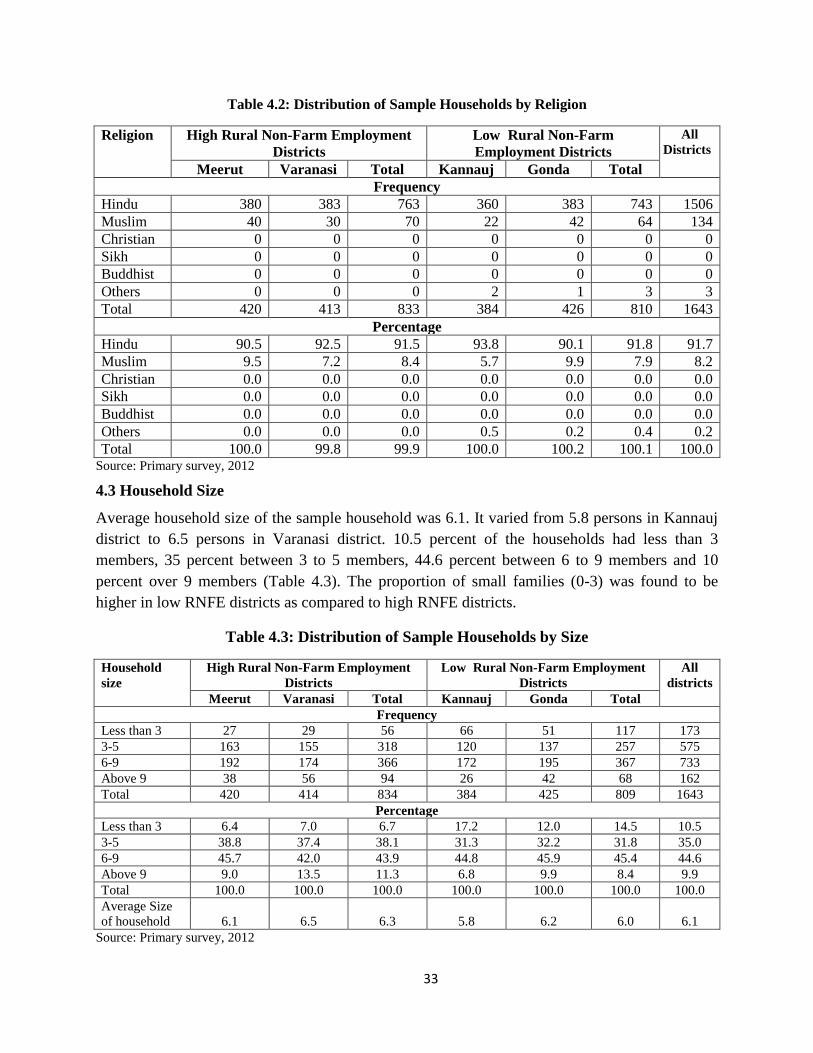
33
Table 4.2: Distribution of Sample Households by Religion
Religion High Rural Non-Farm Employment
Districts
Low Rural Non-Farm
Employment Districts
All
Districts
Meerut Varanasi Total Kannauj Gonda Total
Frequency
Hindu 380 383 763 360 383 743 1506
Muslim 40 30 70 22 42 64 134
Christian 0 0 0 0 0 0 0
Sikh 0 0 0 0 0 0 0
Buddhist 0 0 0 0 0 0 0
Others 0 0 0 2 1 3 3
Total 420 413 833 384 426 810 1643
Percentage
Hindu 90.5 92.5 91.5 93.8 90.1 91.8 91.7
Muslim 9.5 7.2 8.4 5.7 9.9 7.9 8.2
Christian 0.0 0.0 0.0 0.0 0.0 0.0 0.0
Sikh 0.0 0.0 0.0 0.0 0.0 0.0 0.0
Buddhist 0.0 0.0 0.0 0.0 0.0 0.0 0.0
Others 0.0 0.0 0.0 0.5 0.2 0.4 0.2
Total 100.0 99.8 99.9 100.0 100.2 100.1 100.0 Source: Primary survey, 2012
4.3 Household Size
Average household size of the sample household was 6.1. It varied from 5.8 persons in Kannauj
district to 6.5 persons in Varanasi district. 10.5 percent of the households had less than 3
members, 35 percent between 3 to 5 members, 44.6 percent between 6 to 9 members and 10
percent over 9 members (Table 4.3). The proportion of small families (0-3) was found to be
higher in low RNFE districts as compared to high RNFE districts.
Table 4.3: Distribution of Sample Households by Size
Household
size
High Rural Non-Farm Employment
Districts
Low Rural Non-Farm Employment
Districts
All
districts
Meerut Varanasi Total Kannauj Gonda Total
Frequency
Less than 3 27 29 56 66 51 117 173
3-5 163 155 318 120 137 257 575
6-9 192 174 366 172 195 367 733
Above 9 38 56 94 26 42 68 162
Total 420 414 834 384 425 809 1643
Percentage
Less than 3 6.4 7.0 6.7 17.2 12.0 14.5 10.5
3-5 38.8 37.4 38.1 31.3 32.2 31.8 35.0
6-9 45.7 42.0 43.9 44.8 45.9 45.4 44.6
Above 9 9.0 13.5 11.3 6.8 9.9 8.4 9.9
Total 100.0 100.0 100.0 100.0 100.0 100.0 100.0
Average Size
of household 6.1 6.5 6.3 5.8 6.2 6.0 6.1
Source: Primary survey, 2012

34
4.4 Occupational Pattern
The occupational pattern of the sample households was found nearly similar in all the four
districts. About half of the sample households reported cultivation as their main occupation
(Table 4.4). About one-fifth of them were engaged in non-agricultural labour and another one-
fifth were self-employed in non-agriculture. About 6.3 per cent were employed in public service
and 3.8 percent in private service. The proportion of those employed in public services was
relatively higher in the two eastern districts, while the proportion of those employed in public
services was higher in the two western districts. Very few households reported animal husbandry
and agricultural labour as their principal occupation.
Table 4.4: Distribution of Households by Principal Occupation
Principal Occupation High Rural Non-Farm
Employment Districts
Low Rural Non-Farm
Employment Districts
All
Districts
Meerut Varanasi Total Kannauj Gonda Total
Frequency
Cultivation 210 210 420 193 213 406 826
Animal husbandry 0 1 1 0 0 0 1
Agricultural labour 0 0 0 2 1 3 3
Non-agricultural
labour 84 83 167 77 83 160 327
Self employed in non-
agriculture 84 79 163 72 85 157 320
Service(public) 22 28 50 18 35 53 103
Service(private) 20 13 33 22 8 30 63
Total 420 414 834 384 425 809 1643
Percentage
Cultivation 50.0 50.7 50.4 50.3 50.1 50.2 50.3
Animal husbandry 0.0 0.2 0.1 0.0 0.0 0.0 0.1
Agricultural labour 0.0 0.0 0.0 0.5 0.2 0.4 0.2
Non-agricultural
labour 20.0 20.0 20.0 20.1 19.5 19.8 19.9
Self employed in non-
agriculture 20.0 19.1 19.5 18.8 20.0 19.4 19.5
Service(public) 5.2 6.8 6.0 4.7 8.2 6.6 6.3
Service(private) 4.8 3.1 4.0 5.7 1.9 3.7 3.8
Total 100.0 100.0 100.0 100.0 100.0 100.0 100.0 Source: Primary survey, 2012
4.5 Land Ownership
Table 4.5 shows the distribution of sample households by size of land ownership. 22.7 percent of
the households were landless. This proportion varied from 10.2percent in Kannauj district to 35
percent in Meerut district. About 56 percent of the households had less than 2.5 acres of land and
14 percent had between 2.5 and 5.0 acres of land. The proportion of marginal holdings was
higher in the low RNFE districts. Only 7 percent of the households owned more than 5 acres of
land.

35
Table 4.5: Distribution of Households by Land Ownership
Land ownership
(acre)
High Rural Non-Farm
Employment Districts
Low Rural Non-Farm
Employment Districts
All
districts
Meerut Varanasi Total Kannauj Gonda Total
Frequency
Landless 147 98 245 39 89 128 373
Upto 2.5 184 226 410 256 250 506 916
2.5-5 55 64 119 61 54 115 234
5-10 23 18 41 21 22 43 84
Above 10 11 8 19 7 10 17 36
Total 420 414 834 384 425 809 1643
Percentage
Landless 35.00 23.67 29.38 10.16 20.94 15.82 22.70
Upto 2.5 43.81 54.59 49.16 66.67 58.82 62.55 55.75
2.5-5.0 13.10 15.46 14.27 15.89 12.71 14.22 14.24
5.0-10.0 5.48 4.35 4.92 5.47 5.18 5.32 5.11
Above 10.0 2.62 1.93 2.28 1.82 2.35 2.10 2.19
Total 100.00 100.00 100.00 100.00 100.00 100.00 100.00
Source: Primary survey, 2012
Details of landholdings per household are given in Table 3.6. Average land owned per sample
households was 1.96 acres, but varied from 1.71 in Varanasi to 2.17 in Gonda. The extent of
leasing was very nominal. Nearly entire cropped area was irrigated in all the districts.
Table 4.6: Details of Land Owned and Leased per Sample Household (in acres)
Sl.
No.
Land Holdings
Details
High Rural Non-Farm
Employment Districts
Low Rural Non-Farm
Employment Districts
Total
Meerut Varanasi Total Kannauj Gonda Total
1 Total land owned 1.99 1.71 1.85 1.98 2.17 2.08 1.96
2 Crop land 1.92 1.70 1.81 1.98 2.15 2.06 1.94
3 Homestead land 0.34 0.07 0.21 0.11 0.08 0.10 0.15
4 Land leased in 0.03 0.14 0.08 0.07 0.05 0.06 0.07
5 Land leased out 0.02 0.08 0.05 0.19 0.02 0.10 0.07
6 Irrigated land 1.91 1.70 1.80 1.97 2.13 2.06 1.93 Source: Primary survey, 2012
4.6 Main Crops Grown
The cropping pattern on sample farms is shown in Table 4.7. Paddy and coarse cereals are the
main crops of the kharif season. A higher proportion of farmers in western UP grows coarse
cereals, while farmers in east UP prefer to grow paddy. Wheat is the main crop of the rabi
season, followed by oilseeds. Sugarcane and potato are the main cash crops. Sugarcane is more
popular in Meerut and Gonda district, while Varanasi and Kannauj specialise in potato growing.
Very few farmers reported growing high value crops like sunflower, peppermint or tobacco.

36
8.6 percent farmers reported growing vegetables. This proportion was much higher in Varanasi
at 20 percent.
Table 4.7: Main Crops Grown by Sample Households
Crops grown High Rural Non-Farm
Employment Districts
Low Rural Non-Farm
Employment Districts
All
districts
Meerut Varanasi Total Kannauj Gonda Total
Frequency
Kharif
Paddy 152 274 426 93 295 388 814
Coarse cereals 224 9 233 279 217 496 729
Pulses 8 7 15 6 37 43 58
Rabi
Wheat 271 314 585 329 332 661 1246
Coarse cereals 2 22 24 16 24 40 64
Pulses 1 35 36 3 20 23 59
Oilseeds 139 60 199 38 205 243 442
Cash crop
Sugarcane 178 4 182 2 85 87 269
Potato 15 92 107 178 16 194 301
Sunflower 0 1 1 2 2 4 5
Peppermint 0 0 0 0 1 1 1
Tobacco 2 1 3 1 4 5 8
Vegetables/spices 10 85 95 18 29 47 142
Percentage
Kharif
Paddy 36.19 66.18 51.08 24.22 69.41 47.96 49.54
Coarse cereals 53.33 2.17 27.94 72.66 51.06 61.31 44.37
Pulses 1.90 1.69 1.80 1.56 8.71 5.32 3.53
Rabi
Wheat 64.52 75.85 70.14 85.68 78.12 81.71 75.84
Coarse cereals 0.48 5.31 2.88 4.17 5.65 4.94 3.90
Pulses 0.24 8.45 4.32 0.78 4.71 2.84 3.59
Oilseeds 33.10 14.49 23.86 9.90 48.24 30.04 26.90
Cash crop
Sugarcane 42.38 0.97 21.82 0.52 20.00 10.75 16.37
Potato 3.57 22.22 12.83 46.35 3.76 23.98 18.32
Sunflower 0.00 0.24 0.12 0.52 0.47 0.49 0.30
Peppermint 0.00 0.00 0.00 0.00 0.24 0.12 0.06
Tobacco 0.48 0.24 0.36 0.26 0.94 0.62 0.49
Vegetables/Spices 2.38 20.53 11.39 4.69 6.82 5.81 8.64 Source: Primary survey, 2012
4.7 Age and Sex Distribution of Household Members
Tables 4.8 and 4.9 give distribution of household members by age and sex. 31.8 percent
household members were below 15 years of age and 8 percent were in the age group 60 and
above. Remaining 60 percent was in the working age group, i.e. 15 to 59 years. Age structure

37
was almost similar in all the four districts surveyed. Sex ratio for the entire sample households
was 883. It varied from 869 in Meerut district to 895 in 909 in Kannauj district. It may be noted
that the sex ratio was higher in low RNFE districts as compared to high of RNFE districts.
Table 4.8: Distribution of Household Members by Age and Gender (Nos.)
Age-groups High Rural Non-Farm
Employment Districts
Low Rural Non-Farm
Employment Districts
All
district
s Meerut Varanasi Total Kannauj Gonda Total
Male
1-5 118 131 249 125 160 285 534
6-14 311 305 616 236 347 583 1199
15-24 309 336 645 264 264 528 1173
25-40 307 286 593 247 318 565 1158
41-59 215 236 451 168 197 365 816
60 & above 110 131 241 116 109 225 466
Total Males 1370 1425 2795 1156 1395 2551 5346
Female
1-5 96 106 202 101 135 236 438
6-14 243 261 504 227 292 519 1023
15-24 285 252 537 257 233 490 1027
25-40 297 288 585 227 319 546 1131
41-59 203 226 429 151 179 330 759
60 & above 66 113 179 88 73 161 340
Total
Females 1190 1246 2436 1051 1231 2282 4718
Total
1-5 214 237 451 226 295 521 972
6-14 554 566 1120 463 639 1102 2222
15-24 594 588 1182 521 497 1018 2200
25-40 604 574 1178 474 637 1111 2289
41-59 418 462 880 319 376 695 1575
60 & above 176 244 420 204 182 386 806
Total Persons 2560 2671 5231 2207 2626 4833 10064
Sex Ratio 869 874 872 909 882 895 883
Source: Primary survey, 2012

38
Table 4.9: Distribution of Household Members by Age and Gender (percent)
Age-groups High Rural Non-Farm
Employment Districts
Low Rural Non-Farm
Employment Districts
Total
Meerut Varanasi Total Kannauj Gonda Total
Male
1-5 8.6 9.2 8.9 10.8 11.5 11.2 10.0
6-14 22.7 21.4 22.0 20.4 24.9 22.9 22.4
15-24 22.6 23.6 23.1 22.8 18.9 20.7 21.9
25-40 22.4 20.1 21.2 21.4 22.8 22.1 21.7
41-59 15.7 16.6 16.1 14.5 14.1 14.3 15.3
60 & above 8.0 9.2 8.6 10.0 7.8 8.8 8.7
Total Males 100.0 100.0 100.0 100.0 100.0 100.0 100.0
Female
1-5 8.1 8.5 8.3 9.6 11.0 10.3 9.3
6-14 20.4 20.9 20.7 21.6 23.7 22.7 21.7
15-24 23.9 20.2 22.0 24.5 18.9 21.5 21.8
25-40 25.0 23.1 24.0 21.6 25.9 23.9 24.0
41-59 17.1 18.1 17.6 14.4 14.5 14.5 16.1
60 & above 5.5 9.1 7.3 8.4 5.9 7.1 7.2
Total
Females 100.0 100.0 100.0 100.0 100.0 100.0 100.0
Total
1-5 8.4 8.9 8.6 10.2 11.2 10.8 9.7
6-14 21.6 21.2 21.4 21.0 24.3 22.8 22.1
15-24 23.2 22.0 22.6 23.6 18.9 21.1 21.9
25-40 23.6 21.5 22.5 21.5 24.3 23.0 22.7
41-59 16.3 17.3 16.8 14.5 14.3 14.4 15.6
60 & above 6.9 9.1 8.0 9.2 6.9 8.0 8.0
Total Persons 100.0 100.0 100.0 100.0 100.0 100.0 100.0 Source: Primary survey, 2012
4.8 Educational Level
Tables 4.10 and 4.11 show the educational profile of household members above 6 years of age.
18.8 percent of the household members above 6 years were illiterate. 24.5 percent had studied up
to primary level and 21.4 percent up to upper primary level. About 25 percent had education up
to secondary and higher secondary level and about 10 percent were graduates and above.
The proportion of illiterates and those with primary education was higher in low RNFE districts,
while the proportion of persons with secondary education was higher in high RNFE districts.
But the proportion with higher education was nearly the same in the two groups.

39
Table 4.10: Distribution of Household Members by Educational Level (Nos.)
Educational Level High Rural Non-Farm
Employment Districts
Low Rural Non-Farm
Employment Districts
All
Districts
Meerut Varanasi Total Kannauj Gonda Total
Male
Illiterate 109 83 192 125 152 277 469
Primary 258 344 602 263 311 574 1176
Upper Primary 310 260 570 258 235 493 1063
Secondary 211 212 423 118 166 284 707
Higher Secondary 188 189 377 107 193 300 677
Graduate 104 113 217 98 101 199 416
Post-graduate & above 35 40 75 31 31 62 137
Total Males 1215 1241 2456 1000 1189 2189 4645
Female
Illiterate 303 304 607 227 351 578 1185
Primary 204 287 491 255 257 512 1003
Upper Primary 230 187 417 207 191 398 815
Secondary 140 112 252 102 85 187 439
Higher Secondary 118 124 242 57 95 152 394
Graduate 51 67 118 56 50 106 224
Post-graduate & above 23 15 38 23 16 39 77
Total Females 1069 1096 2165 927 1045 1972 4137
Total
Illiterate 412 387 799 352 503 855 1654
Primary 462 631 1093 518 568 1086 2179
Upper Primary 540 447 987 465 426 891 1878
Secondary 351 324 675 220 251 471 1146
Higher Secondary 306 313 619 164 288 452 1071
Graduate 155 180 335 154 151 305 640
Post-graduate & above 58 55 113 54 47 101 214
Total 2284 2337 4621 1927 2234 4161 8782 Source: Primary survey, 2012
Comparing the educational achievements of male and female household members we find that
female illiteracy was 28.6 percent against male illiteracy of 10.1 percent (Table 4.11).
The proportion of educated females in all levels was found to be lower as compared to that of
males. In fact, the gap increased as one moved the educational ladder. Thus, the proportion of
graduate persons was 7 for females and 12 for males.

40
Table 4.11: Distribution of Household Members by Educational Level (percent)
Educational Level High Rural Non-Farm
Employment Districts
Low Rural Non-Farm
Employment Districts
All
Districts
Meerut Varanasi Total Kannauj Gonda Total
Male
Illiterate 9.0 6.7 7.8 12.5 12.8 12.7 10.1
Primary 21.2 27.7 24.5 26.3 26.2 26.2 25.3
Upper Primary 25.5 21.0 23.2 25.8 19.8 22.5 22.9
Secondary 17.4 17.1 17.2 11.8 14.0 13.0 15.2
Higher Secondary 15.5 15.2 15.4 10.7 16.2 13.7 14.6
Graduate 8.6 9.1 8.8 9.8 8.5 9.1 9.0
Post-graduate & above 2.9 3.2 3.1 3.1 2.6 2.8 2.9
Total Males 100.0 100.0 100.0 100.0 100.0 100.0 100.0
Female
Illiterate 28.3 27.7 28.0 24.5 33.6 29.3 28.6
Primary 19.1 26.2 22.7 27.5 24.6 26.0 24.2
Upper Primary 21.5 17.1 19.3 22.3 18.3 20.2 19.7
Secondary 13.1 10.2 11.6 11.0 8.1 9.5 10.6
Higher Secondary 11.0 11.3 11.2 6.1 9.1 7.7 9.5
Graduate 4.8 6.1 5.5 6.0 4.8 5.4 5.4
Post-graduate & above 2.2 1.4 1.8 2.5 1.5 2.0 1.9
Total Females 100.0 100.0 100.0 100.0 100.0 100.0 100.0
Total
Illiterate 18.0 16.6 17.3 18.3 22.5 20.5 18.8
Primary 20.2 27.0 23.7 26.9 25.4 26.1 24.8
Upper Primary 23.6 19.1 21.4 24.1 19.1 21.4 21.4
Secondary 15.4 13.9 14.6 11.4 11.2 11.3 13.0
Higher Secondary 13.4 13.4 13.4 8.5 12.9 10.9 12.2
Graduate 6.8 7.7 7.2 8.0 6.8 7.3 7.3
Post-graduate & above 2.5 2.4 2.4 2.8 2.1 2.4 2.4
Total 100.0 100.0 100.0 100.0 100.0 100.0 100.0 Source: Primary survey, 2012
Technical Education
Tables 4.12 and 4.13 show the details of household members with technical education. Only 160
persons had acquired some professional training out of which 136 were males and only 24 were
females. Out of the total persons reporting technical education, 7.5 percent had BE or B.Tech
degree, 3.1 percent had done course at polytechnic, 13.8 percent were ITI trained and 5.6 percent
were medical graduates. The largest majority belonged to those who had done some other
professional course. 5 percent reported having received informal training. It is also noted that the
proportion of person with higher professional training like BE, B. Tech, Polytechnic and ITI was
more in the high RNFE districts as compared to the low RNFE districts. Only 1.6 percent of the
persons above 6 years of age had acquired professional training. This proportion varied from
1.34 percent in Gonda district to 2.61 percent in Varanasi district.

41
Table 4.12: Distribution of Household Members by Technical Education (Nos.)
Technical
education
High Rural Non-Farm
Employment Districts
Low Rural Non-Farm
Employment Districts
Total
Merrut Varanasi Total Kannauj Gonda Total
Male
B.E/B.Tech 3 5 8 2 1 3 11
Polytechnic 2 2 4 1 0 1 5
ITI 7 8 15 3 3 6 21
Medical 1 4 5 3 1 4 9
Other Professional
Course 19 7 26 8 19 27 53
Other Formal 0 23 23 8 0 8 31
Informal 0 4 4 2 0 2 6
Total males 32 53 85 27 24 51 136
Female
B.E/B.Tech 1 0 1 0 0 0 1
Polytechnic
0
0 0
ITI 0 0 0 0 1 1 1
Medical
0
0 0
Other Professional
Course 4 2 6 4 5 9 15
Other Formal 0 5 5 0 0 0 5
Informal 0 1 1 1 0 1 2
Total Females 5 8 13 5 6 11 24
Total
B.E/B.Tech 4 5 9 2 1 3 12
Polytechnic 2 2 4 1 0 1 5
ITI 7 8 15 3 4 7 22
Medical 1 4 5 3 1 4 9
Other Professional
Course 23 9 32 12 24 36 68
Other Formal 0 28 28 8 0 8 36
Informal 0 5 5 3 0 3 8
Total 37 61 98 32 30 62 160
As percent of total
population above 6
yrs 1.62 2.61 2.12 1.66 1.34 1.49 1.82
Source: Primary survey, 2012
The proportion of females with professional training at BE/B. Tech or ITI was much lower as
compared to that of males. Majority of women had done other professional courses (Table 4.13).
Thus, women are lagging behind men in technical training.

42
Table 4.13: Distribution of Household Members by Technical Education (percent)
Technical
education
High Rural Non Farm-
Employment Districts
Low Rural Non-Farm
Employment Districts
Total
Meerut Varanasi Total Kannauj Gonda Total
Male
B.E/B.Tech 9.4 9.4 9.4 7.4 4.2 5.9 8.1
Polytechnic 6.3 3.8 4.7 3.7 0.0 2.0 3.7
ITI 21.9 15.1 17.6 11.1 12.5 11.8 15.4
Medical 3.1 7.5 5.9 11.1 4.2 7.8 6.6
Other Professional
Course 59.4 13.2 30.6 29.6 79.2 52.9 39.0
Other Formal 0.0 43.4 27.1 29.6 0.0 15.7 22.8
Informal 0.0 7.5 4.7 7.4 0.0 3.9 4.4
100.0 100.0 100.0 100.0 100.0
100.
0 100.0
Female
B.E/B.Tech 20.0 0.0 7.7 0.0 0.0 0.0 4.2
Polytechnic 0.0 0.0 0.0 0.0 0.0 0.0 0.0
ITI 0.0 0.0 0.0 0.0 16.7 9.1 4.2
Medical 0.0 0.0 0.0 0.0 0.0 0.0 0.0
Other Professional
Course 80.0 25.0 46.2 80.0 83.3 81.8 62.5
Other Formal
Training 0.0 62.5 38.5 0.0 0.0 0.0 20.8
Informal training 0.0 12.5 7.7 20.0 0.0 9.1 8.3
100.0 100.0 100.0 100.0 100.0
100.
0 100.0
Total
B.E/B.Tech 10.8 8.2 9.2 6.3 3.3 4.8 7.5
Polytechnic 5.4 3.3 4.1 3.1 0.0 1.6 3.1
ITI 18.9 13.1 15.3 9.4 13.3 11.3 13.8
Medical 2.7 6.6 5.1 9.4 3.3 6.5 5.6
Other Professional
Course 62.2 14.8 32.7 37.5 80.0 58.1 42.5
Other Formal
Training 0.0 45.9 28.6 25.0 0.0 12.9 22.5
Informal training 0.0 8.2 5.1 9.4 0.0 4.8 5.0
Total 100.0 100.0 100.0 100.0 100.0 100.0 100.0 Source: Primary survey, 2012
4.9 Household Assets
Ownership of productive assets is a primary requirement for employment. Table 4.14 shows the
value of different types of productive assets owned by the sample households. The average value
of assets per household was about Rs. 40 lakh in Meerut and Varanasi. But it was much lower at
Rs. 19.9 lakh in Gonda and Rs. 11.7 lakh in Kannauj. The value of agricultural machinery and
livestock owned per household was much higher in Meerut district as compared to the other
districts.
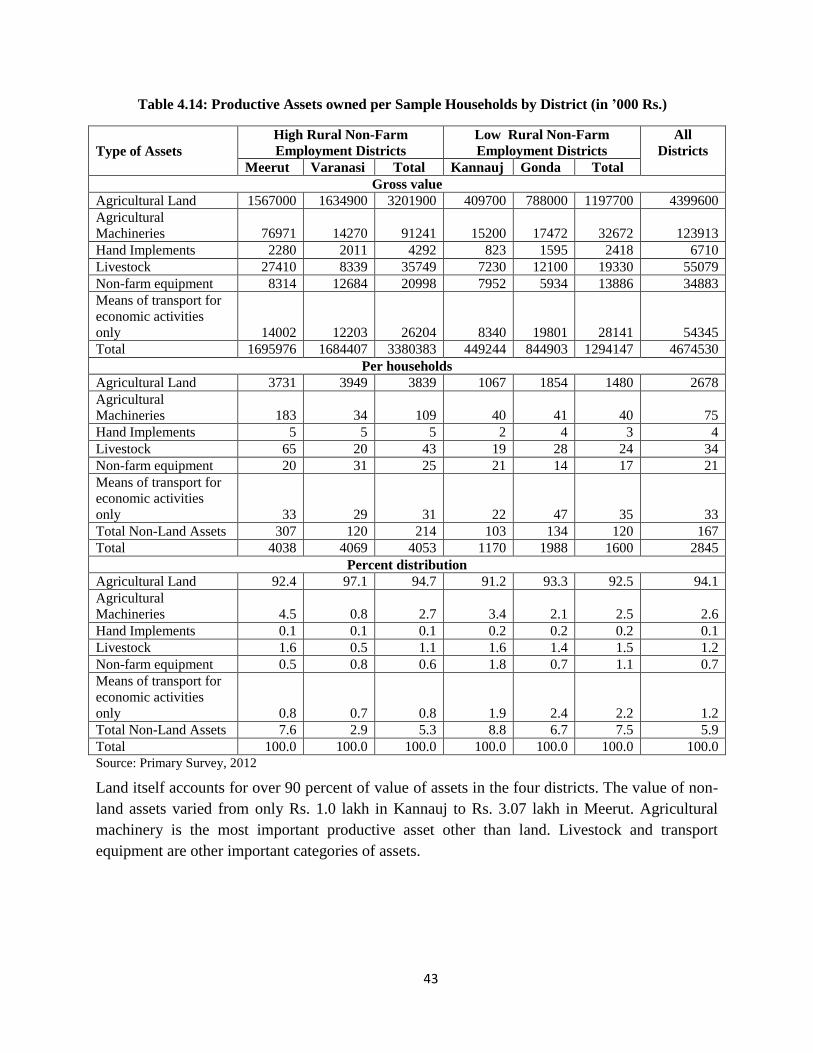
43
Table 4.14: Productive Assets owned per Sample Households by District (in ’000 Rs.)
Type of Assets
High Rural Non-Farm
Employment Districts
Low Rural Non-Farm
Employment Districts
All
Districts
Meerut Varanasi Total Kannauj Gonda Total
Gross value
Agricultural Land 1567000 1634900 3201900 409700 788000 1197700 4399600
Agricultural
Machineries 76971 14270 91241 15200 17472 32672 123913
Hand Implements 2280 2011 4292 823 1595 2418 6710
Livestock 27410 8339 35749 7230 12100 19330 55079
Non-farm equipment 8314 12684 20998 7952 5934 13886 34883
Means of transport for
economic activities
only 14002 12203 26204 8340 19801 28141 54345
Total 1695976 1684407 3380383 449244 844903 1294147 4674530
Per households
Agricultural Land 3731 3949 3839 1067 1854 1480 2678
Agricultural
Machineries 183 34 109 40 41 40 75
Hand Implements 5 5 5 2 4 3 4
Livestock 65 20 43 19 28 24 34
Non-farm equipment 20 31 25 21 14 17 21
Means of transport for
economic activities
only 33 29 31 22 47 35 33
Total Non-Land Assets 307 120 214 103 134 120 167
Total 4038 4069 4053 1170 1988 1600 2845
Percent distribution
Agricultural Land 92.4 97.1 94.7 91.2 93.3 92.5 94.1
Agricultural
Machineries 4.5 0.8 2.7 3.4 2.1 2.5 2.6
Hand Implements 0.1 0.1 0.1 0.2 0.2 0.2 0.1
Livestock 1.6 0.5 1.1 1.6 1.4 1.5 1.2
Non-farm equipment 0.5 0.8 0.6 1.8 0.7 1.1 0.7
Means of transport for
economic activities
only 0.8 0.7 0.8 1.9 2.4 2.2 1.2
Total Non-Land Assets 7.6 2.9 5.3 8.8 6.7 7.5 5.9
Total 100.0 100.0 100.0 100.0 100.0 100.0 100.0
Source: Primary Survey, 2012
Land itself accounts for over 90 percent of value of assets in the four districts. The value of non-
land assets varied from only Rs. 1.0 lakh in Kannauj to Rs. 3.07 lakh in Meerut. Agricultural
machinery is the most important productive asset other than land. Livestock and transport
equipment are other important categories of assets.

44
4.10 Conclusion
The main findings of the present chapter are summarised below:
22.5 percent of the sample households belonged to SC category, 45.8 percent were OBC and
31.2 percent Others.
91.7 percent of the sample households belonged to Hindu community and 8.2 percent to Muslim
community.
About half of the sample households reported cultivation as their main occupation. About one-
fifth were engaged in non-agricultural labour and another one-fifth were self-employed in non-
agriculture. About one-tenth were employed in public or private service.
22.7 percent of the households were landless. This proportion varied from 10.2 percent in
Kannauj district to 35 percent in Meerut district. About 56 percent of the households had less
than 2.5 acres of land and 14 percent had between 2.5 and 5.0 acre of land. Only 7 percent
households owned more than 5 acres of land.
60percent of the household members were in the working age group, i.e. 15 to 59 years.
Sex ratio for the entire sample households was 883.
18.8 percent of the household members above 6 years were illiterate. 24.5 percent had studied up
to primary level and 21.4 percent upto upper primary level. About 25 percent had education up to
secondary and higher secondary level and about 10 percent were graduates and above.
Female illiteracy was 28.6 percent as against male illiteracy of 10.1 percent.
Only 1.6 percent of the persons above 6 years of age had acquired professional training. Out of
the 160 persons who had acquired some professional training, 136 were males and only 24 were
females.
Out of the total persons reporting technical education 7.5 percent had BE or B.Tech degree, 3.1
percent had done course at polytechnic, 13.8 percent were ITI trained and 5.6 percent were
medical graduates. The largest majority belonged to those who had done some other professional
course. Only 5 percent reported having received informal training.
Average value of assets per household was about Rs. 40 lakh in Meerut and Varanasi. But it was
much lower at Rs. 19.9 lakh in Gonda and Rs. 11.7 lakh in Kannauj. Land accounted for over 90
percent of value of assets in the the four districts. The value of non-land assets varied from only
Rs. 1.0 lakh in Kannauj to Rs. 3.07 lakh in Meerut. Agricultural machinery is the most important
productive asset other than land. Livestock and transport equipment are other important
categories of assets.

45
CHAPTER V
Dynamics of Rural Non Farm Employment
In this chapter we have analysed the dynamics of rural non-farm employment in terms of
changes in the occupational pattern, earning levels, role of MNREGS, employment of women in
RNFE activities, etc.
5.1 Workforce Participation
In general, Work Participation Rates (WPRs) in Uttar Pradesh are low. In our sample the WPR
came to 30.5 percent. It varied from 27.9 percent in Varanasi to 32.9 percent in Meerut (Table
5.1). WPR were relatively higher in western region as compared to eastern region.
Table 5.1: Workforce Participation Rates (percent)
High Rural Non Farm Employment
Districts
Low Rural Non Farm Employment
Districts
All
districts Meerut Varanasi Total Kannauj Gonda Total
32.9 27.9 30.3 32.4 29.3 30.7 30.5
Occupational Pattern
Table 5.2 shows the current occupational pattern of the household workers. 41.9 percent of the
workers were employed in cultivation. This proportion was 43.7 percent in low RNFE districts
and 40.2 in high RNFE districts. 3.1 percent were engaged in agricultural labour and 18.5
percent in non-agriculture labour. This proportion varied from 14.9 percent in Gonda to 22.4
percent in Varanasi. Another 18 percent were self employed in non-agricultural activities.
This proportion was relatively higher in Varanasi as compared to the other districts. 4.7 percent
were employed in public services and 7.8 percent in private services. The share of private
services was highest in Meerut and that of public services in Gonda district. In all the districts
surveyed we find that now non-agricultural sector provides employment to more than half of the
rural workers. This fact highlights the growing importance of rural non-farm activities in the
economy.
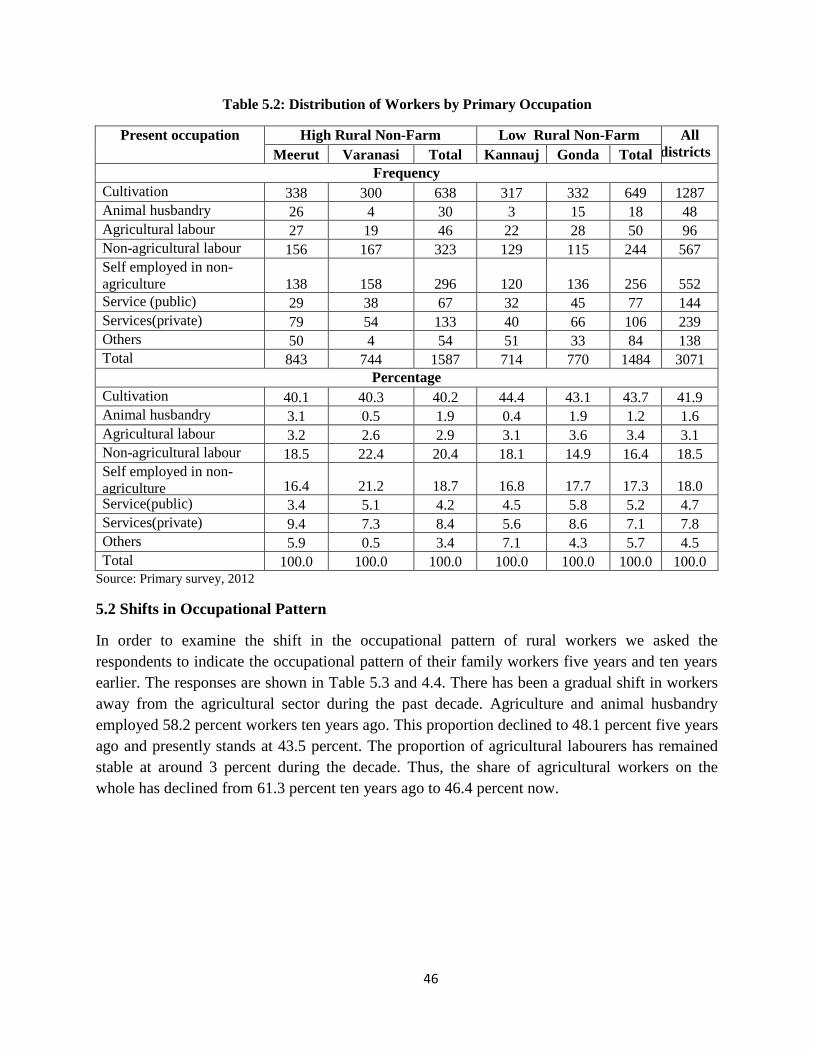
46
Table 5.2: Distribution of Workers by Primary Occupation
Present occupation
High Rural Non-Farm
Employment Districts
Low Rural Non-Farm
Employment Districts
All
districts Meerut Varanasi Total Kannauj Gonda Total
Frequency
Cultivation 338 300 638 317 332 649 1287
Animal husbandry 26 4 30 3 15 18 48
Agricultural labour 27 19 46 22 28 50 96
Non-agricultural labour 156 167 323 129 115 244 567
Self employed in non-
agriculture 138 158 296 120 136 256 552
Service (public) 29 38 67 32 45 77 144
Services(private) 79 54 133 40 66 106 239
Others 50 4 54 51 33 84 138
Total 843 744 1587 714 770 1484 3071
Percentage
Cultivation 40.1 40.3 40.2 44.4 43.1 43.7 41.9
Animal husbandry 3.1 0.5 1.9 0.4 1.9 1.2 1.6
Agricultural labour 3.2 2.6 2.9 3.1 3.6 3.4 3.1
Non-agricultural labour 18.5 22.4 20.4 18.1 14.9 16.4 18.5
Self employed in non-
agriculture 16.4 21.2 18.7 16.8 17.7 17.3 18.0
Service(public) 3.4 5.1 4.2 4.5 5.8 5.2 4.7
Services(private) 9.4 7.3 8.4 5.6 8.6 7.1 7.8
Others 5.9 0.5 3.4 7.1 4.3 5.7 4.5
Total 100.0 100.0 100.0 100.0 100.0 100.0 100.0 Source: Primary survey, 2012
5.2 Shifts in Occupational Pattern
In order to examine the shift in the occupational pattern of rural workers we asked the
respondents to indicate the occupational pattern of their family workers five years and ten years
earlier. The responses are shown in Table 5.3 and 4.4. There has been a gradual shift in workers
away from the agricultural sector during the past decade. Agriculture and animal husbandry
employed 58.2 percent workers ten years ago. This proportion declined to 48.1 percent five years
ago and presently stands at 43.5 percent. The proportion of agricultural labourers has remained
stable at around 3 percent during the decade. Thus, the share of agricultural workers on the
whole has declined from 61.3 percent ten years ago to 46.4 percent now.

47
Table 5.3: Distribution of Household Workers by Primary Occupation Five Years Ago
Occupation
(5 years back)
High Rural Non-Farm
Employment Districts
Low Rural Non-Farm
Employment Districts
All
District
s Meerut Varanasi Total Kannauj Gonda Total
Frequency
Cultivation 318 272 590 265 346 611 1201
Animal husbandry 23 4 27 2 4 6 33
Agricultural labour 15 17 32 25 20 45 77
Non-agricultural labour 134 133 267 96 98 194 461
Self employed in non-
agriculture 126 134 260 85 110 195 455
Service(public) 30 32 62 26 44 70 132
Services (private) 61 25 86 28 40 68 154
Others 27 1 28 8 19 27 55
Total 734 618 1352 535 681 1216 2568
Percentage
Cultivation 43.3 44.0 43.6 49.5 50.8 50.2 46.8
Animal husbandry 3.1 0.6 2.0 0.4 0.6 0.5 1.3
Agricultural labour 2.0 2.8 2.4 4.7 2.9 3.7 3.0
Non-agricultural labour 18.3 21.5 19.7 17.9 14.4 16.0 18.0
Self employed in non-
agriculture 17.2 21.7 19.2 15.9 16.2 16.0 17.7
Service(public) 4.1 5.2 4.6 4.9 6.5 5.8 5.1
Services(private) 8.3 4.0 6.4 5.2 5.9 5.6 6.0
Others 3.7 0.2 2.1 1.5 2.8 2.2 2.1
Total 100.0 100.0 100.0 100.0 100.0 100.0 100.0 Source: Primary survey, 2012
Table 5.4: Distribution of Household Workers by Primary Occupation Ten Years Ago
Occupation (10 years
back)
High Rural Non-Farm
Employment Districts
Low Rural Non-Farm
Employment Districts
Total
Meerut Varanasi Total Kannauj Gonda Total
Frequency
Cultivation 324 271 595 267 369 636 1231
Animal husbandry 18 3 21 1 4 5 26
Agricultural labour 12 13 25 15 22 37 62
Non-agricultural labour 108 117 225 69 46 115 340
Self employed in non-
agriculture 70 101 171 52 56 108 279
Service(public) 22 28 50 17 37 54 104
Services(private) 29 10 39 19 30 49 88
Others 12 0 12 5 9 14 26
Total 595 543 1138 445 573 1018 2156
Percentage
Cultivation 54.5 49.9 52.3 60.0 64.4 62.5 57.1
Animal husbandry 3.0 0.6 1.8 0.2 0.7 0.5 1.2
Agricultural labour 2.0 2.4 2.2 3.4 3.8 3.6 2.9
Non-agricultural labour 18.2 21.5 19.8 15.5 8.0 11.3 15.8

48
Self employed in non-
agriculture 11.8 18.6 15.0 11.7 9.8 10.6 12.9
Service(public) 3.7 5.2 4.4 3.8 6.5 5.3 4.8
Services(private) 4.9 1.8 3.4 4.3 5.2 4.8 4.1
Others 2.0 0.0 1.1 1.1 1.6 1.4 1.2
Total 100.0 100.0 100.0 100.0 100.0 100.0 100.
0 Source: Primary survey, 2012
Table 5.5 shows the growth of workers by sectors during the last decade. The growth of total
workers was 19 percent in both the five year sub-periods. The number of workers in animal
husbandry shows a high growth. The number of cultivators decline during 2002-07 but increased
by 7.2 percent during 2007-12. Agricultural labourers grew by about 24 percent in both the sub-
periods. Non-agricultural labourers also show a high growth during the decade. Private services
and self-employed in non-agriculture are the fastest growing sectors in the rural areas. On the
whole, the growth of non-agricultural workers was much faster as compared to the growth of the
agricultural workers. It would also be observed from the table that the growth of workers has
slowed down during the last five years.
Table 5.5: Percent Change in Workers by Sectors during the Last Ten years
Occupation High RNFE Districts Low RNFE Districts All Districts
2007-2012 2002-2007 2007-2012 2002-2007 2007-2012 2002-2007
Cultivation 8.1 -0.8 6.2 -3.9 7.2 -2.4
Animal husbandry 11.1 28.6 200.0 20.0 45.5 26.9
Agricultural labour 43.8 28.0 11.1 21.6 24.7 24.2
Non-agricultural
labour 21.0 18.7 25.8 68.7 23.0 35.6
Self employed in
non-agriculture 13.8 52.0 31.3 80.6 21.3 63.1
Service (public) 8.1 24.0 10.0 29.6 9.1 26.9
Services(private) 54.7 120.5 55.9 38.8 55.2 75.0
Others 92.9 133.3 211.1 92.9 150.9 111.5
Total 17.4 18.8 22.0 19.4 19.6 19.1 Source: Primary survey, 2012
The differential growth in workers in different sectors has led to an important sectoral shift in the
occupational structure of the workforce as depicted in Table 5.6. For the entire period the
proportion of cultivators has declined by about 15 percent percentage points, while that of
agricultural labourers has remained static. The share of non-agricultural workers has increased
by 2.7 percentage points and that of private services by 3.7 percentage points. The share of
public services has, however, remained stable. It will also be observed from the table that the
pace of structural shift has decline in the last five years as compared to preceding five years.
Comparing the pattern of occupational shifts in high and low RNFE districts we find that the
pattern of shifts was more or less similar, but the pace of shift in favour of non-agriculture was
faster in the low RNFE districts.

49
Table 5.6: Sectoral Shifts in the Employment Pattern during the Last Ten Years
Occupation High RNFE Districts Low RNFE Districts All Districts
2007-2012 2002-2007 2007-2012 2002-2007 2007-2012 2002-2007
Cultivation -3.4 -8.7 -6.5 -12.3 -4.9 -10.3
Animal husbandry -0.1 0.2 0.7 0 0.3 0.1
Agricultural labour 0.5 0.2 -0.3 0.1 0.1 0.1
Non-agricultural
labour 0.7 -0.1 0.4 4.7 0.5 2.2
Self-employed in
non-agriculture -0.5 4.2 1.3 5.4 0.3 4.8
Service (public) -0.4 0.2 -0.6 0.5 -0.4 0.3
Services(private) 2 3 1.5 0.8 1.8 1.9
Others 1.3 1 3.5 0.8 2.4 0.9
Total 0 0 0 0 0 0 Source: Primary Survey in selected districts
Reasons of Occupational Shift
Out of the total workers 489 or 16 percent were reported to have changed their occupation during
the last five years. The proportion of workers reporting shift of occupation was higher in Meerut
and Gonda as compared to the other two districts (Table 5.7). Gonda a backward district with
low RNFE registered highest occupational changes. The main reasons reported for occupational
shifts were small size of land holdings and search for new employment opportunity. Low income
in agriculture also propelled shift to other sectors. The role of government schemes was nominal.
About 5 percent of the workers went in for higher education. This proportion was higher in
eastern districts especially Gonda (Table 5.7). Thus, the main factor in occupational shifts seems
to be push factor due to low agricultural incomes and small size of landholdings which are
unable to provide sustenance to the farmers’ household.
Table 5.7: Distribution of Workers by Reasons of Occupational Shift
Reasons of
occupational shift
High Rural Non Farm
Employment Districts
Low Rural Non Farm
Employment Districts
Total
Meerut Varanasi Total Kannauj Gonda Total
Frequency
Low agricultural
income 14 6 20 14 12 26 46
Small landholding 29 9 38 21 64 85 123
Higher education 2 3 5 1 16 17 22
Risk aversion 2 1 3 2 0 2 5
Govt scheme 3 0 3 1 0 1 4
New employment
opportunity 43 13 56 4 62 66 122
Others 47 30 77 31 59 90 167
Total 140 62 202 74 213 287 489
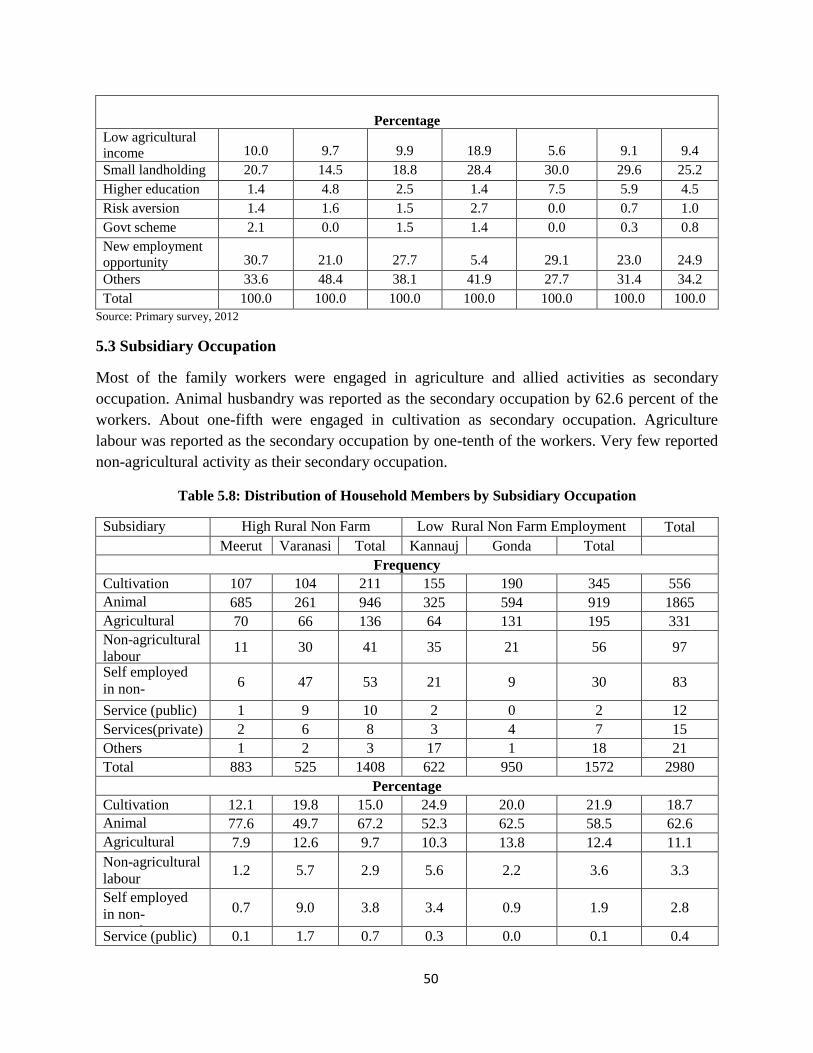
50
Percentage
Low agricultural
income 10.0 9.7 9.9 18.9 5.6 9.1 9.4
Small landholding 20.7 14.5 18.8 28.4 30.0 29.6 25.2
Higher education 1.4 4.8 2.5 1.4 7.5 5.9 4.5
Risk aversion 1.4 1.6 1.5 2.7 0.0 0.7 1.0
Govt scheme 2.1 0.0 1.5 1.4 0.0 0.3 0.8
New employment
opportunity 30.7 21.0 27.7 5.4 29.1 23.0 24.9
Others 33.6 48.4 38.1 41.9 27.7 31.4 34.2
Total 100.0 100.0 100.0 100.0 100.0 100.0 100.0
Source: Primary survey, 2012
5.3 Subsidiary Occupation
Most of the family workers were engaged in agriculture and allied activities as secondary
occupation. Animal husbandry was reported as the secondary occupation by 62.6 percent of the
workers. About one-fifth were engaged in cultivation as secondary occupation. Agriculture
labour was reported as the secondary occupation by one-tenth of the workers. Very few reported
non-agricultural activity as their secondary occupation.
Table 5.8: Distribution of Household Members by Subsidiary Occupation
Subsidiary
occupation
High Rural Non Farm
Employment Districts
Low Rural Non Farm Employment
Districts Total
Meerut Varanasi Total Kannauj Gonda Total
Frequency
Cultivation 107 104 211 155 190 345 556
Animal
husbandry 685 261 946 325 594 919 1865
Agricultural
labour 70 66 136 64 131 195 331
Non-agricultural
labour 11 30 41 35 21 56 97
Self employed
in non-
agriculture
6 47 53 21 9 30 83
Service (public) 1 9 10 2 0 2 12
Services(private) 2 6 8 3 4 7 15
Others 1 2 3 17 1 18 21
Total 883 525 1408 622 950 1572 2980
Percentage
Cultivation 12.1 19.8 15.0 24.9 20.0 21.9 18.7
Animal
husbandry 77.6 49.7 67.2 52.3 62.5 58.5 62.6
Agricultural
labour 7.9 12.6 9.7 10.3 13.8 12.4 11.1
Non-agricultural
labour 1.2 5.7 2.9 5.6 2.2 3.6 3.3
Self employed
in non-
agriculture
0.7 9.0 3.8 3.4 0.9 1.9 2.8
Service (public) 0.1 1.7 0.7 0.3 0.0 0.1 0.4

51
Services(private) 0.2 1.1 0.6 0.5 0.4 0.4 0.5
Others 0.1 0.4 0.2 2.7 0.1 1.1 0.7
Total 100.0 100.0 100.0 100.0 100.0 100.0 100.0 Source: Primary survey, 2012
5.4 Non-Agricultural Labour
Non-agricultural labour has emerged as an important source of employment in the rural areas in
recent years. It accounts for 18.5 percent of total rural employment and almost 40 percent of non-
farm employment in the rural areas. The share of non-agricultural labour in total RNFE varied
from 30.7 percent in Gonda district to 51.6 percent in Varanasi. The share of this sector was
higher in high RNFE districts as compared to low RNFE districts (Table 5.9). It would,
therefore, be worthwhile to discuss details of the nature of non-agricultural employment.
Table 5.9: Number and Proportion of Non-Agricultural Labour by District
Particulars High RNFE Districts Low RNFE Districts All
Districts Meerut Varanasi Total Kannuj Gonda Total
Number 156 167 323 129 115 244 567
Percentage to total workers 18.5 22.4 20.4 18.1 14.9 16.4 18.5
Percentage to Non-Farm
Workers
39.9 51.6 45.3 37.8 30.7 34.0 39.7
Source: Primary Survey, 2012
Table 5.10 shows the distribution of non-agricultural labourers by sector of employment.
More than half of the non-agricultural labourers were employed in the construction activity.
This proportion was as high as 86.5 percent in Meerut district and 93.9 percent in Gonda district.
But the proportion of construction workers was much lower in Varanasi and Kannauj districts.
Very few non-agricultural labourers were employed in manufacturing, trade and hotel and
restaurants. About 41 percent labourers were engaged in miscellaneous activities.
Table 5.10: Distribution of Non-Agricultural Labour by Sector
Sector High RNFE Districts Low RNFE Districts All Districts
Combined Meerut Varanasi Total Kannauj Gonda Total
Frequency
Mining & Quarrying 0 0 0 0 2 2 2
Manufacturing 13 3 16 0 0 0 16
Construction 135 50 185 22 108 130 315
Wholesale & Retail Trade 0 0 0 0 1 1 1
Hotel & Restaurant 0 0 0 0 0 0 0
Others 8 114 122 107 4 111 233
Total 156 167 323 129 115 244 567
Percentage
Mining & Quarrying 0.0 0.0 0.0 0.0 1.7 0.8 0.4
Manufacturing 8.3 1.8 5.0 0.0 0.0 0.0 2.8
Construction 86.5 29.9 57.3 17.1 93.9 53.3 55.6
Wholesale & Retail Trade 0.0 0.0 0.0 0.0 0.9 0.4 0.2
Hotel & Restaurant 0.0 0.0 0.0 0.0 0.0 0.0 0.0
Others 5.1 68.3 37.8 82.9 3.5 45.5 41.1
Total 100.0 100.0 100.0 100.0 100.0 100.0 100.0
Source: Primary Survey
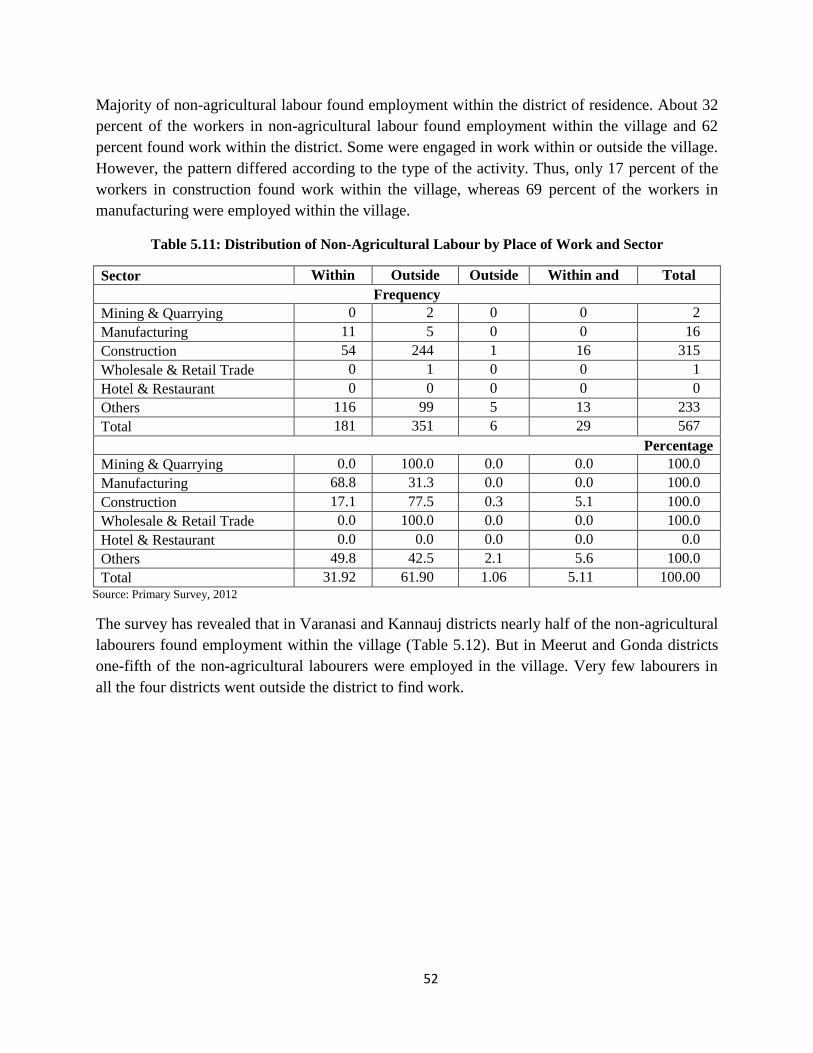
52
Majority of non-agricultural labour found employment within the district of residence. About 32
percent of the workers in non-agricultural labour found employment within the village and 62
percent found work within the district. Some were engaged in work within or outside the village.
However, the pattern differed according to the type of the activity. Thus, only 17 percent of the
workers in construction found work within the village, whereas 69 percent of the workers in
manufacturing were employed within the village.
Table 5.11: Distribution of Non-Agricultural Labour by Place of Work and Sector
Sector Within
Village
Outside
Village
Outside
District
Within and
Outside
Village
Total
Frequency
Mining & Quarrying 0 2 0 0 2
Manufacturing 11 5 0 0 16
Construction 54 244 1 16 315
Wholesale & Retail Trade 0 1 0 0 1
Hotel & Restaurant 0 0 0 0 0
Others 116 99 5 13 233
Total 181 351 6 29 567
Percentage
Mining & Quarrying 0.0 100.0 0.0 0.0 100.0
Manufacturing 68.8 31.3 0.0 0.0 100.0
Construction 17.1 77.5 0.3 5.1 100.0
Wholesale & Retail Trade 0.0 100.0 0.0 0.0 100.0
Hotel & Restaurant 0.0 0.0 0.0 0.0 0.0
Others 49.8 42.5 2.1 5.6 100.0
Total 31.92 61.90 1.06 5.11 100.00 Source: Primary Survey, 2012
The survey has revealed that in Varanasi and Kannauj districts nearly half of the non-agricultural
labourers found employment within the village (Table 5.12). But in Meerut and Gonda districts
one-fifth of the non-agricultural labourers were employed in the village. Very few labourers in
all the four districts went outside the district to find work.

53
Table 5.12: Distribution of Non-Agricultural Labour by Place of Work and District
Place of Work High RNFE Districts Low RNFE Districts All
Districts
Combined Meerut Varanasi Total Kannauj Gonda Total
Frequency
Within Village 28 72 100 64 17 81 181
Outside Village 128 80 208 51 92 143 351
Outside District 0 4 4 2 0 2 6
Within and Outside
Village 0 11 11 12 6 18 29
All categories 156 167 323 129 115 244 567
Percentage
Within Village 17.9 43.1 31.0 49.6 14.8 33.2 31.9
Outside Village 82.1 47.9 64.4 39.5 80.0 58.6 61.9
Outside District 0.0 2.4 1.2 1.6 0.0 0.8 1.1
Within and Outside
Village 0.0 6.6 3.4 9.3 5.2 7.4 5.1
All categories 100.0 100.0 100.0 100.0 100.0 100.0 100.0 Source: Primary Survey, 2012 (mention percent across place of work in each district in brackets)
Looking at the distance from place of work we find that about 28percent non-agricultural labour work
within the village and another 35percent get work within 5 km. of their residence (Table 5.13).
The proportion of workers getting job within 5 km was much higher in low RNFE districts as compared
to high RNFE districts. Almost half of the non-agricultural workers in Meerut had to travel more than 10
km. for work.
Table 5.13: Distribution of Non-Agricultural Labour by Distance of Workplace
Distance of Work Place High RNFE Districts Low RNFE Districts All
Districts Meerut Varanasi Total Kannauj Gonda Total
Frequency
Within Village 24 73 97 47 16 63 160
Up to 5 km 25 30 55 56 85 141 196
5 - 10 km 33 29 62 22 13 35 97
10 - 20 km 67 34 101 1 0 1 102
Above from 20 km 7 1 8 3 1 4 12
Total 156 167 323 129 115 244 567
Percentage
Within Village 15.4 43.7 30.0 36.4 13.9 25.8 28.2
Up to 5 km 16.0 18.0 17.0 43.4 73.9 57.8 34.6
5 - 10 km 21.2 17.4 19.2 17.1 11.3 14.3 17.1
10 - 20 km 42.9 20.4 31.3 0.8 0.0 0.4 18.0
20 km and above 4.5 0.6 2.5 2.3 0.9 1.6 2.1
Total 100.0 100.0 100.0 100.0 100.0 100.0 100.0
Source: Primary Survey, 2012

54
It was found that non-agricultural labour does not provide work throughout the year. Only about
43 percent persons reportedly got employment as non-agricultural labour from 6 to 12 months
(Table 5.14). This proportion was the highest for Meerut, followed by Kannauj. Nearly the same
proportion reported getting work for 3 to 6 months, while 12.5 percent worked as non-
agricultural labourer for less than three months.
Table 5.14: Distribution of Non-Agricultural Labour by Days of Employment
Days of Employment High RNFE Districts Low RNFE Districts All
Districts Meerut Varanasi Total Kannauj Gonda Total
Frequency
Less than 3 months 2 34 36 26 9 35 71
3 - 6 months 47 72 119 49 80 129 248
6 - 12 months 106 61 167 54 25 79 246
Above 12 months 1 0 1 0 1 1 2
Total 156 167 323 129 115 244 567
Percentage
Less than 3 months 1.3 20.4 11.1 20.2 7.8 14.3 12.5
3 - 6 months 30.1 43.1 36.8 38.0 69.6 52.9 43.7
6 - 12 months 67.9 36.5 51.7 41.9 21.7 32.4 43.4
12 months and above 0.6 0.0 0.3 0.0 0.9 0.4 0.4
Total 100.0 100.0 100.0 100.0 100.0 100.0 100.0 Source: Primary Survey, 2012
About three-fourths of the workers reported working for 8 hours and above and the remaining
one-fourth worked from 4 to 8 hours per day. The highest intensity of work was found in case of
Meerut and lowest in case of Varanasi (Table 5.15).
Table 5.15: Distribution of Non-Agricultural Labour by Work Hours
Hours of Work High RNFE Districts Low RNFE Districts All
Districts Meerut Varanasi Total Kannauj Gonda Total
Frequency
Less than 4 hrs 0 3 3 1 0 1 4
5 - 8 hrs 16 74 90 35 26 61 151
Above than 8 hrs 140 90 230 93 89 182 412
Total 156 167 323 129 115 244 567
Percentage
Less than 4 hrs 0.0 1.8 0.9 0.8 0.0 0.4 0.7
4 - 8 hrs 10.3 44.3 27.9 27.1 22.6 25.0 26.6
8 hrs and above 89.7 53.9 71.2 72.1 77.4 74.6 72.7
Total 100.0 100.0 100.0 100.0 100.0 100.0 100.0 Source: Primary Survey, 2012
Almost all non-agriculture labourers were working as casual workers. Only 0.5 percent reported
working as regular worker (Table 5.16).

55
Table 5.16: Distribution of Non-Agricultural Labour by District and Type of Contract
Type of Contract High RNFE Districts Low RNFE Districts All
Districts Meerut Varanasi Total Kannauj Gonda Total
Frequency
Regular 0 2 2 1 0 1 3
Casual 156 165 321 128 115 243 564
Total 156 167 323 129 115 244 567
Percentage
Regular 0.0 1.2 0.6 0.8 0.0 0.4 0.5
Casual 100.0 98.8 99.4 99.2 100.0 99.6 99.5
Total 100.0 100.0 100.0 100.0 100.0 100.0 100.0
Source: Primary Survey, 2012
The study of mode of wage payment revealed that over 90 non-agricultural labourers were paid
wages on daily basis, while 1.2 percent got wages on monthly basis. 7.6 percent reported
working on piece rate basis. The piece rate system was more prevalent in Kannauj district
followed by Varanasi (Table 5.17).
Table 5.17: Distribution of Non-Agricultural Labour by District and Mode of Payment
Mode of Payment High RNFE Districts Low RNFE Districts All
Districts Meerut Varanasi Total Kannauj Gonda Total
Frequency
Daily 146 152 298 110 109 219 517
Piece-Rate 7 15 22 18 3 21 43
Monthly 3 0 3 1 3 4 7
Total 156 167 323 129 115 244 567
Percentage
Daily 93.6 91.0 92.3 85.3 94.8 89.8 91.2
Piece-Rate 4.5 9.0 6.8 14.0 2.6 8.6 7.6
Monthly 1.9 0.0 0.9 0.8 2.6 1.6 1.2
Total 100.0 100.0 100.0 100.0 100.0 100.0 100.0
Source: Primary Survey, 2012
The average annual earning of non-agricultural labour was reported at Rs. 30,573. The highest
earning was reported in the case of manufacturing followed by construction (Table 5.18).
Average earnings were much lower in mining and quarrying and other activities. Considerable
variations in annual earnings were also found among districts within the same sector. In general,
annual earnings in all activities were much higher in the two high RNFE districts as compared to
the low RNFE districts. This was both on the account of wage differentials and the number of
days of employment.

56
Table 5.18: Average Annual Earnings of Non-Agricultural Labour by Sector (Rs.)
Sector High RNFE Districts Low RNFE Districts All
Districts Meerut Varanasi Total Kannauj Gonda Total
Mining & Quarrying
14400 14400 14400
Manufacturing 40131 25500 37388
37388
Construction 43368 42706 43189 44790 24925 28287 37039
Wholesale & Retail
Trade
28000 28000 28000
Hotel & Restaurant
Others 36100 23600 24419 18402 16125 18320 21513
Total 42725 29354 35812 22902 24463 23638 30573 Source: Primary Survey, 2012
Looking at the social group-wise annual earnings of non-agricultural labour we find that the
earning levels are higher for OBC and other castes as compared to ST and SC group. OBC had
highest annual earnings in Meerut and SC had highest earning in Kannauj (Table 5.19). It will
also be observed from the table that the earning levels are much higher in Meerut district,
followed by Varanasi. The two low total non- farm cost (TNFC) districts have much lower level
of earnings.
Table 5.19: Average Annual Earnings of Non-Agricultural Labour by Social Groups (Rs.)
Social Group High RNFE Districts Low RNFE Districts All
Districts Meerut Varanasi Total Kannauj Gonda Total
Scheduled Tribe 18000 32040 29700 15400 12750 14075 25794
Scheduled Caste 41546 23426 35254 25089 23278 24123 29868
Other Backward
Classes 45755 31664 36361 21581 26500 23438 31315
Others 43367 36150 40789 8833 32800 22529 34702
All Social Groups 42725 29354 35812 22902 24463 23638 30573 Source: Primary Survey, 2012
5.5 Self Employed Workers in Non-Agriculture
We now analyse the details of self-employed non-agricultural (SENAg) workers. This is an
important category of RNFE. The SENAg workers account for about one-fifth of total workers
and two-fifths of non-agricultural workers (Table 5.20). Their proportion is relatively higher in
Varanasi district, which is traditionally known for its handloom and handicrafts.

57
Table 5.20: Distribution of Self-Employed in Non-Agriculture by District
Particulars High RNFE Districts Low RNFE Districts All
Districts Meerut Varanasi Total Kannauj Gonda Total
Number 138 158 296 120 136 256 552
Percentage to total workers 16.4 21.2 18.7 16.8 17.7 17.3 18.0
Percentage to Non-
Agricultural Workers 35.3 45.7 40.3 36.2 38.1 37.3 38.8
Source: Primary Survey, 2012
Wholesale and retail trade is the most import SENAg activity, followed by manufacturing and
services. However, in Meerut and Kannauj largest proportion is engaged in manufacturing.
In Varanasi service is the main activity and in Gonda trade is dominant activity among self-
employed workers (Table 5.21).
Table 5.21: Distribution of Self-Employed in Non-Agriculture by Sector
Sector High RNFE Districts Low RNFE Districts All
Districts Meerut Varanasi Total Kannauj Gonda Total
Frequency
Manufacturing 54 41 95 37 17 54 149
Construction and repairing 9 26 35 8 10 18 53
Wholesale & Retail Trade 37 35 72 47 82 129 201
Service 32 54 86 24 24 48 134
Transport 6 2 8 4 3 7 15
Total 138 158 296 120 136 256 552
Percentage
Manufacturing 39.1 25.9 32.1 30.8 12.5 21.1 27.0
Construction and repairing 6.5 16.5 11.8 6.7 7.4 7.0 9.6
Wholesale & Retail Trade 26.8 22.2 24.3 39.2 60.3 50.4 36.4
Service 23.2 34.2 29.1 20.0 17.6 18.8 24.3
Transport 4.3 1.3 2.7 3.3 2.2 2.7 2.7
Total 100.0 100.0 100.0 100.0 100.0 100.0 100.0 Source: Primary Survey, 2012
Table 5.22 shows the place of work for SENAg workers by sectors. Self-employed workers in
manufacturing basically work from their home in the village. In construction, trade and service
about two-thirds of the self-employed workers get employment in the village itself. Those
engaged in transport activities operate mostly from outside the village. Nearly all the self-
employed workers are working within the district.

58
Table 5.22: Distribution of Self-Employed in Non-Agricultural by Activity and Workplace
Activity Within
Village
Outside
Village
Outside
District
Within and
outside
village
Total
Frequency
Manufacturing 141 8 0 0 149
Construction and repairing 34 19 0 0 53
Wholesale & Retail Trade 138 62 0 1 201
Service 95 36 3 0 134
Transport 1 14 0 0 15
Total 409 139 3 1 552
Percentage
Manufacturing 94.6 5.4 0.0 0.0 100.0
Construction and repairing 64.2 35.8 0.0 0.0 100.0
Wholesale & Retail Trade 68.7 30.8 0.0 0.5 100.0
Service 70.9 26.9 2.2 0.0 100.0
Transport 6.7 93.3 0.0 0.0 100.0
Total 74.1 25.2 0.5 0.2 100.0 Source: Primary Survey, 2012
About three-fourth of SENAg workers are working in the village itself, while about one-fourth
work in places outside the village in the same district. The situation was found to be almost
similar in all the four districts surveyed (Table 5.23).
Table 5.23: Distribution of Self-Employed in Non-Agriculture by District and Workplace
Place of Work High RNFE Districts Low RNFE Districts All
Districts Meerut Varanasi Total Kannauj Gonda Total
Frequency
Within Village 105 120 225 95 89 184 409
Outside Village 32 38 70 24 45 69 139
Outside District 1 0 1 0 2 2 3
Within and outside village 0 0 0 1 0 1 1
Total 138 158 296 120 136 256 552
Percentage
Within Village 76.1 75.9 76.0 79.2 65.4 71.9 74.1
Outside Village 23.2 24.1 23.6 20.0 33.1 27.0 25.2
Outside District 0.7 0.0 0.3 0.0 1.5 0.8 0.5
Within and outside village 0.0 0.0 0.0 0.8 0.0 0.4 0.2
Total 100.0 100.0 100.0 100.0 100.0 100.0 100.0 Source: Primary Survey, 2012

59
The number of self-employed in non-agriculture workers five years ago was reported at 455
against the present number of 552, i.e. an increase of about 21 per cent was reported.
The highest percentage increase took place in manufacturing, followed by trade and services
(Table 5.25). Transport workers show a decline. About one-third of these workers were
employed in trade and about one-fourth each in manufacturing and services (Table 5.25).
The sectoral pattern of employment of SENAg workers does not show much change over the
time.
Table 5.24: Distribution of Self-Employed in Non-Agriculture Five Years Ago
Activity High RNFE Districts Low RNFE Districts All
Districts Meerut Varanasi Total Kannauj Gonda Total
Frequency
Manufacturing 49 27 76 24 13 37 113
Construction and repairing 10 23 33 6 10 16 49
Wholesale & Retail Trade 33 31 64 34 67 101 165
Service 30 46 76 19 14 33 109
Transport 4 7 11 2 6 8 19
Total 126 134 260 85 110 195 455
Percentage
Manufacturing 38.9 20.1 29.2 28.2 11.8 19.0 24.8
Construction and repairing 7.9 17.2 12.7 7.1 9.1 8.2 10.8
Wholesale & Retail Trade 26.2 23.1 24.6 40.0 60.9 51.8 36.3
Service 23.8 34.3 29.2 22.4 12.7 16.9 24.0
Transport 3.2 5.2 4.2 2.4 5.5 4.1 4.2
Total 100.0 100.0 100.0 100.0 100.0 100.0 100.0 Source: Primary Survey, 2012
Table 5.25: Change in the Self-Employed in Non-Agriculture during Last Five Years
Activity High RNFE Districts Low RNFE Districts All
Districts Meerut Varanasi Total Kannauj Gonda Total
Frequency
Manufacturing 5 14 19 13 4 17 36
Construction
and
repairing
-1 3 2 2 0 2 4
Wholesale &
Retail Trade 37 4 8 13 15 28 36
Service 2 8 10 5 10 15 25
Transport 2 -5 -3 2 -3 -1 -4
Total 12 24 36 35 26 61 97
Percent Increase
Manufacturing 10.2 51.9 25.0 54.2 30.8 45.9 31.9
Construction
and repairing -10.0 13.0 6.1 33.3 0.0 12.5 8.2

60
Wholesale &
Retail Trade 112.1 12.9 12.5 38.2 22.4 27.7 21.8
Service 6.7 17.4 13.2 26.3 71.4 45.5 22.9
Transport 50.0 -71.4 -27.3 100.0 -50.0 -12.5 -21.1
Total 9.5 17.9 13.8 41.2 23.6 31.3 21.3
Source: Primary Survey, 2012
Average annual earning per self-employed person was estimated at Rs. 35,373 for all sample
households. It varied from Rs. 12,711 in Kannauj to Rs. 59,357 in Gonda districts. Average
earnings were highest in the case of service sector, followed by transport, while lowest earnings
were reported in manufacturing (Table 5.26).
Table 5.26: Average Annual Net Earnings of Self-Employed in Non-Agriculture
by District and Activity (Rs.)
Activity High RNFE Districts Low RNFE Districts All
Districts Meerut Varanasi Total Kannauj Gonda Total
Manufacturing 22181 16210 19604 9893 78882 31612 23956
Construction and
repairing 66333 21160 32776 17314 81830 53156 39698
Wholesale & Retail
Trade 36200 22626 29601 14557 49737 36919 34298
Service 59906 47224 51943 11806 62913 37359 46719
Transport 45417 23700 39987 13318 108333 54039 46545
Total 38577 29140 33540 12711 59357 37492 35373 Source: Primary Survey, 2012
In Meerut, highest earnings were reported for other castes. But OBC group reported highest
earnings in Varanasi and Gonda, while in Gonda highest earnings were reported in case of SCs
(Table 5.27).
Table 5.27: Average Annual Net Earnings of Self-Employed in Non-Agriculture
by Social Groups (Rs.)
Social Group High RNFE Districts Low RNFE Districts All
Districts Meerut Varanasi Total Kannauj Gonda Total
Scheduled Tribe
3855 3855
3855
Scheduled Caste 38305 14260 31010 17836 42222 24487 29246
Other Backward
Classes 29109 34426 32817 11177 62073 32626 32725
Others 53658 28781 44012 12795 59269 50870 48324
All Social Groups 38577 29140 33540 12711 59357 37492 35373 Source: Primary Survey, 2012
Services are emerging as an important source of employment even in the rural areas.
They account for 12.5 percent of total rural workers and a little less than one-fourth of the RNFE

61
in our sample (Table 5.28). Government services accounted for about 27 percent of total
employment in services in Meerut and over 40percent in the other three districts. 38 percent of
the workers in the services were regular workers, while 62 were contractual workers (Table
5.29).
Table 5.28: Workers Employed in Services by District (Nos.)
Sector of
Employment High RNFE Districts Low RNFE Districts All
Distric
ts Meerut Varanasi Total Kannauj Gonda Total
Government 29 38 67 32 45 77 144
Private 79 54 133 40 66 106 239
Total 108 92 200 72 111 183 383
As percent of total
Workers 12.8 12.4 12.6 10.1 14.4 12.3 12.5
As percent of total
Non-Agricultural
Workers
23.9 21.9 22.9 19.4 28.1 23.9 23.4
Source: Primary Survey, 2012
Table 5.29: Workers Employed in Services by Nature of Employment
Nature of
Employment
High RNFE Districts Low RNFE Districts All
Districts Meerut Varanasi Total Kannauj Gonda Total
Frequency
Regular 48 32 80 24 41 65 145
Contractual 60 60 120 48 70 118 238
Total 108 92 200 72 111 183 383
Percent
Regular 44.4 34.8 40.0 33.3 36.9 35.5 37.9
Contractual 55.6 65.2 60.0 66.7 63.1 64.5 62.1
Total 100.0 100.0 100.0 100.0 100.0 100.0 100.0
Source: Primary Survey, 2012
Per person annual earnings in the services were reported at Rs. 1,04,449 for the sample
households. It was much higher in the government sector (Rs. 1,86,211) as compared to the
private sector (Rs. 55,186). In Kannauj district annual earnings were reported to be much lower
than in the other districts (Table 5.30).
Table 5.30: Average Annual Earning per Person in Service by District (Rs.)
Sector of
Employment
High RNFE Districts Low RNFE Districts All
Districts Meerut Varanasi Total Kannauj Gonda Total
Government 230497 205210 216155 72873 222222 160155 186211
Private 65601 38667 54665 27653 72923 55840 55186
Total 109879 107456 108764 47751 133450 99732 104449 Source: Primary survey, 2012
Earning levels in contractual employment were found to be much lower (Rs. 51,565) as
compared to the employees in the regular employment (Rs. 1,91,930). Income levels were found
to be relatively lower in Kannuaj district in both the types of employment, while earning levels
were highest in Gonda district (Table 5.31).

62
Table 5.31: Average Annual Earning Per Person in Service by Nature of Employment (Rs.)
Nature of
Employment
High RNFE Districts Low RNFE Districts All
Districts Meerut Varanas
i
Total Kannauj Gonda Total
Regular 167471 232797 193601 97571 243902 189872 191930
Contractual 63805 40608 52207 22841 70161 50912 51565
Total 109879 107456 108764 47751 133450 99732 104449 Source: Primary survey, 2012
Looking at the quality of employment we find that in the government sector about two-thirds
employees received provident fund and insurance benefits and about 56 percent received medical
and retirement benefit (Table 5.32). In Meerut more than three-fourths of government employees
received these benefits, but in Kannauj this proportion was rather low. As far as the private
sector is concerned, only a very small proportion reported getting various types of benefits in
Meerut and Kannauj districts, but no workers received these benefits in Varanasi and Gonda
district.
Table 5.32: Proportion of Salaried Persons Receiving Different Type of Benefits (percent)
Type of Benefit
High RNFE Districts Low RNFE Districts All Districts
Meerut Varanasi Kannauj Gonda
Government Sector
PF/CPF 75.9 60.5 50.0 66.7 63.2
Medical 79.3 50.0 28.1 66.7 56.3
Insurance 86.2 63.2 43.8 73.3 66.7
Retirement benefits 75.9 57.9 18.8 68.9 56.3
Any other 65.5 10.5 3.1 64.4 36.8
Private Sector
Provident Fund 6.3 0.0 12.1 0.0 5.4
Medical 5.1 0.0 10.6 0.0 4.6
Insurance 5.1 0.0 9.1 0.0 4.2
Retirement benefits 1.3 0.0 4.5 0.0 1.7
Any other 1.3 0.0 3.0 0.0 1.3 Source: Primary survey, 2012
5.6 Distribution by Earning Levels
The earning levels in RNFE activities were found to be very low. Table 5.33 shows the
distribution of workers by level of annual earnings in different types of RNFE activities. One-
third of RNFE workers in our sample earned less than Rs. 20,000 a year, while another one-third
earned between Rs. 20,000 to Rs. 40,000. About one-fourth earned between Rs. 40,000 and Rs.
80,000. Only one-tenth RNFE workers had annual earnings of more than Rs.80,000. Earning
levels were found to be the lowest for self-employed RNFE workers and highest for salaried
workers. Comparing across the districts we find that the proportion of workers earning less than

63
Rs. 40,000 annually was 52 percent in Meerut and 53 percent in Gonda as compared to 72
percent in Varanasi and 87 percent in Kannauj.
Table 5.33: Distribution of Persons by Range of Annual Earnings by Category of Work
District
Category of Workers
Annual Earning in Rs.
< 20000
20000-
40000
40000-
80000
80000-
150000
150000-
300000 >300000
All
Groups
High RNFE Districts
Meerut
Employed in non-
agriculture labour 1.9 50.0 46.8 1.3 0.0 0.0 100.0
Self –employed in non-
farm activities 47.8 20.3 18.1 9.4 4.3 0.0 100.0
Salaried employed 9.3 17.6 37.0 15.7 13.0 7.4 100.0
Total 19.7 31.1 34.3 8.0 5.0 2.0 100.0
Varanasi
Employed in non-
agriculture labour 32.3 42.5 24.6 0.6 0.0 0.0 100.0
Self –employed in non-
farm activities 52.5 31.6 13.9 1.3 0.0 0.6 100.0
Salaried employed 8.7 37.0 21.7 7.6 13.0 12.0 100.0
Total 34.8 37.2 19.9 2.4 2.9 2.9 100.0
Low RNFE Districts
Kannauj
Employed in non-
agriculture labour 51.9 31.0 17.1 0.0 0.0 0.0 100.0
Self –employed in non-
farm activities 70.8 28.3 0.8 0.0 0.0 0.0 100.0
Salaried employed 48.6 25.0 9.7 2.8 12.5 1.4 100.0
Total 58.3 28.7 9.3 0.6 2.8 0.3 100.0
Gonda
Employed in non-
agriculture labour 42.6 47.8 9.6 0.0 0.0 0.0 100.0
Self –employed in non-
farm activities 20.6 16.9 44.9 14.7 2.9 0.0 100.0
Salaried employed 6.3 27.0 22.5 11.7 12.6 19.8 100.0
Total 23.2 29.8 26.8 9.1 5.0 6.1 100.0
All Districts
All
Districts
Employed in non-
agriculture labour 30.5 43.0 25.9 0.5 0.0 0.0 100.0
Self –employed in non-
farm activities 47.5 24.5 19.7 6.3 1.8 0.2 100.0
Salaried employed 15.7 26.4 24.0 10.2 12.8 11.0 100.0
Total 33.0 32.0 23.2 5.1 3.9 2.9 100.0 Source: Primary survey, 2012

64
5.7 Employment in Mahatma Gandhi National Employment Guarantee Scheme
MNREGS is an important programme implemented by the government to provide assured
employment of 100 days to the households per year. In our sample only 3.7 percent workers
reported working under MNREGS. But this proportion was only 1 percent in Meerut (Table
5.34). The proportion of households working on MNREGS is much higher for SC and ST
workers as compared to OBC and other categories.
Table 5.34: Distribution of Persons Who Got Work in MNREGS by Social Group
Social Group High RNFE Districts Low RNFE Districts All
District
s Meerut Varanasi Total Kannauj Gonda Total
Frequency
Scheduled Tribe 0 3 3 1 0 1 4
Scheduled Caste 13 34 47 49 26 75 122
Other Backward
Classes 1 33 34 27 7 34 68
Others 0 2 2 1 1 3
All Social Groups 14 72 86 78 33 111 197
Percentage
Scheduled Tribe 0.0 14.3 13.0 11.1 0 11.1 12.5
Scheduled Caste 3.3 18.4 8.0 17.6 9.0 13.2 10.6
Other Backward
Classes 0.1 4.0 2.2 4.4 2.1 3.6 2.7
Others 0.0 0.7 0.3 0.3 0.0 0.1 0.2
All Social Groups 1.0 5.4 3.1 6.3 2.4 4.2 3.7 Source: Primary Survey, 2012
Employment days on MNREGS are shown in Table 5.35. On an average, a worker got 33 days
of employment in a year in MNREGs. However, the number of days generated in Meerut per
worker was only 25. Among social groups highest number of days of employment was reported
in case of ST workers and lowest for other workers. On the whole, the contribution of MNREGS
to employment generation as proportion of total employment does not seem to be much.

65
Table 5.35: Average Days of Employment per Worker in NREGA by Social Group
Sector High RNFE Districts Low RNFE Districts All
Districts Meerut Varanasi Total Kannauj Gonda Total
Total Number of Days
Scheduled Tribe 0 150 150 35 0 35 185
Scheduled Caste 314 1016 1330 1732 868 2600 3930
Other Backward Classes 25 911 936 1052 290 1342 2278
Others 0 46 46 30
30 76
All Social Groups 339 2123 2462 2849 1158 4007 6469
Days per Worker
Scheduled Tribe 0 50.0 50.0 35.0 0 35.0 46.3
Scheduled Caste 24.2 29.9 28.3 35.3 33.4 34.7 32.2
Other Backward Classes 25.0 27.6 27.5 39.0 41.4 39.5 33.5
Others 0 23.0 23.0 30.0 0 30.0 25.3
All Social Groups 24.2 29.5 28.6 36.5 35.1 36.1 32.8 Source: Primary Survey, 2012
Average earning per worker per day on MNREGs were Rs. 110. It varied from Rs. 105 in
Kannauj to Rs.120 in Meerut and Gonda. Among social groups, the lowest earnings were
reported for ST workers. OBC workers got higher wages in MNREGs as compared to other
social groups in all districts except Varanasi where the other group was the highest paid (Table
5.36). Thus, some wage discrimination on caste basis seems to be prevailing in the state.
Table 5.36: Average Earnings per Worker in NREGA by District and Social Group (Rs.)
Social Group High RNFE Districts Low RNFE Districts All
Districts Meerut Varanasi Total Kannauj Gonda Total
Total Earnings
Scheduled Tribes 0 320 320 100 0 100 420
Scheduled Castes 1560 3620 5180 5020 3120 8140 13320
Other Backward Classes 120 3720 3840 2940 840 3780 7620
Others 0 300 300 100 0 100 400
All Social Groups 1680 7960 9640 8160 3960 12120 21760
Per worker Earnings
Scheduled Tribes 0 107 107 100 0 100 105
Scheduled Castes 120 106 110 102 120 109 109
Other Backward Classes 120 113 113 109 120 111 112
Others 0 150 150 100 0 100 133
All Social Groups 120 111 112 105 120 109 110 Source: Primary Survey, 2012

66
5.8 Migrant Workers
The extent of migration was reported to be low. Thus, only about 7 percent sample households
reported having migrant workers. This proportion was varied from 4.5 percent in Meerut to 8.9
percent in Gonda (Table 5.37). Around three-fourths of the migrant workers were working in
other states, while about one-sixth were working within the state in other districts (Table 5.38).
Migration within the state was relatively higher in Meerut district, which is relatively more
developed with better employment opportunities. 9 percent of the migrants had gone abroad from
Gonda. No other district reported international migration. All the migrant workers were males.
Table 5.37: Number of Migrant Workers by District
Particulars High RNFE Districts Low RNFE Districts All
Districts Meerut Varanasi Total Kannauj Gonda Total
No. of Migrant Workers 26 44 70 30 55 85 155
No. of households
reporting migrant
workers 19 27 46 24 38 62 108
As percent of total
households in in the
village 4.5 6.5 5.5 6.3 8.9 7.7 6.6 Source: Primary Survey, 2012
Table 5.38: Distribution of Migrants according to Destination of Migration
Place of Migration High RNFE Districts Low RNFE Districts All
Districts Meerut Varanasi Total Kannauj Gonda Total
Frequency
Within the districts 3 3 6 1 0 1 7
Within the State 7 6 13 3 9 12 25
Other States 16 35 51 26 41 67 118
Abroad 0 0 0 0 5 5 5
Total 26 44 70 30 55 85 155
Percentage
Within the districts 11.5 6.8 8.6 3.3 0.0 1.2 4.5
Within the State 26.9 13.6 18.6 10.0 16.4 14.1 16.1
Other States 61.5 79.5 72.9 86.7 74.5 78.8 76.1
Abroad 0.0 0.0 0.0 0.0 9.1 5.9 3.2
Total 100.0 100.0 100.0 100.0 100.0 100.0 100.0 Source: Primary Survey, 2012
Details of migration according to period of migration have been given in Table 5.39. Less than
one-fourth of the migrants had migrated during the last years and about 55 percent had migrated
for a period of 1 to 5 years. Remaining 22 percent were long period migrants. The proportion of
long period migrants was much higher in Varanasi (34%) and Kannauj (30%).
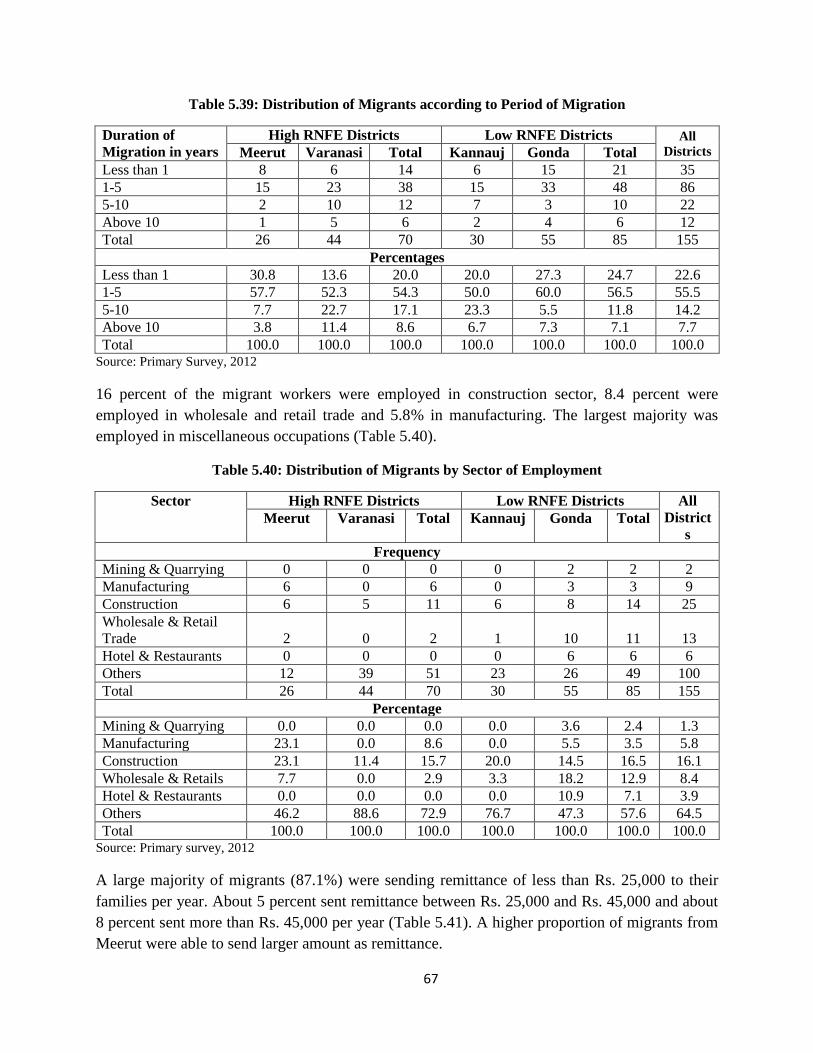
67
Table 5.39: Distribution of Migrants according to Period of Migration
Duration of
Migration in years
High RNFE Districts Low RNFE Districts All
Districts Meerut Varanasi Total Kannauj Gonda Total
Less than 1 8 6 14 6 15 21 35
1-5 15 23 38 15 33 48 86
5-10 2 10 12 7 3 10 22
Above 10 1 5 6 2 4 6 12
Total 26 44 70 30 55 85 155
Percentages
Less than 1 30.8 13.6 20.0 20.0 27.3 24.7 22.6
1-5 57.7 52.3 54.3 50.0 60.0 56.5 55.5
5-10 7.7 22.7 17.1 23.3 5.5 11.8 14.2
Above 10 3.8 11.4 8.6 6.7 7.3 7.1 7.7
Total 100.0 100.0 100.0 100.0 100.0 100.0 100.0 Source: Primary Survey, 2012
16 percent of the migrant workers were employed in construction sector, 8.4 percent were
employed in wholesale and retail trade and 5.8% in manufacturing. The largest majority was
employed in miscellaneous occupations (Table 5.40).
Table 5.40: Distribution of Migrants by Sector of Employment
Sector High RNFE Districts Low RNFE Districts All
District
s Meerut Varanasi Total Kannauj Gonda Total
Frequency
Mining & Quarrying 0 0 0 0 2 2 2
Manufacturing 6 0 6 0 3 3 9
Construction 6 5 11 6 8 14 25
Wholesale & Retail
Trade 2 0 2 1 10 11 13
Hotel & Restaurants 0 0 0 0 6 6 6
Others 12 39 51 23 26 49 100
Total 26 44 70 30 55 85 155
Percentage
Mining & Quarrying 0.0 0.0 0.0 0.0 3.6 2.4 1.3
Manufacturing 23.1 0.0 8.6 0.0 5.5 3.5 5.8
Construction 23.1 11.4 15.7 20.0 14.5 16.5 16.1
Wholesale & Retails 7.7 0.0 2.9 3.3 18.2 12.9 8.4
Hotel & Restaurants 0.0 0.0 0.0 0.0 10.9 7.1 3.9
Others 46.2 88.6 72.9 76.7 47.3 57.6 64.5
Total 100.0 100.0 100.0 100.0 100.0 100.0 100.0 Source: Primary survey, 2012
A large majority of migrants (87.1%) were sending remittance of less than Rs. 25,000 to their
families per year. About 5 percent sent remittance between Rs. 25,000 and Rs. 45,000 and about
8 percent sent more than Rs. 45,000 per year (Table 5.41). A higher proportion of migrants from
Meerut were able to send larger amount as remittance.

68
Table 5.41: Annual Remittance Sent by Migrants (Rs.)
Sector High RNFE Districts Low RNFE Districts All
Districts Meerut Varanasi Total Kannauj Gonda Total
Frequency
Below 25000 18 41 59 28 48 76 135
25000-45000 5 1 6 1 1 2 8
Above 45000 3 2 5 1 6 7 12
Total 26 44 70 30 55 85 155
Percentage
Below 25000 69.2 93.2 84.3 93.3 87.3 89.4 87.1
25000-45000 19.2 2.3 8.6 3.3 1.8 2.4 5.2
Above 45000 11.5 4.5 7.1 3.3 10.9 8.2 7.7
Total 100.0 100.0 100.0 100.0 100.0 100.0 100.0 Source: Primary survey, 2012
5.9 Female Employment
We now analyse the employment status of female workers. In general, female work participation
rate is lower in UP. There were 2,667 adult women in the sample households above 15 years of
age. Three-fourths of adult women were employed only in household work. This proportion was
as high as 87 percent in Varanasi. 2.6 percent were engaged in family labour in agriculture and a
few in family labour in non-agriculture. Thus, only one-fifth women were engaged in paid work
like self-employment in non-agriculture, wage labour and other activities (Table 5.42).
This proportion was lowest in Varanasi (13%). A higher proportion of females in Gonda was
engaged in wage labour.
Table 5.42: Distribution of Adult Female Members by District and Activity
Activity
High RNFE Districts Low RNFE Districts All
Districts Meerut Varanasi Total Kannauj Gonda Total
Frequency
Only household work 568 561 1129 379 495 874 2003
Family labour in agriculture 36 3 39 5 25 30 69
Family labour in non-
agriculture 1 7 8 1 0 1 9
Self employment in non-
agriculture 15 33 48 31 6 37 85
Wage labour 24 35 59 21 68 89 148
Other activities 174 7 181 86 86 172 353
Total 818 646 1464 523 680 1203 2667
Percentage
Only household work 69.4 86.8 77.1 72.5 72.8 72.7 75.1
Family labour in agriculture 4.4 0.5 2.7 1.0 3.7 2.5 2.6
Family labour in non-
agriculture 0.1 1.1 0.5 0.2 0.0 0.1 0.3
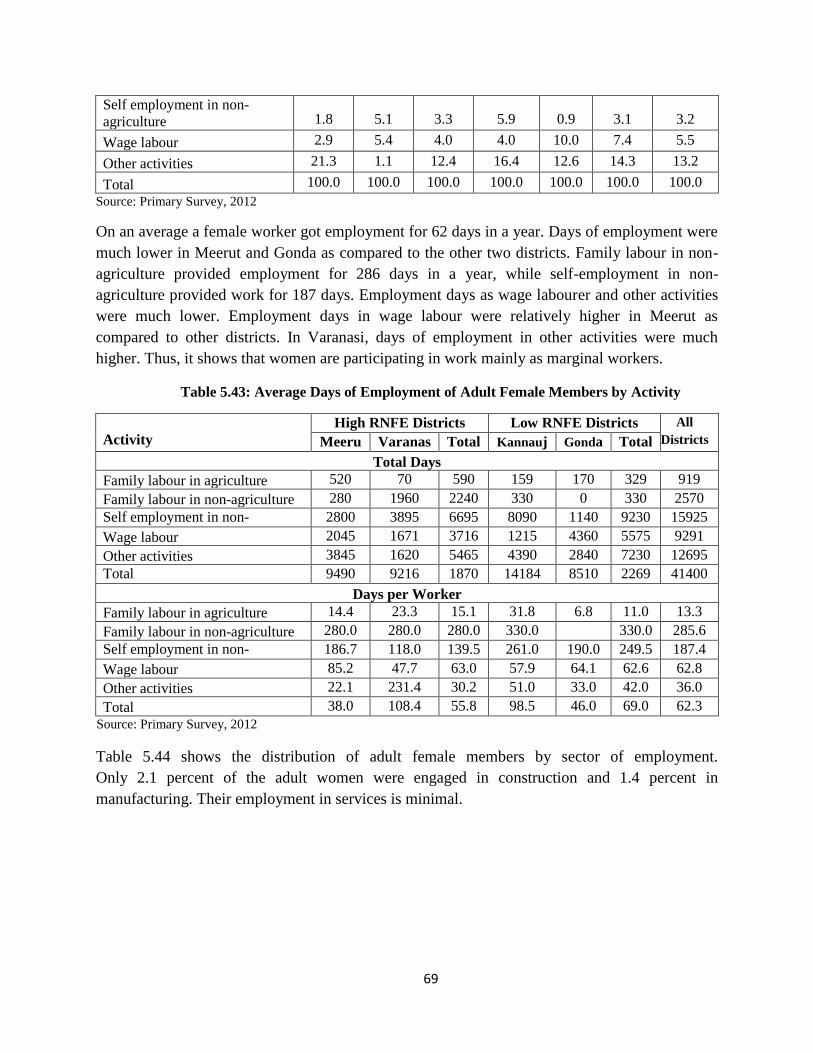
69
Self employment in non-
agriculture 1.8 5.1 3.3 5.9 0.9 3.1 3.2
Wage labour 2.9 5.4 4.0 4.0 10.0 7.4 5.5
Other activities 21.3 1.1 12.4 16.4 12.6 14.3 13.2
Total 100.0 100.0 100.0 100.0 100.0 100.0 100.0
Source: Primary Survey, 2012
On an average a female worker got employment for 62 days in a year. Days of employment were
much lower in Meerut and Gonda as compared to the other two districts. Family labour in non-
agriculture provided employment for 286 days in a year, while self-employment in non-
agriculture provided work for 187 days. Employment days as wage labourer and other activities
were much lower. Employment days in wage labour were relatively higher in Meerut as
compared to other districts. In Varanasi, days of employment in other activities were much
higher. Thus, it shows that women are participating in work mainly as marginal workers.
Table 5.43: Average Days of Employment of Adult Female Members by Activity
Activity
High RNFE Districts Low RNFE Districts All
Districts Meeru
t
Varanas
i
Total Kannauj Gonda Total
Total Days
Family labour in agriculture 520 70 590 159 170 329 919
Family labour in non-agriculture 280 1960 2240 330 0 330 2570
Self employment in non-
agriculture
2800 3895 6695 8090 1140 9230 15925
Wage labour 2045 1671 3716 1215 4360 5575 9291
Other activities 3845 1620 5465 4390 2840 7230 12695
Total
9490 9216 1870
6
14184 8510 2269
4
41400
Days per Worker
Family labour in agriculture 14.4 23.3 15.1 31.8 6.8 11.0 13.3
Family labour in non-agriculture 280.0 280.0 280.0 330.0
330.0 285.6
Self employment in non-
agriculture
186.7 118.0 139.5 261.0 190.0 249.5 187.4
Wage labour 85.2 47.7 63.0 57.9 64.1 62.6 62.8
Other activities 22.1 231.4 30.2 51.0 33.0 42.0 36.0
Total 38.0 108.4 55.8 98.5 46.0 69.0 62.3
Source: Primary Survey, 2012
Table 5.44 shows the distribution of adult female members by sector of employment.
Only 2.1 percent of the adult women were engaged in construction and 1.4 percent in
manufacturing. Their employment in services is minimal.

70
Table 5.44: Distribution of Adult Female Members by District and Sector of Employment
Sector High RNFE Districts Low RNFE Districts All
Districts Meerut Varanasi Total Kannauj Gonda Total
Frequency
Mining & Quarrying 0 0 0 0 0
Manufacturing 7 28 35 1 1 2 37
Construction 9 16 25 30 2 32 57
Wholesale & Retail
Trade 0 1 1 1 2 3 4
Hotel & Restaurant 0 3 3 0 0 0 3
Others (agriculture &
allied activity,
household work, etc.)
802 598 1400 491 675 1166 2566
Total 818 646 1464 523 680 1203 2667
Percentage
Mining & Quarrying 0.0 0.0 0.0 0.0 0.0 0.0 0.0
Manufacturing 0.9 4.3 2.4 0.2 0.1 0.2 1.4
Construction 1.1 2.5 1.7 5.7 0.3 2.7 2.1
Wholesale & Retail
Trade 0.0 0.2 0.1 0.2 0.3 0.2 0.1
Hotel & Restaurant 0.0 0.5 0.2 0.0 0.0 0.0 0.1
Others (agriculture &
allied activity,
household work, etc.)
98.0 92.6 95.6 93.9 99.3 96.9 96.2
Total 100.0 100.0 100.0 100.0 100.0 100.0 100.0
Source: Primary Survey, 2012
Women mostly work at home, 92 percent of women were reported to be working at home
whether on domestic or productive activities. 7.5 percent worked in the village (Table 5.45). Less
than 1 percent reported working outside the village, mostly within the district. As the women
have to shoulder the responsibility of household work, it is difficult for them to work outside the
village.
Table 5.45: Distribution of Adult Female Members by District and Workplace
Workplace
High RNFE Districts Low RNFE Districts All
Districts Meerut Varanasi Total Kannauj Gonda Total
Frequency
Within House 774 600 1374 484 588 1072 2446
Within Village 36 42 78 36 87 123 201
Within District 8 2 10 3 4 7 17
Outside District 0 0 0
0 0
Within house and village 0 2 2 0 1 1 3
Total 818 646 1464 523 680 1203 2667
Percentage
Within House 94.6 92.9 93.9 92.5 86.5 89.1 91.7
Within Village 4.4 6.5 5.3 6.9 12.8 10.2 7.5
Within District 1.0 0.3 0.7 0.6 0.6 0.6 0.6
Outside District 0.0 0.0 0.0 0.0 0.0 0.0 0.0
Within house and village 0.0 0.3 0.1 0.0 0.1 0.1 0.1
Total 100.0 100.0 100.0 100.0 100.0 100.0 100.0
Source: Primary Survey, 2012

71
The respondents were asked to report if women faced some work related problems. Nearly in
half of the cases there was no response to this question. In 45.6 percent of the cases it was said
that there is no problem. This is most possibly due to the fact that our respondents were mostly
males and the question was not put to female workers directly. Only 6.3 percent of the
respondents reported that distance is a problem for women workers (Table 5.46).
Table 5.46: Problems related to Work faced by Adult Female Members by District
Problems
High RNFE Districts Low RNFE Districts All
Districts Meerut Varanasi Total Kannauj Gonda Total
Frequency
No problem 805 33 838 365 13 378 1216
Distance 13 46 59 57 52 109 168
Family responsibility 0 0 0 0 0 0 0
Family not allowing 0 0 0 0 0 0 0
Work place issues 0 0 0 0 0 0 0
No response 0 567 567 101 615 716 1283
Total 818 646 1464 523 680 1203 2667
Percentage
No problem 98.4 5.1 57.2 69.8 1.9 31.4 45.6
Distance 1.6 7.1 4.0 10.9 7.6 9.1 6.3
Family responsibility 0.0 0.0 0.0 0.0 0.0 0.0 0.0
Family not allowing 0.0 0.0 0.0 0.0 0.0 0.0 0.0
Work place issues 0.0 0.0 0.0 0.0 0.0 0.0 0.0
No response 0.0 87.8 38.7 19.3 90.4 59.5 48.1
Total 100.0 100.0 100.0 100.0 100.0 100.0 100.0
Source: Primary Survey, 2012
5.10 Conclusion
The main findings of the present chapter are summarised below:
In our sample the WPR came to 30.5percent.
41.9 percent of workers were employed in cultivation. 3.1 percent were engaged in agricultural
labour and 18.5 percent in non-agriculture labour. Another 18 percent were self-employed in
non-agricultural activities, 4.7 percent were employed in public services and 7.8 percent in
private services. In all the districts surveyed we find that now non-agricultural sector provides
employment to more than half of the rural workers.
There has been a gradual shift in workers away from the agricultural sector during the past
decade. Agriculture and animal husbandry employed 58.2 percent of the workers ten years ago.
This proportion declined to 48.1 percent five years ago and presently stands at 43.5 percent.
The proportion of agricultural labourers has remained stable at around 3 percent during the
decade. Thus, the share of agricultural workers on the whole has declined, from 61.3 percent ten
years ago to 46.4 percent now.

72
The growth of total workers was 19 percent in both the five year sub-periods. The number of
workers in animal husbandry shows a high growth. The number of cultivators declined during
2002-07 but increased by 7.2 percent during 2007-12. Agricultural labourers grew by about 24
percent in both the sub-periods. Non-agricultural labourers also show a high growth during the
decade. Private services and self-employed in non-agriculture are the fastest growing sectors in
the rural areas.
The main reasons reported for the occupational shifts were small size of landholdings and search
for new employment opportunity. Low income in agriculture also propelled shift to other sectors.
The role of government schemes was nominal. About 5 percent of the workers went in for higher
education.
Most of the family workers were engaged in agriculture and allied activities as secondary
occupation. Very few reported non-agricultural activity as their secondary occupation.
More than half of the non-agricultural labourers were employed in the construction activity.
Very few non-agricultural labourers were employed in manufacturing, trade and hotel &
restaurants. About 41 percent of the labourers were engaged in miscellaneous activities.
About 32 percent of the workers in non-agricultural labour found employment within the village
and 62 percent found work within the district. Very few labourers in all the four districts went
outside the district to find work. Looking at the distance from place of work we find that about
28percent non-agricultural labour work within the village and another 35 percent get work within
5 km of their residence.
It was found that non-agricultural labour does not provide work throughout the year. Only about
43 percent of the people reportedly got employment as non-agricultural labour from 6 to 12
months. Nearly the same proportion reported getting work for 3 to 6 months, while 12.5 percent
worked as non-agricultural labour for less than three months. About three-fourths workers
reported working for 8 hours and above and the remaining one-fourth worked from 4 to 8 hours
per day. Almost all non-agriculture labourers were working as casual workers.
The study of mode of wage payment revealed that over 90 non-agricultural labourers were paid
wages on daily basis, while 1.2 percent got wages on monthly basis. 7.6 percent reported
working on piece rate basis. Average annual earning of non-agricultural labour was reported at
Rs.30,573. Highest earning was reported in the case of manufacturing, followed by construction.
Considerable variations in annual earnings were also found among districts within the same
sector. The earning levels are higher for OBC and other castes as compared to ST and SC group.
Self-Employed in Non-Agricultural (SENAg) workers account for about one-fifth of the total
workers and two-fifths of the non-agricultural workers. Wholesale and retail trade is the most
import SENAg activity, followed by manufacturing and services. Self-employed workers in
73
manufacturing basically work from their home in the village. In construction, trade and service
about two-thirds of the self-employed workers get employment in the village itself.
Those engaged in transport activities operate mostly from outside the village. Nearly all the self-
employed workers are working within the district.
Average annual earning per self-employed person was estimated at Rs. 35,373 for all the sample
households. It varied from Rs. 12,711 in Kannauj to Rs.59,357 in Gonda district. Average
earnings were the highest in case of service sector, followed by transport, while the lowest
earnings were reported in manufacturing.
Services are emerging as an important source of employment even in the rural areas.
They account for 12.5 percent of total rural workers and a little less than one-fourth of RNFE in
our sample. Per person annual earnings in the services were reported at Rs. 1,04,449 for the
sample households. It was much higher in the government sector (Rs. 1,86,211) as compared to
private sector (Rs. 55,186). Earning levels in contractual employment were found to be much
lower (Rs. 51,565) as compared to the employees in the regular employment (Rs. 1,91,930).
Looking at the quality of employment we find that in the government sector about two-thirds
employees received PF and insurance benefits and about 56 percent received medical and
retirement benefit.
In our sample only 3.7 percent of the workers reported working under MNREGS. The proportion
of households working on MNREGs is much higher for SC and ST workers as compared to OBC
and other categories. On an average a worker got 33 days of employment in a year in MNREGS.
On the whole, the contribution of MNREGs to employment generation as proportion of total
employment does not seem to be much.
Only about 7 percent of the sample households reported having migrant workers. Around three-
fourths of the migrant workers were working in other states, while about one-sixth were working
within the state in other districts. All the migrant workers were males. 16 percent of migrant
workers were employed in construction sector, 8.4 percent were employed in wholesale and
retail trade and 5.8 in manufacturing. Largest majority was employed in miscellaneous
occupations. A large majority of migrants (87.1%) were sending remittance of less than
Rs. 25,000 to their families per year.
Only one-fifth of the women were engaged in paid work like self-employment in non-
agriculture, wage labour and other activities. On and average a female worker got employment
for 62 days in a year. Family labour in non-agriculture provided employment for 286 days in a
year, while self-employment in non-agriculture provided work for 187 days. Employment days
as wage labour and other activities were much lower. Thus, it shows that women are
participating in work mainly as marginal workers. 92 percent women were reported to be
working at home whether on domestic or productive activities. As the women have to shoulder
the responsibility of household of the work, it is difficult for them to work outside the village.

74
CHAPTER VI
Characteristics of Village Enterprises
During the survey, information about village enterprises was also collected. We surveyed about
ten enterprises in each village covering different types of activities. In all, information was
collected from 207 enterprises located in the 20 villages surveyed. In the present chapter the
main findings of the enterprise survey have been presented.
6.1 Type of Enterprises
Out of the 207 enterprises surveyed, 37 percent were trade enterprises. About 23 percent each
were manufacturing and non-manufacturing enterprise, 13 percent were service enterprise and 4
percent belonged to other categories (Table 6.1). The proportion of manufacturing enterprises
was much higher in high RNFE districts as compared to low RNFE districts. Trade and service
related enteprises were numerous in the two low RNFE districts.
Table 6.1: Number of Enterprises by Type of Enterprise
Category
of District District Manufacturing Non-
Manufacturing Trade Service Others Total
Frequency
High RNFE
Districts
Meerut 19 20 12 1 4 56
Varanasi 16 6 21 6 2 51
Total 35 26 33 7 6 107
Low RNFE
Districts
Kannauj 8 2 26 11 3 50
Gonda 4 19 18 9 0 50
Total 12 21 44 20 3 100
All districts Total 47 47 77 27 9 207
Percentage
High RNFE
Districts
Meerut 33.9 35.7 21.4 1.8 7.1 100.0
Varanasi 31.4 11.8 41.2 11.8 3.9 100.0
Total 32.7 24.3 30.8 6.5 5.6 100.0
Low
Districts
RNFE
Kannauj 16.0 4.0 52.0 22.0 6.0 100.0
Gonda 8.0 38.0 36.0 18.0 0.0 100.0
Total 12.0 21.0 44.0 20.0 3.0 100.0
All districts Total 22.7 22.7 37.2 13.0 4.3 100.0
Source: Primary Survey, 2012
6.2 Year of Establishment
Out of the total enterprises, 46.4 percent were established before 2000 and 53.6 percent were
established thereafter. Nearly same pattern was observed across different types of enterprises
except in the case of non-manufacturing enterprises. A higher proportion of the latter were of old
vintage. The proportion of new enterprises was higher in the low RNFE districts, particularly in
Kannauj.

75
Table 6.2: Distribution of Enterprises by Year of Establishment
Type of
Enterprise
Year of
establishmen
t
High RNFE Districts
Low RNFE Districts
All
districts Meerut Varanasi Total Kannauj Gonda Total
Frequency
Manufacturing Before 2000 8 9 17 4 2 6 23
After 2000 11 7 18 4 2 6 24
Non-
Manufacturing
Before 2000 16 6 22 1 6 7 29
After 2000 4 0 4 1 13 14 18
Trade Before 2000 4 8 12 5 11 16 28
After 2000 8 13 21 21 7 28 49
Service Before 2000 0 4 4 4 4 8 12
After 2000 1 2 3 7 5 12 15
Others Before 2000 0 1 1 3 0 3 4
After 2000 4 1 5 0 0 0 5
Total Before 2000 28 28 56 17 23 40 96
After 2000 28 23 51 33 27 60 11
1 Percentage
Manufacturing Before 2000 42.1 56.3 48.
6
50.0 50.0 50.0 48.
9 After 2000 57.9 43.8 51.
4
50.0 50.0 50.0 51.
1 Non-
Manufacturing
Before 2000 80.0 100.0 84.
6
50.0 31.6 33.3 61.
7 After 2000 20.0 0.0 15.
4
50.0 68.4 66.7 38.
3 Trade
Before 2000 33.3 38.1 36.
4
19.2 61.1 36.4 36.
4 After 2000 66.7 61.9 63.
6
80.8 38.9 63.6 63.
6 Service
Before 2000 0.0 66.7 57.
1
36.4 44.4 40.0 44.
4 After 2000 100.0 33.3 42.
9
63.6 55.6 60.0 55.
6 Others
Before 2000 0.0 50.0 16.
7
100.0 0.0 100.0 44.
4 After 2000 100.0 50.0 83.
3
0.0 100.0 0.0 55.
6 Total
Before 2000 50.0 54.9 52.
3
34.0 46.0 40.0 46.
4 After 2000 50.0 45.1 47.
7
66.0 54.0 60.0 53.
6 Source: Primary Survey, 2012
6.3 No. of Employees
Most of the enterprises are in the nature of micro-enterprises run by the entrepreneur himself.
There was a little less than one employee per enterprise. The size of unit was somewhat larger in
Meerut with 1.2 employees per enterprise. However, in Kannauj a very few hired employees
were employed. Among all the sectors, manufacturing and non-manufacturing enterprises were
somewhat larger. Trading enterprises were mostly run without hired workers. They are mostly
one-man shops.
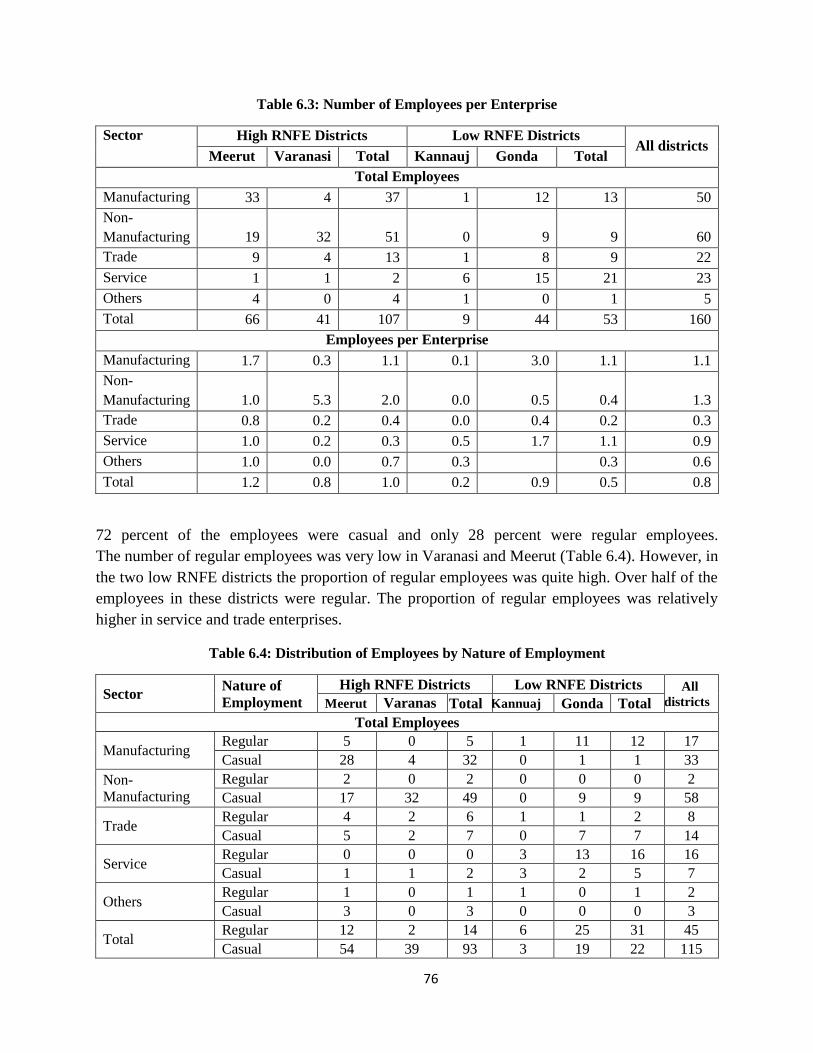
76
Table 6.3: Number of Employees per Enterprise
Sector High RNFE Districts Low RNFE Districts All districts
Meerut Varanasi Total Kannauj Gonda Total
Total Employees
Manufacturing 33 4 37 1 12 13 50
Non-
Manufacturing 19 32 51 0 9 9 60
Trade 9 4 13 1 8 9 22
Service 1 1 2 6 15 21 23
Others 4 0 4 1 0 1 5
Total 66 41 107 9 44 53 160
Employees per Enterprise
Manufacturing 1.7 0.3 1.1 0.1 3.0 1.1 1.1
Non-
Manufacturing 1.0 5.3 2.0 0.0 0.5 0.4 1.3
Trade 0.8 0.2 0.4 0.0 0.4 0.2 0.3
Service 1.0 0.2 0.3 0.5 1.7 1.1 0.9
Others 1.0 0.0 0.7 0.3
0.3 0.6
Total 1.2 0.8 1.0 0.2 0.9 0.5 0.8
72 percent of the employees were casual and only 28 percent were regular employees.
The number of regular employees was very low in Varanasi and Meerut (Table 6.4). However, in
the two low RNFE districts the proportion of regular employees was quite high. Over half of the
employees in these districts were regular. The proportion of regular employees was relatively
higher in service and trade enterprises.
Table 6.4: Distribution of Employees by Nature of Employment
Sector Nature of
Employment
High RNFE Districts Low RNFE Districts All
districts Meerut Varanas
i Total Kannuaj Gonda Total
Total Employees
Manufacturing Regular 5 0 5 1 11 12 17
Casual 28 4 32 0 1 1 33
Non-
Manufacturing
Regular 2 0 2 0 0 0 2
Casual 17 32 49 0 9 9 58
Trade Regular 4 2 6 1 1 2 8
Casual 5 2 7 0 7 7 14
Service Regular 0 0 0 3 13 16 16
Casual 1 1 2 3 2 5 7
Others Regular 1 0 1 1 0 1 2
Casual 3 0 3 0 0 0 3
Total Regular 12 2 14 6 25 31 45
Casual 54 39 93 3 19 22 115

77
Percent
Manufacturing Regular 15.2 0.0 13.5 100.0 91.7 92.3 34.0
Casual 84.8 100.0 86.5 0.0 8.3 7.7 66.0
Non-
Manufacturing Regular 10.5 0.0 3.9 0.0 0.0 0.0 3.3
Casual 89.5 100.0 96.1 100.0 100.0 100.0 96.7
Trade Regular 44.4 50.0 46.2 100.0 12.5 22.2 36.4
Casual 55.6 50.0 53.8 0.0 87.5 77.8 63.6
Service Regular 0.0 0.0 0.0 50.0 86.7 76.2 69.6
Casual 100.0 100.0 100.
0
50.0 13.3 23.8 30.4
Others Regular 25.0 0.0 25.0 100.0 0.0 100.0 40.0
Casual 75.0 100.0 75.0 0.0 100.0 0.0 60.0
Total Regular 18.2 4.9 13.1 66.7 56.8 58.5 28.1
Casual 81.8 95.1 86.9 33.3 43.2 41.5 71.9
Source: Primary Survey, 2012
Nearly 90 percent of the employees were from the village itself. In Gonda this proportion was
lower as compared to the other districts (Table 6.5.). Some of the workers came from the same
district but outside the village. Only 1 percent of the employees came from other districts or
states.
Table 6.5: Distribution of Employees by Place of Origin
Place of Marketing High RNFE Districts
Low RNFE Districts
All
districts Meerut Varanasi Total Kannauj Gonda Total
Frequency
Within Village 49 48 97 48 41 89 186
Within District 6 2 8 1 7 8 16
Within village and district 0 0 0 1 2 3 3
Within village and outside district 1 0 1 0 0 0 1
Outside District 0 1 1 0 0 0 1
Outside State 0 0 0 0 0 0 0
Total 56 51 107 50 50 100 207
Percentages
Within Village 87.5 94.1 90.7 96 82 89 89.9
Within District 10.7 3.9 7.5 2 14 8 7.7
Within village and district 0 0 0 2 4 3 1.4
Within village and outside district 1.8 0 0.9 0 0 0 0.5
Outside District 0 2 0.9 0 0 0 0.5
Outside State 0 0 0 0 0 0 0
Total 100 100 100 100 100 100 100 Source: Primary Survey, 2012
6.4 Average Monthly Earnings
Average monthly earnings of enterprises for the entire sample came to Rs. 5318. Income levels
were almost double in Meerut and Gonda as compared to Varanasi and Kannauj district

78
(Table 6.6). Among different types of enterprises industrial enterprises (manufacturing and non-
manufacturing) had much higher earnings levels as compared to trade and services. The earnings
were the lowest in trade. Within the same category considerable differences in earning levels are
observed among the four districts. In all, the categories earnings were higher in Meerut and
Gonda as compared to Varanasi and Kannauj.
Table 6.6: Average Net Earning per Month by Type of Enterprise (Rs.)
Sector High RNFE Districts
Low RNFE Districts
All
districts
Meerut Varanasi Total Kannauj Gonda Total
Total Earnings
Manufacturing 165300 55100 220400 27800 36000 63800 284200
Non-Manufacturing 124500 27200 151700 7300 122000 129300 281000
Trade 66800 83500 150300 86800 101500 188300 338600
Service 8000 18000 26000 38900 76000 114900 140900
Others 42500 5500 48000 8200 0 8200 56200
total 407100 189300 596400 169000 335500 504500 110090
0 Per Enterprise
Manufacturing 8700 3444 6297 3475 9000 5317 6047
Non-Manufacturing 6225 4533 5835 3650 6421 6157 5979
Trade 5567 3976 4555 3338 5639 4280 4397
Service 8000 3000 3714 3536 8444 5745 5219
Others 10625 2750 8000 2733 0 2733 6244
total 7270 3712 5574 3380 6710 5045 5318 Source: Primary Survey, 2012
6.5 Marketing of Produce
Village enterprises are mainly catering to the local demand. About 70 percent enterprises
reported that they sell their products in the village itself. 10 percent sell within the district and
another 7 percent in both the village and district. Only 7 percent reported selling their products
outside the district. The pattern of sale, however, differed among districts. In Meerut only
39percent sold their output within the village, while 52 percent enterprises sold their output
within the village in Gonda. On the other hand, in Varanasi and Kannauj nearly whole of output
was sold in the village itself. In case of Meerut, 21 percent of the enterprises reported selling
their products outside the district. The nature of enterprises, thus seem to be different in Meerut
and Gonda. It will also be observed that the earning levels were also higher in these two districts.
It appears that the size of market and earning levels are correlated.

79
Table 6.7: Distribution of Enterprises by Place of Marketing of Their Product
Place of Marketing High RNFE Districts
Low RNFE Districts
All
districts
Meerut Varanasi Total Kannauj Gonda Total
Frequency
Within Village 22 49 71 49 26 75 146
Within District 13 2 15 1 5 6 21
Outside District 12 0 12 0 3 3 15
Outside State 0 0 0 0 0 0 0
Within village and district 8 0 8 0 16 16 24
Within and outside of village 1 0 1 0 0 0 1
Total 56 51 107 50 50 100 207
Percent
Within Village 39.3 96.1 66.4 98 52 75 70.5
Within District 23.2 3.9 14 2 10 6 10.1
Outside District 21.4 0 11.2 0 6 3 7.2
Outside State 0 0 0 0 0 0 0
Within village and district 14.3 0 7.5 0 32 16 11.6
Within and outside of village 1.8 0 0.9 0 0 0 0.5
Total 100 100 100 100 100 100 100 Source: Primary Survey, 2012
Most of the enterprises sell their output directly to the consumers. In the two low RNFE districts
the entire output was sold directly to the consumers by the producers. This proportion was 82
percent in Varanasi and 68 percent in Meerut (Table 6.8). In these two districts middlemen were
also engaged for marketing of output. No enterprise sold its output to the government.
Table 6.8: Distribution of Enterprises by Mode of Marketing
Mode of Marketing High RNFE Districts
Low RNFE Districts
All
districts
Meerut Varanasi Total Kannauj Gonda Total
Frequency
Direct Sale 38 42 80 50 50 100 180
Through Middle Men 17 8 25 0 0 0 25
Both Direct sale and middle men 1 0 1 0 0 0 1
Govt. Procurement 0 0 0 0 0 0 0
Others 0 1 1 0 0 0 1
Total 56 51 107 50 50 100 207
Percentages
Direct Selling 67.9 82.4 74.8 100 100 100 87.0
Middle Men 30.4 15.7 23.4 0 0 0 12.1
Both Direct Sale and middle men 1.8 0 0.9 0 0 0 0.5
Govt. Procurement 0 0 0 0 0 0 0.0
Others 0 2 0.9 0 0 0 0.5
Total 100 100 100 100 100 100 100 Source: Primary Survey, 2012
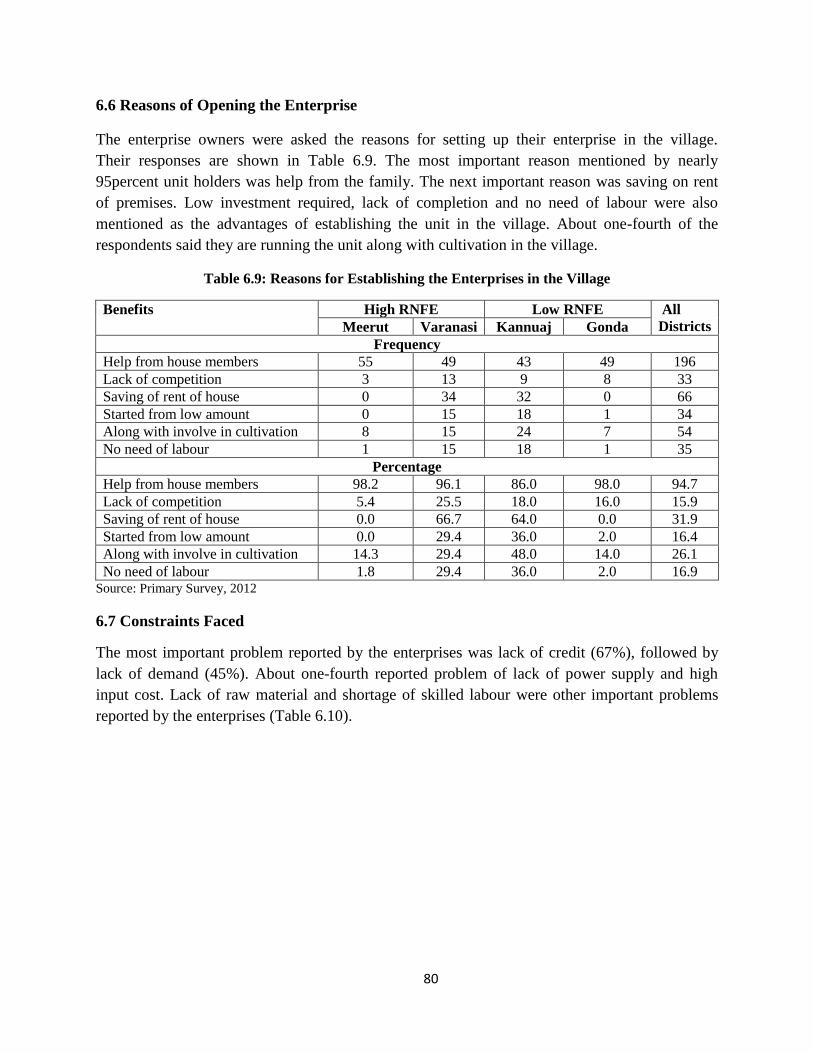
80
6.6 Reasons of Opening the Enterprise
The enterprise owners were asked the reasons for setting up their enterprise in the village.
Their responses are shown in Table 6.9. The most important reason mentioned by nearly
95percent unit holders was help from the family. The next important reason was saving on rent
of premises. Low investment required, lack of completion and no need of labour were also
mentioned as the advantages of establishing the unit in the village. About one-fourth of the
respondents said they are running the unit along with cultivation in the village.
Table 6.9: Reasons for Establishing the Enterprises in the Village
Benefits High RNFE Low RNFE All
Districts Meerut Varanasi Kannuaj Gonda
Frequency
Help from house members 55 49 43 49 196
Lack of competition 3 13 9 8 33
Saving of rent of house 0 34 32 0 66
Started from low amount 0 15 18 1 34
Along with involve in cultivation 8 15 24 7 54
No need of labour 1 15 18 1 35
Percentage
Help from house members 98.2 96.1 86.0 98.0 94.7
Lack of competition 5.4 25.5 18.0 16.0 15.9
Saving of rent of house 0.0 66.7 64.0 0.0 31.9
Started from low amount 0.0 29.4 36.0 2.0 16.4
Along with involve in cultivation 14.3 29.4 48.0 14.0 26.1
No need of labour 1.8 29.4 36.0 2.0 16.9 Source: Primary Survey, 2012
6.7 Constraints Faced
The most important problem reported by the enterprises was lack of credit (67%), followed by
lack of demand (45%). About one-fourth reported problem of lack of power supply and high
input cost. Lack of raw material and shortage of skilled labour were other important problems
reported by the enterprises (Table 6.10).

81
Table 6.10: Constraints faced by Enterprises in Running the Establishment
Constraints High RNFE
Low RNFE
All
Districts
Meerut Varanasi Kannuaj Gonda
Frequency
Lack of credit 13 47 50 29 139
Lack of demand 12 35 40 6 93
Inadequate of power
supply 18 15 1 18 52
High input cost 23 3 5 18 49
Lack of raw material 9 10 9 4 32
Lack of skilled labour 16 1 3 8 28
Inadequate benefit 3 10 9 1 23
Problem due to taxes 2 8 9 2 21
High competition 7 7 4 2 20
Problem in license 1 5 7 2 15
Untimely payment by
middle-man 5 1 3 0 9
Percentage
Lack of credit 23.2 92.2 100 58 67.1
Lack of demand 21.4 68.6 80 12 44.9
Inadequate of power
supply 32.1 29.4 2 36 25.1
High input cost 41.1 5.9 10 36 23.7
Lack of raw material 16.1 19.6 18 8 15.5
Lack of skilled labour 28.6 2 6 16 13.5
Inadequate benefit 5.4 19.6 18 2 11.1
Problem due to taxes 3.6 15.7 18 4 10.1
High competition 12.5 13.7 8 4 9.7
Problem in license 1.8 9.8 14 4 7.2
Untimely payment by
middle-man 8.9 2 6 0 4.3 Source: Primary Survey, 2012
6.8 Conclusion
The main findings of the chapter are summarised below:
Out of the 207 enterprises surveyed, 37 percent were trade enterprises, about 23 percent each
were manufacturing and non-manufacturing enterprise, 13 percent were service enterprise and
4 percent belonged to other categories.
Out of the total enterprises 46.4 percent, were established before 2000 and 53.6 percent were
established thereafter.
Most of the enterprises are in the nature of micro-enterprises run by the entrepreneur himself.
There was a little less than one employee per enterprise.

82
About 72 percent of the employees were casual and only 28 percent were regular employees.
Nearly 90 percent of the employees were from the village itself.
Average monthly earning of enterprises for the entire sample came to Rs. 5318. Among different
types of enterprises industrial enterprises had much higher earnings as compared to trade and
services. Earnings were the lowest in trade. Within the same category considerable differences in
earning levels are observed among the four districts.
Village enterprises are mainly catering to the local demand. About 70 percent of the enterprises
reported that they sell their products in the village itself, 10 percent sell within the district and
another 7 percent in village and district both. Only 7 percent reported selling their products
outside the district. Most of the enterprises sell their output directly to the consumers.
The most important reason for setting up the unit in the village mentioned by nearly 95 percent
unit holders was help from the family. The next important reason was saving on rent of premises.
Low investment, lack of completion and no need of labour were also mentioned as the
advantages of establishing the unit in the village. About one-fourth of the respondents said they
are running the unit along with the cultivation in the village.
The most important problem reported by the enterprises was lack of credit followed by the lack
of demand. About one-fourth reported problem of lack of power supply and high input cost.
Lack of raw material and shortage of skilled labour were other important problems reported by
the enterprises.

83
CHAPTER VII
Rural Non-Farm Employment: Some Correlates
In this chapter we propose to examine some of the factors associated with rural non-farm
employment as hypothesised in the beginning of the study. These correlates are related to the
gender composition, caste background, education level, earning differentials and infrastructure
development.
7.1 Sex Composition
It was hypothesised that RNFE activities would be related to gender. Participation of women in
RNFE is expected to be lower than that of men. We find that out of the total 1,649 workers in the
sample households 89 percent were males and only 11percent were females. The proportion of
female workers to total RNFE workers ranged from a low of 6.6 percent in Gonda to 15.9
percent in Kannauj (Table 7.1). Thus, the findings confirm the hypothesis of low participation of
women in RNFE activities.
Table 7.1: Number of Persons in RNFE Activities by Gender
Region/District Male Female Total
Nos. Percent to Total
RNFC
Workers
Nos. Percent to Total
RNFC
Workers
Nos.
Percent
to Total
RNFC
Workers
High
RNFE
Districts
Meerut 402 88.9 50 11.1 452 100.0
Varanasi 380 90.3 41 9.7 421 100.0
Total 782 89.6 91 10.4 873 100.0
Low
RNFE
Districts
Kannauj 313 84.1 59 15.9 372 100.0
Gonda 369 93.4 26 6.6 395 100.0
Total 682 88.9 85 11.1 767 100.0
All district 1464 89.3 176 10.7 1640 100.0
Source: Primary Survey, 2012
However, a higher proportion of total female workers was engaged in RNFE sector as compared
to male workers. The proportions were 57.9 percent and 52.9 percent respectively.
The proportion of female workers in RNFE was much higher in Kannauj and Varanasi as
compared to the other two districts (Table 7.2).
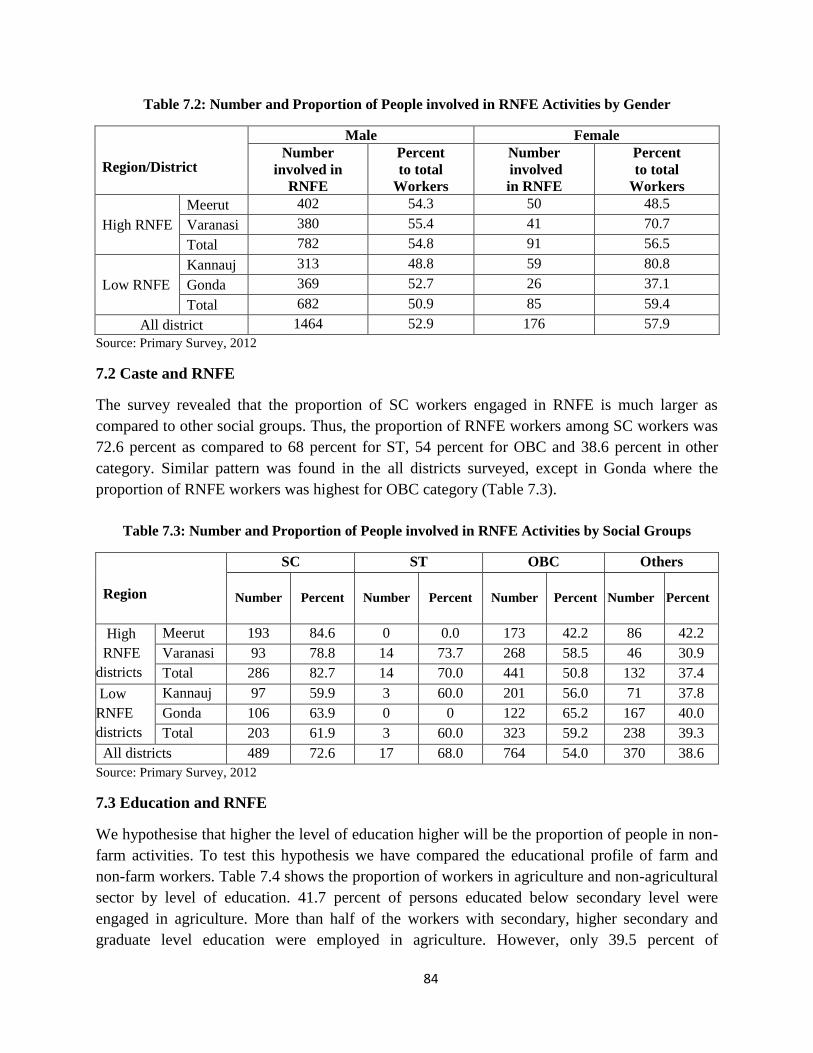
84
Table 7.2: Number and Proportion of People involved in RNFE Activities by Gender
Region/District
Male Female
Number
involved in
RNFE
Percent
to total
Workers
Number
involved
in RNFE
Percent
to total
Workers
High RNFE
Meerut 402 54.3 50 48.5
Varanasi 380 55.4 41 70.7
Total 782 54.8 91 56.5
Low RNFE
Kannauj 313 48.8 59 80.8
Gonda 369 52.7 26 37.1
Total 682 50.9 85 59.4
All district 1464 52.9 176 57.9
Source: Primary Survey, 2012
7.2 Caste and RNFE
The survey revealed that the proportion of SC workers engaged in RNFE is much larger as
compared to other social groups. Thus, the proportion of RNFE workers among SC workers was
72.6 percent as compared to 68 percent for ST, 54 percent for OBC and 38.6 percent in other
category. Similar pattern was found in the all districts surveyed, except in Gonda where the
proportion of RNFE workers was highest for OBC category (Table 7.3).
Table 7.3: Number and Proportion of People involved in RNFE Activities by Social Groups
Region
SC ST OBC Others
Number Percent Number Percent Number Percent Number Percent
High
RNFE
districts
Meerut 193 84.6 0 0.0 173 42.2 86 42.2
Varanasi 93 78.8 14 73.7 268 58.5 46 30.9
Total 286 82.7 14 70.0 441 50.8 132 37.4
Low
RNFE
districts
Kannauj 97 59.9 3 60.0 201 56.0 71 37.8
Gonda 106 63.9 0 0 122 65.2 167 40.0
Total 203 61.9 3 60.0 323 59.2 238 39.3
All districts 489 72.6 17 68.0 764 54.0 370 38.6
Source: Primary Survey, 2012
7.3 Education and RNFE
We hypothesise that higher the level of education higher will be the proportion of people in non-
farm activities. To test this hypothesis we have compared the educational profile of farm and
non-farm workers. Table 7.4 shows the proportion of workers in agriculture and non-agricultural
sector by level of education. 41.7 percent of persons educated below secondary level were
engaged in agriculture. More than half of the workers with secondary, higher secondary and
graduate level education were employed in agriculture. However, only 39.5 percent of
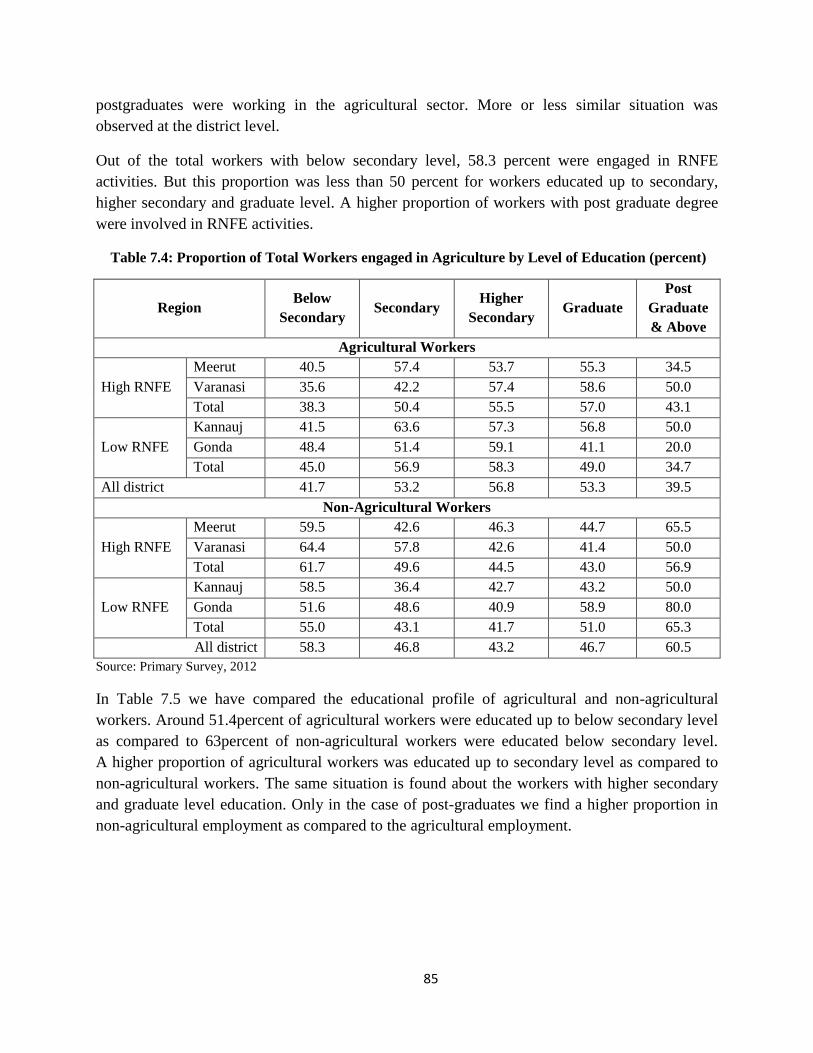
85
postgraduates were working in the agricultural sector. More or less similar situation was
observed at the district level.
Out of the total workers with below secondary level, 58.3 percent were engaged in RNFE
activities. But this proportion was less than 50 percent for workers educated up to secondary,
higher secondary and graduate level. A higher proportion of workers with post graduate degree
were involved in RNFE activities.
Table 7.4: Proportion of Total Workers engaged in Agriculture by Level of Education (percent)
Region
Below
Secondary Secondary
Higher
Secondary Graduate
Post
Graduate
& Above
Agricultural Workers
High RNFE
Meerut 40.5 57.4 53.7 55.3 34.5
Varanasi 35.6 42.2 57.4 58.6 50.0
Total 38.3 50.4 55.5 57.0 43.1
Low RNFE
Kannauj 41.5 63.6 57.3 56.8 50.0
Gonda 48.4 51.4 59.1 41.1 20.0
Total 45.0 56.9 58.3 49.0 34.7
All district 41.7 53.2 56.8 53.3 39.5
Non-Agricultural Workers
High RNFE
Meerut 59.5 42.6 46.3 44.7 65.5
Varanasi 64.4 57.8 42.6 41.4 50.0
Total 61.7 49.6 44.5 43.0 56.9
Low RNFE
Kannauj 58.5 36.4 42.7 43.2 50.0
Gonda 51.6 48.6 40.9 58.9 80.0
Total 55.0 43.1 41.7 51.0 65.3
All district 58.3 46.8 43.2 46.7 60.5
Source: Primary Survey, 2012
In Table 7.5 we have compared the educational profile of agricultural and non-agricultural
workers. Around 51.4percent of agricultural workers were educated up to below secondary level
as compared to 63percent of non-agricultural workers were educated below secondary level.
A higher proportion of agricultural workers was educated up to secondary level as compared to
non-agricultural workers. The same situation is found about the workers with higher secondary
and graduate level education. Only in the case of post-graduates we find a higher proportion in
non-agricultural employment as compared to the agricultural employment.

86
Table 7.5: Distribution of RNFE Workers by Level of Education (percent)
Districts Below
Secondary Secondary
Higher
Secondary Graduate
Post
Graduate
& Above
Total
Agricultural Workers
High
RNFE
Meerut 48.8 19.9 16.6 12.0 2.6 100.0
Varanasi 43.0 15.2 20.4 15.8 5.6 100.0
Total 46.2 17.8 18.3 13.7 3.9 100.0
Low
RNFE
Kannauj 54.1 16.4 13.7 12.3 3.5 100.0
Gonda 58.7 14.7 17.3 8.0 1.3 100.0
Total 56.5 15.5 15.6 10.0 2.4 100.0
All districts 51.4 16.6 17.0 11.9 3.1 100.0
Non-Agricultural Workers
High
RNFE
Meerut 62.2 12.8 12.4 8.4 4.2 100.0
Varanasi 59.6 15.9 11.6 8.6 4.3 100.0
Total 60.9 14.3 12.0 8.5 4.2 100.0
Low
RNFE
Kannauj 70.2 8.6 9.4 8.6 3.2 100.0
Gonda 59.5 13.2 11.4 10.9 5.1 100.0
Total 64.7 11.0 10.4 9.8 4.2 100.0
All districts 62.7 12.7 11.3 9.1 4.2 100.0
Source: Primary Survey, 2012
Thus, we find that contrary to our hypothesis the education profile of agricultural workers is
better than that of non-agricultural workers. This can be attributed to the fact that the jobs in the
non-agricultural sector are low paid jobs and do not require high level of education or training.
7.4 Education and Employment
It was also hypothesised that higher the level of education higher will be the days of employment
in non-farm activities. Table 7.6 provides support to this hypothesis. The average and median
number of days of employment increase with the level of education in the case of non-
agricultural labour. Thus, a person with secondary level education gets higher days of
employment as compared to a person with below secondary education. Similarly, a graduate
non-agricultural labour got employment for higher number of days as compared to the non-
graduates. However, in the case of post-graduate workers number of days was reported to be
lower.
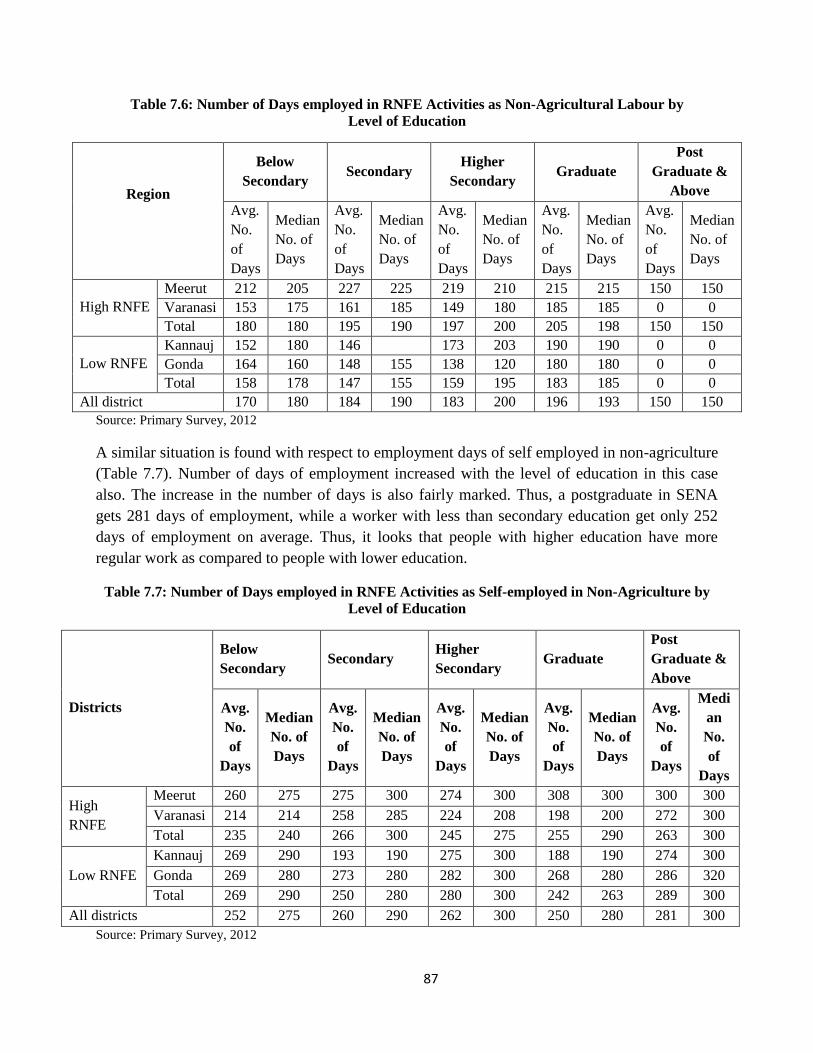
87
Table 7.6: Number of Days employed in RNFE Activities as Non-Agricultural Labour by
Level of Education
Region
Below
Secondary Secondary
Higher
Secondary Graduate
Post
Graduate &
Above
Avg.
No.
of
Days
Median
No. of
Days
Avg.
No.
of
Days
Median
No. of
Days
Avg.
No.
of
Days
Median
No. of
Days
Avg.
No.
of
Days
Median
No. of
Days
Avg.
No.
of
Days
Median
No. of
Days
High RNFE
Meerut 212 205 227 225 219 210 215 215 150 150
Varanasi 153 175 161 185 149 180 185 185 0 0
Total 180 180 195 190 197 200 205 198 150 150
Low RNFE
Kannauj 152 180 146
170
173 203 190 190 0 0
Gonda 164 160 148 155 138 120 180 180 0 0
Total 158 178 147 155 159 195 183 185 0 0
All district 170 180 184 190 183 200 196 193 150 150
Source: Primary Survey, 2012
A similar situation is found with respect to employment days of self employed in non-agriculture
(Table 7.7). Number of days of employment increased with the level of education in this case
also. The increase in the number of days is also fairly marked. Thus, a postgraduate in SENA
gets 281 days of employment, while a worker with less than secondary education get only 252
days of employment on average. Thus, it looks that people with higher education have more
regular work as compared to people with lower education.
Table 7.7: Number of Days employed in RNFE Activities as Self-employed in Non-Agriculture by
Level of Education
Districts
Below
Secondary Secondary
Higher
Secondary Graduate
Post
Graduate &
Above
Avg.
No.
of
Days
Median
No. of
Days
Avg.
No.
of
Days
Median
No. of
Days
Avg.
No.
of
Days
Median
No. of
Days
Avg.
No.
of
Days
Median
No. of
Days
Avg.
No.
of
Days
Medi
an
No.
of
Days
High
RNFE
Meerut 260 275 275 300 274 300 308 300 300 300
Varanasi 214 214 258 285 224 208 198 200 272 300
Total 235 240 266 300 245 275 255 290 263 300
Low RNFE
Kannauj 269 290 193 190 275 300 188 190 274 300
Gonda 269 280 273 280 282 300 268 280 286 320
Total 269 290 250 280 280 300 242 263 289 300
All districts 252 275 260 290 262 300 250 280 281 300
Source: Primary Survey, 2012

88
7.5 Land Size and RNFE
We hypothesise that persons with small land base will have greater involvement in non-
agricultural activities as compared to those with larger landholdings. Table 7.8 shows the
distribution of RNFE workers by the size of land owned by family. The table reveals that 38
percent of the RNFE workers were landless and 52 percent had less than 2.5 acres of land.
Hardly 10 percent of the RNFE workers had more than 2.5 acres of land. The relationship was
also observed for different types of RNFE workers. Thus, nearly all the non-agricultural
labourers came from landless households or households owning less than 2.5 acres of land.
However, about 10 percent of self-employed workers in non-agriculture were having land in
excess of 2.5 acres. In case of services, about 25 percent workers came from this category.
Hardly, 15 percent of landless were in services. Thus, excess to land enables medium and large
farmers to start non-farm activities and it increases their opportunity to get into services because
of better level of education.
Table 7.8: Distribution of RNFE Workers by Size of Landholdings (percent)
Districts Size of land holding (in acre)
Total Land less Upto 2.5 2.5 to 5 5 to 10
10 &
above
Members involved in Non Agriculture Labour
High RNFE
district
Meerut 77.6 21.8 0.6 0.0 0.0 100.0
Varanasi 52.1 47.9 0.0 0.0 0.0 100.0
Total 64.4 35.3 0.3 0.0 0.0 100.0
Low RNFE
district
Kannauj 16.3 82.9 0.0 0.8 0.0 100.0
Gonda 40.9 58.3 0.9 0.0 0.0 100.0
Total 27.9 71.3 0.4 0.4 0.0 100.0
All district 48.7 50.8 0.4 0.2 0.0 100.0
Members Self Employed in Non-Agriculture
High RNFE
district
Meerut 64.5 32.6 1.4 0.0 1.4 100.0
Varanasi 48.7 43.0 3.8 1.3 3.2 100.0
Total 56.1 38.2 2.7 0.7 2.4 100.0
Low RNFE
districts
Kannauj 18.3 65.0 13.3 3.3 0.0 100.0
Gonda 38.2 52.9 5.1 1.5 2.2 100.0
Total 28.9 58.6 9.0 2.3 1.2 100.0
All district s 43.5 47.6 5.6 1.4 1.8 100.0
Salaried Persons
High RNFE
districts
Meerut 19.4 60.2 10.2 7.4 2.8 100.0
Varanasi 14.1 56.5 25.0 1.1 3.3 100.0
Total 17.0 58.5 17.0 4.5 3.0 100.0
Low RNFE
districts
Kannauj 11.1 66.7 15.3 4.2 2.8 100.0
Gonda 13.5 59.5 13.5 9.9 3.6 100.0

89
Total 12.6 62.3 14.2 7.7 3.3 100.0
All district 14.9 60.3 15.7 6.0 3.1 100.0
Total RNFE Workers
High RNFE
districts
Meerut 57.5 35.8 3.5 2.0 1.2 100.0
Varanasi 42.4 48.0 7.0 0.7 1.9 100.0
Total 49.8 42.0 5.3 1.3 1.6 100.0
Low RNFE
districts
Kannauj 15.9 72.6 8.4 2.5 0.6 100.0
Gonda 31.5 56.6 6.4 3.6 1.9 100.0
Total 24.2 64.1 7.3 3.1 1.3 100.0
All districts 38.1 52.1 6.2 2.1 1.5 100.0 Source: Primary Survey, 2012
7.6 Earnings in Agriculture and Non-Agricultural Sectors
It is hypothesised that wages and earnings are higher in rural non-farm activities as compared to
that in agricultural sector. Information on income of agricultural households was not collected
during the survey. Hence, it is not possible to directly compare the income per worker in
agriculture and non-agriculture. However, some inference can be made on the basis of other
available information. A recent study of farmers income in UP conducted by the Giri Institute of
Development Studies showed that income per workers from all the sources (agricultural and non-
agricultural) in farm households amounted to Rs. 50,318 in 2010-11. As against to this the
average income per workers for non-agricultural labour and self-employed in non-agriculture in
the present study comes to Rs. 30,573 and 35,373 (Table 7.9). Thus, it is evident that the non-
farm workers are generally employed in the low paid informal sector activities. Hence, the
distress hypothesis with respect to the rural diversification seems to be working in case of UP.
Thus, the hypothesis of higher earnings per worker in non-farm sector as compared to farm
sector is not supported by our study. Only in the case of services it is found that the level of
earning per person is substantially higher than in agriculture or other non-farm activities.
Table 7.9: Per Worker Annual Earning in Agriculture and Non-Agricultural Sectors (Rs.)
Sector High RNFE Districts Low RNFE Districts All
Districts Meerut Varanasi Total Kannauj Gonda Total
Non-Agricultural
Labour 42725 29354 35812 22902 24463 23638 30573
Self Employed in
Non-Agriculture 38577 29140 33540 12711 59357 37492 35373
Service 109879 107456 108764 47751 133450 99732 104449 Source: Primary Survey, 2012
7.7 Age and RNFE Employment
Age profile of RNFE workers is younger as compared to the agricultural workers. 21.4 percent
of the RNFE workers were below 24 years in age as compared to 12.6 percent of the agricultural
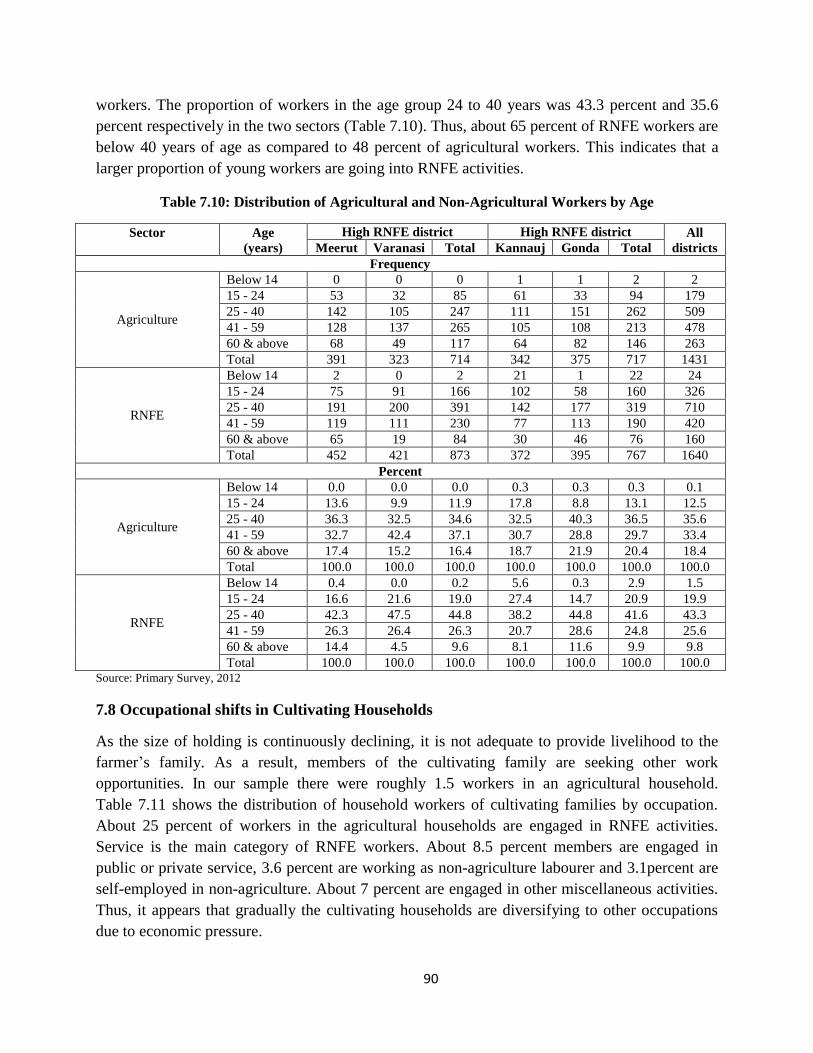
90
workers. The proportion of workers in the age group 24 to 40 years was 43.3 percent and 35.6
percent respectively in the two sectors (Table 7.10). Thus, about 65 percent of RNFE workers are
below 40 years of age as compared to 48 percent of agricultural workers. This indicates that a
larger proportion of young workers are going into RNFE activities.
Table 7.10: Distribution of Agricultural and Non-Agricultural Workers by Age
Sector
Age
(years)
High RNFE district High RNFE district All
districts Meerut Varanasi Total Kannauj Gonda Total
Frequency
Agriculture
Below 14 0 0 0 1 1 2 2
15 - 24 53 32 85 61 33 94 179
25 - 40 142 105 247 111 151 262 509
41 - 59 128 137 265 105 108 213 478
60 & above 68 49 117 64 82 146 263
Total 391 323 714 342 375 717 1431
RNFE
Below 14 2 0 2 21 1 22 24
15 - 24 75 91 166 102 58 160 326
25 - 40 191 200 391 142 177 319 710
41 - 59 119 111 230 77 113 190 420
60 & above 65 19 84 30 46 76 160
Total 452 421 873 372 395 767 1640
Percent
Agriculture
Below 14 0.0 0.0 0.0 0.3 0.3 0.3 0.1
15 - 24 13.6 9.9 11.9 17.8 8.8 13.1 12.5
25 - 40 36.3 32.5 34.6 32.5 40.3 36.5 35.6
41 - 59 32.7 42.4 37.1 30.7 28.8 29.7 33.4
60 & above 17.4 15.2 16.4 18.7 21.9 20.4 18.4
Total 100.0 100.0 100.0 100.0 100.0 100.0 100.0
RNFE
Below 14 0.4 0.0 0.2 5.6 0.3 2.9 1.5
15 - 24 16.6 21.6 19.0 27.4 14.7 20.9 19.9
25 - 40 42.3 47.5 44.8 38.2 44.8 41.6 43.3
41 - 59 26.3 26.4 26.3 20.7 28.6 24.8 25.6
60 & above 14.4 4.5 9.6 8.1 11.6 9.9 9.8
Total 100.0 100.0 100.0 100.0 100.0 100.0 100.0 Source: Primary Survey, 2012
7.8 Occupational shifts in Cultivating Households
As the size of holding is continuously declining, it is not adequate to provide livelihood to the
farmer’s family. As a result, members of the cultivating family are seeking other work
opportunities. In our sample there were roughly 1.5 workers in an agricultural household.
Table 7.11 shows the distribution of household workers of cultivating families by occupation.
About 25 percent of workers in the agricultural households are engaged in RNFE activities.
Service is the main category of RNFE workers. About 8.5 percent members are engaged in
public or private service, 3.6 percent are working as non-agriculture labourer and 3.1percent are
self-employed in non-agriculture. About 7 percent are engaged in other miscellaneous activities.
Thus, it appears that gradually the cultivating households are diversifying to other occupations
due to economic pressure.

91
Table 7.11: Distribution of Workers in Agricultural Household by Main Occupation
Main Occupation
High RNFE Districts Low RNFE Districts All
Districts Meerut Varanasi Total Kannuaj Gonda Total
Frequency
Cultivation 298 248 546 282 285 567 1113
Animal Husbandry 23 1 24 1 8 9 33
Agriculture Labour 4 4 8 4 1 5 13
Non-agriculture labour 15 22 37 6 10 16 53
Self employed in non-
agriculture 6 22 28 7 11 18 46
Government Service 5 4 9 10 6 16 25
Private Service 43 20 63 10 28 38 101
Others 35 3 38 37 27 64 102
Total 429 324 753 357 376 733 1486
Percent
Cultivation 69.5 76.5 72.5 79.0 75.8 77.4 74.9
Animal Husbandry 5.4 0.3 3.2 0.3 2.1 1.2 2.2
Agriculture Labour 0.9 1.2 1.1 1.1 0.3 0.7 0.9
Non-agriculture labour 3.5 6.8 4.9 1.7 2.7 2.2 3.6
Self employed in non-
agriculture 1.4 6.8 3.7 2.0 2.9 2.5 3.1
Government Service 1.2 1.2 1.2 2.8 1.6 2.2 1.7
Private Service 10.0 6.2 8.4 2.8 7.4 5.2 6.8
Others 8.2 0.9 5.0 10.4 7.2 8.7 6.9
Total 100.0 100.0 100.0 100.0 100.0 100.0 100.0
Source: Primary Survey, 2012
7.9 RNFE and Distance from Town
Urbanisation has been mentioned by scholars as an important factor in promoting RNFE.
Generally, it is believed that villages located near towns will have a higher proportion of workers
in RNFE. This hypothesis is not supported by our data as not clear cut relation between distance
and RNFE proportion is observed (Table 7.12). Thus, in Meerut the highest proportion of RNFE
was in villages within 5 km. In Varanasi, villages within 5-1 km. had a higher proportion of
RNFE workers. In Kannuj, the highest proportion of RNFE worker was observed in remote
villages, though in Gondathe highest proportion was in the villages located near the town.
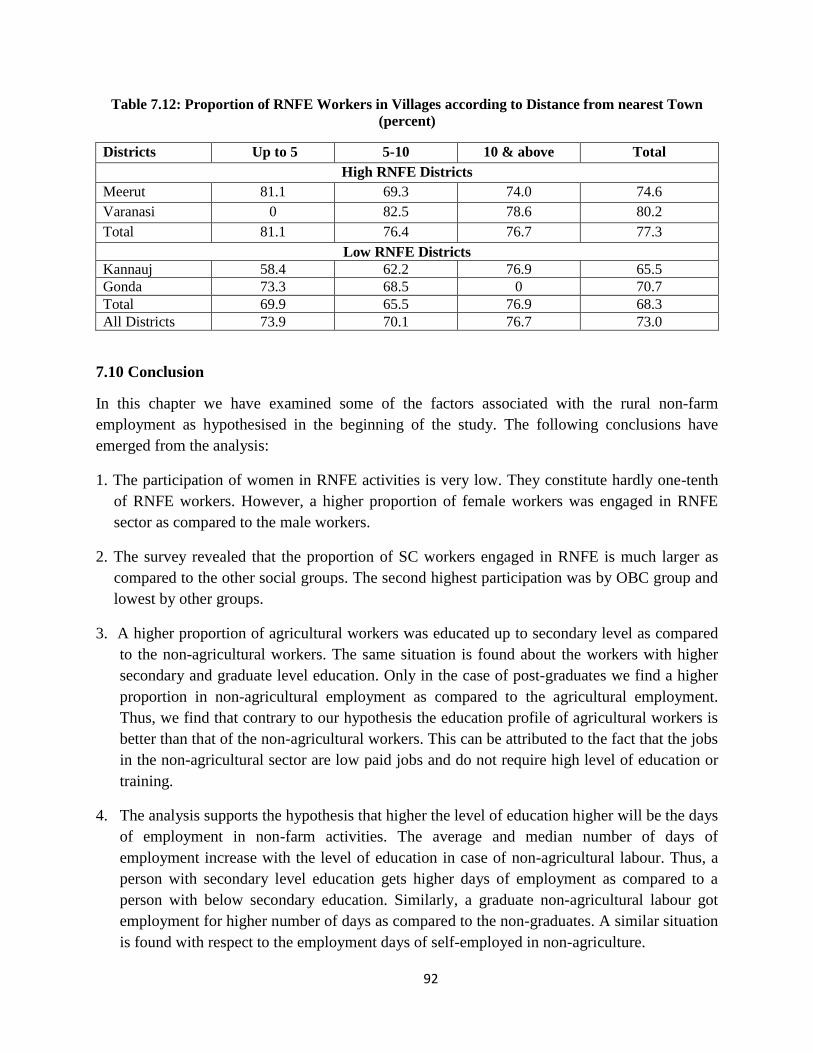
92
Table 7.12: Proportion of RNFE Workers in Villages according to Distance from nearest Town
(percent)
Districts Up to 5 5-10 10 & above Total
High RNFE Districts
Meerut 81.1 69.3 74.0 74.6
Varanasi 0 82.5 78.6 80.2
Total 81.1 76.4 76.7 77.3
Low RNFE Districts
Kannauj 58.4 62.2 76.9 65.5
Gonda 73.3 68.5 0 70.7
Total 69.9 65.5 76.9 68.3
All Districts 73.9 70.1 76.7 73.0
7.10 Conclusion
In this chapter we have examined some of the factors associated with the rural non-farm
employment as hypothesised in the beginning of the study. The following conclusions have
emerged from the analysis:
1. The participation of women in RNFE activities is very low. They constitute hardly one-tenth
of RNFE workers. However, a higher proportion of female workers was engaged in RNFE
sector as compared to the male workers.
2. The survey revealed that the proportion of SC workers engaged in RNFE is much larger as
compared to the other social groups. The second highest participation was by OBC group and
lowest by other groups.
3. A higher proportion of agricultural workers was educated up to secondary level as compared
to the non-agricultural workers. The same situation is found about the workers with higher
secondary and graduate level education. Only in the case of post-graduates we find a higher
proportion in non-agricultural employment as compared to the agricultural employment.
Thus, we find that contrary to our hypothesis the education profile of agricultural workers is
better than that of the non-agricultural workers. This can be attributed to the fact that the jobs
in the non-agricultural sector are low paid jobs and do not require high level of education or
training.
4. The analysis supports the hypothesis that higher the level of education higher will be the days
of employment in non-farm activities. The average and median number of days of
employment increase with the level of education in case of non-agricultural labour. Thus, a
person with secondary level education gets higher days of employment as compared to a
person with below secondary education. Similarly, a graduate non-agricultural labour got
employment for higher number of days as compared to the non-graduates. A similar situation
is found with respect to the employment days of self-employed in non-agriculture.

93
5. As hypothesised larger proportion of landless persons and persons with small landholdings
were found to be involved in non-agricultural activities as compared to those with larger
landholdings. Around 38 percent of the RNFE workers were landless and 52 percent had less
than 2.5 acres of land. Hardly 10percent of the RNFE workers had more than 2.5 acres of
land. The relationship was also observed for different types of RNFE workers.
6. Income per workers for non-agricultural labour and self-employed in non-agriculture was
found to be Rs. 30,573 and Rs. 35,373 respectively as compared to the average income of a
farm household of Rs. 50,300. Thus, it is evident that the non-farm workers are generally
employed in the low paid informal sector activities. Hence, the distress hypothesis with
respect to rural diversification seems to be working in case of UP. Only in the case of
services it is found that the level of earning per person is substantially higher than in
agriculture or other non-farm activities.
7. Age profile of RNFE workers was found to be younger as compared to agricultural workers.
About 65 percent of RNFE workers are below 40 years of age as compared to 48 percent of
agricultural workers. This indicates that a larger proportion of young workers are going into
RNFE activities.
8. As the size of holding is continuously declining, it is not adequate to provide livelihood to the
farmer’s family. As a result, the members of cultivating family are seeking other work
opportunities. In our sample about 25 percent of workers in the agricultural households were
found to be engaged in RNFE activities. Service is the main category of RNFE workers.
Thus, it appears that gradually the cultivating households are diversifying to other
occupations due to economic pressure.
9. Urbanisation has been mentioned by scholars as an important factor in promoting RNFE.
Generally, it is believed that villages located near towns will have a higher proportion of
workers in RNFE. This hypothesis is not supported by our data as not clear cut relation
between distance and RNFE proportion is observed.

94
CHAPTER VIII
Findings based on Focus Group Discussions
Focus Group Discussions (FGD) were held with stakeholders in all the four districts, where
survey was done. In each focus group discussion around 30 stakeholders participated including
local entrepreneurs, industry officers and knowledgeable persons of the area along with the
research team of Giri Institute of Development Studies and Institute of Applied Manpower
Research (IAMR). The main findings emerging from the FGDs are discussed in this chapter.
8.1 FGD at Meerut
Meerut district falling in the Western region of the state is a relatively developed district.
Meerut is an agriculturally advanced district of Uttar Pradesh. The main crops of the district are
sugarcane, wheat, rice, gram and pulses. This district is also famous for the manufacturing of
sports goods. A number of small scale units are engaged, both in rural and urban areas, in
making cricket bats and balls, badminton rackets, shuttle cocks, foot balls and carom boards. For
the manufacturing these sports items wood is available in the rural areas of the district. Iron and
Scissor manufacturing units are also working in the rural part of the district.
The FGD was organized at Meerut on 18th
April, 2012. A total number of 25 persons participated
in the FGD including officials from district industries centre, khadi village industries, industrial
training institute and non-government organization’s representatives, unit holders, industrialists
and members of trade associations, rural entrepreneurs, teachers and village pradhans. Dr. R.C.
Tyagi attended the discussion on behalf of the Giri Institute of Development Studies, Lucknow
and Dr. Rashmi Agrawal and Dr. Shachi Joshi attended on behalf of the Institute of Applied
Manpower Research, Government of India, New Delhi.
Dr.Vinod Kumar, General Manager, DIC informed that agriculture and agro-based industries are
the main economic activities of the district. Seven sugar mills, six khandsari units and around
100 cane crushers for the production of gur are working in the district. Most of these units are
located in rural areas. Mr. Charan Singh, Asst. Manager, DIC told that there is a great scope of
alcohol based industry as plenty of Sheera is available in the district 240 items can be produced
from sheera, these units can be installed in rural areas with low investment. He also suggested
that agro based units’ like bee farming, vermiculture, achar-murabba units, rice mills, potato
chips making units, sports goods manufacturing units can be installed at a low cost in the rural
areas of the district and can increase the employment opportunities in rural areas.
Mr. A. K. Srivastava of DIC emphasized that there is a great scope for the development of dairy
in the rural part of the district. The dairy department should provide loans to the farmers for the
development of this industry at rural level. Mr. J. S. Nagar informed that two Government
Industrial Training Institutes (GITI) and seven private Industrial Training Institutes (ITI) are
working in the district. The young generation living in rural areas is much interested to work in
urban parts of the district. Urbanization, modernization and technological improvements are the

95
main factors those attracting young generation towards urban parts of the district and are much
interested to get a white collar job in urban areas. They are taking interest in computer operating
courses as after learning computer operations they may get employment in private business
centres, Shops and malls etc. Government should open computer training centres to train youth.
Mr. Tribhuvan Patel of DIC informed that the Industrial training cum Production Centre has
been closed and suggested that it should be restarted by the government. Few NGOs are working
in the district; they should also come forward in this direction. There is a great problem of
finances for installation of a new small scale industry unit especially in the rural areas private
financiers charge very high rate of interest. Mr. Patel emphasized that the government should
provide loan at a low rate of interest and tax incentives to the young entrepreneurs who would set
up SSI units in rural areas. The skilled female workers of sports manufacturing goods of rural
areas are getting employment in the rural areas as they prefer to work from home. Male members
of the family take the raw material for sports goods from the city and after the work is finishing
by the female members of the rural areas they come to the city for the sale of the finished goods.
Mr. M. S. Pawar and Mr. R. A. Goel informed that in Kashi village of Meerut Block, 40 per cent
of the households are engaged in Chandi-Ka-Wark manufacturing which is an edible item and is
used to decorate sweets and fruits. More than 1,000 people of Kashi village are engaged in this
work. With the expertise of making Chandi-Ka-Wark this business requires finance for
purchasing the raw material. They recommended that banks should provide loan for the raw
material.
Mr. Sajid, a young entrepreneur, running embroidery centre informed that embroidery training
work centre is going to start shortly under the cluster scheme of the government, with an amount
of Rs. 7 crore, which has been approved by the government.
Mr. Ram Kishan Agrawal, President of U. P. Chamber of Commerce and owner of Hans
Engineering Works said that there is a great scope of agricultural implements manufacturing
units in the rural part of the district which would be able to generate employment in rural areas.
To start a new agricultural implements manufacturing unit, training is required.
He recommended that the industrial training programme be run through government training
centre in the district; otherwise it is difficult to start any industry by the new entrepreneurs.
Mr. Agrawal added that private industries can provide this training to the newcomers but they
will not take any interest unless government provides some incentives to training provider units
such as Tax incentive, etc. Dr. R. C. Tyagi enquired from Dr. Vinod Kumar, G.M., DIC that why
DIC is not playing any role in providing expert advice and training to these new entrepreneurs as
it was one of the prime functions of the DIC. Mr.Vinod Kumar replied that DIC is not providing
any training due to lack of funds.
The discussion identified a number of rural and agro industries which have a good potential in
the district. These include: sports goods like cricket bats and balls, badminton rackets, shuttle
cocks, foot balls and carom boards; Iron Scissor manufacturing units; alcohol based industries;

96
agro based units like bee farming, vermiculture, achar-murabba units, rice mills, potato chips
making units; Dairy and milk processing units; agricultural implements manufacturing units; and
embroidery.
Among the support systems, emphasis was put on the following measures:
(i) Provision of credit at reasonable rate of interest.
(ii) Technical training institutes should be strengthened, private training providers should be
given financial and tax incentives, DIC should take responsibility of providing technical
training for industries, rural youth should be provided training in computers to increase
their employment potential.
8.2 FGD at Varanasi
The FGD was on 10th
May, 2012 in Varanasi. Total 28 persons participated in the FGD including
officials from different industrial departments i.e. DIC and KVC, representatives of NGOs, unit
holders, industrialists and members of Trade Associations, rural entrepreneurs, teachers and
gram pradhans. Dr. R.C. Tyagi attended the discussion on behalf of the Giri Institute of
Development Studies, Lucknow and Dr. P. K. Saxena attended on behalf of the Institute of
Applied Manpower Research, Govt. of India, New Delhi.
Varanasi is situated in the eastern plain region of Uttar Pradesh. This district is densely populated
with 2,063 persons per square km as against the state average of 689 persons per square km.
The majority of the population is primarily agrarian. The major crops grown in the district are
wheat, paddy and pulses. Fruits like mango, guava, aonla and vegetables like ladies finger and
capsicum are the other crops grown in the district. Varanasi produces large quantities of langra
mangoes, which is a popular variety developed in the area. Banarsipaan (betel leaf) is famous for
its taste. This district is famous for its silk saries and brassware. Fine silk and brocaded fabrics,
exquisite saris, brassware, jewellery, woodcraft, carpets, wall hangings, lamp shades and masks
of Hindu and Buddhist deities are some of the Varanasi’s local products.
During the discussion Mr. S. B. Singh, Asst. Manager, DIC informed that agriculture and agro
based industries are the main economic activities of the district. Shri Shiromani Tiwari, General
Secretary, Industry Association, narrated the problems of farmers and entrepreneurs in the
district. Mr. Tiwari said that the condition of farmers in the district is bad and the condition of
the small scale industrial units is also deteriorating day by day. Small and marginal farmers
dominate Varanasi district and majority of them have the landholding of less than 1 hectare in
size, which is not viable for proper agriculture. Further, the land size is going on reducing due to
the fragmentation. On the other hand, the condition of the industrial sector is also badly suffering
due to poor power supply both in the rural and urban areas of the district. Agriculture and
industrial sector are not in the position to generate employment opportunities. Government

97
should take steps to improve the power situation so that the industrial units can work properly
and new units can come into existence.
Mr. P. L. Maurya, Asst. Manager, DIC informed that cottage industry, trade and services have
traditionally been contributing the economy of the district. Silk sarees, electric fan
manufacturing, fruit preservation, small wooden toy making are traditional industries of the
district. Most of these activities are in a state of decline due to the competition of similar
products at much cheaper rates.
Syed Hasan Ansari, General Secretary, (EUPEA) a local NGO, suggested that animal husbandry
sector is having a great scope in the district. He added that it also generates employment
opportunities and supplementary income to the rural masses comprising small, marginal farmers
and agricultural labourers. It not only provides full employment to thousands of rural peoples but
also produces food of immense nutritional importance. Mr. S. B. Singh supported this and said
that dairy forms a strong support and employment base to the rural and urban population of the
district, and is the most important economic activity next to agriculture sector. There is a great
scope for the development of dairy in the rural part of the district. The dairy department and
banks should provide loan to the farmers for the development of this industry in rural areas. He
assured that the development of dairy industry will certainly improve the employment situation
in the rural areas of the district. Mr. Singh also suggested sericulture and vermiculture scheme
for the district.
Mr. I.K. Kothari highlighted the problems of the carpet industry. The carpet manufacturing units
are mostly located in the rural areas of the district and providing employment in the rural areas
but these units are facing the problem of raw material that is wool, which comes from other
districts and some time from other states. It increases the cost of production of final product.
He suggested that wool industry should also develop in Varanasi district particularly in rural
area. He quoted the example of Rajasthan wool industry. He argued that if wool industry can
work in Rajasthan then why not this industry can work in UP.
Mr. Deepak Kothari, an entrepreneur, highlighted the problem of silk saree manufacturers.
He said that the main problem of this industry is of raw material that is silk. Although, this is one
of the main industry of the district which provides employment to thousands of male and female
workers both in the urban and rural areas suffering due to the problem of raw material and
shortage of power supply, which is very uncertain in the district. Resham Uddyog is required in
this district. Farming of sahtoot for the production of silk is required particularly in the rural
areas. Resham Board is here in Varanasi district but not working at all, it should be revitalized.
It was pointed out that most of the cold storage units are closing down due to the shortage of
power supply in the district. These cold stores are the requirement of the farmers to hold their
agricultural produce, especially potato and tomato. These cold stores will provide jobs to the
rural mass, he added. Government should improve the power supply for the district as most of
98
the industrial units are suffering due to power shortage. Other entrepreneurs suggested that due
to the high production of tomato and guavas, processing is required to be developed in the area.
The main findings based on the FGD are summarised below:
Agro based units’ like bee farming, vermiculture, rice mills, flour mills can be installed at a
low cost in the rural parts of the district to increase the employment opportunities in rural
areas.
There is a great scope for the dairy industry in the rural part of the district, liberal loan
facility to support the sector should also be given.
Badohi near the district is an important centre of carpet weaving. But there is a shortage of
wool which is imported from outside. Wool industry should be promoted in the district.
There is a good scope of electric fan manufacturing units, fruit processing and preservation
centers, small wooden toy making units, potato chips making units and tomato processing
units in the rural areas of the district. Banks should come forward in providing loans to
these small scale units.
Silk sarees weaving is an important industry of the district. However, the basic raw
material is imported from the other states. Hence, efforts should be made to produce silk
locally. Farming of sahtoot for the production of silk should be encouraged in the district.
Resham Board of Varanasi district should be revitalized.
Cold stores are the requirement of the farmers to keep their produce, especially potato and
tomato.
Power is a critical bottleneck for the industrial sector. Steps should be undertaken to
improve the power situation in the district.
8.3 FGD at Kannauj
An FGD was on 16 April, 2012 in Kannauj. A total number of 33 persons participated in the
FGD. Participants included officials from different industrial departments i.e. DIC, KVIB, ITI,
Fragrance & Flavour Development Centre, NGO representatives, unit holders, industrialists and
members of Itra Association, rural entrepreneurs, teachers and gram pradhans. Dr. R.C. Tyagi
attended the discussion on behalf of the Giri Institute of Development Studies, Lucknow and
Dr. G.P. Joshi and Dr. Sanjay Kumar attended on behalf of the Institute of Applied Manpower
Research, Government of India, New Delhi.
The main crops of the district are wheat, rice and potato. During the discussion Mr. Surendra
Chandra, G.M. of DIC informed that due to the high production of potato crop, 95 cold storages
are working in the district. Each cold store is providing seasonal employment to 15 to 20
persons. Mr. Pawan Trivedi, the member of the trade association informed that in spite of the
high production of potato, not even a single processing unit of potato is working in the district.
There is a great scope of potato processing industry in the district. Some entrepreneurs informed
that the quality of potato grown in the district is not suitable for making chips and potato

99
processing. The potatoes grown in the area are small in size and have high content of moisture in
it, which is not suitable for the potato processing. They suggested that high quality of potato seed
should be provided to the farmers.
Mr. Ranjan Bajpai, a member of perfume association mentioned that perfume manufacturing is
one of the most profitable businesses of the district but it needs a high quality of specialization.
During the course of perfume making if a particular specialized worker is not available, the
whole process will stop. In this situation they cannot provide job to the new workers. Due to the
requirement of highly skilled workers in the perfume making units, these units are not generating
job opportunities on the required scale. Mr. Bajpai also informed that more than 80 percent of the
perfume produce in the district goes to pan-masala units located at Kanpur and other districts.
Remaining perfume is packed in bottles for the aromatic purposes either in the form of liquid or
in the form of spray.
Mr. Anurag Dwivedi and Mr. Manish Srivastava, who are running computer training centres in
the district, informed that most of their students are from rural parts of the district. Both the girls
and the boys are taking interest in computer courses and getting jobs after completing computer
courses. The use of computer is increasing both in private and government sector. Both the
employed and unemployed candidates are getting training in their training centres.
Mr. Shakti Vinay Shukla, Director of Fragrance & Flavour Development Center, Kannauj
informed that this centre was set-up in the year 1991 by the Government of India with the
assistance of United Nations Development Programme and Govt. of UP. The main objective of
the centre is to serve, sustain and upgrade the status of farmers and industry in the aromatic
cultivation and its processing so as to make them competitive both in local and global market.
This centre is also working as a laboratory for the farmers to assess the quantity and value of
their aromatic cultivation. Mr. Shukla added that there is a great scope of agarbatti units in this
district both in the rural and in urban areas at small and large scale. These units are labour
intensive and capable of generating good employment in rural areas.
In the group the discussion entrepreneurs felt that the Value Added Tax (VAT) at 12.5 percent
on the production of Gulukand is crippling the industry. This high rate of VAT adversely affects
their business. They informed that no financial institution except Banksis is working in Kannauj
district. Uttar Pradesh Financial Corporation is also winding up their office from the district on
account of non-viability. No NGO is working in programmes of skill formation and employment
generation in rural areas. Although SHGs have been formed, yet at ground level they are not
functional.
The main suggestions of the FGD are summarised below:
There is a great scope of potato processing industry in the district. It will not only be a
profitable business but will also provide a sizable amount of employment to the rural areas.

100
High quality of potato-seed suitable for processing should be provided to the farmers
through the government seed centers.
A government training center should provide training to youth in the art of making
perfume as highly skilled workers are required in the perfume making units.
Programme for computer training should be promoted in the district to fulfil the
requirement of computer trained candidates in the industry. It will certainly increase the
employment opportunities in the district.
There is a great scope of agarbatti units both in rural and in urban parts of the district.
The agarbatti manufacturing unit can be started by new entrepreneurs in the area as it
require less amount of capital and generate more employment opportunities in the area.
Financial support is required in the district to help new entrepreneurs to set up or to
upgrade small scale units.
NGOs should come forward to motivate and train new entrepreneurs for starting new units
in the district, particularly in the rural areas.
Efforts for capacity building of SHGs should be made to make them functioned.
Some testing laboratories should be set up for the aromatic processing units.
District Industry Center (DIC) should also come forward to motivate and train the new
entrepreneurs in starting new units in the district particularly in rural areas.
8.4 FGD at Gonda
An FGD was organized in the office of G.M, DIC on 7th
May, 2012 in Gonda. In all, 27 persons
participated in FGD including officials from different industrial departments i.e. DIC, KVC, ITI,
representatives of NGOs, unit holders, industrialists and members of trade association, rural
entrepreneurs, teachers and gram pradhans. Dr. R.C. Tyagi attended the discussion on behalf of
the Giri Institute of Development Studies, Lucknow.
The economy of Gonda district is heavily dependent on agriculture. The main crops of the
district are sugarcane, wheat, rice, oil seed, potato and pulses. There are several rice mills, Sugar
mills and other small industries and handicraft industries in the district. One unit of Indian
Telephone Industries is situated at Mankapur in the district. There are six sugar mills in the
districts. The Kundarkhi sugar mill located in the district is the largest sugar mill in India.
Gonda is included in the list of 250 most backward districts of the country. It is one of the 34
districts in Uttar Pradesh currently receiving funds from the Backward Regions Grant Fund
(BRGF).
Mr. Hira Chand, G.M., DIC informed that agriculture and agro-based industries are the main
economic activities of the district. Sugar mills, khandsari units and crushers are working in the
district for the production of crystal sugar and gur. Most of these units are located in rural areas.
Mr. S. N. Dwivedi Asst. Manager, DIC told that there is a great scope of alcohol based industry
in the district. Mr. Dwivedi, informed that a lot of sheera is available here and can be utilized for
the purpose different items which can be produced from sheera and these units can be installed in
101
rural areas with low investment. He also suggested that agro based units like bee farming,
vermiculture, rice mills, flour mills, oil mills can be installed at a low cost in the rural areas of
the district to increase employment opportunities in rural areas.
Mr. V. K. Verma, Asst. Manager, of DIC emphasized that there is a great scope for the
development of dairy in the rural parts of the district. Loans should be provided to the farmers
for the development of this industry. Mr. S. N. Singh informed that two government Industrial
Training Institutes (ITIs) and a few private Industrial Training Institutes are running in the
district. The young generation living in rural areas is much interested to work in urban parts of
the district. Urbanization, modernization and technological improvements are the main factors
attracting young generation towards urban areas. They are taking interest in computer operating
courses as after learning computer operations they may get employment in private business
centers, shops, hotels, etc. Mr. S. N. Dwivedi emphasized that government should open at least
one computer training centers to train them so that candidates would be able to get training from
a government centre.
During the discussion Mr. Hira Chand, G.M, DIC informed that there is a big requirement of
cold storage, especially in the rural part of the Gonda district. Most of the cold stores are closing
down due to the shortage of power supply in the district. The cold stores are required to hold
agricultural produce, especially potato. Simultaneously, the cold stores will provide jobs to the
rural masses he added. Government should improve the power supply in the district as most of
the industrial units are the sufferer of power shortage and are badly affected.
The production of paddy crop in Gonda district is fairly good and almost every village is having
one rice mill. The scope of opening of new rice mills is still there. Mr. Gajendra Singh, Block
Development Officer said that the production of maize crop is high in the district and there is a
big scope of maize processing units in the rural parts of the district. Mr. Singh advised that banks
should come forward in providing loans to the small scale units. He also advocated installing
flour mills, rice mills and potato chips making units in the rural areas of the district.
The G.M., DIC informed that Prime Minister and Chief Minister Rojgar Yojana (PMRY and
CMRY) are running in the district and around 150 small scale units are covered under these
schemes. Gonda is categorized as one of the socially and educationally backward districts of
Uttar Pradesh. The Government of India has created a special scheme for such district through
the backward region grant fund. All government and private ITIs are there in the district. He also
informed that Udyog Bandhu is working under the supervision of Commissioner and District
Magistrate of the Gonda. It is a good forum for solving the problems of small scale units. The
Udyog Bandhu solves all problems related to raw material, allotment of plot for manufacturing
units, finance related problems and electric power related problems by organizing monthly
meeting on every third Wednesday of the month.
During the discussion, Mr. Shiv Kishor, one of the entrepreneurs highlighted the scope of
vermin-compose units, which can be installed in rural areas with low investment. He also said
102
that there is a great scope of carpentry work such as wooden furniture making units, wooden
items for kitchen and wooden decorative pieces, etc. due to the availability of good quality of
wood in the district.
Mr. R. S. Pandey of DIC forced on the fact that government should launch a scheme to promote
self-employment particularly for the youth of the rural areas. Loan should be provided to the
entrepreneurs who are interested in installing crushers as sugarcane is abundant in the area.
The gur manufacturing units can also be installed in the rural areas of the district.
The entrepreneurs complained regarding the poor infrastructural facilities like roads and
electricity in Gonda district, which are creating hindrance in the process of industrial
development. To create employment opportunities in rural areas of the district, they feel that
there should be a special package of power supply in the industrial area as well in rural areas, so
that new entrepreneurs would be able to start their small scale units which will increase
employment opportunities.
Dr. R. C. Tyagi enquired from Mr. Hira Chand, G.M., DIC that why DIC is not playing any role
in providing expert advice and training to these new entrepreneurs as it was one of the prime
functions of the DIC. Mr. Hira Chand replied that the role of DIC is reducing due to lack of
funds for providing training.
On the basis of the FGD following recommendations have been drawn to improve RNFE
opportunities in the district:
Units of alcohol based industry can be installed in rural areas which require low investment
and are labour intensive.
Agro based units like bee farming, vermiculture, rice mills, flour mills, oil mills can be
installed at a low cost in the rural parts of the district which will increase employment
opportunities in rural areas.
There is a great scope for the dairy in the rural part of the district. Loans should be provided
to the farmers for the development of this industry. Dairy industry will certainly improve the
employment and self-employment opportunities in the rural areas of the district.
Government computer training centre is required in the district to train students in computer
operations so that trained candidates would be able to get employment.
The scope of opening of new rice mill in the rural part is there which will generate
employment in the rural areas.
The production of maize crop is high in the district and there is a fair scope of installation of
maize processing units in the rural parts of the district.
There is a fair scope of flour mills, rice mills and potato chips making units in the rural areas
of the district. Banks should come forward in providing loans to these small scale units.
Cold stores should be set up for keeping agricultural produce, especially potato.
To generate employment opportunities in rural areas of the district, there should be a special
package of power supply in the industrial area as well as in rural areas so that new

103
entrepreneurs would be able to start their small scale units, which will increase employment
opportunities.
8.5 Main Conclusions
The main points emerging from the FGDs held in the four study districts are summarized below:
(i) Industrial Base
Of the four districts surveyed, Meerut and Varanasi are relatively more advanced and have high
RNFE, while Kannauj and Gonda are relatively backward districts with low RNFE. However, all
the districts have a industrial base and specialise in the production of some products as shown
below:
Meerut: sugar industry, sports goods, iron scissors, silver foil
Varanasi: silk sarees and brocade, wooden toys, wooden toys
Kannauj: Perfume
Gonda: Sugar industry, rice mills
(ii) Industrial Potential
Participants highlighted that each of the districts has potential for developing industries based on
local resources to generate employment.
All the four districts for being agricultural districts have a good potential for the development of
agro processing units like flour mills, rice mills, dal mills, oil crushers, etc. Cold storages can be
set up in all these districts to preserve agricultural produce and generate employment. Dairying
was mentioned in all the four districts as an important activity to be promoted for generating
employment.
Apart from these common industries each district has a potential for specialised production of
certain products. For instances, Meerut and Gonda have a number of sugar mills. They have a
good potential of setting up industries based on the bye-product of sugarcane like alcohol and
bag gass. Wood based industries can also be promoted in the district. Kannauj is an important
producer of potato and has potential for setting up potato processing units. Agarbatti units can
also be set up in the district. Gonda has potential for maize processing units. In Varanasi,
production of silk and wool can be promoted as there is a great demand for these products in the
districts.
(iii) Constraints on Industrial Development
The main constraint on industrial development mentioned in all the districts was shortage of
power which is badly affect the existing units and preventing setting up of new units.
Inadequate credit facilities were also mentioned as a problem in setting up new units.

104
Rural roads were also mentioned as a constraint in Gonda district.
Shortage of skilled manpower was mentioned as an important constraint in all the four districts.
It was also felt that the District Industries Centres are not playing the expected role in the
promotion of industries through training and other programmes.
(iv) Strategy for Promoting Non-Farm Employment
The main suggestions which emerged from the FGD for promoting industrial activity and
generating employment in the rural areas are summarised below:
Measures should be taken to ensure regular power supply, especially in the industrial areas.
Liberal credit facility at reasonable rates should be provided to the entrepreneurs willing to
set up new units and for promoting activities like dairying.
Training programmes in skills suitable for the area should be started both by the
government and the private sector.
Computer training centres should be established to train rural youth.
Supply of required raw material for local industries should be ensured. Production of
required raw material within district should be encouraged.
For agro-processing units production of varieties suitable for processing should be
promoted.
The District Industries Centres (DIC) should be strengthened to promote industry through
training and other programmes.
The district level udyog bandhu should be made effective to remove problems of local
industrial units.

105
CHAPTER IX
Main Findings and Suggestions
Diversification of the rural economy is regarded as an essential component of rural
transformation. An expanding non-farm sector contributes to the higher rural incomes by
providing additional opportunities for employment and income opportunities in the rural areas.
It also helps in raising income levels of the remaining workers in the agricultural sector by
reducing population pressure on land as well as through its impact on the agricultural wages.
The growth of the non-agricultural sector is rightly regarded as an important element of the
strategy for alleviation of rural poverty. Rural households themselves greatly value non-farm
employment opportunities as additional or alternative sources of income and employment. It is in
this context that the present study looks into the situation of RNFE in Uttar Pradesh.
Objectives
The main objectives of the study were:
1. To map the RNFE activities in sample rural areas;
2. To assess the extent of RNFE as compared to the agricultural employment;
3. To assess the differences across caste and gender in the RNFE;
4. To assess the number of days of employment in RNFE;
5. To assess the wage income levels of various RNFE activities in the selected villages;
6. To assess the resource endowment of the households and the nature of RNFE;
7. To assess the activity status of all the women in each of the households;
8. To analyse the source of demand for rural non-farm activities and their forward and
backward linkages in the rural economy;
9. To analyse the factors which encourage employment in rural non-farm sector;
10. To analyse the constraints that inhibit the growth of rural non-farm sector.
Methodology
The study was mainly based on primary data. For the purpose of the survey we selected two
districts, each from the two major agro-climatic regions of the state, namely Upper Gangetic
Plain and Eastern Plain. The districts in the two regions were classified into two categories, i.e.
high RNFE districts and low RNFE districts. From these two categories one district each has

106
been selected on random basis from both the regions. Thus, a total of four districts have been
selected as indicated below:
1. Upper Ganges Plain
High RNFE District- Meerut
Low RNFE District – Kannauj
2. Eastern Plain
High RNFE District - Varanasi
Low RNFE District – Gonda
From each selected district we selected five villages – three villages near the town with good
connectivity and two villages from remote areas. A complete house listing was done in the
village. All the households were then divided into various groups based on principal occupation
and social groups. About 20 percent of the households in each subgroup were selected for
detailed interview subjected to a maximum of 100 households per village. Thus, a total sample
size consisted of four districts, 20 villages and 1,643 households.
An enterprise survey was also conducted in the sampled villages. Focussed group discussions
were also organized at the district headquarters in all the four districts with different stakeholders
to understand the dynamics of RNFE.
The main findings of the study are summarised below:
9.1 Growth and Structure of Rural Non-Farm Workers in UP
The number of non-agricultural rural workers in UP increased by 19.8 per cent during 1971-81.
The increase was as high as 42.9 percent during 1981-91. The 2001 Census indicates a
quickening of this trend with an increase of 57.5 percent in rural non-agricultural workers against
an increase of 35.8 percent in agricultural workers. As a result, the share of non-agricultural
workers in the total rural workers has increased from 12.9 percent in 1971 to 15.5 percent in
1991 according to the Census data and further to 26.6 percent in 2001.
The proportion of rural male workers in the non-agricultural sector to the total number of rural
male workers increased modestly, according to NSS data, till 1987-88, rising from 18.1 percent
in 1972-73 to 21.1 percent in 1987-88. Since then, the pace of rural diversification has picked up
and the proportion of rural male non-agricultural workers went up to 23.7 percent in 1993-94 and
further to 28.2 percent in 1999-2000. The proportion of rural male non-agricultural workers have
gone up to 39.1 percent in 2009-10, while the proportion of rural female non-agricultural
workers jumped from 12.5 percent in 1999-2000 to 26.3 percent in 2009-10 Significantly, the
pace of diversification of the rural workforce during the period 1987-2000 has been faster in UP
as compared to that in India as a whole.
107
Sectoral analysis revealed that the employment level in agriculture has remained virtually
stagnant between 1993 and 2010, indicating the shrinking absorptive capacity of this over-
crowded sector. The manufacturing sector had shown a steady and high growth of employment
up to 2004-05, but shows a marked decline during 2004-05 to 2009-10. The construction sector
is the most dynamic sector in the rural areas showing a double digit growth during the last
decade. Among the services sector trade & hotels and transport & communications had shown a
high growth during 1993-94 and 2004-05 but the growth rate slackened in the last five years.
Female workers constituted only 23 percent of the rural workers in 2009-10. Their share was
30percent in the agriculture and allied activities, 19 percent in manufacturing, 25 percent in other
services and 8.6 percent in trade and hotels. Overtime, the proportion of women workers shows a
decline-from 27.15 percent in 1993-94 to 23.13 in 2009-10.
There are considerable variations in the proportion of non-farm workers across districts and
regions of the state. This proportion was 27.3 percent in the western region, 21.5 percent in the
eastern region, 17.4 percent in the central region and 13.9 percent in Bundelkhand in 2001
according to Census data. The 2001 Census shows that the pace of diversification towards non-
farm activities has been much faster in the western and central regions during the period 1981
and 2001. In the other two regions, the proportion of non-agricultural workers remains more or
less the same as it was in 1981. The proportion of female workers in the non-agricultural sectors
to the total number of rural female workers is markedly higher in the western region as compared
to the other regions.
The analysis of region-wise data reveals that the dynamics of change seems to be different in
different regions. In the agriculturally dynamic western region, the process of diversification in
favour of non-agricultural activities is more closely related to the internal dynamic of the
agricultural sector. Linkages between agricultural and non-agricultural sectors appear to be
stronger in this region. In central and eastern UP, overcrowding of agriculture coupled with low
productivity is forcing workers to seek non-agricultural employment in low income generating
activities in the informal sector.
Much of the process of diversification to non-farm employment is of the distress type.
High levels of poverty are found to prevail in the RNFS of the state, particularly in the
manufacturing and construction sectors. In general, self-employed workers have lower income
levels as compared to the workers in regular paid jobs.
9.2 Background of the Surveyed Villages
Primary survey was carried out in 20 villages. The main features of the sample villages are
shown below:
108
The OBCs were the most numerous castes in the surveyed villages constituting 47.7 percent of
the households. SC households were the next dominant group with 29.3 percent share in
population. The proportion of other social groups was 22.4 percent.
86.4 percent of the population of the village belonged to Hindu households and 13.6 percent to
Muslim households.
Total literacy varied from 57.5 percent to 85 percent in the sample villages. Male literacy rates
varied from 62 percent to 90 percent, whereas the female literacy rates varied from 45 percent to
80 percent.
58 percent household owned land, while 42 percent were landless. Nearly half of the households
were small farmers with less than 5 acres of land. This proportion was 60 percent in low RNFE
districts and 38.5 percent in high RNFE districts. Less than 10 percent of the households
belonged to the category of medium (5 to 10 acres) or large farmers (above 10 acres).
Out of the 20 surveyed villages, 4 were located within 5 km of the town, while another 10 were
located within 6 to 10 km. Though in most of the cases the distance of the town was not high, but
the quality of road was not good. Only 5 out of the 20 surveyed villages were connected with
metalled roads to the Block HQ.
Most of the villages had access to different types of facilities within 10 km and in many cases
within 5 km. No marked differences in the access to facilities were observed between high and
low RNFE districts.
42 percent of the village households were engaged in rural labour and 27 percent households
were engaged in agriculture and allied activities. About 19 percent were engaged in self-
employment in non-agricultural activities and about 11 percent were employed in services.
The proportion of households in agriculture and allied activities was higher in low RNFE
districts as compared to the high RNFE districts.
Grocery shops existed in 90 percent of the villages surveyed. 75 percent had tea stall and 65
percent had repair shops. Tailors, masons and drivers were found in every village. All villages
except three also had grain miller. Carpenter and blacksmiths were reported in 75 percent of the
villages. Other types of traditional workers were less widespread. Potters were reported in all
villages in Gonda and weavers in all villages of Varanasi. About one-fourth villages reported
having goldsmith, leather workers and bamboo makers.
The number of households of handicraftsmen and skilled workers was reported to have increased
or remained static in most of the villages during the last five years. An increase was reported
particularly in the case of drivers, masons, carpenters and tailors. But, in some villages it was
reported that the number of households belonging to blacksmiths, carpenters, potters and tailors
had declined.

109
Migration was found to be low. Two villages each in Kannauj and Gonda reported immigration
of agricultural workers. Three villages in Meerut and one in Varanasi reported immigration of
non-agricultural workers. The immigration of agricultural workers was mostly for 2 to 4 months.
Immigration of non-agricultural workers in Meerut was on daily basis. Out-migration in search
of work was reported in 16 out of 20 villages. In majority of villages out-migration was mainly
for agricultural work. Mostly out-migration was for 3 to 6 months.
In majority of the villages daily wage rates for agricultural workers were reported to be less than
Rs. 100. The daily wages of non-agricultural labour were reported between Rs. 100 and 200 in
most of the villages. The number of villages reporting higher wages was more in high RNFE
districts, especially Meerut.
In half of the villages wage employment was reported as the new emerging activity for
employment. In a few villages of Varanasi and Kannauj handloom units have been opened.
Petty shops were reported from two villages of Kannauj. Thus, it looks that not many new
activities are being generated in the villages for creation of employment. Mainly people are
depending upon self-employment or wage employment.
9.3 Socio-Economic Characteristics of Sample Households
Information was collected from 1,643 households in the sample villages. The main socio-
economic characteristics of the sample households are summarised below:
22.5percent of sample households belonged to SC category, 45.8 percent were OBC and 31.2
percent others. 91.7 percent of sample households belonged to Hindu community and 8.2 to
Muslim community.
About half of the sample households reported cultivation as their main occupation. About one-
fifth were engaged in non-agricultural labour and another one-fifth were self-employed in non-
agriculture. About one-tenth were employed in public or private service.
22.7 percent of the households were landless. About 56 percent of the households had less than
2.5 acres of land and 14 percent had between 2.5 and 5.0 acres of land. Only 7 percent of the
households owned more than 5 acres of land.
18.8 percent of the household members above six years were illiterate. 24.5 had studied up to
primary level and 21.4 percent up to upper primary level. About 25 percent had education up to
secondary and higher secondary level and about 10 percent were graduates and above. Female
illiteracy was 28.6 percent against male illiteracy of 10.1 percent.
Only 1.6 percent of the persons above six years of age had acquired professional training. Out of
the 160 persons who had acquired some professional training, 136 were males and only 24 were
females. Out of the total persons reporting technical education, 7.5 percent had BE or B.Tech
degree, 3.1 percent had done course at polytechnic and 13.8 percent were ITI trained. 5.6 percent

110
were medical graduates. The largest majority belonged to those who had done some other
professional course. 5 percent reported having received informal training.
Average value of assets per household was about Rs. 40 lakh in Meerut and Varanasi. It was
much lower at Rs. 19.9 lakh in Gonda and Rs. 11.7 lakh in Kannauj. Land accounted for over
90percent of value of assets in the four districts. The value of non-land assets varied from only
Rs. 1.0 lakh in Kannauj to Rs. 3.07 lakh in Meerut. Agricultural machinery is the most important
productive asset other than land. Livestock and transport equipment are the other important
categories of assets.
9.4 Dynamics of RNFE
On the basis of the survey of the sample households following features of RNFE sector were
brought to highlight:
41.9 percent of workers in the sample households were employed in cultivation. 3.1percent were
engaged in agricultural labour and 18.5 percent in non-agriculture labour. Another 18 percent
were self-employed in non-agricultural activities. 4.7 percent were employed in public services
and 7.8 percent in private services. In all the districts surveyed, we find that now non-agricultural
sector provides employment to more than half of the rural workers.
There has been a gradual shift in workers away from the agricultural sector during the past
decade. Agriculture and animal husbandry employed 58.2 percent of the workers ten years ago.
This proportion declined to 48.1 percent five years ago and presently stands at 43.5 percent.
The proportion of agricultural labourers has remained stable at around 3 percent during the
decade. Thus, the share of agricultural workers on the whole has declined from 61.3percent ten
years ago to 46.4 percent now.
The growth of total workers was 19 percent in both the five year sub-periods. The number of
workers in animal husbandry shows a high growth. The number of cultivators declined during
2002-07 but increased by 7.2 percent during 2007-12. Agricultural labourers grew by about 24
percent in both the sub-periods. Non-agricultural labourers also show a high growth during the
decade. Private services and self-employed in non-agriculture are the fastest growing sectors in
the rural areas.
The main reasons reported for the occupational shifts were small size of landholdings and search
for new employment opportunity. Low income in agriculture also propelled shift to other sectors.
The role of government schemes was nominal. About 5 percent of the workers went in for higher
education.
More than half of the non-agricultural labourers were employed in the construction activity.
Very few non-agricultural labourers were employed in manufacturing, trade and hotel and
restaurants.

111
About 32 percent of the workers in non-agricultural labour found employment within the village
and 62 percent found work within the district. Very few labourers in all the four districts went
outside the district to find work.
It was found that non-agricultural labour does not provide work throughout the year. Only about
43 percent of the persons reportedly got employment as non-agricultural labour from 6 to 12
months. Nearly the same proportion reported getting work for 3 to 6 months, while 12.5 percent
worked as non-agricultural labour for less than three months. About three-fourths of the workers
reported working for 8 hours and above and the remaining one-fourth worked from 4 to 8 hours
per day. Almost all the non-agriculture labourers were working as casual workers.
The study of mode of wage payment revealed that over 90 non-agricultural labourers were paid
wages on daily basis, while 1.2 percent got wages on monthly basis. 7.6 percent reported
working on piece rate basis. Average annual earning of non-agricultural labour was reported at
Rs.30,573. The highest earning was reported in the case of manufacturing, followed by
construction. Considerable variations in annual earnings were also found among districts within
the same sector. The earning levels are higher for OBC and other castes as compared to ST and
SC group.
SENAg workers account for about one-fifth of the total workers and two-fifths of non-
agricultural workers. Wholesale and retail trade is the most import SENAg activity, followed by
manufacturing and services. Self-employed workers in manufacturing basically work from their
home in the village. In construction, trade and service about two third self employed workers get
employment in the village itself. Those engaged in transport activities operate mostly from
outside the village. Nearly all the self-employed workers are working within the district.
Average annual earning per self-employed person was estimated at Rs.35,373 for all sample
households. It varied from Rs. 12,711 in Kannauj to 59,357 in Gonda districts. Average earnings
were highest in the case of service sector, followed by transport, while the lowest earnings were
reported in manufacturing.
The services are emerging as an important source of employment even in the rural areas.
They account for 12.5 percent of the total rural workers and a little less than one-fourth of RNFE
in our sample. Per person annual earnings in the services were reported at Rs. 1,04,449 for the
sample households. It was much higher in the government sector (Rs. 1,86,211) as compared to
the private sector (Rs. 55,186). Earning levels in contractual employment were found to be much
lower (Rs. 51,565) as compared to the employees in the regular employment (Rs. 1,91,930).
Looking at the quality of employment we find that in the government sector about two-thirds
employees received PF and insurance benefits and about 56percent received medical and
retirement benefit.
In our sample only 3.7 percent workers reported working under MNREGS. The proportion of
households working on MNREGs is much higher for SC and ST workers as compared to OBC

112
and Other categories. On an average a worker got 33 days of employment in a year in MNREGs.
On the whole, the contribution of MNREGs to employment generation as proportion of total
employment does not seem to be much.
Only about 7 percent of the sample households reported having migrant workers. Around three-
fourths of the migrant workers were working in other states, while about one-sixth were working
within the state in other districts. All the migrant workers were males.16 percent of migrant
workers were employed in construction sector, 8.4 percent were employed in wholesale and
retail trade and 5.8 percent in manufacturing. Largest majority was employed in miscellaneous
occupations. A large majority of migrants (871%) were sending remittance of less than
Rs. 25,000 to their families per year.
Only one-fifth of the women were engaged in paid work like self-employment in non-agriculture,
wage labour and other activities. On an average a female worker got employment for 62 days in a
year. Family labour in non-agriculture provided employment for 286 days in a year, while self-
employment in non-agriculture provided work for 187 days. Employment days as wage labourer
and other activities were much lower. Thus, it looks that women are participating in work mainly
as marginal workers. 92 percent women were reported to be working at home whether on
domestic or productive activities. It is difficult for women to work outside the village as they have
to shoulder the responsibility of household work.
9.5 Characteristics of Village Enterprises
A survey of 207 enterprises was carried out during the study. The main findings emerging from
the enterprise survey are reported below:
37percent of the total enterprises were engaged in trade, 23 percent each were manufacturing
and non-manufacturing enterprise, 13 percent were service enterprise and 4 percent belonged to
other categories.
Out of the total enterprises 46.4 percent were established before 2000 and 53.6 percent were
established thereafter.
Most of the enterprises are in the nature of micro-enterprises run by the entrepreneur himself.
There was a less than one hired employee per enterprise.
72 percent of the employees were casual and only 28 percent were regular employees. Nearly 90
percent of the employees were from the village itself.
Average monthly earning of enterprises for the entire sample came to Rs.5,318. Among different
types of enterprises, industrial enterprises had much higher earning levels as compared to trade
and services. Earnings were lowest in trade. Within the same category considerable differences
in earning levels are observed among the four districts.

113
Village enterprises are mainly catering to the local demand. About 70 percent of the enterprises
reported that they sell their products in the village itself. 10 percent sell within the district and
another 7 percent in village and district both. Only 7 percent reported selling their products
outside the district. Most of the enterprises sell their output directly to the consumers.
The most important reason for setting up the unit in the village mentioned by nearly 95 percent
unit holders was help from the family. The next important reason was saving on rent of premises.
Low investment, lack of completion and no need of labourers were also mentioned as the
advantages of establishing the unit in the village. About one-fourth respondents said they are
running the unit along with the cultivation in the village.
The most important problem reported by the enterprises was lack of credit, followed by lack of
demand. About one-fourth reported problem of lack of power supply and high input cost.
Lack of raw material and shortage of skilled labour were other important problems reported by
the enterprises.
9.6 Correlates of RNFE
The study based on primary data has revealed the following correlated of RNFE:
The participation of women in RNFE activities is very low. Women constitute hardly one-tenth
of RNFE workers. However, a higher proportion of female workers was engaged in RNFE sector
as compared to the male workers.
The survey revealed that the proportion of SC workers engaged in RNFE is much larger as
compared to the other social groups. The second highest participation was by OBC group and
lowest by the other groups.
Education level was not found correlated to RNFE. In fact, a higher proportion of agricultural
workers was educated up to secondary level as compared to the non-agricultural workers.
The same situation is found about the workers with higher secondary and graduate level
education. Only in the case of post-graduates we find a higher proportion in non-agricultural
employment as compared to agricultural employment. Thus, we find that contrary to our
hypothesis the education profile of agricultural workers is better than that of the non-agricultural
workers. This can be attributed to the fact that the jobs in the non-agricultural sector are mostly
low paid jobs and do not require high level of education or training.
The analysis supports the hypothesis that higher the level of education higher will be the days of
employment in non-farm activities. The average and median number of days of employment
increase with the level of education in the case of non-agricultural labour. Thus, a person with
secondary level education gets higher days of employment as compared to a person with below
secondary education. Similarly, a graduate non-agricultural labour got employment for higher
number of days as compared to non-graduates. A similar situation is found with respect to the
employment days of self-employed in non-agriculture.
114
As hypothesised, a larger proportion of landless persons and persons with small landholdings
were found to be involved in non-agricultural activities as compared to those with larger
landholdings. 38 percent of the RNFE workers were landless and 52 percent had less than 2.5
acres of land. Hardly 10 percent of the RNFE workers had more than 2.5 acres of land.
The relationship was also observed for different types of RNFE workers.
Income per workers for non-agricultural labour and self-employed in non-agriculture was found
to be Rs. 30,573 and Rs. 35,373 respectively as compared to the average income of a farm
household of Rs. 50,300. Thus, it is evident that the non-farm workers are generally employed in
the low paid informal sector activities. Hence, the distress hypothesis with respect to rural
diversification seems to be working in the case of UP. Only in the case of services it is found that
the level of earning per person is substantially higher than in agriculture or other non-farm
activities.
Age profile of RNFE workers was found to be younger as compared to the agricultural workers.
About 65 percent of RNFE workers are below 40 years of age as compared to 48 percent of
agricultural workers. This indicates that a larger proportion of young workers are going into
RNFE activities.
In our sample about 25 percent of workers in the agricultural households were found to be
engaged in RNFE activities. Service is the main category of RNFE workers. Thus, it appears that
gradually the cultivating households are diversifying to other occupations due to economic
pressure.
9.7 Findings Based on Focus Group Discussions
Of the four districts surveyed Meerut and Varanasi are relatively more advanced and have high
RNFE, while Kannauj and Gonda are relatively backward districts with low RNFE. However, all
the districts have an industrial base and specialise in the production of some products as shown
below:
Meerut: sugar industry, sports goods, iron scissors, silver foil
Varanasi: silk sarees and brocade, wooden toys, wooden toys
Kannauj: Perfume
Gonda: Sugar industry, rice mills
The participants highlighted that each of the district has the potential for developing industries
based on local resources to generate employment. All the four districts for being agricultural
districts have a good potential for development of agro processing units like flour mills, rice
mills, dal mills, oil crushers, etc. Cold storages can be set up in all these districts to preserve
agricultural produce and generate employment. Dairying was mentioned in all the four districts
as an important activity to be promoted for generating employment.
115
Apart from these common industries each district has potential for specialised production of
certain products. For instances, Meerut and Gonda have a number of sugar mills. They have a
good potential of setting up industries based on the bye product of sugarcane like alcohol and
bag gass. Wood based industries can also be promoted in the district. Kannauj is an important
producer of potato and has potential for setting up potato processing units. Agarbatti units can
also be set up in the district. Gonda has potential for maize processing units. In Varanasi,
production of silk and wool can be promoted as there is a great demand for these products in the
districts.
The main constraint on industrial development mentioned in all the districts was the shortage of
power which is badly affect the existing units and preventing setting up of new units. Inadequate
credit facilities were also mentioned as a problem in setting up of new units. Rural roads were
also mentioned as a constraint in Gonda district. Shortage of skilled manpower was mentioned as
an important constraint in all the four districts. It was also felt that the District Industries Centres
are not playing the expected role in the promotion of industries through training and other
programmes.
9.8 Suggestions
The capacity of the agricultural sector to absorb more labour has reached a near saturation point.
The present small size of holdings is unable to provide sustenance to a cultivating family. As a
result the members of cultivating families are searching for employment opportunities outside
agriculture. Our survey reveals that the RNFE workers now account for more than half of the
rural workers in U.P. However, majority of them is employed in traditional activities or low
income generating activities in the informal sector like shops. A large number of RNFE workers
remain below the poverty line. What is required is not only expansion of RNFE activities but
also efforts to raise the productivity and income levels o f RNF workers.
A few suggestions in this regard are given below:
Improvement of rural infrastructure is a basic pre-condition for promoting RNFE. All the
villages should be connected with all-weather roads to improve their connectivity to towns
and markets. Measures should be taken to ensure regular power supply, especially in the
industrial areas.
Financial incentives and liberal credit facility at reasonable rates should be provided to the
entrepreneurs willing to set up new units or expanding existing unit in the rural areas.
Techno-economic surveys at district level should be conducted to identify the potential
activities for development.
Rural youth should be given training in entrepreneurship development and encourage to set
up units in rural areas.
116
Training programmes in skills suitable for the area should be started by both the government
and private sector.
Computer training centres should be established to train rural youth through public private
partnership models.
Participation of women in RNFE activities should be encouraged in training courses and
other support programmes. 30 percent participation for women should be ensured.
Promotion of home based activities would also help in increasing women participation in
work.
Supply of required raw material for local industries should be ensured. Production of
required raw material within district should be encouraged.
Technological upgradation of traditional industries of the district needs to be promoted and
backward and forward linkages provided to them.
Cluster approach to develop selected industries suitable for the area should be promoted to
get the benefit of scale and congomelaration economies.
For agro-processing units production of varieties suitable for processing should be
promoted.
The District Industries Centres (DICs) should be revamped to enable them to play a
dynamic role in promoting industrial activity in the district by identifying potential
industries and conduct training programmes in skill development, marketing, etc. Private
industry and management and technical training institutions should be involved in these
programmes.
The district level udyog bandhu should be made effective to remove problems of local
industrial units.

117
Bibliography
Bhalla, Sheila (2000), “Behind Poverty: The Qualitative Deterioration of Employment Prospects
for Rural Indians”, Working Paper No. 7, Institute of Human Development, New Delhi.
Chadha, G.K. (1997), “Access of Rural Households to Non-farm Employment: Trends,
Constraints and Possibilities,” in G.K. Chadha and Alakh N. Sharma (eds.), Growth,
Employment and Poverty-Change and Continuity in Rural India,Vikas Publishing House, New
Delhi.
__________ (2001), “Impact of Economic Reforms on Rural Employment: No Smooth Sailing
Anticipated,” Indian Journal of Agricultural Economics, Vol. 56, No. 3, July-September.
Mathur, Ashok and S. Chattopadhyay (1997), “Rural Industrialisation and Its Employment
Implications,” in G.K. Chadha and Alakh N. Sharma (eds.), Growth, Employment and Poverty-
Change and Continuity in Rural India,Vikas Publishing House, New Delhi.
Papola, T.S. (1982), Rural Industrialisation: Approaches and Potential, Himalaya Publishing
House, Bombay.
___________(1987), “Rural Industrialisation and Agricultural Growth: A Case Study of India,”
in R Islam,. (ed.), Rural Industrialisation and Employment in Asia, International Labour
Organisation, Asian Employment Programme, New Delhi.
Singh, Ajit Kumar (1994), “Changes in the Structure of Rural Workforce in Uttar Pradesh: A
Temporal and Regional Study,” in Visaria, Pravin and Rakesh Basant,(eds.), Non-Agricultural
Employment in India, Sage Publications, New Delhi.
Vaidyanathan, A. (1986), “Labour Use in Rural India: A Study of Spatial and Temporal
Varations,” Economic and Political Weekly, Vol. 21, No. 52.
World Bank (2002), Poverty In India: The Challenge of Uttar Pradesh, Poverty Reduction and
Economic Management Unit, South Asian Region, Washington.

Recommended