Runoff and infiltration characteristics of permeable pavements
Review of an intensive monitoring program
Presentation Outline
Background & Objectives
Material & Methods• field measurements• lab scale experiments• finite element simulation
Results & Data Analysis• examples: measured infiltration rates• characteristics of infiltration performance
Mathematical Approach
Conclusions0
50
100
150
200
250
300
0 100 200 300 400 500 600 700 800
Background
permeable pavements
• popular and effective technique to reduce stormwater runoff
• but also: significant runoff contribution during storm events
evaluation & modelling of stormwater runoff• common models are mainly using out-dated approaches
• lack of specified and consistent runoff coefficients and parameter recommendations
• only insufficient knowledge of particular runoff performance
need of further investigations & improved modelling methods

main objectives
• analysis of runoff and infiltration performance
• focus on minor permeable pavements
• compilation and generation of a sound data base
• development of an upgraded computational approach
• recommendation of runoff coefficients
partners
• IKT – Institute of Underground Infrastructure• Ministry of the Env., North Rhine-Westphalia
Research Project
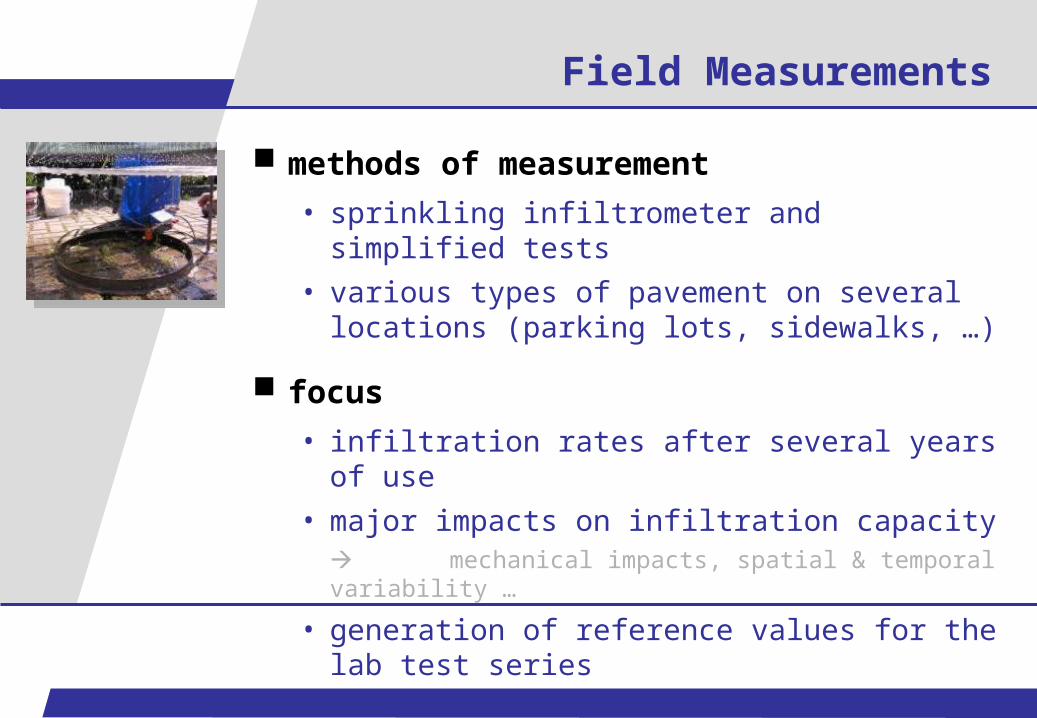
Field Measurements
methods of measurement
• sprinkling infiltrometer and simplified tests
• various types of pavement on several locations (parking lots, sidewalks, …)
focus
• infiltration rates after several years of use
• major impacts on infiltration capacity mechanical impacts, spatial & temporal variability …
• generation of reference values for the lab test series
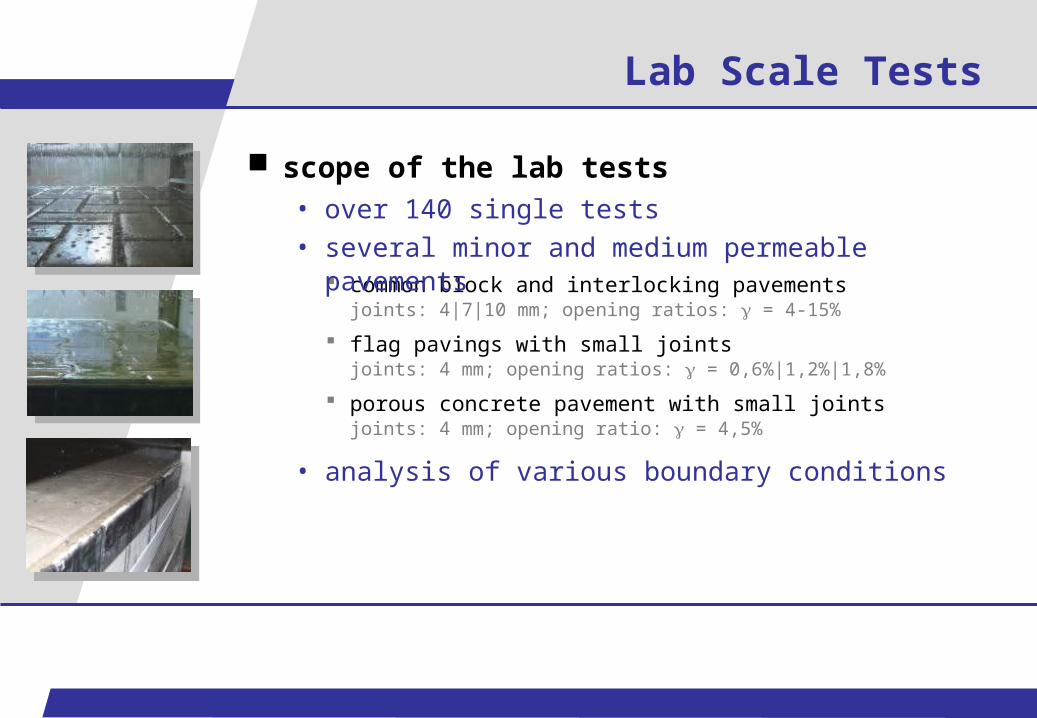
common block and interlocking pavements joints: 4|7|10 mm; opening ratios: = 4-15%
flag pavings with small jointsjoints: 4 mm; opening ratios: = 0,6%|1,2%|1,8%
porous concrete pavement with small jointsjoints: 4 mm; opening ratio: = 4,5%
Lab Scale Tests
scope of the lab tests• over 140 single tests• several minor and medium permeable pavements
• analysis of various boundary conditions
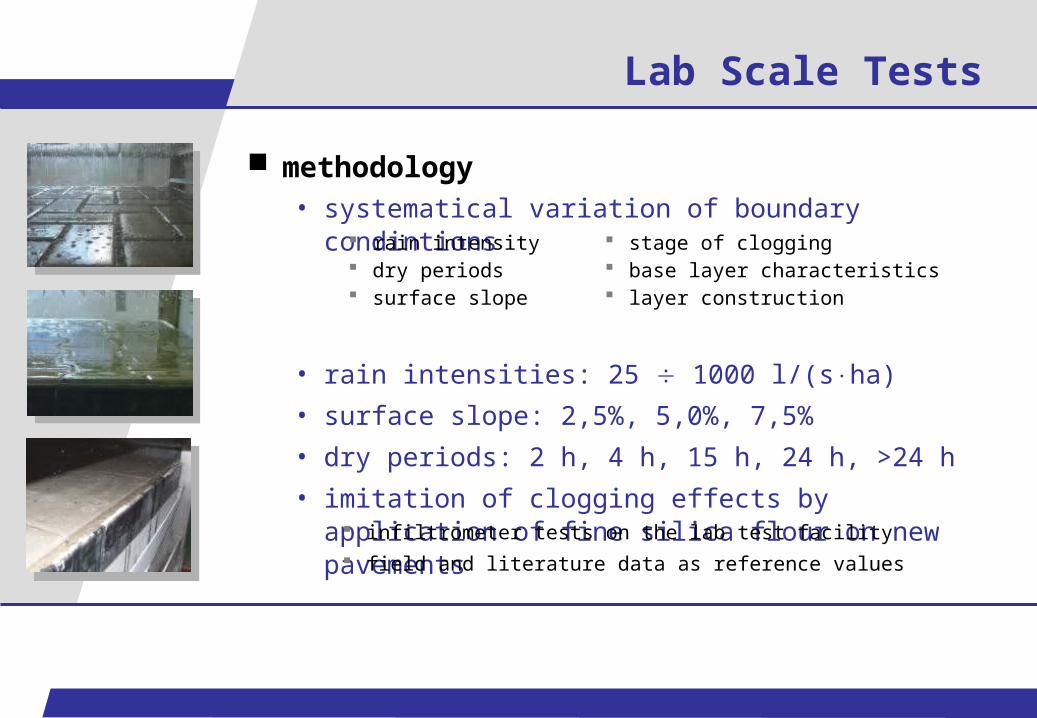
methodology• systematical variation of boundary condintions
• rain intensities: 25 1000 l/(sha)
• surface slope: 2,5%, 5,0%, 7,5%
• dry periods: 2 h, 4 h, 15 h, 24 h, >24 h
• imitation of clogging effects by application of fine silica flour on new pavements
Lab Scale Tests
rain intensity dry periods surface slope
stage of clogging base layer characteristics layer construction
infiltrometer tests on the lab test facility field and literature data as reference values
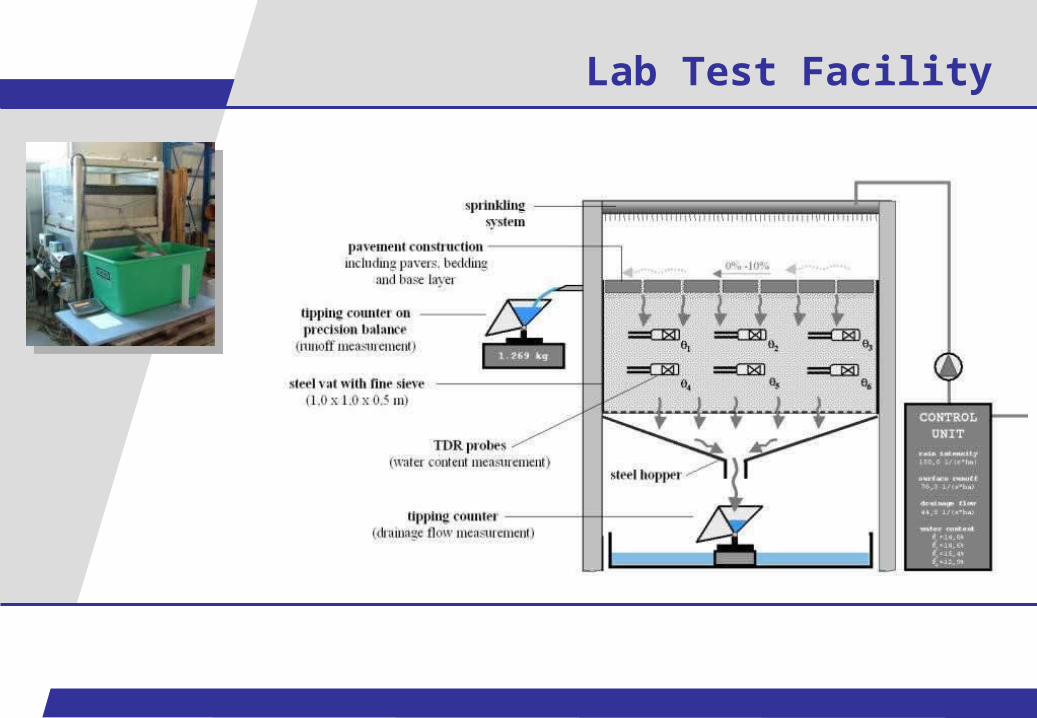
Lab Test Facility

Lab Test Facility

model application• calibration on monitoring data of lab tests
• interpretation & visualization of lab tests
• application on further scenarios additional rain intensities varying base layer and sub-base characteristics varying initial conditions (dry periods & evaporation) ...
Finite Element Simulation
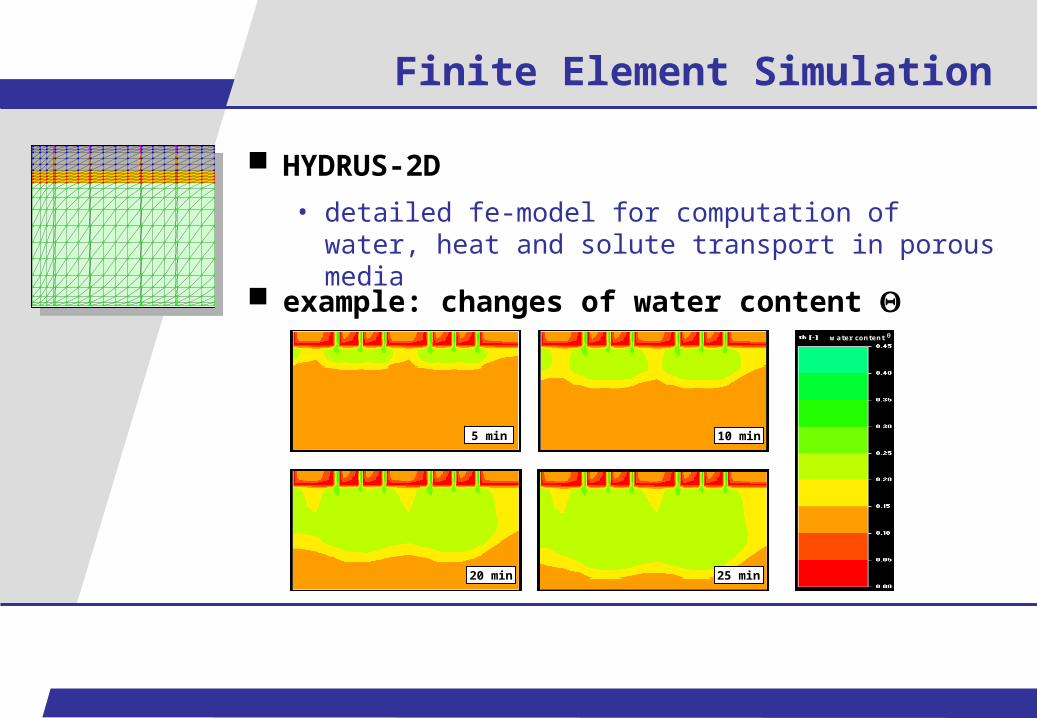
HYDRUS-2D
• detailed fe-model for computation of water, heat and solute transport in porous media
Finite Element Simulation
a
c
b
d
water content
5 min 10 min
20 min 25 min
example: changes of water content
HYDRUS-2D
• detailed fe-model for computation of water, heat and solute transport in porous media
0
20
40
60
80
100
120
140
infiltration ratesafter 10 min
infiltration ratesafter 20 min
infiltration ratesafter 30 min
final infiltrationrates
0
20
40
60
80
100
120
140
infiltration ratesafter 10 min
infiltration ratesafter 20 min
infiltration ratesafter 30 min
final infiltrationrates
Analysis Field Data
selected results of field measurements
#1: infiltration rates of 4 types of permeable pavements on 1 site (comparison)
#2: parking lot of interlocked pavement with gravel filled voids (3 monitoring points)
#3: highly frequented parking lot (interl. pavers)
#4 sparsely frequented parking lot (interl. pavers)
#5: sidewalk of block pavement
#6: sidewalk of cobblestone pavement
#7: sidewalk of flag pavement
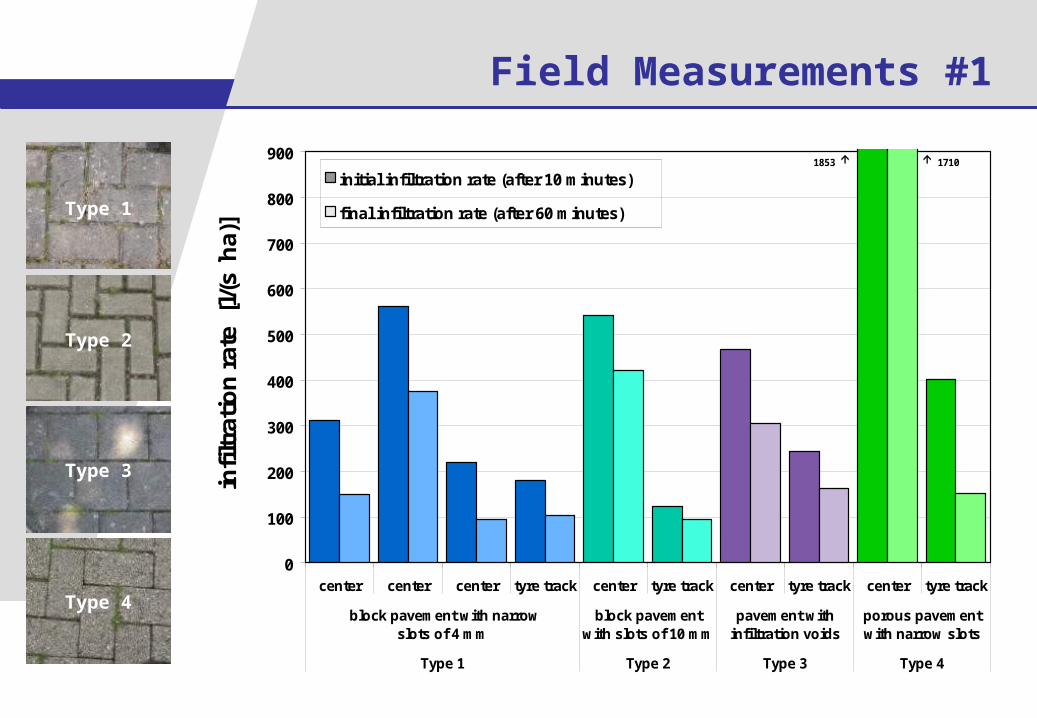
Field Measurements #1
0
100
200
300
400
500
600
700
800
900
center center center tyre track center tyre track center tyre track center tyre track
block pavement with narrow slots of 4 mm
block pavementwith slots of 10 mm
pavement withinfiltration voids
porous pavementwith narrow slots
Type 1 Type 2 Type 3 Type 4
infi
ltra
tio
n r
ate
[l/(
s h
a)]
initial infiltration rate (after 10 minutes)
final infiltration rate (after 60 minutes)
1853 1710
Type 1
Type 2
Type 3
Type 4
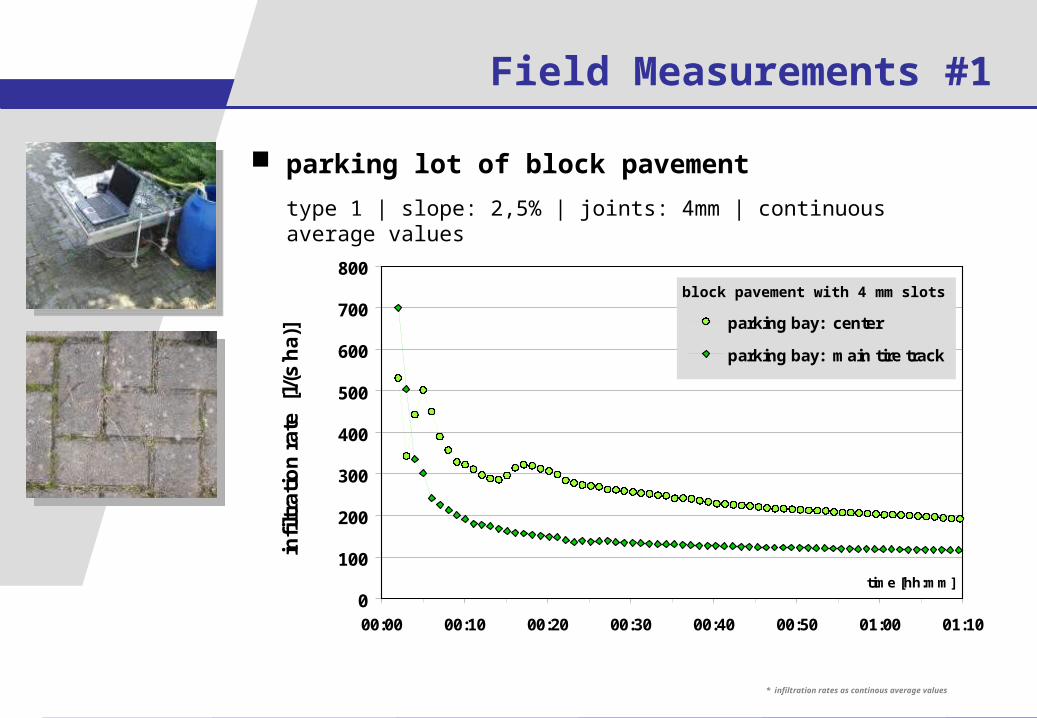
Field Measurements #1
parking lot of block pavement
type 1 | slope: 2,5% | joints: 4mm | continuous average values
0
100
200
300
400
500
600
700
800
00:00 00:10 00:20 00:30 00:40 00:50 01:00 01:10
time [hh:mm]
infi
ltra
tio
n r
ate
[l/
(s h
a)]
block pavement with narrowslots of 4 mmparking bay: center
parking bay: main tire track
block pavement with 4 mm slots
* infiltration rates as continous average values
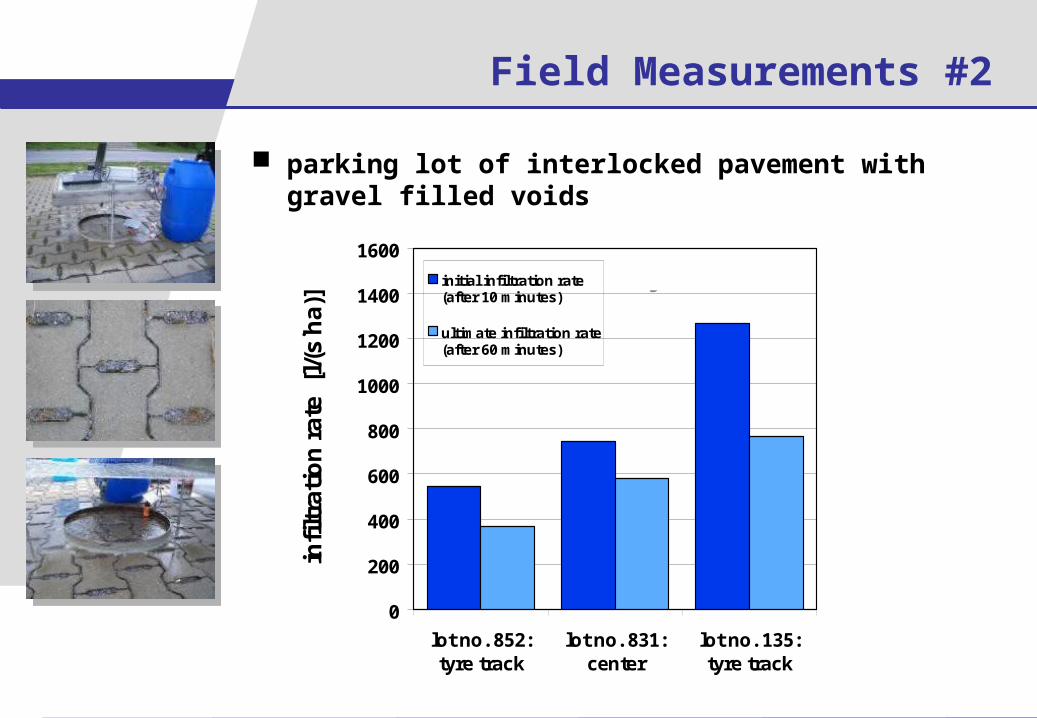
Field Measurements #2
parking lot of interlocked pavement with gravel filled voids
0
200
400
600
800
1000
1200
1400
1600
lot no. 852:tyre track
lot no. 831:center
lot no. 135:tyre track
infi
ltra
tio
n r
ate
[l/(
sh
a)]
initial infiltration rate(after 10 minutes)
ultimate infiltration rate(after 60 minutes)
pavement with gravel filled voids

Field Measurements #3
higher mechanical
impact
lower mechanicalimpact
Example of a highly frequented parking lot
• parking lot at the campus
• interlocking concrete pavement
• 18 infiltration tests
• 6 different monitoring points
• high spatial variability of infiltration capacities (site-scale)
• significant mechanical impact
• mechanical impact heavily increases clogging
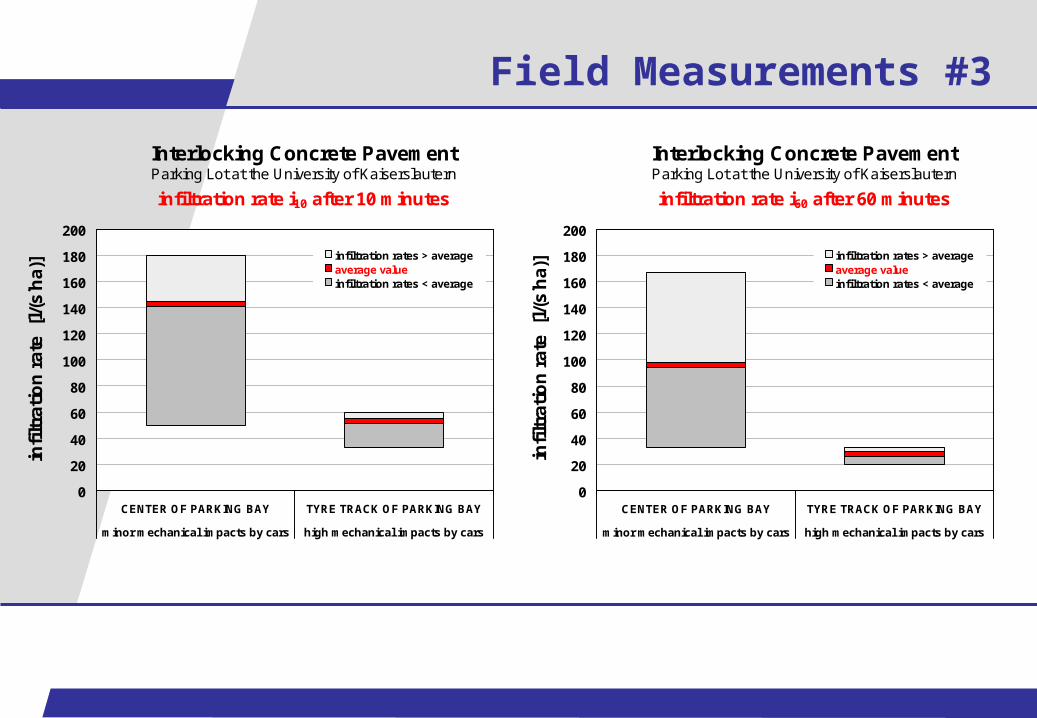
Field Measurements #3
Interlocking Concrete PavementParking Lot at the University of Kaiserslautern
infiltration rate i60 after 60 minutes
0
20
40
60
80
100
120
140
160
180
200
CENTER OF PARKING BAY TYRE TRACK OF PARKING BAY
minor mechanical impacts by cars high mechanical impacts by cars
infiltration rates > average average valueinfiltration rates < averageMinimum
0
20
40
60
80
100
120
140
160
180
200
CENTER OF PARKING BAY TYRE TRACK OF PARKING BAY
minor mechanical impacts by cars high mechanical impacts by carsin
filt
rati
on
rat
e [
l/(s
ha)
]
Interlocking Concrete PavementParking Lot at the University of Kaiserslautern
infiltration rate i10 after 10 minutes
0
20
40
60
80
100
120
140
160
180
200
CENTER OF PARKING BAY TYRE TRACK OF PARKING BAY
minor mechanical impacts by cars high mechanical impacts by cars
infiltration rates > average average valueinfiltration rates < averageMinimum
0
20
40
60
80
100
120
140
160
180
200
CENTER OF PARKING BAY TYRE TRACK OF PARKING BAY
minor mechanical impacts by cars high mechanical impacts by cars
infi
ltra
tio
n r
ate
[l/
(s h
a)]
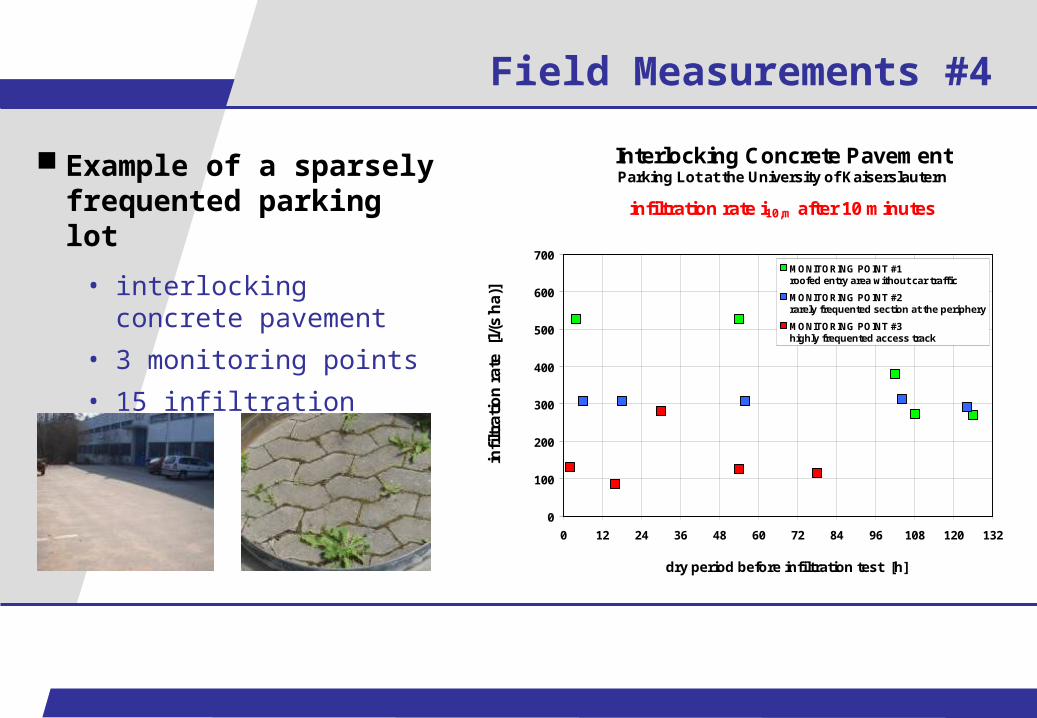
Interlocking Concrete Pavement Parking Lot at the University of Kaiserslautern
infiltration rate i10,m after 10 minutes
0
100
200
300
400
500
600
700
0 12 24 36 48 60 72 84 96 108 120 132
dry period before infiltration test [h]
infi
ltra
tio
n r
ate
[l/(
sh
a)]
MONITORING POINT #1 roofed entry area without car traffic
MONITORING POINT #2 rarely frequented section at the periphery
MONITORING POINT #3 highly frequented access track
Example of a sparsely frequented parking lot
• interlocking concrete pavement
• 3 monitoring points
• 15 infiltration tests
Field Measurements #4
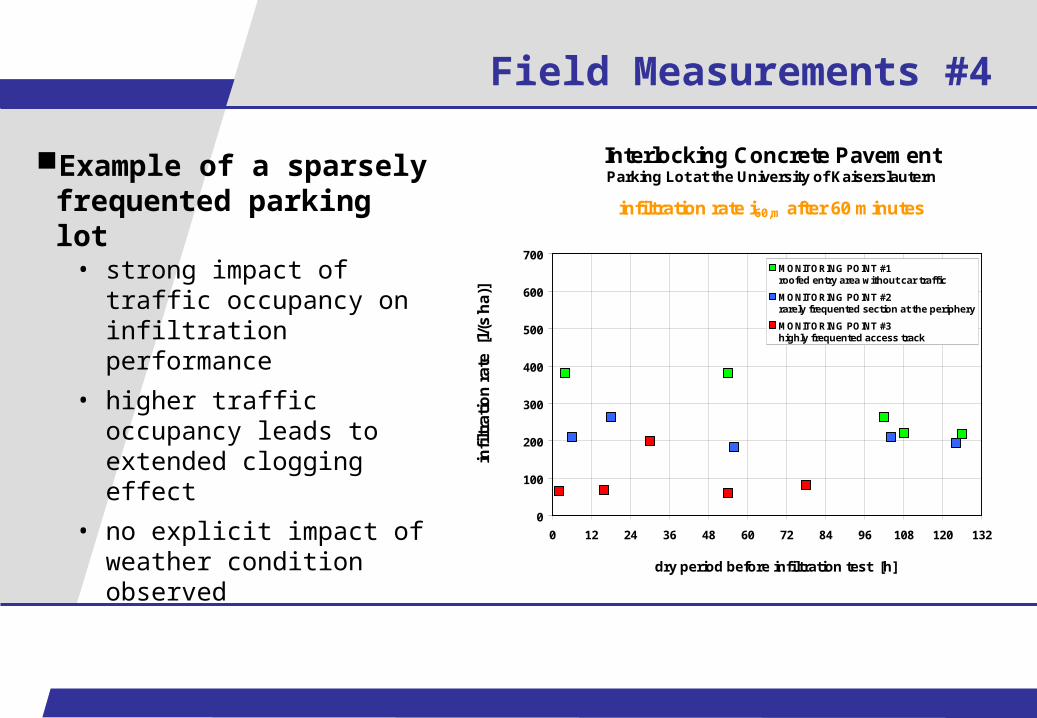
Interlocking Concrete Pavement Parking Lot at the University of Kaiserslautern
infiltration rate i10,m after 10 minutes
0
100
200
300
400
500
600
700
0 12 24 36 48 60 72 84 96 108 120 132
dry period before infiltration test [h]
infi
ltra
tio
n r
ate
[l/(
sh
a)]
MONITORING POINT #1 roofed entry area without car traffic
MONITORING POINT #2 rarely frequented section at the periphery
MONITORING POINT #3 highly frequented access track
Example of a sparsely frequented parking lot
• strong impact of traffic occupancy on infiltration performance
• higher traffic occupancy leads to extended clogging effect
• no explicit impact of weather condition observed
Field Measurements #4
Interlocking Concrete Pavement Parking Lot at the University of Kaiserslautern
infiltration rate i60,m after 60 minutes
0
100
200
300
400
500
600
700
0 12 24 36 48 60 72 84 96 108 120 132
dry period before infiltration test [h]
infi
ltra
tio
n r
ate
[l/(
sh
a)]
MONITORING POINT #1 roofed entry area without car traffic
MONITORING POINT #2 rarely frequented section at the periphery
MONITORING POINT #3 highly frequented access track

0
20
40
60
80
100
120
140
infiltration ratesafter 10 min
infiltration ratesafter 20 min
infiltration ratesafter 30 min
final infiltrationrates
infi
ltra
tio
n r
ate
[l/(
s h
a)]
infiltration rates > average
average value
infiltration rates < average
Field Measurements #5
block pavement monitored at the campus of the university (slots of ~5 mm)

0
100
200
300
400
500
600
700
infiltration ratesafter 10 min
infiltration ratesafter 20 min
infiltration ratesafter 30 min
final infiltrationrates
infi
ltra
tio
n r
ate
[l/
(s h
a)]
infiltration rates > average
average value
infiltration rates < average
Field Measurements #6
cobblestone pavement (non-uniform joints)
0
50
100
150
200
250
300
infiltration ratesafter 10 min
infiltration ratesafter 20 min
infiltration ratesafter 30 min
infiltration ratesafter 60 min
infi
ltra
tio
n r
ate
[l/
(s h
a)]
infiltration rates > average
average value
infiltration rates < average
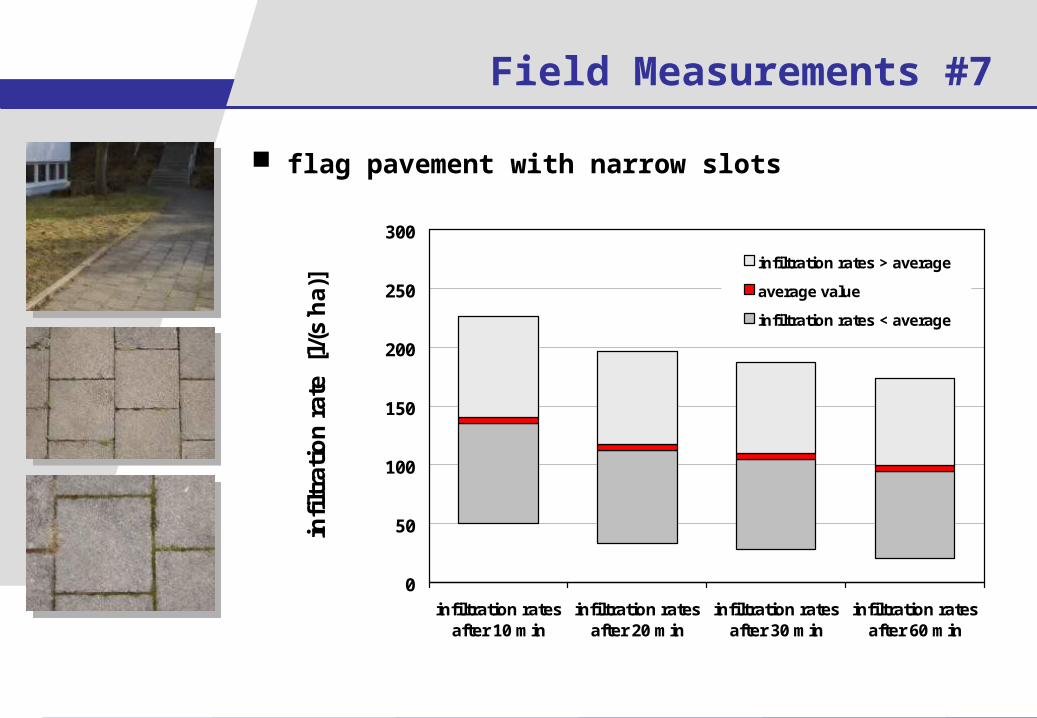
Field Measurements #7
flag pavement with narrow slots
Field Measurements
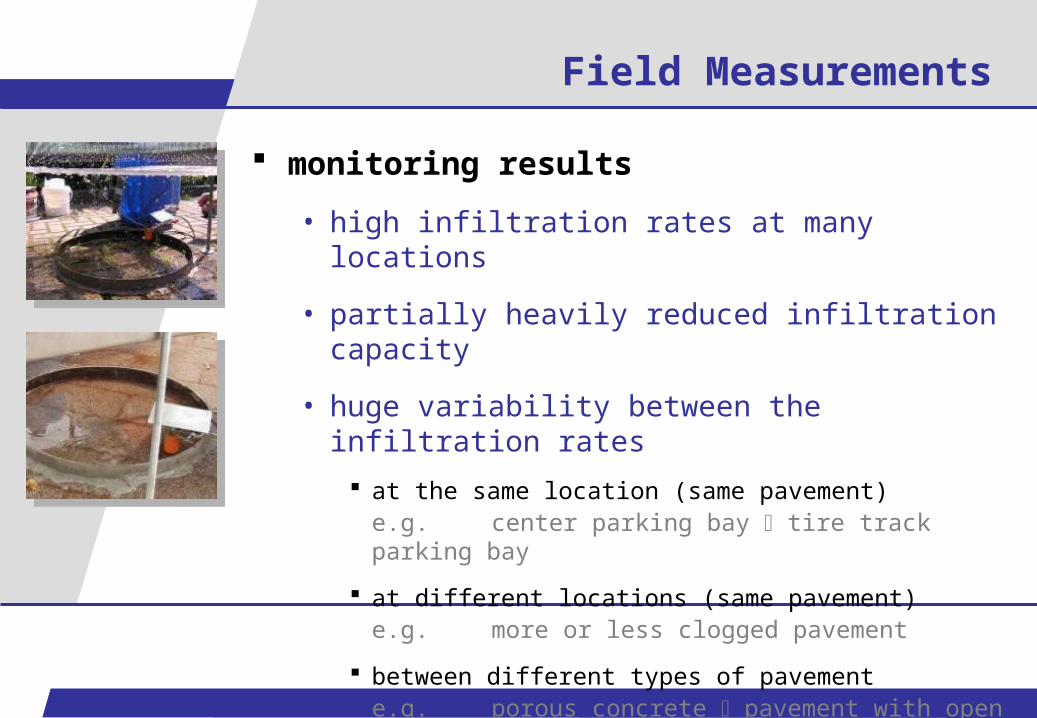
monitoring results
• high infiltration rates at many locations
• partially heavily reduced infiltration capacity
• huge variability between the infiltration rates
at the same location (same pavement)e.g. center parking bay tire track parking bay
at different locations (same pavement)e.g. more or less clogged pavement
between different types of pavement e.g. porous concrete pavement with open voids
Field Measurements
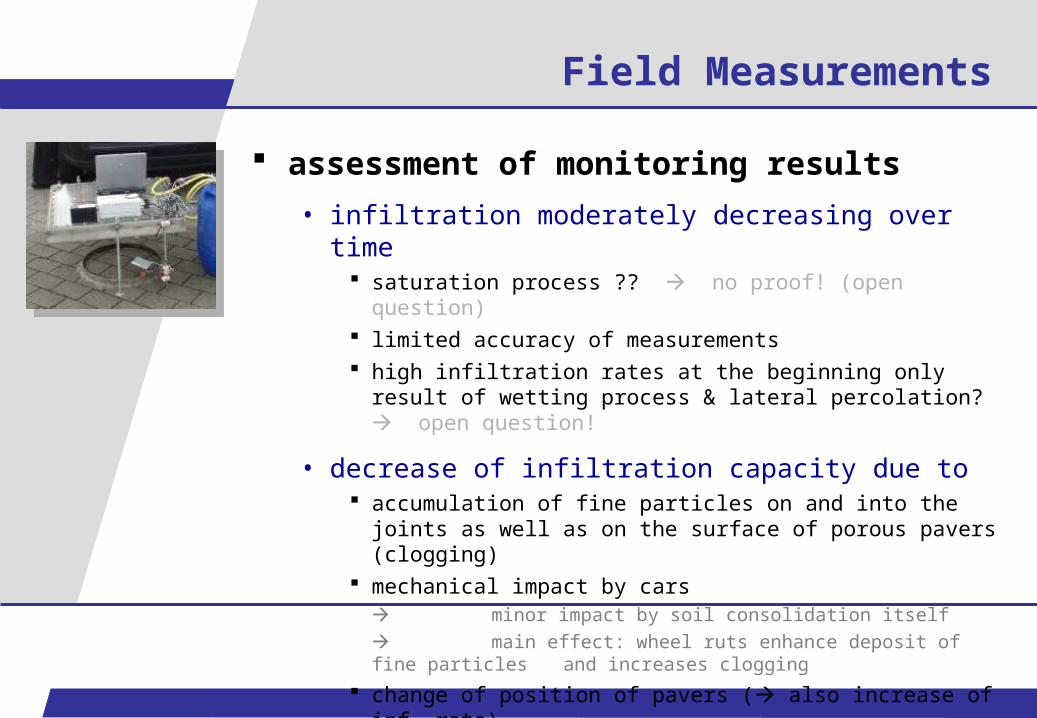
assessment of monitoring results
• infiltration moderately decreasing over time saturation process ?? no proof! (open question) limited accuracy of measurements high infiltration rates at the beginning only result of wetting
process & lateral percolation? open question!
• decrease of infiltration capacity due to accumulation of fine particles on and into the joints as well
as on the surface of porous pavers (clogging) mechanical impact by cars
minor impact by soil consolidation itself main effect: wheel ruts enhance deposit of fine particles and increases clogging
change of position of pavers ( also increase of inf. rate)

Field Measurements
assessment of monitoring results
• major impact on the infiltration capacity by joint material (particular permeability)
• no clear impact of weather condition observed dry period prior to measurements water saturation of joint and base layer material
• site-specific variability higher than climate-specific variability
• explicit infiltration capacity after several years of use not predictable ( stochastic phenomenon)
0
50
100
150
200
250
300
0 100 200 300 400 500 600 700 800
0
50
100
150
200
250
300
0 100 200 300 400 500 600 700 800
Analysis Lab Tests
tests on interlocking concrete pavement (ICP)
• analysis of correlation between infiltration rate and particular rain intensity dry period prior to rain initial water content
surface slope state of clogging
• evaluation of runoff coefficients
• regression analysis of infiltration rate as a function of rain intensity & time
as a function of cumulative rain height & time
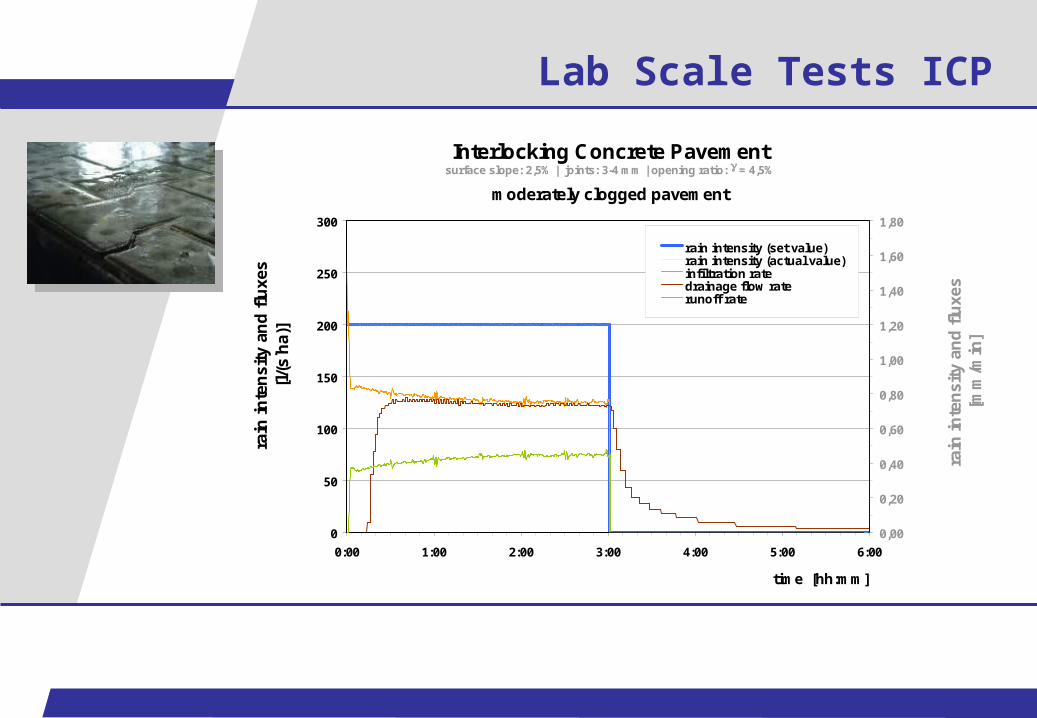
Lab Scale Tests ICP
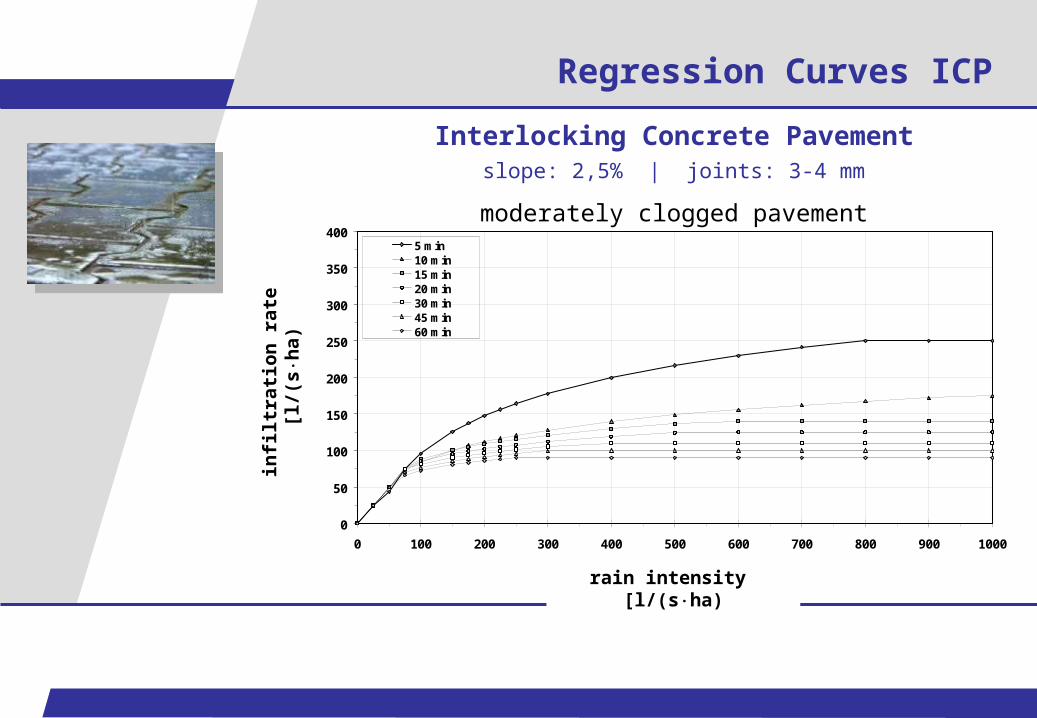
Interlocking Concrete Pavementsurface slope: 2,5% | joints: 3-4 mm | opening ratio: = 4,5%
moderately clogged pavement
0
50
100
150
200
250
300
0:00 1:00 2:00 3:00 4:00 5:00 6:00
time [hh:mm]
rain
inte
nsi
ty a
nd
flu
xes
[l/(
sh
a)]
0,00
0,20
0,40
0,60
0,80
1,00
1,20
1,40
1,60
1,80
rain
inte
nsi
ty a
nd
flu
xes
[mm
/min
]
Reihe7
rain intensity (set value)rain intensity (actual value)infiltration ratedrainage flow raterunoff rateReihe2
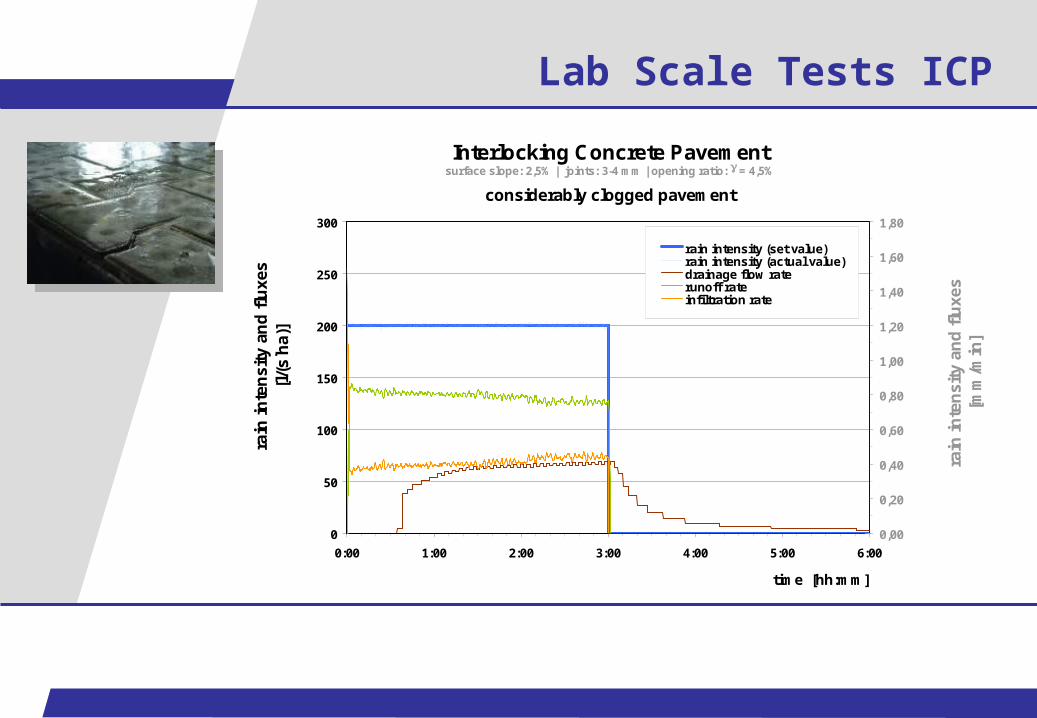
Interlocking Concrete Pavement
surface slope: 2,5% | joints: 3-4 mm | opening ratio: = 4,5%
considerably clogged pavement
0
50
100
150
200
250
300
0:00 1:00 2:00 3:00 4:00 5:00 6:00
time [hh:mm]
rain
inte
nsi
ty a
nd
flu
xes
[l/(
sh
a)]
0,00
0,20
0,40
0,60
0,80
1,00
1,20
1,40
1,60
1,80
rain
inte
nsi
ty a
nd
flu
xes
[mm
/min
]
Reihe7
rain intensity (set value)rain intensity (actual value)drainage flow raterunoff rateinfiltration rateReihe2
Lab Scale Tests ICP

impact of state of clogging & dry period?
impact of particular slope & rain intensity?
Lab Scale Tests: ICP
impact of particular rain intensity?
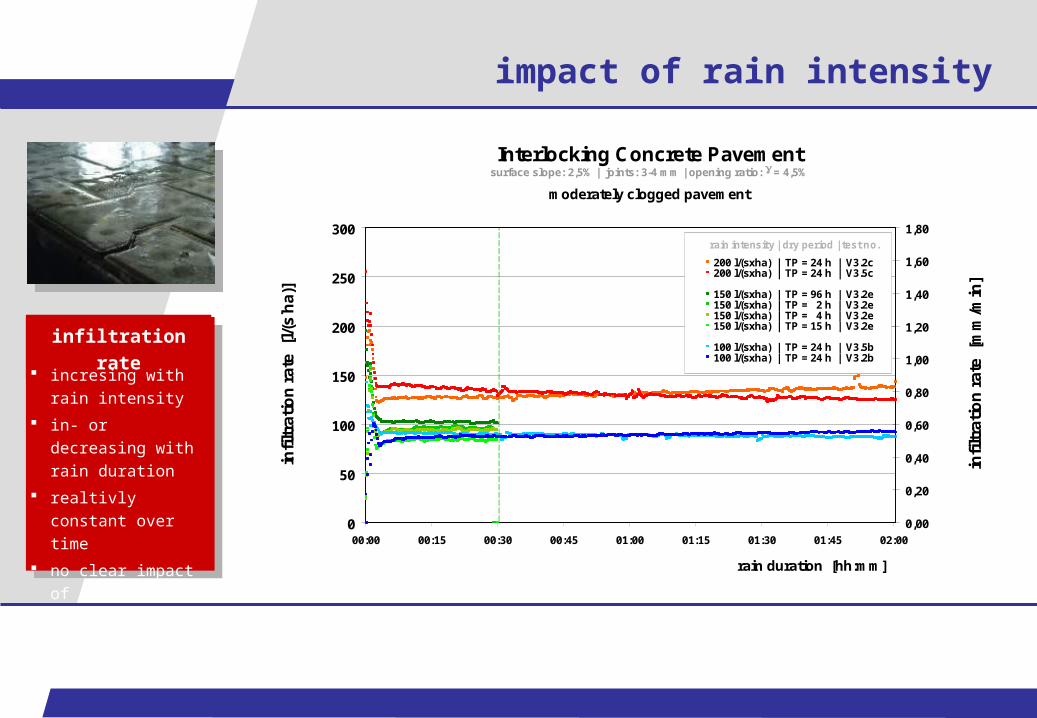
impact of rain intensity
Interlocking Concrete Pavementsurface slope: 2,5% | joints: 3-4 mm | opening ratio: = 4,5%
moderately clogged pavement
0
50
100
150
200
250
300
00:00 00:15 00:30 00:45 01:00 01:15 01:30 01:45 02:00
rain duration [hh:mm]
infi
ltra
tio
n r
ate
[l/(
sh
a)]
0,00
0,20
0,40
0,60
0,80
1,00
1,20
1,40
1,60
1,80
infi
ltra
tio
n r
ate
[m
m/m
in]
Reihe13Reihe10200 l/(sxha) | TP = 24 h | V3.2c200 l/(sxha) | TP = 24 h | V3.5cReihe12150 l/(sxha) | TP = 96 h | V3.2e150 l/(sxha) | TP = 2 h | V3.2e150 l/(sxha) | TP = 4 h | V3.2e150 l/(sxha) | TP = 15 h | V3.2eReihe11100 l/(sxha) | TP = 24 h | V3.5b100 l/(sxha) | TP = 24 h | V3.2bReihe9
rain intensity | dry period | test no.
infiltration rate
incresing with rain intensity
in- or decreasing with rain duration
realtivly constant over time
no clear impact of dry period

Interlocking Concrete Pavement
joints: 3-4 mm | opening ratio: = 4,5%
considerably clogged pavement
0
25
50
75
100
125
150
00:00 00:15 00:30 00:45 01:00 01:15 01:30 01:45 02:00
rain duration [hh:mm]
infi
ltra
tio
n r
ate
[l
/(s
ha
)]
0,00
0,15
0,30
0,45
0,60
0,75
0,90
infi
ltra
tio
n r
ate
[m
m/m
in]
Reihe13Reihe10100 l/(sxha) | slope 2,5% | V3.3bReihe12100 l/(sxha) | slope 5,0% | V3.9bReihe11100 l/(sxha) | slope 7,5% | V3.12bReihe9
impact of surface slope
RAIN INTENSITY SLOPE TEST NO.
r = 100 l/(sha)
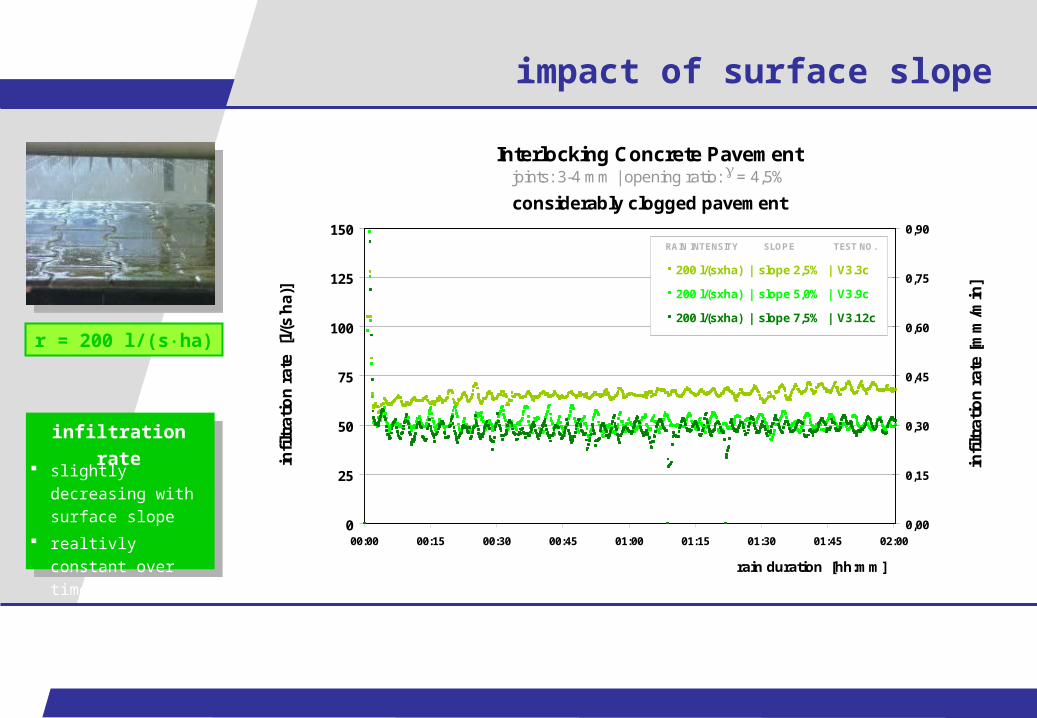
Interlocking Concrete Pavement
joints: 3-4 mm | opening ratio: = 4,5%
considerably clogged pavement
0
25
50
75
100
125
150
00:00 00:15 00:30 00:45 01:00 01:15 01:30 01:45 02:00
rain duration [hh:mm]
infi
ltra
tio
n r
ate
[l
/(s
ha
)]
0,00
0,15
0,30
0,45
0,60
0,75
0,90
infi
ltra
tio
n r
ate
[m
m/m
in]
Reihe13Reihe10200 l/(sxha) | slope 2,5% | V3.3cReihe12200 l/(sxha) | slope 5,0% | V3.9cReihe11200 l/(sxha) | slope 7,5% | V3.12cReihe9
impact of surface slope
RAIN INTENSITY SLOPE TEST NO.
r = 200 l/(sha)
infiltration rate
slightly decreasing with surface slope
realtivly constant over time

Interlocking Concrete Pavementjoints: 3-4 mm | opening ratio: = 4,5%
considerably clogged pavement
0
25
50
75
100
125
150
00:00 00:15 00:30 00:45 01:00 01:15 01:30 01:45 02:00
0,00
0,15
0,30
0,45
0,60
0,75
0,90
impact of surface slope
0
50
100
150
200
250
100 150 200 250 300
rain intensity [l/(sha)]
infi
ltra
tio
n r
ate
[l/(
sh
a)]
0
50
100
150
200
250
100 150 200 250 300
REFERENCE LINE: r = i
Reihe8
new pavement: slope 2,5%
new pavement: slope 5,0%
new pavement: slope 7,5%
gg
moderately clogged: slope 2,5%
moderately clogged: slope 5,0%
moderately clogged: slope 7,5%
hh
considerably clogged: slope 2,5%
considerably clogged: slope 5,0%
considerably clogged: slope 7,5%
Reihe10
infiltration rate
slightly decreasing with surface slope
impact of clogging much higher than impact of slope
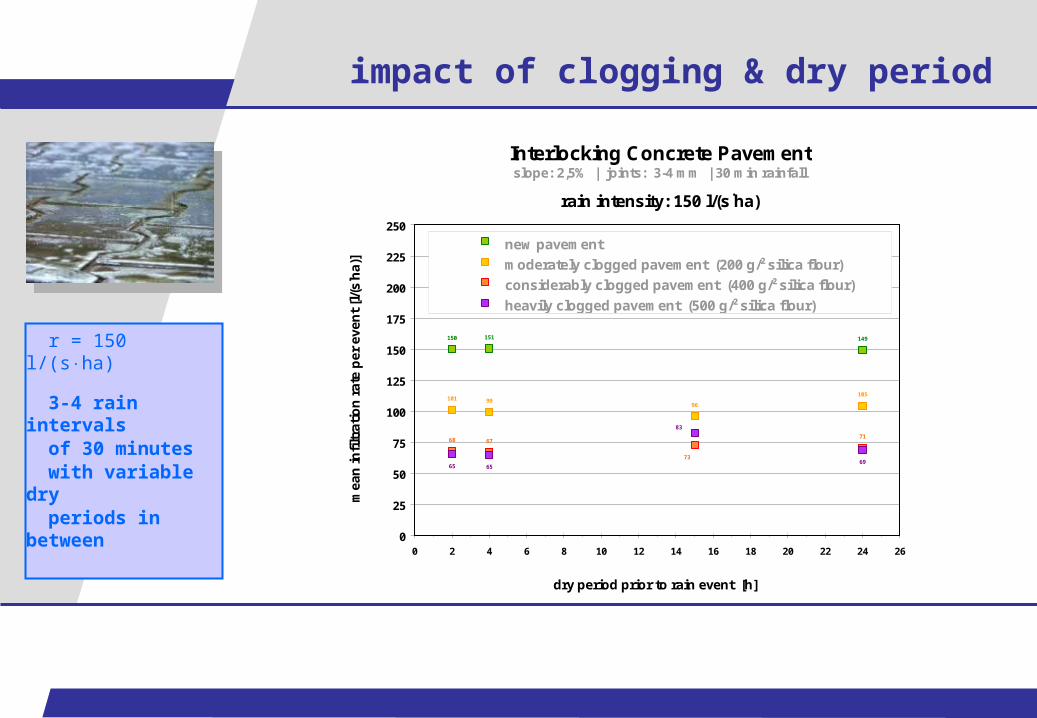
Interlocking Concrete Pavementslope: 2,5% | joints: 3-4 mm | 30 min rainfall
rain intensity: 150 l/(sha)
149
10196
105
6771
65
151150
99
73
68
83
6569
0
25
50
75
100
125
150
175
200
225
250
0 2 4 6 8 10 12 14 16 18 20 22 24 26
dry period prior to rain event [h]
me
an
infi
ltra
tio
n r
ate
pe
r e
ve
nt
[l/(
sh
a)]
new pavement
moderately clogged pavement (200 g/² silica flour)
considerably clogged pavement (400 g/² silica flour)
heavily clogged pavement (500 g/² silica flour)
impact of clogging & dry period
r = 150 l/(sha)
3-4 rain intervals of 30 minutes with variable dry periods in between
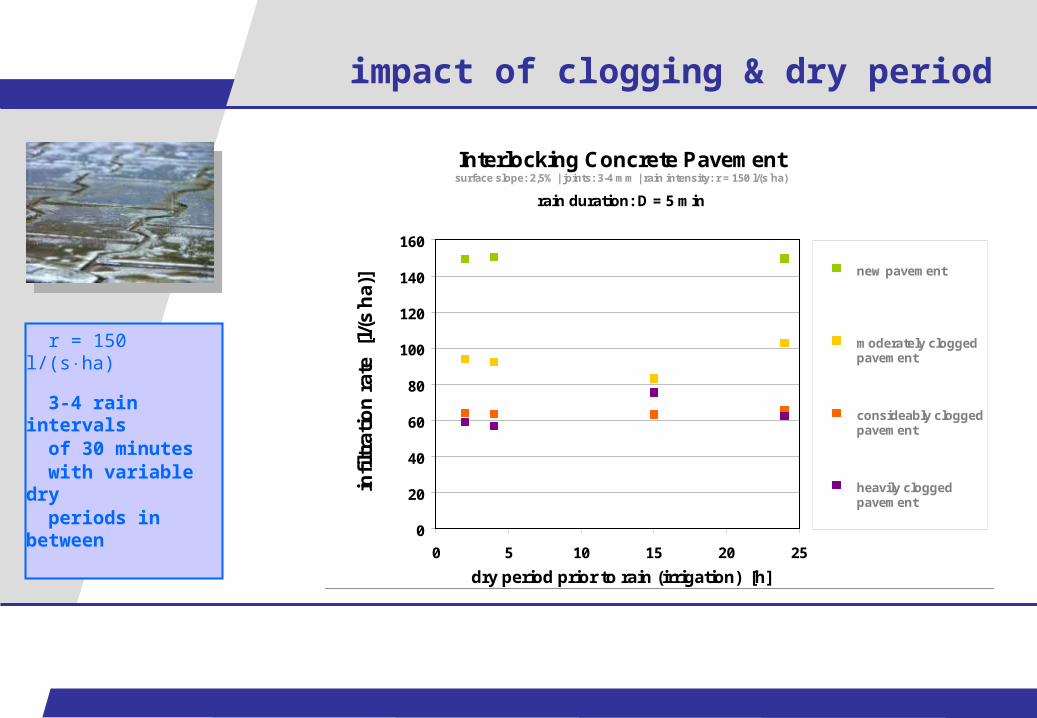
Interlocking Concrete Pavementsurface slope: 2,5% | joints: 3-4 mm | rain intensity: r = 150 l/(sha)
rain duration: D = 5 min
0
20
40
60
80
100
120
140
160
0 5 10 15 20 25
dry period prior to rain (irrigation) [h]
infi
ltra
tio
n r
ate
[l/
(s h
a)] new pavement
moderately cloggedpavement
consideably cloggedpavement
heavily cloggedpavement
impact of clogging & dry period
r = 150 l/(sha)
3-4 rain intervals of 30 minutes with variable dry periods in between
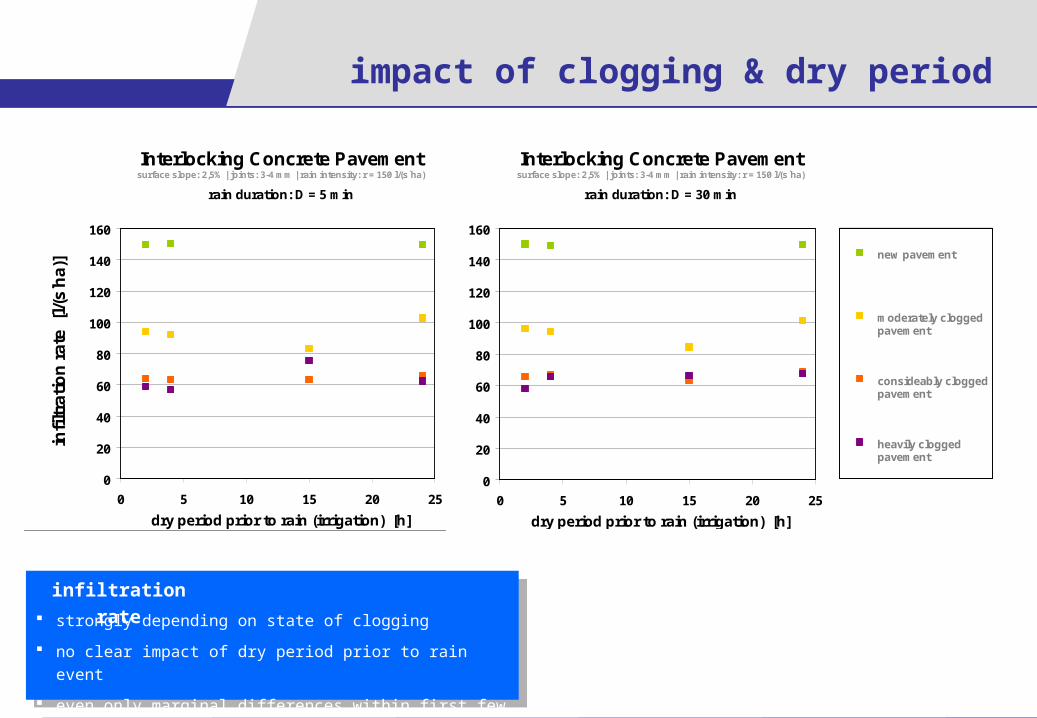
impact of clogging & dry period
Interlocking Concrete Pavementsurface slope: 2,5% | joints: 3-4 mm | rain intensity: r = 150 l/(sha)
rain duration: D = 30 min
0
20
40
60
80
100
120
140
160
0 5 10 15 20 25
dry period prior to rain (irrigation) [h]
Interlocking Concrete Pavementsurface slope: 2,5% | joints: 3-4 mm | rain intensity: r = 150 l/(sha)
rain duration: D = 5 min
0
20
40
60
80
100
120
140
160
0 5 10 15 20 25
dry period prior to rain (irrigation) [h]
infi
ltra
tio
n r
ate
[l/
(s h
a)]
0
20
40
60
80
100
120
140
160
0 5 10 15 20 25
new pavement
moderately cloggedpavement
consideably cloggedpavement
heavily cloggedpavement
infiltration rate
strongly depending on state of clogging
no clear impact of dry period prior to rain event
even only marginal differences within first few minutes
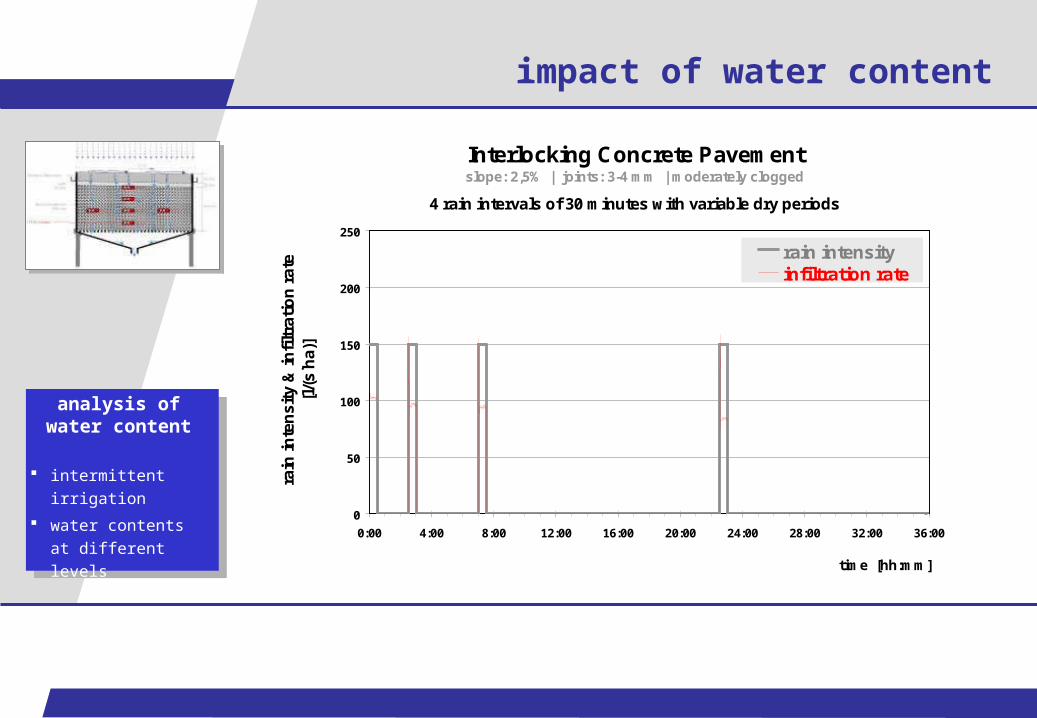
impact of water content
Interlocking Concrete Pavementslope: 2,5% | joints: 3-4 mm | moderately clogged
4 rain intervals of 30 minutes with variable dry periods
0
50
100
150
200
250
0:00 4:00 8:00 12:00 16:00 20:00 24:00 28:00 32:00 36:00
time [hh:mm]
rain
in
ten
sit
y &
in
filt
rati
on
ra
te
[l/(
sh
a)]
rain intensityinfiltration rate
analysis of water content
intermittent irrigation
water contents at different levels
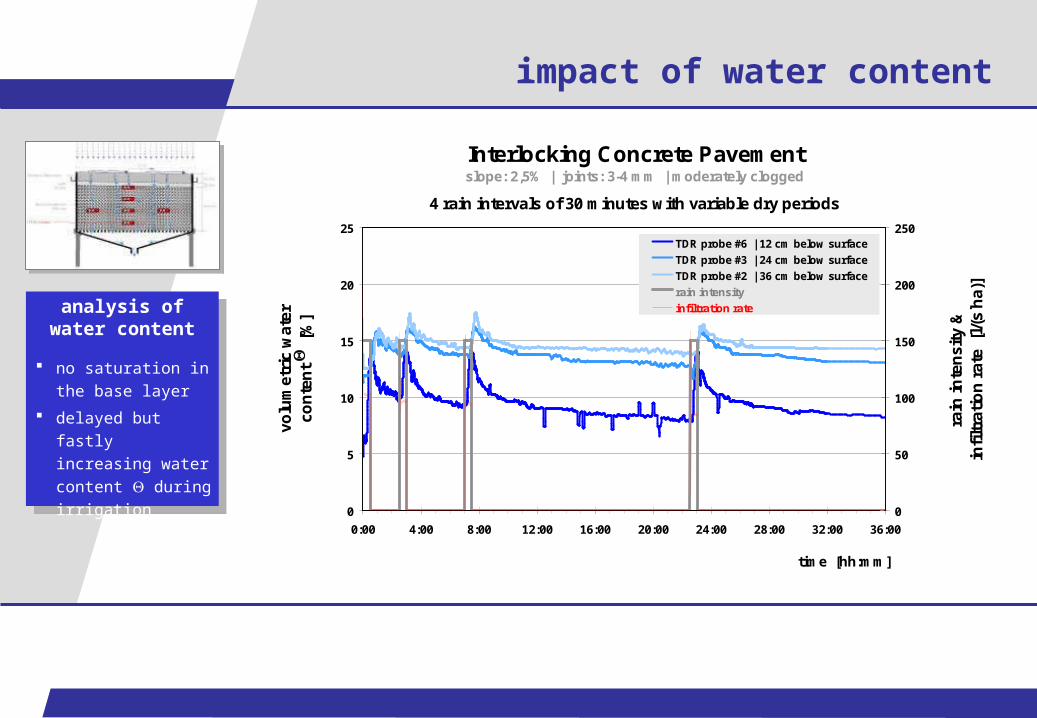
Interlocking Concrete Pavementslope: 2,5% | joints: 3-4 mm | moderately clogged
4 rain intervals of 30 minutes with variable dry periods
0
5
10
15
20
25
0:00 4:00 8:00 12:00 16:00 20:00 24:00 28:00 32:00 36:00
time [hh:mm]
vo
lum
etr
ic w
ate
r c
on
ten
t
[%
]
0
50
100
150
200
250
rain
in
ten
sit
y &
in
filt
rati
on
ra
te
[l/(
sh
a)]
TDR probe #6 | 12 cm below surface
TDR probe #3 | 24 cm below surface
TDR probe #2 | 36 cm below surface
rain intensity
infiltration rate
impact of water content
analysis of water content
no saturation in the base layer
delayed but fastly increasing water content during irrigation

Interlocking Concrete Pavementslope: 2,5% | joints: 3-4 mm | moderately clogged
4 rain intervals of 30 minutes with variable dry periods
0
5
10
15
20
25
0:00 1:00 2:00 3:00 4:00 5:00 6:00 7:00 8:00 9:00 10:00
time [hh:mm]
vo
lum
etr
ic w
ate
r c
on
ten
t
[%
]
0
50
100
150
200
250
rain
in
ten
sit
y &
in
filt
rati
on
ra
te
[l/(
sh
a)]
TDR probe #6 | 12 cm below surfaceTDR probe #3 | 24 cm below surfaceTDR probe #2 | 36 cm below surfacerain intensityinfiltration rate
impact of water content
analysis of water content
straight after irrigation: fast decrease of
afterwards: slowly decreasing water contents

Interlocking Concrete Pavementslope: 2,5% | joints: 3-4 mm | moderately clogged
4 rain intervals of 30 minutes with variable dry periods
0
5
10
15
20
25
0:00 0:30 1:00 1:30 2:00 2:30 3:00 3:30 4:00
time [hh:mm]
vo
lum
etr
ic w
ate
r c
on
ten
t
[%
]
0
50
100
150
200
250
rain
in
ten
sit
y &
in
filt
rati
on
ra
te
[l/(
sh
a)]
TDR probe #6 | 12 cm below surfaceTDR probe #3 | 24 cm below surfaceTDR probe #2 | 36 cm below surfacerain intensityinfiltration rate
impact of water content
analysis of water content
after 10-15 min. infiltrated water reaches top of base layer
after 25-35 min. infiltrated water reaches bottom of base layer

Interlocking Concrete Pavementslope: 2,5% | joints: 3-4 mm | moderately clogged
4 rain intervals of 30 minutes with variable dry periods
0
5
10
15
20
25
0:00 2:00 4:00 6:00 8:00 10:00 12:00 14:00 16:00 18:00 20:00 22:00 24:00 26:00
time [hh:mm]
volu
met
ric
wat
er
con
ten
t
[%
]
0
50
100
150
200
250
rain
inte
nsi
ty &
in
filt
rati
on
rat
e
[l/(
s h
a)]
TDR probe #6 | 12 cm below surfaceTDR probe #3 | 24 cm below surfaceTDR probe #2 | 36 cm below surfacerain intensityinfiltration rate
impact of water content
analysis of water content
no significant impacts of dry-period duration on water contents
no obvious correlation between water content in the base layer and infiltration rate
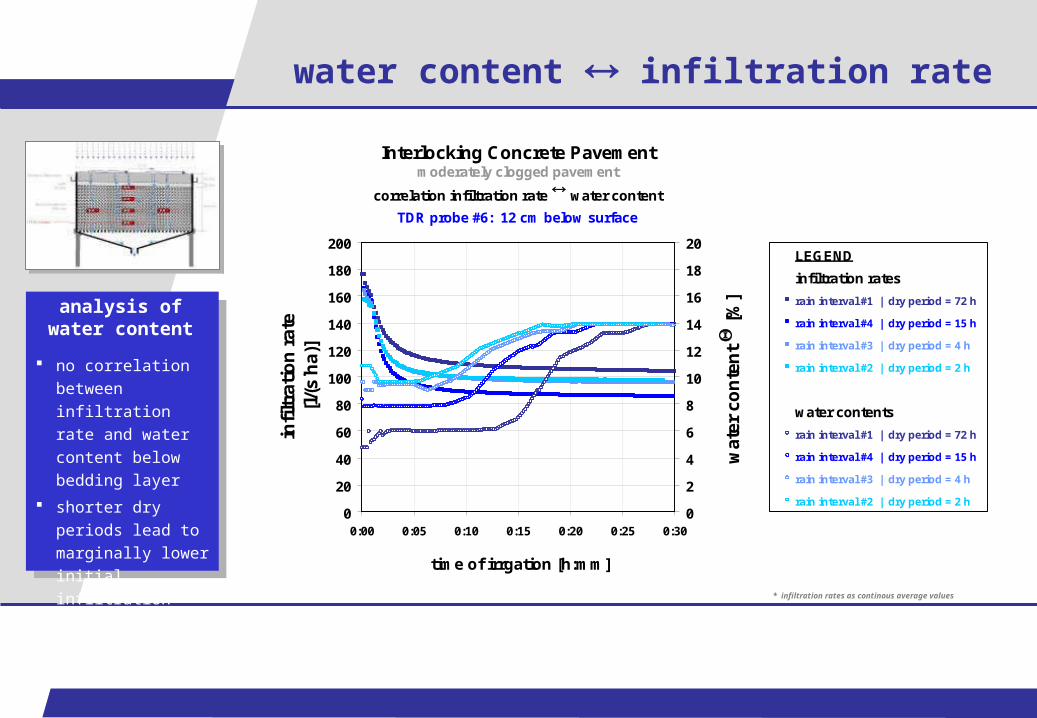
Interlocking Concrete Pavement
moderately clogged pavement
correlation infiltration rate water content
TDR probe #6: 12 cm below surface
0
20
40
60
80
100
120
140
160
180
200
0:00 0:05 0:10 0:15 0:20 0:25 0:30
time of irrgation [h:mm]
infi
ltra
tio
n r
ate
[l/(
sh
a)]
0
2
4
6
8
10
12
14
16
18
20
wat
er c
on
ten
t
[%
]
LEGEND
infiltration rates
rain interval #1 | dry period = 72 h
rain interval #4 | dry period = 15 h
rain interval #3 | dry period = 4 h
rain interval #2 | dry period = 2 h
Reihe6
water contents
rain interval #1 | dry period = 72 h
rain interval #4 | dry period = 15 h
rain interval #3 | dry period = 4 h
rain interval #2 | dry period = 2 h
water content infiltration rate
no correlation between infiltration rate and water content below bedding layer
shorter dry periods lead to marginally lower initial infiltration rates
analysis of water content
* infiltration rates as continous average values
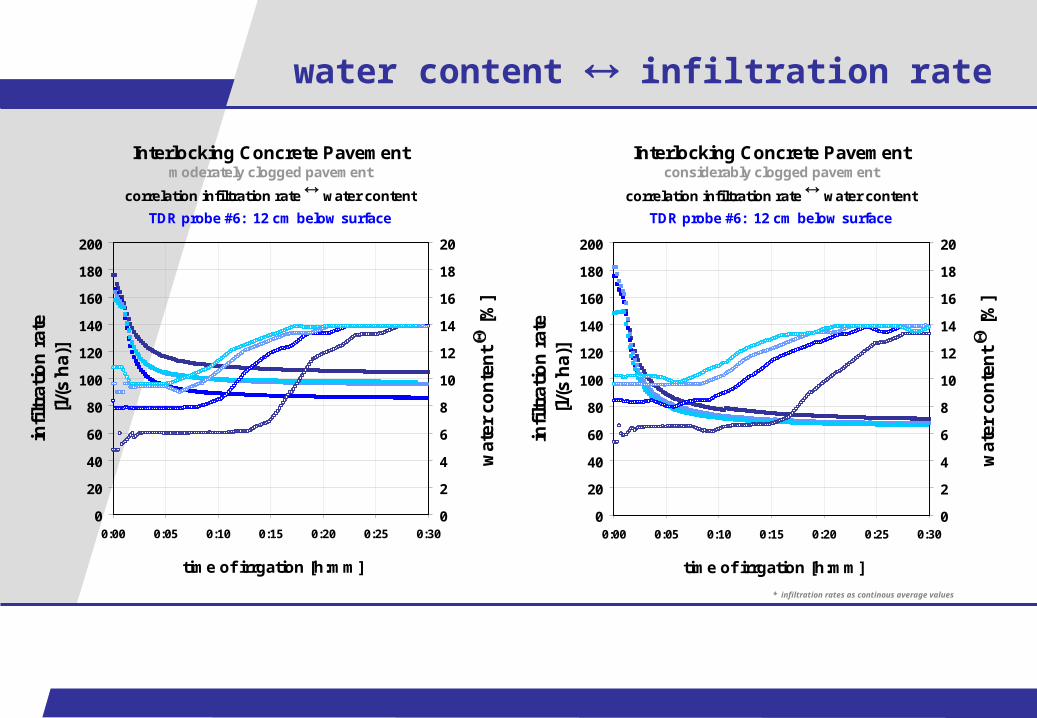
Interlocking Concrete Pavement
considerably clogged pavement
correlation infiltration rate water content
TDR probe #6: 12 cm below surface
0
20
40
60
80
100
120
140
160
180
200
0:00 0:05 0:10 0:15 0:20 0:25 0:30
time of irrgation [h:mm]
infi
ltra
tio
n r
ate
[l/(
sh
a)]
0
2
4
6
8
10
12
14
16
18
20
wat
er c
on
ten
t
[%
]
water content infiltration rate
Interlocking Concrete Pavementmoderately clogged pavement
correlation infiltration rate water content
TDR probe #6: 12 cm below surface
0
20
40
60
80
100
120
140
160
180
200
0:00 0:05 0:10 0:15 0:20 0:25 0:30
time of irrgation [h:mm]
infi
ltra
tio
n r
ate
[l/(
sh
a)]
0
2
4
6
8
10
12
14
16
18
20
wat
er c
on
ten
t
[%
]
* infiltration rates as continous average values
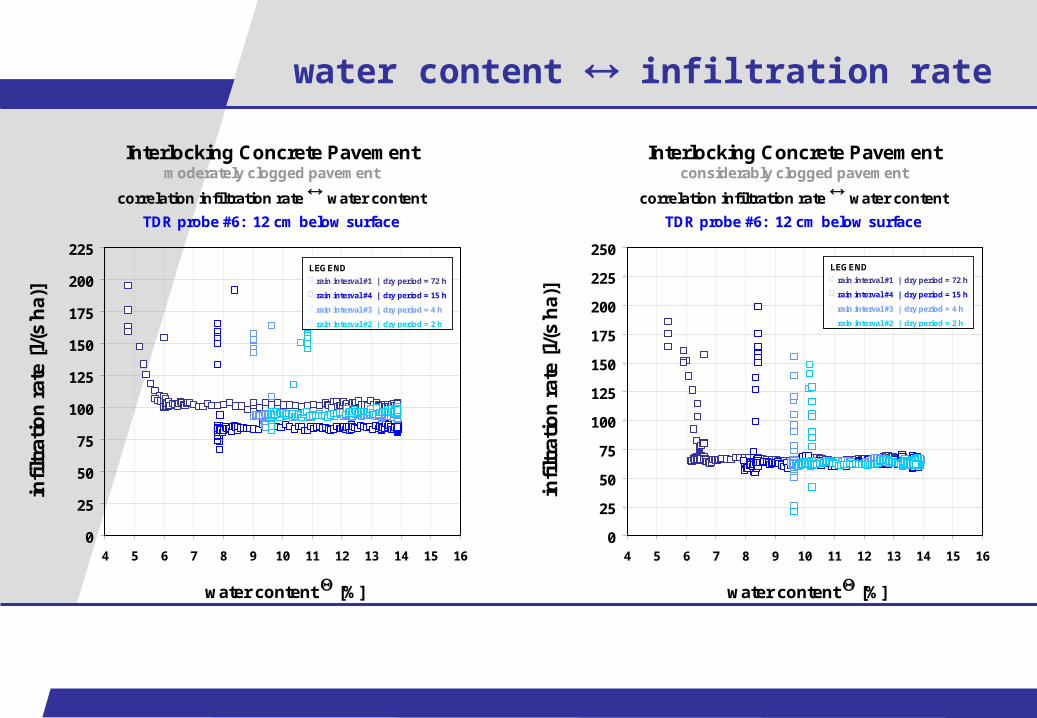
Interlocking Concrete Pavement
considerably clogged pavement
correlation infiltration rate water content
TDR probe #6: 12 cm below surface
0
25
50
75
100
125
150
175
200
225
250
4 5 6 7 8 9 10 11 12 13 14 15 16
water content [%]
infi
ltra
tio
n r
ate
[l/(
sh
a)]
water content infiltration rate
Interlocking Concrete Pavementmoderately clogged pavement
correlation infiltration rate water content
TDR probe #6: 12 cm below surface
0
25
50
75
100
125
150
175
200
225
4 5 6 7 8 9 10 11 12 13 14 15 16
water content [%]
infi
ltra
tio
n r
ate
[l/(
sh
a)]
Interlocking Concrete Pavementmoderately clogged pavement
correlation infiltration rate water content
TDR probe #6: 12 cm below surface
0
50
100
150
200
250
4 6 8 10 12 14 16
water content [%]
infi
ltra
tio
n r
ate
[l/(
sh
a)]
LEGEND
Reihe6
infiltration rates
rain interval #1 | dry period = 72 h
rain interval #4 | dry period = 15 h
rain interval #3 | dry period = 4 h
rain interval #2 | dry period = 2 h
LEGEND
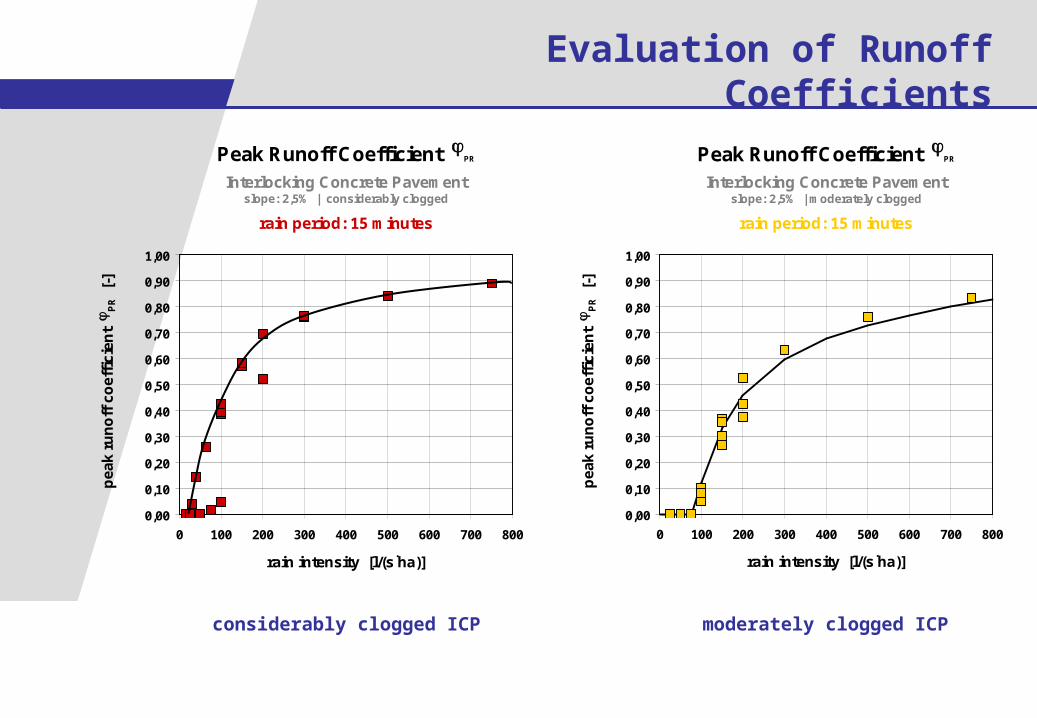
Evaluation of Runoff Coefficients
Peak Runoff Coefficient PR
Interlocking Concrete Pavementslope: 2,5% | considerably clogged
rain period: 15 minutes
0,00
0,10
0,20
0,30
0,40
0,50
0,60
0,70
0,80
0,90
1,00
0 100 200 300 400 500 600 700 800
rain intensity [l/(sha)]
pe
ak
ru
no
ff c
oe
ffic
ien
t
PR
[-]
Peak Runoff Coefficient PR
Interlocking Concrete Pavementslope: 2,5% | moderately clogged
rain period: 15 minutes
0,00
0,10
0,20
0,30
0,40
0,50
0,60
0,70
0,80
0,90
1,00
0 100 200 300 400 500 600 700 800
rain intensity [l/(sha)]
pe
ak
ru
no
ff c
oe
ffic
ien
t
PR
[-]
considerably clogged ICP moderately clogged ICP
Runoff Coefficients
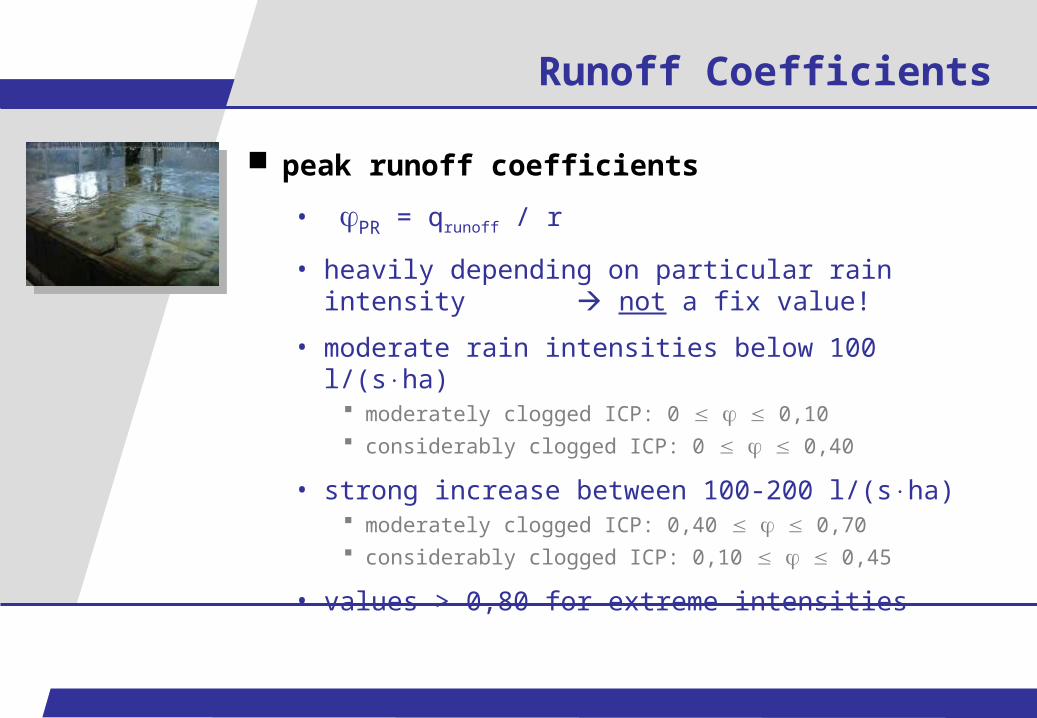
peak runoff coefficients
• PR = qrunoff / r
• heavily depending on particular rain intensity not a fix value!
• moderate rain intensities below 100 l/(sha) moderately clogged ICP: 0 0,10 considerably clogged ICP: 0 0,40
• strong increase between 100-200 l/(sha) moderately clogged ICP: 0,40 0,70 considerably clogged ICP: 0,10 0,45
• values > 0,80 for extreme intensities

Interlocking Concrete Pavementsurface slope: J = 2,5% | joints: 3-4 mm | opening ratio: = 4,5%
rain period: D = 20 min
0
50
100
150
200
250
300
0 100 200 300 400 500 600 700 800
rain intensity (irrigation) [l/(sha)]
infi
ltra
tio
n r
ate
[l/
(s h
a)]
0
50
100
150
200
250
300
0 100 200 300 400 500 600 700 800
new built pavementReihe14
moderately cloggedpavementReihe12
considerably cloggedpavementReihe11
heavily cloggedpavementReihe10
reference line: r = i
Reihe13
Regr. NZ
QM200
QM400
QM500
Reihe15
Regression Analysis ICP
Regression Analysis ICP
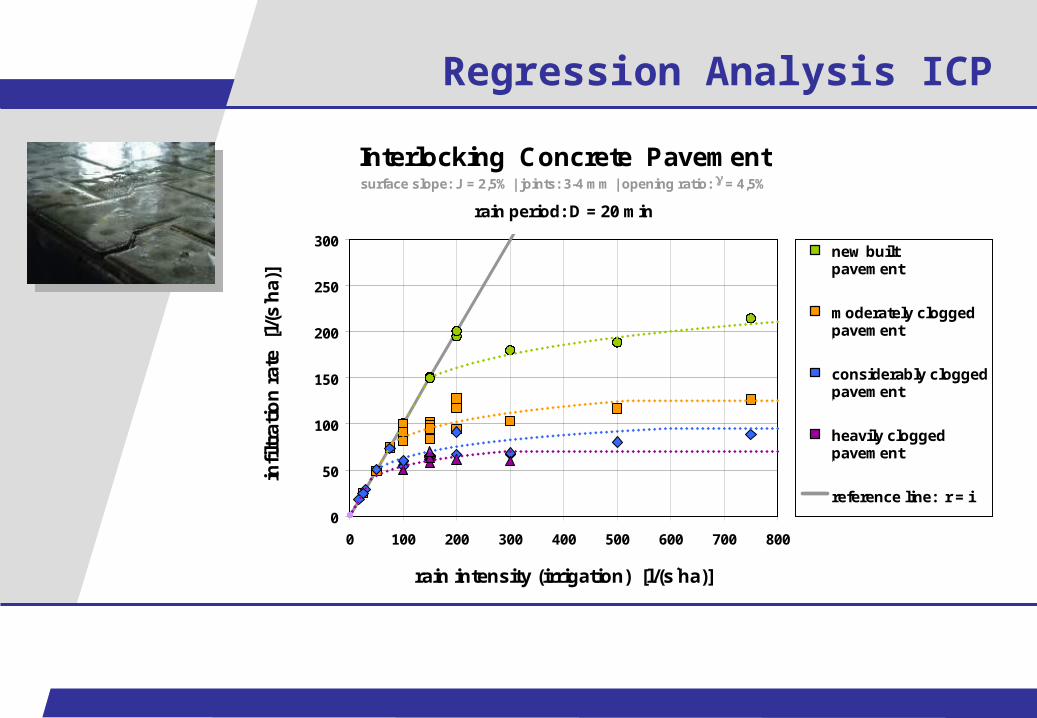
Interlocking Concrete Pavementsurface slope: J = 2,5% | joints: 3-4 mm | opening ratio: = 4,5%
rain period: D = 20 min
0
50
100
150
200
250
300
0 100 200 300 400 500 600 700 800
rain intensity (irrigation) [l/(sha)]
infi
ltra
tio
n r
ate
[l/
(s h
a)]
0
50
100
150
200
250
300
0 100 200 300 400 500 600 700 800
new built pavementReihe14
moderately cloggedpavementReihe12
considerably cloggedpavementReihe11
heavily cloggedpavementReihe10
reference line: r = i
Reihe13
Regr. NZ
QM200
QM400
QM500
Reihe15
Regression Analysis ICP
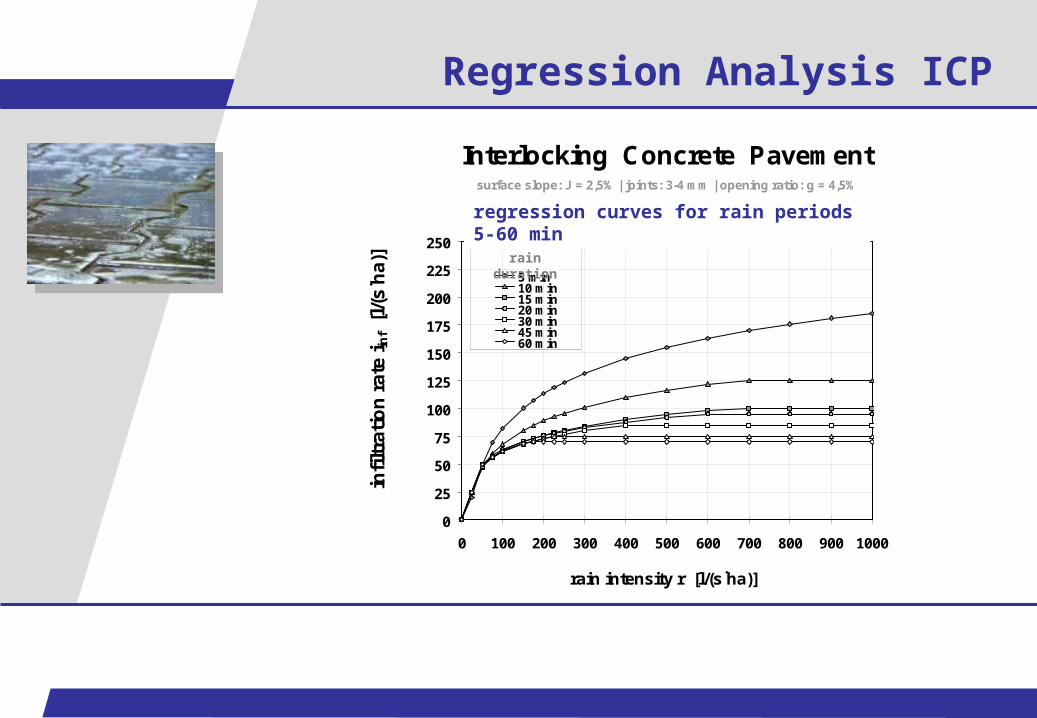
Interlocking Concrete Pavementsurface slope: J = 2,5% | joints: 3-4 mm | opening ratio: g = 4,5%
regression curves for rain periods 5-60 min
0
25
50
75
100
125
150
175
200
225
250
0 100 200 300 400 500 600 700 800 900 1000
rain intensity r [l/(sha)]
infi
ltra
tio
n r
ate
i inf
[l/(
sh
a)] Reihe8
Reihe95 min10 min15 min20 min30 min45 min60 min
rain duration
regression curves for rain periods 5-60 min
Versickerungsrate in Abhängigkeit von
der Regendauer und der RegenintensitätDoppelverbundpflaster mit schmalem Fugenbild
Neuzustand mit 2,5% Gefälle
0
50
100
150
200
250
300
350
400
0 100 200 300 400 500 600 700 800 900 1000
Beregnungsintensität r [l/(sha)]
Ve
rsic
ke
run
gs
rate
f
[l/(
sh
a)]
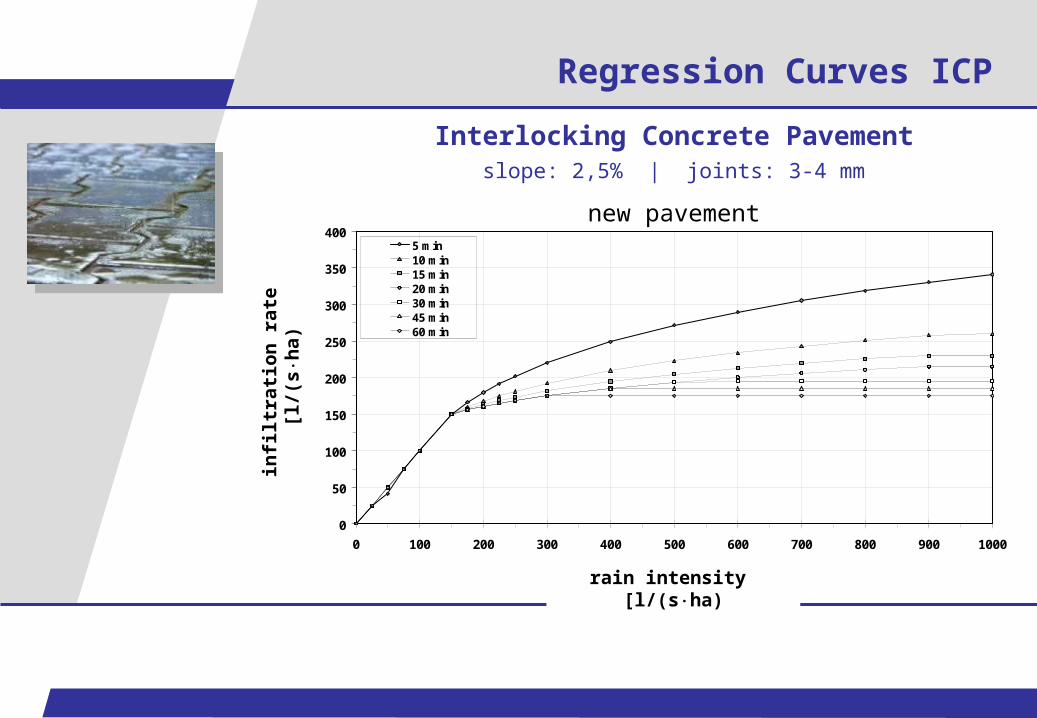
5 min10 min15 min20 min30 min45 min60 min
Regression Curves ICP
infi
ltra
tio
n r
ate
[l
/(s
ha)
rain intensity [l/(sha)
Interlocking Concrete Pavementslope: 2,5% | joints: 3-4 mm
new pavement
Versickerungsrate in Abhängigkeit von
der Regendauer und der RegenintensitätDoppelverbundpflaster mit schmalem Fugenbild
200 g/m² Quarzmehl mit 2,5% Gefälle
0
50
100
150
200
250
300
350
400
0 100 200 300 400 500 600 700 800 900 1000
Beregnungsintensität r [l/(sha)]
Ve
rsic
ke
run
gs
rate
f
[l/(
sh
a)]
5 min10 min15 min20 min30 min45 min60 min
Regression Curves ICP
infi
ltra
tio
n r
ate
[l
/(s
ha)
rain intensity [l/(sha)
Interlocking Concrete Pavementslope: 2,5% | joints: 3-4 mm
moderately clogged pavement

Versickerungsrate in Abhängigkeit von
der Regendauer und der RegenintensitätDoppelverbundpflaster mit schmalem Fugenbild
400 g/m² Quarzmehl mit 2,5% Gefälle
0
50
100
150
200
250
300
350
400
0 100 200 300 400 500 600 700 800 900 1000
Beregnungsintensität r [l/(sha)]
Ve
rsic
ke
run
gs
rate
f
[l/(
sh
a)]
5 min10 min15 min20 min30 min45 min60 min
Regression Curves ICP
infi
ltra
tio
n r
ate
[l
/(s
ha)
rain intensity [l/(sha)
Interlocking Concrete Pavementslope: 2,5% | joints: 3-4 mm
considerably clogged pavement
New Modelling Approach
integration of major processes
– rain and slope dependent infiltration capacity
– clogging effects (reduced infiltration capacity)
– storage function of base layer
– interactions between top layer, base layer and natural soil layer ( water transport)
development in a MATLAB/Simulink environment
calibration and test on data base
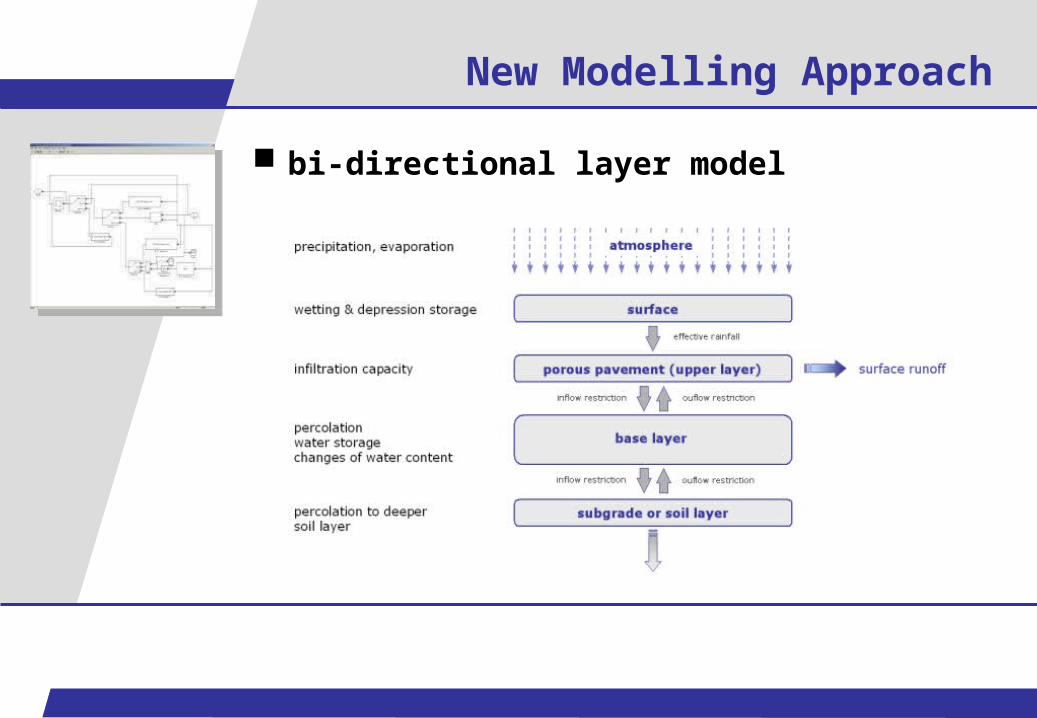
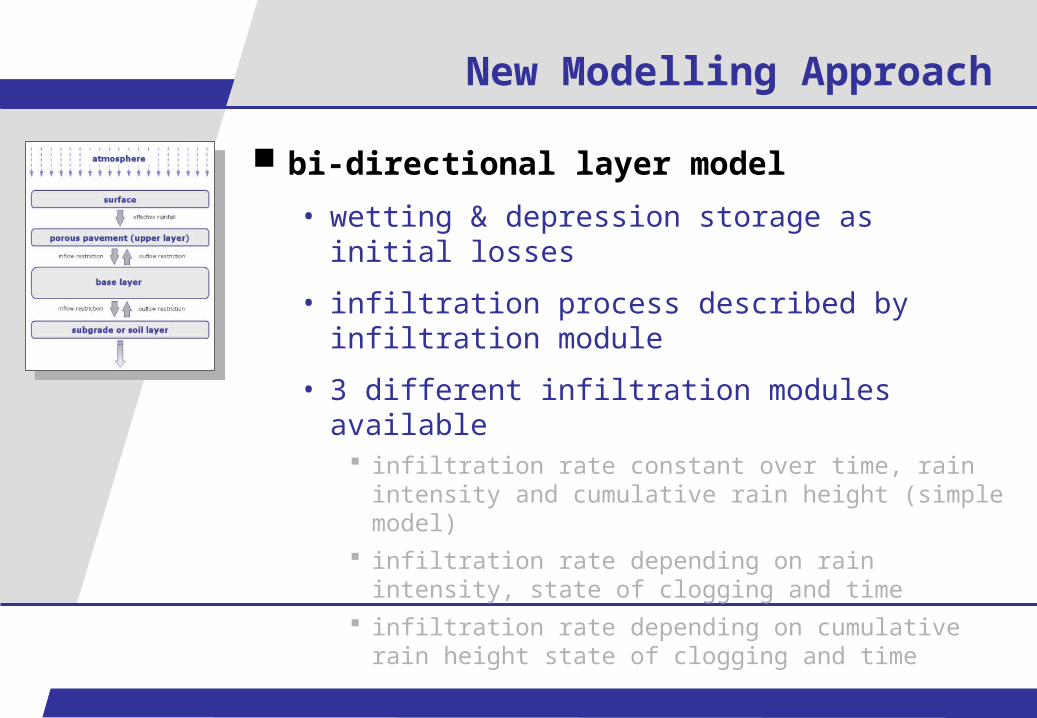
New Modelling Approach
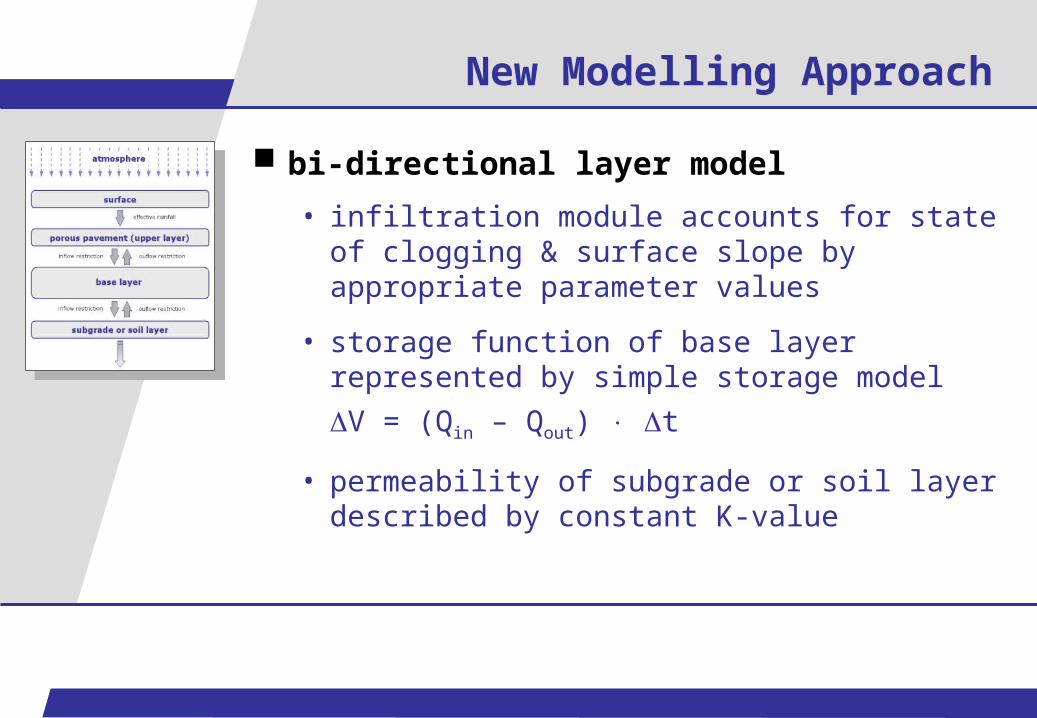
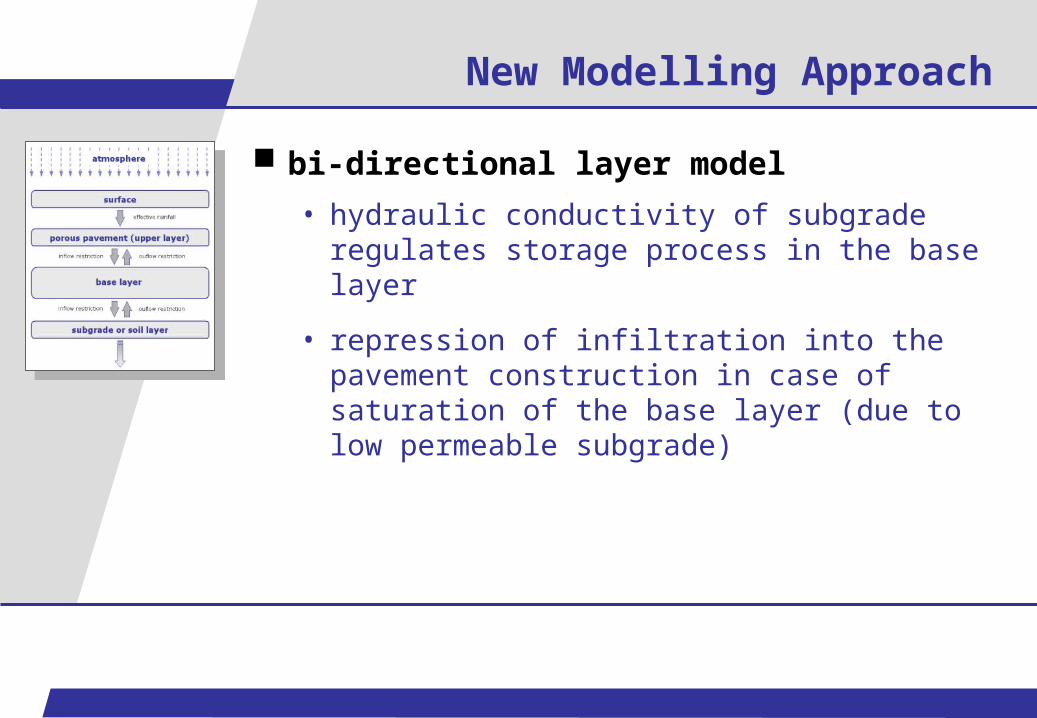
bi-directional layer model
New Modelling Approach
bi-directional layer model
• wetting & depression storage as initial losses
• infiltration process described by infiltration module
• 3 different infiltration modules available infiltration rate constant over time, rain intensity
and cumulative rain height (simple model) infiltration rate depending on rain intensity, state of
clogging and time infiltration rate depending on cumulative rain height
state of clogging and time
New Modelling Approach
bi-directional layer model
• infiltration module accounts for state of clogging & surface slope by appropriate parameter values
• storage function of base layer represented by simple storage model
V = (Qin – Qout) t
• permeability of subgrade or soil layer described by constant K-value
New Modelling Approach
bi-directional layer model
• hydraulic conductivity of subgrade regulates storage process in the base layer
• repression of infiltration into the pavement construction in case of saturation of the base layer (due to low permeable subgrade)

Regression Infiltration Rate
Interlocking Concrete Pavementsurface slope: J = 2,5% | joints: 3-4 mm | opening ratio: = 4,5%
rain period: D = 20 min
0
50
100
150
200
250
300
0 100 200 300 400 500 600 700 800
rain intensity (irrigation) [l/(sha)]
infi
ltra
tio
n r
ate
[l/
(s h
a)]
0
50
100
150
200
250
300
0 100 200 300 400 500 600 700 800
new built pavementReihe14
moderately cloggedpavementReihe12
considerably cloggedpavementReihe11
heavily cloggedpavementReihe10
reference line: r = i
Reihe13
Regr. NZ
QM200
QM400
QM500
Reihe15
Regression Infiltration Rate
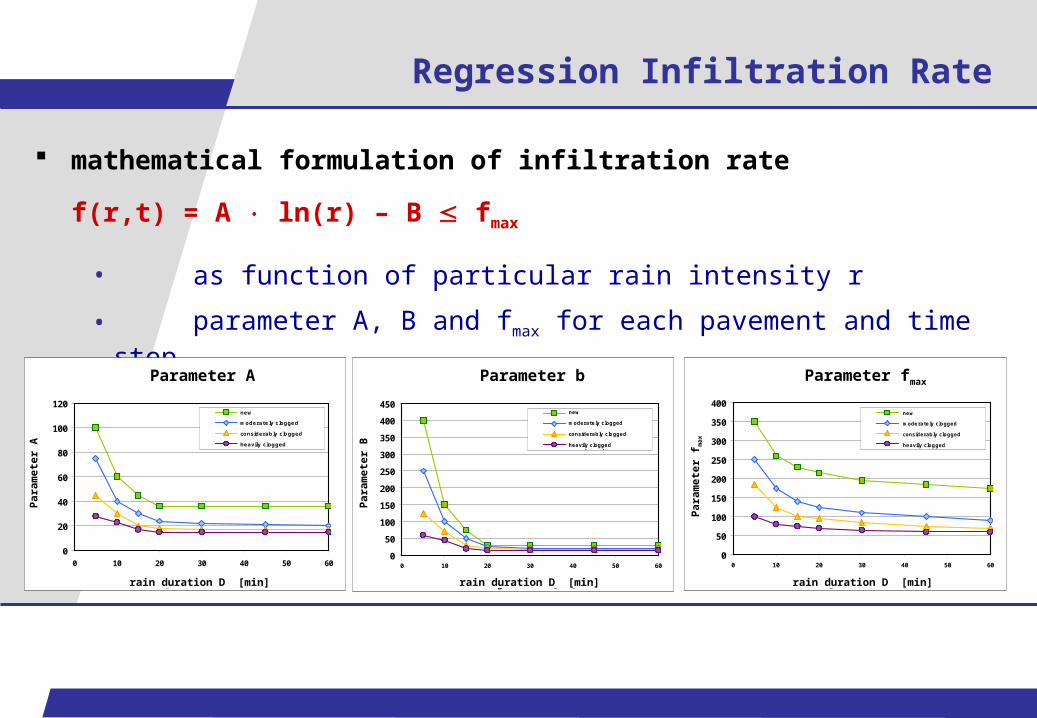
mathematical formulation of infiltration rate
f(r,t) = A ln(r) – B fmax
• as function of particular rain intensity r
• parameter A, B and fmax for each pavement and time step
Regressionsparameter A
0
20
40
60
80
100
120
0 10 20 30 40 50 60
Regendauer D [min]
Par
ame
terw
ert
A
Neuzustand200 g/m² Quarzmehl400 g/m² Quarzmehl500 g/m² Quarzmehl
Regressionsparameter B
0
50
100
150
200
250
300
350
400
450
0 10 20 30 40 50 60
Regendauer D [min]
Pa
ram
ete
rwe
rt B
Neuzustand200 g/m² Quarzmehl400 g/m² Quarzmehl500 g/m² Quarzmehl
Regressionsparameter fmax
0
50
100
150
200
250
300
350
400
0 10 20 30 40 50 60
Regendauer D [min]
Pa
ram
ete
rwe
rt f
max
Neuzustand200 g/m² Quarzmehl400 g/m² Quarzmehl500 g/m² Quarzmehl
Parameter A
rain duration D [min]
Para
mete
r A
new
moderately clogged
considerably clogged
heavily clogged
Parameter b
rain duration D [min]
Para
mete
r B
new
moderately clogged
considerably clogged
heavily clogged
Parameter fmax
rain duration D [min]
Para
mete
r f m
ax
new
moderately clogged
considerably clogged
heavily clogged
Regression Model Parameters
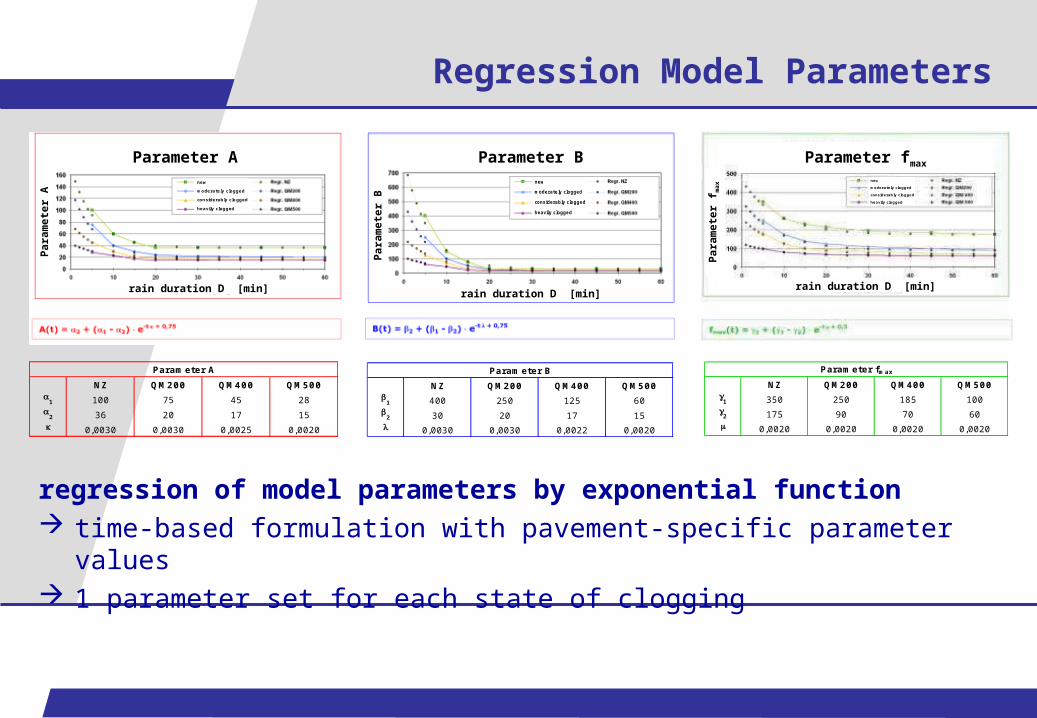
regression of model parameters by exponential function time-based formulation with pavement-specific parameter values 1 parameter set for each state of clogging
NZ QM200 QM400 QM500
1 100 75 45 28
2 36 20 17 15 0,0030 0,0030 0,0025 0,0020
Parameter A
Parameter A
rain duration D [min]
Para
mete
r A
new
moderately clogged
considerably clogged
heavily clogged
NZ QM200 QM400 QM500
1 400 250 125 60
2 30 20 17 15 0,0030 0,0030 0,0022 0,0020
Parameter B
Parameter B
rain duration D [min]
Para
mete
r B
new
moderately clogged
considerably clogged
heavily clogged
NZ QM200 QM400 QM5001 350 250 185 100
2 175 90 70 60 0,0020 0,0020 0,0020 0,0020
Parameter fmax
Parameter fmax
rain duration D [min]
Para
mete
r f m
ax new
moderately clogged
considerably clogged
heavily clogged
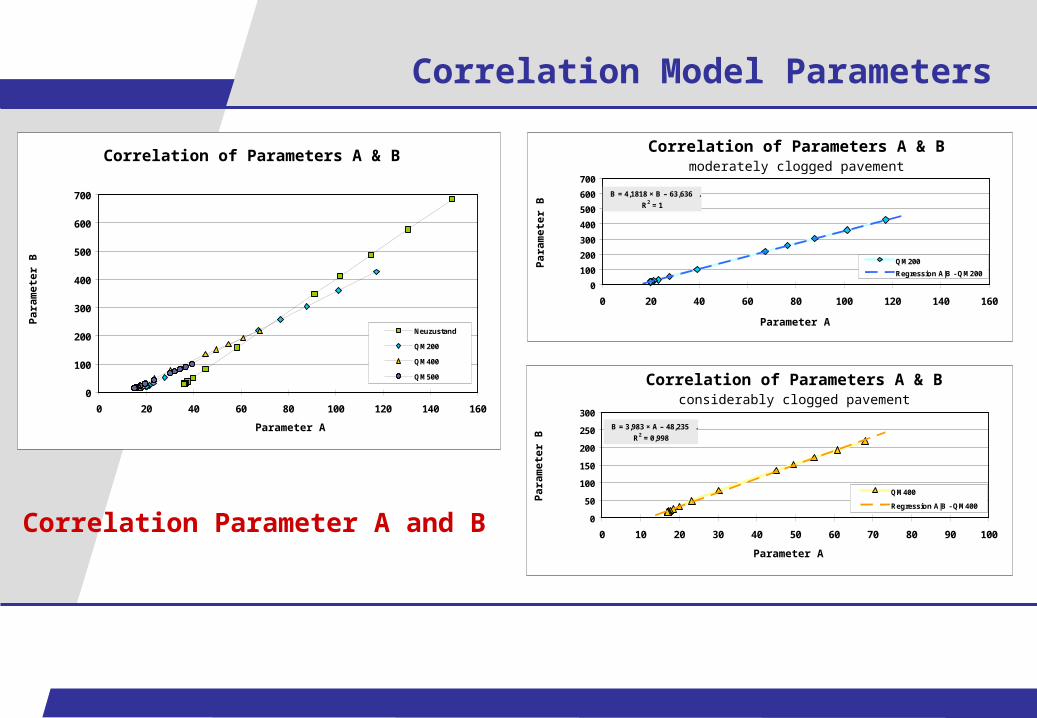
Correlation Model Parameters
Korrelation der Modellparameter A und B
0
100
200
300
400
500
600
700
0 20 40 60 80 100 120 140 160
Parameterwert A
Pa
ram
eter
wer
t B
Neuzustand
QM200
QM400
QM500
Korrelation der Modellparameter A und B– geringer bis mittlerer Kolmatierungsgrad –
B = 4,1818 × B – 63,636 .
R2 = 1
0
100
200
300
400
500
600
700
0 20 40 60 80 100 120 140 160
Parameterwert A
Pa
ram
eter
wer
t B
QM200
Regression A|B - QM200
Korrelation der Modellparameter A und B– mittlerer bis hoher Kolmatierungsgrad –
B = 3,983 × A – 48,235 .
R2 = 0,998
0
50
100
150
200
250
300
0 10 20 30 40 50 60 70 80 90 100
Parameterwert A
Pa
ram
eter
wer
t B
QM400
Regression A|B - QM400
Correlation Parameter A and B
Correlation of Parameters A & B
Parameter A
Para
mete
r B
Correlation of Parameters A & Bmoderately clogged pavement
Correlation of Parameters A & Bconsiderably clogged pavement
Parameter A
Parameter AP
ara
mete
r B
Para
mete
r B
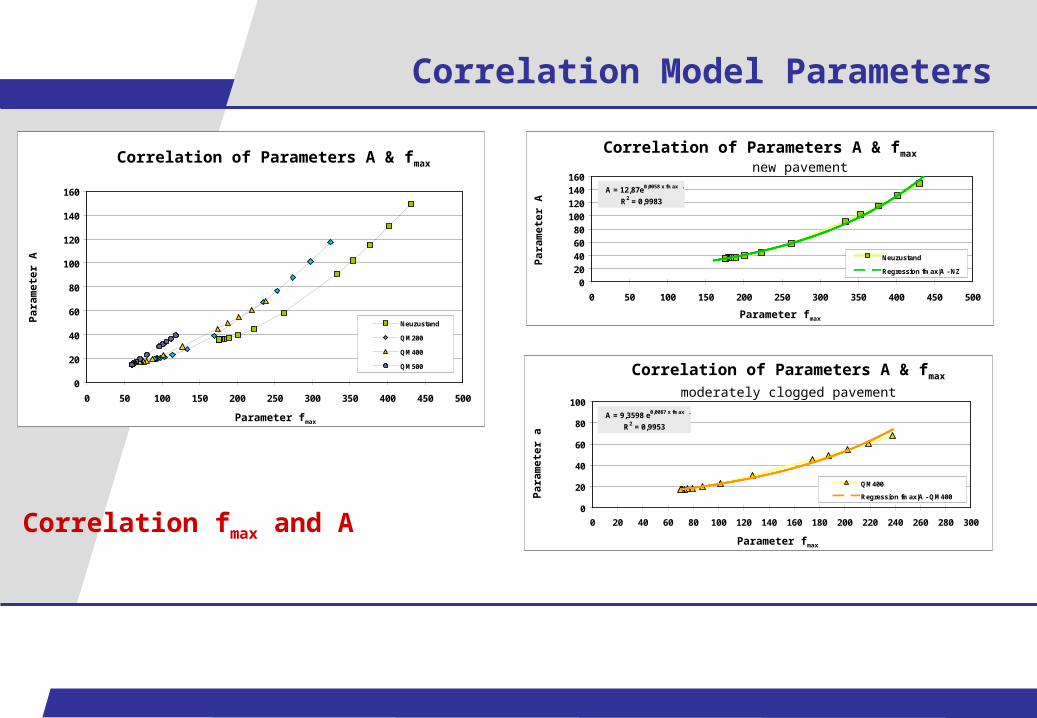
Correlation Model Parameters
Correlation fmax and A
Korrelation der Modellparameter fmax und A
0
20
40
60
80
100
120
140
160
0 50 100 150 200 250 300 350 400 450 500
Parameterwert fmax
Pa
ram
eter
wer
t A
Neuzustand
QM200
QM400
QM500
Correlation of Parameters A & fmax
Parameter fmax
Para
mete
r A
Korrelation der Modellparameter fmax und A– Neuzustand –
A = 12,87e0,0058 x fmax .
R2 = 0,9983
020406080
100120140160
0 50 100 150 200 250 300 350 400 450 500
Parameterwert fmax
Pa
ram
ete
rwer
t A
Neuzustand
Regression fmax|A - NZ
Correlation of Parameters A & fmax new pavement
Parameter fmax
Para
mete
r A
Korrelation der Modellparameter fmax und A– mittlerer bis hoher Kolmatierungsgrad –
A = 9,3598 e0,0087 x fmax .
R2 = 0,9953
0
20
40
60
80
100
0 20 40 60 80 100 120 140 160 180 200 220 240 260 280 300
Parameterwert fmaxP
ara
me
terw
ert
A
QM400
Regression fmax|A - QM400
Correlation of Parameters A & fmax
moderately clogged pavement
Parameter fmaxP
ara
mete
r a
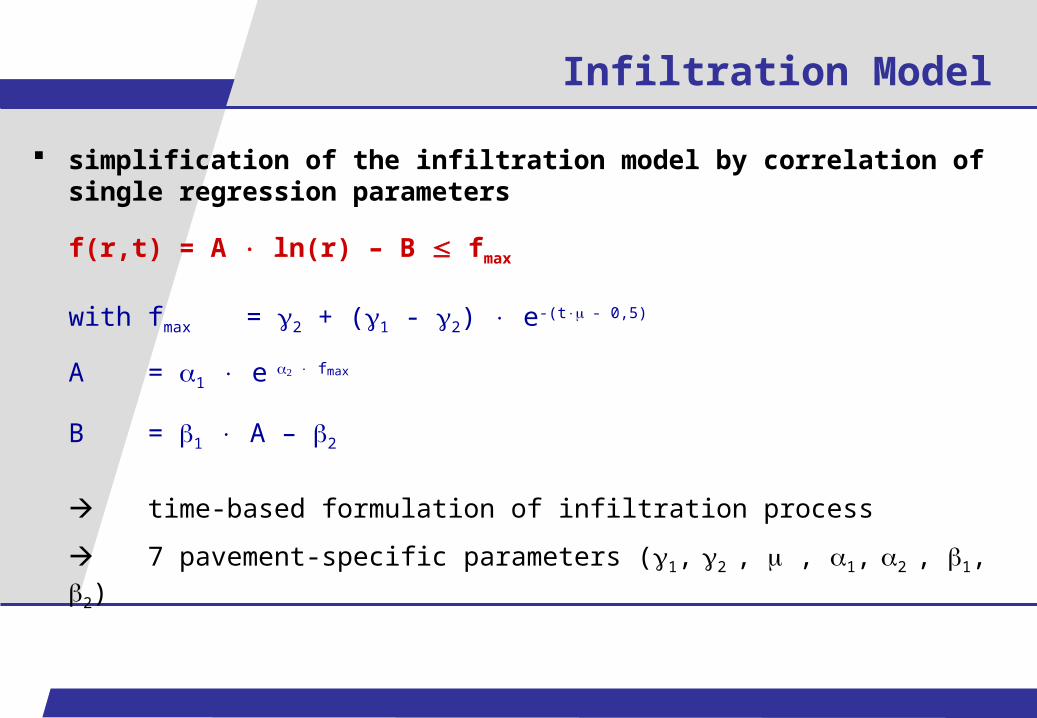
Infiltration Model
simplification of the infiltration model by correlation of single regression parameters
f(r,t) = A ln(r) – B fmax
with fmax = 2 + (1 - 2) e-(t- 0,5)
A = 1 e fmax
B = 1 A – 2
time-based formulation of infiltration process
7 pavement-specific parameters (1, 2 , , 1, 2 , 1, 2)
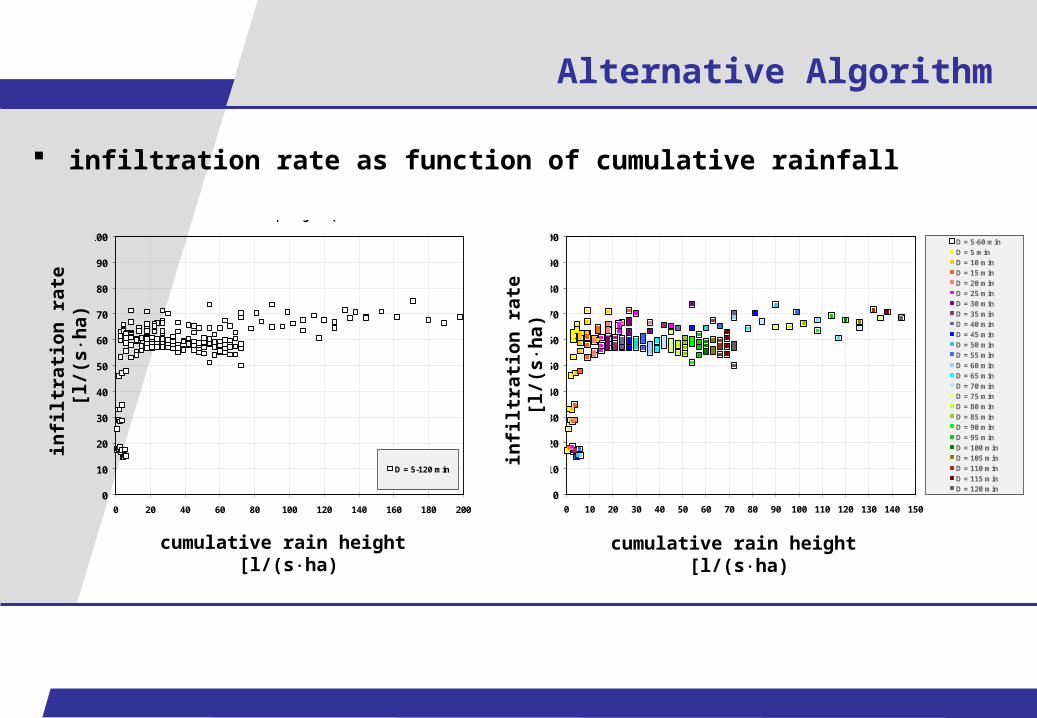
Alternative Algorithm
Versickerungsrate in Abhängigkeit von der Regenhöhe und der Regendauer
Doppelverbundpflaster mit schmalem Fugenbild bei 2,5% GefälleMessergebnnisse Versuchsserien 3
starke Kolmation | 400 g/m² Quarzmehl
0
10
20
30
40
50
60
70
80
90
100
0 20 40 60 80 100 120 140 160 180 200
Regenhöhe [mm]
Ver
sick
eru
ng
srat
e f
[l
/(s h
a)]
D = 5-120 min
Versickerungsrate in Abhängigkeit von der Regenhöhe und der Regendauer
Doppelverbundpflaster mit schmalem Fugenbild bei 2,5% GefälleMessergebnnisse Versuchsserien 3
starke Kolmation | 400 g/m² Quarzmehl
0
10
20
30
40
50
60
70
80
90
100
0 10 20 30 40 50 60 70 80 90 100 110 120 130 140 150
Regenhöhe [mm]
Ver
sick
eru
ng
srat
e f
[l
/(s
ha)
]
D = 5-60 minD = 5 minD = 10 minD = 15 minD = 20 minD = 25 minD = 30 minD = 35 minD = 40 minD = 45 minD = 50 minD = 55 minD = 60 minD = 65 minD = 70 minD = 75 minD = 80 minD = 85 minD = 90 minD = 95 minD = 100 minD = 105 minD = 110 minD = 115 minD = 120 min
infi
ltra
tio
n r
ate
[l
/(s
ha)
cumulative rain height [l/(sha) cumulative rain height [l/(sha)
infi
ltra
tio
n r
ate
[l
/(s
ha)
infiltration rate as function of cumulative rainfall
Alternative Algorithm
Versickerungsrate in Abhängigkeit von Regenhöhe und -dauer
DV-Pflaster mit schmalem Fugenbild | 2,5% Gefällestarke Kolmation | 400 g/m² Quarzmehl
0
10
20
30
40
50
60
70
80
0 20 40 60 80 100 120 140
Regenhöhe [mm]
Ve
rsic
ke
run
gs
rate
f
[l/(
sh
a)]
D = 5 min Regr. D = 5 min r = f | D = 5 minD = 10 min Regr. D = 10 min r = f | D = 10 minD = 15 min Regr. D = 15 min r = f | D = 15 minD = 20 min Regr. D = 20 min r = f | D = 20 minD = 25 min Regr. D = 25 min r = f | D = 25 minD = 30 min Regr. D = 30 min r = f | D = 30 minD = 35 min Regr. D = 35 min r = f | D = 35 minD = 40 min Regr. D = 40 min r = f | D = 40 minD = 45 min Regr. D = 45 min r = f | D = 45 minD = 50 min Regr. D = 50 min r = f | D = 50 minD = 55 min Regr. D = 55 min r = f | D = 55 minD = 60 min Regr. D = 60 min r = f | D = 60 minD = 65 min Regr. D = 65 min r = f | D = 65 minD = 70 min Regr. D = 70 min r = f | D = 70 minD = 75 min Regr. D = 75 min r = f | D = 75 minD = 80 min Regr. D = 80 min r = f | D = 80 minD = 85 min Regr. D = 85 min r = f | D = 85 minD = 90 min Regr. D = 90 min r = f | D = 90 minD = 95 min Regr. D = 95 min r = f | D = 95 minD = 100 min Regr. D = 100 min r = f | D = 100 minD = 105 min Regr. D = 105 min r = f | D = 105 minD = 110 min Regr. D = 110 min r = f | D = 110 minD = 115 min Regr. D = 115 min r = f | D = 115 minD = 120 min Regr. D = 120 min r = f | D = 120 minReihe52 Reihe53 Reihe54D = 5-60 min fmax fmin
infi
ltra
tio
n r
ate
[l
/(s
ha)
cumulative rain height [l/(sha)
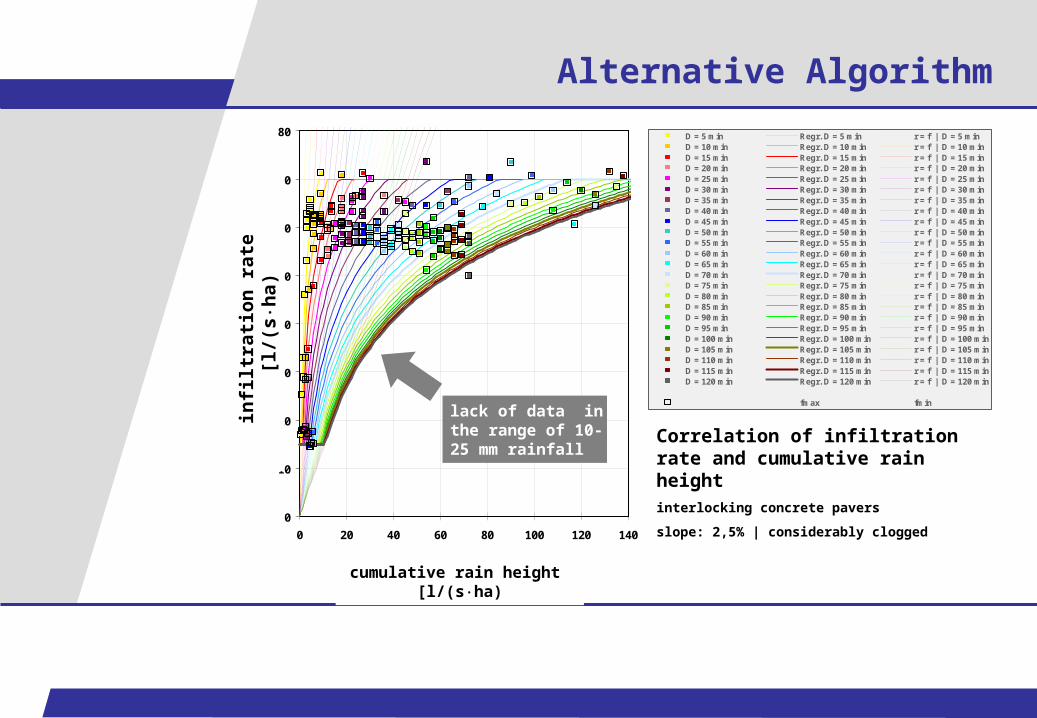
Correlation of infiltration rate and cumulative rain heightinterlocking concrete pavers
slope: 2,5% | considerably clogged
lack of data in the range of 10-25 mm rainfall
Alternative Algorithm
Versickerungsrate in Abhängigkeit von Regenhöhe und -dauer
DV-Pflaster mit schmalem Fugenbild | 2,5% Gefällestarke Kolmation | 400 g/m² Quarzmehl
0
10
20
30
40
50
60
70
80
0 20 40 60 80 100 120 140
Regenhöhe [mm]
Ve
rsic
ker
un
gs
rate
f
[l/(
sh
a)]
D = 5 min Regr. D = 5 min r = f | D = 5 minD = 10 min Regr. D = 10 min r = f | D = 10 minD = 15 min Regr. D = 15 min r = f | D = 15 minD = 20 min Regr. D = 20 min r = f | D = 20 minD = 25 min Regr. D = 25 min r = f | D = 25 minD = 30 min Regr. D = 30 min r = f | D = 30 minD = 35 min Regr. D = 35 min r = f | D = 35 minD = 40 min Regr. D = 40 min r = f | D = 40 minD = 45 min Regr. D = 45 min r = f | D = 45 minD = 50 min Regr. D = 50 min r = f | D = 50 minD = 55 min Regr. D = 55 min r = f | D = 55 minD = 60 min Regr. D = 60 min r = f | D = 60 minD = 65 min Regr. D = 65 min r = f | D = 65 minD = 70 min Regr. D = 70 min r = f | D = 70 minD = 75 min Regr. D = 75 min r = f | D = 75 minD = 80 min Regr. D = 80 min r = f | D = 80 minD = 85 min Regr. D = 85 min r = f | D = 85 minD = 90 min Regr. D = 90 min r = f | D = 90 minD = 95 min Regr. D = 95 min r = f | D = 95 minD = 100 min Regr. D = 100 min r = f | D = 100 minD = 105 min Regr. D = 105 min r = f | D = 105 minD = 110 min Regr. D = 110 min r = f | D = 110 minD = 115 min Regr. D = 115 min r = f | D = 115 minD = 120 min Regr. D = 120 min r = f | D = 120 minReihe52 Reihe53 Reihe54D = 5-60 min fmax fmin
Versickerungsrate in Abhängigkeit von Regenhöhe und -dauer
DV-Pflaster mit schmalem Fugenbild | 2,5% Gefällestarke Kolmation | 400 g/m² Quarzmehl
0
10
20
30
40
50
60
70
80
0 5 10 15 20 25 30
Regenhöhe [mm]
Ve
rsic
ke
run
gs
rate
f
[l/(
sh
a)]
infi
ltra
tio
n r
ate
[l
/(s
ha)
cumulative rain height [l/(sha) cumulative rain height [l/(sha)
infi
ltra
tio
n r
ate
[l
/(s
ha)
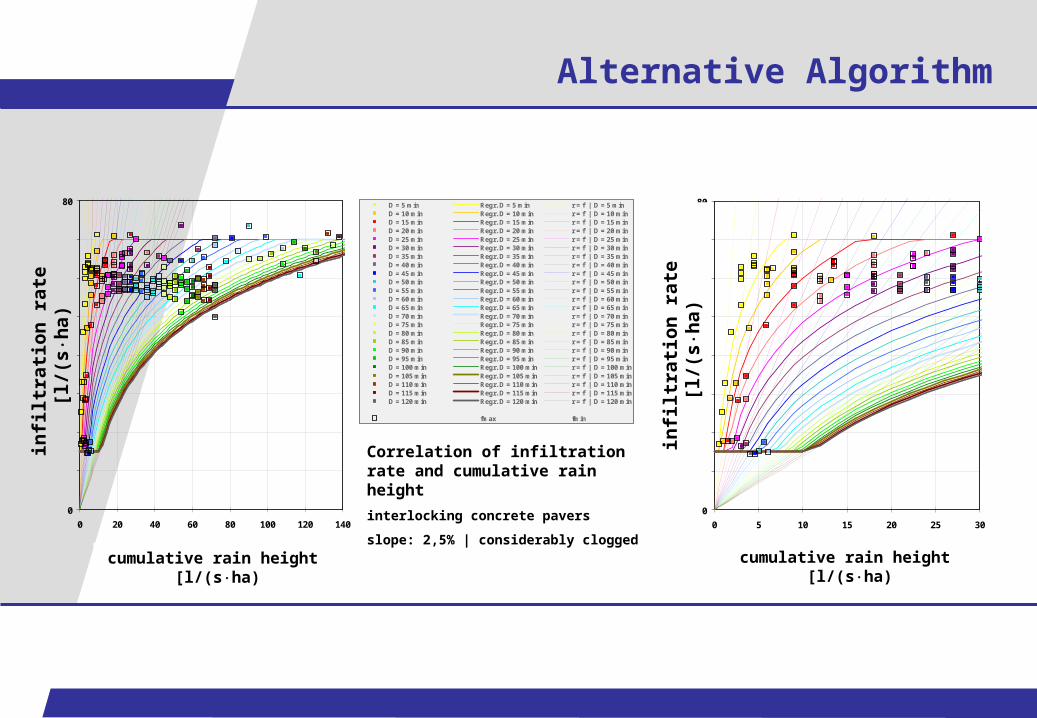
Correlation of infiltration rate and cumulative rain height
interlocking concrete pavers
slope: 2,5% | considerably clogged
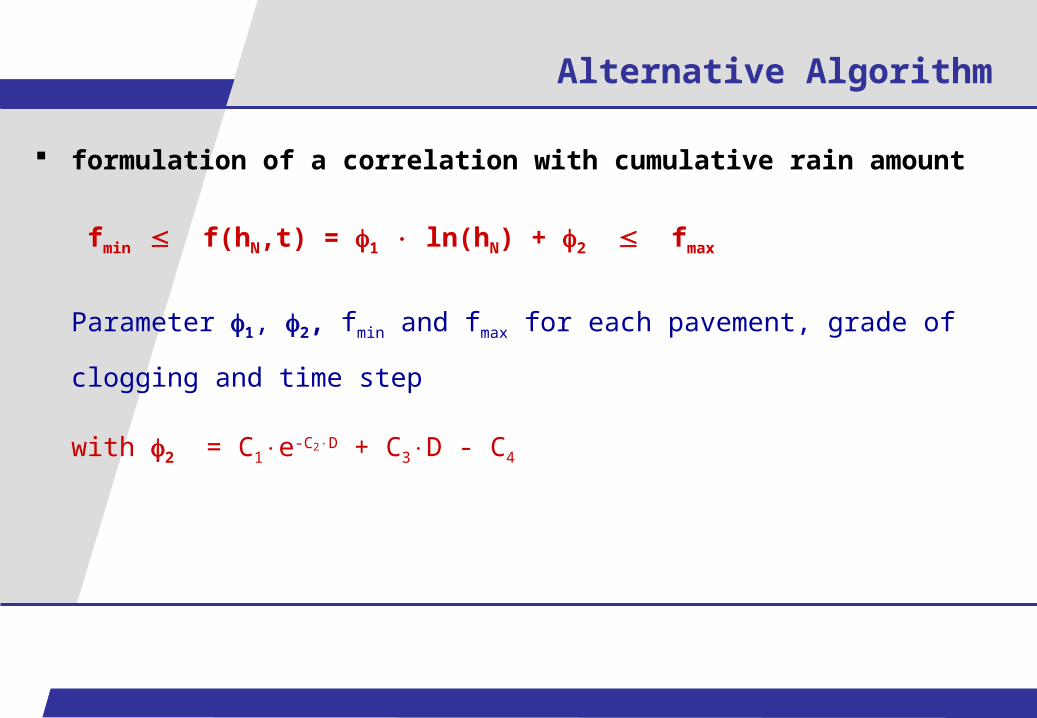
Alternative Algorithm
formulation of a correlation with cumulative rain amount
fmin f(hN,t) = 1 ln(hN) + 2 fmax
Parameter 1, 2, fmin and fmax for each pavement, grade of clogging
and time step
with 2 = C1e-C2D + C3D - C4

Analysis Lab Tests: FP
tests on concrete flagstone pavement
• 3 types of common flagstone pavement (FP) size: 30x30 cm, 40x40 cm and 50x50 cm
opening ratios: 1,8%, 1,2%, 0,6%
• new & considerably clogged pavement
• surface slope: 2,5%
• various rain intensities
• additional tests on pavement on low permeable subgrade
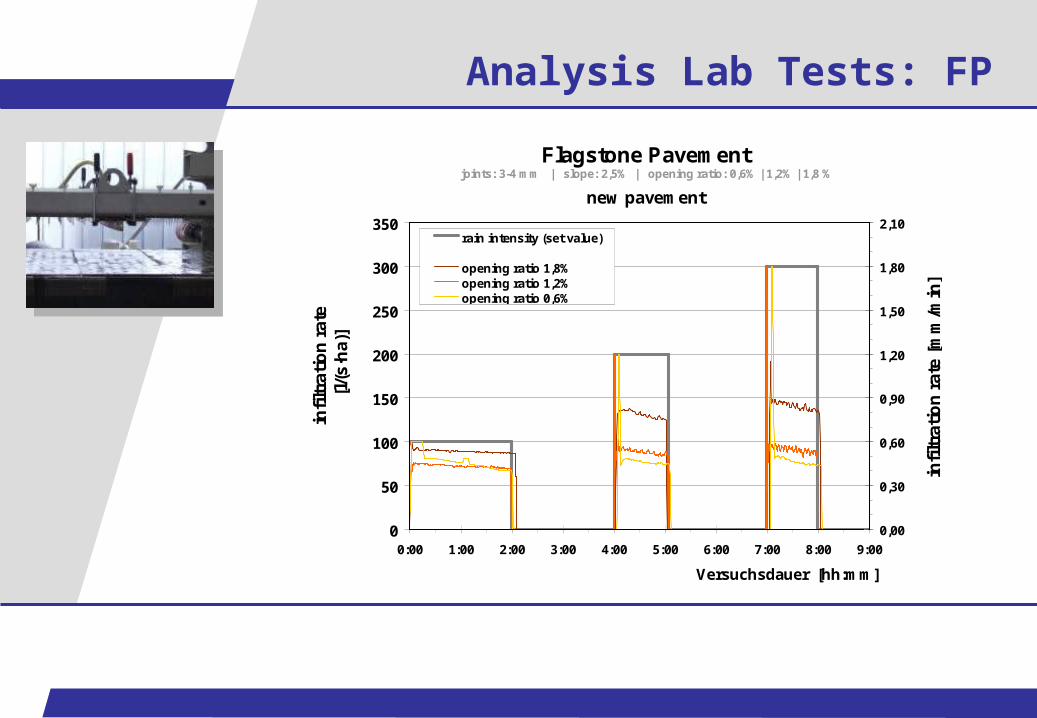
Flagstone Pavement joints: 3-4 mm | slope: 2,5% | opening ratio: 0,6% | 1,2% | 1,8 %
new pavement
0
50
100
150
200
250
300
350
0:00 1:00 2:00 3:00 4:00 5:00 6:00 7:00 8:00 9:00
Versuchsdauer [hh:mm]
infi
ltra
tio
n r
ate
[l/
(s∙h
a)]
0,00
0,30
0,60
0,90
1,20
1,50
1,80
2,10
infi
ltra
tio
n r
ate
[m
m/m
in]
rain intensity (set value)opening ratio 0,6%opening ratio 1,8%opening ratio 1,2%opening ratio 0,6%
Analysis Lab Tests: FP
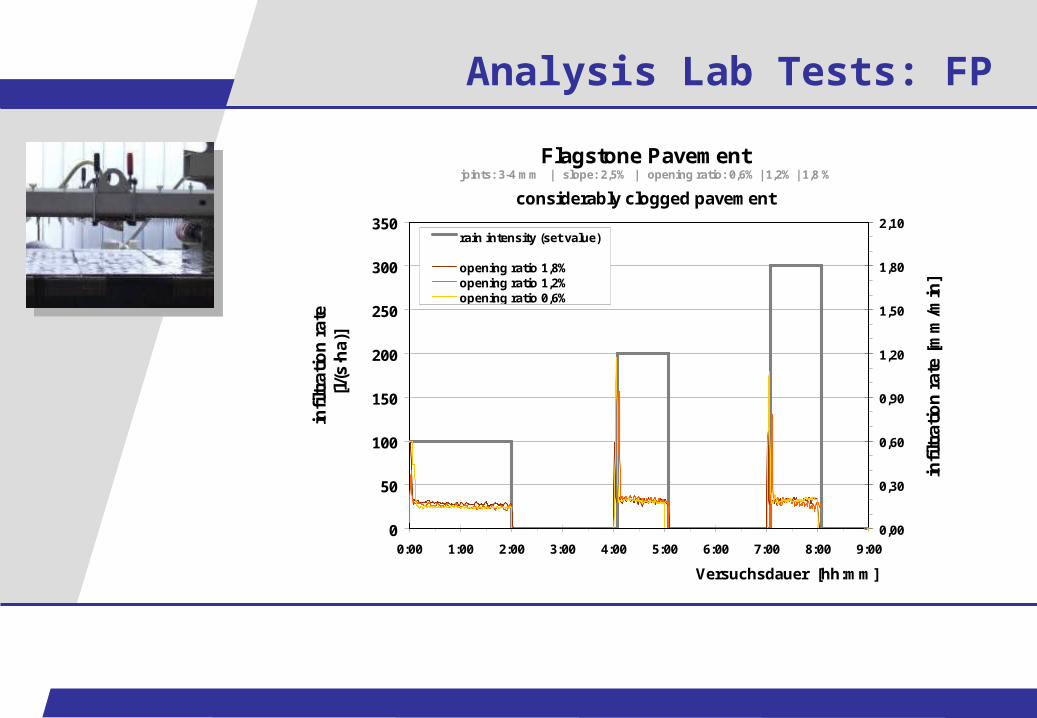
Flagstone Pavement joints: 3-4 mm | slope: 2,5% | opening ratio: 0,6% | 1,2% | 1,8 %
considerably clogged pavement
0
50
100
150
200
250
300
350
0:00 1:00 2:00 3:00 4:00 5:00 6:00 7:00 8:00 9:00
Versuchsdauer [hh:mm]
infi
ltra
tio
n r
ate
[l/
(s∙h
a)]
0,00
0,30
0,60
0,90
1,20
1,50
1,80
2,10
infi
ltra
tio
n r
ate
[m
m/m
in]
rain intensity (set value)opening ratio 0,6%opening ratio 1,8%opening ratio 1,2%opening ratio 0,6%
Analysis Lab Tests: FP

Flagstone Pavement joints: 3-4 mm slope: 2,5% opening ratio: 0,6% / 1,2% | 1,8 %
rain period D = 15 min
0
20
40
60
80
100
120
140
160
180
200
220
0 50 100 150 200 250 300 350
rain intensity [l/(sha)]
infi
ltra
tio
n r
ate
[l/(
sh
a)]
reference line: r = i
Reihe9
OR = 1,8% (new pavement)
OR = 1,2% (new pavement)
OR = 0,6% (new pavement)
Reihe7
OR = 1,8% (clogged pavement)
OR = 1,2% (clogged pavement)
OR = 0,6% (clogged pavement)
impact of rain intensity
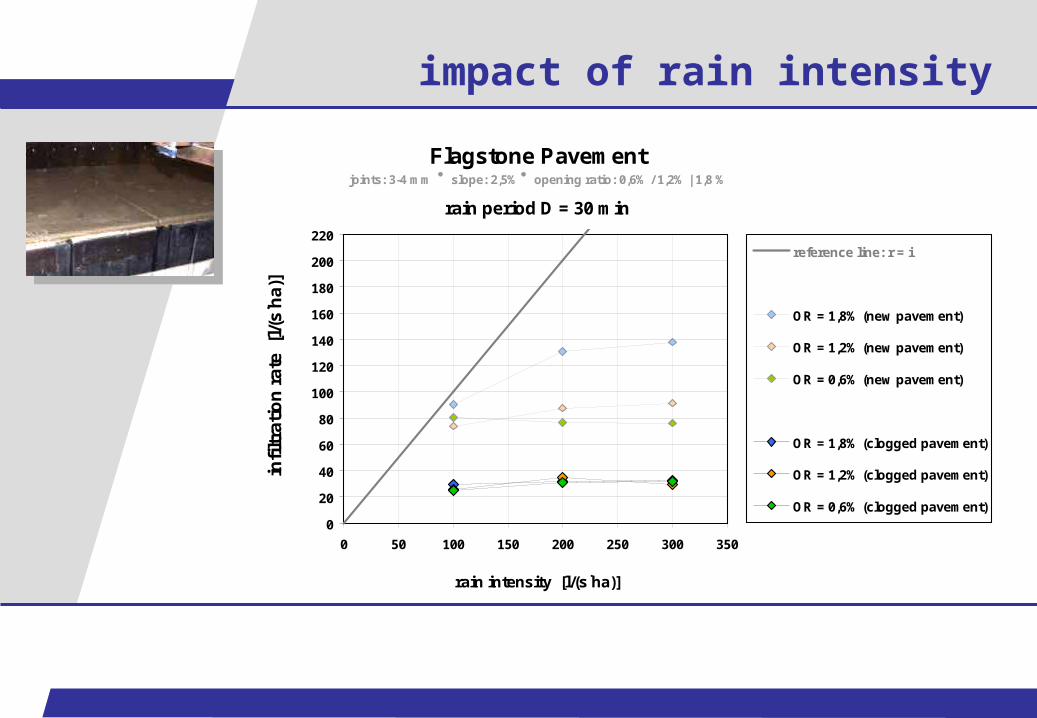
Flagstone Pavement joints: 3-4 mm slope: 2,5% opening ratio: 0,6% / 1,2% | 1,8 %
rain period D = 30 min
0
20
40
60
80
100
120
140
160
180
200
220
0 50 100 150 200 250 300 350
rain intensity [l/(sha)]
infi
ltra
tio
n r
ate
[l/(
sh
a)]
reference line: r = i
Reihe9
OR = 1,8% (new pavement)
OR = 1,2% (new pavement)
OR = 0,6% (new pavement)
Reihe7
OR = 1,8% (clogged pavement)
OR = 1,2% (clogged pavement)
OR = 0,6% (clogged pavement)
impact of rain intensity

impact of rain height
Flagstone Pavementflagstones 30x30 | 40x40 | 50x50 cm
opening ratios 0,6% | 1,2% | 1,8%
rain duration D = 30 min
y = 17,368Ln(x) + 18,045
R2 = 0,1471
y = 0,1211x + 25,772
R2 = 0,3665
0
20
40
60
80
100
120
140
160
180
200
0 10 20 30 40 50 60
cumulative rain height [mm]
new pavement
clogged pavement
Linear (new pavement)
Linear (cloggedpavement)
Flagstone Pavementflagstones 30x30 | 40x40 | 50x50 cm
opening ratios 0,6% | 1,2% | 1,8%
rain duration D = 15 min
y = 17,368Ln(x) + 18,045
R2 = 0,1471
y = 0,3028x + 25,95
R2 = 0,3782
0
20
40
60
80
100
120
140
160
180
200
0 5 10 15 20 25 30
cumulative rain height [mm]
infi
ltra
tio
n r
ate
[l/(
sh
a)]
new pavement
clogged pavement
Linear (new pavement)
Linear (cloggedpavement)
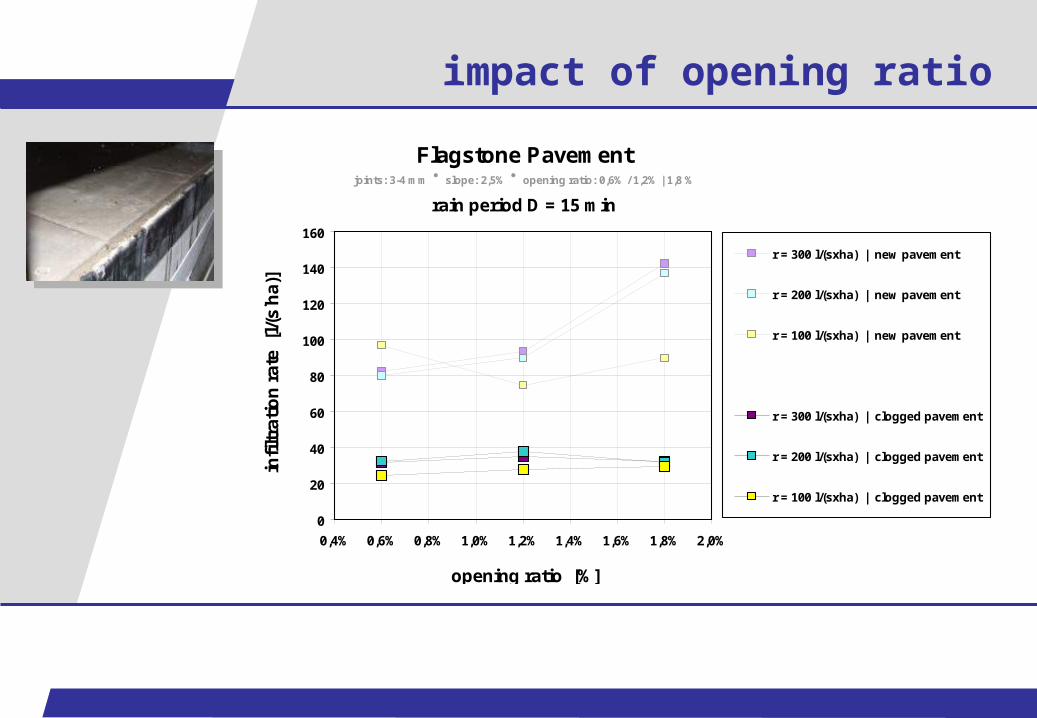
impact of opening ratio
Flagstone Pavement joints: 3-4 mm slope: 2,5% opening ratio: 0,6% / 1,2% | 1,8 %
rain period D = 15 min
0
20
40
60
80
100
120
140
160
0,4% 0,6% 0,8% 1,0% 1,2% 1,4% 1,6% 1,8% 2,0%
opening ratio [%]
infi
ltra
tio
n r
ate
[l/(
sh
a)]
r = 300 l/(sxha) | new pavement
r = 200 l/(sxha) | new pavement
r = 100 l/(sxha) | new pavement
Reihe7
r = 300 l/(sxha) | clogged pavement
r = 200 l/(sxha) | clogged pavement
r = 100 l/(sxha) | clogged pavement
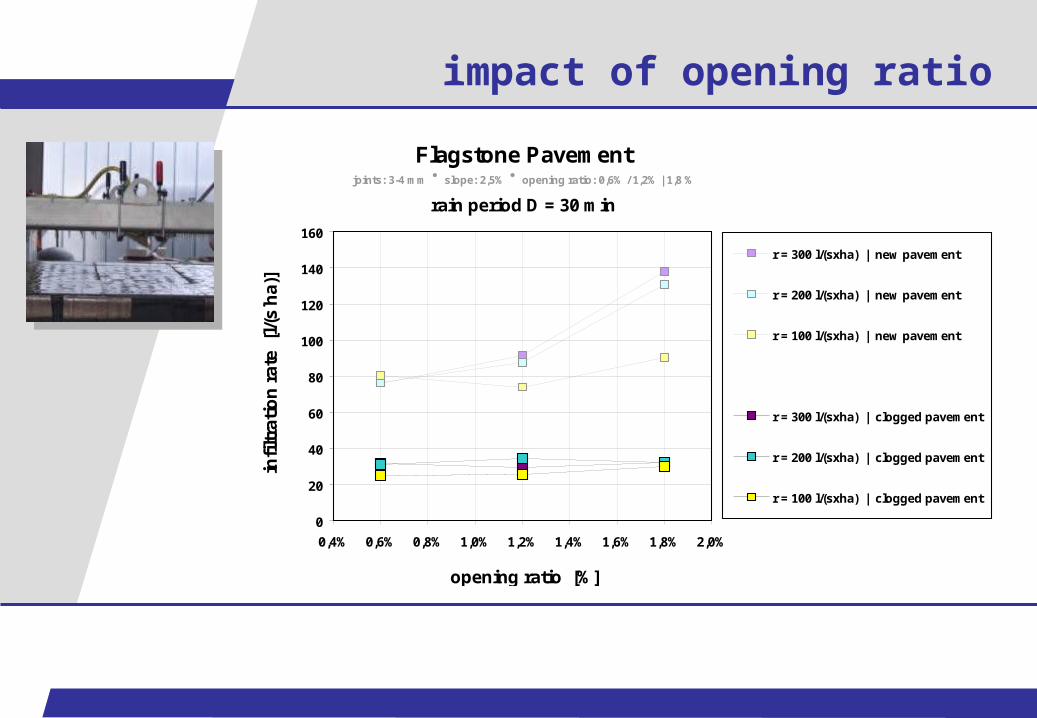
Flagstone Pavement joints: 3-4 mm slope: 2,5% opening ratio: 0,6% / 1,2% | 1,8 %
rain period D = 30 min
0
20
40
60
80
100
120
140
160
0,4% 0,6% 0,8% 1,0% 1,2% 1,4% 1,6% 1,8% 2,0%
opening ratio [%]
infi
ltra
tio
n r
ate
[l/(
sh
a)]
r = 300 l/(sxha) | new pavement
r = 200 l/(sxha) | new pavement
r = 100 l/(sxha) | new pavement
Reihe7
r = 300 l/(sxha) | clogged pavement
r = 200 l/(sxha) | clogged pavement
r = 100 l/(sxha) | clogged pavement
impact of opening ratio
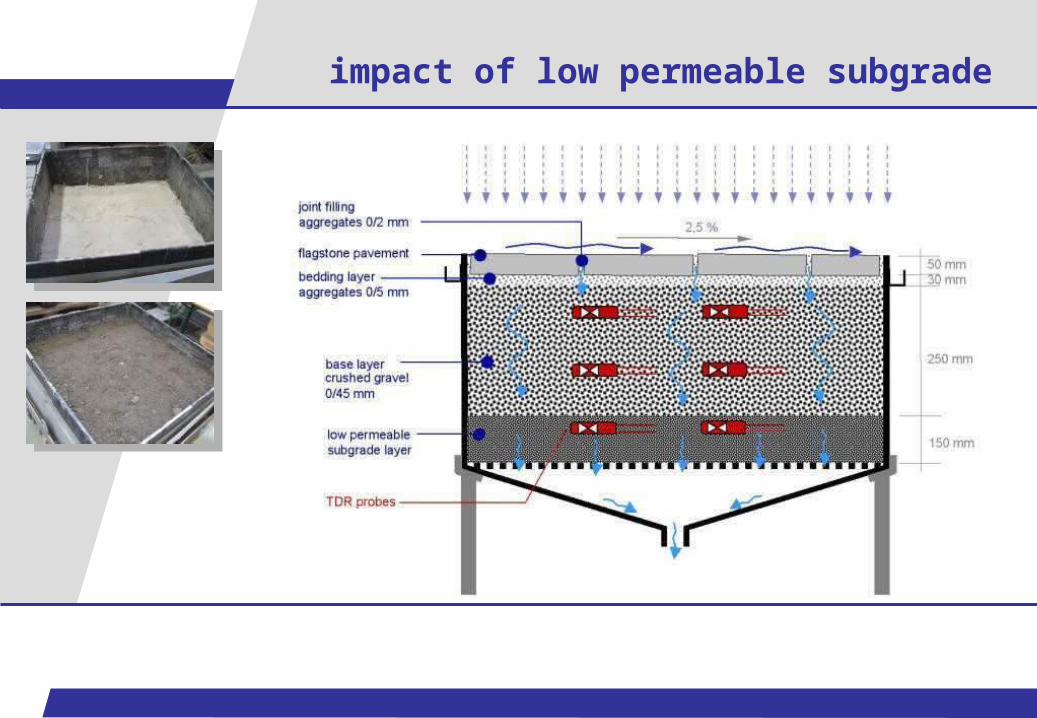
impact of low permeable subgrade
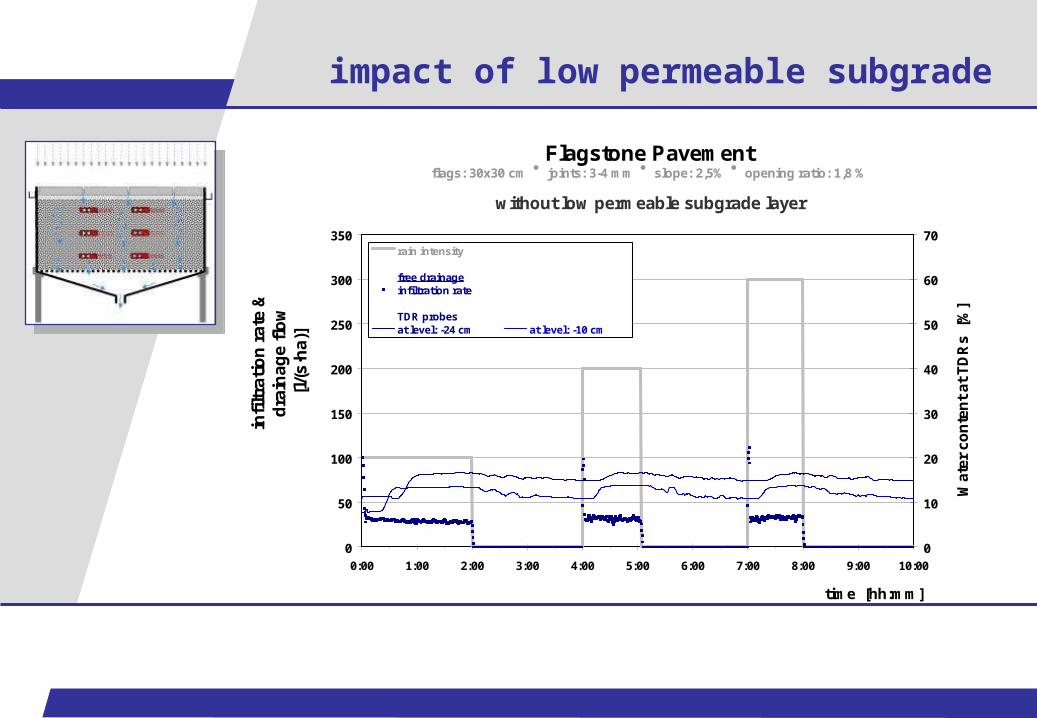
Flagstone Pavement
flags: 30x30 cm joints: 3-4 mm slope: 2,5% opening ratio: 1,8 %
without low permeable subgrade layer
0
50
100
150
200
250
300
350
0:00 1:00 2:00 3:00 4:00 5:00 6:00 7:00 8:00 9:00 10:00
time [hh:mm]
infi
ltra
tio
n r
ate
&
dra
ina
ge
flo
w
[l/(
s∙h
a)]
0
10
20
30
40
50
60
70
Wat
er
co
nte
nt
at T
DR
s [
%]
rain intensity Reihe1Reihe13 Reihe10free drainage low permeable baseinfiltration rate Reihe9Reihe11 TDR probesTDR probes Reihe4at level: -24 cm at level: -10 cm
impact of low permeable subgrade
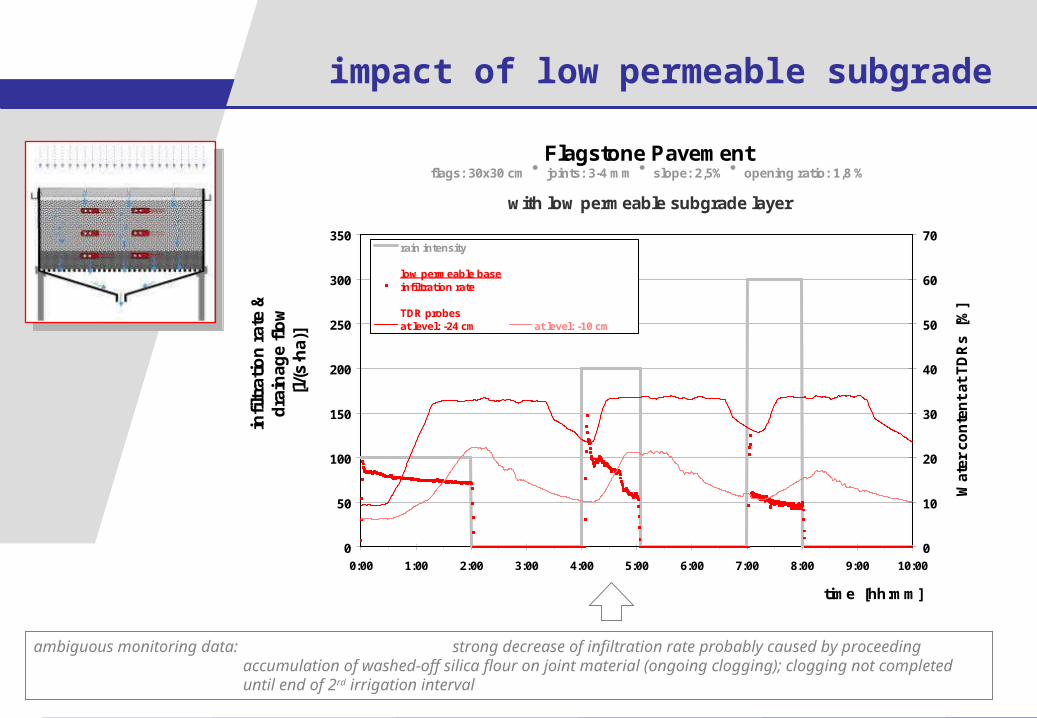
Flagstone Pavement
flags: 30x30 cm joints: 3-4 mm slope: 2,5% opening ratio: 1,8 %
with low permeable subgrade layer
0
50
100
150
200
250
300
350
0:00 1:00 2:00 3:00 4:00 5:00 6:00 7:00 8:00 9:00 10:00
time [hh:mm]
infi
ltra
tio
n r
ate
&
dra
ina
ge
flo
w
[l/(
s∙h
a)]
0
10
20
30
40
50
60
70
Wat
er
co
nte
nt
at T
DR
s [
%]
rain intensity Reihe1Reihe13 Reihe10low permeable base free drainageinfiltration rate Reihe9Reihe11 TDR probesTDR probes Reihe2at level: -24 cm at level: -10 cm
ambiguous monitoring data: strong decrease of infiltration rate probably caused by proceeding accumulation of washed-off silica flour on joint material (ongoing clogging); clogging not completed until end of 2 rd irrigation interval
impact of low permeable subgrade
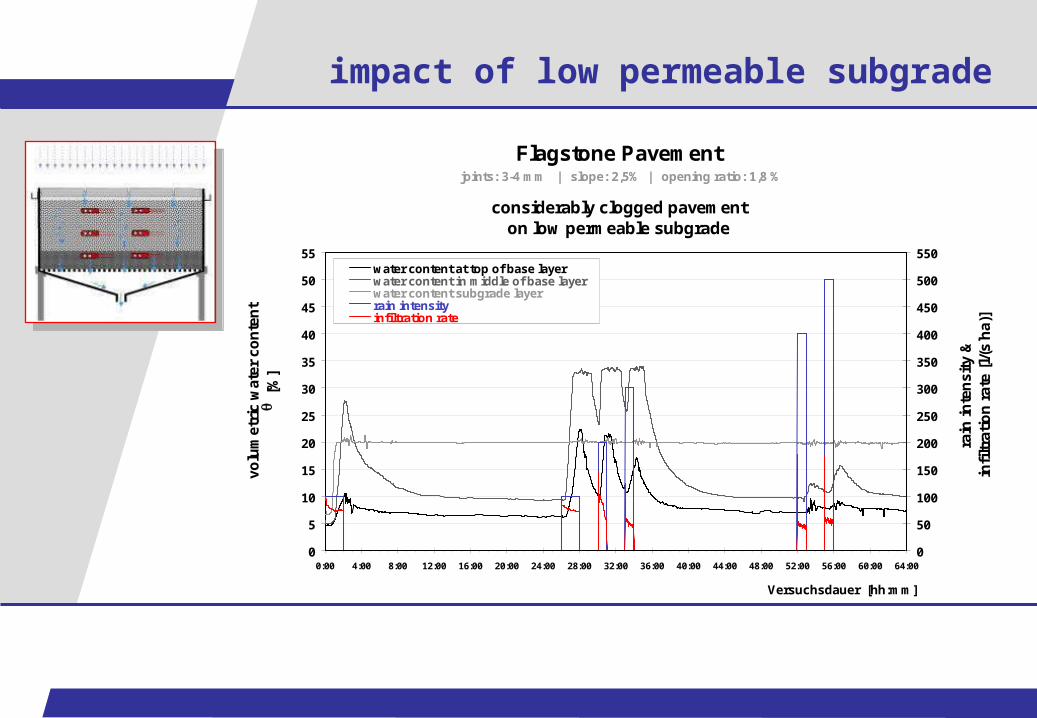
impact of low permeable subgrade
Flagstone Pavement joints: 3-4 mm | slope: 2,5% | opening ratio: 1,8 %
considerably clogged pavement on low permeable subgrade
0
5
10
15
20
25
30
35
40
45
50
55
0:00 4:00 8:00 12:00 16:00 20:00 24:00 28:00 32:00 36:00 40:00 44:00 48:00 52:00 56:00 60:00 64:00
Versuchsdauer [hh:mm]
volu
met
ric
wat
er c
on
ten
t
[
%]
0
50
100
150
200
250
300
350
400
450
500
550
rain
in
ten
sity
&
infi
ltra
tio
n r
ate
[l/(
sh
a)]
water content at top of base layerwater content in middle of base layerwater content subgrade layerrain intensityinfiltration rate

impact of low permeable subgrade
Flagstone Pavementflags: 30x30 cm joints: 3-4 mm slope: 2,5% opening ratio: 1,8 %
with & without low permeable subgrade layer
0
50
100
150
200
250
300
350
0:00 1:00 2:00 3:00 4:00 5:00 6:00 7:00 8:00 9:00 10:00
time [hh:mm]
infi
ltra
tio
n r
ate
& d
rain
age
flo
w
[l/(
s∙h
a)]
rain intensity (set value) Reihe1Reihe13 Reihe10low permeable base Reihe14infiltration rate drainage flow rateReihe9 Reihe11free drainage Reihe12infiltration rate drainage flow rate
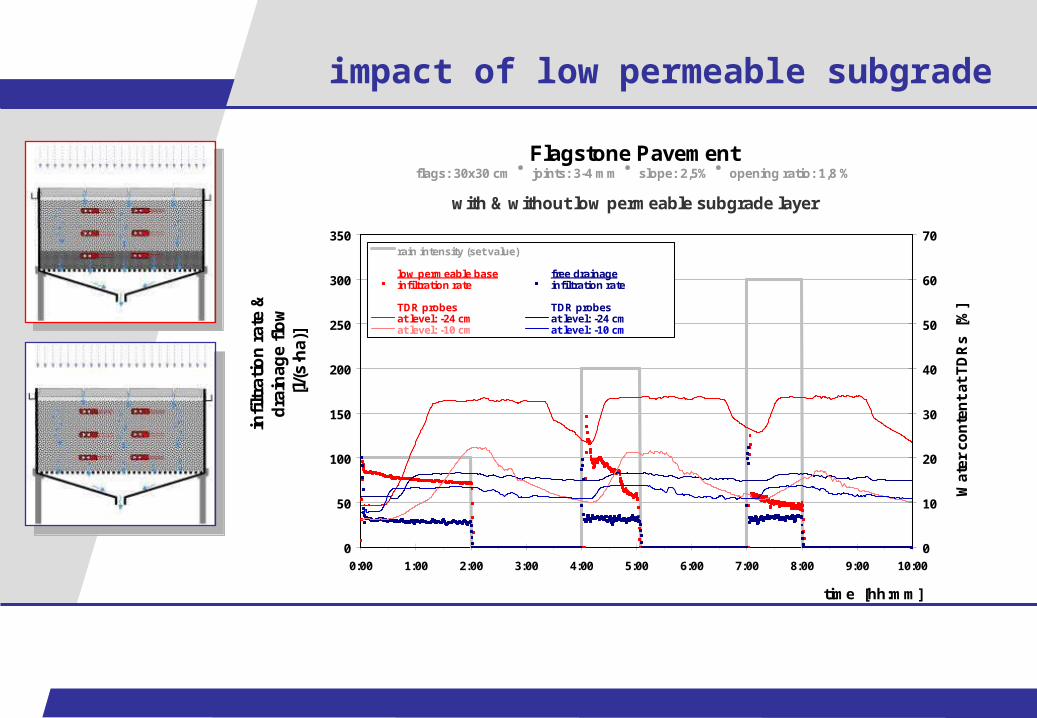
Flagstone Pavement
flags: 30x30 cm joints: 3-4 mm slope: 2,5% opening ratio: 1,8 %
with & without low permeable subgrade layer
0
50
100
150
200
250
300
350
0:00 1:00 2:00 3:00 4:00 5:00 6:00 7:00 8:00 9:00 10:00
time [hh:mm]
infi
ltra
tio
n r
ate
&
dra
ina
ge
flo
w
[l/(
s∙h
a)]
0
10
20
30
40
50
60
70
Wat
er
co
nte
nt
at T
DR
s [
%]
rain intensity (set value) Reihe1Reihe13 Reihe10low permeable base free drainageinfiltration rate infiltration rateReihe9 Reihe11TDR probes TDR probesat level: -24 cm at level: -24 cmat level: -10 cm at level: -10 cm
impact of low permeable subgrade

Runoff Coefficients
Peak Runoff Coefficient PR
Flagstone Pavementslope: 2,5% | considerably clogged
0,00
0,10
0,20
0,30
0,40
0,50
0,60
0,70
0,80
0,90
1,00
0 100 200 300 400 500 600 700 800
rain intensity [l/(sha)]
pe
ak
ru
no
ff c
oe
ffic
ien
t
PR
[-]
considerably clogged pavement
moderately clogged pavement
new pavement
Runoff Coefficients
peak runoff coefficients
• PR = qrunoff / r
• depending on particular rain intensity not a fix value!
• depending on particular state of clogging
• example: r = 100 l/(sha)
PR = 0,20 0,70 (huge variation!)

Assessment Flagstone Pavement
impacts on infiltration rate
• rain intensity as well as opening ratio have only for new pavements a significant impact (infiltration rates of 70 – 140 l/(sha))
• for clogged flag pavements the infiltration rate is more or less independent of rain intensity and cumulative rain height (~ 30 l/(sha))
• for clogged flag pavements with small joints the infiltration rate is also independent of the ratio of openings or the diameter of the joints
• state of clogging is the most governing impact on the infiltration capacity (30 – 140 l/(sha))
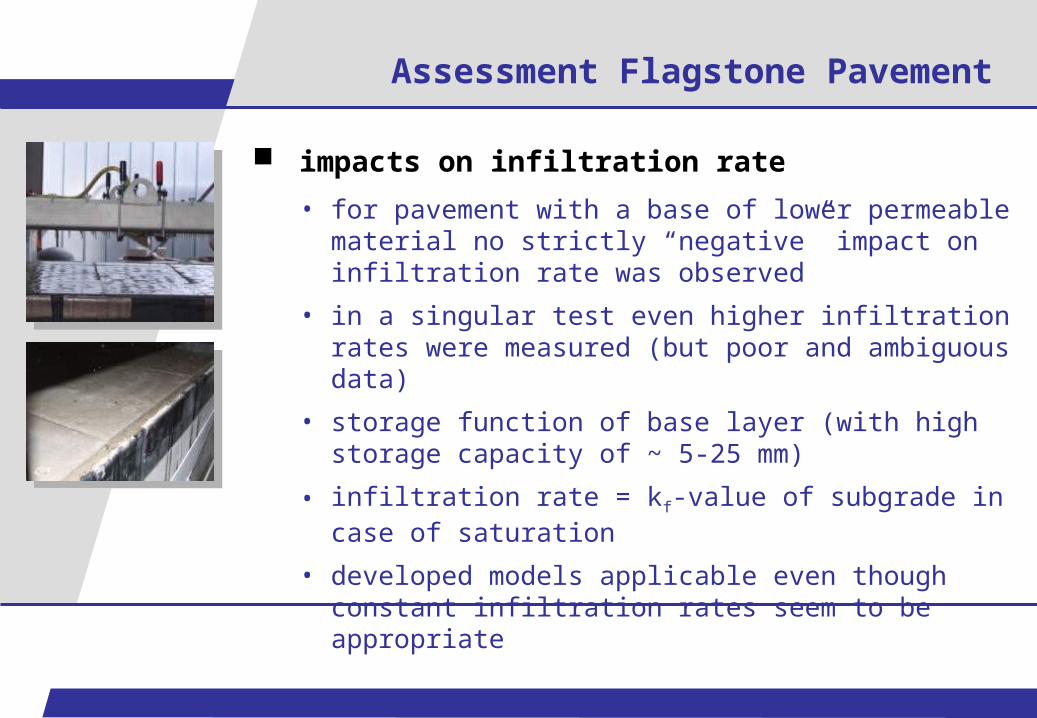
Assessment Flagstone Pavement
impacts on infiltration rate
• for pavement with a base of lower permeable material no strictly “negative” impact on infiltration rate was observed
• in a singular test even higher infiltration rates were measured (but poor and ambiguous data)
• storage function of base layer (with high storage capacity of ~ 5-25 mm)
• infiltration rate = kf-value of subgrade in case of saturation
• developed models applicable even though constant infiltration rates seem to be appropriate
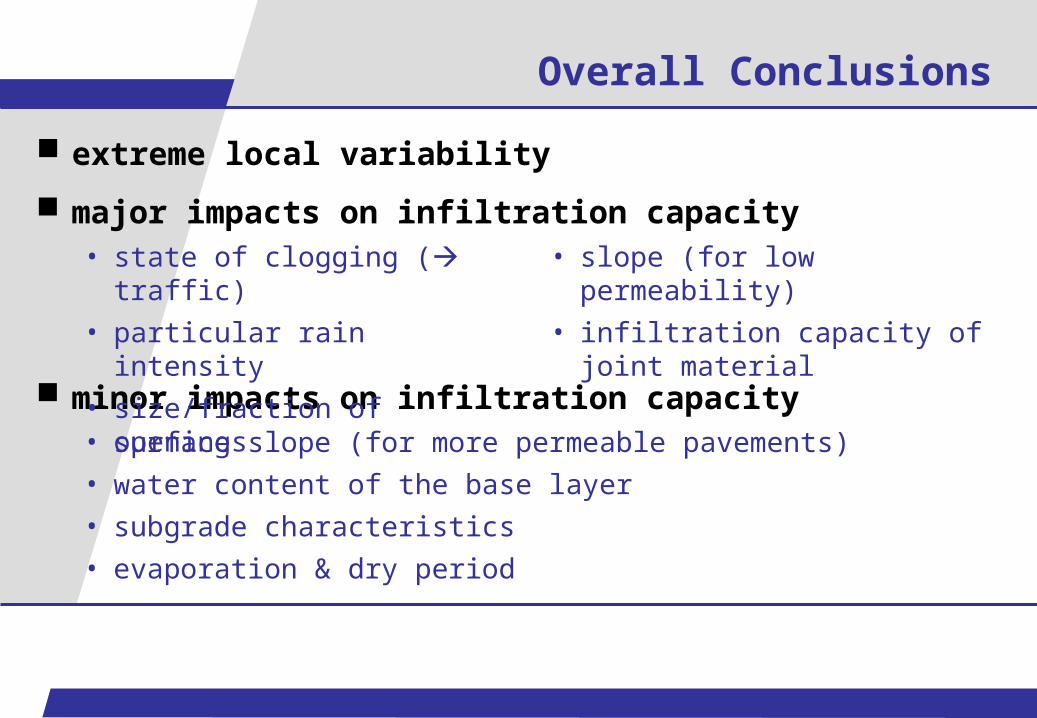
minor impacts on infiltration capacity• surface slope (for more permeable pavements)• water content of the base layer• subgrade characteristics• evaporation & dry period
Overall Conclusions
extreme local variability
major impacts on infiltration capacity• state of clogging ( traffic)• particular rain intensity • size/fraction of openings
• slope (for low permeability)• infiltration capacity of joint
material

Summary & Outlook
broad and reliable data base– field and lab experiments + fe-simulation– quantification of major processes, interactions and
characteristic values
evaluation & modelling of stormwater runoff– mean and peak runoff coefficients– advanced modelling algorithm
outlook– additional field measurements & simulations– compilation & analysis of a data pool (stochastic aspects)
Recommended