CHEMICAL ENGINEERING TRANSACTIONS
VOL. 52, 2016
A publication of
The Italian Association of Chemical Engineering Online at www.aidic.it/cet
Guest Editors: Petar Sabev Varbanov, Peng-Yen Liew, Jun-Yow Yong, Jiří Jaromír Klemeš, Hon Loong Lam Copyright © 2016, AIDIC Servizi S.r.l.,
ISBN 978-88-95608-42-6; ISSN 2283-9216
Ru-containing Catalysts in Hydrogenation of D-glucose in
Flow-type Microreactor
Esther M. Sulman*, Valentin Yu. Doluda, Valentina G. Matveeva, Maxim E.
Grigorev, Mikhail G. Sulman, Alexey V. Bykov
Tver Technical University, Dep. Biotechnology and Chemistry, A.Nikitina str. 22, 170026, Tver, Russia.
The samples of ruthenium impregnated in hypercrosslinked polystyrene and activated carbon were tested in
D-glucose hydrogenation using mini reactror systems. Catalysts were characterized by nitrogen physisorption,
X-Ray photoelectron spectroscopy, hydrogen chemisorption, X-Ray fluorescence analysis. Physicochemical
changes of the studied catalysts are shown during the catalysts stability investigation. A strong influence of the
reactor type on the catalysts stability in D-glucose hydrogenation is discussed.
1. Introduction
D-glucose catalytic hydrogenation to D-sorbitol can be considered a promising step in cellulose feedstock
transformation technology to fuel components and valuable chemicals (Mishra et al., 2012). Besides D-sorbitol
has wide application in food, nutrition and chemical industries. Traditionally D-glucose is hydrogenated in bath
reactor systems using Ru, Ni, Pd impregnated over different organic and inorganic supports (Aho et al., 2015).
The catalysts based on active metals incorporated in a different type of carbon supports are more selective
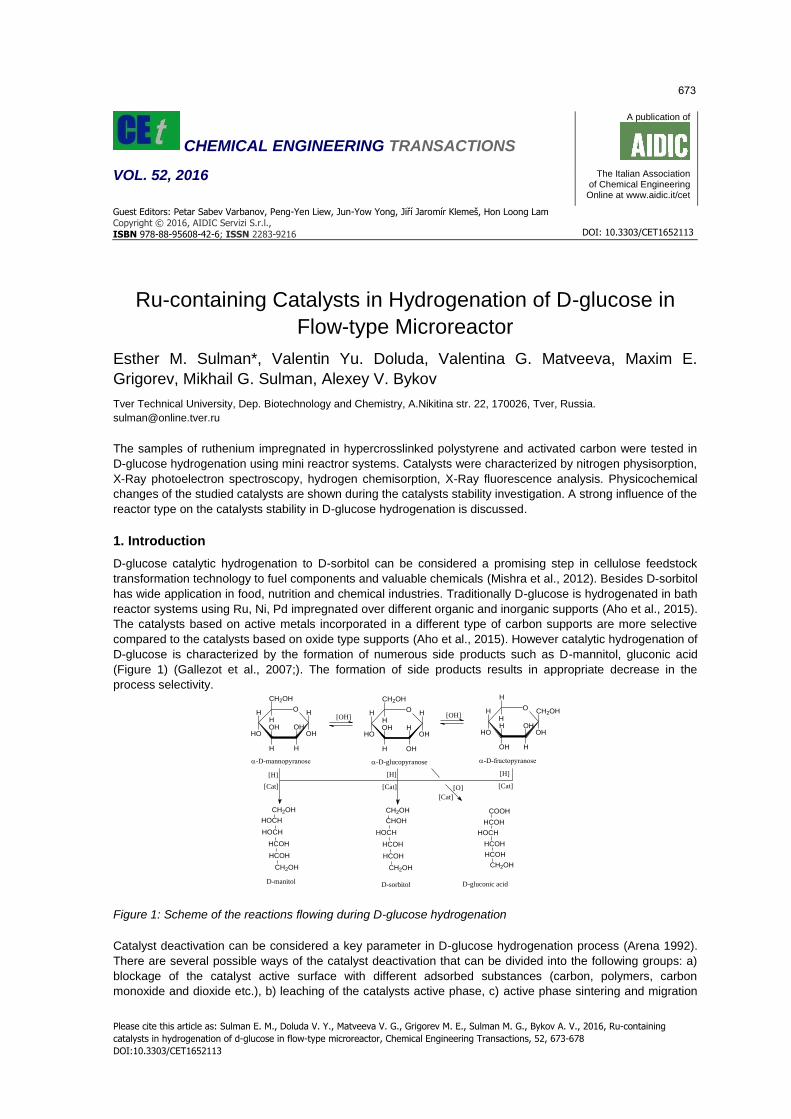
compared to the catalysts based on oxide type supports (Aho et al., 2015). However catalytic hydrogenation of
D-glucose is characterized by the formation of numerous side products such as D-mannitol, gluconic acid
(Figure 1) (Gallezot et al., 2007;). The formation of side products results in appropriate decrease in the
process selectivity.
Figure 1: Scheme of the reactions flowing during D-glucose hydrogenation
Catalyst deactivation can be considered a key parameter in D-glucose hydrogenation process (Arena 1992).
There are several possible ways of the catalyst deactivation that can be divided into the following groups: a)
blockage of the catalyst active surface with different adsorbed substances (carbon, polymers, carbon
monoxide and dioxide etc.), b) leaching of the catalysts active phase, c) active phase sintering and migration
O
CH2OH
H
OH
HOH
H
HO
H H
OH
COOH
HCOH
HOCH
HCOH
HCOH
CH2OH
O
H
H
H
OHH
OH
HO
H CH2OH
OH
O
CH2OH
H
H
OHOH
H
HO
H H
OH
CH2OH
HOCH
HOCH
HCOH
HCOH
CH2OH
CH2OH
CHOH
HOCH
HCOH
HCOH
CH2OH
-D-glucopyranose-D-mannopyranose -D-fructopyranose
D-manitol D-sorbitol D-gluconic acid
[Cat]
[H][H][H]
[Cat] [Cat]
[OH][OH]
[O]
[Cat]
DOI: 10.3303/CET1652113
Please cite this article as: Sulman E. M., Doluda V. Y., Matveeva V. G., Grigorev M. E., Sulman M. G., Bykov A. V., 2016, Ru-containing catalysts in hydrogenation of d-glucose in flow-type microreactor, Chemical Engineering Transactions, 52, 673-678 DOI:10.3303/CET1652113
673
d) change of the catalysts active phase structure, e) mechanical catalysts abrasion (Worstell 2014). The
insight in the catalyst deactivation of D-glucose hydrogenation process can be valuable for the development of
new stable catalysts. The results of such study for Ru based catalysts are described in the paper.
2. Materials and methods
2.1 Materials Reagent grade hydrogen of 99.99 % purity, sodium hydrogen carbonate (NaHCO3), reagent-grade THF,
methanol, activated carbon (designated as ACC), glucose, sorbitol, maltose, maltitol, gluconic acid, acetone
were purchased from local supplier and were used as received. Ruthenium hydroxychloride (Ru(OH)Cl3) was
purchased from Aurat Ltd (Moscow, Russia). The distilled water was purified with Aqua post water purification
system. Hypercrosslinked polystyrene (HPS) was purchased from Purolite Int. (U.K.), as Macronet MN 100.
1-2 mm polymer and ACC granules were washed with acetone and water twice and dried under vacuum for
24 h.
2.2 Catalyst synthesis
Prior to the catalyst synthesis ACC and HPS samples were ground and fraction 0.12 mm was taken for
preparation. Carbon and HPS based catalysts were prepared by the impregnation of supports with ruthenium
hydroxychloride in a complex solution. The complex solution consisted of 5 mL of THF, 1 mL of water and
1 mL of methanol. In a typical synthesis, 0.21 g Ru(OH)Cl3 was dissolved under nitrogen into 7 mL of a
complex solvent, to which 3 g of ACC or MN-100 were added. The suspension was continuously stirred for 10
min to allow the adsorption of the solution by the support, which was then dried at 75 °C for 1 h. The catalysts
were reduced in hydrogen for 3 hours at 300 °C. Ru content was found to be 2.9 and 2.85 wt. % for ACC and
HPS based catalysts by XRF elemental analysis. Samples were designated as HPS-Ru-3%, ACC-Ru-3%
(Table 1).
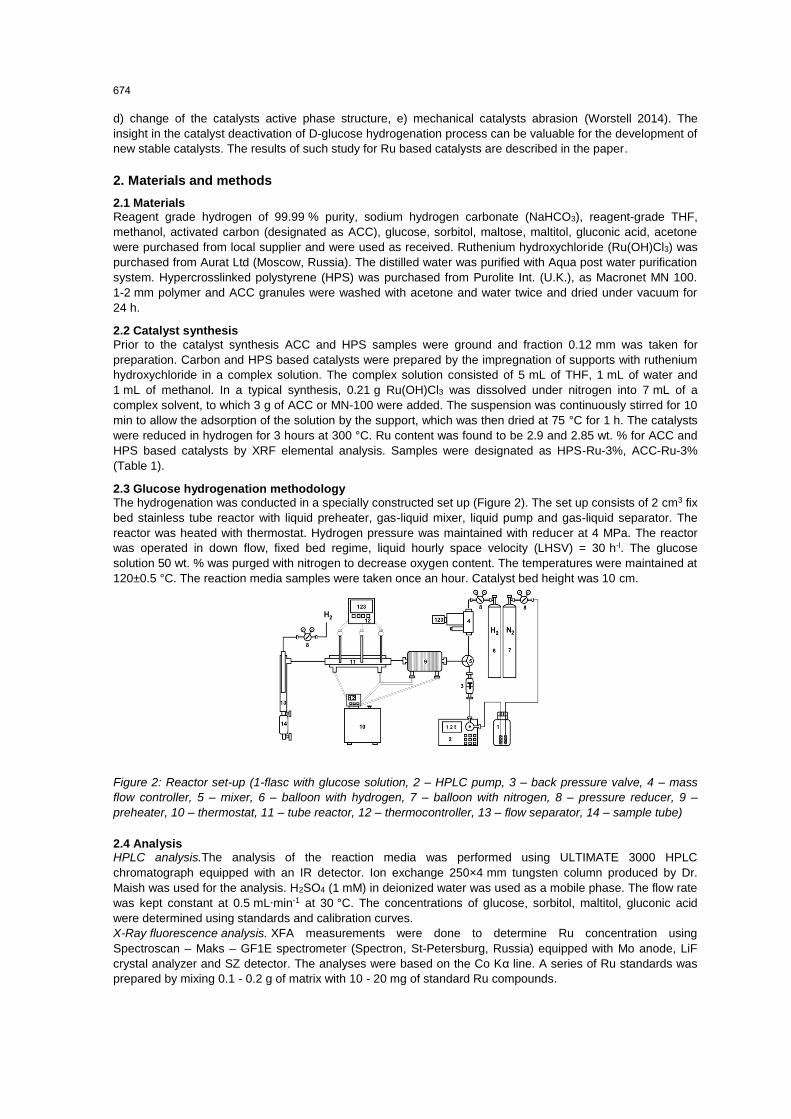
2.3 Glucose hydrogenation methodology The hydrogenation was conducted in a specially constructed set up (Figure 2). The set up consists of 2 cm3 fix
bed stainless tube reactor with liquid preheater, gas-liquid mixer, liquid pump and gas-liquid separator. The
reactor was heated with thermostat. Hydrogen pressure was maintained with reducer at 4 MPa. The reactor
was operated in down flow, fixed bed regime, liquid hourly space velocity (LHSV) = 30 h-l. The glucose
solution 50 wt. % was purged with nitrogen to decrease oxygen content. The temperatures were maintained at
120±0.5 °C. The reaction media samples were taken once an hour. Catalyst bed height was 10 cm.
Figure 2: Reactor set-up (1-flasc with glucose solution, 2 – HPLC pump, 3 – back pressure valve, 4 – mass
flow controller, 5 – mixer, 6 – balloon with hydrogen, 7 – balloon with nitrogen, 8 – pressure reducer, 9 –
preheater, 10 – thermostat, 11 – tube reactor, 12 – thermocontroller, 13 – flow separator, 14 – sample tube)
2.4 Analysis HPLC analysis.The analysis of the reaction media was performed using ULTIMATE 3000 HPLC
chromatograph equipped with an IR detector. Ion exchange 250×4 mm tungsten column produced by Dr.
Maish was used for the analysis. H2SO4 (1 mM) in deionized water was used as a mobile phase. The flow rate
was kept constant at 0.5 mL∙min-1 at 30 °C. The concentrations of glucose, sorbitol, maltitol, gluconic acid
were determined using standards and calibration curves.
X-Ray fluorescence analysis. XFA measurements were done to determine Ru concentration using
Spectroscan – Maks – GF1E spectrometer (Spectron, St-Petersburg, Russia) equipped with Mo anode, LiF
crystal analyzer and SZ detector. The analyses were based on the Co Kα line. A series of Ru standards was
prepared by mixing 0.1 - 0.2 g of matrix with 10 - 20 mg of standard Ru compounds.
674
Liquid nitrogen physisorption.Nitrogen physisorption analysis was conducted at the normal boiling point of
liquid nitrogen using Beckman CoulterSA 3100 apparatus (Coulter Corporation, USA). Prior to the analysis,
samples were degassed in Becman Coulter SA-PREP apparatus for the sample preparation at 120 °C in
vacuum for 1 h.
X-ray photoelectron spectroscopy analysis. XPS data were obtained using Mg Kα (hν =1253.6 eV) radiation
with ES-2403 spectrometer modified with analyzer PHOIBOS 100 produced by SPECS (Germany). All the
data were obtained at an X-ray power of 200 W and an energy step of 0.1 eV. The samples were allowed to
outgas for 180 min before the analysis and were sufficiently stable during the examination. The data analysis
was performed by CasaXPS. Deconvolution of Ru based catalysts was made by simultaneous fitting of Ru 3p
and C1s+Ru 3d energy levels.
Chemisorption.The dispersion and the mean diameter of the ruthenium nanoparticles were measured by
hydrogen chemisorption. MicromeriticsAutoChem 2910 was used in the measurements. Prior to the analysis
the samples were purged in-situ at 300 °C for 2 h in a continuous flow of Ar. Thereafter the temperature was
decreased to 25 °C. Pulses of hydrogen (10 % H2 in Ar) were introduced into the sample and the amount of
non-sorbed hydrogen was measured. A ratio of H2:Ru = 2 was used in the calculations.
TEM analysis.TEM of catalysts was performed with a JEOL JEM1010 electron spectroscopic microscope
operated at accelerating voltage of 60 kV. Metal-containing HPS powders were embedded in epoxy resin and
subsequently microtomed at ambient temperature. Images of the resulting thin sections (ca. 50 nm thick) were
collected with the Gatan digital camera and analyzed with the Adobe Photoshop software package and the
Scion Image Processing Toolkit.
3. Results and Discussion
3.1 Initial catalysts physicochemical characterization results The synthesized catalysts are characterized by large surface areas typical for micro-mesoporous materials
(Table 1). Active metal dispersion is 32 % and 28 % for ACC-Ru-3% and HPS-Ru-3% samples. The
dispersion values correspond to particle sizes between 2-5 nm for ACC-Ru-3% and 2-8 nm for HPS-Ru-3%.
Ru is mainly presented in the +4 oxidation state in the form of ruthenium oxide.
Table 1: Initial catalysts characteristics
Catalyst characteristics ACC-Ru-3% HPS-Ru-3%
Surface area, m2/g 720 810 Granulometric composition, mm 0.1-0.14 0.1-0.14 Nanoparticles size, nm 2-5 2-8 Ru oxidation state Ru+4 Ru+4 Ru concentration, w % 2.9 2.85 Ru dispersion, % 32 28 Mass transfer coefficient, m/s 0.45*10-4 0.32*10-4
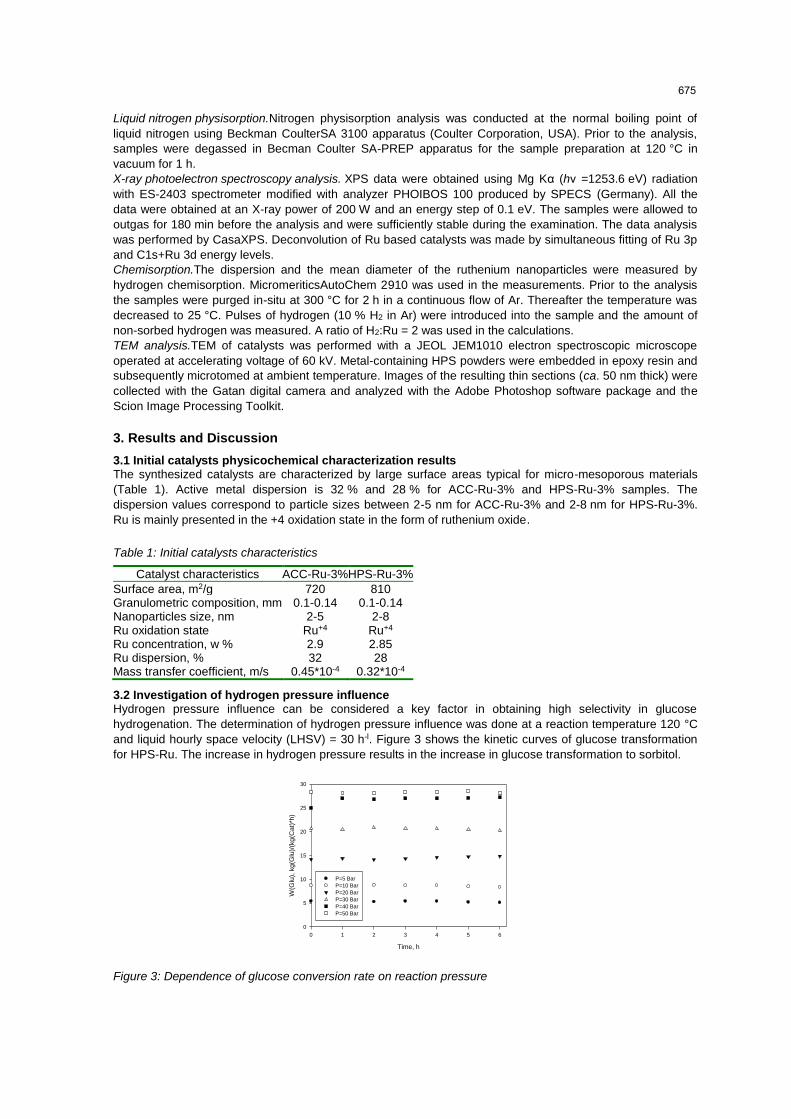
3.2 Investigation of hydrogen pressure influence Hydrogen pressure influence can be considered a key factor in obtaining high selectivity in glucose
hydrogenation. The determination of hydrogen pressure influence was done at a reaction temperature 120 °C
and liquid hourly space velocity (LHSV) = 30 h-l. Figure 3 shows the kinetic curves of glucose transformation
for HPS-Ru. The increase in hydrogen pressure results in the increase in glucose transformation to sorbitol.
Time, h
0 1 2 3 4 5 6
W(G
lu),
kg(G
lu)/
(kg(C
at)
*h)
0
5
10
15
20
25
30
P=5 Bar
P=10 Bar
P=20 Bar
P=30 Bar
P=40 Bar
P=50 Bar
Figure 3: Dependence of glucose conversion rate on reaction pressure
675
Glucose highest reaction rate was achieved at hydrogen pressure from 10 up to 120 bar, (Figure 3). The
average process selectivity to sorbitol is 95 %.
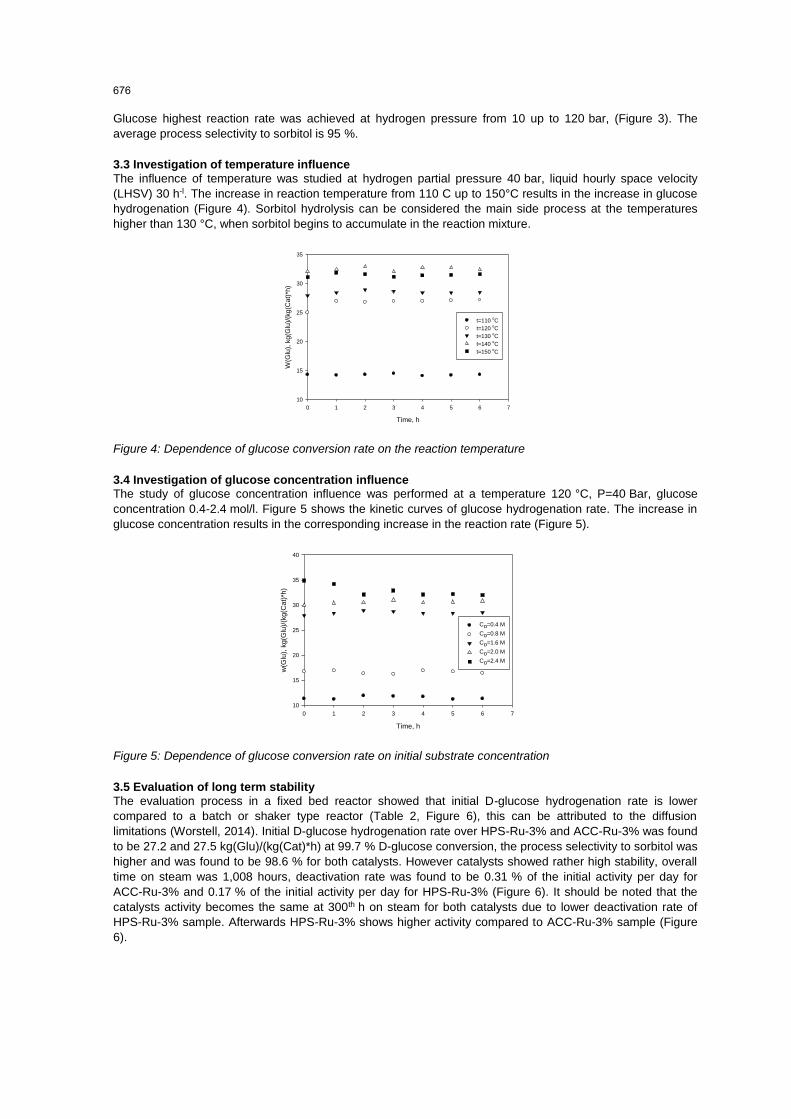
3.3 Investigation of temperature influence
The influence of temperature was studied at hydrogen partial pressure 40 bar, liquid hourly space velocity
(LHSV) 30 h-l. The increase in reaction temperature from 110 C up to 150°C results in the increase in glucose
hydrogenation (Figure 4). Sorbitol hydrolysis can be considered the main side process at the temperatures
higher than 130 °C, when sorbitol begins to accumulate in the reaction mixture.
Time, h
0 1 2 3 4 5 6 7
W(G
lu),
kg(G
lu)/
(kg(C
at)
*h)
10
15
20
25
30
35
t=110 оC
t=120 оC
t=130 оC
t=140 оC
t=150 оC
Figure 4: Dependence of glucose conversion rate on the reaction temperature
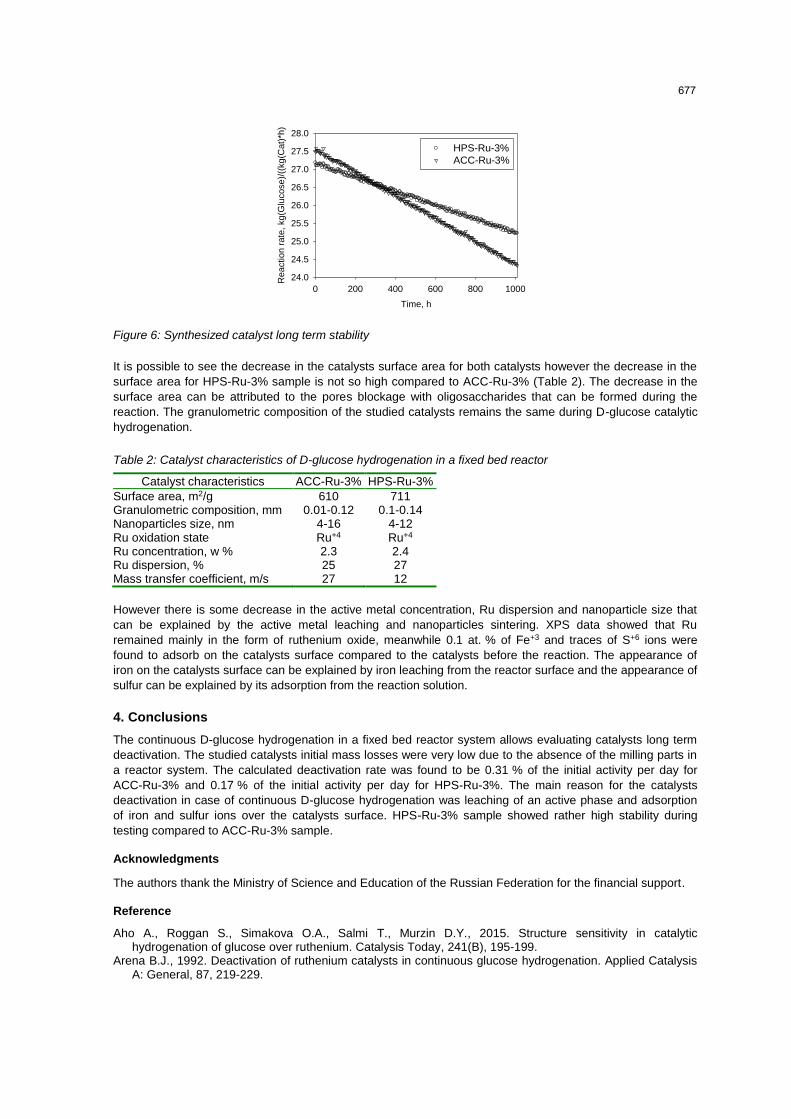
3.4 Investigation of glucose concentration influence The study of glucose concentration influence was performed at a temperature 120 °C, P=40 Bar, glucose
concentration 0.4-2.4 mol/l. Figure 5 shows the kinetic curves of glucose hydrogenation rate. The increase in
glucose concentration results in the corresponding increase in the reaction rate (Figure 5).
Time, h
0 1 2 3 4 5 6 7
w(G
lu),
kg(G
lu)/
(kg(C
at)
*h)
10
15
20
25
30
35
40
Co=0.4 M
Co=0.8 M
Co=1.6 M
Co=2.0 M
Co=2.4 M
Figure 5: Dependence of glucose conversion rate on initial substrate concentration
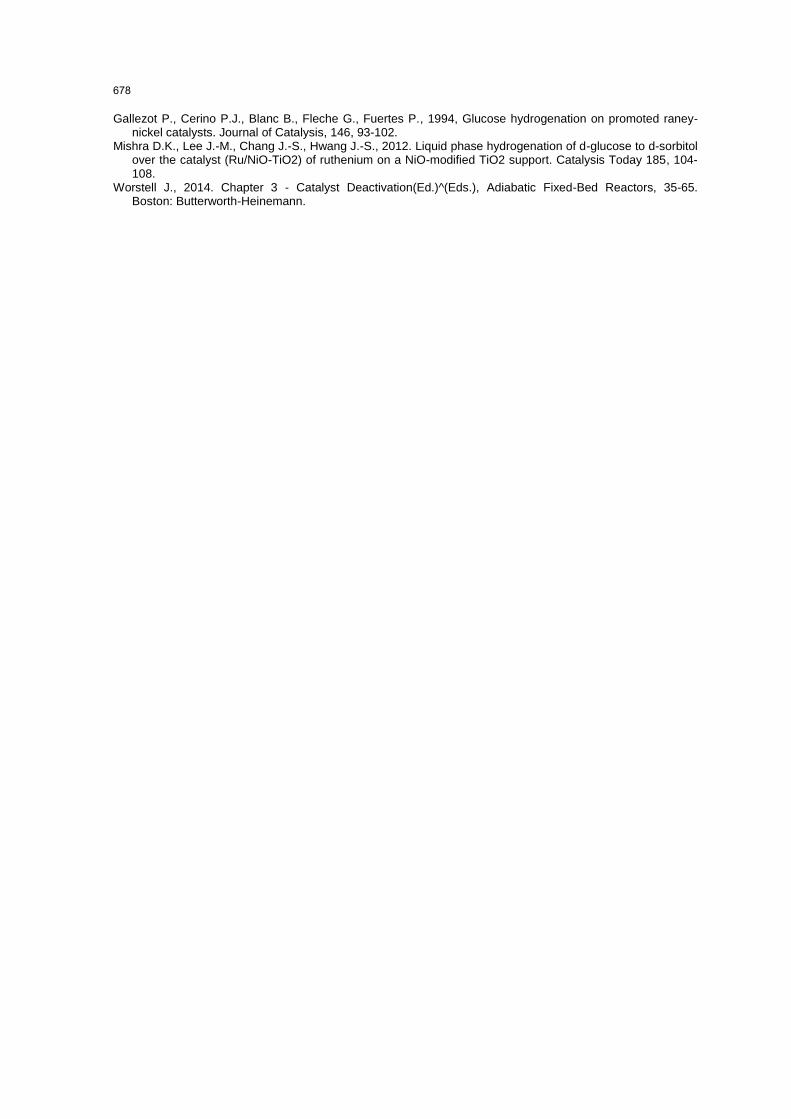
3.5 Evaluation of long term stability
The evaluation process in a fixed bed reactor showed that initial D-glucose hydrogenation rate is lower
compared to a batch or shaker type reactor (Table 2, Figure 6), this can be attributed to the diffusion
limitations (Worstell, 2014). Initial D-glucose hydrogenation rate over HPS-Ru-3% and ACC-Ru-3% was found
to be 27.2 and 27.5 kg(Glu)/(kg(Cat)*h) at 99.7 % D-glucose conversion, the process selectivity to sorbitol was
higher and was found to be 98.6 % for both catalysts. However catalysts showed rather high stability, overall
time on steam was 1,008 hours, deactivation rate was found to be 0.31 % of the initial activity per day for
ACC-Ru-3% and 0.17 % of the initial activity per day for HPS-Ru-3% (Figure 6). It should be noted that the
catalysts activity becomes the same at 300th h on steam for both catalysts due to lower deactivation rate of
HPS-Ru-3% sample. Afterwards HPS-Ru-3% shows higher activity compared to ACC-Ru-3% sample (Figure
6).
676
Time, h
0 200 400 600 800 1000R
eaction r
ate
, kg(G
lucose)/
((kg(C
at)
*h)
24.0
24.5
25.0
25.5
26.0
26.5
27.0
27.5
28.0
HPS-Ru-3%
ACC-Ru-3%
Figure 6: Synthesized catalyst long term stability
It is possible to see the decrease in the catalysts surface area for both catalysts however the decrease in the
surface area for HPS-Ru-3% sample is not so high compared to ACC-Ru-3% (Table 2). The decrease in the
surface area can be attributed to the pores blockage with oligosaccharides that can be formed during the
reaction. The granulometric composition of the studied catalysts remains the same during D-glucose catalytic
hydrogenation.
Table 2: Catalyst characteristics of D-glucose hydrogenation in a fixed bed reactor
Catalyst characteristics ACC-Ru-3% HPS-Ru-3%
Surface area, m2/g 610 711 Granulometric composition, mm 0.01-0.12 0.1-0.14 Nanoparticles size, nm 4-16 4-12 Ru oxidation state Ru+4 Ru+4 Ru concentration, w % 2.3 2.4 Ru dispersion, % 25 27 Mass transfer coefficient, m/s 27 12
However there is some decrease in the active metal concentration, Ru dispersion and nanoparticle size that
can be explained by the active metal leaching and nanoparticles sintering. XPS data showed that Ru
remained mainly in the form of ruthenium oxide, meanwhile 0.1 at. % of Fe+3 and traces of S+6 ions were
found to adsorb on the catalysts surface compared to the catalysts before the reaction. The appearance of
iron on the catalysts surface can be explained by iron leaching from the reactor surface and the appearance of
sulfur can be explained by its adsorption from the reaction solution.
4. Conclusions
The continuous D-glucose hydrogenation in a fixed bed reactor system allows evaluating catalysts long term
deactivation. The studied catalysts initial mass losses were very low due to the absence of the milling parts in
a reactor system. The calculated deactivation rate was found to be 0.31 % of the initial activity per day for
ACC-Ru-3% and 0.17 % of the initial activity per day for HPS-Ru-3%. The main reason for the catalysts
deactivation in case of continuous D-glucose hydrogenation was leaching of an active phase and adsorption
of iron and sulfur ions over the catalysts surface. HPS-Ru-3% sample showed rather high stability during
testing compared to ACC-Ru-3% sample.
Acknowledgments
The authors thank the Ministry of Science and Education of the Russian Federation for the financial support.
Reference
Aho A., Roggan S., Simakova O.A., Salmi T., Murzin D.Y., 2015. Structure sensitivity in catalytic hydrogenation of glucose over ruthenium. Catalysis Today, 241(B), 195-199.
Arena B.J., 1992. Deactivation of ruthenium catalysts in continuous glucose hydrogenation. Applied Catalysis A: General, 87, 219-229.
677
Gallezot P., Cerino P.J., Blanc B., Fleche G., Fuertes P., 1994, Glucose hydrogenation on promoted raney-nickel catalysts. Journal of Catalysis, 146, 93-102.
Mishra D.K., Lee J.-M., Chang J.-S., Hwang J.-S., 2012. Liquid phase hydrogenation of d-glucose to d-sorbitol over the catalyst (Ru/NiO-TiO2) of ruthenium on a NiO-modified TiO2 support. Catalysis Today 185, 104-108.
Worstell J., 2014. Chapter 3 - Catalyst Deactivation(Ed.)^(Eds.), Adiabatic Fixed-Bed Reactors, 35-65. Boston: Butterworth-Heinemann.
678
Recommended