SRI Conference Amsterdam
March 14th, 2013
Royal Philips Electronics Creating value through Sustainability
Important information Forward-looking statements This document and the related oral presentation, including responses to questions following the presentation contain certain forward-looking statements with respect to the financial condition, results of operations and business of Philips and certain of the plans and objectives of Philips with respect to these items. Examples of forward-looking statements include statements made about our strategy, estimates of sales growth, future EBITA and future developments in our organic business. By their nature, these statements involve risk and uncertainty because they relate to future events and circumstances and there are many factors that could cause actual results and developments to differ materially from those expressed or implied by these statements. These factors include, but are not limited to, domestic and global economic and business conditions, developments within the euro zone, the successful implementation of our strategy and our ability to realize the benefits of this strategy, our ability to develop and market new products, changes in legislation, legal claims, changes in exchange and interest rates, changes in tax rates, pension costs and actuarial assumptions, raw materials and employee costs, our ability to identify and complete successful acquisitions and to integrate those acquisitions into our business, our ability to successfully exit certain businesses or restructure our operations, the rate of technological changes, political, economic and other developments in countries where Philips operates, industry consolidation and competition. As a result, Philips’ actual future results may differ materially from the plans, goals and expectations set forth in such forward-looking statements. For a discussion of factors that could cause future results to differ from such forward-looking statements, see the Risk management chapter included in our Annual Report 2012.
Third-party market share data Statements regarding market share, including those regarding Philips’ competitive position, contained in this document are based on outside sources such as specialized research institutes, industry and dealer panels in combination with management estimates. Where information is not yet available to Philips, those statements may also be based on estimates and projections prepared by outside sources or management. Rankings are based on sales unless otherwise stated.
Use of non-GAAP Information In presenting and discussing the Philips Group’s financial position, operating results and cash flows, management uses certain non-GAAP financial measures. These non-GAAP financial measures should not be viewed in isolation as alternatives to the equivalent IFRS measures and should be used in conjunction with the most directly comparable IFRS measures. A reconciliation of such measures to the most directly comparable IFRS measures is contained in our Annual Report 2012. Further information on non-GAAP measures can be found in our Annual Report 2012.
Use of fair-value measurements In presenting the Philips Group’s financial position, fair values are used for the measurement of various items in accordance with the applicable accounting standards. These fair values are based on market prices, where available, and are obtained from sources that are deemed to be reliable. Readers are cautioned that these values are subject to changes over time and are only valid at the balance sheet date. When quoted prices do not exist, we estimated the fair values using appropriate valuation models, and when observable market data are not available, we used unobservable inputs. They require management to make significant assumptions with respect to future developments, which are inherently uncertain and may therefore deviate from actual developments. Critical assumptions used are disclosed in our 2012 financial statements. Independent valuations may have been obtained to support management’s determination of fair values. All amounts in millions of euro’s unless otherwise stated; data included are unaudited. Financial reporting is in accordance with IFRS, unless otherwise stated.
2

Mission, Vision, Behaviors
3
Mission
Improving people’s lives
through meaningful
innovation
Vision
At Philips, we strive to make the
world healthier and more
sustainable through innovation.
Our goal is to improve the lives
of 3 billion people a year by
2025.
We will be the best place to
work for people who share our
passion.
Together we will deliver superior
value for our customers and
shareholders.
Behaviors
• Eager to win
• Take ownership
• Team up to excel
3
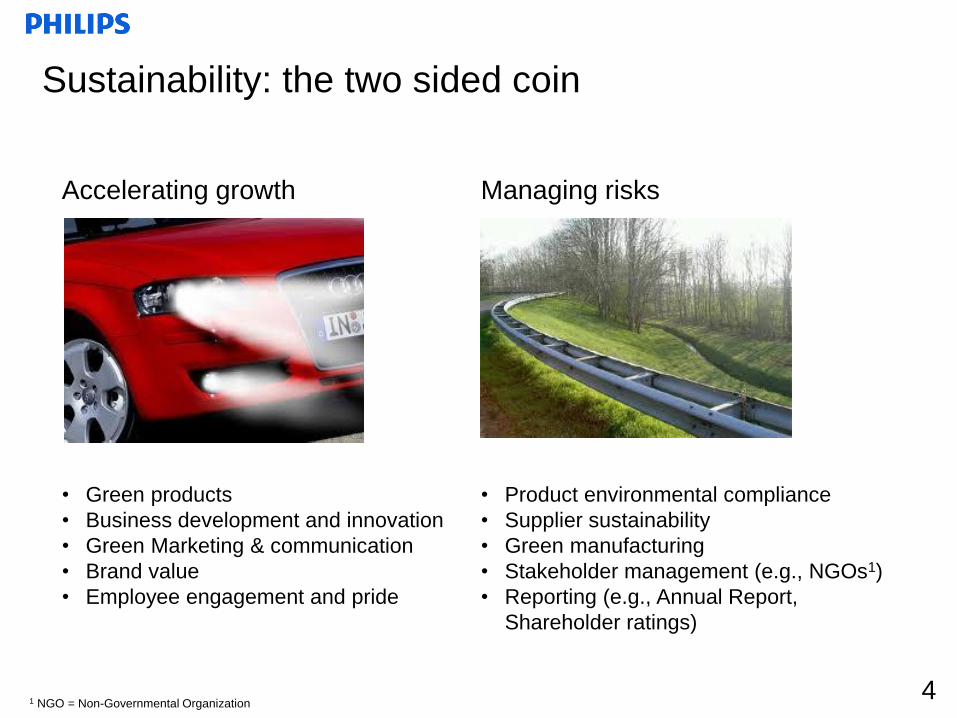
• Green products
• Business development and innovation
• Green Marketing & communication
• Brand value
• Employee engagement and pride
• Product environmental compliance
• Supplier sustainability
• Green manufacturing
• Stakeholder management (e.g., NGOs1)
• Reporting (e.g., Annual Report,
Shareholder ratings)
Accelerating growth Managing risks
Sustainability: the two sided coin
4 1 NGO = Non-Governmental Organization

Sustainability as a driver for growth
Success of EcoVision Green Products represented around 45% of sales
in 2012, up from 39% in 2011 driven by
investments in Green Innovation.
EcoVision targets for 2015
• 50% of sales from Green Products
• EUR 2 billion Green Innovation investments
• To improve the lives of 2 billion people
• To improve the energy efficiency of our overall
portfolio by 50%
• To double the amount of recycled materials in
our products as well as to double the collection
and recycling of Philips products
Recent accomplishments
• Philips was awarded sector and super sector
leader in the Dow Jones Sustainability Index for
the second consecutive year with highest scores
ever
• Philips was ranked first for the fifth time in six
years for Responsible Supply Chain
Management by the Dutch Association of
Investors for Sustainable Development (VBDO)
• Philips again achieved top scores in the Carbon
Disclosure Project
• Top 50 position in Best Global Green Brands
2012
• Philips received the prestigious Giga Ton Award
(known as the Green Oscar) for its long-
standing business leadership to reduce carbon
usage
• Philips received an overall global rating of 10.0
(“best in class”), the highest being assigned
from GMI, an independent global company in
Corporate Governance and ESG
5
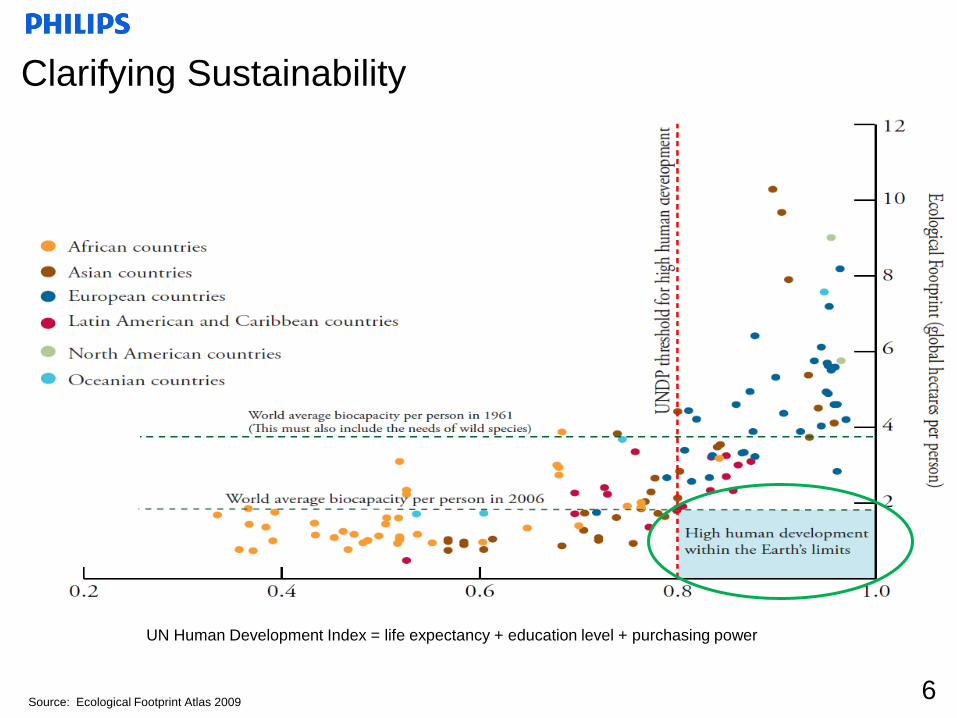
6 Source: Ecological Footprint Atlas 2009
Clarifying Sustainability
UN Human Development Index = life expectancy + education level + purchasing power
6
7
Ecological footprint
(Healthy Planet)
Human Development Index (Healthy Lives)
UP
DO
WN
A Healthier and more
Sustainable World
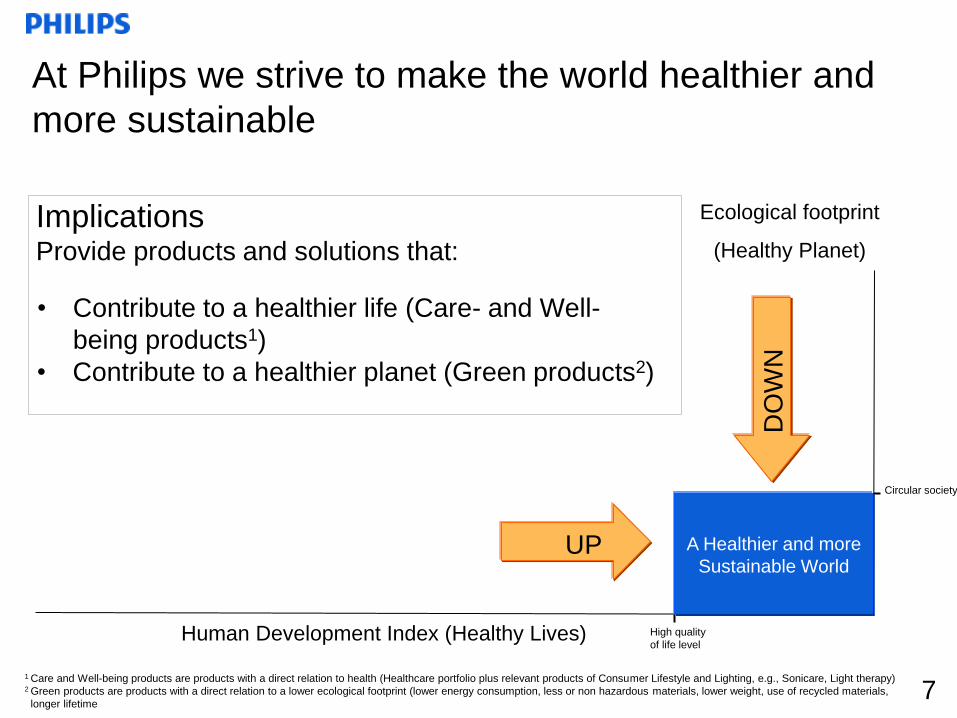
At Philips we strive to make the world healthier and
more sustainable
1 Care and Well-being products are products with a direct relation to health (Healthcare portfolio plus relevant products of Consumer Lifestyle and Lighting, e.g., Sonicare, Light therapy) 2 Green products are products with a direct relation to a lower ecological footprint (lower energy consumption, less or non hazardous materials, lower weight, use of recycled materials,
longer lifetime
Implications Provide products and solutions that:
• Contribute to a healthier life (Care- and Well-
being products1)
• Contribute to a healthier planet (Green products2)
Circular society
High quality
of life level
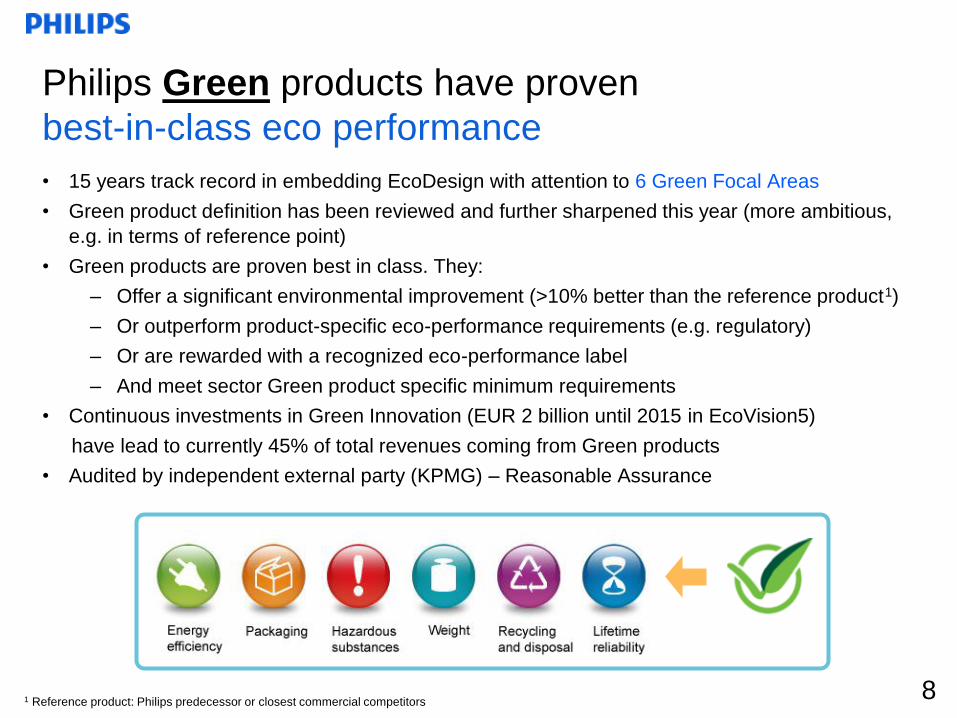
Philips Green products have proven
best-in-class eco performance
• 15 years track record in embedding EcoDesign with attention to 6 Green Focal Areas
• Green product definition has been reviewed and further sharpened this year (more ambitious,
e.g. in terms of reference point)
• Green products are proven best in class. They:
– Offer a significant environmental improvement (>10% better than the reference product1)
– Or outperform product-specific eco-performance requirements (e.g. regulatory)
– Or are rewarded with a recognized eco-performance label
– And meet sector Green product specific minimum requirements
• Continuous investments in Green Innovation (EUR 2 billion until 2015 in EcoVision5)
have lead to currently 45% of total revenues coming from Green products
• Audited by independent external party (KPMG) – Reasonable Assurance
8 1 Reference product: Philips predecessor or closest commercial competitors
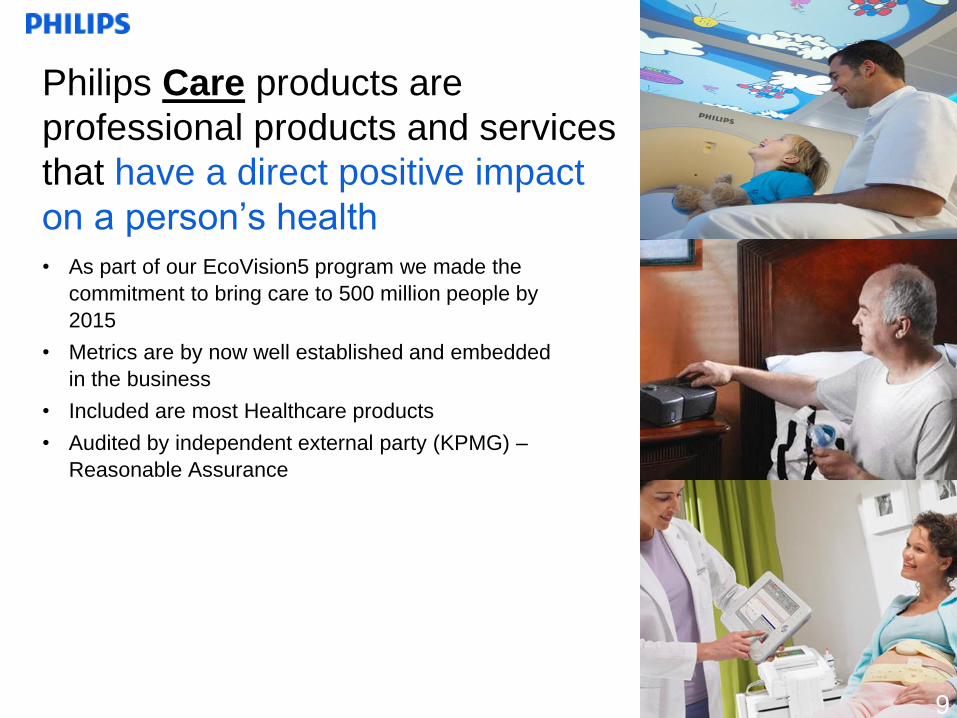
Philips Care products are
professional products and services
that have a direct positive impact
on a person’s health
• As part of our EcoVision5 program we made the
commitment to bring care to 500 million people by
2015
• Metrics are by now well established and embedded
in the business
• Included are most Healthcare products
• Audited by independent external party (KPMG) –
Reasonable Assurance
9 9
9
9
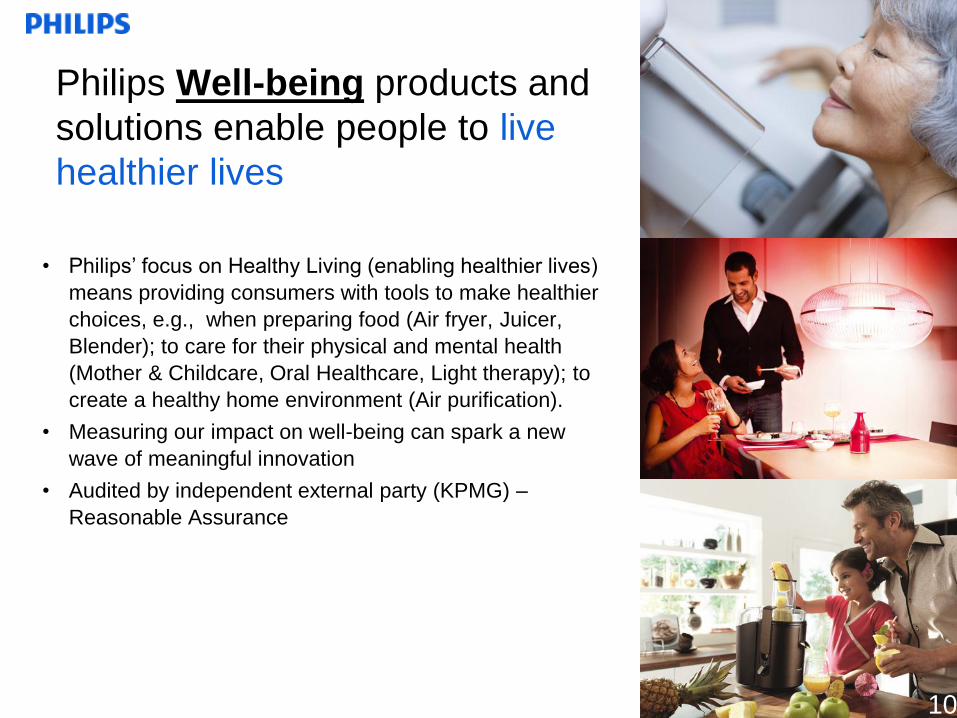
• Philips’ focus on Healthy Living (enabling healthier lives)
means providing consumers with tools to make healthier
choices, e.g., when preparing food (Air fryer, Juicer,
Blender); to care for their physical and mental health
(Mother & Childcare, Oral Healthcare, Light therapy); to
create a healthy home environment (Air purification).
• Measuring our impact on well-being can spark a new
wave of meaningful innovation
• Audited by independent external party (KPMG) –
Reasonable Assurance
Philips Well-being products and
solutions enable people to live
healthier lives
10 10
10
10
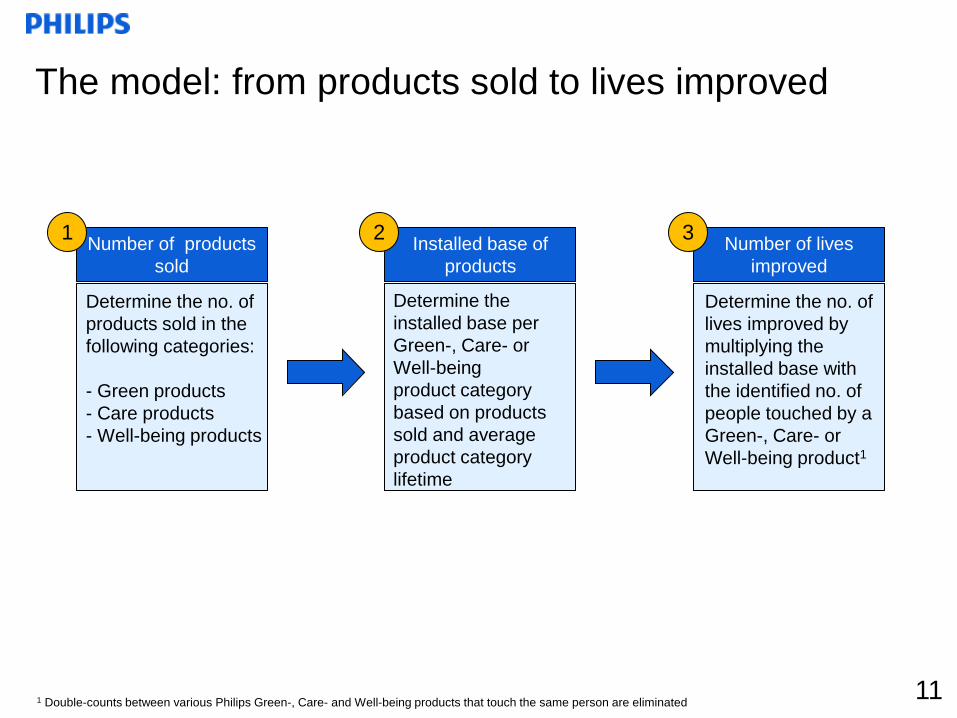
The model: from products sold to lives improved
11 11 1 Double-counts between various Philips Green-, Care- and Well-being products that touch the same person are eliminated
Determine the no. of
products sold in the
following categories:
- Green products
- Care products
- Well-being products
Number of products
sold
1
Determine the
installed base per
Green-, Care- or
Well-being
product category
based on products
sold and average
product category
lifetime
Installed base of
products
2
Determine the no. of
lives improved by
multiplying the
installed base with
the identified no. of
people touched by a
Green-, Care- or
Well-being product1
Number of lives
improved
3
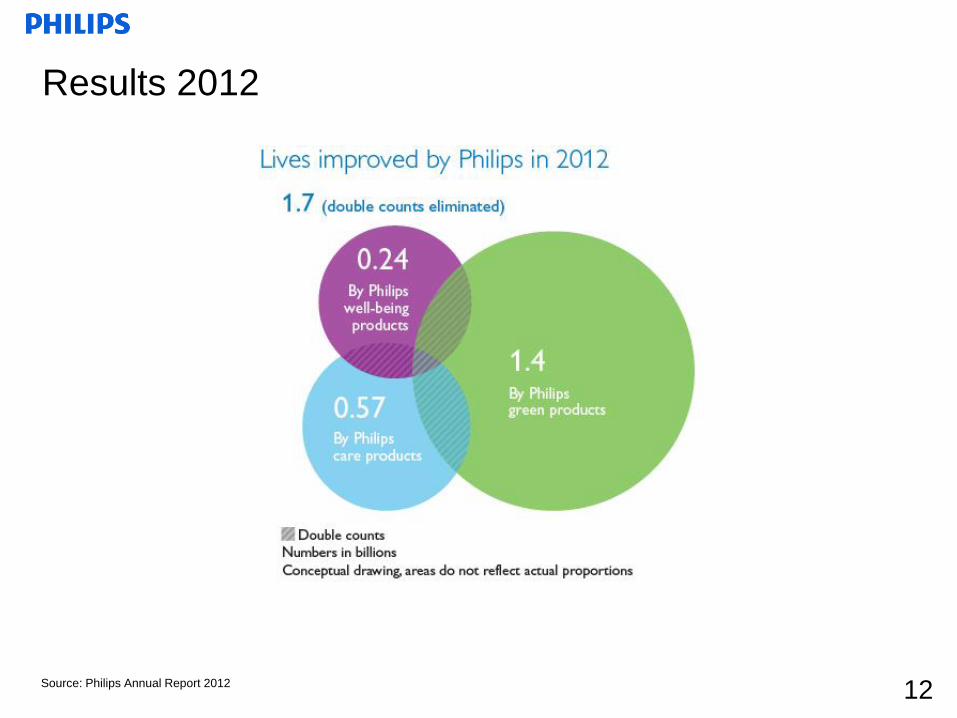
Results 2012
12 Source: Philips Annual Report 2012
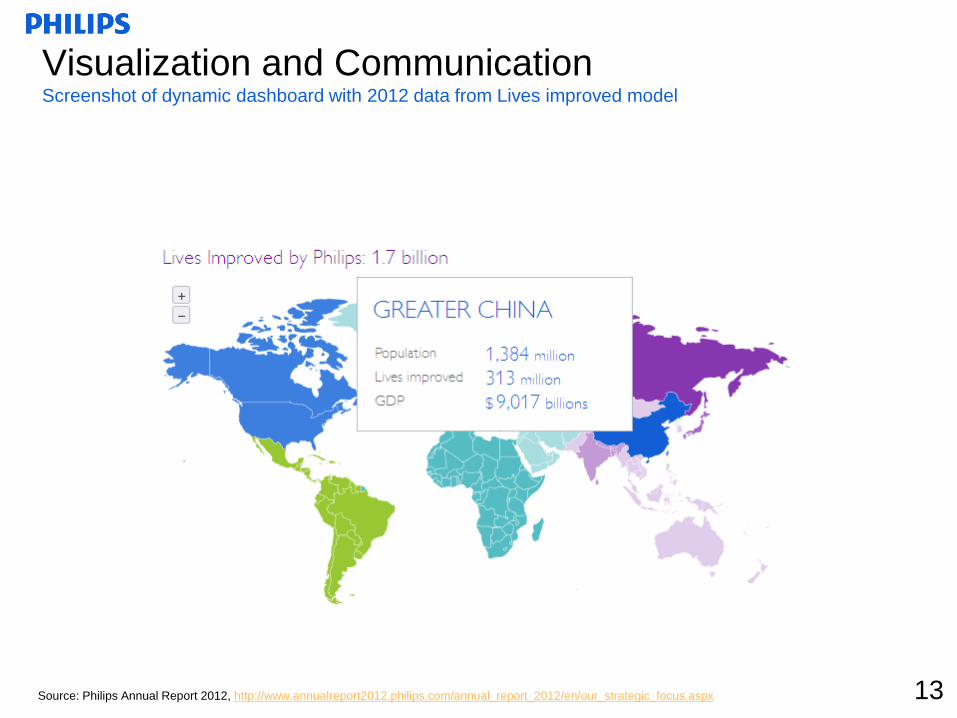
Visualization and Communication Screenshot of dynamic dashboard with 2012 data from Lives improved model
13 Source: Philips Annual Report 2012, http://www.annualreport2012.philips.com/annual_report_2012/en/our_strategic_focus.aspx

14
Some other highlights from Annual Report 2012
15 15
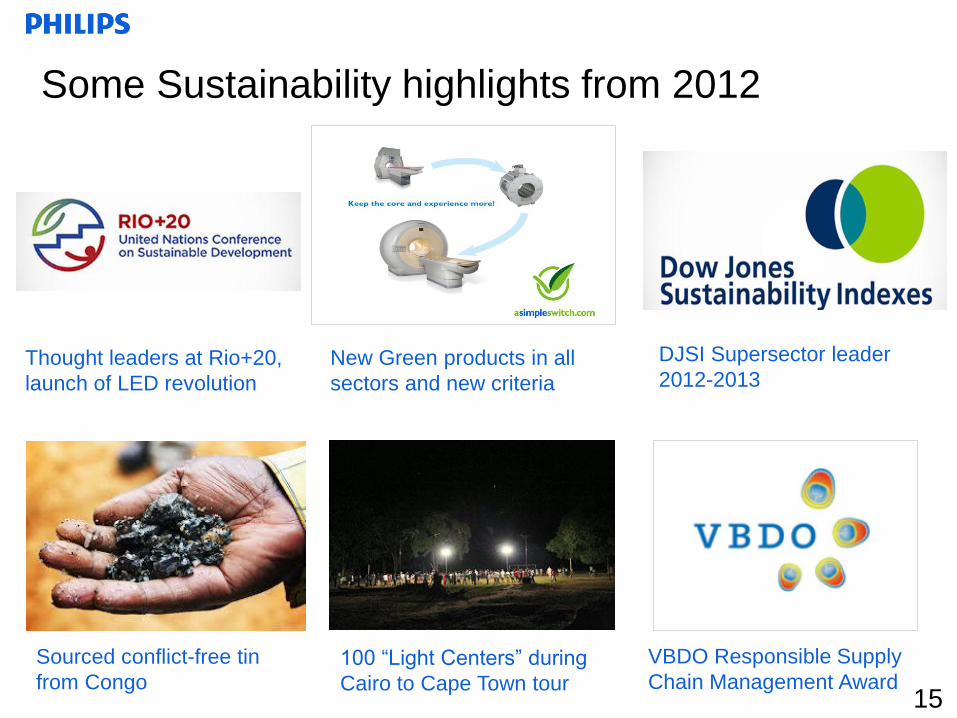
VBDO Responsible Supply
Chain Management Award
Some Sustainability highlights from 2012
Thought leaders at Rio+20,
launch of LED revolution
DJSI Supersector leader
2012-2013
100 “Light Centers” during
Cairo to Cape Town tour
New Green products in all
sectors and new criteria
Sourced conflict-free tin
from Congo

January 29th, 2013
Royal Philips Electronics Fourth Quarter and Annual Results 2012
Information booklet
Important information Forward-looking statements This document and the related oral presentation, including responses to questions following the presentation contain certain forward-looking statements with respect to the financial condition, results of operations and business of Philips and certain of the plans and objectives of Philips with respect to these items. Examples of forward-looking statements include statements made about our strategy, estimates of sales growth, future EBITA and future developments in our organic business. By their nature, these statements involve risk and uncertainty because they relate to future events and circumstances and there are many factors that could cause actual results and developments to differ materially from those expressed or implied by these statements. These factors include but are not limited to domestic and global economic and business conditions, developments within the euro zone, the successful implementation of our strategy and our ability to realize the benefits of this strategy, our ability to develop and market new products, changes in legislation, legal claims, changes in exchange and interest rates, changes in tax rates, pension costs and actuarial assumptions, raw materials and employee costs, our ability to identify and complete successful acquisitions and to integrate those acquisitions into our business, our ability to successfully exit certain businesses or restructure our operations, the rate of technological changes, political, economic and other developments in countries where Philips operates, industry consolidation and competition. As a result, Philips’ actual future results may differ materially from the plans, goals and expectations set forth in such forward-looking statements. For a discussion of factors that could cause future results to differ from such forward-looking statements, see the Risk management chapter included in our Annual Report 2011 and the “Risk and uncertainties” section in our semi-annual financial report for the six months ended July 1, 2012.
Third-party market share data Statements regarding market share, including those regarding Philips’ competitive position, contained in this document are based on outside sources such as research institutes, industry and dealer panels in combination with management estimates. Where information is not yet available to Philips, those statements may also be based on estimates and projections prepared by outside sources or management. Rankings are based on sales unless otherwise stated.
Use of non-GAAP Information In presenting and discussing the Philips Group’s financial position, operating results and cash flows, management uses certain non-GAAP financial measures. These non-GAAP financial measures should not be viewed in isolation as alternatives to the equivalent IFRS measures and should be used in conjunction with the most directly comparable IFRS measures. A reconciliation of such measures to the most directly comparable IFRS measures is contained in our Annual Report 2011. Further information on non-GAAP measures can be found in our Annual Report 2011.
Use of fair-value measurements In presenting the Philips Group’s financial position, fair values are used for the measurement of various items in accordance with the applicable accounting standards. These fair values are based on market prices, where available, and are obtained from sources that are deemed to be reliable. Readers are cautioned that these values are subject to changes over time and are only valid at the balance sheet date. When quoted prices do not exist, we estimated the fair values using appropriate valuation models, and when observable market data are not available, we used unobservable inputs. They require management to make significant assumptions with respect to future developments, which are inherently uncertain and may therefore deviate from actual developments. Critical assumptions used are disclosed in our 2011 financial statements. Independent valuations may have been obtained to support management’s determination of fair values. All amounts in millions of euro’s unless otherwise stated; data included are unaudited. Financial reporting is in accordance with IFRS, unless otherwise stated.
1. Management update
2. Group results Q4 2012 and annual results
3. Accelerate! Change and performance
4. Portfolio strength and path to value
5. Group and sector overview
Agenda Agenda
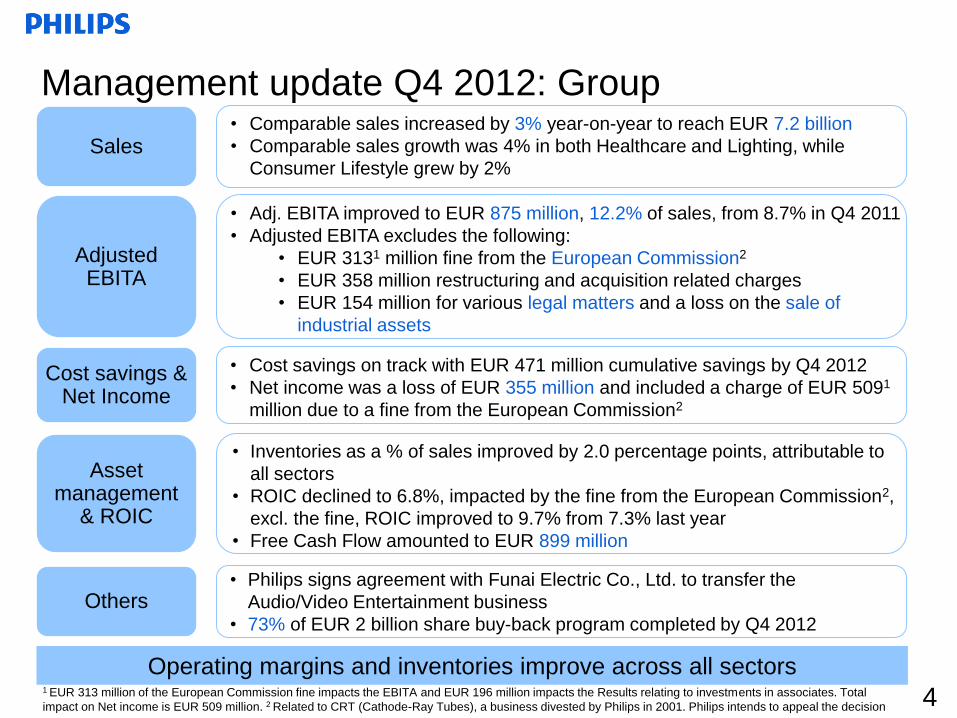
• Adj. EBITA improved to EUR 875 million, 12.2% of sales, from 8.7% in Q4 2011
• Adjusted EBITA excludes the following:
• EUR 3131 million fine from the European Commission2
• EUR 358 million restructuring and acquisition related charges
• EUR 154 million for various legal matters and a loss on the sale of
industrial assets
Operating margins and inventories improve across all sectors
• Comparable sales increased by 3% year-on-year to reach EUR 7.2 billion
• Comparable sales growth was 4% in both Healthcare and Lighting, while
Consumer Lifestyle grew by 2%
• Inventories as a % of sales improved by 2.0 percentage points, attributable to
all sectors
• ROIC declined to 6.8%, impacted by the fine from the European Commission2,
excl. the fine, ROIC improved to 9.7% from 7.3% last year
• Free Cash Flow amounted to EUR 899 million
• Philips signs agreement with Funai Electric Co., Ltd. to transfer the
Audio/Video Entertainment business
• 73% of EUR 2 billion share buy-back program completed by Q4 2012
Management update Q4 2012: Group
• Cost savings on track with EUR 471 million cumulative savings by Q4 2012
• Net income was a loss of EUR 355 million and included a charge of EUR 5091
million due to a fine from the European Commission2
Sales
Adjusted EBITA
Asset management
& ROIC
Others
Cost savings & Net Income
4 1 EUR 313 million of the European Commission fine impacts the EBITA and EUR 196 million impacts the Results relating to investments in associates. Total
impact on Net income is EUR 509 million. 2 Related to CRT (Cathode-Ray Tubes), a business divested by Philips in 2001. Philips intends to appeal the decision
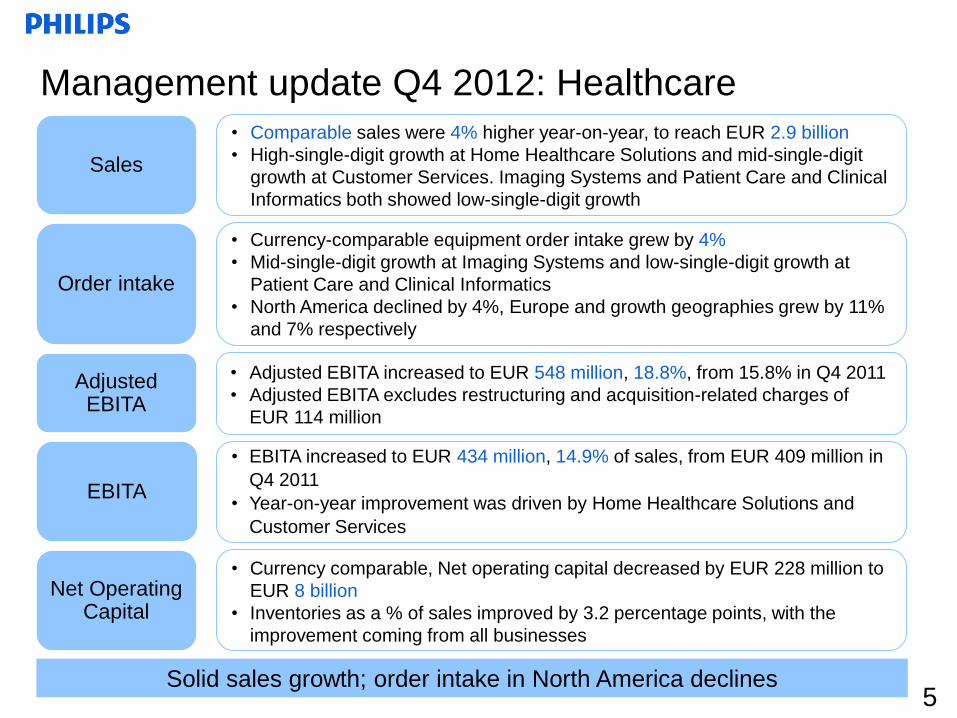
Sales
• Comparable sales were 4% higher year-on-year, to reach EUR 2.9 billion
• High-single-digit growth at Home Healthcare Solutions and mid-single-digit
growth at Customer Services. Imaging Systems and Patient Care and Clinical
Informatics both showed low-single-digit growth
• EBITA increased to EUR 434 million, 14.9% of sales, from EUR 409 million in
Q4 2011
• Year-on-year improvement was driven by Home Healthcare Solutions and
Customer Services
EBITA
Net Operating Capital
Solid sales growth; order intake in North America declines
Management update Q4 2012: Healthcare
Order intake
• Currency-comparable equipment order intake grew by 4%
• Mid-single-digit growth at Imaging Systems and low-single-digit growth at
Patient Care and Clinical Informatics
• North America declined by 4%, Europe and growth geographies grew by 11%
and 7% respectively
5
• Currency comparable, Net operating capital decreased by EUR 228 million to
EUR 8 billion
• Inventories as a % of sales improved by 3.2 percentage points, with the
improvement coming from all businesses
• Adjusted EBITA increased to EUR 548 million, 18.8%, from 15.8% in Q4 2011
• Adjusted EBITA excludes restructuring and acquisition-related charges of
EUR 114 million
Adjusted EBITA
Sales
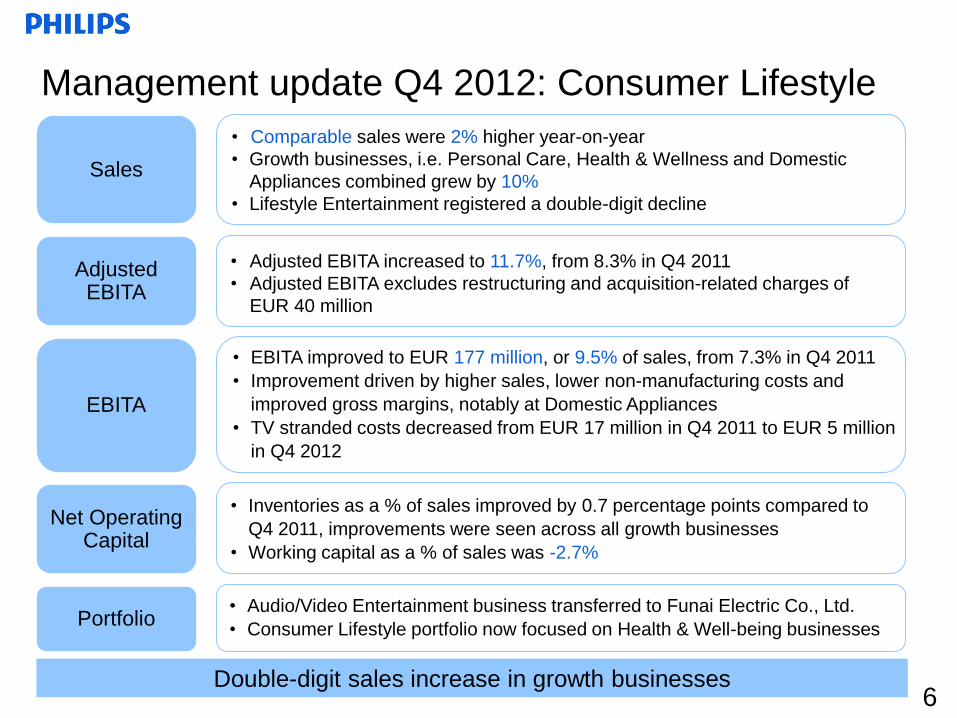
• Comparable sales were 2% higher year-on-year
• Growth businesses, i.e. Personal Care, Health & Wellness and Domestic
Appliances combined grew by 10%
• Lifestyle Entertainment registered a double-digit decline
• Adjusted EBITA increased to 11.7%, from 8.3% in Q4 2011
• Adjusted EBITA excludes restructuring and acquisition-related charges of
EUR 40 million
Adjusted EBITA
• Audio/Video Entertainment business transferred to Funai Electric Co., Ltd.
• Consumer Lifestyle portfolio now focused on Health & Well-being businesses
Double-digit sales increase in growth businesses
Management update Q4 2012: Consumer Lifestyle
Net Operating Capital
6
• EBITA improved to EUR 177 million, or 9.5% of sales, from 7.3% in Q4 2011
• Improvement driven by higher sales, lower non-manufacturing costs and
improved gross margins, notably at Domestic Appliances
• TV stranded costs decreased from EUR 17 million in Q4 2011 to EUR 5 million
in Q4 2012
EBITA
Portfolio
• Inventories as a % of sales improved by 0.7 percentage points compared to
Q4 2011, improvements were seen across all growth businesses
• Working capital as a % of sales was -2.7%
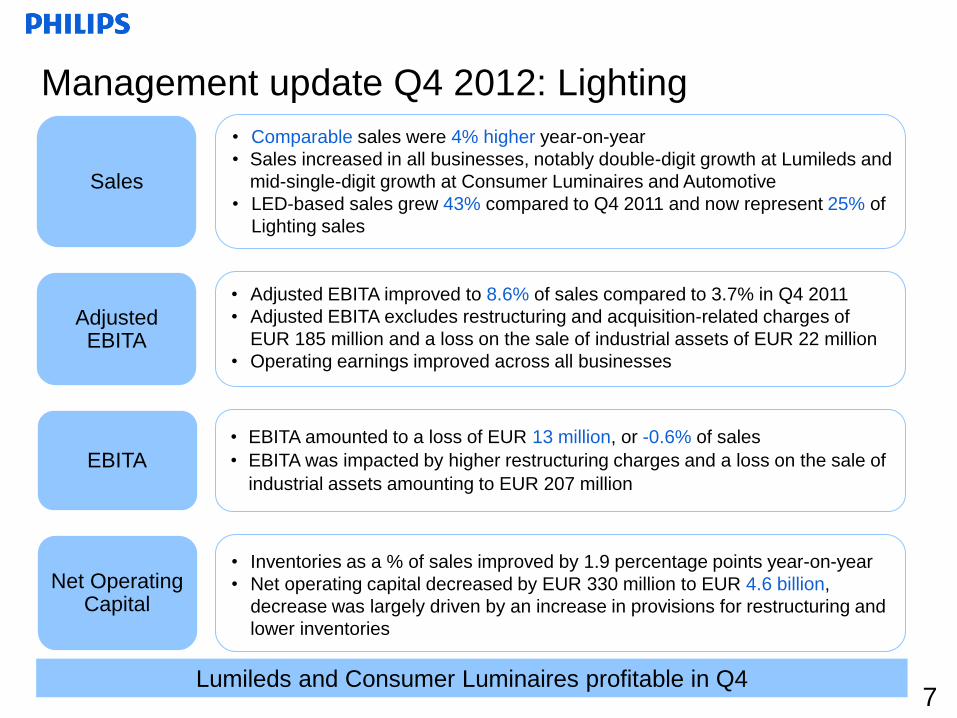
Sales
• Comparable sales were 4% higher year-on-year
• Sales increased in all businesses, notably double-digit growth at Lumileds and
mid-single-digit growth at Consumer Luminaires and Automotive
• LED-based sales grew 43% compared to Q4 2011 and now represent 25% of
Lighting sales
EBITA
Net Operating Capital
• Inventories as a % of sales improved by 1.9 percentage points year-on-year
• Net operating capital decreased by EUR 330 million to EUR 4.6 billion,
decrease was largely driven by an increase in provisions for restructuring and
lower inventories
Lumileds and Consumer Luminaires profitable in Q4
Management update Q4 2012: Lighting
7
• Adjusted EBITA improved to 8.6% of sales compared to 3.7% in Q4 2011
• Adjusted EBITA excludes restructuring and acquisition-related charges of
EUR 185 million and a loss on the sale of industrial assets of EUR 22 million
• Operating earnings improved across all businesses
Adjusted EBITA
• EBITA amounted to a loss of EUR 13 million, or -0.6% of sales
• EBITA was impacted by higher restructuring charges and a loss on the sale of
industrial assets amounting to EUR 207 million

North America
• Philips Group sales declined by 3% reflecting market uncertainty
• Healthcare sales declined by low-single-digit and equipment order intake
declined by mid-single-digit
• Consumer Lifestyle sales excluding Lifestyle Entertainment grew by mid-
single-digit, driven by the Health and Wellness business
• Lighting sales declined by low-single-digit in the quarter
• Group sales excluding Lifestyle Entertainment grew by low-single-digit for the
quarter despite the challenging economic environment
• Healthcare sales declined by 4%. Equipment order intake grew by double-
digits including 2 multi-year projects in the Benelux
• In Consumer Lifestyle sales of the combined growth businesses, i.e. Personal
Care, Health & Wellness and Domestic Appliances grew by low-single-digit,
while sales for the sector declined by mid-single-digit
• Lighting sales grew by mid-single-digit
• Group sales increased by 10%, driven by China, India, Russia and Brazil
• Strong Healthcare sales growth of 19%. Equipment order intake was up by
high-single-digit. China, India, Russia and Latam up double-digits
• Consumer Lifestyle sales showed high-single-digit growth, driven by solid
growth in Russia, Brazil and India
• Lighting sales grew by mid-single-digits driven by China, India and Brazil
Europe
Growth
Geographies
Sales and order growth in Europe as uncertainty causes decline in North America
Management update Q4 2012: By Geography
8
1. Management update
2. Group results Q4 2012 and annual results
3. Accelerate! Change and performance
4. Portfolio strength and path to value
5. Group and sector overview
Agenda Agenda
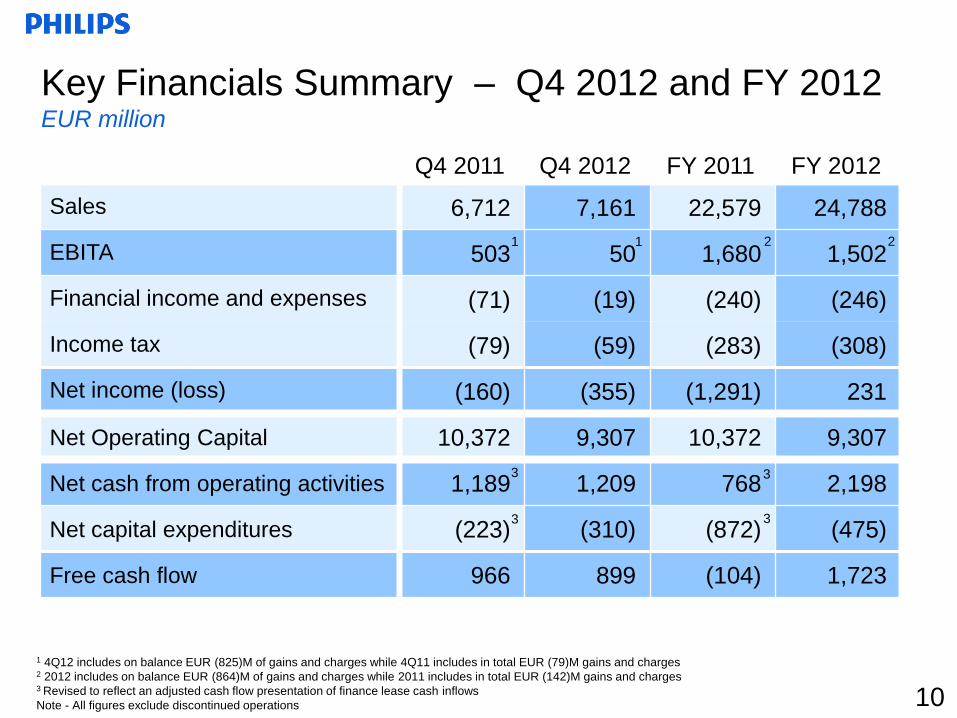
Q4 2011 Q4 2012 FY 2011 FY 2012
Sales 6,712 7,161 22,579 24,788
EBITA 503 50 1,680 1,502
Financial income and expenses (71) (19) (240) (246)
Income tax (79) (59) (283) (308)
Net income (loss) (160) (355) (1,291) 231
Net Operating Capital 10,372 9,307 10,372 9,307
Net cash from operating activities 1,189 1,209 768 2,198
Net capital expenditures (223) (310) (872) (475)
Free cash flow 966 899 (104) 1,723
Key Financials Summary – Q4 2012 and FY 2012 EUR million
1 1 2
1 4Q12 includes on balance EUR (825)M of gains and charges while 4Q11 includes in total EUR (79)M gains and charges 2 2012 includes on balance EUR (864)M of gains and charges while 2011 includes in total EUR (142)M gains and charges 3 Revised to reflect an adjusted cash flow presentation of finance lease cash inflows
Note - All figures exclude discontinued operations
3
3
10
2
3
3
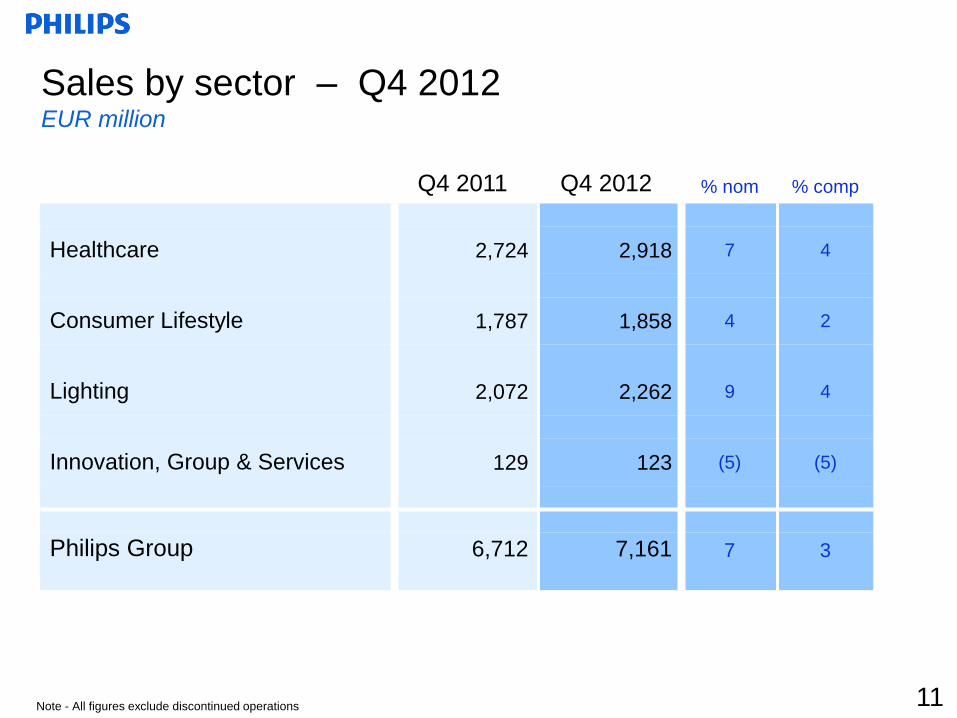
Sales by sector – Q4 2012 EUR million
Q4 2011 Q4 2012 % nom % comp
Healthcare 2,724 2,918 7 4
Consumer Lifestyle 1,787 1,858 4 2
Lighting 2,072 2,262 9 4
Innovation, Group & Services 129 123 (5) (5)
Philips Group 6,712 7,161 7 3
Note - All figures exclude discontinued operations 11

Sales by sector – FY 2012 EUR million
2011 2012 % nom % comp
Healthcare 8,852 9,983 13 6
Consumer Lifestyle 5,615 5,953 6 2
Lighting 7,638 8,442 11 4
Innovation, Group & Services 474 410 (13) (7)
Philips Group 22,579 24,788 10 4
Note - All figures exclude discontinued operations 12
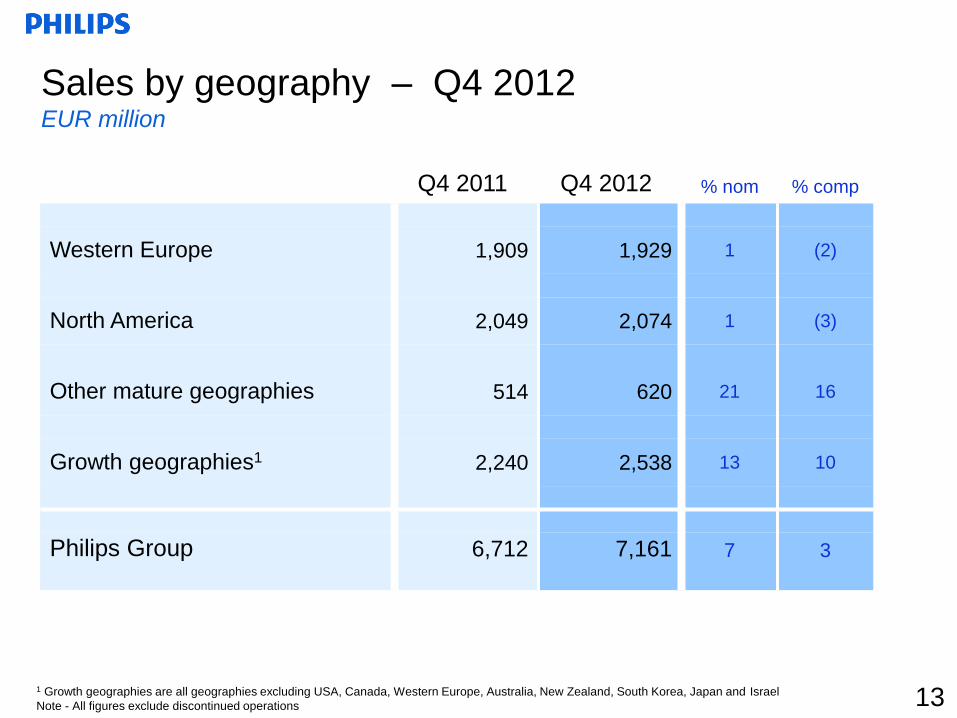
Sales by geography – Q4 2012 EUR million
Q4 2011 Q4 2012 % nom % comp
Western Europe 1,909 1,929 1 (2)
North America 2,049 2,074 1 (3)
Other mature geographies 514 620 21 16
Growth geographies1 2,240 2,538 13 10
Philips Group 6,712 7,161 7 3
1 Growth geographies are all geographies excluding USA, Canada, Western Europe, Australia, New Zealand, South Korea, Japan and Israel
Note - All figures exclude discontinued operations 13
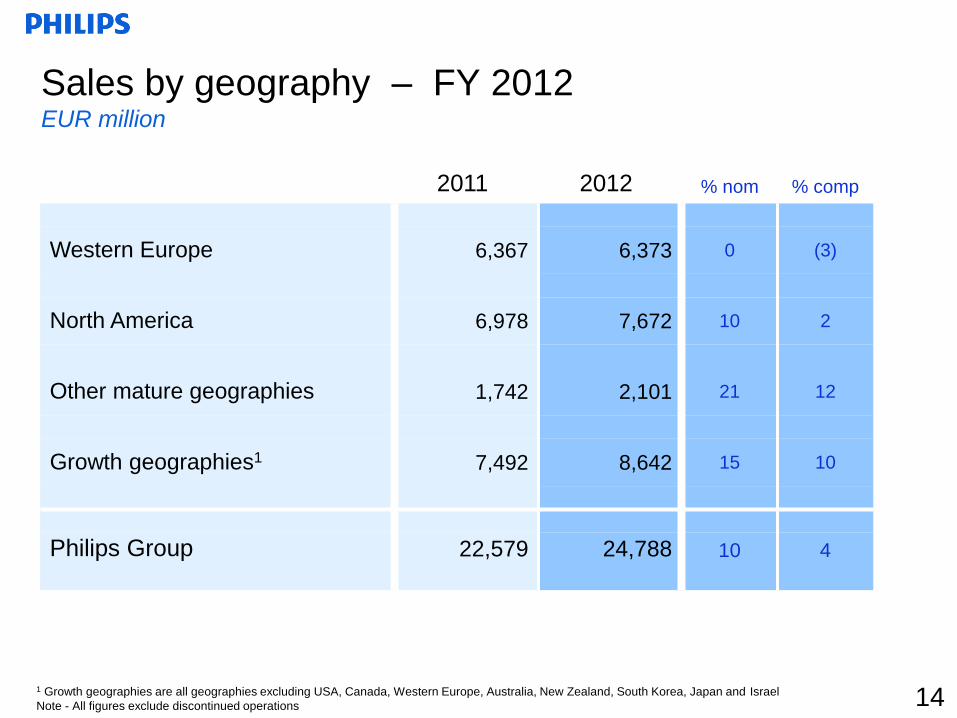
Sales by geography – FY 2012 EUR million
2011 2012 % nom % comp
Western Europe 6,367 6,373 0 (3)
North America 6,978 7,672 10 2
Other mature geographies 1,742 2,101 21 12
Growth geographies1 7,492 8,642 15 10
Philips Group 22,579 24,788 10 4
1 Growth geographies are all geographies excluding USA, Canada, Western Europe, Australia, New Zealand, South Korea, Japan and Israel
Note - All figures exclude discontinued operations 14
23 11 8 1119 6 5 919 13 9 125 9 21 12272
7 922 10 7 1114 8 11 10
19
9
5
10
0
10
20
30
2011 2012 2011 2012 2011 2012 2011 2012
5 4 6 48
(0)
4 4 7 1 8 63 0 7 39
(1)
2 4 7 3 6 5 7 3 4 5
4
2
43
-5
0
5
10
2011 2012 2011 2012 2011 2012 2011 2012
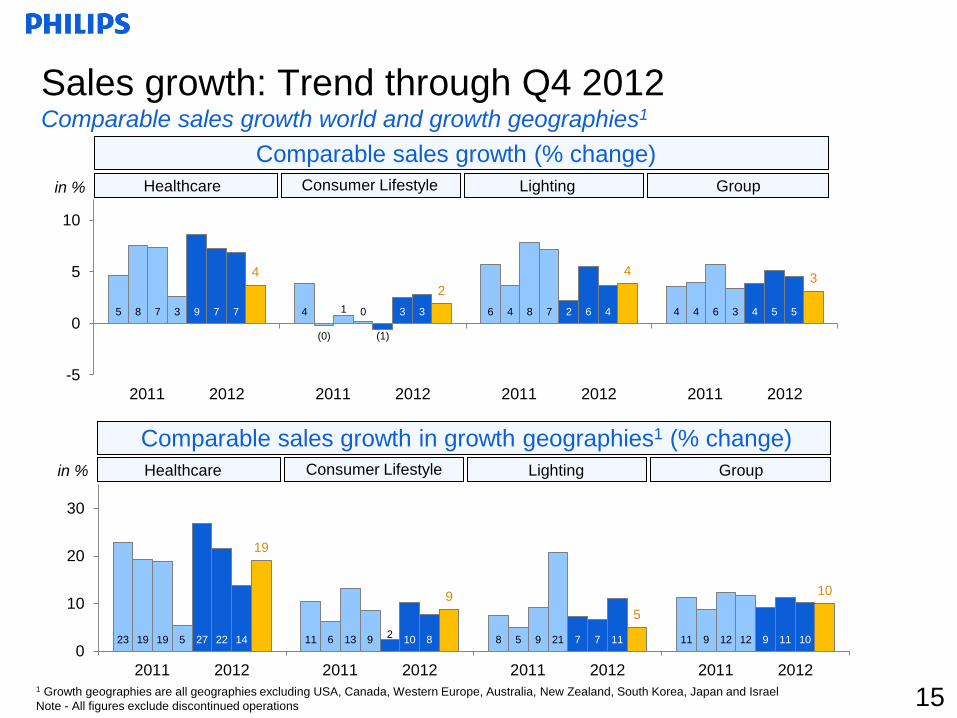
Sales growth: Trend through Q4 2012 Comparable sales growth world and growth geographies1
Comparable sales growth (% change)
Healthcare Consumer Lifestyle Lighting Group
Healthcare Consumer Lifestyle Lighting Group
Comparable sales growth in growth geographies1 (% change)
in %
in %
15 1 Growth geographies are all geographies excluding USA, Canada, Western Europe, Australia, New Zealand, South Korea, Japan and Israel
Note - All figures exclude discontinued operations
27%
41%43%
Mature
65%
Growth
35%
24%
41%46%Mature
65%
Growth
35%
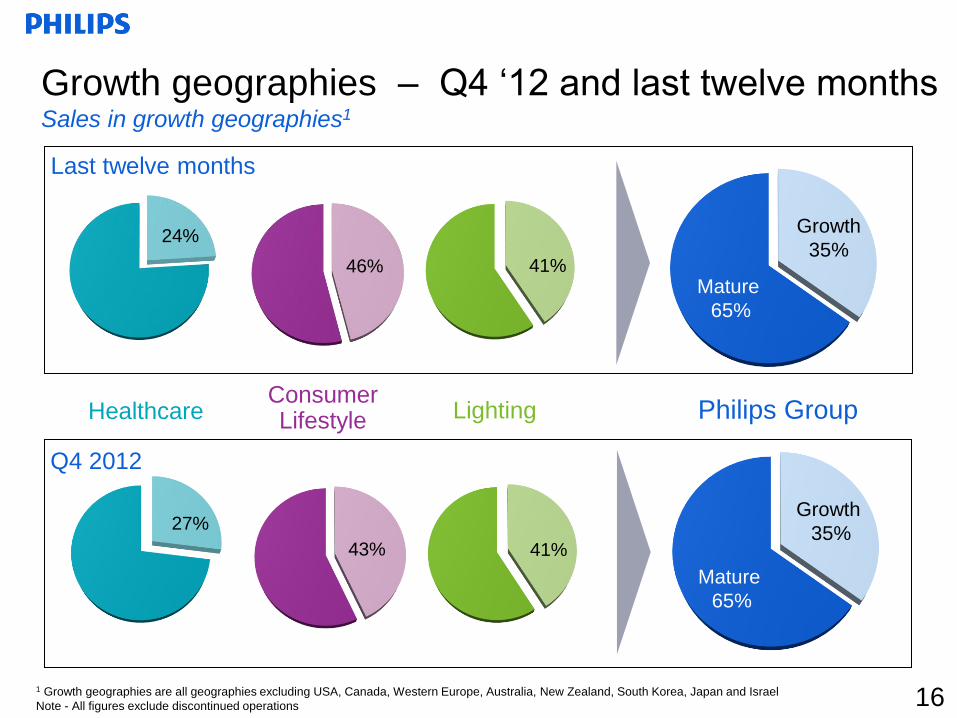
Growth geographies – Q4 ‘12 and last twelve months Sales in growth geographies1
Q4 2012
Last twelve months
Healthcare Consumer Lifestyle Lighting Philips Group
16 1 Growth geographies are all geographies excluding USA, Canada, Western Europe, Australia, New Zealand, South Korea, Japan and Israel
Note - All figures exclude discontinued operations
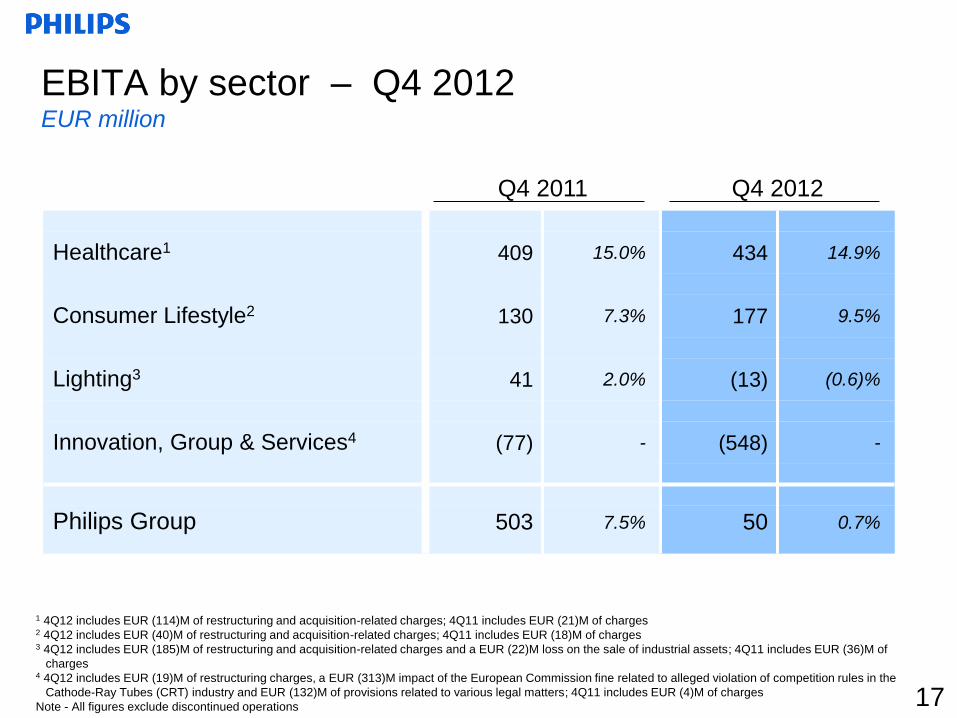
EBITA by sector – Q4 2012 EUR million
Q4 2011 Q4 2012
Healthcare1 409 15.0% 434 14.9%
Consumer Lifestyle2 130 7.3% 177 9.5%
Lighting3 41 2.0% (13) (0.6)%
Innovation, Group & Services4 (77) - (548) -
Philips Group 503 7.5% 50 0.7%
1 4Q12 includes EUR (114)M of restructuring and acquisition-related charges; 4Q11 includes EUR (21)M of charges 2 4Q12 includes EUR (40)M of restructuring and acquisition-related charges; 4Q11 includes EUR (18)M of charges 3 4Q12 includes EUR (185)M of restructuring and acquisition-related charges and a EUR (22)M loss on the sale of industrial assets; 4Q11 includes EUR (36)M of
charges 4 4Q12 includes EUR (19)M of restructuring charges, a EUR (313)M impact of the European Commission fine related to alleged violation of competition rules in the
Cathode-Ray Tubes (CRT) industry and EUR (132)M of provisions related to various legal matters; 4Q11 includes EUR (4)M of charges
Note - All figures exclude discontinued operations 17
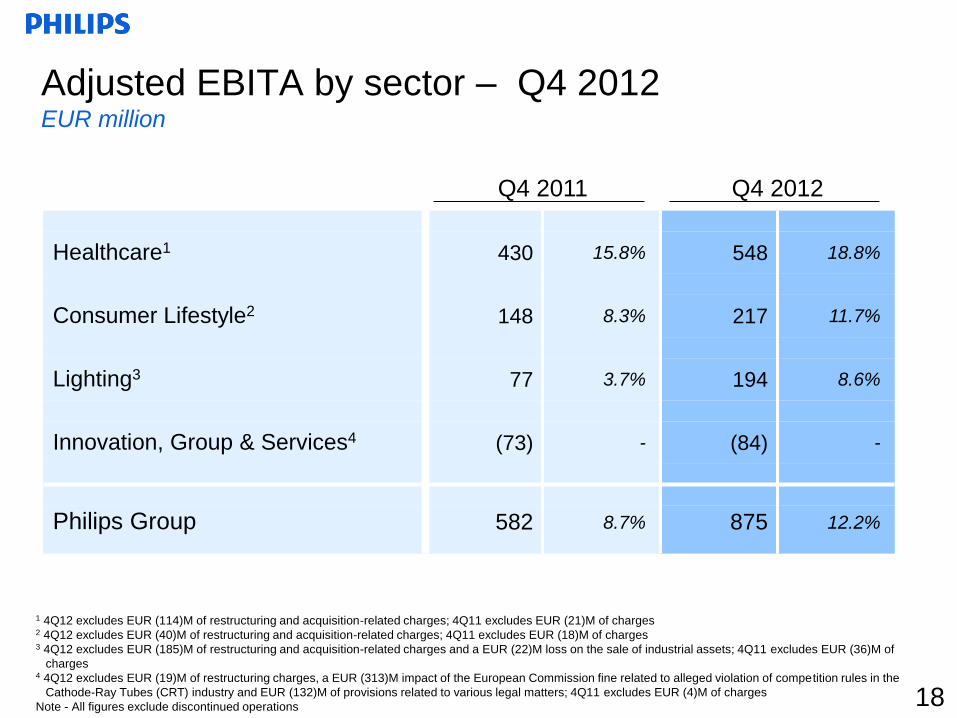
Adjusted EBITA by sector – Q4 2012 EUR million
Q4 2011 Q4 2012
Healthcare1 430 15.8% 548 18.8%
Consumer Lifestyle2 148 8.3% 217 11.7%
Lighting3 77 3.7% 194 8.6%
Innovation, Group & Services4 (73) - (84) -
Philips Group 582 8.7% 875 12.2%
18
1 4Q12 excludes EUR (114)M of restructuring and acquisition-related charges; 4Q11 excludes EUR (21)M of charges 2 4Q12 excludes EUR (40)M of restructuring and acquisition-related charges; 4Q11 excludes EUR (18)M of charges 3 4Q12 excludes EUR (185)M of restructuring and acquisition-related charges and a EUR (22)M loss on the sale of industrial assets; 4Q11 excludes EUR (36)M of
charges 4 4Q12 excludes EUR (19)M of restructuring charges, a EUR (313)M impact of the European Commission fine related to alleged violation of competition rules in the
Cathode-Ray Tubes (CRT) industry and EUR (132)M of provisions related to various legal matters; 4Q11 excludes EUR (4)M of charges
Note - All figures exclude discontinued operations
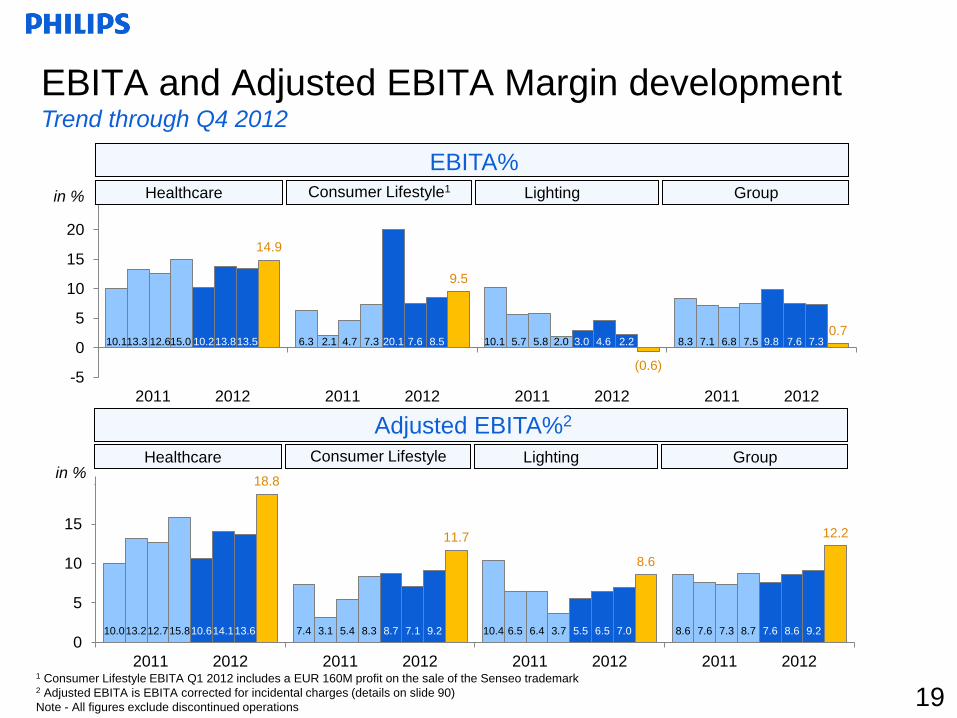
10.0 7.4 10.4 8.613.2 3.1 6.5 7.612.7 5.4 6.4 7.315.8 8.3 3.7 8.710.6 8.7 5.5 7.614.1 7.1 6.5 8.613.6 9.2 7.0 9.2
18.8
11.7
8.6
12.2
0
5
10
15
20
2011 2012 2011 2012 2011 2012 2011 2012
10.1 6.3 10.1 8.313.3 2.1 5.7 7.112.6 4.7 5.8 6.815.0 7.3 2.0 7.510.2 20.1 3.0 9.813.8 7.6 4.6 7.613.5 8.5 2.2 7.3
14.9
9.5
(0.6)
0.7
-5
0
5
10
15
20
25
2011 2012 2011 2012 2011 2012 2011 2012
EBITA and Adjusted EBITA Margin development Trend through Q4 2012
Healthcare Consumer Lifestyle Lighting Group
Adjusted EBITA%2
1 Consumer Lifestyle EBITA Q1 2012 includes a EUR 160M profit on the sale of the Senseo trademark 2 Adjusted EBITA is EBITA corrected for incidental charges (details on slide 90)
Note - All figures exclude discontinued operations
in %
19
Healthcare Consumer Lifestyle1 Lighting Group
EBITA%
in %
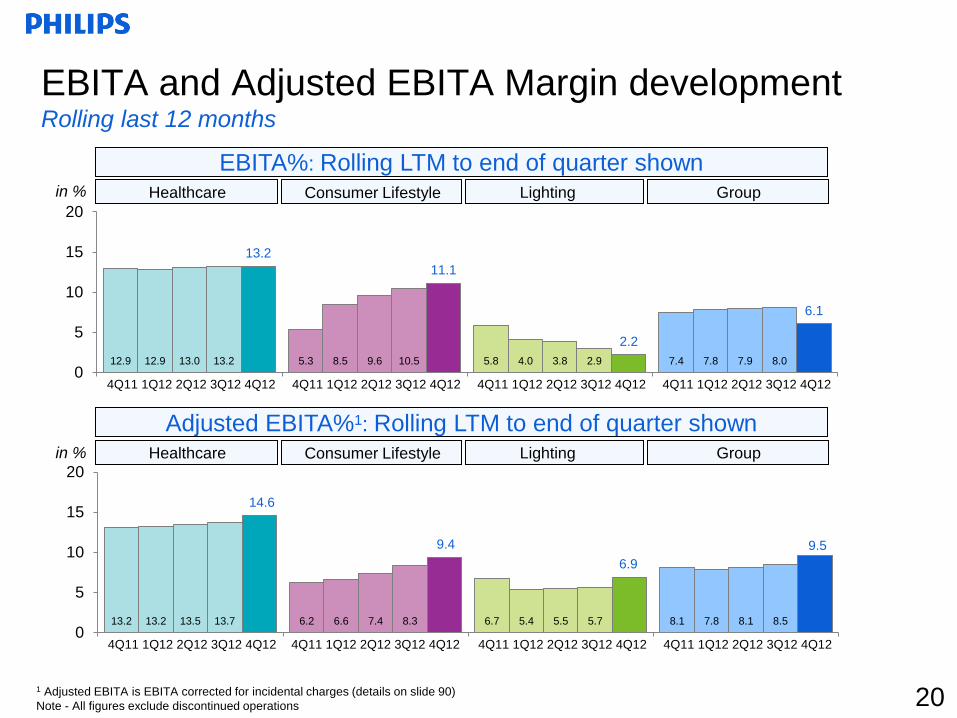
13.2 6.2 6.7 8.113.2 6.6 5.4 7.813.5 7.4 5.5 8.113.7 8.3 5.7 8.5
14.6
9.4
6.9
9.5
0
5
10
15
20
4Q11 1Q12 2Q12 3Q12 4Q12 4Q11 1Q12 2Q12 3Q12 4Q12 4Q11 1Q12 2Q12 3Q12 4Q12 4Q11 1Q12 2Q12 3Q12 4Q12
12.9 5.3 5.8 7.412.9 8.5 4.0 7.813.0 9.6 3.8 7.913.2 10.5 2.9 8.0
13.2
11.1
2.2
6.1
0
5
10
15
20
4Q11 1Q12 2Q12 3Q12 4Q12 4Q11 1Q12 2Q12 3Q12 4Q12 4Q11 1Q12 2Q12 3Q12 4Q12 4Q11 1Q12 2Q12 3Q12 4Q12
EBITA and Adjusted EBITA Margin development Rolling last 12 months
Healthcare Consumer Lifestyle Lighting Group
EBITA%: Rolling LTM to end of quarter shown
1 Adjusted EBITA is EBITA corrected for incidental charges (details on slide 90)
Note - All figures exclude discontinued operations
Healthcare Consumer Lifestyle Lighting Group
Adjusted EBITA%1: Rolling LTM to end of quarter shown
in %
in %
20
5%
10%
15%
20%
25%
0
1500
3000
4500
4Q10 1Q11 2Q11 3Q11 4Q11 1Q12 2Q12 3Q12 4Q12
2%
6%
10%
14%
18%
0
750
1500
2250
4Q10 1Q11 2Q11 3Q11 4Q11 1Q12 2Q12 3Q12 4Q12
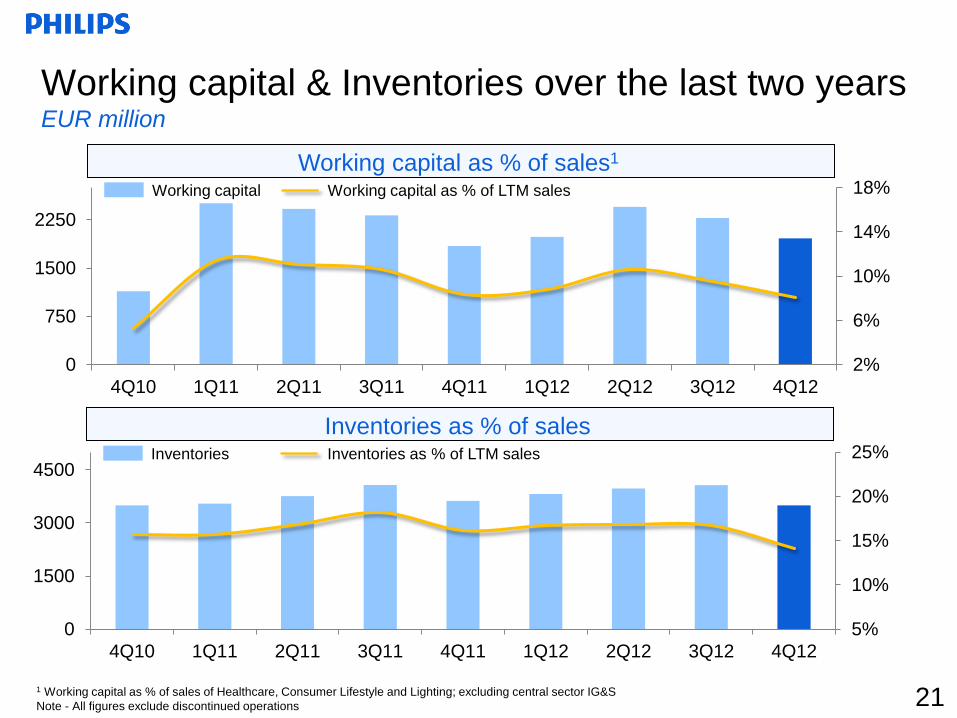
Inventories Inventories as % of LTM sales
1 Working capital as % of sales of Healthcare, Consumer Lifestyle and Lighting; excluding central sector IG&S
Note - All figures exclude discontinued operations
Working capital & Inventories over the last two years EUR million
Inventories as % of sales
Working capital Working capital as % of LTM sales
Working capital as % of sales1
21
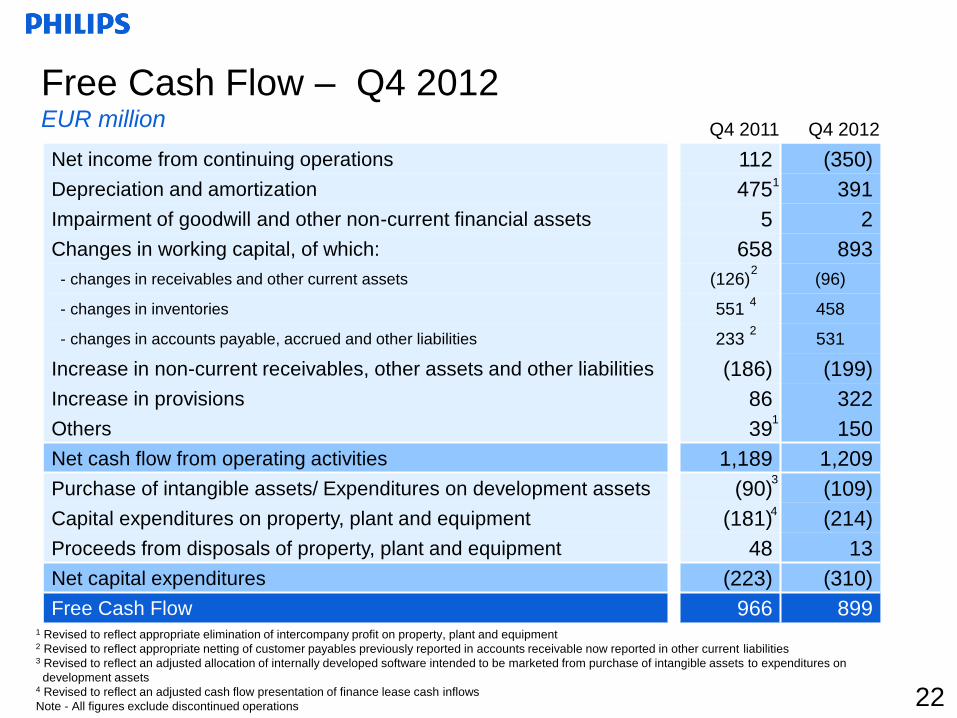
Q4 2011 Q4 2012
Net income from continuing operations 112 (350)
Depreciation and amortization 475 391
Impairment of goodwill and other non-current financial assets 5 2
Changes in working capital, of which: 658 893
- changes in receivables and other current assets (126) (96)
- changes in inventories 551 458
- changes in accounts payable, accrued and other liabilities 233 531
Increase in non-current receivables, other assets and other liabilities (186) (199)
Increase in provisions 86 322
Others 39 150
Net cash flow from operating activities 1,189 1,209
Purchase of intangible assets/ Expenditures on development assets (90) (109)
Capital expenditures on property, plant and equipment (181) (214)
Proceeds from disposals of property, plant and equipment 48 13
Net capital expenditures (223) (310)
Free Cash Flow 966 899
Free Cash Flow – Q4 2012 EUR million
1 Revised to reflect appropriate elimination of intercompany profit on property, plant and equipment 2 Revised to reflect appropriate netting of customer payables previously reported in accounts receivable now reported in other current liabilities 3 Revised to reflect an adjusted allocation of internally developed software intended to be marketed from purchase of intangible assets to expenditures on
development assets 4 Revised to reflect an adjusted cash flow presentation of finance lease cash inflows
Note - All figures exclude discontinued operations
1
1
4
22
2
2
3
4
6.0%
7.6%
9.5%
11.9% 11.8%
0.6%
-1.4%
-4.9%
-3.8%
8.8%9.4%
6.8%
11.3%
9.6%
7.3%8.1% 8.5%
-6%
-4%
-2%
0%
2%
4%
6%
8%
10%
12%
14%
1Q10 2Q10 3Q10 4Q10 1Q11 2Q11 3Q11 4Q11 1Q12 2Q12 3Q12 4Q12
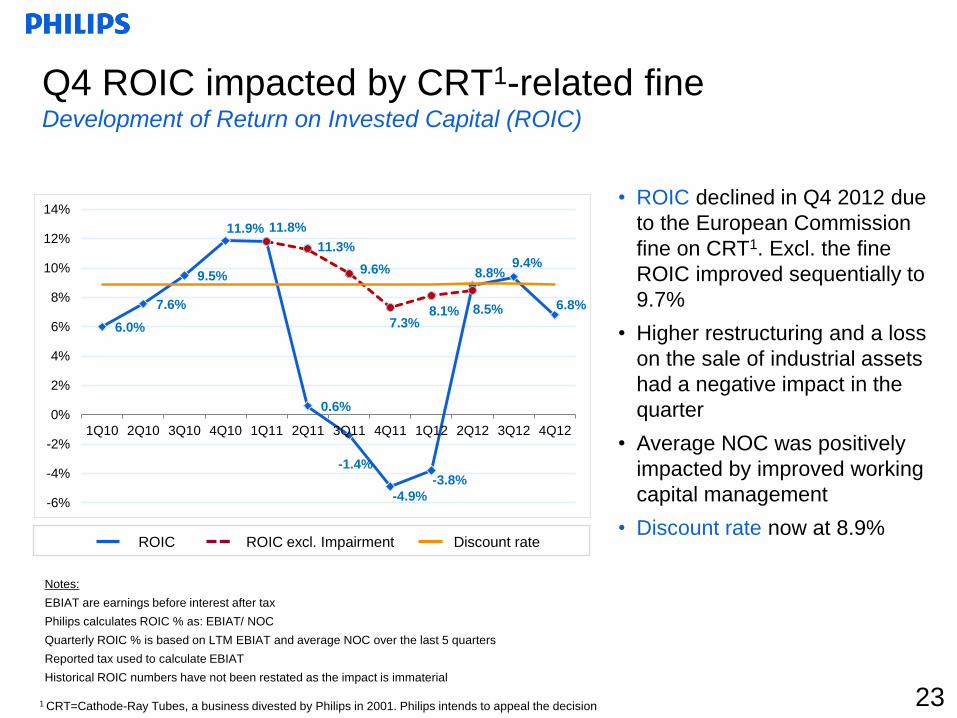
Q4 ROIC impacted by CRT1-related fine Development of Return on Invested Capital (ROIC)
Notes:
EBIAT are earnings before interest after tax
Philips calculates ROIC % as: EBIAT/ NOC
Quarterly ROIC % is based on LTM EBIAT and average NOC over the last 5 quarters
Reported tax used to calculate EBIAT
Historical ROIC numbers have not been restated as the impact is immaterial
• ROIC declined in Q4 2012 due
to the European Commission
fine on CRT1. Excl. the fine
ROIC improved sequentially to
9.7%
• Higher restructuring and a loss
on the sale of industrial assets
had a negative impact in the
quarter
• Average NOC was positively
impacted by improved working
capital management
• Discount rate now at 8.9% ROIC ROIC excl. Impairment Discount rate
23 1 CRT=Cathode-Ray Tubes, a business divested by Philips in 2001. Philips intends to appeal the decision
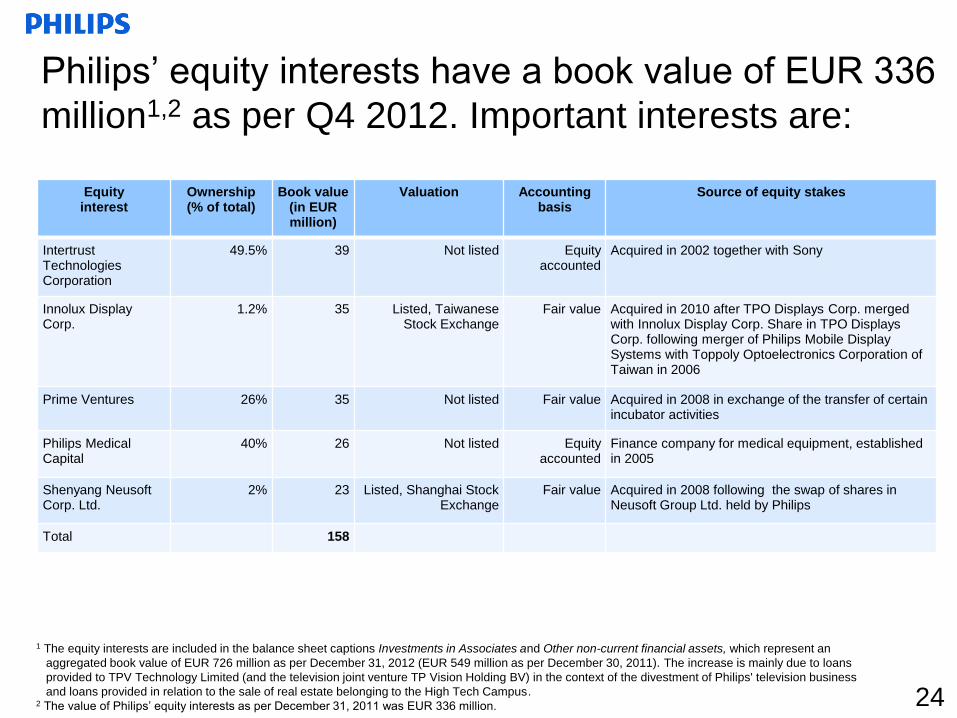
Philips’ equity interests have a book value of EUR 336
million1,2 as per Q4 2012. Important interests are:
Equity interest
Ownership (% of total)
Book value (in EUR million)
Valuation Accounting basis
Source of equity stakes
Intertrust Technologies Corporation
49.5% 39 Not listed Equity accounted
Acquired in 2002 together with Sony
Innolux Display Corp.
1.2% 35 Listed, Taiwanese Stock Exchange
Fair value Acquired in 2010 after TPO Displays Corp. merged with Innolux Display Corp. Share in TPO Displays Corp. following merger of Philips Mobile Display Systems with Toppoly Optoelectronics Corporation of Taiwan in 2006
Prime Ventures 26% 35 Not listed Fair value Acquired in 2008 in exchange of the transfer of certain incubator activities
Philips Medical Capital
40% 26 Not listed Equity accounted
Finance company for medical equipment, established in 2005
Shenyang Neusoft Corp. Ltd.
2% 23 Listed, Shanghai Stock Exchange
Fair value Acquired in 2008 following the swap of shares in Neusoft Group Ltd. held by Philips
Total 158
1 The equity interests are included in the balance sheet captions Investments in Associates and Other non-current financial assets, which represent an
aggregated book value of EUR 726 million as per December 31, 2012 (EUR 549 million as per December 30, 2011). The increase is mainly due to loans
provided to TPV Technology Limited (and the television joint venture TP Vision Holding BV) in the context of the divestment of Philips' television business
and loans provided in relation to the sale of real estate belonging to the High Tech Campus. 2 The value of Philips’ equity interests as per December 31, 2011 was EUR 336 million. 24
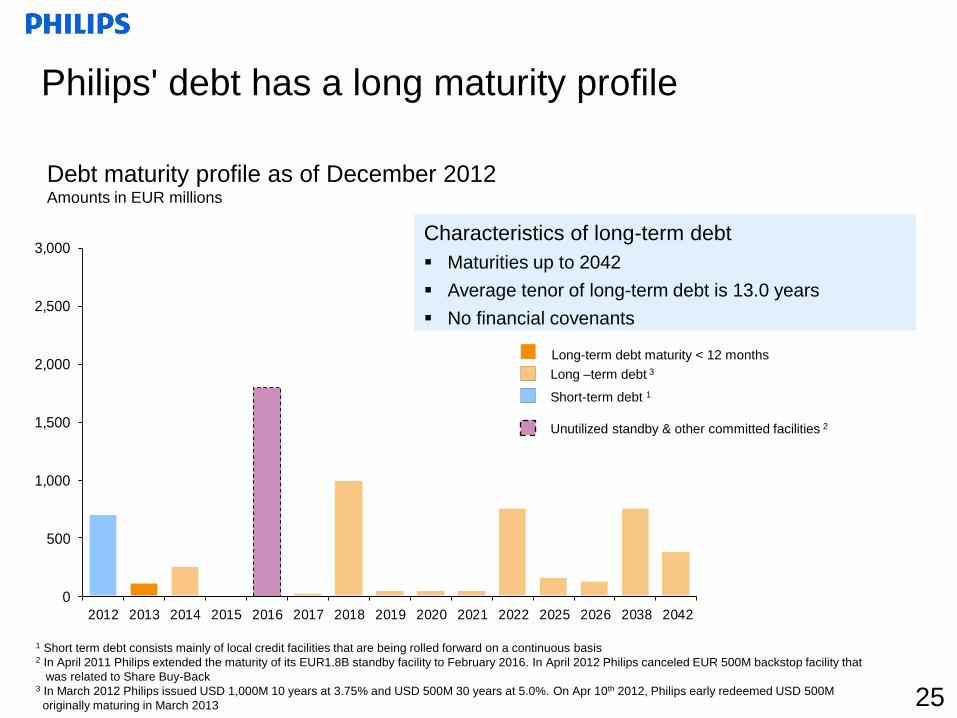
Philips' debt has a long maturity profile
Debt maturity profile as of December 2012 Amounts in EUR millions
1 Short term debt consists mainly of local credit facilities that are being rolled forward on a continuous basis 2 In April 2011 Philips extended the maturity of its EUR1.8B standby facility to February 2016. In April 2012 Philips canceled EUR 500M backstop facility that
was related to Share Buy-Back 3 In March 2012 Philips issued USD 1,000M 10 years at 3.75% and USD 500M 30 years at 5.0%. On Apr 10th 2012, Philips early redeemed USD 500M
originally maturing in March 2013
Characteristics of long-term debt
Maturities up to 2042
Average tenor of long-term debt is 13.0 years
No financial covenants
Long-term debt maturity < 12 months
Long –term debt 3
Short-term debt 1
Unutilized standby & other committed facilities 2
25
0
500
1,000
1,500
2,000
2,500
3,000
2012 2013 2014 2015 2016 2017 2018 2019 2020 2021 2022 2025 2026 2038 2042

0.140.18 0.18
0.230.25
0.30
0.36 0.36 0.36 0.360.40
0.44
0.60
0.70 0.70 0.70
0.75 0.75 0.75
1995 1996 1997 1998 1999 2000 2001 2002 2003 2004 2005 2006 2007 2008 2009 2010 2011 2012 2013
A history of sustainable dividend growth EUR cents per share
“We are committed to a stable dividend policy with a 40%
to 50% pay-out of continuing net income.”
26 1 Elective dividend, proposal subject to approval in the General Shareholders Meeting on May 3rd, 2013
1
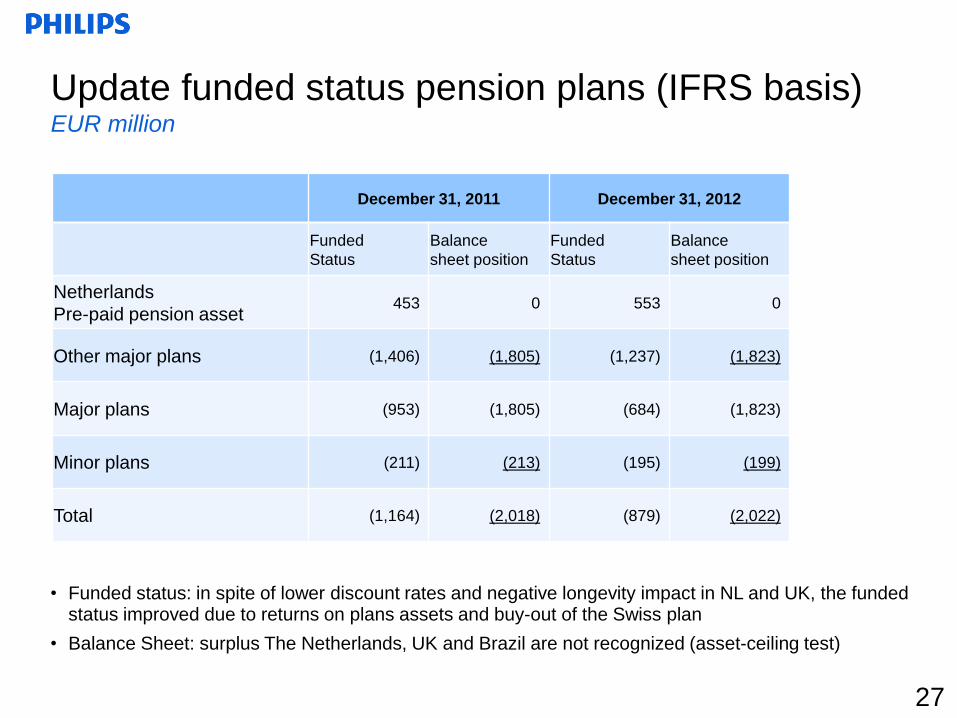
Update funded status pension plans (IFRS basis) EUR million
27
• Funded status: in spite of lower discount rates and negative longevity impact in NL and UK, the funded status improved due to returns on plans assets and buy-out of the Swiss plan
• Balance Sheet: surplus The Netherlands, UK and Brazil are not recognized (asset-ceiling test)
December 31, 2011 December 31, 2012
Funded
Status
Balance
sheet position
Funded
Status
Balance
sheet position
Netherlands
Pre-paid pension asset 453 0 553 0
Other major plans (1,406) (1,805) (1,237) (1,823)
Major plans (953) (1,805) (684) (1,823)
Minor plans (211) (213) (195) (199)
Total (1,164) (2,018) (879) (2,022)
Disciplined Capital Use
• Our objective is to have an A3/A- rating
• We will drive higher capital efficiency and cash flow yields through improved working
capital turns and CAPEX discipline
• We are committed to a stable dividend policy with a 40% to 50% pay-out of continuing net
income
• Cash will be used to:
- Invest in value creating growth (both organic and through acquisitions)
- Mitigate risk
- Return capital to shareholders over time
• We will exercise stringent discipline and return criteria (including ROIC hurdles) in our
end-to-end acquisition process in line with the nature of the transaction
28
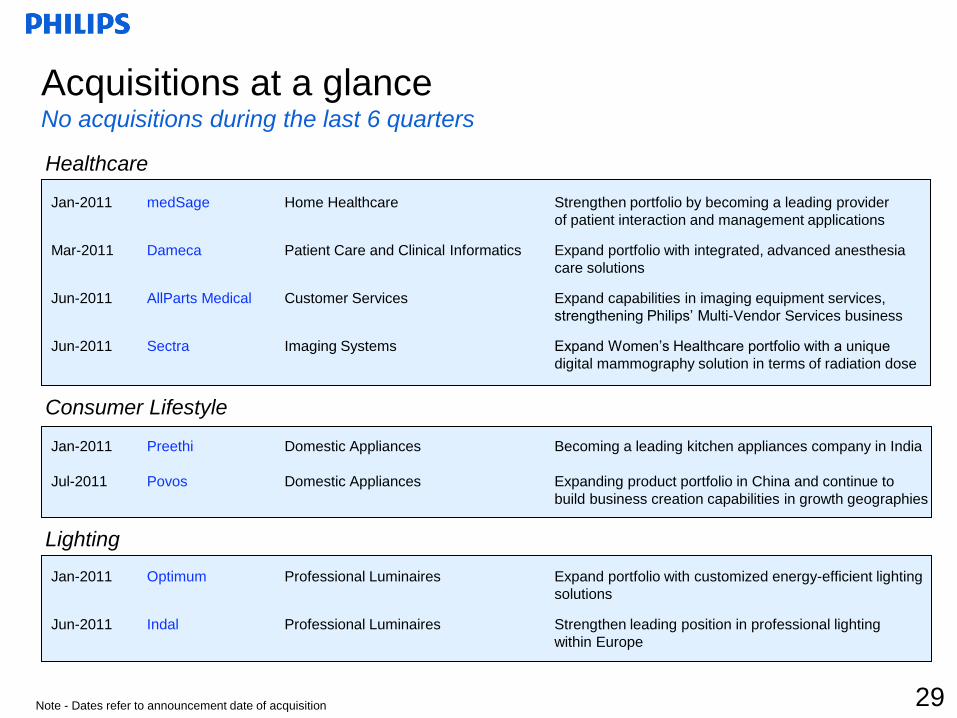
Jan-2011 Preethi Domestic Appliances Becoming a leading kitchen appliances company in India
Jul-2011 Povos Domestic Appliances Expanding product portfolio in China and continue to
build business creation capabilities in growth geographies
Jan-2011 Optimum Professional Luminaires Expand portfolio with customized energy-efficient lighting
solutions
Jun-2011 Indal Professional Luminaires Strengthen leading position in professional lighting
within Europe
Jan-2011 medSage Home Healthcare Strengthen portfolio by becoming a leading provider
of patient interaction and management applications
Mar-2011 Dameca Patient Care and Clinical Informatics Expand portfolio with integrated, advanced anesthesia
care solutions
Jun-2011 AllParts Medical Customer Services Expand capabilities in imaging equipment services,
strengthening Philips’ Multi-Vendor Services business
Jun-2011 Sectra Imaging Systems Expand Women’s Healthcare portfolio with a unique
digital mammography solution in terms of radiation dose
Acquisitions at a glance No acquisitions during the last 6 quarters
Note - Dates refer to announcement date of acquisition
Healthcare
Consumer Lifestyle
Lighting
29
1. Management update
2. Group results Q4 2012 and annual results
3. Accelerate! Change and performance
4. Portfolio strength and path to value
5. Group and sector overview
Agenda Agenda
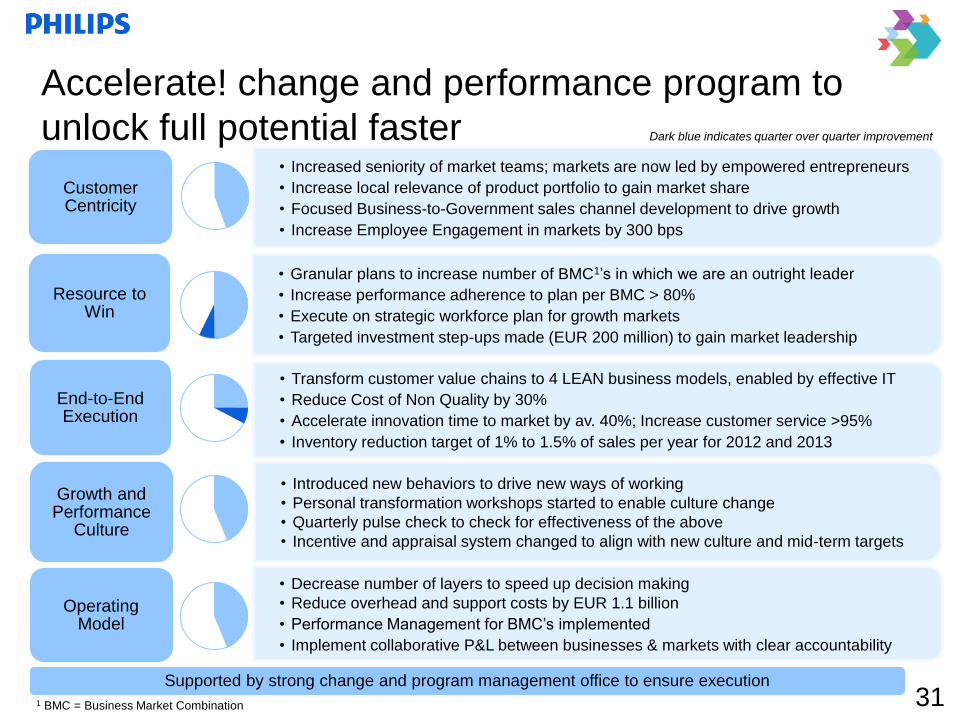
• Increased seniority of market teams; markets are now led by empowered entrepreneurs
• Increase local relevance of product portfolio to gain market share
• Focused Business-to-Government sales channel development to drive growth
• Increase Employee Engagement in markets by 300 bps
Customer Centricity
• Granular plans to increase number of BMC1’s in which we are an outright leader
• Increase performance adherence to plan per BMC > 80%
• Execute on strategic workforce plan for growth markets
• Targeted investment step-ups made (EUR 200 million) to gain market leadership
Resource to Win
• Transform customer value chains to 4 LEAN business models, enabled by effective IT
• Reduce Cost of Non Quality by 30%
• Accelerate innovation time to market by av. 40%; Increase customer service >95%
• Inventory reduction target of 1% to 1.5% of sales per year for 2012 and 2013
End-to-End Execution
• Introduced new behaviors to drive new ways of working
• Personal transformation workshops started to enable culture change
• Quarterly pulse check to check for effectiveness of the above
• Incentive and appraisal system changed to align with new culture and mid-term targets
Growth and Performance
Culture
• Decrease number of layers to speed up decision making
• Reduce overhead and support costs by EUR 1.1 billion
• Performance Management for BMC’s implemented
• Implement collaborative P&L between businesses & markets with clear accountability
Operating Model
Accelerate! change and performance program to
unlock full potential faster
Supported by strong change and program management office to ensure execution
Dark blue indicates quarter over quarter improvement
31 1 BMC = Business Market Combination
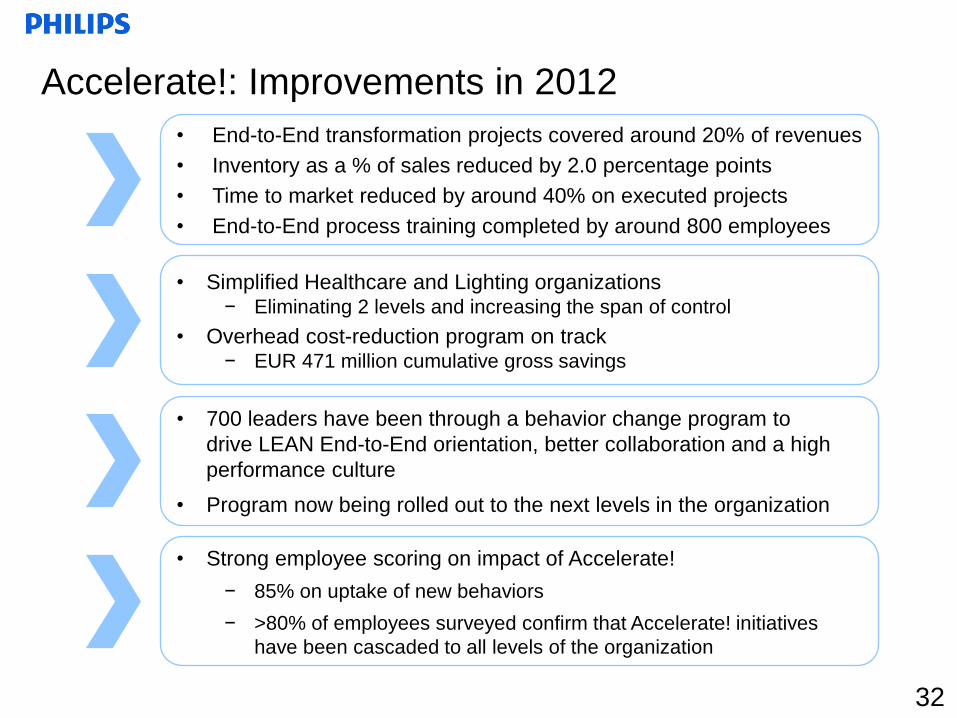
• Simplified Healthcare and Lighting organizations − Eliminating 2 levels and increasing the span of control
• Overhead cost-reduction program on track − EUR 471 million cumulative gross savings
• 700 leaders have been through a behavior change program to
drive LEAN End-to-End orientation, better collaboration and a high
performance culture
• Program now being rolled out to the next levels in the organization
• Strong employee scoring on impact of Accelerate!
− 85% on uptake of new behaviors
− >80% of employees surveyed confirm that Accelerate! initiatives
have been cascaded to all levels of the organization
Accelerate!: Improvements in 2012
• End-to-End transformation projects covered around 20% of revenues
• Inventory as a % of sales reduced by 2.0 percentage points
• Time to market reduced by around 40% on executed projects
• End-to-End process training completed by around 800 employees
32
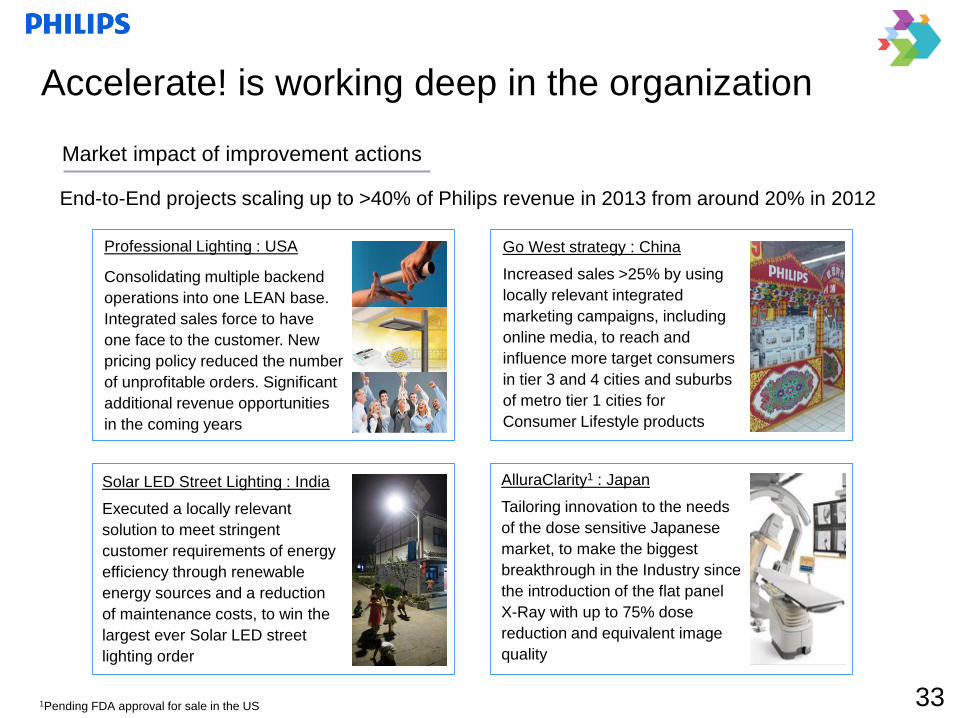
End-to-End projects scaling up to >40% of Philips revenue in 2013 from around 20% in 2012
Accelerate! is working deep in the organization
Market impact of improvement actions
33
Solar LED Street Lighting : India
Executed a locally relevant
solution to meet stringent
customer requirements of energy
efficiency through renewable
energy sources and a reduction
of maintenance costs, to win the
largest ever Solar LED street
lighting order
Go West strategy : China
Increased sales >25% by using
locally relevant integrated
marketing campaigns, including
online media, to reach and
influence more target consumers
in tier 3 and 4 cities and suburbs
of metro tier 1 cities for
Consumer Lifestyle products
AlluraClarity1 : Japan
Tailoring innovation to the needs
of the dose sensitive Japanese
market, to make the biggest
breakthrough in the Industry since
the introduction of the flat panel
X-Ray with up to 75% dose
reduction and equivalent image
quality
Professional Lighting : USA
Consolidating multiple backend
operations into one LEAN base.
Integrated sales force to have
one face to the customer. New
pricing policy reduced the number
of unprofitable orders. Significant
additional revenue opportunities
in the coming years
1Pending FDA approval for sale in the US
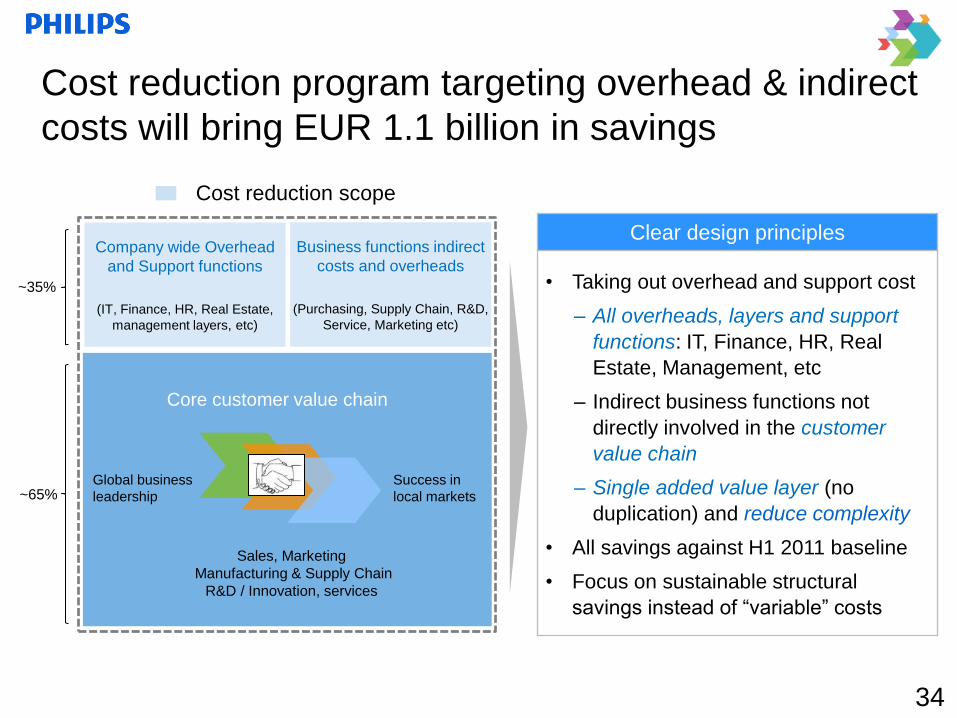
Cost reduction program targeting overhead & indirect
costs will bring EUR 1.1 billion in savings
Cost reduction scope
45
3
7
-93
• Taking out overhead and support cost
– All overheads, layers and support
functions: IT, Finance, HR, Real
Estate, Management, etc
– Indirect business functions not
directly involved in the customer
value chain
– Single added value layer (no
duplication) and reduce complexity
• All savings against H1 2011 baseline
• Focus on sustainable structural
savings instead of “variable” costs
Business functions indirect
costs and overheads
(Purchasing, Supply Chain, R&D,
Service, Marketing etc)
Sales, Marketing
Manufacturing & Supply Chain
R&D / Innovation, services
Company wide Overhead
and Support functions
(IT, Finance, HR, Real Estate,
management layers, etc)
~35%
~65%
Core customer value chain
Global business
leadership
Success in
local markets
34
Clear design principles
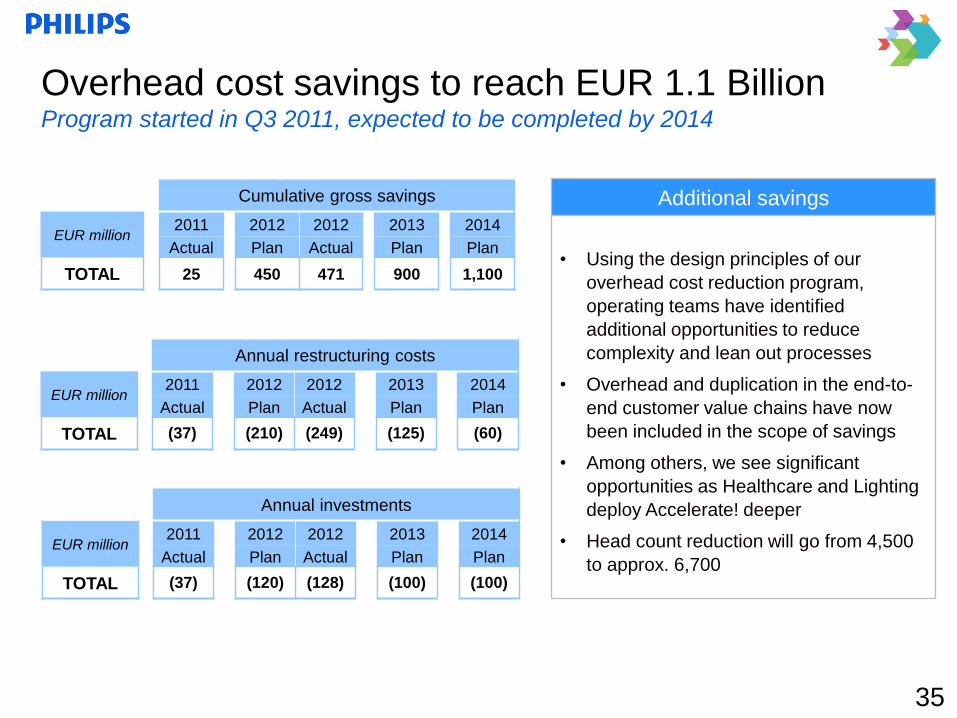
Additional savings
• Using the design principles of our
overhead cost reduction program,
operating teams have identified
additional opportunities to reduce
complexity and lean out processes
• Overhead and duplication in the end-to-
end customer value chains have now
been included in the scope of savings
• Among others, we see significant
opportunities as Healthcare and Lighting
deploy Accelerate! deeper
• Head count reduction will go from 4,500
to approx. 6,700
Overhead cost savings to reach EUR 1.1 Billion Program started in Q3 2011, expected to be completed by 2014
35
Cumulative gross savings
EUR million 2011 2012 2012 2013 2014
Actual Plan Actual Plan Plan
TOTAL 25 450 471 900 1,100
Annual restructuring costs
EUR million 2011 2012 2012 2013 2014
Actual Plan Actual Plan Plan
TOTAL (37) (210) (249) (125) (60)
Annual investments
EUR million 2011 2012 2012 2013 2014
Actual Plan Actual Plan Plan
TOTAL (37) (120) (128) (100) (100)
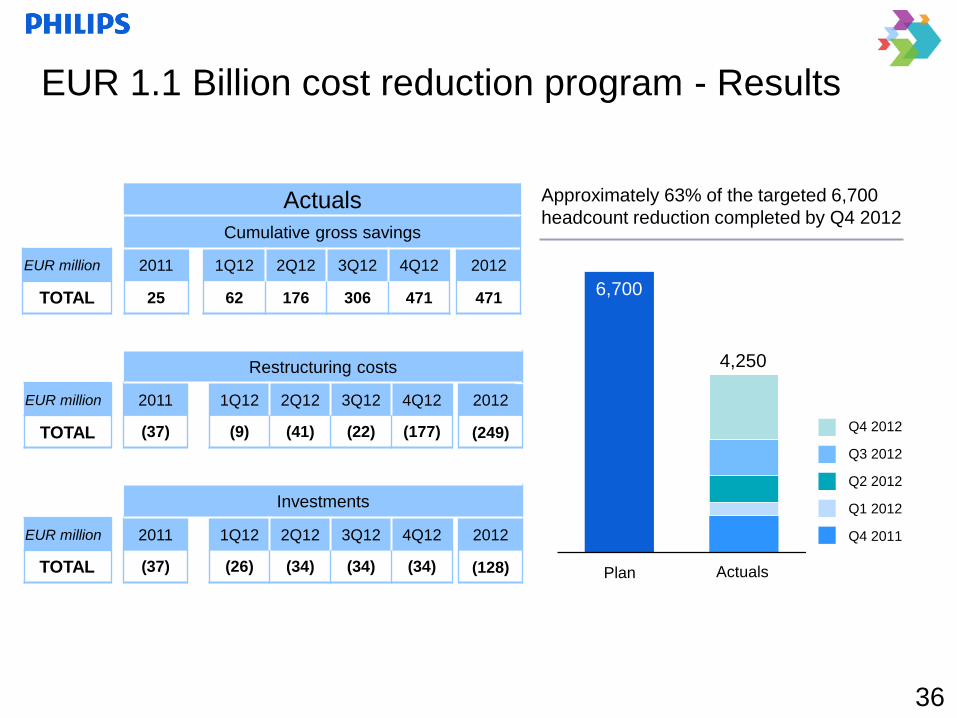
Actuals
Cumulative gross savings
EUR million 2011 1Q12 2Q12 3Q12 4Q12 2012
TOTAL 25 62 176 306 471 471
Restructuring costs
EUR million 2011 1Q12 2Q12 3Q12 4Q12 2012
TOTAL (37) (9) (41) (22) (177) (249)
Investments
EUR million 2011 1Q12 2Q12 3Q12 4Q12 2012
TOTAL (37) (26) (34) (34) (34) (128)
EUR 1.1 Billion cost reduction program - Results
Approximately 63% of the targeted 6,700
headcount reduction completed by Q4 2012
Plan Actuals
6,700
4,250
36
Q4 2012
Q3 2012
Q2 2012
Q1 2012
Q4 2011
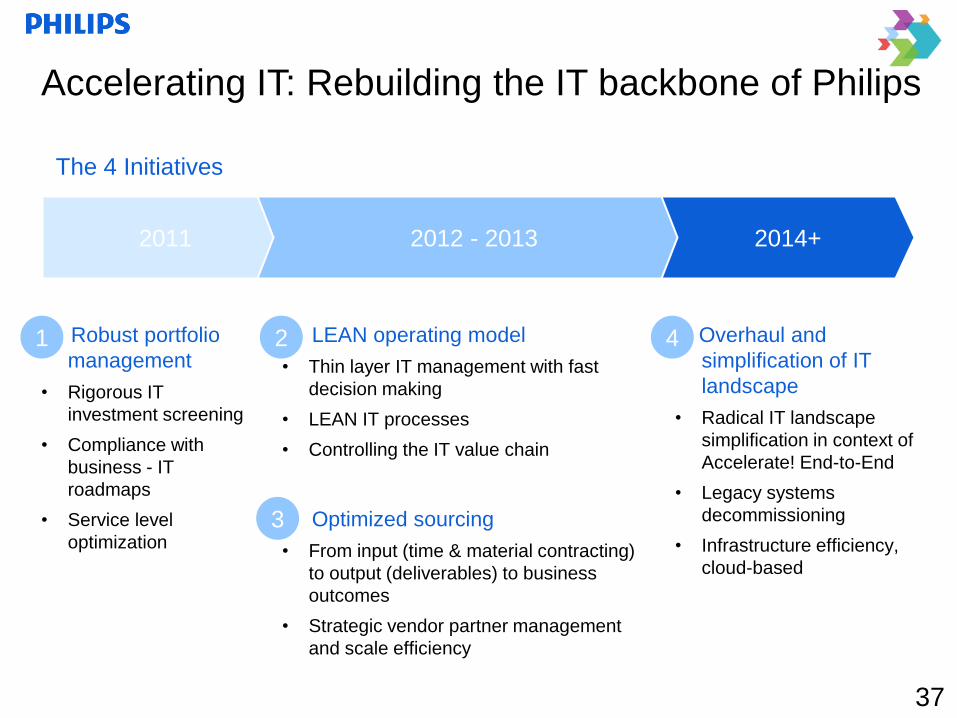
2014+ 2012 - 2013 2011
Robust portfolio
management
• Rigorous IT
investment screening
• Compliance with
business - IT
roadmaps
• Service level
optimization
1 LEAN operating model
• Thin layer IT management with fast
decision making
• LEAN IT processes
• Controlling the IT value chain
2
Optimized sourcing
• From input (time & material contracting)
to output (deliverables) to business
outcomes
• Strategic vendor partner management
and scale efficiency
3
Overhaul and
simplification of IT
landscape
• Radical IT landscape
simplification in context of
Accelerate! End-to-End
• Legacy systems
decommissioning
• Infrastructure efficiency,
cloud-based
4
The 4 Initiatives
Accelerating IT: Rebuilding the IT backbone of Philips
37
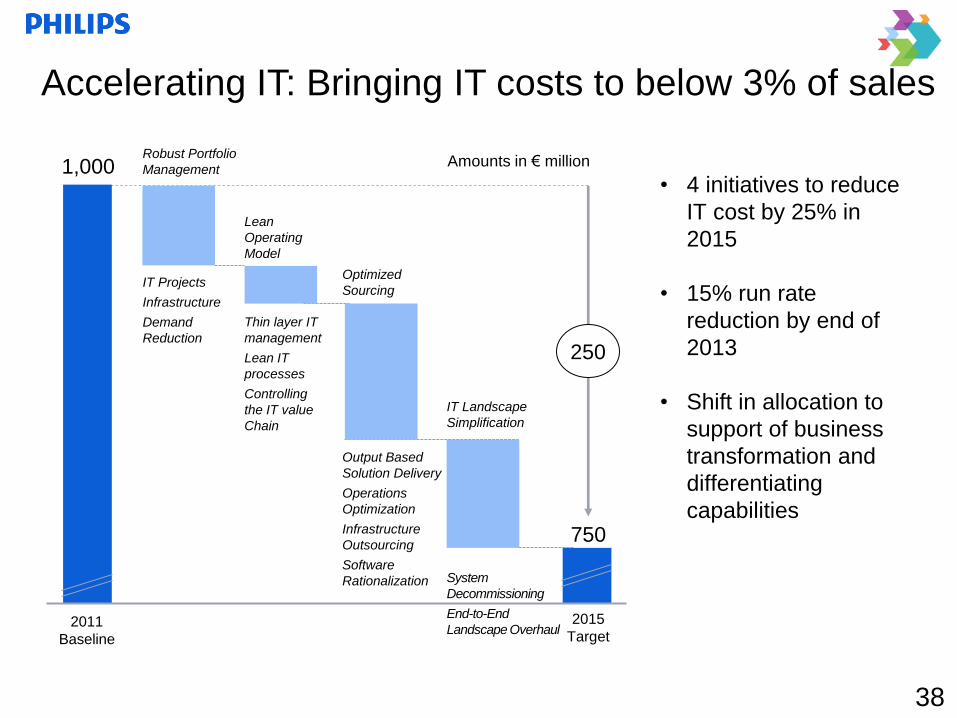
System
Decommissioning
End-to-End
Landscape Overhaul
• 4 initiatives to reduce
IT cost by 25% in
2015
• 15% run rate
reduction by end of
2013
• Shift in allocation to
support of business
transformation and
differentiating
capabilities
2011
Baseline
2015
Target
IT Landscape
Simplification
Lean
Operating
Model
Robust Portfolio
Management
IT Projects
Infrastructure
Demand
Reduction
Thin layer IT
management
Lean IT
processes
Controlling
the IT value
Chain
1,000
750
250
Output Based
Solution Delivery
Operations
Optimization
Infrastructure
Outsourcing
Software
Rationalization
Optimized
Sourcing
Amounts in € million
Accelerating IT: Bringing IT costs to below 3% of sales
38
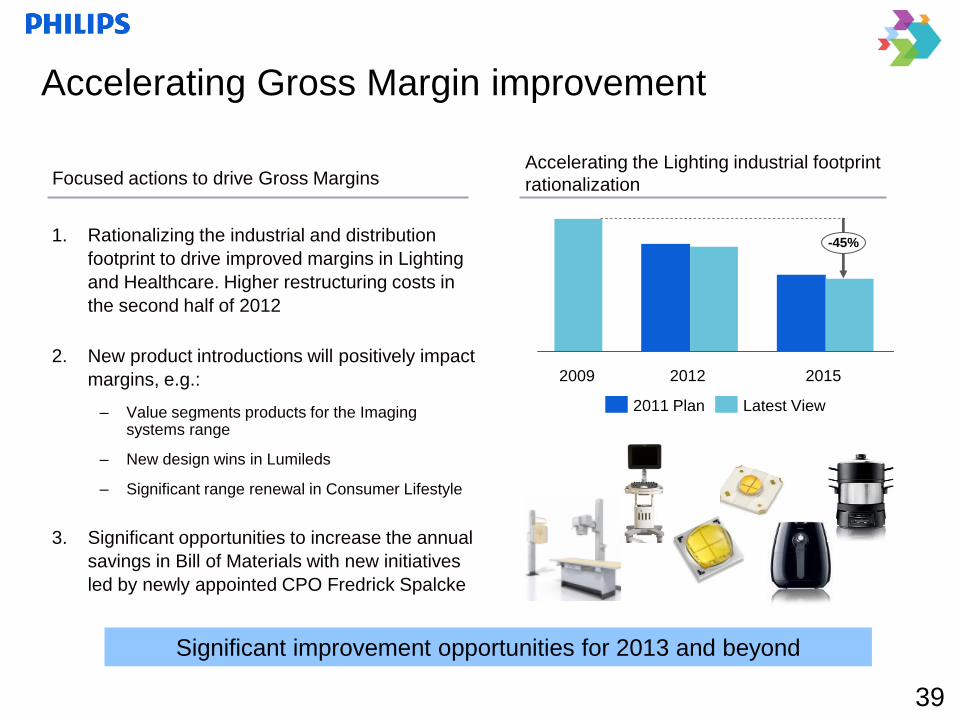
Accelerating Gross Margin improvement
1. Rationalizing the industrial and distribution
footprint to drive improved margins in Lighting
and Healthcare. Higher restructuring costs in
the second half of 2012
2. New product introductions will positively impact
margins, e.g.:
– Value segments products for the Imaging systems range
– New design wins in Lumileds
– Significant range renewal in Consumer Lifestyle
3. Significant opportunities to increase the annual
savings in Bill of Materials with new initiatives
led by newly appointed CPO Fredrick Spalcke
Focused actions to drive Gross Margins
Significant improvement opportunities for 2013 and beyond
Accelerating the Lighting industrial footprint
rationalization
-45%
2015 2012 2009
Latest View 2011 Plan
2009
39
1. Management update
2. Group results Q4 2012 and annual results
3. Accelerate! Change and performance
4. Portfolio strength and path to value
5. Group and sector overview
Agenda Agenda
Healthcare Consumer Lifestyle Lighting Semiconductors
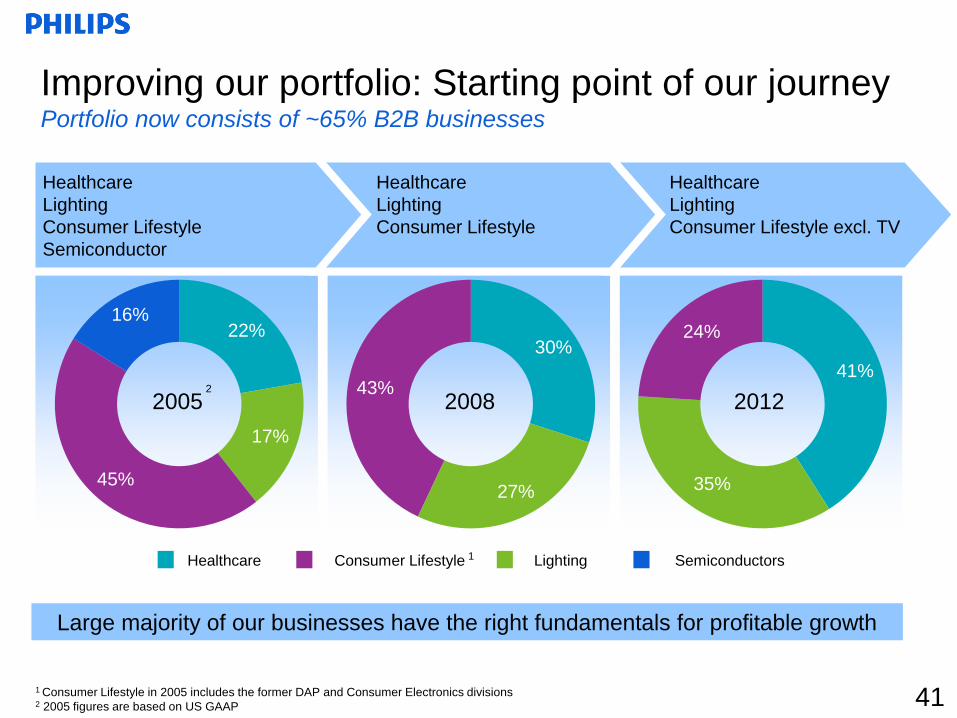
Improving our portfolio: Starting point of our journey Portfolio now consists of ~65% B2B businesses
16% 22%
30% 24%
41%
35%
2008 2005
17%
43%
45% 27%
Ju
Healthcare
Lighting
Consumer Lifestyle
Semiconductor
Healthcare
Lighting
Consumer Lifestyle excl. TV
Healthcare
Lighting
Consumer Lifestyle
1 Consumer Lifestyle in 2005 includes the former DAP and Consumer Electronics divisions 2 2005 figures are based on US GAAP
2
Large majority of our businesses have the right fundamentals for profitable growth
1
2012
41
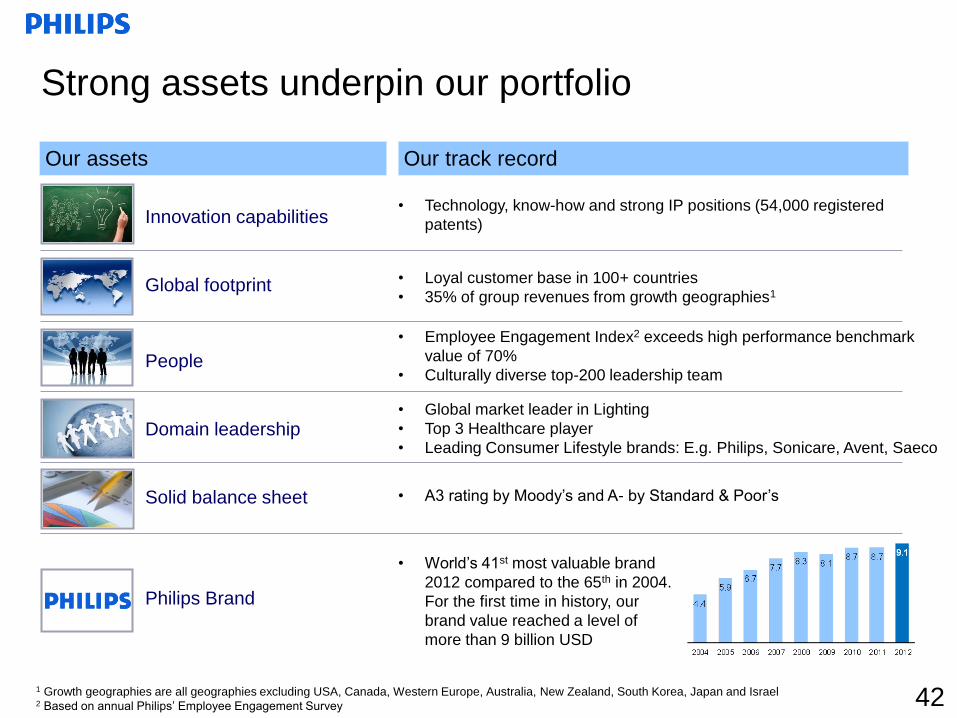
• World’s 41st most valuable brand
2012 compared to the 65th in 2004.
For the first time in history, our
brand value reached a level of
more than 9 billion USD
Our assets
Strong assets underpin our portfolio
Our track record
Innovation capabilities
Global footprint
People
Domain leadership
Solid balance sheet
• Loyal customer base in 100+ countries
• 35% of group revenues from growth geographies1
• Employee Engagement Index2 exceeds high performance benchmark
value of 70%
• Culturally diverse top-200 leadership team
• Global market leader in Lighting
• Top 3 Healthcare player
• Leading Consumer Lifestyle brands: E.g. Philips, Sonicare, Avent, Saeco
• A3 rating by Moody’s and A- by Standard & Poor’s
• Technology, know-how and strong IP positions (54,000 registered
patents)
1 Growth geographies are all geographies excluding USA, Canada, Western Europe, Australia, New Zealand, South Korea, Japan and Israel 2 Based on annual Philips’ Employee Engagement Survey 42
Philips Brand
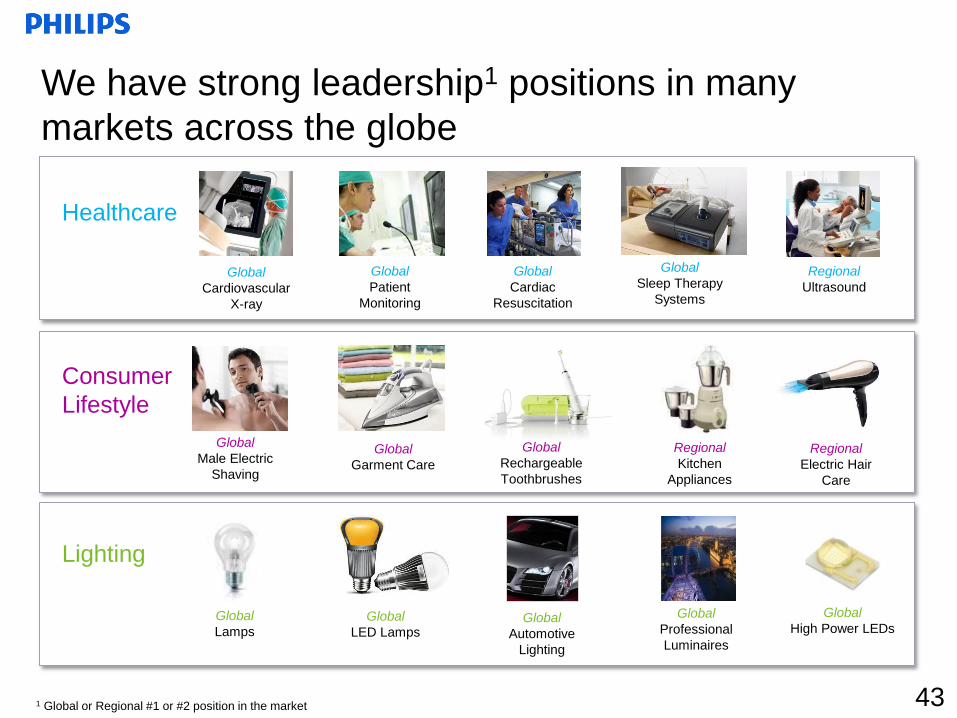
We have strong leadership1 positions in many
markets across the globe
43
Global
Cardiovascular
X-ray
Regional
Ultrasound
Global
Patient
Monitoring
Global
Cardiac
Resuscitation
Global
Lamps
Global
Male Electric
Shaving
Healthcare
Lighting
Consumer
Lifestyle
Global
Sleep Therapy
Systems
Global
Garment Care
Global
Rechargeable
Toothbrushes
Regional
Kitchen
Appliances
Regional
Electric Hair
Care
Global
LED Lamps Global
Automotive
Lighting
Global
Professional
Luminaires
Global
High Power LEDs
Global
Cardiovascular
X-ray
1 Global or Regional #1 or #2 position in the market
He
alth
ca
re
Lig
htin
g
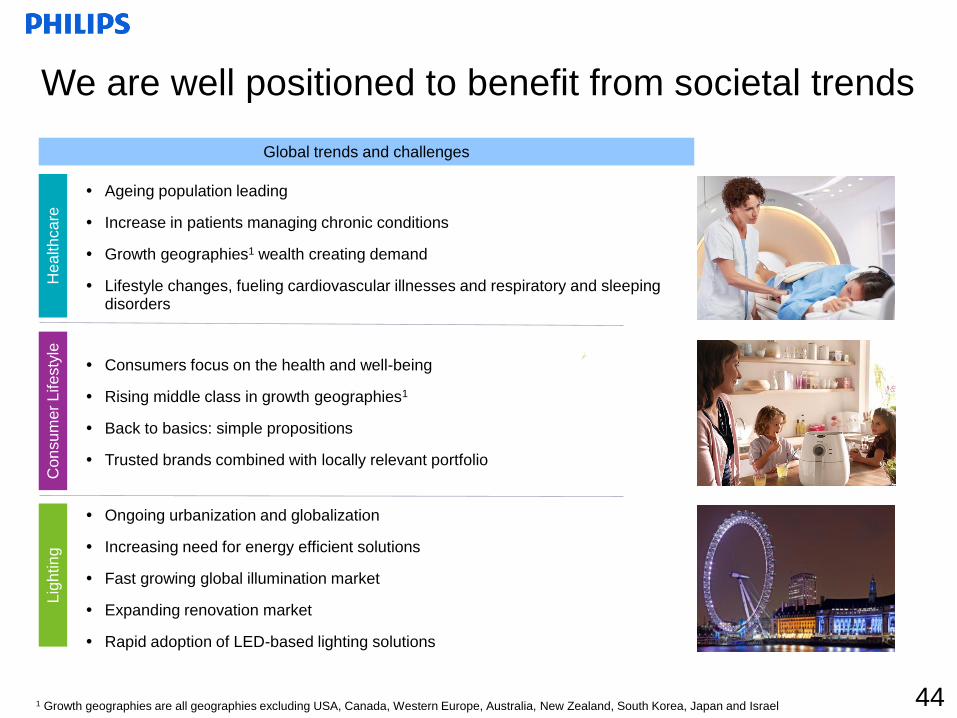
Ongoing urbanization and globalization
Increasing need for energy efficient solutions
Fast growing global illumination market
Expanding renovation market
Rapid adoption of LED-based lighting solutions
We are well positioned to benefit from societal trends
Con
su
mer
Life
sty
le
Ageing population leading
Increase in patients managing chronic conditions
Growth geographies1 wealth creating demand
Lifestyle changes, fueling cardiovascular illnesses and respiratory and sleeping disorders
Consumers focus on the health and well-being
Rising middle class in growth geographies1
Back to basics: simple propositions
Trusted brands combined with locally relevant portfolio
Global trends and challenges
44 1 Growth geographies are all geographies excluding USA, Canada, Western Europe, Australia, New Zealand, South Korea, Japan and Israel
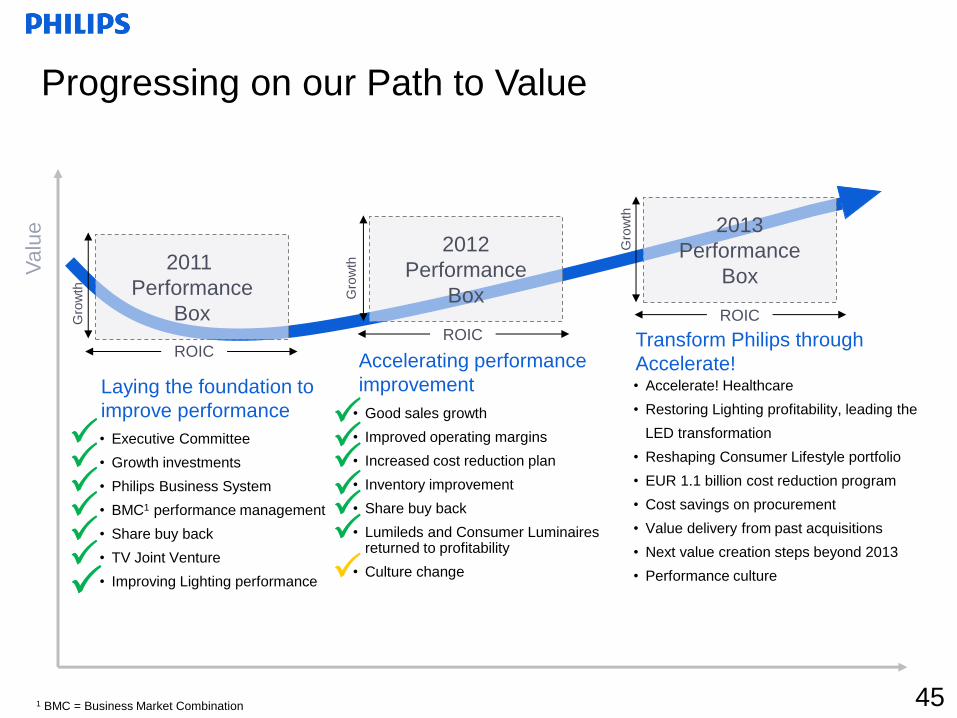
2013
Performance
Box
• Executive Committee
• Growth investments
• Philips Business System
• BMC1 performance management
• Share buy back
• TV Joint Venture
• Improving Lighting performance
Valu
e
ROIC
2011
Performance
Box Gro
wth
ROIC
Laying the foundation to
improve performance
Transform Philips through
Accelerate! • Accelerate! Healthcare
• Restoring Lighting profitability, leading the
LED transformation
• Reshaping Consumer Lifestyle portfolio
• EUR 1.1 billion cost reduction program
• Cost savings on procurement
• Value delivery from past acquisitions
• Next value creation steps beyond 2013
• Performance culture
Gro
wth
1 BMC = Business Market Combination
Progressing on our Path to Value
45
2012
Performance
Box
• Good sales growth
• Improved operating margins
• Increased cost reduction plan
• Inventory improvement
• Share buy back
• Lumileds and Consumer Luminaires returned to profitability
• Culture change
Accelerating performance
improvement
Gro
wth
ROIC
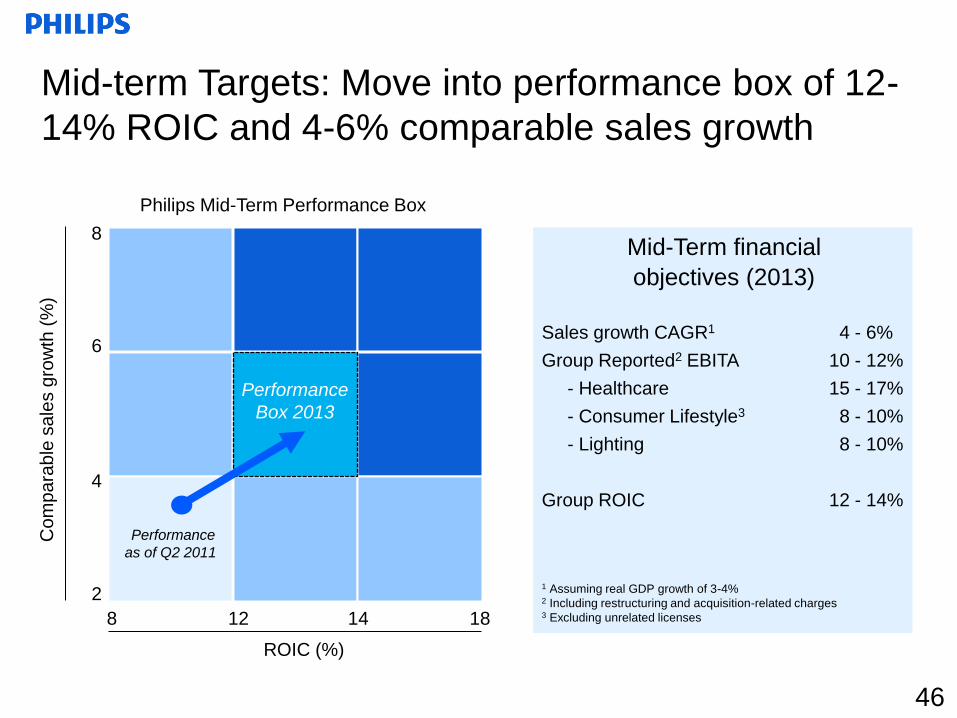
ROIC (%)
4
6
8
2
8 12 14 18
Co
mp
ara
ble
sa
les g
row
th (
%)
Performance
Box 2013
Performance
as of Q2 2011
Philips Mid-Term Performance Box
Mid-Term financial
objectives (2013)
Sales growth CAGR1 4 - 6%
Group Reported2 EBITA 10 - 12%
- Healthcare 15 - 17%
- Consumer Lifestyle3 8 - 10%
- Lighting 8 - 10%
Group ROIC 12 - 14%
1 Assuming real GDP growth of 3-4% 2 Including restructuring and acquisition-related charges 3 Excluding unrelated licenses
Mid-term Targets: Move into performance box of 12-
14% ROIC and 4-6% comparable sales growth
46
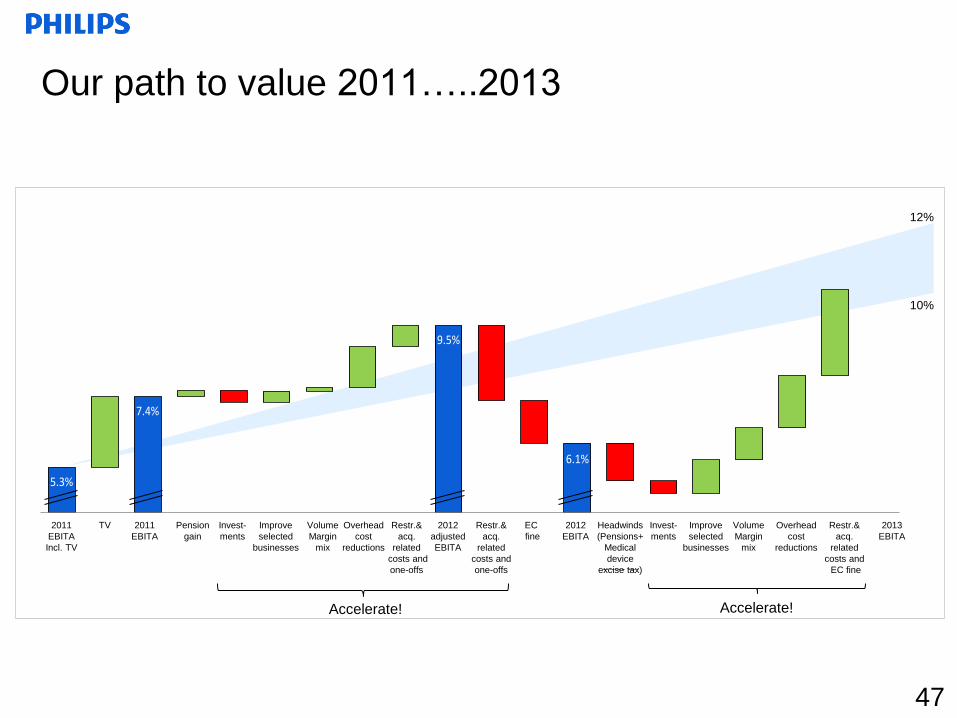
5.3%
7.4%
9.5%
6.1%
2011EBITAincl. TV
TV 2011EBITA
Pensiongain
Invest-ments
Improveselected
businesses
VolumeMargin
mix
Overheadcost
reductions
Restr. &acq. relatedcosts andone-offs
2012adjustedEBITA
Restr. &acq. relatedcosts andone-offs
EC fine 2012EBITA
Headwinds(Pensions+ Medical
deviceexcise tax
Invest-ments
Improveselected
businesses
VolumeMargin
mix
Overheadcost
reductions
Restr. &acq. relatedcosts andEC fine
2013EBITA
12%
10%
Our path to value 2011…..2013
Accelerate!
47
Accelerate!
2011
EBITA
Incl. TV
TV 2011
EBITA
Pension
gain
Invest-
ments
Improve
selected
businesses
Volume
Margin
mix
Overhead
cost
reductions
Restr.&
acq.
related
costs and
one-offs
Restr.&
acq.
related
costs and
EC fine
Headwinds
(Pensions+
Medical
device
excise tax)
Restr.&
acq.
related
costs and
one-offs
EC
fine
2012
EBITA
2013
EBITA
2012
adjusted
EBITA
Invest-
ments
Improve
selected
businesses
Volume
Margin
mix
Overhead
cost
reductions
1. Management update
2. Group results Q4 2012 and annual results
3. Accelerate! Change and performance
4. Portfolio strength and path to value
5. Group and sector overview
Agenda Agenda
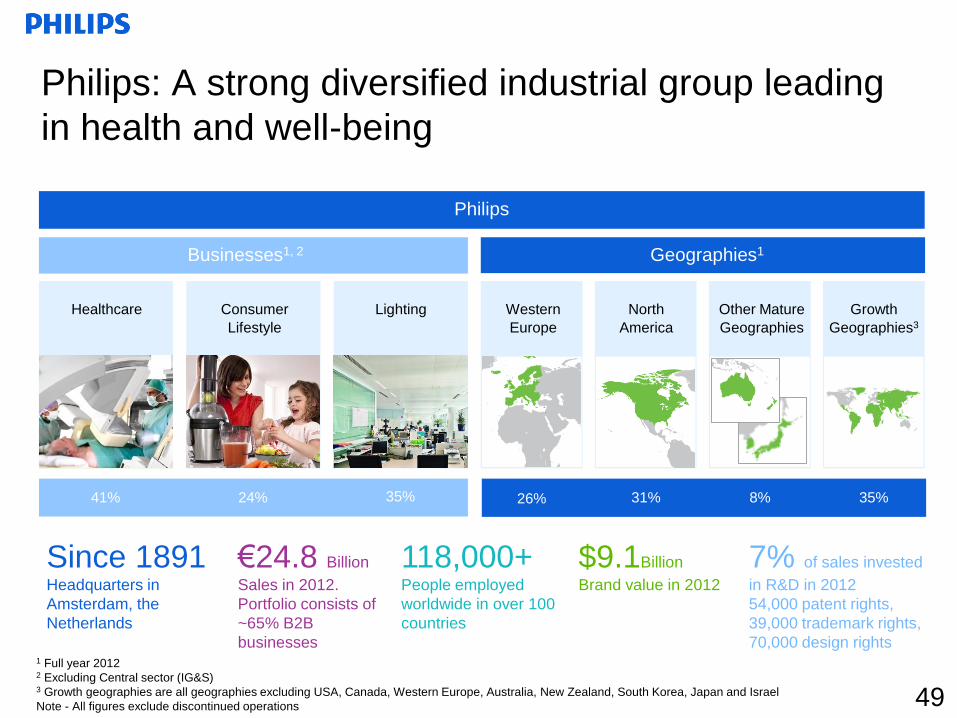
Philips: A strong diversified industrial group leading
in health and well-being
Philips
Businesses1, 2 Geographies1
Healthcare Consumer
Lifestyle
Lighting North
America
Other Mature
Geographies
31% 8% 35%
Growth
Geographies3
41%
€24.8 Billion
Sales in 2012.
Portfolio consists of
~65% B2B
businesses
118,000+ People employed
worldwide in over 100
countries
24% 35%
Since 1891 Headquarters in
Amsterdam, the
Netherlands
7% of sales invested
in R&D in 2012
54,000 patent rights,
39,000 trademark rights,
70,000 design rights
Western
Europe
26%
$9.1Billion
Brand value in 2012
1 Full year 2012 2 Excluding Central sector (IG&S) 3 Growth geographies are all geographies excluding USA, Canada, Western Europe, Australia, New Zealand, South Korea, Japan and Israel
Note - All figures exclude discontinued operations 49
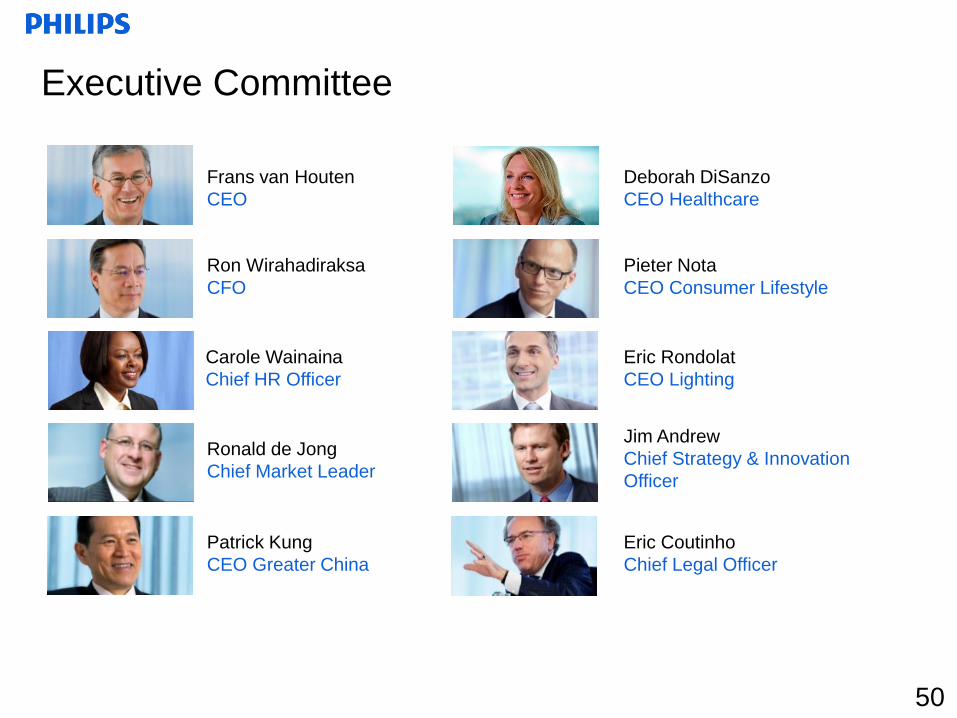
Executive Committee
Frans van Houten
CEO
Deborah DiSanzo
CEO Healthcare
Ron Wirahadiraksa
CFO
Ronald de Jong
Chief Market Leader
Patrick Kung
CEO Greater China
Jim Andrew
Chief Strategy & Innovation
Officer
Eric Rondolat
CEO Lighting
Carole Wainaina
Chief HR Officer
Eric Coutinho
Chief Legal Officer
Pieter Nota
CEO Consumer Lifestyle
50
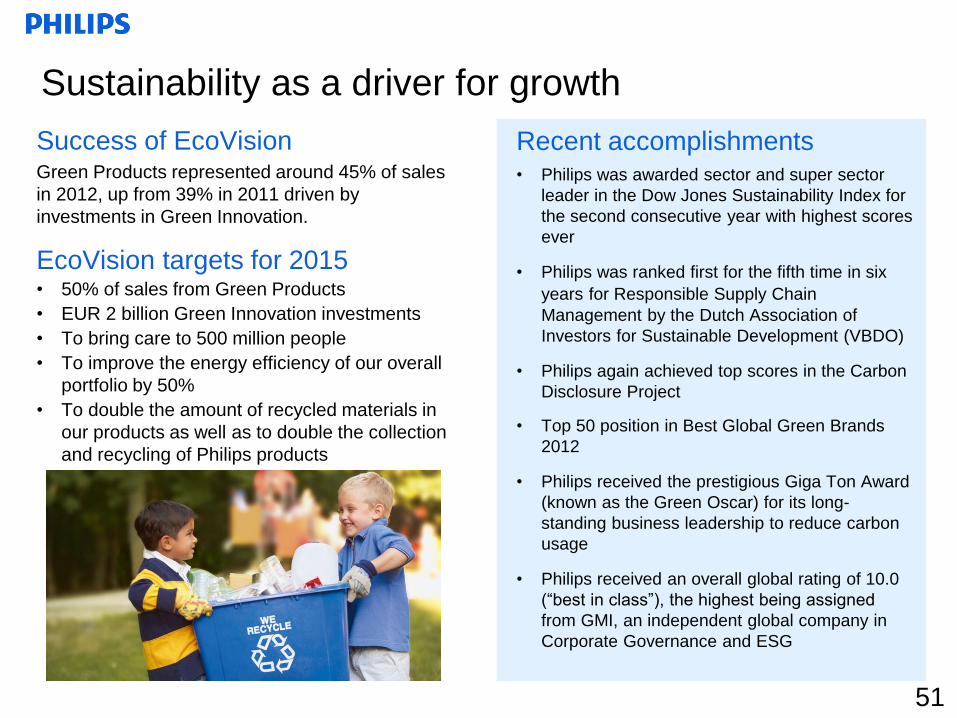
Sustainability as a driver for growth
Success of EcoVision Green Products represented around 45% of sales
in 2012, up from 39% in 2011 driven by
investments in Green Innovation.
EcoVision targets for 2015
• 50% of sales from Green Products
• EUR 2 billion Green Innovation investments
• To bring care to 500 million people
• To improve the energy efficiency of our overall
portfolio by 50%
• To double the amount of recycled materials in
our products as well as to double the collection
and recycling of Philips products
Recent accomplishments
• Philips was awarded sector and super sector
leader in the Dow Jones Sustainability Index for
the second consecutive year with highest scores
ever
• Philips was ranked first for the fifth time in six
years for Responsible Supply Chain
Management by the Dutch Association of
Investors for Sustainable Development (VBDO)
• Philips again achieved top scores in the Carbon
Disclosure Project
• Top 50 position in Best Global Green Brands
2012
• Philips received the prestigious Giga Ton Award
(known as the Green Oscar) for its long-
standing business leadership to reduce carbon
usage
• Philips received an overall global rating of 10.0
(“best in class”), the highest being assigned
from GMI, an independent global company in
Corporate Governance and ESG
51
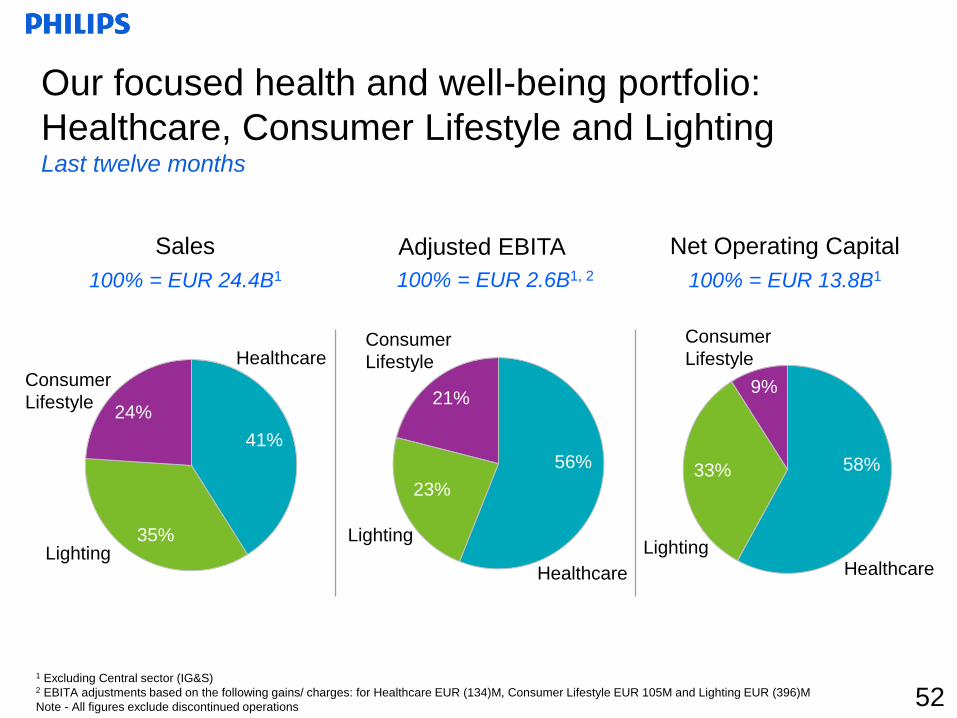
Our focused health and well-being portfolio:
Healthcare, Consumer Lifestyle and Lighting Last twelve months
Net Operating Capital Sales
100% = EUR 24.4B1 100% = EUR 13.8B1 100% = EUR 2.6B1, 2
Adjusted EBITA
Healthcare
Consumer
Lifestyle
Lighting
Healthcare Consumer
Lifestyle
Lighting
21%
23%
56% 41%
35%
24%
58%
9%
33%
Consumer
Lifestyle
Lighting Healthcare
1 Excluding Central sector (IG&S) 2 EBITA adjustments based on the following gains/ charges: for Healthcare EUR (134)M, Consumer Lifestyle EUR 105M and Lighting EUR (396)M
Note - All figures exclude discontinued operations 52
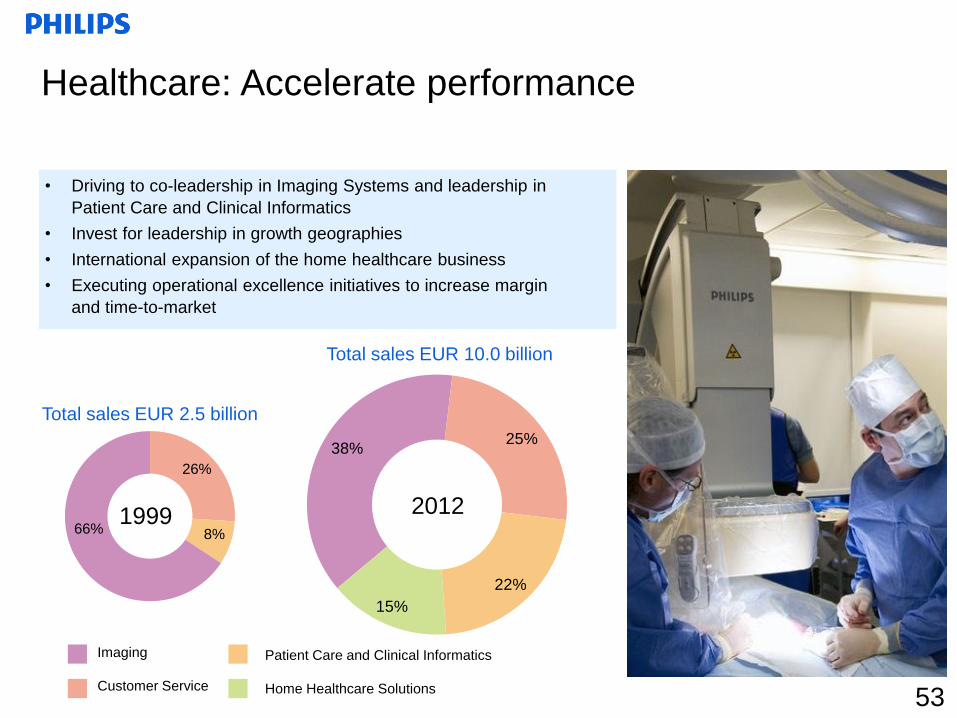
15%
22%
25% 38%
1999 66%
26%
8%
Imaging
Customer Service
Total sales EUR 2.5 billion
Total sales EUR 10.0 billion
Healthcare: Accelerate performance
Patient Care and Clinical Informatics
Home Healthcare Solutions
• Driving to co-leadership in Imaging Systems and leadership in
Patient Care and Clinical Informatics
• Invest for leadership in growth geographies
• International expansion of the home healthcare business
• Executing operational excellence initiatives to increase margin
and time-to-market
2012
53
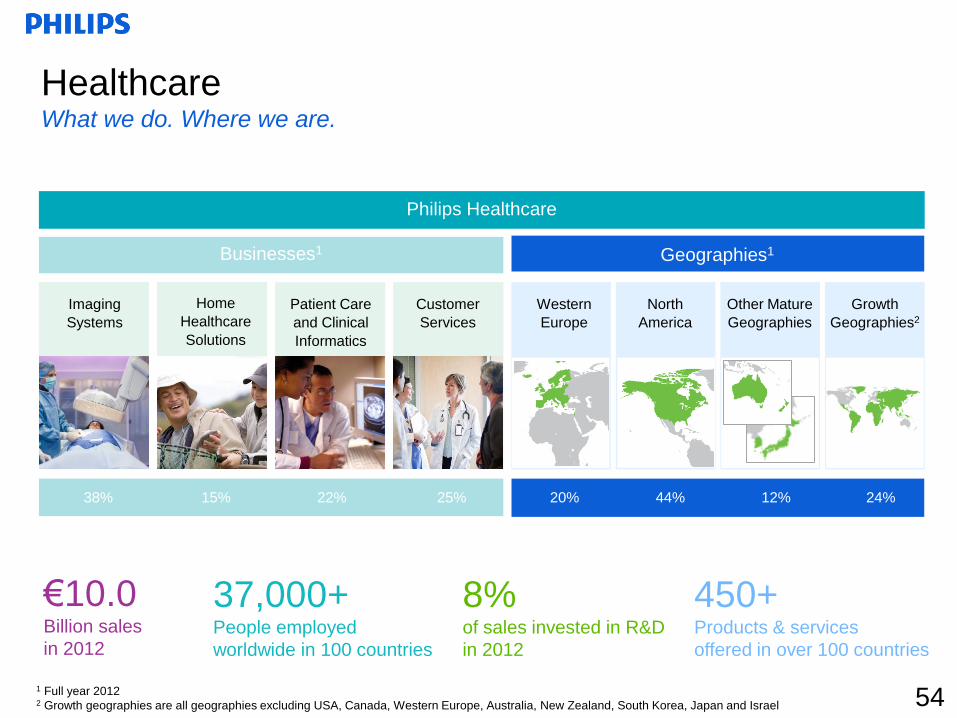
Healthcare What we do. Where we are.
Philips Healthcare
Businesses1
Imaging
Systems
Home
Healthcare
Solutions
Patient Care
and Clinical
Informatics
Customer
Services
38%
€10.0 Billion sales
in 2012
37,000+ People employed
worldwide in 100 countries
15% 22% 25%
450+ Products & services
offered in over 100 countries
8% of sales invested in R&D
in 2012
54
Geographies1
North
America
Other Mature
Geographies
44% 12% 24%
Growth
Geographies2
Western
Europe
20%
1 Full year 2012 2 Growth geographies are all geographies excluding USA, Canada, Western Europe, Australia, New Zealand, South Korea, Japan and Israel
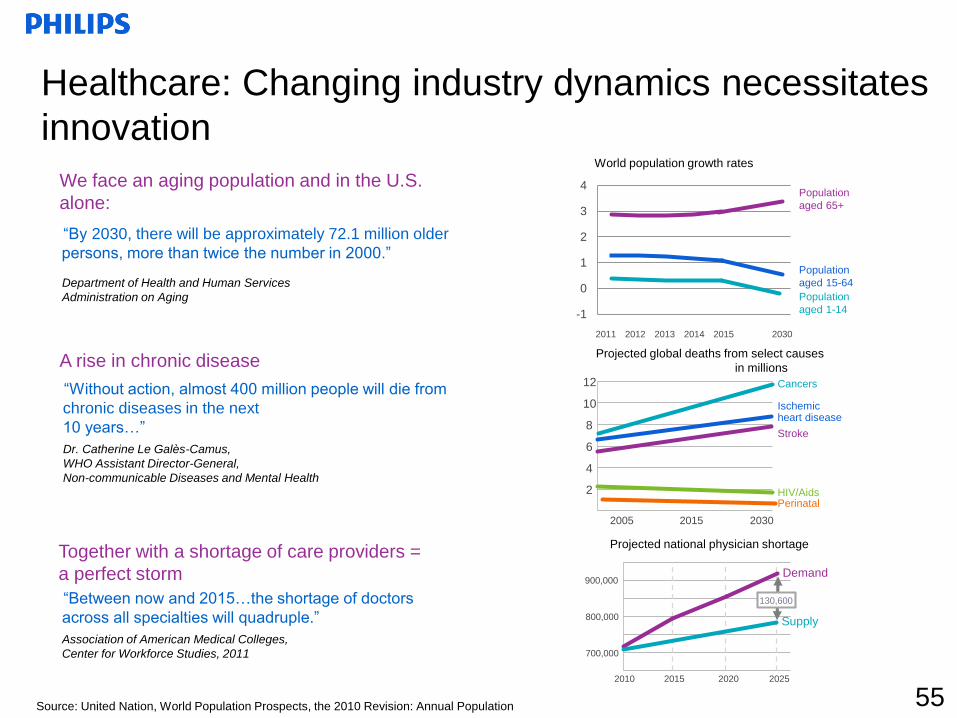
World population growth rates
Population
aged 65+
Population
aged 15-64
-1
0
1
2
3
4
Population
aged 1-14
2011 20302012 2013 2014 2015
Projected global deaths from select causes
in millions
Ischemic heart disease
2005 2030
2
4
6
8
10
12 Cancers
Stroke
PerinatalHIV/Aids
2015
Projected national physician shortage
2010 2020
700,000
800,000
900,000Demand
Supply
2015 2025
130,600
“Without action, almost 400 million people will die from
chronic diseases in the next
10 years…”
Dr. Catherine Le Galès-Camus,
WHO Assistant Director-General,
Non-communicable Diseases and Mental Health
A rise in chronic disease
“Between now and 2015…the shortage of doctors
across all specialties will quadruple.”
Association of American Medical Colleges,
Center for Workforce Studies, 2011
Together with a shortage of care providers =
a perfect storm
“By 2030, there will be approximately 72.1 million older
persons, more than twice the number in 2000.”
Department of Health and Human Services
Administration on Aging
We face an aging population and in the U.S.
alone:
Healthcare: Changing industry dynamics necessitates
innovation
Source: United Nation, World Population Prospects, the 2010 Revision: Annual Population 55
0
1,000
2,000
3,000
4,000
5,000
6,000
7,000
8,000
9,000
10,000
1999 2000 2001 2002 2003 2004 2005 2006 2007 2008 2009 2010 2011 2012Economic Downturn
USD
millions
4% -3% 9% 22% 3% 13% 10% 7% -7% -3% -11% 5% 2% -2%
Economic Downturn
Out of Hospital Imaging Growth DRA
Market Growth
BBA Increases Outpatient Technical Charges
Stark II Rules
Limit Physician Ownership
in Outpatient Imaging
DRA announced Utilization,
physician fee schedule
Outpatient Imaging
Paid 2.5% higher
Bond crisis
CMS P4P Reduces
Reimbursement for
80% of Hospitals
Balanced
Budget Act 2
Imaging Systems
incl. Ultrasound
Patient Care and Clinical Informatics
Signing Healthcare
Reform
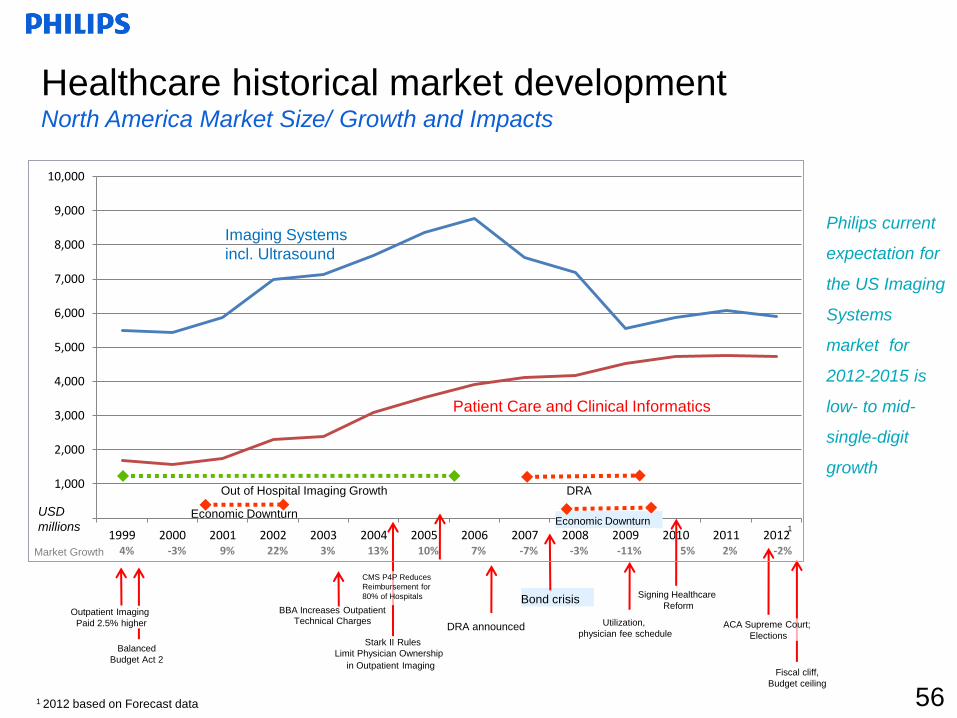
Healthcare historical market development North America Market Size/ Growth and Impacts
Philips current
expectation for
the US Imaging
Systems
market for
2012-2015 is
low- to mid-
single-digit
growth
56 Fiscal cliff,
Budget ceiling
ACA Supreme Court;
Elections
1 2012 based on Forecast data
1
10%
12%
14%
16%
0
400
800
1,200
4Q10 1Q11 2Q11 3Q11 4Q11 1Q12 2Q12 3Q12 4Q12
0%
10%
20%
30%
0
1,000
2,000
3,000
4Q10 1Q11 2Q11 3Q11 4Q11 1Q12 2Q12 3Q12 4Q12
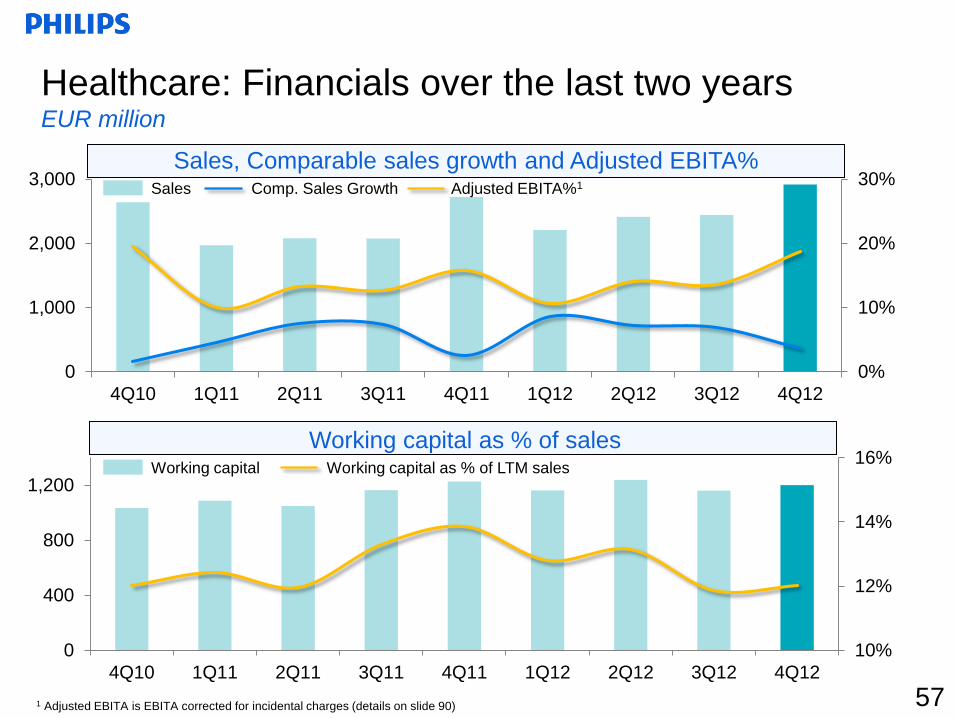
Sales Comp. Sales Growth Adjusted EBITA%1
Working capital Working capital as % of LTM sales
1 Adjusted EBITA is EBITA corrected for incidental charges (details on slide 90)
Healthcare: Financials over the last two years EUR million
Sales, Comparable sales growth and Adjusted EBITA%
Working capital as % of sales
57
26%
29%
40%
5%
Growth
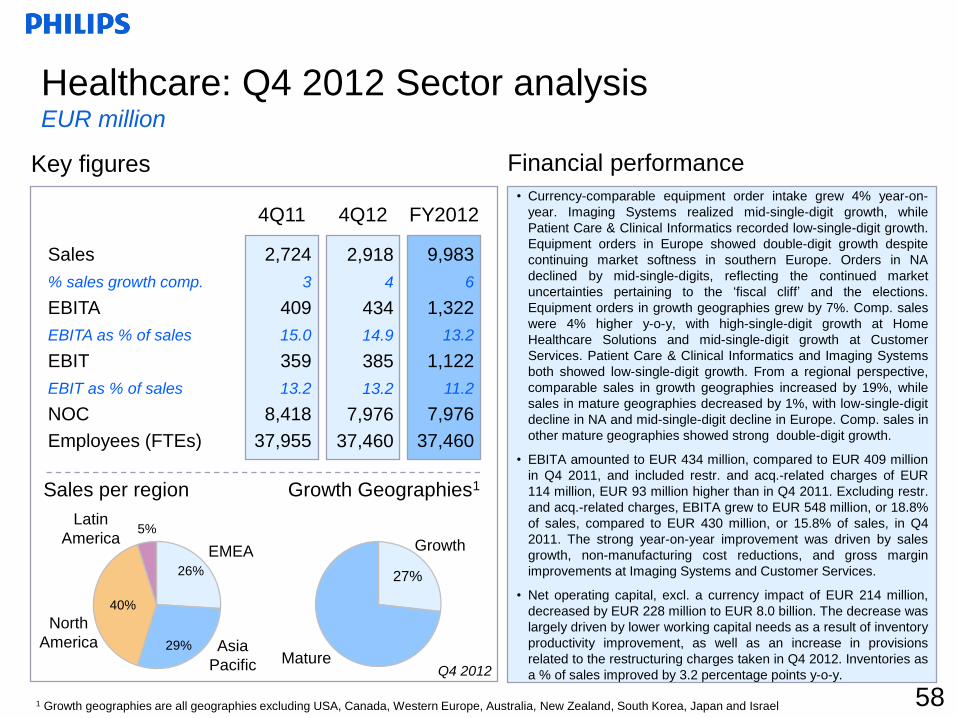
• Currency-comparable equipment order intake grew 4% year-on-
year. Imaging Systems realized mid-single-digit growth, while
Patient Care & Clinical Informatics recorded low-single-digit growth.
Equipment orders in Europe showed double-digit growth despite
continuing market softness in southern Europe. Orders in NA
declined by mid-single-digits, reflecting the continued market
uncertainties pertaining to the ‘fiscal cliff’ and the elections.
Equipment orders in growth geographies grew by 7%. Comp. sales
were 4% higher y-o-y, with high-single-digit growth at Home
Healthcare Solutions and mid-single-digit growth at Customer
Services. Patient Care & Clinical Informatics and Imaging Systems
both showed low-single-digit growth. From a regional perspective,
comparable sales in growth geographies increased by 19%, while
sales in mature geographies decreased by 1%, with low-single-digit
decline in NA and mid-single-digit decline in Europe. Comp. sales in
other mature geographies showed strong double-digit growth.
• EBITA amounted to EUR 434 million, compared to EUR 409 million
in Q4 2011, and included restr. and acq.-related charges of EUR
114 million, EUR 93 million higher than in Q4 2011. Excluding restr.
and acq.-related charges, EBITA grew to EUR 548 million, or 18.8%
of sales, compared to EUR 430 million, or 15.8% of sales, in Q4
2011. The strong year-on-year improvement was driven by sales
growth, non-manufacturing cost reductions, and gross margin
improvements at Imaging Systems and Customer Services.
• Net operating capital, excl. a currency impact of EUR 214 million,
decreased by EUR 228 million to EUR 8.0 billion. The decrease was
largely driven by lower working capital needs as a result of inventory
productivity improvement, as well as an increase in provisions
related to the restructuring charges taken in Q4 2012. Inventories as
a % of sales improved by 3.2 percentage points y-o-y.
Sales
% sales growth comp.
EBITA
EBITA as % of sales
EBIT
EBIT as % of sales
NOC
Employees (FTEs)
Healthcare: Q4 2012 Sector analysis EUR million
4Q11
2,724
3
409
15.0
359
13.2
8,418
37,955
4Q12
9,983
6
1,322
13.2
1,122
11.2
7,976
37,460
FY2012
Financial performance Key figures
Sales per region Growth Geographies1
2,918
4
434
14.9
385
13.2
7,976
37,460
27%
EMEA
Asia
Pacific
North
America
Latin
America
Mature Q4 2012
58 1 Growth geographies are all geographies excluding USA, Canada, Western Europe, Australia, New Zealand, South Korea, Japan and Israel

-40%
-20%
0%
20%
40%
60%
Q1 Q2 Q3 Q4 Q1 Q2 Q3 Q4 Q1 Q2 Q3 Q4 Q1 Q2 Q3 Q4 Q1 Q2 Q3 Q4
World Western Europe North America Rest of the World
2012
Currency adjusted order intake only relates to the Imaging Systems and Patient Care &
Clinical Informatics businesses
Quarterly currency adjusted equipment order intake
2008 2009 2010
Healthcare: Equipment order intake
2011
59
~15%
~45%
~40%
70
80
90
100
110
120
130
140
Q1 Q2 Q3 Q4 Q1 Q2 Q3 Q4 Q1 Q2 Q3 Q4 Q1 Q2 Q3 Q4 Q1 Q2 Q3 Q4
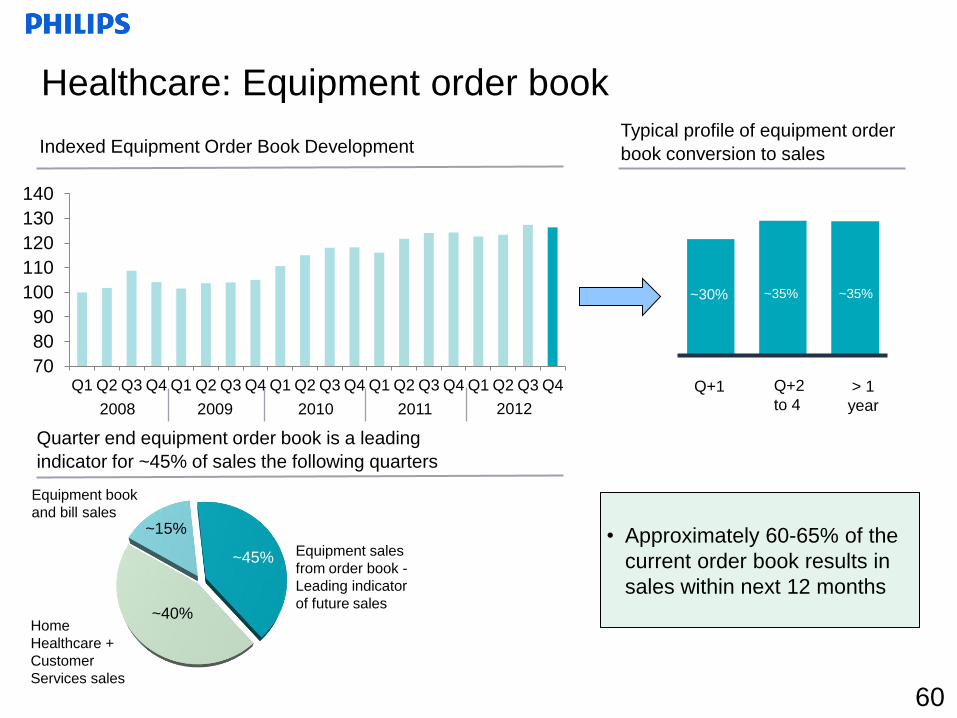
Healthcare: Equipment order book
Indexed Equipment Order Book Development
Quarter end equipment order book is a leading
indicator for ~45% of sales the following quarters
Home
Healthcare +
Customer
Services sales
Equipment book
and bill sales
Equipment sales
from order book -
Leading indicator
of future sales
Typical profile of equipment order
book conversion to sales
> 1
year
~30% ~35%
Q+1 Q+2
to 4
~35%
2009 2010 2008 2011 2012
60
• Approximately 60-65% of the
current order book results in
sales within next 12 months
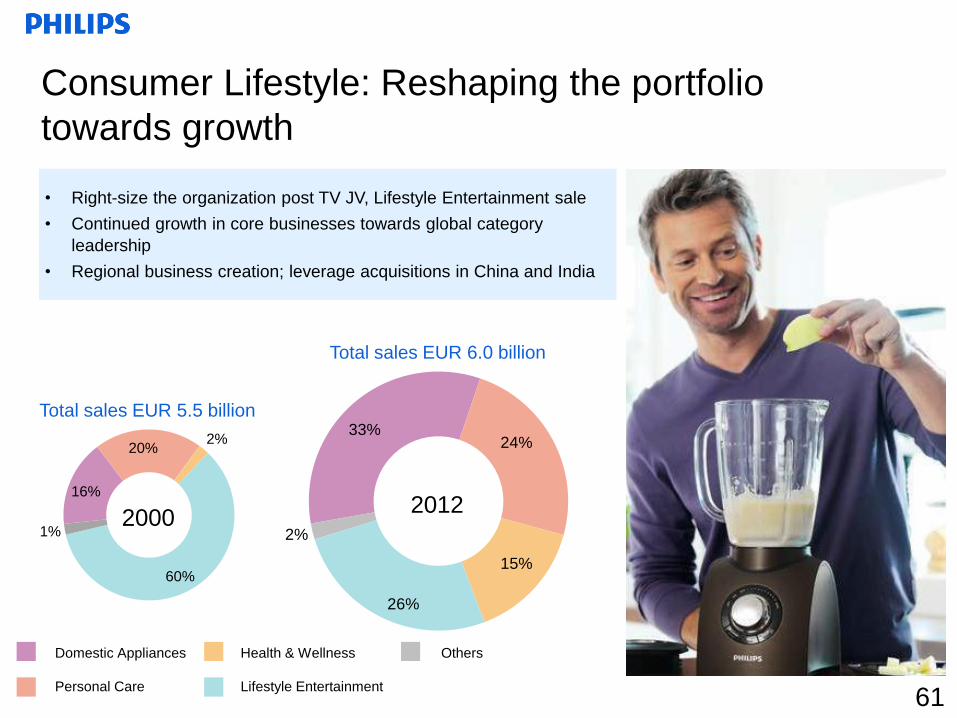
2000
Total sales EUR 5.5 billion
Total sales EUR 6.0 billion
Consumer Lifestyle: Reshaping the portfolio
towards growth
16%
1%
20%
60%
33%
26%
15%
24%
Domestic Appliances
Personal Care
2%
2%
2012
Health & Wellness
Lifestyle Entertainment
Others
• Right-size the organization post TV JV, Lifestyle Entertainment sale
• Continued growth in core businesses towards global category
leadership
• Regional business creation; leverage acquisitions in China and India
61
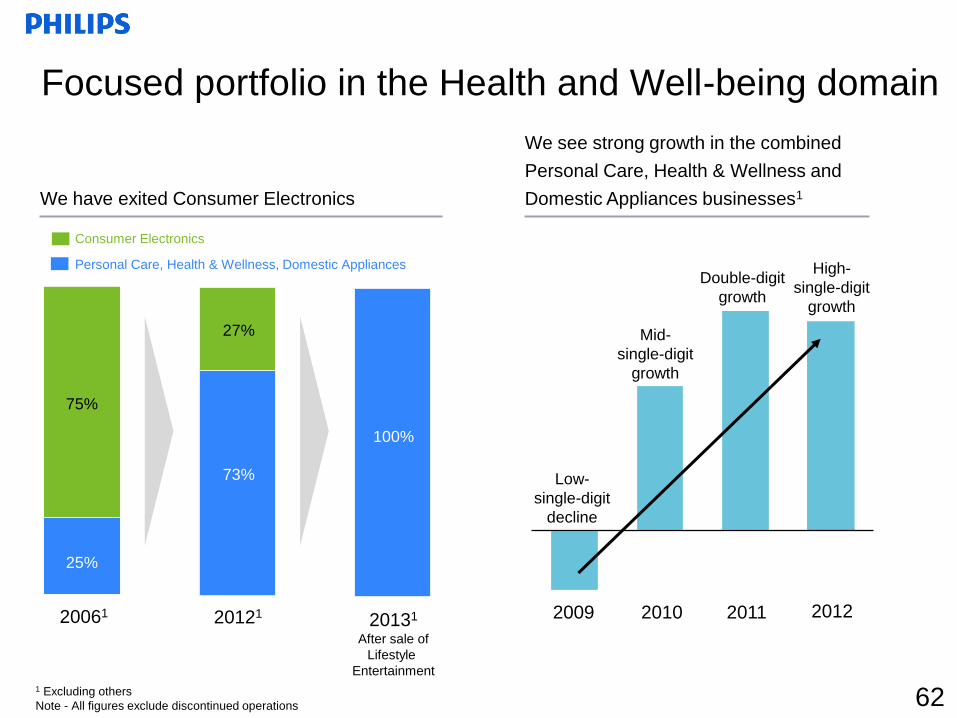
We have exited Consumer Electronics
20061
25%
75%
27%
Consumer Electronics
Focused portfolio in the Health and Well-being domain
2012 2010 2009
We see strong growth in the combined
Personal Care, Health & Wellness and
Domestic Appliances businesses1
Mid-
single-digit
growth
Low-
single-digit
decline
High-
single-digit
growth
62
Personal Care, Health & Wellness, Domestic Appliances
73%
1 Excluding others
Note - All figures exclude discontinued operations
20121
Double-digit
growth
2011
100%
20131
After sale of
Lifestyle
Entertainment
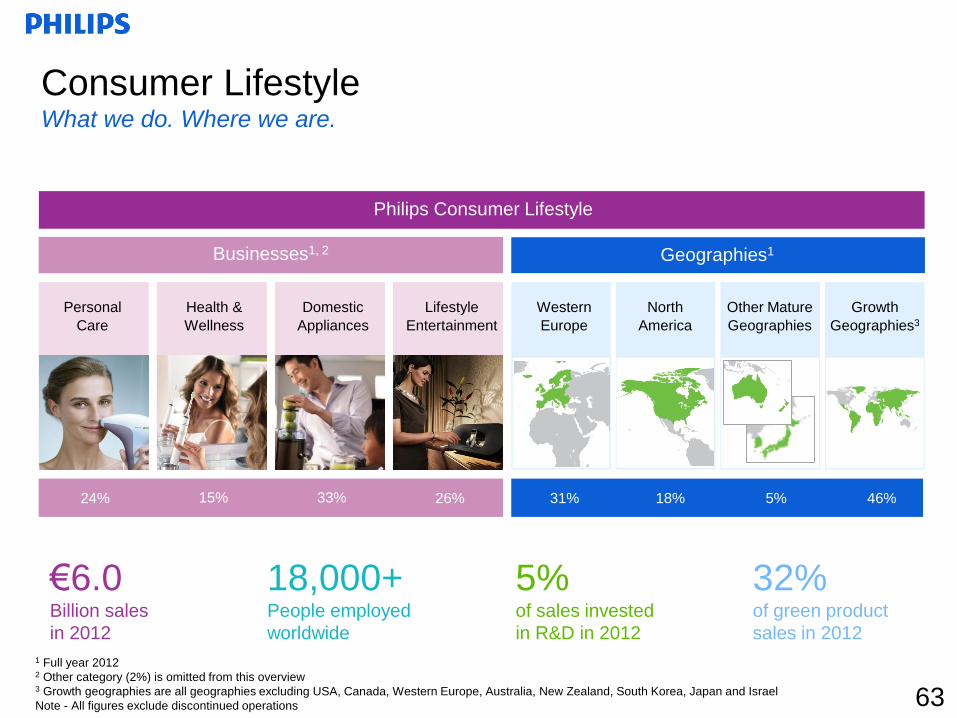
Consumer Lifestyle What we do. Where we are.
Philips Consumer Lifestyle
Businesses1, 2
Personal
Care
Health &
Wellness
Domestic
Appliances
Lifestyle
Entertainment
€6.0 Billion sales
in 2012
18,000+ People employed
worldwide
5% of sales invested
in R&D in 2012
1 Full year 2012 2 Other category (2%) is omitted from this overview 3 Growth geographies are all geographies excluding USA, Canada, Western Europe, Australia, New Zealand, South Korea, Japan and Israel
Note - All figures exclude discontinued operations
24% 15% 33% 26%
32% of green product
sales in 2012
63
Geographies1
North
America
Other Mature
Geographies
18% 5% 46%
Growth
Geographies3
Western
Europe
31%
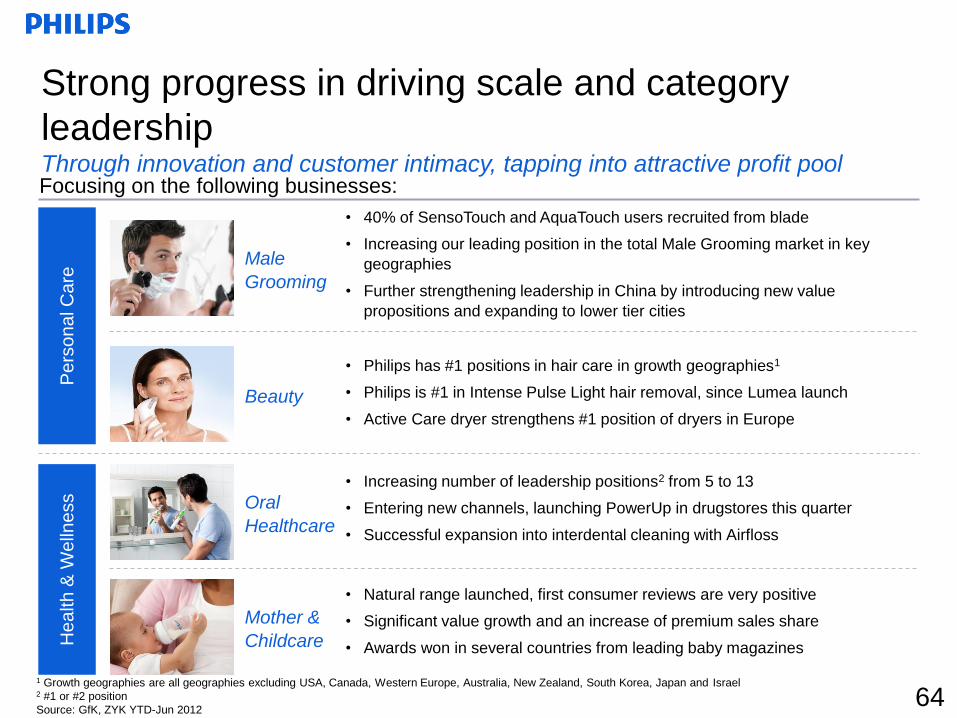
• 40% of SensoTouch and AquaTouch users recruited from blade
• Increasing our leading position in the total Male Grooming market in key
geographies
• Further strengthening leadership in China by introducing new value
propositions and expanding to lower tier cities
Beauty
• Philips has #1 positions in hair care in growth geographies1
• Philips is #1 in Intense Pulse Light hair removal, since Lumea launch
• Active Care dryer strengthens #1 position of dryers in Europe
Oral
Healthcare
• Increasing number of leadership positions2 from 5 to 13
• Entering new channels, launching PowerUp in drugstores this quarter
• Successful expansion into interdental cleaning with Airfloss
Mother &
Childcare
• Natural range launched, first consumer reviews are very positive
• Significant value growth and an increase of premium sales share
• Awards won in several countries from leading baby magazines
Male
Grooming
Pe
rso
na
l C
are
H
ea
lth
& W
elln
ess
Focusing on the following businesses:
Strong progress in driving scale and category
leadership Through innovation and customer intimacy, tapping into attractive profit pool
1 Growth geographies are all geographies excluding USA, Canada, Western Europe, Australia, New Zealand, South Korea, Japan and Israel 2 #1 or #2 position
Source: GfK, ZYK YTD-Jun 2012 64
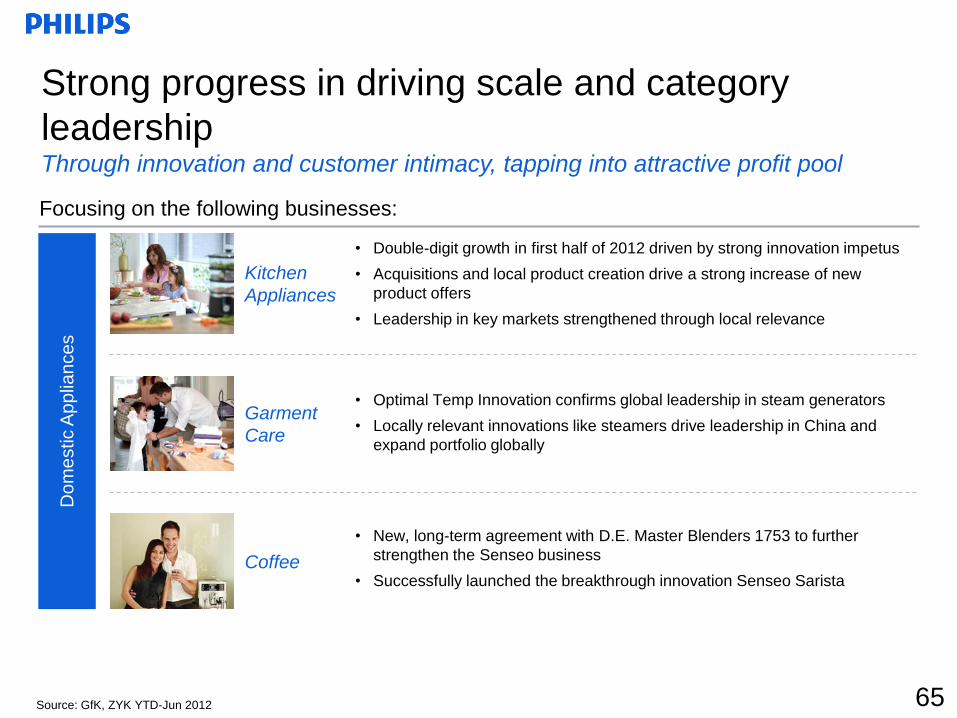
Focusing on the following businesses:
Do
me
stic A
pp
lian
ce
s
• Double-digit growth in first half of 2012 driven by strong innovation impetus
• Acquisitions and local product creation drive a strong increase of new
product offers
• Leadership in key markets strengthened through local relevance
• Optimal Temp Innovation confirms global leadership in steam generators
• Locally relevant innovations like steamers drive leadership in China and
expand portfolio globally
• New, long-term agreement with D.E. Master Blenders 1753 to further
strengthen the Senseo business
• Successfully launched the breakthrough innovation Senseo Sarista
Garment
Care
Coffee
Kitchen
Appliances
Strong progress in driving scale and category
leadership Through innovation and customer intimacy, tapping into attractive profit pool
Source: GfK, ZYK YTD-Jun 2012 65
-15%
-10%
-5%
0%
5%
10%
-800
-600
-400
-200
0
200
400
600
4Q10 1Q11 2Q11 3Q11 4Q11 1Q12 2Q12 3Q12 4Q12
-10%
0%
10%
20%
-1,000
0
1,000
2,000
4Q10 1Q11 2Q11 3Q11 4Q11 1Q12 2Q12 3Q12 4Q12
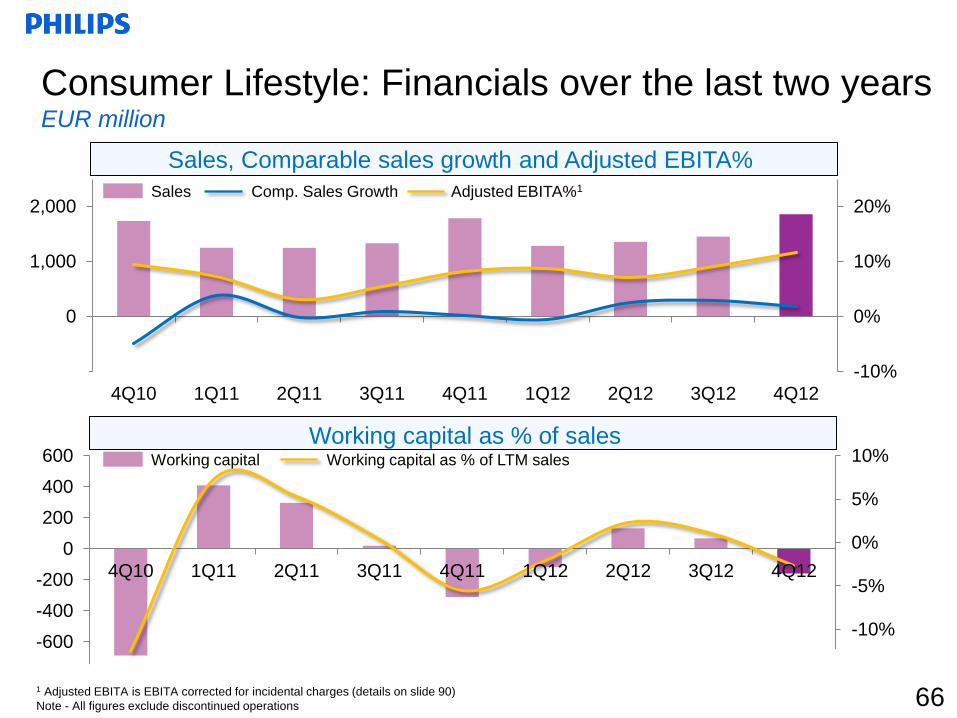
Sales Comp. Sales Growth Adjusted EBITA%1
Working capital Working capital as % of LTM sales
Consumer Lifestyle: Financials over the last two years EUR million
Sales, Comparable sales growth and Adjusted EBITA%
Working capital as % of sales
1 Adjusted EBITA is EBITA corrected for incidental charges (details on slide 90)
Note - All figures exclude discontinued operations 66
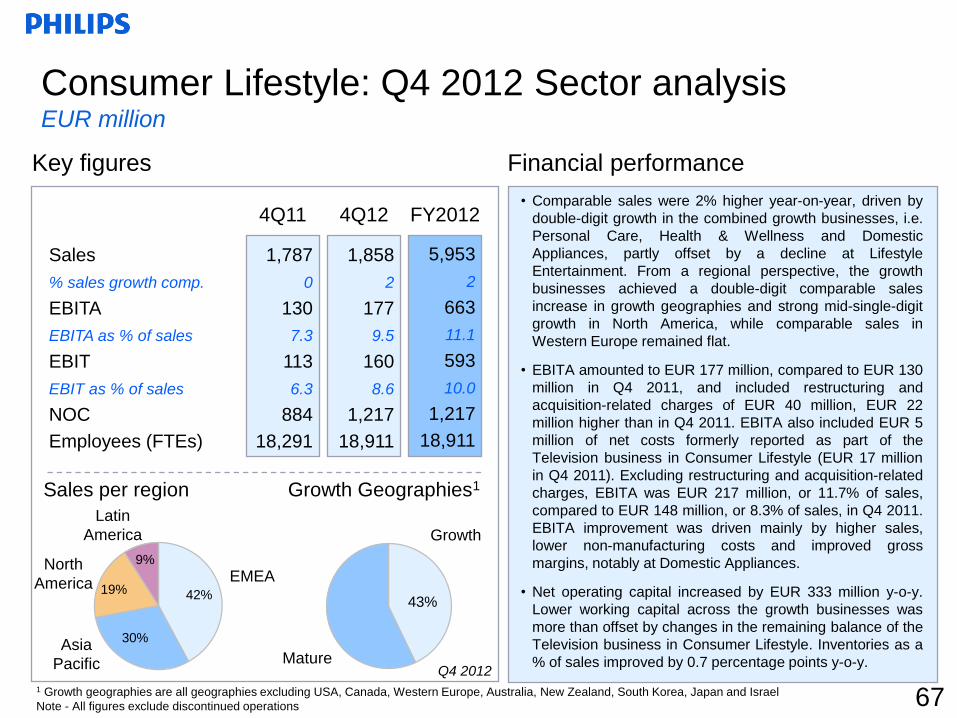
42%
30%
19%
9%
Growth
• Comparable sales were 2% higher year-on-year, driven by
double-digit growth in the combined growth businesses, i.e.
Personal Care, Health & Wellness and Domestic
Appliances, partly offset by a decline at Lifestyle
Entertainment. From a regional perspective, the growth
businesses achieved a double-digit comparable sales
increase in growth geographies and strong mid-single-digit
growth in North America, while comparable sales in
Western Europe remained flat.
• EBITA amounted to EUR 177 million, compared to EUR 130
million in Q4 2011, and included restructuring and
acquisition-related charges of EUR 40 million, EUR 22
million higher than in Q4 2011. EBITA also included EUR 5
million of net costs formerly reported as part of the
Television business in Consumer Lifestyle (EUR 17 million
in Q4 2011). Excluding restructuring and acquisition-related
charges, EBITA was EUR 217 million, or 11.7% of sales,
compared to EUR 148 million, or 8.3% of sales, in Q4 2011.
EBITA improvement was driven mainly by higher sales,
lower non-manufacturing costs and improved gross
margins, notably at Domestic Appliances.
• Net operating capital increased by EUR 333 million y-o-y.
Lower working capital across the growth businesses was
more than offset by changes in the remaining balance of the
Television business in Consumer Lifestyle. Inventories as a
% of sales improved by 0.7 percentage points y-o-y.
Sales
% sales growth comp.
EBITA
EBITA as % of sales
EBIT
EBIT as % of sales
NOC
Employees (FTEs)
Consumer Lifestyle: Q4 2012 Sector analysis EUR million
1,787
0
130
7.3
113
6.3
884
18,291
5,953
2
663
11.1
593
10.0
1,217
18,911
Key figures Financial performance
4Q11 4Q12 FY2012
1,858
2
177
9.5
160
8.6
1,217
18,911
43%
EMEA
Asia
Pacific
North
America
Latin
America
Mature
1 Growth geographies are all geographies excluding USA, Canada, Western Europe, Australia, New Zealand, South Korea, Japan and Israel
Note - All figures exclude discontinued operations
Sales per region Growth Geographies1
Q4 2012
67
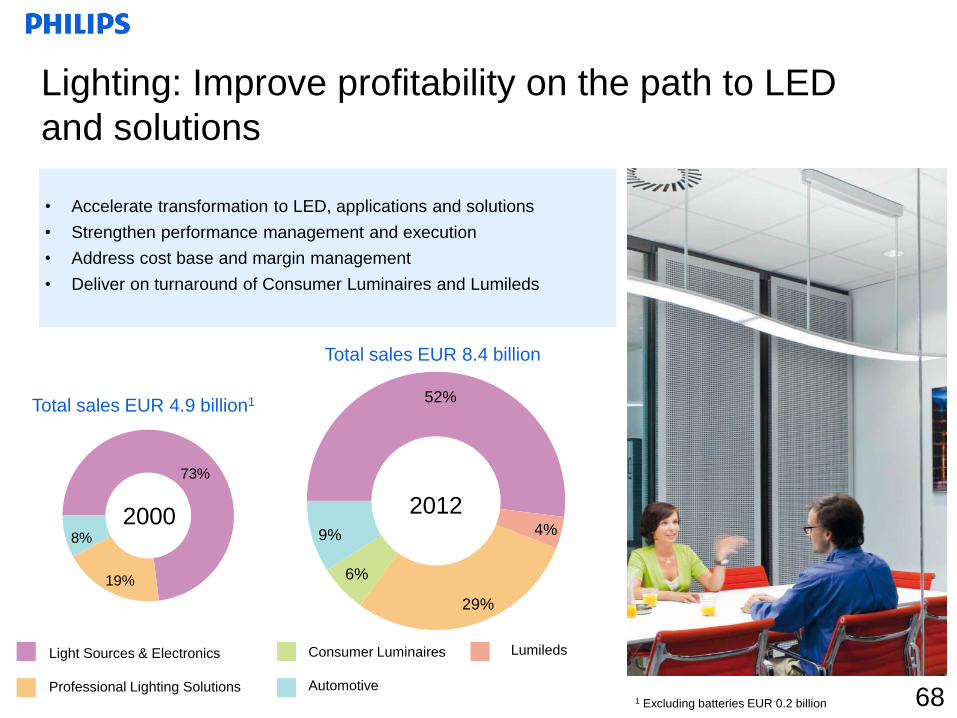
Total sales EUR 4.9 billion1
Total sales EUR 8.4 billion
Lighting: Improve profitability on the path to LED
and solutions
Light Sources & Electronics
Professional Lighting Solutions
8%
73%
19%
9%
52%
6%
4%
29%
2000
1 Excluding batteries EUR 0.2 billion
Consumer Luminaires
Automotive
Lumileds
• Accelerate transformation to LED, applications and solutions
• Strengthen performance management and execution
• Address cost base and margin management
• Deliver on turnaround of Consumer Luminaires and Lumileds
2012
68
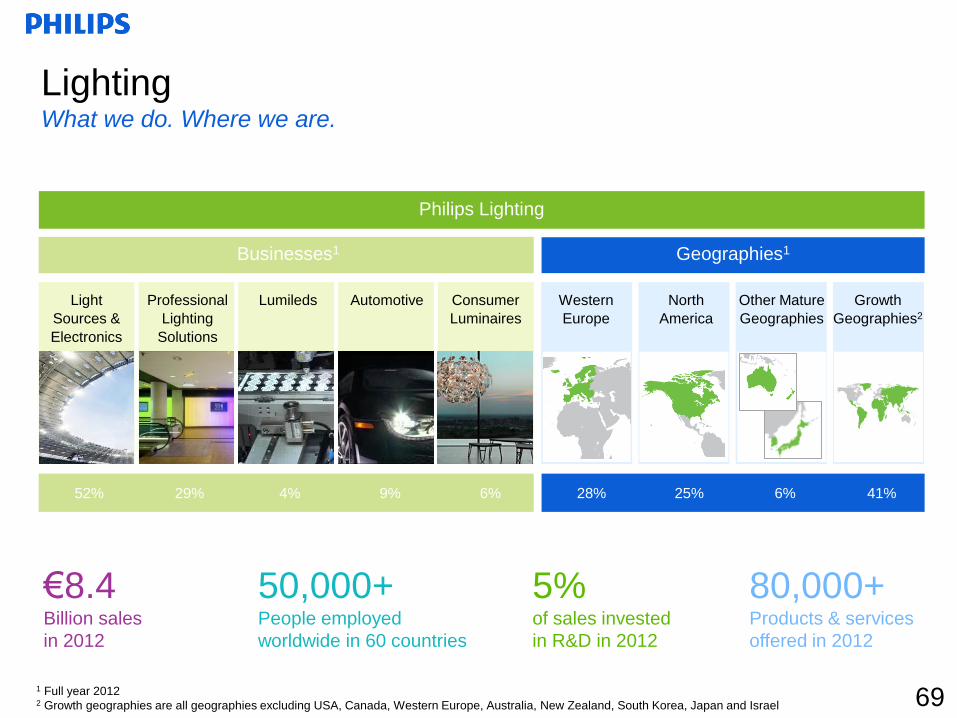
Lighting What we do. Where we are.
Philips Lighting
Businesses1
Light
Sources &
Electronics
Professional
Lighting
Solutions
Lumileds Automotive
1 Full year 2012 2 Growth geographies are all geographies excluding USA, Canada, Western Europe, Australia, New Zealand, South Korea, Japan and Israel
52% 29% 4% 9%
69
Geographies1
North
America
Other Mature
Geographies
25% 6% 41%
Growth
Geographies2
Western
Europe
28%
€8.4 Billion sales
in 2012
50,000+ People employed
worldwide in 60 countries
5% of sales invested
in R&D in 2012
80,000+ Products & services
offered in 2012
Consumer
Luminaires
6%
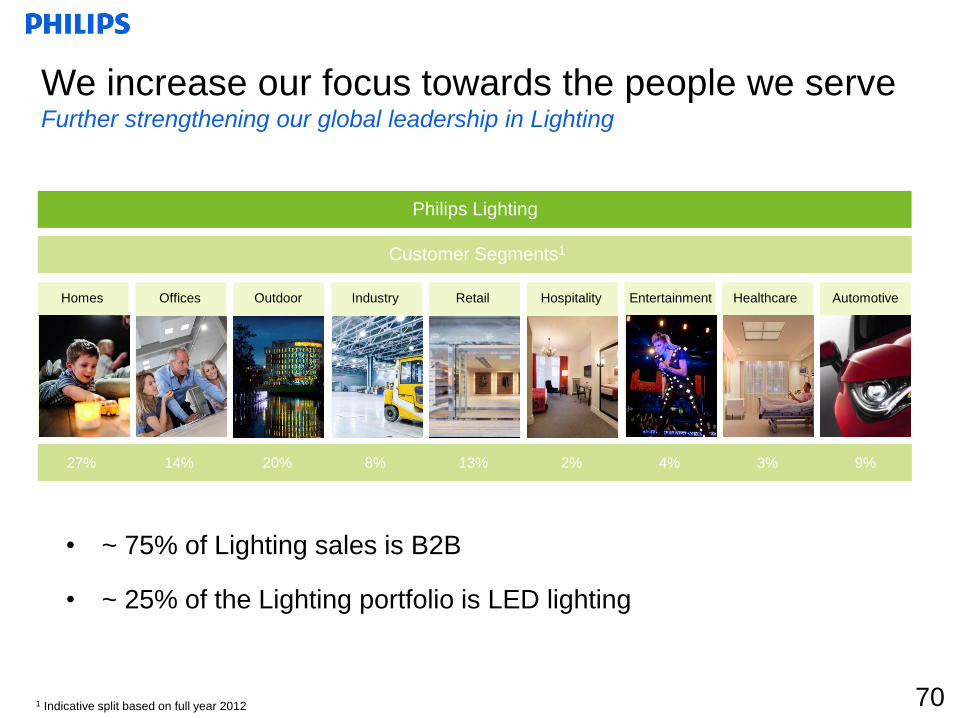
Philips Lighting
Customer Segments1
27% 14% 20% 8% 13% 2% 4% 3% 9%
Retail Entertainment Healthcare Automotive Homes Offices Outdoor Industry Hospitality
We increase our focus towards the people we serve Further strengthening our global leadership in Lighting
1 Indicative split based on full year 2012 70
• ~ 75% of Lighting sales is B2B
• ~ 25% of the Lighting portfolio is LED lighting
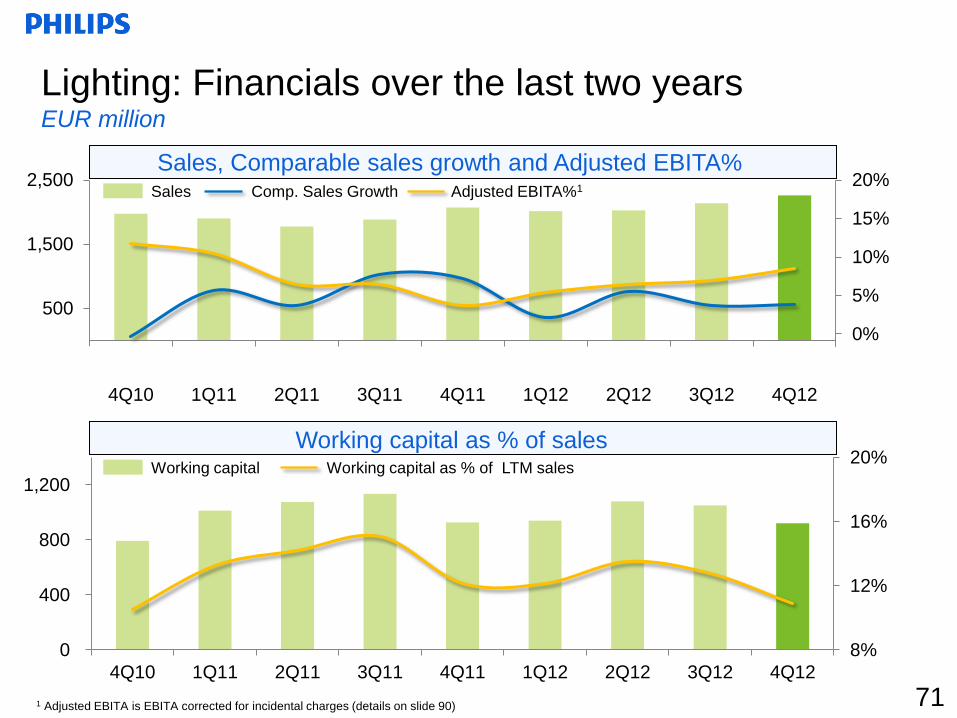
8%
12%
16%
20%
0
400
800
1,200
4Q10 1Q11 2Q11 3Q11 4Q11 1Q12 2Q12 3Q12 4Q12
-5%
0%
5%
10%
15%
20%
-500
500
1,500
2,500
4Q10 1Q11 2Q11 3Q11 4Q11 1Q12 2Q12 3Q12 4Q12
Working capital Working capital as % of LTM sales
Sales Comp. Sales Growth Adjusted EBITA%1
Sales, Comparable sales growth and Adjusted EBITA%
Working capital as % of sales
Lighting: Financials over the last two years EUR million
1 Adjusted EBITA is EBITA corrected for incidental charges (details on slide 90) 71
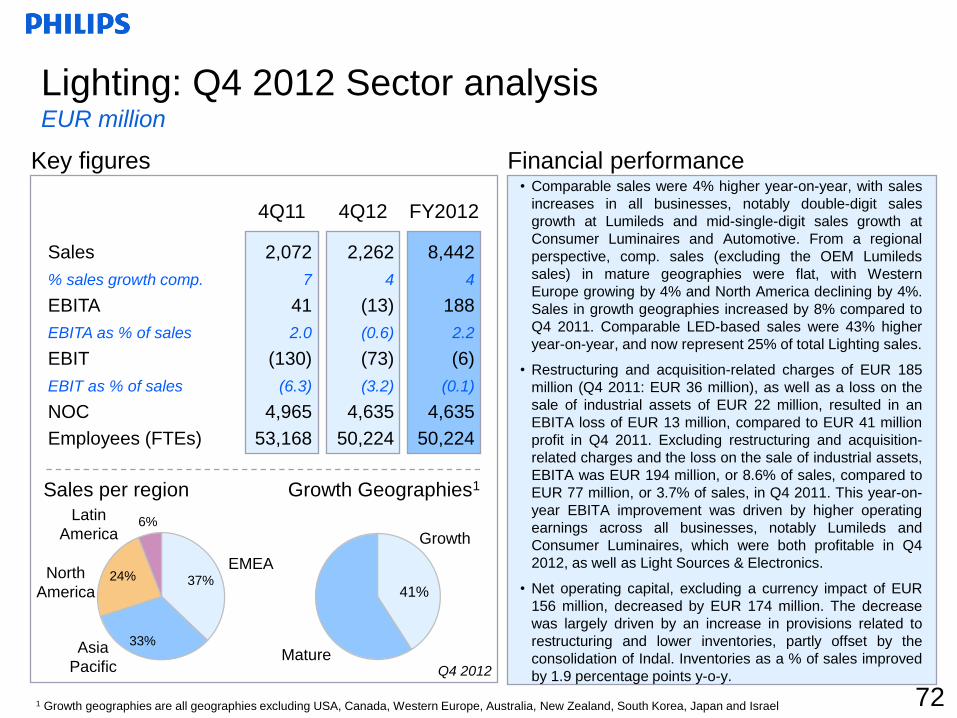
37%
33%
24%
6%
Growth
Sales
% sales growth comp.
EBITA
EBITA as % of sales
EBIT
EBIT as % of sales
NOC
Employees (FTEs)
• Comparable sales were 4% higher year-on-year, with sales
increases in all businesses, notably double-digit sales
growth at Lumileds and mid-single-digit sales growth at
Consumer Luminaires and Automotive. From a regional
perspective, comp. sales (excluding the OEM Lumileds
sales) in mature geographies were flat, with Western
Europe growing by 4% and North America declining by 4%.
Sales in growth geographies increased by 8% compared to
Q4 2011. Comparable LED-based sales were 43% higher
year-on-year, and now represent 25% of total Lighting sales.
• Restructuring and acquisition-related charges of EUR 185
million (Q4 2011: EUR 36 million), as well as a loss on the
sale of industrial assets of EUR 22 million, resulted in an
EBITA loss of EUR 13 million, compared to EUR 41 million
profit in Q4 2011. Excluding restructuring and acquisition-
related charges and the loss on the sale of industrial assets,
EBITA was EUR 194 million, or 8.6% of sales, compared to
EUR 77 million, or 3.7% of sales, in Q4 2011. This year-on-
year EBITA improvement was driven by higher operating
earnings across all businesses, notably Lumileds and
Consumer Luminaires, which were both profitable in Q4
2012, as well as Light Sources & Electronics.
• Net operating capital, excluding a currency impact of EUR
156 million, decreased by EUR 174 million. The decrease
was largely driven by an increase in provisions related to
restructuring and lower inventories, partly offset by the
consolidation of Indal. Inventories as a % of sales improved
by 1.9 percentage points y-o-y.
2,072
7
41
2.0
(130)
(6.3)
4,965
53,168
8,442
4
188
2.2
(6)
(0.1)
4,635
50,224
Financial performance Key figures
4Q11 4Q12 FY2012
2,262
4
(13)
(0.6)
(73)
(3.2)
4,635
50,224
41%
EMEA
Asia
Pacific
North
America
Latin
America
Mature
Lighting: Q4 2012 Sector analysis EUR million
Sales per region Growth Geographies1
Q4 2012
72 1 Growth geographies are all geographies excluding USA, Canada, Western Europe, Australia, New Zealand, South Korea, Japan and Israel
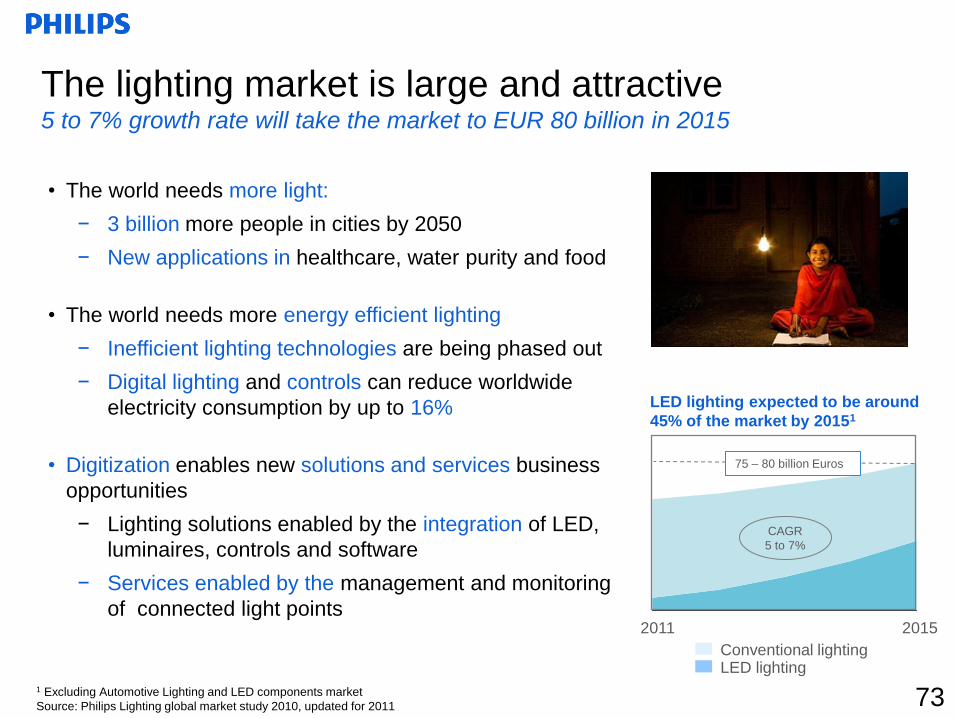
The lighting market is large and attractive 5 to 7% growth rate will take the market to EUR 80 billion in 2015
• The world needs more light:
− 3 billion more people in cities by 2050
− New applications in healthcare, water purity and food
• The world needs more energy efficient lighting
− Inefficient lighting technologies are being phased out
− Digital lighting and controls can reduce worldwide
electricity consumption by up to 16%
• Digitization enables new solutions and services business
opportunities
− Lighting solutions enabled by the integration of LED,
luminaires, controls and software
− Services enabled by the management and monitoring
of connected light points
LED lighting expected to be around
45% of the market by 20151
2015 2011
Conventional lighting LED lighting
75 – 80 billion Euros
CAGR
5 to 7%
1 Excluding Automotive Lighting and LED components market
Source: Philips Lighting global market study 2010, updated for 2011 73
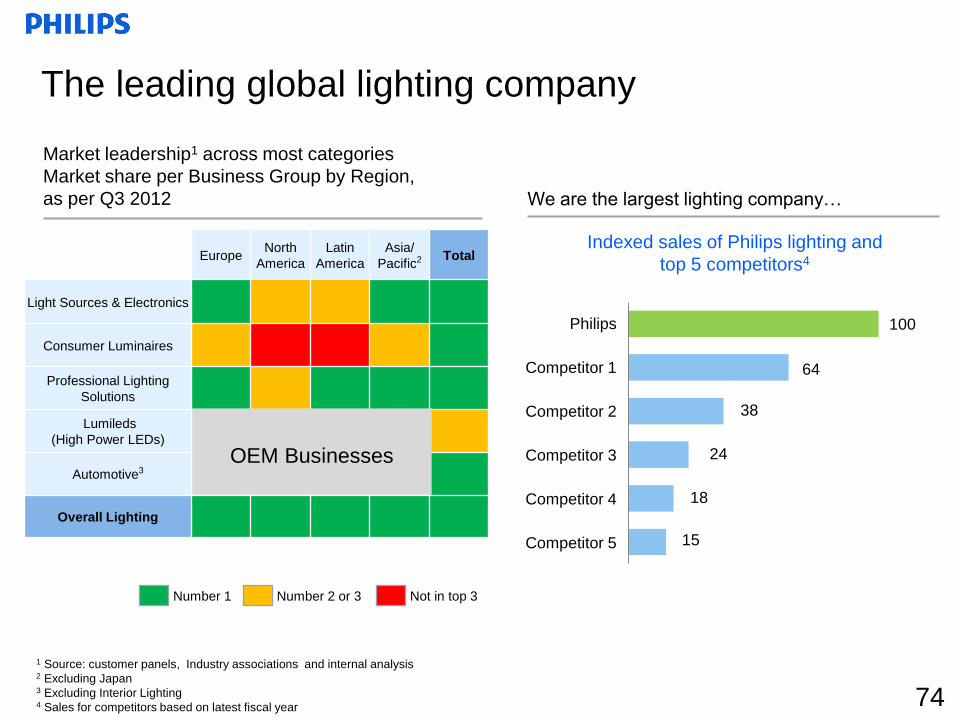
15
18
24
38
64
100
The leading global lighting company
Number 1 Number 2 or 3 Not in top 3
Market leadership1 across most categories
Market share per Business Group by Region,
as per Q3 2012
1 Source: customer panels, Industry associations and internal analysis 2 Excluding Japan 3 Excluding Interior Lighting 4 Sales for competitors based on latest fiscal year
We are the largest lighting company…
Europe North
America
Latin
America
Asia/
Pacific2 Total
Light Sources & Electronics
Consumer Luminaires Professional Lighting
Solutions Lumileds
(High Power LEDs)
Automotive3
Overall Lighting
74
Competitor 5
Competitor 4
Competitor 3
Competitor 2
Competitor 1
Philips
Indexed sales of Philips lighting and
top 5 competitors4
OEM Businesses
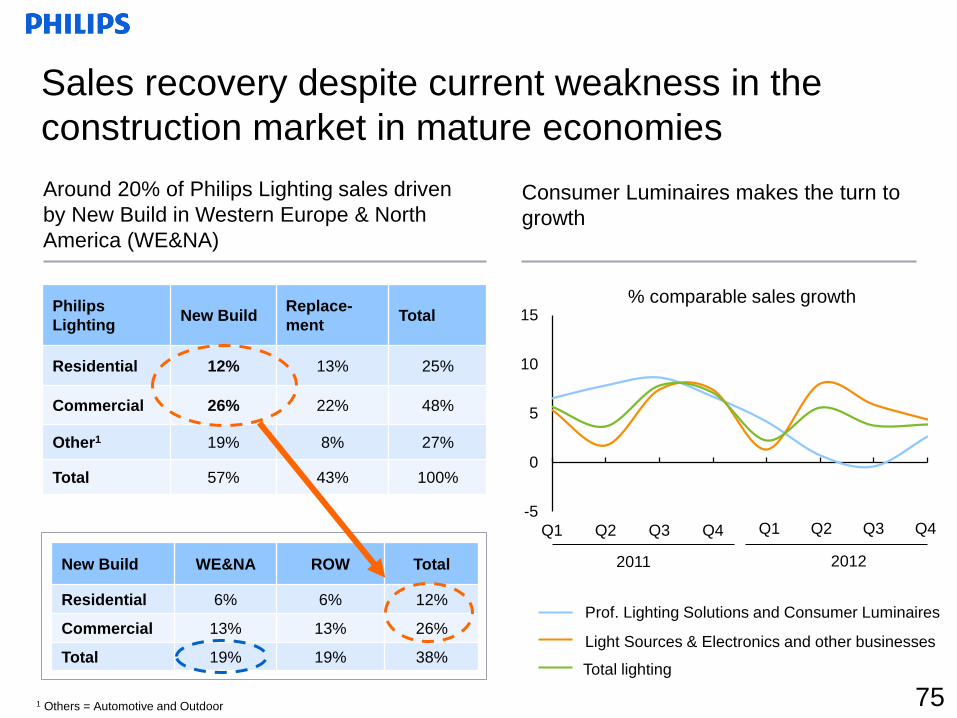
-5
0
5
10
15
Q1 Q2 Q3 Q4
Sales recovery despite current weakness in the
construction market in mature economies
Philips
Lighting New Build
Replace-
ment Total
Residential 12% 13% 25%
Commercial 26% 22% 48%
Other1 19% 8% 27%
Total 57% 43% 100%
Q1
% comparable sales growth
2011
Total lighting
Light Sources & Electronics and other businesses
Prof. Lighting Solutions and Consumer Luminaires
Around 20% of Philips Lighting sales driven
by New Build in Western Europe & North
America (WE&NA)
Consumer Luminaires makes the turn to
growth
New Build WE&NA ROW Total
Residential 6% 6% 12%
Commercial 13% 13% 26%
Total 19% 19% 38%
2012
Q2
75
Q3 Q4
1 Others = Automotive and Outdoor
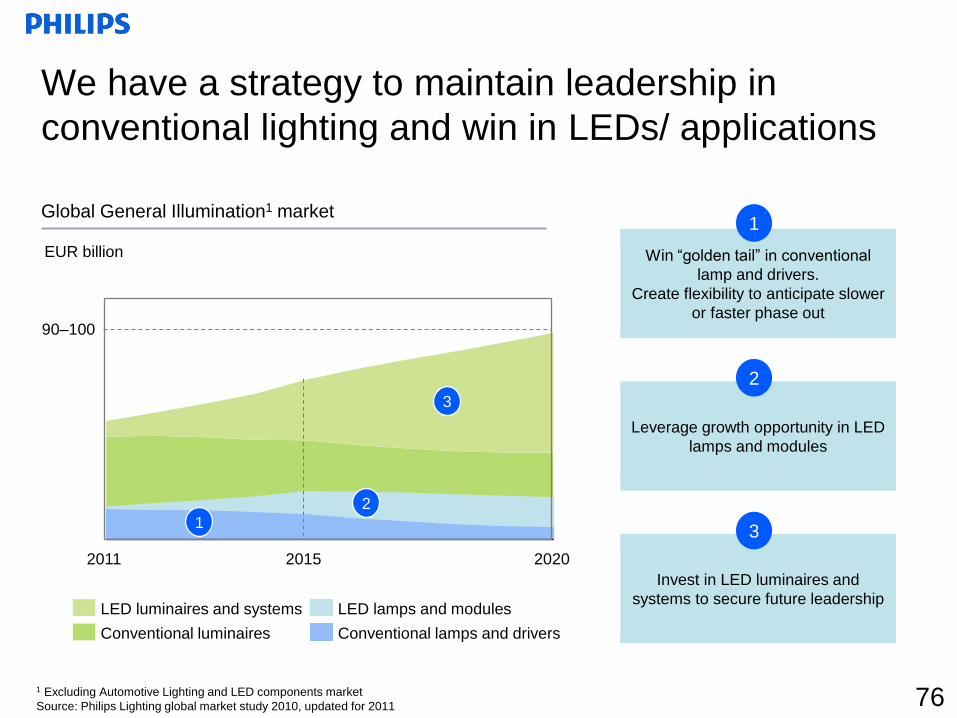
We have a strategy to maintain leadership in
conventional lighting and win in LEDs/ applications
2011 2020 2015
Conventional luminaires
LED lamps and modules
Conventional lamps and drivers
2
1
3
Win “golden tail” in conventional
lamp and drivers.
Create flexibility to anticipate slower
or faster phase out
Leverage growth opportunity in LED
lamps and modules
Invest in LED luminaires and
systems to secure future leadership
1
2
3
90–100
EUR billion
Global General Illumination1 market
1 Excluding Automotive Lighting and LED components market
Source: Philips Lighting global market study 2010, updated for 2011 76
LED luminaires and systems
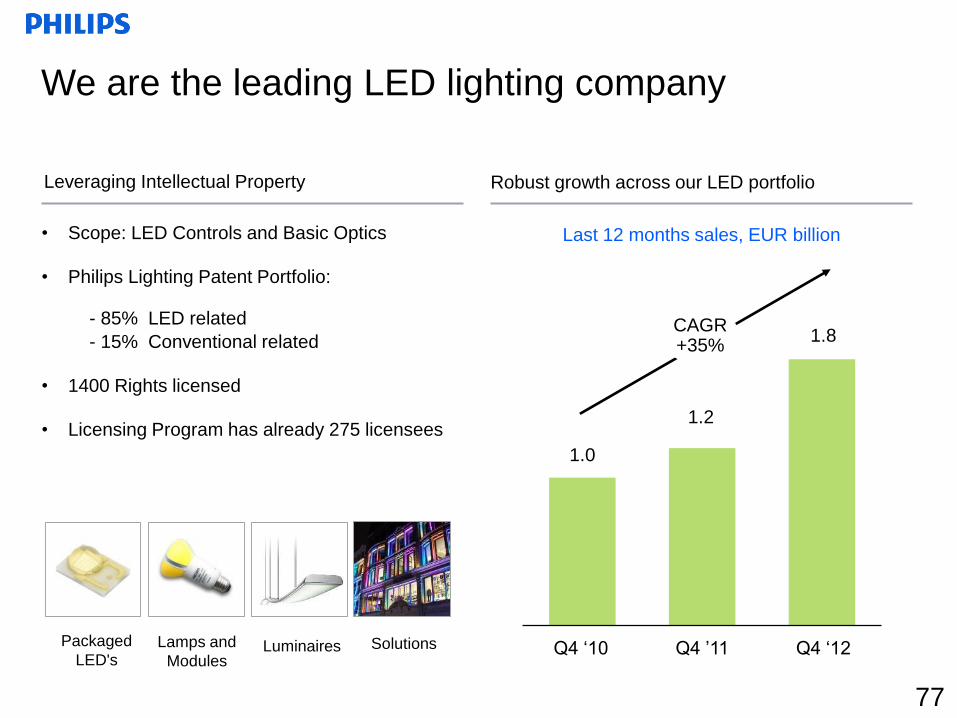
1.0
1.2
1.8
We are the leading LED lighting company
CAGR +35%
Q4 ‘12 Q4 ’11 Q4 ‘10
Last 12 months sales, EUR billion • Scope: LED Controls and Basic Optics
• Philips Lighting Patent Portfolio:
- 85% LED related
- 15% Conventional related
• 1400 Rights licensed
• Licensing Program has already 275 licensees
Robust growth across our LED portfolio
77
Luminaires Lamps and
Modules
Packaged
LED's Solutions
Leveraging Intellectual Property
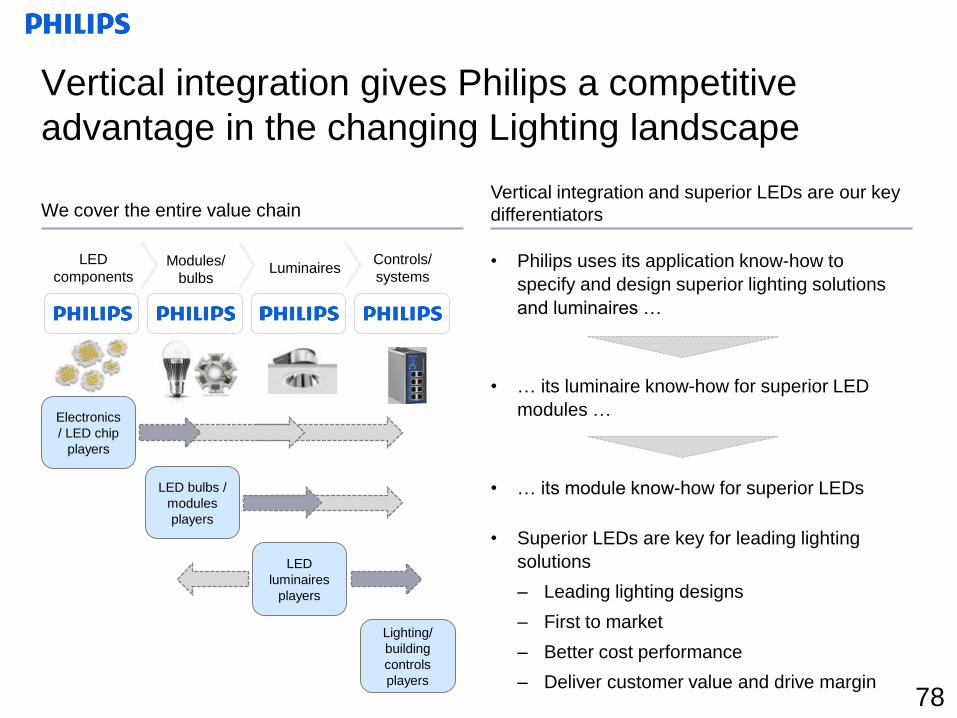
Vertical integration gives Philips a competitive
advantage in the changing Lighting landscape
Electronics
/ LED chip
players
LED bulbs /
modules
players
LED
luminaires
players
Lighting/
building
controls
players
• Philips uses its application know-how to
specify and design superior lighting solutions
and luminaires …
• … its luminaire know-how for superior LED
modules …
• … its module know-how for superior LEDs
• Superior LEDs are key for leading lighting
solutions
– Leading lighting designs
– First to market
– Better cost performance
– Deliver customer value and drive margin
Modules/
bulbs Luminaires
LED
components
Controls/
systems
We cover the entire value chain Vertical integration and superior LEDs are our key
differentiators
78
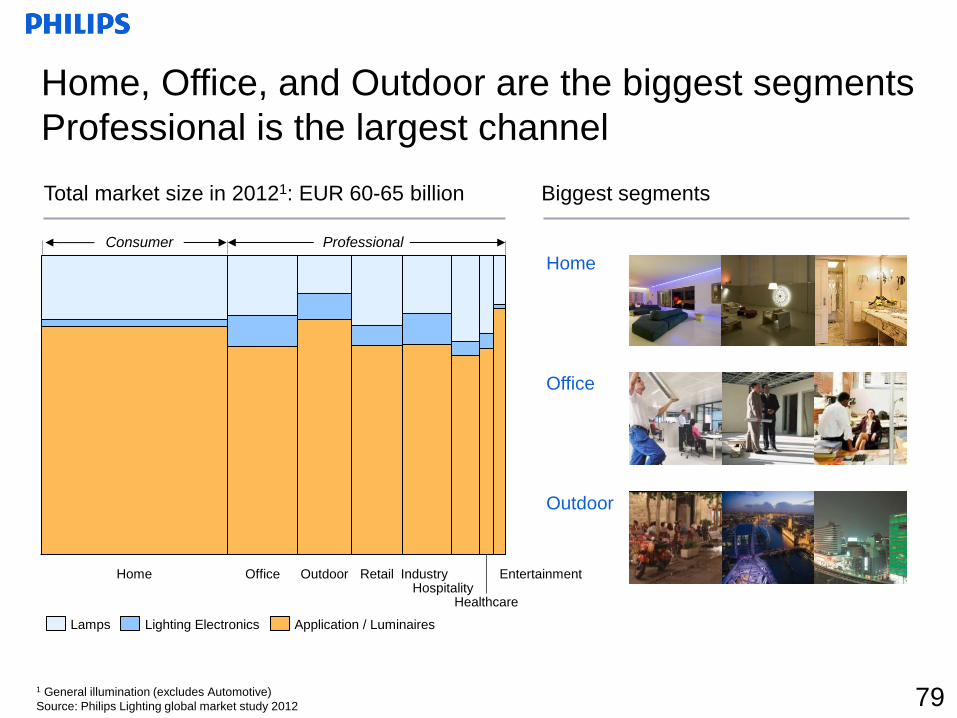
Office Outdoor Home Entertainment
Healthcare Hospitality
Industry Retail
Application / Luminaires Lighting Electronics Lamps
Home
Consumer Professional
Biggest segments Total market size in 20121: EUR 60-65 billion
Office
Outdoor
1 General illumination (excludes Automotive)
Source: Philips Lighting global market study 2012
Home, Office, and Outdoor are the biggest segments
Professional is the largest channel
79
Innovation, Group & Services Formerly known as Group Management & Services
Group Innovation Philips Group Innovation encompasses Group Funded Research and Innovation,
Design and Emerging Businesses
IP Royalty Royalty/licensing activities related to the IP on products no longer sold by the sectors
Group Management and Regional Costs Group headquarters and country & regional overheads
Accelerate! related investments Expected to stop by the end of the program in 2014
Pensions Pension and other postretirement benefit costs mostly related to former Philips’
employees
Service Units and Other Global service units; Shared service centers; Corporate Investments, TV stranded
costs and other incidentals related to the legal liabilities of the Group
80
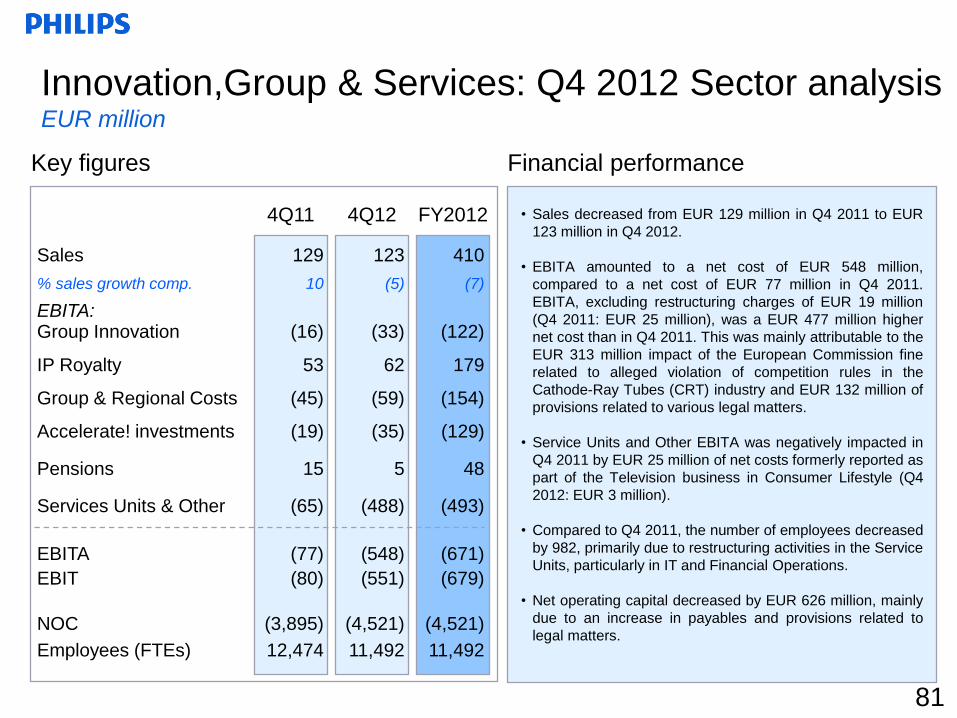
Sales
% sales growth comp.
EBITA: Group Innovation IP Royalty Group & Regional Costs Accelerate! investments Pensions Services Units & Other EBITA
EBIT
NOC
Employees (FTEs)
Innovation,Group & Services: Q4 2012 Sector analysis EUR million
Financial performance Key figures
4Q11 4Q12 FY2012
129
10
(16)
53
(45)
(19)
15
(65)
(77)
(80)
(3,895)
12,474
123
(5)
(33)
62
(59)
(35)
5
(488)
(548)
(551)
(4,521)
11,492
410
(7)
(122)
179
(154)
(129)
48
(493)
(671)
(679)
(4,521)
11,492
• Sales decreased from EUR 129 million in Q4 2011 to EUR
123 million in Q4 2012.
• EBITA amounted to a net cost of EUR 548 million,
compared to a net cost of EUR 77 million in Q4 2011.
EBITA, excluding restructuring charges of EUR 19 million
(Q4 2011: EUR 25 million), was a EUR 477 million higher
net cost than in Q4 2011. This was mainly attributable to the
EUR 313 million impact of the European Commission fine
related to alleged violation of competition rules in the
Cathode-Ray Tubes (CRT) industry and EUR 132 million of
provisions related to various legal matters.
• Service Units and Other EBITA was negatively impacted in
Q4 2011 by EUR 25 million of net costs formerly reported as
part of the Television business in Consumer Lifestyle (Q4
2012: EUR 3 million).
• Compared to Q4 2011, the number of employees decreased
by 982, primarily due to restructuring activities in the Service
Units, particularly in IT and Financial Operations.
• Net operating capital decreased by EUR 626 million, mainly
due to an increase in payables and provisions related to
legal matters.
81
To be published here soon:
(please refresh the page)
Royal Philips ElectronicsQ2 Quarterly Results 2011 – Presentation
July 18, 2011

Appendix
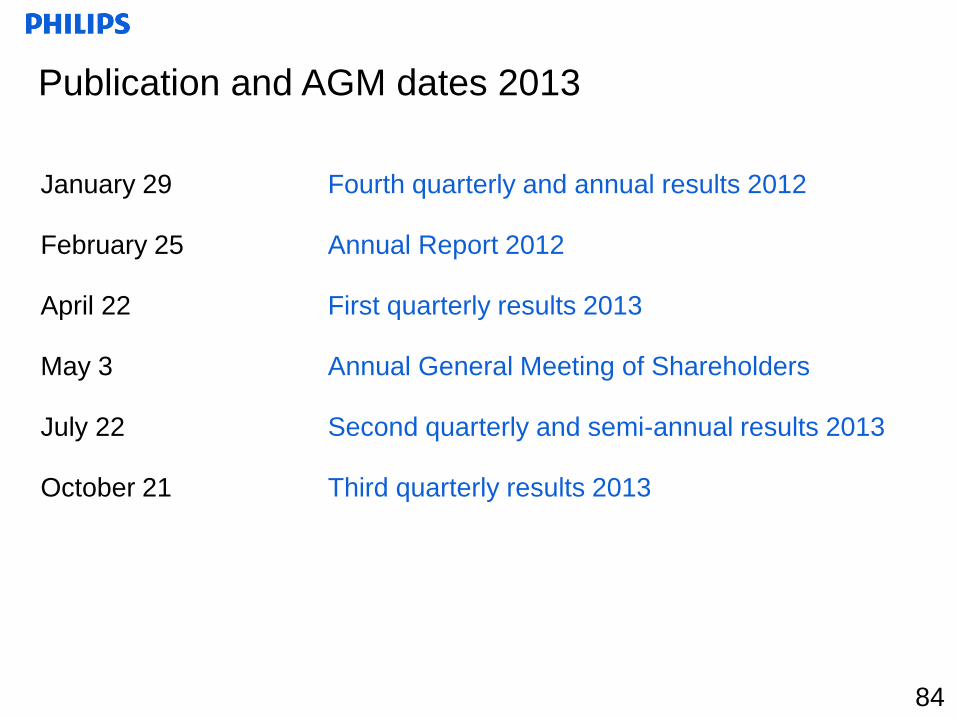
Publication and AGM dates 2013
January 29 Fourth quarterly and annual results 2012
February 25 Annual Report 2012
April 22 First quarterly results 2013
May 3 Annual General Meeting of Shareholders
July 22 Second quarterly and semi-annual results 2013
October 21 Third quarterly results 2013
84
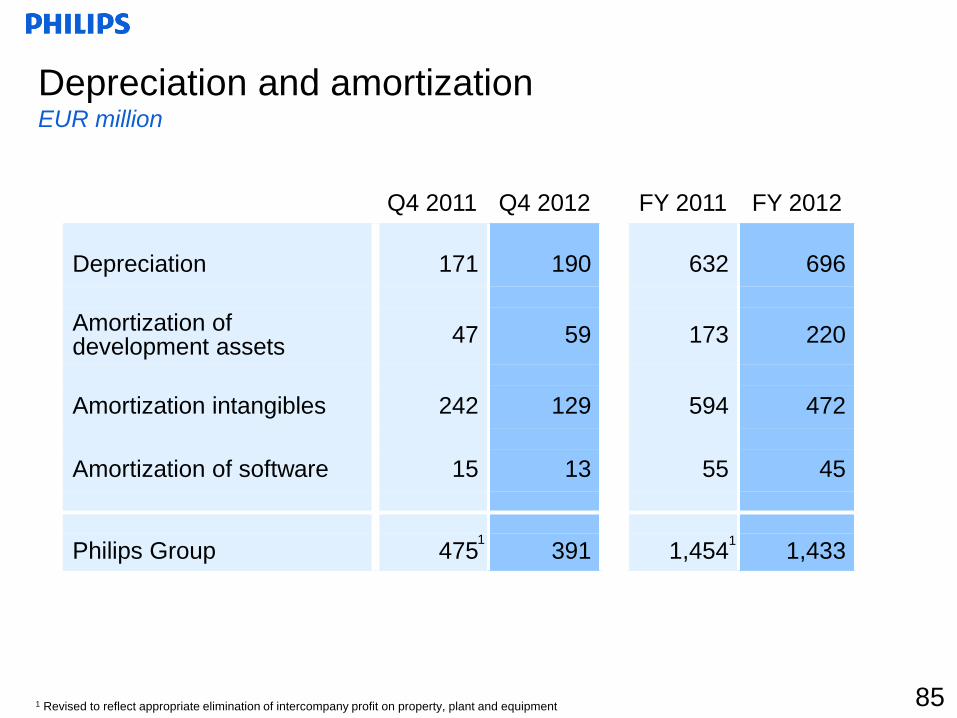
Depreciation and amortization EUR million
Q4 2011 Q4 2012 FY 2011 FY 2012
Depreciation 171 190 632 696
Amortization of development assets
47 59 173 220
Amortization intangibles 242 129 594 472
Amortization of software 15 13 55 45
Philips Group 475 391 1,454 1,433
85
1
1 Revised to reflect appropriate elimination of intercompany profit on property, plant and equipment
1
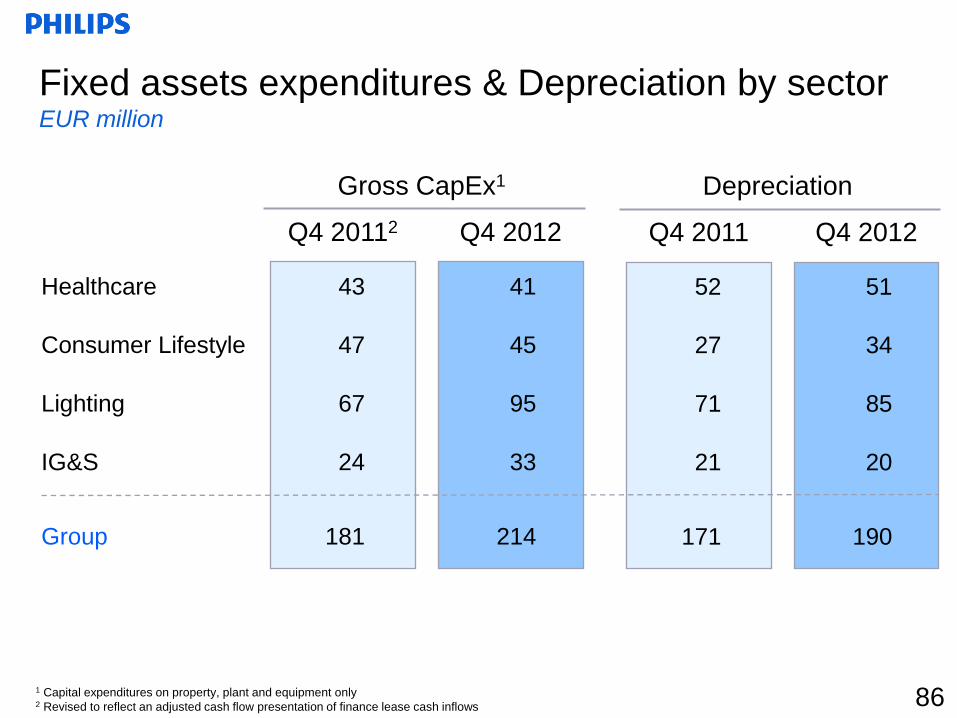
Fixed assets expenditures & Depreciation by sector EUR million
Q4 2012 Q4 20112
43
47
67
24
181
41
45
95
33
214
Healthcare
Consumer Lifestyle
Lighting
IG&S
Group
Gross CapEx1
Q4 2012 Q4 2011
52
27
71
21
171
51
34
85
20
190
Depreciation
86 1 Capital expenditures on property, plant and equipment only 2 Revised to reflect an adjusted cash flow presentation of finance lease cash inflows
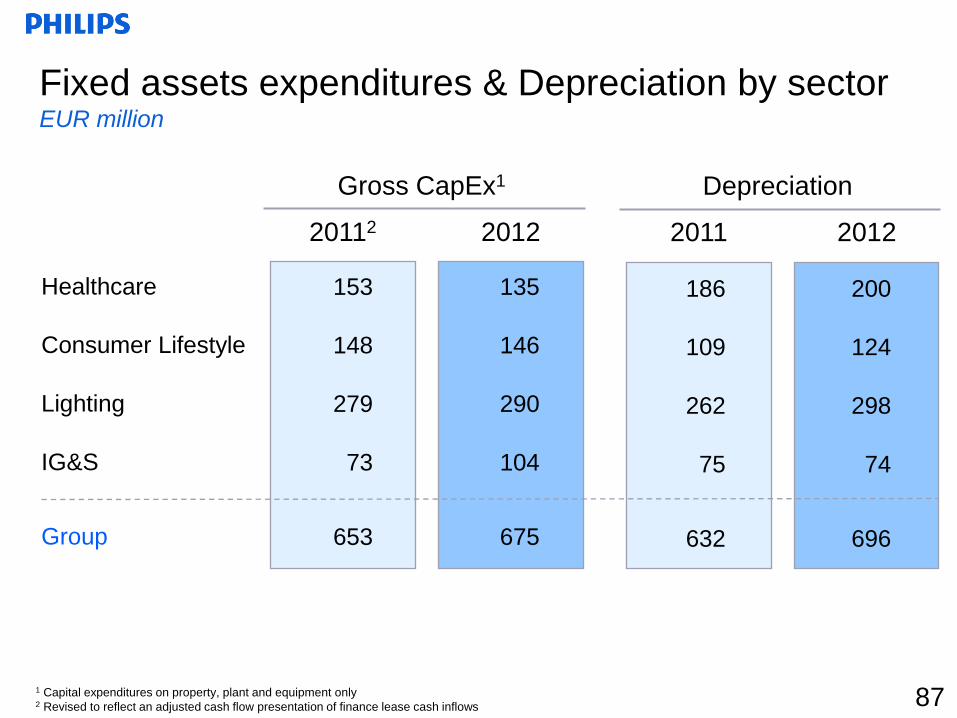
Fixed assets expenditures & Depreciation by sector EUR million
2012 20112
135
146
290
104
675
Healthcare
Consumer Lifestyle
Lighting
IG&S
Group
Gross CapEx1
2012 2011
200
124
298
74
696
Depreciation
153
148
279
73
653
186
109
262
75
632
1 Capital expenditures on property, plant and equipment only 2 Revised to reflect an adjusted cash flow presentation of finance lease cash inflows 87

Development cost capitalization & amortization by
sector EUR million
Q4 2012 Q4 2011
47
13
15
-
75
67
9
17
14
107
Healthcare
Consumer Lifestyle
Lighting
IG&S
Group
Capitalization
Q4 2012 Q4 2011
30
8
9
-
47
37
8
14
-
59
Amortization
88
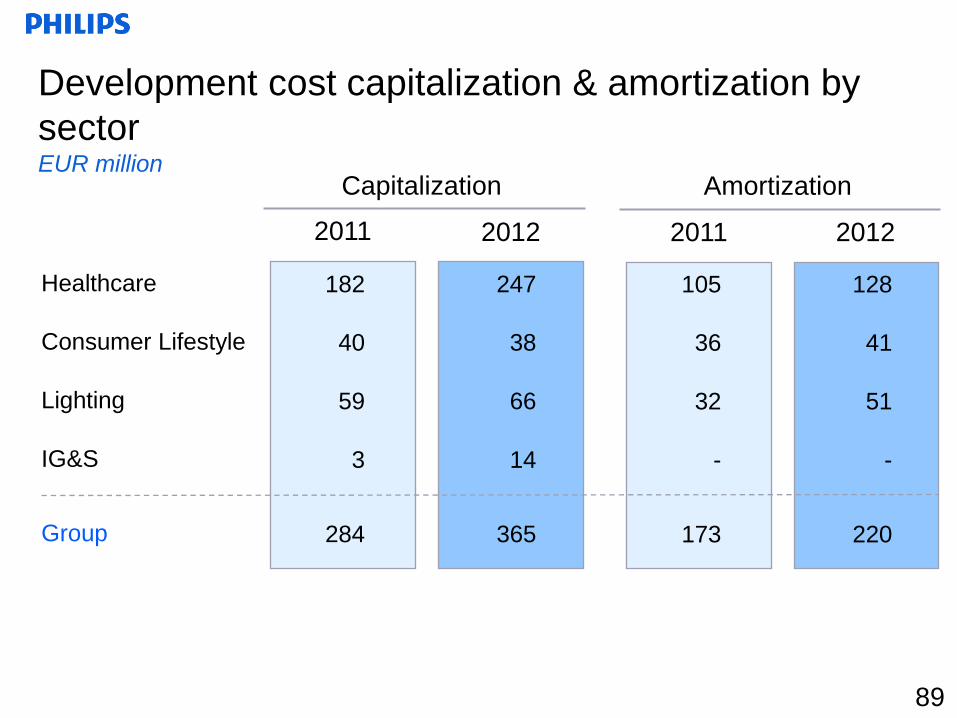
Development cost capitalization & amortization by
sector EUR million
2012 2011
182
40
59
3
284
247
38
66
14
365
Healthcare
Consumer Lifestyle
Lighting
IG&S
Group
Capitalization
2012 2011
105
36
32
-
173
128
41
51
-
220
Amortization
89
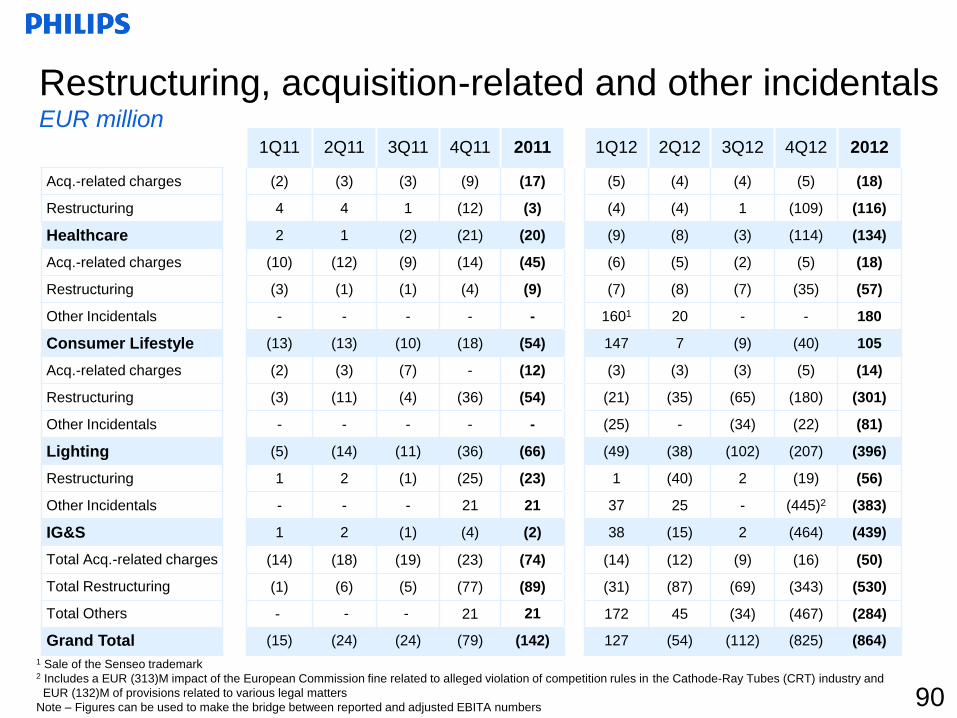
1Q11 2Q11 3Q11 4Q11 2011 1Q12 2Q12 3Q12 4Q12 2012
Acq.-related charges (2) (3) (3) (9) (17) (5) (4) (4) (5) (18)
Restructuring 4 4 1 (12) (3) (4) (4) 1 (109) (116)
Healthcare 2 1 (2) (21) (20) (9) (8) (3) (114) (134)
Acq.-related charges (10) (12) (9) (14) (45) (6) (5) (2) (5) (18)
Restructuring (3) (1) (1) (4) (9) (7) (8) (7) (35) (57)
Other Incidentals - - - - - 1601 20 - - 180
Consumer Lifestyle (13) (13) (10) (18) (54) 147 7 (9) (40) 105
Acq.-related charges (2) (3) (7) - (12) (3) (3) (3) (5) (14)
Restructuring (3) (11) (4) (36) (54) (21) (35) (65) (180) (301)
Other Incidentals - - - - - (25) - (34) (22) (81)
Lighting (5) (14) (11) (36) (66) (49) (38) (102) (207) (396)
Restructuring 1 2 (1) (25) (23) 1 (40) 2 (19) (56)
Other Incidentals - - - 21 21 37 25 - (445)2 (383)
IG&S 1 2 (1) (4) (2) 38 (15) 2 (464) (439)
Total Acq.-related charges (14) (18) (19) (23) (74) (14) (12) (9) (16) (50)
Total Restructuring (1) (6) (5) (77) (89) (31) (87) (69) (343) (530)
Total Others - - - 21 21 172 45 (34) (467) (284)
Grand Total (15) (24) (24) (79) (142) 127 (54) (112) (825) (864)
Restructuring, acquisition-related and other incidentals EUR million
1 Sale of the Senseo trademark 2 Includes a EUR (313)M impact of the European Commission fine related to alleged violation of competition rules in the Cathode-Ray Tubes (CRT) industry and
EUR (132)M of provisions related to various legal matters
Note – Figures can be used to make the bridge between reported and adjusted EBITA numbers 90

Recommended