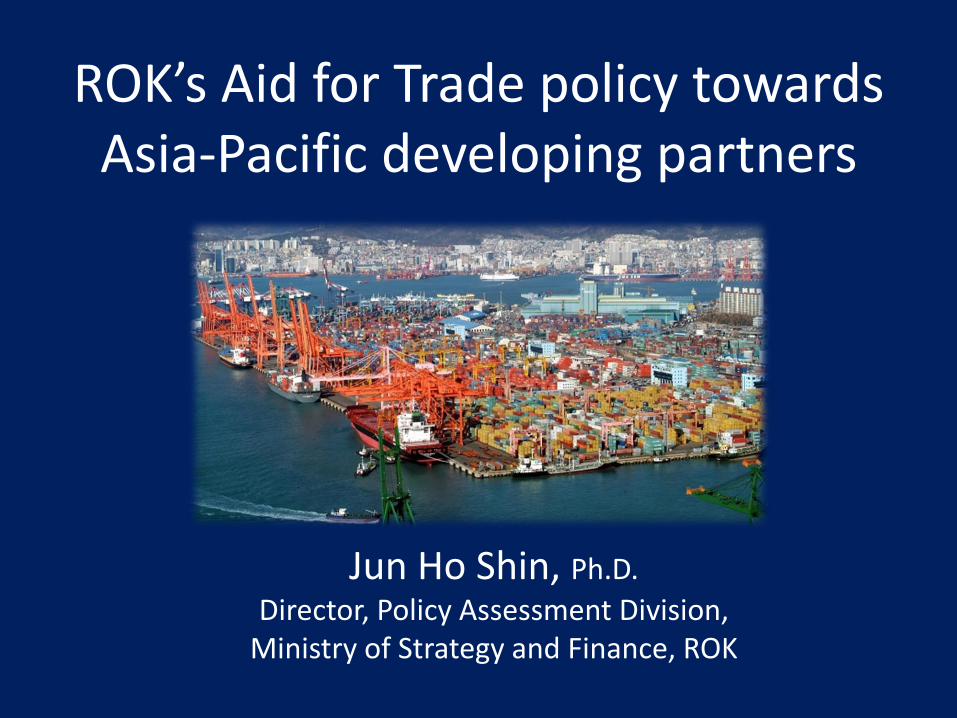
ROK’s Aid for Trade policy towards Asia-Pacific developing partners
Jun Ho Shin, Ph.D.
Director, Policy Assessment Division, Ministry of Strategy and Finance, ROK
Despite some issues to develop further, the ROK has recognized the importance of trade for economic development and has developed its Aid for Trade (AfT) policy based on what it is able to contribute towards Asia-Pacific countries both in terms of quality and quantity.
Main point

Outline
I. Overview
V. ROK’s AfT policy
VI. Way forward
III. ROK’s ODA figures
II. Key features of ROK’s Official Development Assistance (ODA)
IV. ROK’s Aid for Trade (AfT) performance

I. Overview
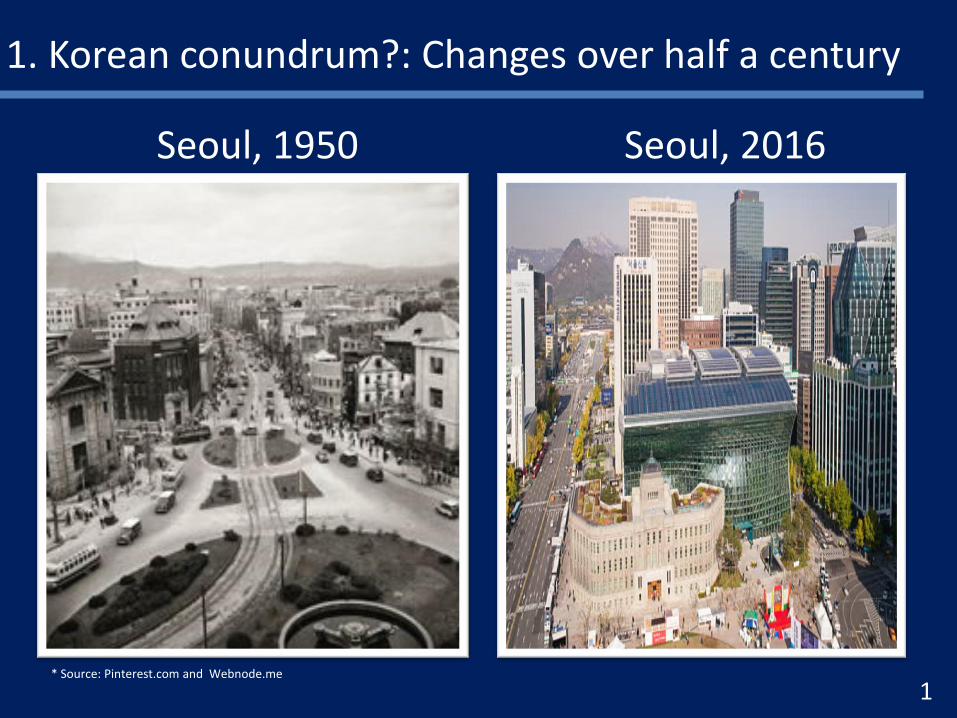
* Source: Pinterest.com and Webnode.me
1. Korean conundrum?: Changes over half a century
Seoul, 1950 Seoul, 2016
1

1960s 2010s
Per Capita GNI (USD)
110(1962)
27,440(2015)
Merchandise Exports (USD)
32 million(1960) 527 billion (2015)
% of GDP
Agriculture Industry Services
39.4(1965) 21.3(1965) 39.3(1965)
2.3(2015) 38.0(2015) 59.7(2015)
Life Expectancy 55.3(1960) 82.4(2014)
Enrollment Rate(%)
High Schools Univ./Colleges
48.8(1980) 11.4(1980)
93.5(2015) 68.1(2015)
* Source: KOSIS and WB data
2. Socio-economic performance
2
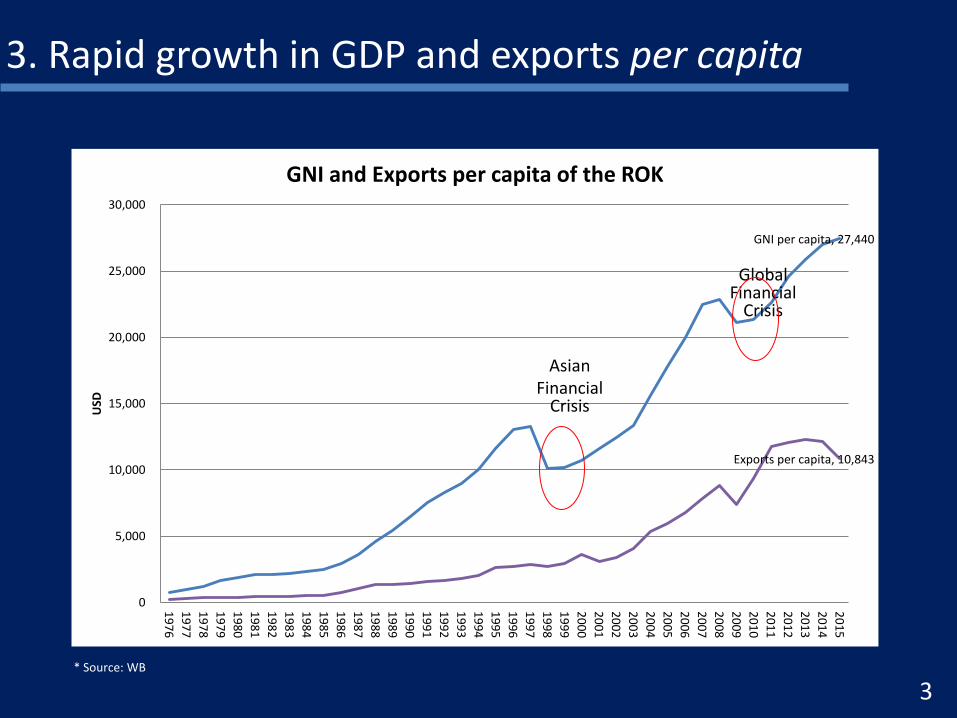
GNI per capita, 27,440
Exports per capita, 10,843
0
5,000
10,000
15,000
20,000
25,000
30,000
19
76
19
77
19
78
19
79
19
80
19
81
19
82
19
83
19
84
19
85
19
86
19
87
19
88
19
89
19
90
19
91
19
92
19
93
19
94
19
95
19
96
19
97
19
98
19
99
20
00
20
01
20
02
20
03
20
04
20
05
20
06
20
07
20
08
20
09
20
10
20
11
20
12
20
13
20
14
20
15
USD
GNI and Exports per capita of the ROK
Asian Financial
Crisis
Global Financial
Crisis
* Source: WB
3. Rapid growth in GDP and exports per capita
3
II. Key features of ROK’s ODA

1. Transformation from an aid recipient to an aid donor
2. The fast growing ODA by volume
3. Possibilities of South-South Cooperation
4
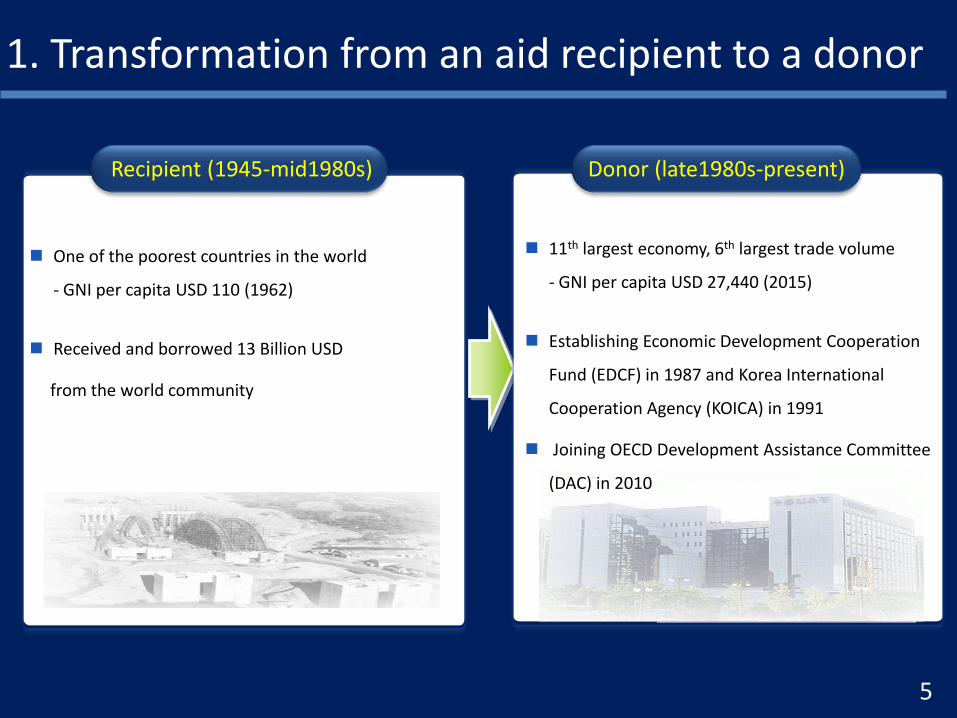
Recipient (1945-mid1980s)
One of the poorest countries in the world
- GNI per capita USD 110 (1962)
Received and borrowed 13 Billion USD
from the world community
Donor (late1980s-present)
1. Transformation from an aid recipient to a donor
11th largest economy, 6th largest trade volume
- GNI per capita USD 27,440 (2015)
Establishing Economic Development Cooperation
Fund (EDCF) in 1987 and Korea International
Cooperation Agency (KOICA) in 1991
Joining OECD Development Assistance Committee
(DAC) in 2010
5

- In absolute terms, still a small amount (2014) OECD DAC 115billion dollars
2.4billion dollars - Despite two global financial crises, the fastest pace of ODA growth OECD DAC: 1.7% 17.0%
2. Fast growing ODA by volume
* Source: OECD
1.7%
-0.5%
8.3%
3.0%
17.0%
-2.5%
2.0%
-0.05
0.00
0.05
0.10
0.15
0.20
DA
C C
ou
ntr
ies,
To
tal
F
ran
ce
G
erm
any
J
apan
K
ore
a
U
nit
ed K
ingd
om
U
nit
ed S
tate
s
Annual growth rate of ODA (2006-2014, commitment)
6
vs.
vs.
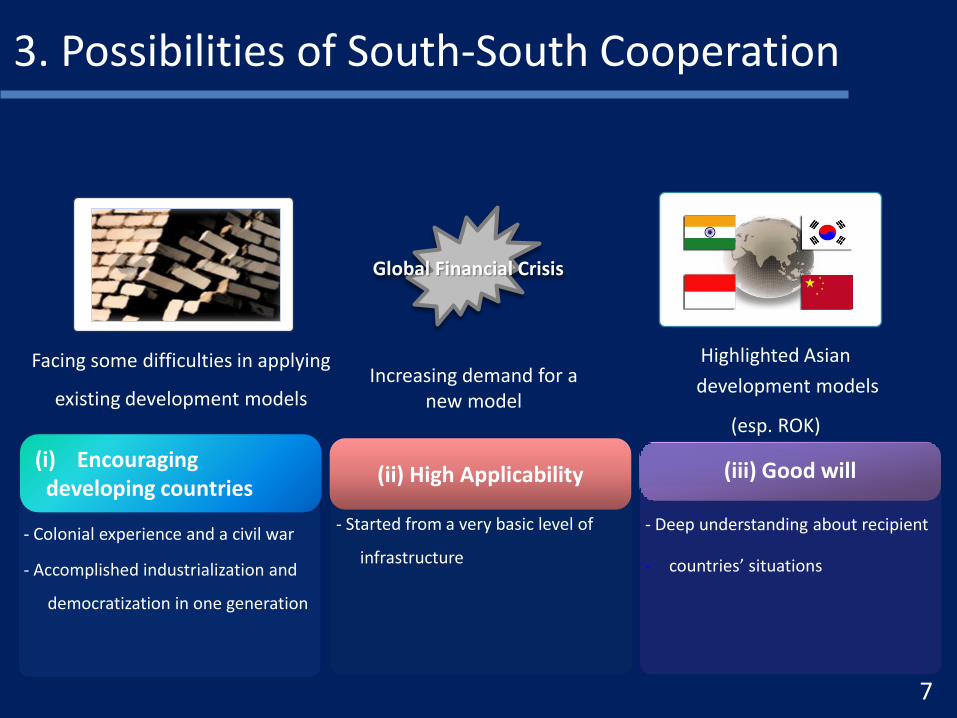
3. Possibilities of South-South Cooperation
Facing some difficulties in applying
existing development models
Highlighted Asian
development models
(esp. ROK)
Global Financial Crisis
(i) Encouraging developing countries
(ii) High Applicability (iii) Good will
- Deep understanding about recipient
- countries’ situations
- Started from a very basic level of
infrastructure
Increasing demand for a new model
- Colonial experience and a civil war
- Accomplished industrialization and
democratization in one generation
7

III. ROK’s overall ODA figures
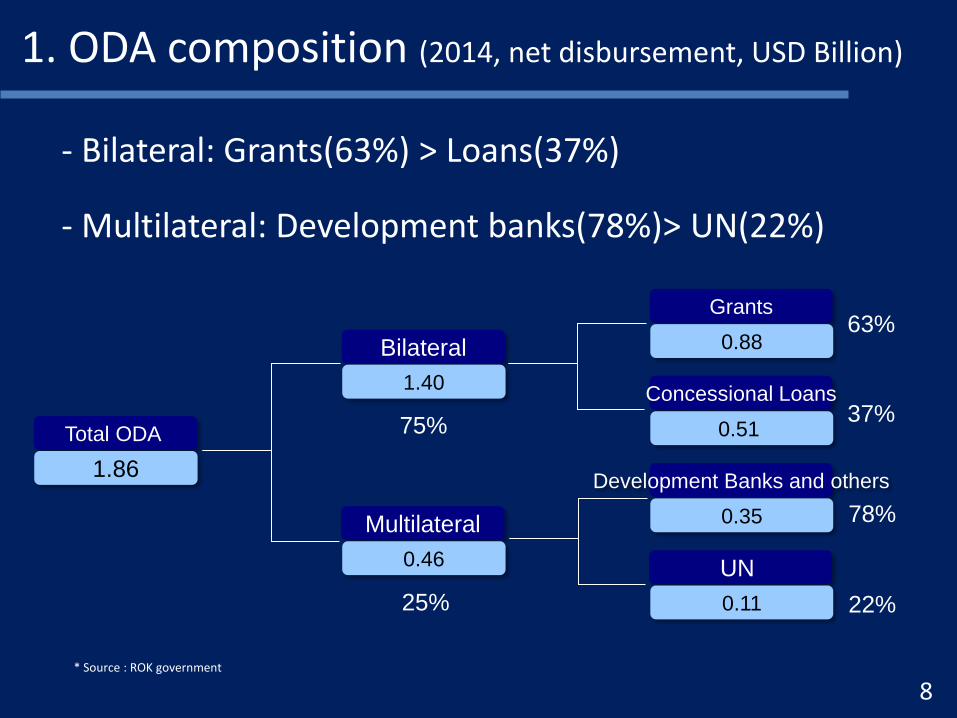
1. ODA composition (2014, net disbursement, USD Billion)
Total ODA
1.86
Multilateral
0.46
Bilateral
1.40
0.88
Grants
0.51
Concessional Loans
Development Banks and others
0.35
UN
0.11
75%
25%
63%
37%
78%
22%
* Source : ROK government
- Multilateral: Development banks(78%)> UN(22%)
- Bilateral: Grants(63%) > Loans(37%)
8
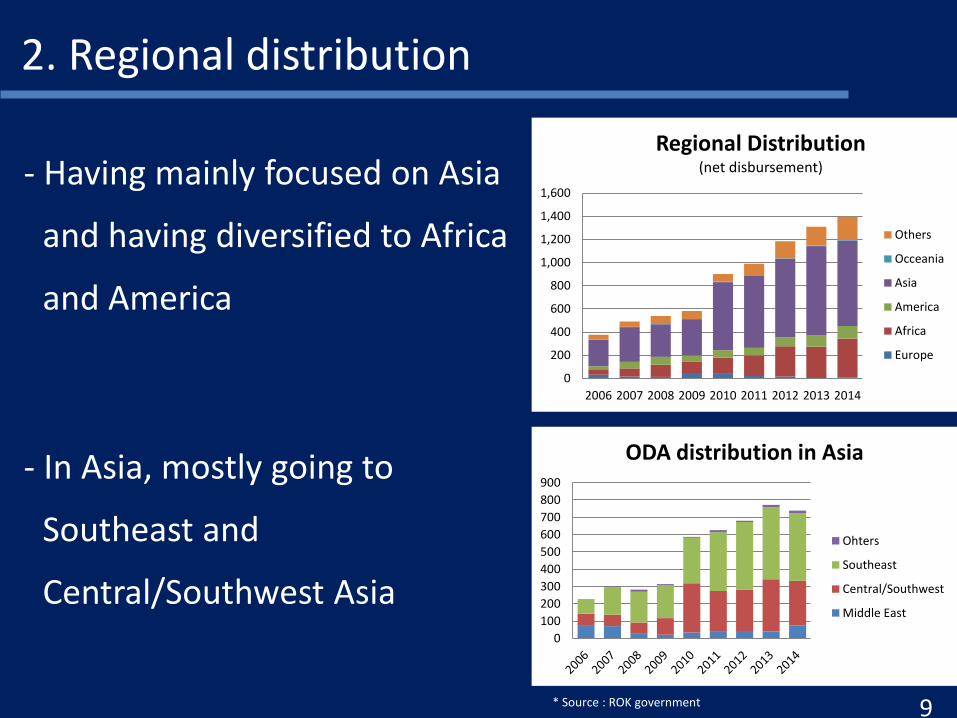
- Having mainly focused on Asia
and having diversified to Africa
and America
2. Regional distribution
* Source : ROK government
0
200
400
600
800
1,000
1,200
1,400
1,600
2006 2007 2008 2009 2010 2011 2012 2013 2014
Regional Distribution (net disbursement)
Others
Occeania
Asia
America
Africa
Europe
0
100
200
300
400
500
600
700
800
900
ODA distribution in Asia
Ohters
Southeast
Central/Southwest
Middle East
- In Asia, mostly going to
Southeast and
Central/Southwest Asia
9
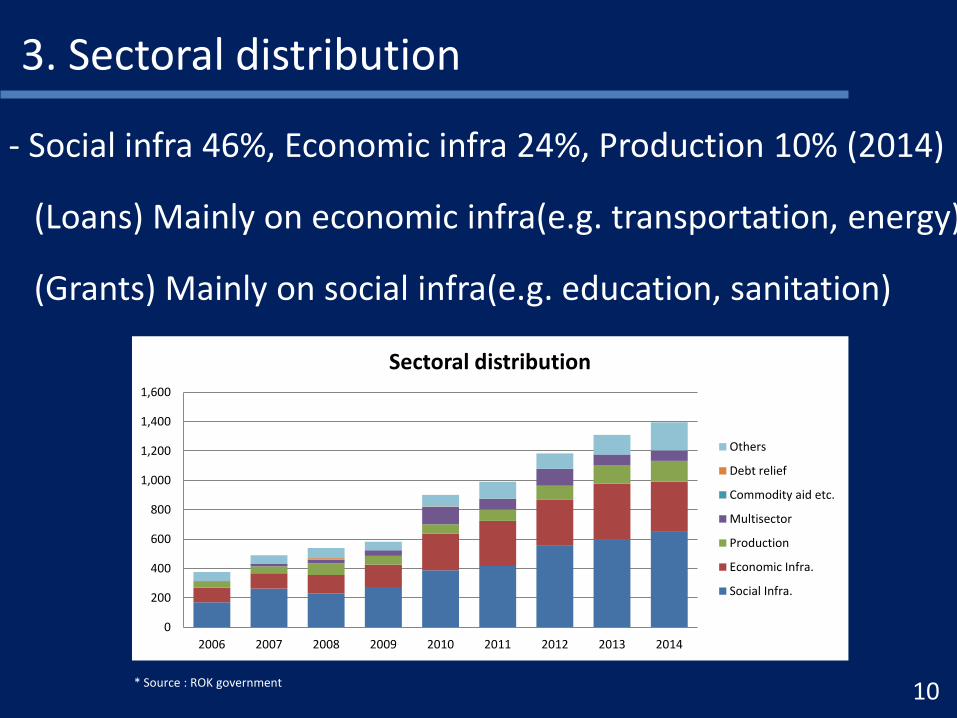
- Social infra 46%, Economic infra 24%, Production 10% (2014)
(Loans) Mainly on economic infra(e.g. transportation, energy)
(Grants) Mainly on social infra(e.g. education, sanitation)
3. Sectoral distribution
* Source : ROK government 10
0
200
400
600
800
1,000
1,200
1,400
1,600
2006 2007 2008 2009 2010 2011 2012 2013 2014
Sectoral distribution
Others
Debt relief
Commodity aid etc.
Multisector
Production
Economic Infra.
Social Infra.

IV. ROK’s AfT performance

- Global Aid for Trade Review (2007)
- Aid for Trade at a Glance (2009)
- Seoul Development Consensus (2010)
- Donor Questionnaire on AfT (2011)
- OECD-DAC Peer Review (2012)
- Aid for Trade at a Glance (2015)
1. ROK’s readiness for Aid for Trade
11
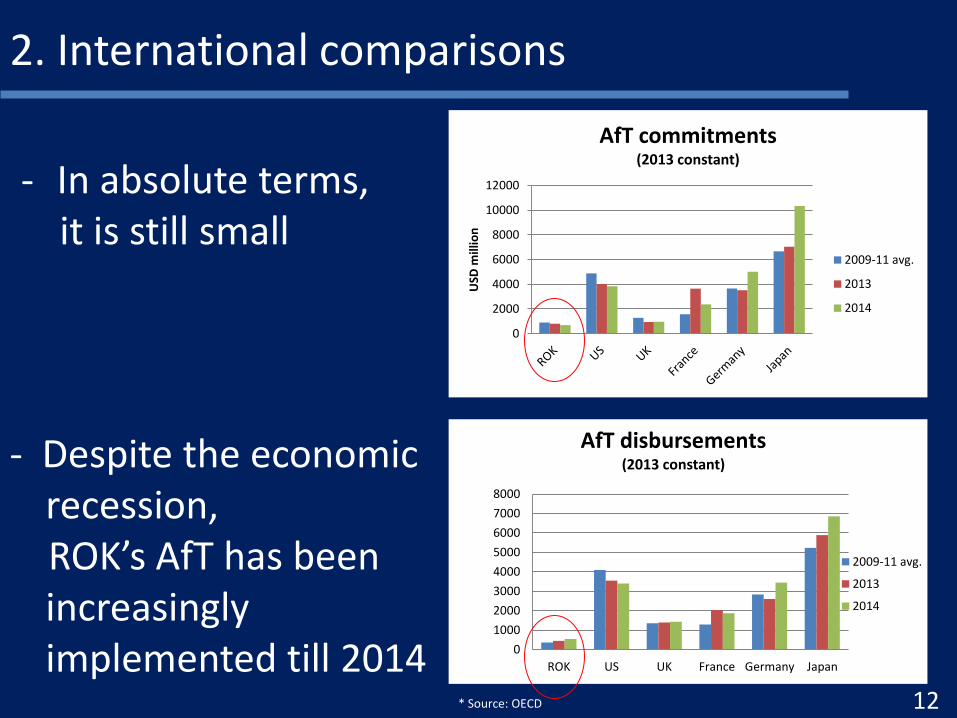
2. International comparisons
- Despite the economic recession,
ROK’s AfT has been increasingly implemented till 2014
- In absolute terms, it is still small
* Source: OECD 12
0
2000
4000
6000
8000
10000
12000
USD
mill
ion
AfT commitments (2013 constant)
2009-11 avg.
2013
2014
0
1000
2000
3000
4000
5000
6000
7000
8000
ROK US UK France Germany Japan
AfT disbursements (2013 constant)
2009-11 avg.
2013
2014

3. ROK’s sectoral distributions in AfT
- ROK’s AfT has been peaked in 2014
- Economic infrastructure> Building productive capacity > Trade policy and regulations
13
0
200
400
600
800
1000
1200
2010 2011 2012 2013 2014 2015
AfT commitments of ROK (USD million) Others
Trade-relatedAdjustment
Trade PolicyRegulations
BuildingProductiveCapacityEconomic Infra
0
100
200
300
400
500
600
2010 2011 2012 2013 2014 2015
AfT disbursements of ROK (USD million)
Trade-relatedAdjustment
Trade Policy Regulations
Building ProductiveCapacity
Economic Infra
* Source: ROK government

4. ROK’s AfT in Asia-Pacific region
- Showing similar pattern in volume and composition
* Source: ROK government 14
0
100
200
300
400
500
600
700
800
2010 2011 2012 2013 2014 2015
AfT commitments for Asia and the Pacific (USD millions)
Trade-related Adjustment
Trade Policy Regulations
Building ProductiveCapacity
Economic Infra
* Top 5 partners (commitment): Bangladesh, Myanmar, Viet Nam, Philippines, and Pakistan
0
100
200
300
400
500
2010 2011 2012 2013 2014 2015
AfT disbursments for Asia and the Pacific
Trade-related Adjustment
Trade Policy Regulations
Building ProductiveCapacity
Economic Infra
* Top 5 partners (disbursement): Bangladesh, Viet Nam, Sri Lanka, Philippines, and Indonesia

V. ROK’s AfT policy
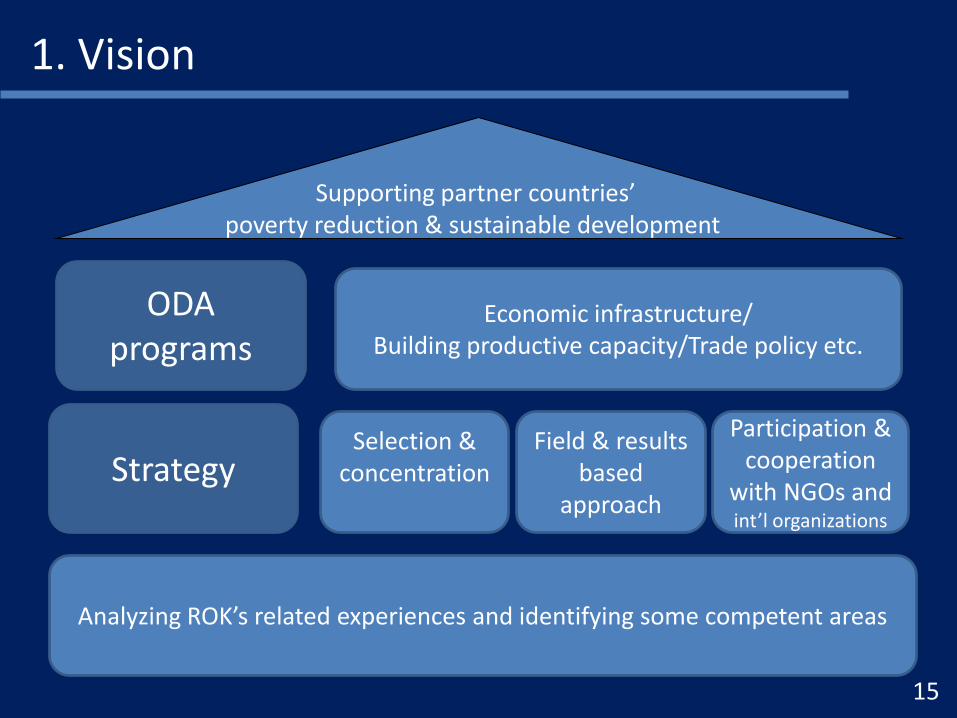
1. Vision
Analyzing ROK’s related experiences and identifying some competent areas
ODA programs
Strategy
Economic infrastructure/ Building productive capacity/Trade policy etc.
Selection & concentration
Field & results based
approach
Participation & cooperation
with NGOs and int’l organizations
Supporting partner countries’ poverty reduction & sustainable development
15
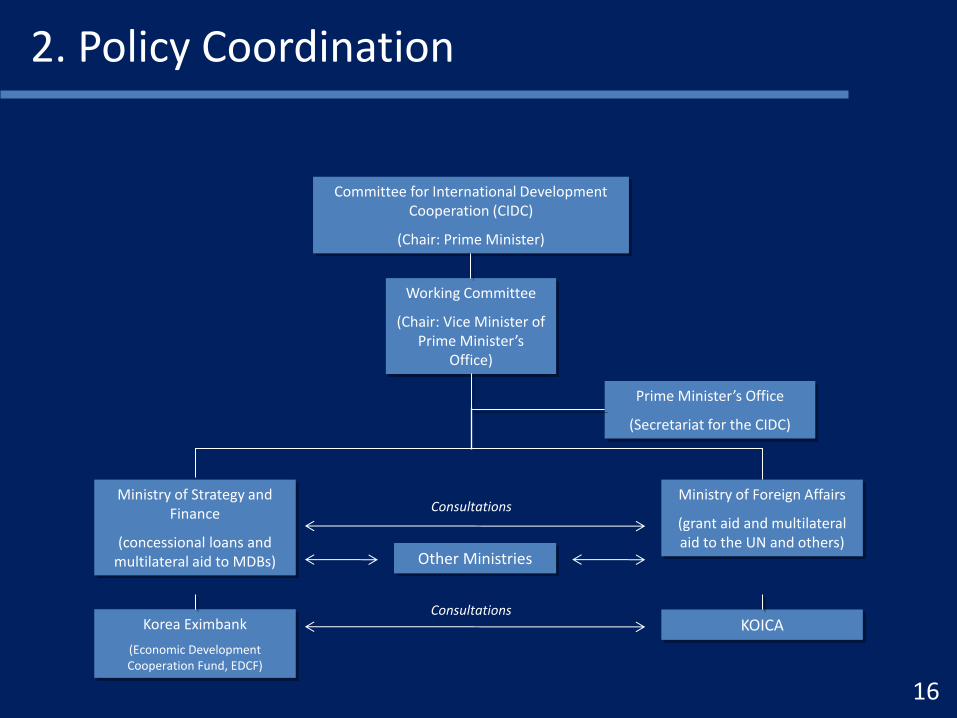
2. Policy Coordination
Committee for International Development Cooperation (CIDC)
(Chair: Prime Minister)
Working Committee
(Chair: Vice Minister of Prime Minister’s
Office)
Prime Minister’s Office
(Secretariat for the CIDC)
Ministry of Strategy and Finance
(concessional loans and multilateral aid to MDBs)
Korea Eximbank
(Economic Development Cooperation Fund, EDCF)
Ministry of Foreign Affairs
(grant aid and multilateral aid to the UN and others)
KOICA
Other Ministries
Consultations
Consultations
16

3. Strategy
1) Establishing Country Partnership Strategies (CPS) for its 24 priority partners*
* Criteria : Income levels, Economic relations, Regional distribution, etc.
- 11 Countries in Asia-Pacific region: Bangladesh*, Cambodia*, Indonesia, Lao PDR*, Mongolia, Myanmar*, Nepal*, Pakistan, Philippines, Sri Lanka, and Viet Nam
* 5 Least Developed Countries (LDC)
17
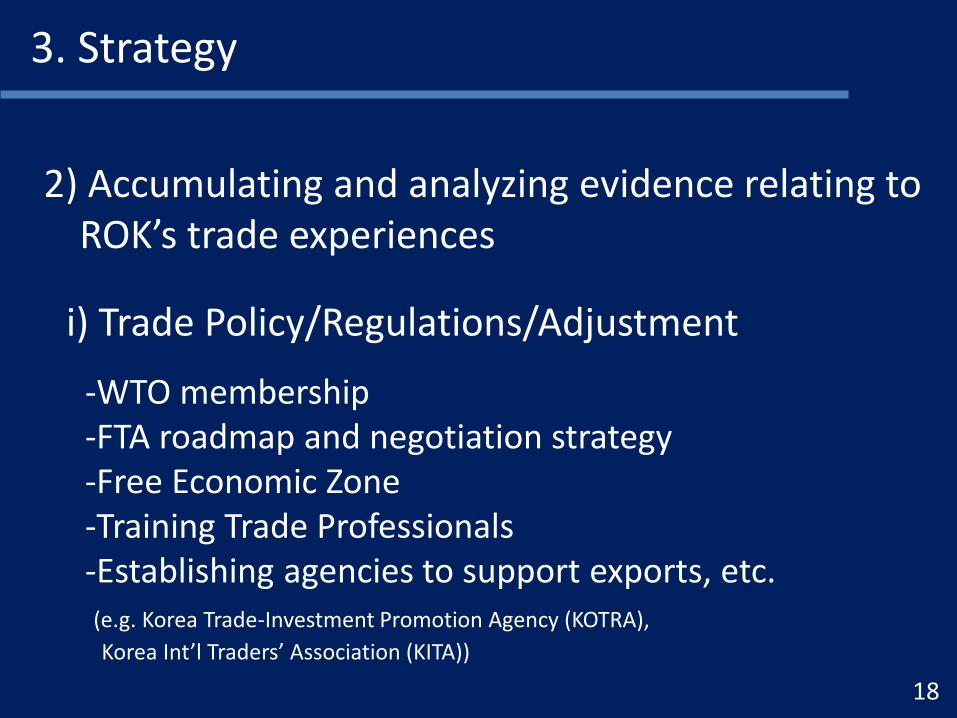
3. Strategy
2) Accumulating and analyzing evidence relating to ROK’s trade experiences
-WTO membership -FTA roadmap and negotiation strategy -Free Economic Zone -Training Trade Professionals -Establishing agencies to support exports, etc. (e.g. Korea Trade-Investment Promotion Agency (KOTRA),
Korea Int’l Traders’ Association (KITA))
i) Trade Policy/Regulations/Adjustment
18

- Green growth
- ICT R&D system
- Agricultural cooperative system
- Reforestation
- Fisheries development, etc.
ii) Building productive capacity
3. Strategy
19
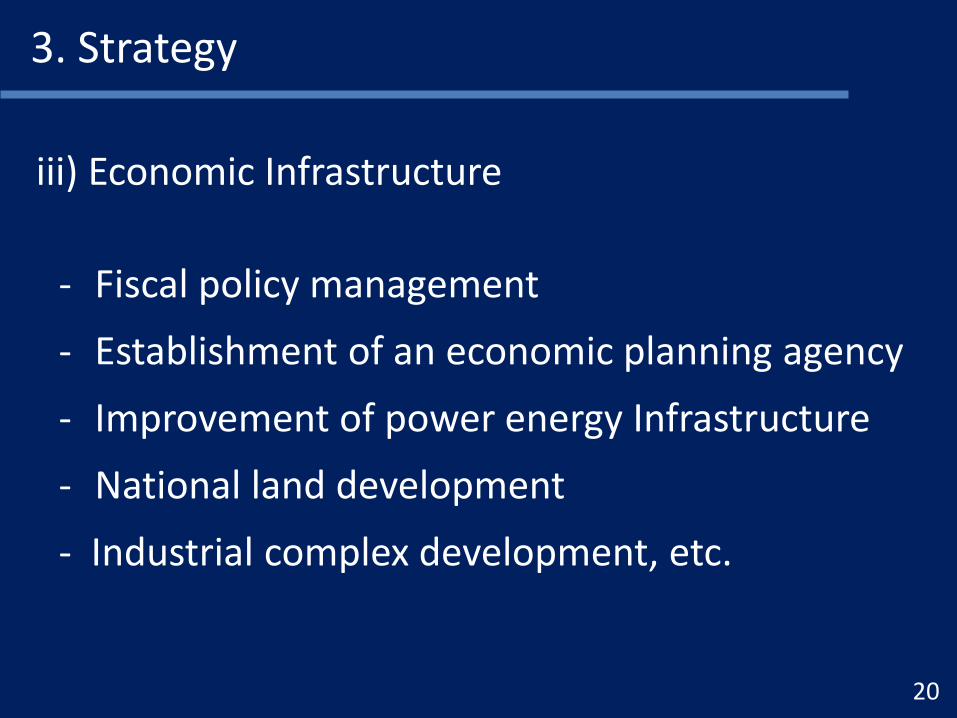
iii) Economic Infrastructure
- Fiscal policy management
- Establishment of an economic planning agency
- Improvement of power energy Infrastructure
- National land development
- Industrial complex development, etc.
3. Strategy
20

Some cases

Greater Mekong Sub-region (GMS) Southern coastal Corridor
- One of ADB’s GMS corridor programs - Region: Cambodia and Viet Nam - Total amount : EDCF 250 million USD * Co-financing with ADB (82 million USD), AusAid (34million USD) - Cross-border project - Adopting ADB safeguard policy
* Source: ROK government
Cases 1: Economic infrastructure
21
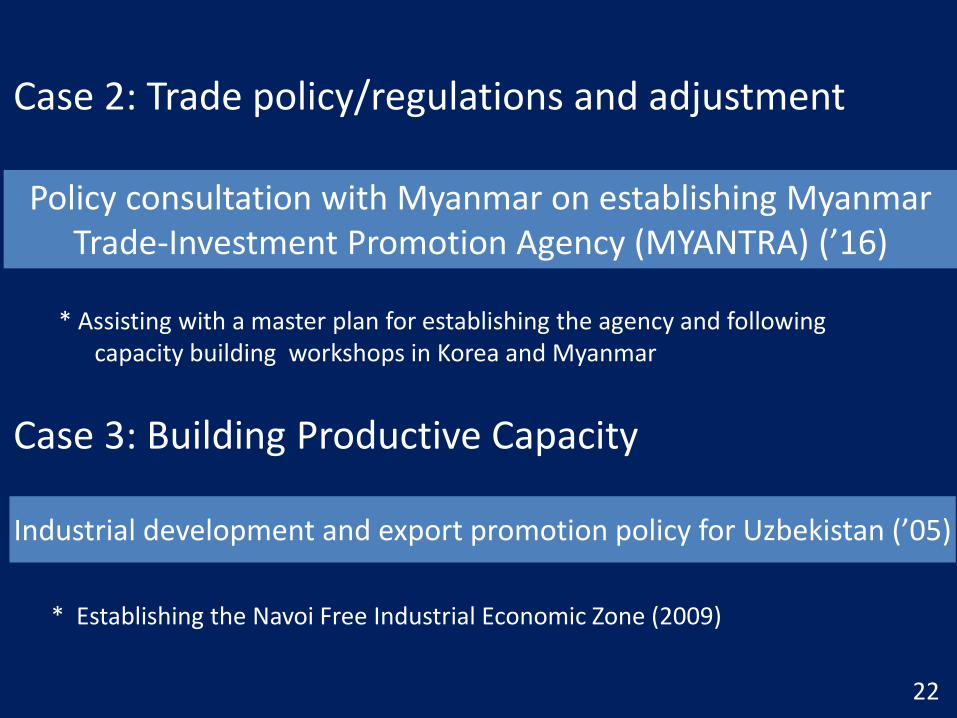
Case 2: Trade policy/regulations and adjustment
Policy consultation with Myanmar on establishing Myanmar Trade-Investment Promotion Agency (MYANTRA) (’16)
* Establishing the Navoi Free Industrial Economic Zone (2009)
Case 3: Building Productive Capacity
Industrial development and export promotion policy for Uzbekistan (’05)
* Assisting with a master plan for establishing the agency and following capacity building workshops in Korea and Myanmar
22

VI. Way forward

2. Focusing more on LDCs
1. Independent policy guidelines on AfT
3. Ensuring policy coherence on AfT as a cross cutting issue
23
Recommended