Risk Assessment for Development
Wells, GGS, Pipeline and
GPP in the Block AAP-ON-94/1,
Tinsukia District, Assam
Final Report
Dirok Field Development Phase-I & II
Prepared for:
Hindustan Oil Exploration Company Limited
Prepared by:
SENES Consultants India Pvt. Ltd.
Accreditation No. – NABET/EIA/1013/43
October, 2015

RA for Dirok Development Field
SENES 2 HOEC
Risk Assessment
1.1 QUANTITATIVE RISK ASSESSMENT
This section on Quantitative Risk Assessment (QRA) aims to provide a systematic analysis of the major
risks that may arise as a result of HOEC’s Gas Production Program comprising of drilling of 3 development
wells, installation of 1 Gas Gathering Station (GGS), Gas Processing Plant (GPP), laying of gas pipelines for
evacuation of natural gas from GGS to GPP
The QRA process outlines rational evaluations of the identified risks based on their significance and
provides the outline for appropriate preventive and risk mitigation measures. Results of the QRA provides
valuable inputs into the overall project planning and the decision making process for effectively
addressing the identified risks. This will ensure that the project risks stay below As Low As Reasonably
Practicable (ALARP) levels at all times during project implementation. In addition, the QRA will also help
in assessing risks arising from potential emergency situations like a blow out, jet fires and develop a
structured Emergency Response Plan (ERP) to restrict damage to personnel, infrastructure and the
environment.
The risk study for the onshore production activities has considered all aspects of operation of the drilling
rig and other associated activities during the production phase. Pipeline rupture and leaks constitute the
major potential hazards that may be associated with the proposed onshore production activities in AAP-
ON-94/1 block.
The following section describes objectives, methodology of the risk assessment study and then presents
the assessment for each of the potential risk separately. This includes identification of major hazards,
hazard screening and ranking, frequency and consequence analysis for major hazards. The hazards have
subsequently been quantitatively evaluated through a criteria based risk evaluation matrix. Risk
mitigation measures to reduce significant risks to acceptable levels have also been recommended as a
part of the risk assessment study.
1.1.1 Objective of the QRA Study
The overall objective of this QRA with respect to the proposed project involves
identification and evaluation of major risks, prioritizing risks identified based on their
hazard consequences and formulating suitable risk reduction/mitigation measures in line
with the ALARP principle. Hence in order to ensure effective management of any
emergency situations (with potential individual and societal risks) that may arise during
the development drilling activities, following specific objectives need to be achieved.

RA for Dirok Development Field
SENES 3 HOEC
Identify potential risk scenarios that may arise from the proposed development activities
particularly during transportation of natural gas and development drilling.
Analyze the possible likelihood and frequency of such risk scenarios by reviewing
historical accident related data for the onshore oil and gas industries.
Predict the consequences of such potential risk scenario’s and if consequences are high,
establish the same by through application of quantitative simulations.
Recommend feasible preventive and risk mitigation measures as well as provide inputs for
drawing up of Disaster Management Plan (DMP)/Emergency Response Plan (ERP) for the
project.
1.1.2 Risk Assessment Methodology
An overview of the methodology employed is provided here to briefly introduce the study
approach.
A site reconnaissance visit was conducted to identify all hazards, both generic and site specific.
Reviews of literature and accident databases were also undertaken. These formed the basis for
identifying all hazardous scenarios for the QRA Study. The frequencies, or the likelihood, of the
various possible outcomes resulting from natural gas release scenario were derived from historical
accident databases and, where necessary, these were modified to take into account local factors.
For all identified hazards assessed the consequences of each release were modeled using ALOHA
consequence modeling software.
Hazard Identification
Hazards associated with the proposed project have been identified based on site reconnaissance
visit, understanding of existing operations and detailed review of known incident records
worldwide and experience gained from operations at similar facilities.
In addition, based on the discussion with HOEC representative it is understood that natural gas
will be handled both at the well site and pipeline transportation. As the gas disperses, it mixes with
the surrounding air and warms up. The vapour cloud will only ignite if it encounters an ignition
source while concentrated within its flammability range.
Hazard Effects
In the event of an accidental natural gas release (in gaseous phase) from piping or equipment or
during blow outs, the characteristics of the possible hazardous effects are described below.

RA for Dirok Development Field
SENES 4 HOEC
Jet Fire
Jet fires result from ignited releases of pressurized flammable gas or superheated/pressurized
liquid. The momentum of the release carries the materials forward in a long plume entraining air
to give a flammable mixture. Jet fires only occur where the natural gas is being handled under
pressure or when handled in gas phase and the release are unobstructed. This is considered to be
the most credible risk scenario for the proposed project given the pipeline will be operated at a
design pressure of ~50 kg/cm2.
Flash Fire
Following natural gas release under high pressures, a cloud of methane may be formed, initially
located around the release point. If this cloud is not ignited immediately, it will move with the
wind and be diluted as a result of air entrainment. The dispersing vapour cloud may subsequently
come in contact with an ignition source and burn rapidly with a sudden flash. If the source of
material which created the cloud is still present, then the fire will flash back to the source giving a
jet fire. Direct contact with the burning vapours may cause fatalities but the short duration of the
flash fire generally means that thermal radiation effects are not significant outside the cloud and
thus no fatalities are expected outside of the flash fire envelope.
Fireball
Immediate ignition of releases caused by a rupture in a gas piping may give rise to a fireball upon
ignition. Fireballs have very high thermal radiation, similar to jet fires although the duration of the
event is short.
Vapour Cloud Explosion
A flash fire is the most likely outcome upon ignition of a dispersing vapour cloud from a natural
gas release. If the gas is ignited in areas where there is significant degree of confinement and
congestion an explosion may result. However if the ignition happens in open (unconfined) areas
as in this case, pure methane is not known to generate damaging overpressures (explode).
To summarize a gas phase release can result in a flash fire, fireball or jet fire. A liquid phase release
is generally associated with flash fire, vapour cloud explosion, pool fire or jet fire.
Scenarios for QRA study
Scenarios for the QRA study were identified based on the hazard identified in the aforesaid section
based on the site visit undertaken and review of incident records. Loss of containment events have
been identified for each section of the pipeline, corresponding to the relevant process conditions,
as listed in Table 6.1.

RA for Dirok Development Field
SENES 5 HOEC
TABLE 0-1: SCENARIOS FOR QRA STUDY
Sl.
No Plant Section
Initiating
Event Risk Scenario
Potential Outcome
Scenario
1 Pipeline Rupture 8” & 12” pipeline
rupture Jet fire, flash fire
Frequency Analysis
1.1.3 Pipeline Failure Frequency Analysis
An effort has also been made to understand the primary failure frequencies of gas pipeline which
is the result of the number of incidents within a period divided by the corresponding total system
exposure. Based on the European Gas Pipeline Incident Data Group (EGIG) database the evolution
of the primary failure frequencies over the entire period and for the last five years has been
provided in Table 6.2 below.
TABLE 0-2: PRIMARY GAS PIPELINE FAILURE FREQUENCY
Period No. of Incidents Total System
Exposure (km.yr)
Primary failure
frequency
(1000 km.yr)
1970-2007 1173 3.15.106 0.372
1970-2010 1249 3.55.106 0.351
1971-2010 1222 3.52.106 0.347
1981-2010 860 3.01.106 0.286
1991-2010 460 2.25.106 0.204
2001-2010 207 1.24.106 0.167
2006-2010 106 0.654.106 0.162
Source: 8h EGIG Report
As referred in the above table the overall failure frequency (0.35) of the entire period (1970-2010)
is slightly lower than the failure frequency of 0.37 reported in the 7th EGIG report (1970-2007).
The failure frequency of the last 5 years was found to be half the primary failure frequency over
the entire period showing the improved performance over the recent years.
Incident Causes
Natural gas pipeline failure incidents can be attributed to the following major causes viz. external
interference, construction defects, corrosion (internal & external), ground movement and hot tap.
The distribution of incidents with cause has been presented in the Figure 6.1 below.

RA for Dirok Development Field
SENES 6 HOEC
FIGURE 0-1: NATURAL GAS PIPELINE FAILURE – DISTRIBUTION OF INCIDENT & CAUSES
Source: 8th EGIG Report
The interpretation of the aforesaid figure indicated external interference as the major cause of
pipeline failure contributing to about 48.4% of the total failure incidents followed by construction
defects (16.7%) and corrosion related problems (16.1%). Ground movement resulting from
seismic disturbance, landslides, flood etc contributed to only 7.4% of pipeline failure incident
causes.
The pipeline failure frequency viz. leaks or rupture from natural gas transportation pipeline with
respect to the proposed project has been established based on the interpretation of the database of
European Gas Pipeline Incident Data Group (EGIG) representing almost 2 million kilometer year
of pipeline operations. The failure rate reported by EGIG for on-shore gas pipeline with design
pressure greater than 15 bar is 4.76 x 10⁻⁴ km/year. Full Bore Rupture (FBR) represents 13% of
the cases (6.188 x 10⁻⁵ failure /km/yr) and 87% of the cases represents Leaks (4.14 x 10⁻⁴ failure
/km/yr).
The frequency of pipeline failure computed for the proposed project based on EGIG failure
frequency is presented in the Table 6.3 below.
TABLE 0-3: NATURAL GAS PIPELINE FAILURE FREQUENCY
Sl. No Pipeline Failure Case
EGIG Failure
Frequency
(per km.year)
Total
Pipeline
Length (km)
Project Pipeline
Failure Frequency
(per year)
1 Gas Pipeline Rupture 6.188 x 10⁻⁵ 25 1.54 x 10⁻³
2 Gas Pipeline Leak 4.14 x 10⁻⁴ 25 1.03 x 10⁻²

RA for Dirok Development Field
SENES 7 HOEC
Pipeline Failure – Ignition Probability
In the period 1970-2010, only 4.4% of the gas releases recorded as incidents in the EGIG database
ignited. Ignition depends on the existence of random ignition sources. The EGIG database gives
the opportunity to evaluate the link between ignition and leak size.
The ignition probability of pipeline failure (rupture & leaks) with respect to the proposed project
is derived based on the following equations as provided in the IGEM/TD/2 standard
P ign = 0.0555 + 0.0137pd2; for 0≤pd2≤57
(Ignition Probability for pipeline ruptures)
P ign = 0.81; for pd2>57
P ign = 0.0555 + 0.0137(0.5pd2);
for 0≤0.5pd2≤57
(Ignition Probability for pipeline leaks)
P ign = 0.81; for 0.5pd2>57
Where:
P ign = Probability of ignition
p = Pipeline operating pressure (bar)
d = Pipeline diameter (m)
The ignition probability of natural gas release from 8” & 12” pipeline leak or rupture is calculated
based on the above equations utilizing the following input parameters as discussed below.
RA for Dirok Development Field
SENES 8 HOEC
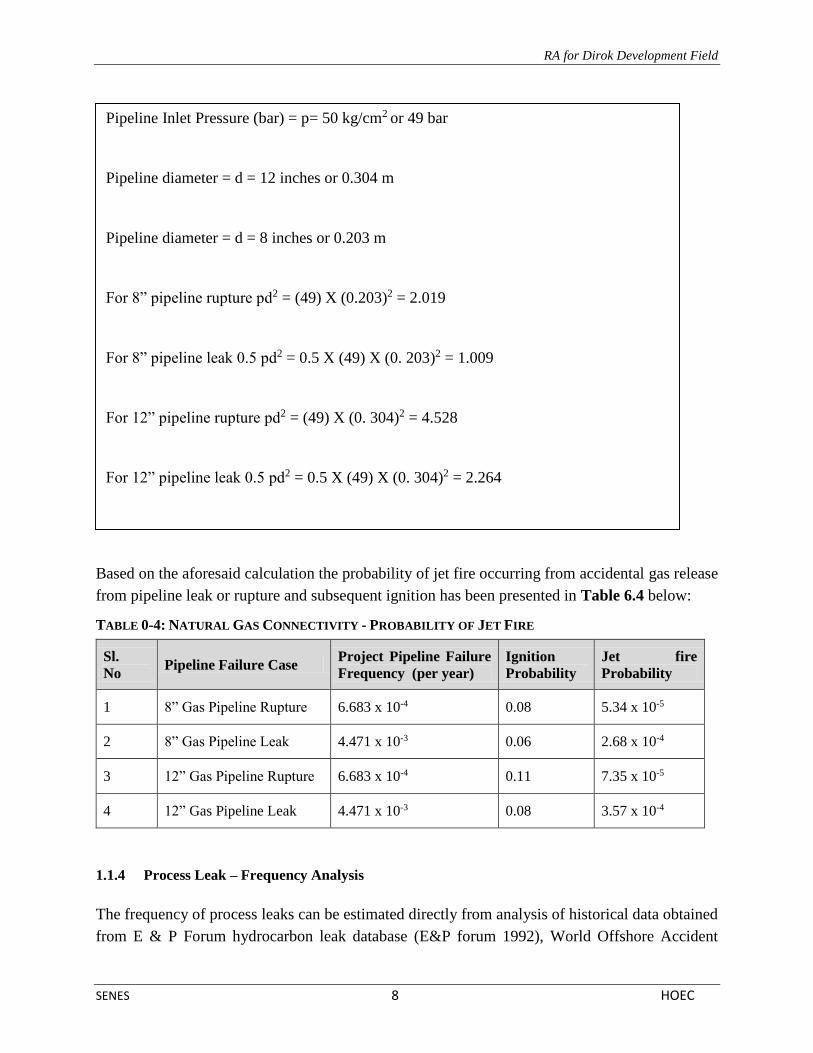
Based on the aforesaid calculation the probability of jet fire occurring from accidental gas release
from pipeline leak or rupture and subsequent ignition has been presented in Table 6.4 below:
TABLE 0-4: NATURAL GAS CONNECTIVITY - PROBABILITY OF JET FIRE
Sl.
No Pipeline Failure Case
Project Pipeline Failure
Frequency (per year)
Ignition
Probability
Jet fire
Probability
1 8” Gas Pipeline Rupture 6.683 x 10⁻⁴ 0.08 5.34 x 10⁻⁵
2 8” Gas Pipeline Leak 4.471 x 10⁻³ 0.06 2.68 x 10⁻⁴
3 12” Gas Pipeline Rupture 6.683 x 10⁻⁴ 0.11 7.35 x 10⁻⁵
4 12” Gas Pipeline Leak 4.471 x 10⁻³ 0.08 3.57 x 10⁻⁴
1.1.4 Process Leak – Frequency Analysis
The frequency of process leaks can be estimated directly from analysis of historical data obtained
from E & P Forum hydrocarbon leak database (E&P forum 1992), World Offshore Accident
Pipeline Inlet Pressure (bar) = p= 50 kg/cm2 or 49 bar
Pipeline diameter = d = 12 inches or 0.304 m
Pipeline diameter = d = 8 inches or 0.203 m
For 8” pipeline rupture pd2 = (49) X (0.203)2 = 2.019
For 8” pipeline leak 0.5 pd2 = 0.5 X (49) X (0. 203)2 = 1.009
For 12” pipeline rupture pd2 = (49) X (0. 304)2 = 4.528
For 12” pipeline leak 0.5 pd2 = 0.5 X (49) X (0. 304)2 = 2.264
Since 0≤pd2≤57 and 0≤0.5pd2≤57, the following equation has been utilized for deriving
the ignition probability for pipeline failure.
P ign for 8’ pipeline rupture = 0.0555 + 0.0137pd2 = 0.0555 + 0.0137 (2.019) = 0.083
P ign for 8” pipeline leak = 0.0555 + 0.0137(0.5pd2) = 0.0555 + 0.0137 (1.009) = 0.069
P ign for 12’ pipeline rupture = 0.0555 + 0.0137pd2 = 0.0555 + 0.0137 (4.528) = 0.117
P ign for 12” pipeline leak = 0.0555 + 0.0137(0.5pd2) = 0.0555 + 0.0137 (2.264) = 0.086

RA for Dirok Development Field
SENES 9 HOEC
Database (WOAD) and OREDA. Although onshore data is available for process leaks, the
information is not considered representative of the actual scenario. Under such circumstances
historical data available on hydrocarbon leaks in the OGP authenticated offshore accident
databases have been considered for purpose of process leak frequency analysis. Failure frequencies
of process equipment as in this case where leaks have been considered from valves and flanges of
the GCS facility has been presented in Table 6.5 below.
TABLE 0-5: LEAK FREQUENCIES FROM PROCESS EQUIPMENT
Equipment Type Frequency
(per equipment item year)
Flanges 8.8 X 10⁻⁵
Valves 2.3 X 10⁻⁴
Source: HSE Hydrocarbon Release Database
1.1.5 Blow Out – Frequency Analysis
Blow out frequency estimates is obtained from a combination of incident experience and associated
exposure in a given area over a given period. For the purpose of calculation of blow out frequency analysis
in context of the present study involving development operations, blow out frequencies per well drilled
have been considered. As comparable data for onshore operations was not available database for offshore
operations of North Sea Standard1 has been referred which has recorded a blowout frequency of 1.8 X 10-
5 per well per year.
Based on the given frequency and information provided by HOEC for the proposed project the blow out
frequency is calculated as follows:
No of development wells to be drilled = 3 (A)
Blow out frequency for development well drilling = 1.8 X 10⁻⁵ per well drilled (B)
Frequency of blow out occurrence for the proposed project = (A X B) = 3 X 1.8 X 10-5
= 5.4 X 10⁻⁵ per well drilled
Thus, the blow out frequency for the proposed project is calculated at 5.4 X 10⁻⁵ per well drilled i.e. the
likelihood of its occurrence is “Not Likely”
Blow Out – Ignition Probability
Review of SINTEF database indicates that a rounded ignition probability of 0.3 has been widely used for
the purpose of quantitative risk analysis arising from blow outs. As per this database generally ignition
occurred within first 5 minutes in approximately 40% of the blowouts leading to either pool and/or jet
1 http://www.ogp.org.uk/pubs/434-02.pdf

RA for Dirok Development Field
SENES 10 HOEC
fire. Blow out leading to flammable gas release has a greater probability of ignition compared to liquid
releases2
An alternative to the blowout ignition probabilities given by the UKOOA look-up correlations can be
obtained from Scandpowers’s interpretation of the blowout data provided by SINTEF 2. The most
significant category is that for deep blowouts which indicates an early ignition probability of 0.09. For the
purpose of the QRA study this can be taken as occurring immediately on release and calculation provided
below:
No of development wells to be drilled = 3 (A)
Blow out frequency for development drilling = 1.8 X 10⁻⁵ per well drilled (B)
Blow out ignition probability = 0.09 (C)
Probability of Blow out ignition for the proposed project = (A X B X C) = 3 X 1.8 X 10-5 X 0.09
= 4.8 X 10⁻⁶
Hence based on the aforesaid calculation the probability of ignition of blow out releases of hydrocarbons
for the proposed project will be 4.8X10⁻⁶ and has been considered to be as negligible.
1.1.6 Consequence Analysis
Pipeline generally contains large inventories of oil or gas under high pressure; although accidental
releases from them are remote they have the potential of catastrophic or major consequences if
related risks are not adequately analyzed or controlled. The consequences of possible pipeline
failure is generally predicted based on the hypothetical failure scenario considered and defining
parameters such as meteorological conditions (stability class), leak hole & rupture size and
orientation, pipeline pressure & temperature, physicochemical properties of chemicals released
etc.
As discussed earlier, jet fire have been identified as the possible consequences resulting from
release and is dependent on the ignition time. Taking into account the gas gathering and processing
facilities and pipeline the hypothetical risk scenarios as provided in Table 6.1 have been
considered for failure consequence modeling with respect to proposed project. In addition to the
above the following design specifications as presented in Table 6.6 have been considered for
consequence modeling
TABLE 0-6: PIPELINE DESIGN SPECIFICATIONS
Sl.
No. Parameters Values
1 Pipeline diameter (inch) 8 inch and 12 inch
2 Pipeline length (km) 16km & 9km
2 Fire and Explosion – Fire Risk Analysis by Daejun Change, Division of Ocean System and Engineering

RA for Dirok Development Field
SENES 11 HOEC
Sl.
No. Parameters Values
4 Design pressure (bar)* 49
5 Design temperature (in °C) 50
In the present study, we have estimated the consequence of each reference scenarios (as mentioned
in Table 6.1) in terms of fatality only. For each effect type (i.e. radiation, overpressure and toxic
release), a set of threshold values were considered having 1, 5, 10, 20 and 50% fatality (Table
6.7). These threshold values were derived from Probit functions using the following equations:
Thermal Radiation [1]: Pr = -14.9 + 2.56 x In (Q4/3 x t) ........................................ Eq.
Overpressure [2]: Pr = 1.47 + 1.37 ln (p) ..................................................... Eq.
Toxic release [3]: Pr = a +b x In (Cn x t) ....................................................... Eq.
where,
Pr = Probit
Q = heat radiation (W/m2)
t = exposure time (s)
p = peak overpressure (psig)
a, b, n = constants describing the toxicity of a substance
C = concentration (mg/m3)
t = exposure time (minutes)
TABLE 0-7: THRESHOLD VALUES FOR EACH EFFECT LEVEL
Fatality (%) Radiation (kW/m2) Overpressure (psi)
50 26.50 13.10
20 20.78 7.15
10 18.25 5.20
5 16.42 3.95
1 13.42 2.40
[N. B. The values were derived using the above mentioned Probit equations]
Based on these threshold values, effect distances were calculated to delineate different threat-zones
for each reference scenario. The analysis made use of the ALOHA model, one of the most
commonly used effect models to generate the consequence effects showing the estimated distances
for each scenario considered to a specified hazard end-point. These zones are displayed on a single
Threat Zone plot displayed as red, orange and yellow with red representing the worst hazard. The
threat zone displayed by ALOHA represent thermal radiation levels and also indicates the effects

RA for Dirok Development Field
SENES 12 HOEC
on people who are exposed to those thermal radiation levels but are able to seek shelter within one
minute.
Predominant local meteorological conditions and composition of the natural gas as provided
during discussions with HOEC personnel was also considered for this study. Nearly about 88-90%
of the natural gas is constituted by methane with ethane representing the remaining 2%.
Case I: Release of natural gas from valves/flanges of GGS – hole size (1”dia)
The jet fire threat zone plot for release and ignition of flammable natural gas from GGS facility
valves/flanges leak of size - diameter 1 inch is represented in Figure 6.2 below.
FIGURE 0-2: THREAT ZONE PLOT FOR JET FIRE – 1” DIA LEAK
THREAT ZONE:
Threat Modeled: Thermal radiation from jet fire
Orange: 11 meters --- (10.0 kW/ (sq m) = potentially lethal within 60 sec
Yellow: 16 meters --- (5.0 kW/ (sq m) = 2nd degree burns within 60 sec

RA for Dirok Development Field
SENES 13 HOEC
Taking into consideration established probit values that are linked to fatality caused by thermal
radiation from fire, no endpoint distances have been computed below thermal radiation of 13.42
kW/sq.m.
Case II: Ignition of natural gas from complete rupture of 8” pipeline
The complete rupture of 8” pipeline will result in the release of natural gas (in gaseous phase) the
ignition of which is likely to result in jet fire. The threat zone plot of jet fire resulting from pipeline
rupture is derived using ALOHA and represented in Figure 6.3.
FIGURE 0-3: THREAT ZONE PLOT FOR JET FIRE - 8” PIPELINE RUPTURE
THREAT ZONE
Threat Modeled: Thermal radiation from jet fire resulting from full bore rupture
Red : 19 meters --- (26.50 kW/ (sq m) = 50% fatality
Orange: 25 meters --- (18.25 kW/ (sq m) = 10% fatality
Yellow: 30 meters --- (13.42 kW/ (sq m) = 1% fatality

RA for Dirok Development Field
SENES 14 HOEC
The worst hazard for release and ignition of natural gas from complete rupture of 8” dia pipeline
will be experienced to a maximum radial distance of 19m from the source with 50% fatality.

RA for Dirok Development Field
SENES 15 HOEC
Case III: Ignition of natural gas from complete rupture of 12” pipeline
The complete rupture of 12” pipeline will result in the release of natural gas (in gaseous phase) the
ignition of which is likely to result in jet fire. The threat zone plot of jet fire resulting from pipeline
rupture is derived using ALOHA and represented in Figure 6.4.
FIGURE 0-4: THREAT ZONE PLOT FOR JET FIRE - 12” PIPELINE RUPTURE
THREAT ZONE
Threat Modeled: Thermal radiation from jet fire resulting from full bore rupture
Red : 29 meters --- (26.50 kW/ (sq m) = 50% fatality
Orange: 38 meters --- (16.42 kW/ (sq m) = 10% fatality
Yellow: 46 meters --- (13.42 kW/ (sq m) = 1% fatality
The worst hazard for release and ignition of natural gas from complete rupture of 12” dia pipeline
will be experienced to a maximum radial distance of 29m from the source with 50% fatality.
RA for Dirok Development Field
SENES 16 HOEC
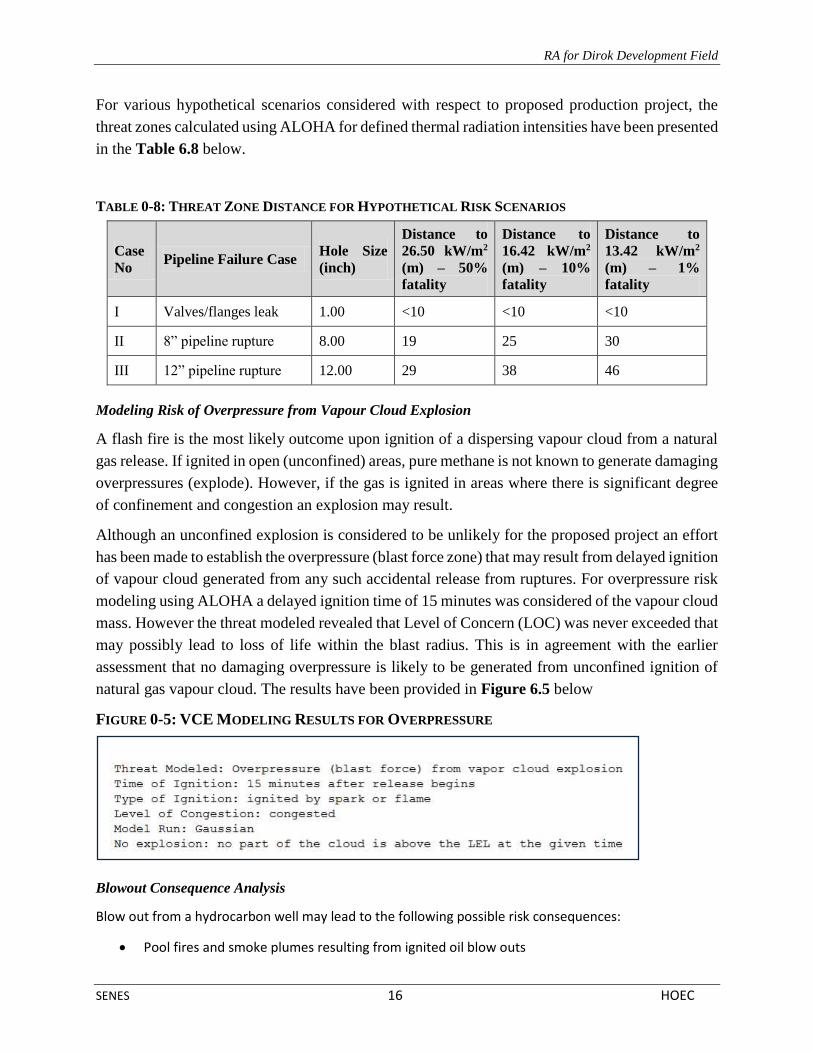
For various hypothetical scenarios considered with respect to proposed production project, the
threat zones calculated using ALOHA for defined thermal radiation intensities have been presented
in the Table 6.8 below.
TABLE 0-8: THREAT ZONE DISTANCE FOR HYPOTHETICAL RISK SCENARIOS
Case
No Pipeline Failure Case
Hole Size
(inch)
Distance to
26.50 kW/m2
(m) – 50%
fatality
Distance to
16.42 kW/m2
(m) – 10%
fatality
Distance to
13.42 kW/m2
(m) – 1%
fatality
I Valves/flanges leak 1.00 <10 <10 <10
II 8” pipeline rupture 8.00 19 25 30
III 12” pipeline rupture 12.00 29 38 46
Modeling Risk of Overpressure from Vapour Cloud Explosion
A flash fire is the most likely outcome upon ignition of a dispersing vapour cloud from a natural
gas release. If ignited in open (unconfined) areas, pure methane is not known to generate damaging
overpressures (explode). However, if the gas is ignited in areas where there is significant degree
of confinement and congestion an explosion may result.
Although an unconfined explosion is considered to be unlikely for the proposed project an effort
has been made to establish the overpressure (blast force zone) that may result from delayed ignition
of vapour cloud generated from any such accidental release from ruptures. For overpressure risk
modeling using ALOHA a delayed ignition time of 15 minutes was considered of the vapour cloud
mass. However the threat modeled revealed that Level of Concern (LOC) was never exceeded that
may possibly lead to loss of life within the blast radius. This is in agreement with the earlier
assessment that no damaging overpressure is likely to be generated from unconfined ignition of
natural gas vapour cloud. The results have been provided in Figure 6.5 below
FIGURE 0-5: VCE MODELING RESULTS FOR OVERPRESSURE
Blowout Consequence Analysis
Blow out from a hydrocarbon well may lead to the following possible risk consequences:
Pool fires and smoke plumes resulting from ignited oil blow outs

RA for Dirok Development Field
SENES 17 HOEC
Jet fires resulting from ignited gas blow outs
Oil slicks resulting from un-ignited oil pools.
However for the proposed project involving development drilling of gas wells for natural gas releases
leading to jet fire, modeling has been based considering methane which has been identified as the
principal constituent of natural gas.
Ignition of Flammable Gas Release leading to Jet Fire
Jet fires are burning jet of gas or sprays of atomized liquids resulting from gas and condensate release
from high pressure equipment and blow outs. Jet fires may also result in the release of high pressure liquid
containing dissolved gas due to gas flashing off and turning the liquid into a spray of small droplets. In
context of the present study, formation of jet fires can be attributed by the high pressure release and
ignition of natural gas if encountered during development of block hydrocarbon reserves.
Natural gas as recovered from underground deposits primarily contains methane (CH4) as a flammable
component, but it also contains heavier gaseous hydrocarbons such as ethane (C2H6), propane (C3H8) and
butane (C4H10). Other gases such as CO2, nitrogen and hydrogen sulfide (H2S) are also often present.
Methane is typically 70-90 percent, ethane 5-15 percent, propane and butane, up to 5 percent. Thus,
considering higher percentage of methane in natural gas, the thermo-chemical properties of the same has
been utilized in the jet fire blow out consequence modeling. The following risk scenario (Table 6.9) has
been considered for nature gas release consequence modeling:
TABLE 0-9: NATURAL GAS RELEASE MODELING SCENARIOS
Scenario Release Rate (kg/s) Release Type
Worst Case 10 Large
For the worst case scenario (10 kg/s release of natural gas) an effort was made to establish the
overpressure (blast force zone) that may result from delayed ignition of vapour cloud generated from any
such accidental release. For overpressure risk modeling using ALOHA a delayed ignition time of 5 minutes
was considered of the vapour cloud mass. However the threat modeled revealed that Level of Concern
(LOC) was never exceeded that may possibly lead to damage to property or life within the blast radius.
The results have been provided in Figure 6.6 below
FIGURE 0-6: WORST CASE – OVERPRESSURE RISK MODELING RESULTS FOR BLOWOUT

RA for Dirok Development Field
SENES 18 HOEC
Pre Control Measure of Gas Release
1. Rig Safety Engineer, Rig Manager & Drilling Supervisor to create the awareness about the gas
leakage procedure to the crew 2. All the employees to wear appropriate Personal Protective equipments 3. Avoid creating any source of ignition surrounding the rig site 4. Restricted Hot work & Kitchen activities
5. Restricted Vehicle Movements 6. Minimize the Crew moment 7. Medic & HSE Engineer should be Maintain SCPA ready condition 8. Medic should be organize necessary emergency facilities at First Aid Room as well as Ambulance
van
9. Fire Team to be Maintain the Fire Engine, Fire Extinguishers & Water to be control the fire during
the emergency. 10. Before testing inspect the Gas Detectors readily working condition
11. Inspect the Wind sock & it’s Properly fixed necessary place 12. Inspect the HSD Storage area any leakage in surrounding area & reduce the stock 13. Flammable material (LPG, HSD...etc) & Chemicals should not be stored
14. Inspect the rig site & Stop all hot work and shutdown all other sources of ignition 15. Incase any Emergency Raise the Alarm 16. Inform Drilling Supervisor of incident
17. Request assistance from emergency services 18. Shut down and isolate electrical supply & Flow lines to affected area if safe to do so 19. Evacuate any personnel at risk to the Muster Point or to a safe distance upwind from the incident
area and wait until advised otherwise
20. Confirm all personnel are accounted for via Muster Point head count 21. As time permits, maintain log of events for collection at end of incident
1.1.7 Individual Risk
Individual risk is the probability at which an individual may be expected to sustain a given level
of harm from the realization of specified hazards. In simple terms it is a measure to assess the
overall risk of the area concerned thus to protect each individual against hazards involving
hazardous chemicals, irrespective of the size of the accident that may occur. Graphically it
represents as iso-risk contour which connects all of the geographical locations around a hazardous
activity with the same probability of fatality.
In order to generate different level of iso-risk curves for the area concerned, it is required to
estimate the respective contribution of each reference scenario. Accordingly, individual risk of
each scenario was estimated by combining the frequency of the initiating event, the conditional
probability of that scenario sequence and the Probit value of the effect footprints. In particular
following expression was used to estimate the Individual Risk (IR) at a given geographical location
for each reference scenario:
IR(x, y, i) = fi. PFi ………………………………………………………………………………………………… (Eq. iv)

RA for Dirok Development Field
SENES 19 HOEC
where:
- fi is the frequency of the accident scenario i (year-1); calculated as multiplicative factor of the
frequency of the initiating event and the probability that the sequence of events leading to the
accident scenario i will occur: fi = fincident i . Psequence i
- PFi is the probability of fatality that the accident scenario i will result at location (i.e. Probit).
The individual risk so obtained is then compared with the Tolerance Criteria of Individual Risk as
provided in the Figure 6.7 below.
FIGURE 0-7: TOLERANCE CRITERIA FOR INDIVIDUAL RISKS
Hence for the proposed project the individual risk has been considered only for pipeline rupture as
no predicted fatality has been established for the consequence modeling undertaken for natural gas
release ignition from blow outs and/or valves/flanges of the GGS facility. Based on the above
equation the individual risk as calculated including the tolerance criteria has been presented in the
Table 6.10 below.

RA for Dirok Development Field
SENES 20 HOEC
TABLE 0-10: INDIVIDUAL RISK – PIPELINE RUPTURE
Accident Scenario
Frequency Fatality Probability Individual Risk
Individual Risk
Criterion
A. 8 inch Pipeline Rupture
5.34 x 10⁻⁵ 0.50 2 x 10⁻⁵ ALARP
5.34 x 10⁻⁵ 0.10 5 x 10⁻⁶ Tolerable
5.34 x 10⁻⁵ 0.01 5 x 10⁻⁷ Tolerable
B. 12 inch Pipeline Rupture
7.35 x 10⁻⁵ 0.50 3 x 10⁻⁵ ALARP
7.35 x 10⁻⁵ 0.10 7 x 10⁻⁶ Tolerable
7.35 x 10⁻⁵ 0.01 7 x 10⁻⁷ Tolerable
The individual risk resulting from proposed project particularly from pipeline operations in most
cases is assessed to be within tolerable limits. The maximum off-site risk is computed to be 2 x
10-5 and 3 x 10⁻⁵ which falls in the ALARP region of the individual risk criterion. Hence in order
to control the potential risk/hazards the following additional mitigation measures need to be
adopted as specified in the section below.
1.1.8 Risk Mitigation Measures
Pipeline Safety Devices & Features
The natural gas distribution network to be equipped with an emergency shutdown system
to close down all gas delivery system and to de-energize the electrical facilities located in
the vicinity of gas headers in case of leaks.
Over pressure shut off valves shall be provided upstream and downstream of controlling
regulators along with alarm provision in case of failure of the regulator.
Any equipment or section of the pipeline containing flammable gas in the form of trapped
volume shall be protected against excessive pressure developed due to rise in surrounding
temperature by installing Thermal Relief Valves (TRVs).
Pressure safety valves or other devices of sufficient capacity and sensitivity will be
installed to ensure that the normal operating pressure of the system is not exceeded by more
than 10%.
Vent line shall be designed and installed to exhaust the gas from relief valves to atmosphere
in accordance with OISD-STD-106.

RA for Dirok Development Field
SENES 21 HOEC
The pipeline should be monitored and controlled from SCADA system to ensure effective
and reliable control, management and supervision of the pipeline. All remote SV stations,
IPS, dispatch & receiving stations will have suitable field signals’ connectivity with
SCADA.
Pipeline Corrosion Control
The natural gas pipeline network will be protected from external corrosion by a
combination of anticorrosion coatings and cathodic protection. The cathodic protection
(CP) system will be designed in accordance with NACE-RP-0169.
Temporary cathodic protection will be provided during construction phase by sacrificial
anodes.
Corrosion coupons & corrosion sensing probes will be provided as required for monitoring
internal and external corrosion.
Safety devices in line with NACE-RP-01-77 shall be installed for preventing the damage
to the CP system of pipeline due to lightning or fault currents when the pipeline is installed
near electric transmission tower footings, ground cables etc
Pipeline system will be installed so that the below grade or submerged portions are not in
electrical contact with any casing, foreign piping systems or other metallic structures. This
shall not preclude the use of electrical bonds where necessary.
All pipeline stations, all roads and railway crossing locations, caution signs will be
displayed indicating hazardous area, name of the operating company emergency telephone
contact nos. etc.
Pipeline Operation & Maintenance
A detailed operation and maintenance procedure for control system and safety interlocks
will be developed comprising of pipeline system description, normal operations & shut
down procedure, temporary operations, emergency shutdown details and emergency
operations.
Operating instructions, emergency shutdown (ESD), Trip set pressures need to be
displayed in the control room and near all important operating equipments.
A detailed periodic preventive maintenance procedure and schedule to be developed for
entire mainline system considering the recommendations given by the original equipment
manufacturer. In this regard the work permits system as specified in OISD-STD-105 will
be adhered.

RA for Dirok Development Field
SENES 22 HOEC
Pipelines will be inspected with Geometry pig for dent/ ovality and other geometrical
deformities at the time of construction.
Pipeline valve location access will be properly maintained. Road and highways crossings
will be inspected once in 3 months. Water course crossings shall be inspected twice in a
year i.e. prior and after monsoon or flash flood for sufficiency of cover, accumulation of
debris, or for any other condition affecting the safety and security of the pipeline crossings.
Inspection of pipes, valves and fittings will be carried out as per OISD-STD-130.
Periodic inspection and maintenance will be carried out for control and protective
equipment including pressure limiting devices, regulators, controllers, relief valves and
other safety devices in accordance with OEM and OISD standards (Pumps: OISD-STD-
119, Compressors: OISD-STD-120, Pressure Limiting Devices: OISD-STD-132)
Periodic monitoring will be undertaken for Cathodic Protection System and internal
corrosion.
Route markers need to be installed and frequent patrolling will be carried out along the
pipeline route. Special precautions in this regards will be taken near community settlements
and infrastructure (schools, health centers etc) identified within the potential threat zone
leading to ≥ 1% fatality.
Villagers / public along the right of way will be a made aware of the possible consequence
of pipeline leaks and this shall be included as a part of regular audit procedure.
Blow Out Preventive Measures
Mitigation measures for prevention of blow out incidents as outlined below is formulated
based on review of specific provisions of Oil Mines Regulation Act 1984
The following control equipment for the drilling mud system shall be installed and kept in
use during drilling operations:
A pit level indicator registering increase or reduction in the drilling mud volume and shall
include a visual and audio warning device near the driller’s stand.
A device to accurately measure the volume of mud required to keep the well filled at all
times;
A gas detector or explosimeter at the primary shale shaker and connected to audible or
visual alarm near the driller’s stand;
A device to ensure filling of well with mud when the string is being pulled out;
A control device near the driller’s stand to stop the mud pump when the well kicks,

RA for Dirok Development Field
SENES 23 HOEC
If the control equipment indicates that formation fluids are entering the well, immediate
steps shall be taken to control the well.
The manager of every mine in which blowout preventor (BOP) assembly is installed, shall
submit to the Regional Inspector standing orders specifying the action to be taken when a
well kicks and the duties of each person employed on the rig and such order persons as
may be necessary for blowout drills and actual emergencies.
Blowout prevention drill shall be conducted for this purpose once in seven days.
Suitable control valves shall be kept available near the well which can be used in case of
emergency to control the well.
1.1.9 Emergency Management
Objective
The primary objective of the Emergency Response Plan (ERP) is to provide a safe, timely, effective and
coordinated response by the onsite Emergency Response Team (ERT), along with the other local and
government agencies/departments to prevent or minimize any major emergencies that may arise from
possible failures of proposed development drilling project.
The main objectives of this plan are:
Minimize the risk for human life, environment and common property resources, by means
of an effective and efficient intervention;
Protection of the environment;
Protection of public safety;
Initiate the early and efficient response throughout the utilization of all available resources.
Purpose
The purpose of the ERP is to effectively manage and control the emergencies occurring during project
operations. This ERP ensures,
emergency response group is effective & adequate;
clear roles and responsibilities of key personnel & support groups;
availability and adequacy of emergency infrastructure & resources; and
efficient emergency communication

RA for Dirok Development Field
SENES 24 HOEC
1.1.10 Emergency Response - Organizational Structure
HOEC will constitute emergency response teams to respond to Environmental issues, fire, accidents and
technical emergencies. These teams will be made up from operations personnel, who can be called upon
24 hours a day, supported by senior management field personnel as and when required. The emergency
response teams will receive specific training for their roles and exercised on a regular basis.
The emergency response set-up is categorized into
Emergency Response Group (ERG) members
Emergency Management Team (EMT) members
The Emergency Response Group (ERG) is the field-based team, which activates the emergency response
immediately on realizing the emergency. The ERG is organized as:
Emergency Response Group (ERG) leader
Forward Controller (FC)
Incident Controller (IC)
Emergency Response Team (ERT) members
Rig HSE Engineer
Event logger (to be appointed by Rig Manager as per requirement)
The Drilling Supervisor shall be the Emergency Response Group (ERG) leader located at drilling Rig site.
The Drilling Rig Manager shall presume the role of ‘Forward Controller’ (FC). The Tool Pusher shall
presume the role of ‘Incident Controller’ (IC) and shall be at the scene of the incident along with his team
members, to control the emergency. The Forward Controller shall be located at the Rig control room. He
shall direct and advise the Incident Controller (IC) on the course of action to be taken in consultation with
Drilling Supervisor. The Incident Controller will be present at the scene of emergency and will be the
person in the field responsible to control the emergency. He will report the situation to the Forward
Controller and to the Drilling Supervisor (ERG leader). The Drilling Supervisor and the Forward Controller
(FC) shall constantly update the Drilling Superintendent who in turn updates the other members of the
Emergency Management Team (EMT) at Chennai Head Quarters.
The Emergency Management Team (EMT) shall comprise of the following members:
Managing Director (Emergency Response Manager)
Drilling Manager (EMT Leader)
Drilling Superintendent
Logistics In-charge
Project Office In-Charge Assam

RA for Dirok Development Field
SENES 25 HOEC
HSE Manager
Drilling Administrator
Once the emergency message is received from the Rig, the Drilling Superintendent shall inform to Drilling
Manager who in turn after discussion with the Emergency Response Manager Managing Director and the
team at Chennai (if necessary) will activate the Emergency Management Teams (EMT) to the Emergency
Control Room.
The organizational chart for emergency response is presented in Figure 6.8 below.
FIGURE 0-8: EMERGENCY RESPONSE ORGANIZATIONAL CHART
1.1.11 Emergency Classification
Due consideration is given to the severity of potential emergency situation that may arise as a result of
pipeline failure accident events as discussed in the Quantitative Risk Analysis (QRA) study. Not all
emergency situations call for mobilization of same resources or emergency actions and therefore, the

RA for Dirok Development Field
SENES 26 HOEC
emergencies are classified into three levels depending on their severity and potential impact, so that
appropriate emergency response procedures can be effectively implemented by the ERG and EMT. The
emergency levels/tiers defined with respect to this project based on their severity have been discussed in
the subsequent sections with 'decision tree' for emergency classification being depicted in Figure 6.9
FIGURE 0-9: EMERGENCY CLASSIFICATION “DECISION TREE”
Level 1 - Emergency
An event can be dealt with by personnel and resources available at site; the event does not have any
effect outside the site, external agencies are unlikely to be involved.

RA for Dirok Development Field
SENES 27 HOEC
There is unlikely to be danger to life, to the environment, or to Company asset or reputation.
The Site Emergency Response Plan and Procedure are activated; the Company base offices at Digboi
and Chennai are notified.
Level 2 - Emergency
It is an event which may be dealt locally but requires involvement of wider Company resources and
external support. The initial event may be “on-site”, have some effect outside the site or be “off-site”, and
external services will be involved in handling the emergency.
There is likely to be danger to life, to the environment, or to Company asset or reputation.
The Site Emergency Response Plan and Procedure are activated; the Emergency Response Plan of HOEC
is activated.
Level 3 - Emergency
It is a major where likely to be danger to life, to the environment, or to Company asset or reputation is
involved.
The Site Emergency Response Plan and Procedure are activated; the Emergency Response Plan of HOEC
will be activated.
1.1.12 Emergency Response Procedure
The emergency response plan covers the following risk scenarios viz.
Fire from ignition of gas leaks from pipeline, GGS etc
Injury
Structural Failure
Well Blow Out during drilling
Hydrocarbon Leaks During Well Testing
Bomb Threat
Extreme Weather
However for the purpose of the present study response procedures has been limited to risk assessed in
aforesaid sections viz. blow outs and fire from pipeline failure. Details of the response procedures to be
adopted to manage the aforesaid risks have been provided below.

RA for Dirok Development Field
SENES 28 HOEC
Fire from Pipeline Failure

RA for Dirok Development Field
SENES 29 HOEC

RA for Dirok Development Field
SENES 30 HOEC
Well Control Emergency
Recommended