Rising Corporate Concentration, Declining Trade Union Power, and the Growing Income Gap: American Prosperity in Historical PerspectiveJordan Brennan
March 2016

RisingCorporateConcentration,DecliningTradeUnionPower,andtheGrowingIncomeGap:
AmericanProsperityinHistoricalPerspective
JordanBrennan*
March2016
*JordanBrennanisaneconomistwithUnifor,Canada’slargestprivatesectorlaborunion,andaresearchassociate of the Canadian Centre for Policy Alternatives. E-mail: [email protected]:www.jordanbrennan.org.

1
Contents
ExecutiveSummary 2
Acknowledgments 4
ListofFigures 5
PartI:CorporateConcentration,SecularStagnation,andtheGrowingIncomeGap 6
PartII:LaborUnions,Inflation,andtheMakingofanInclusiveProsperity 24
Appendix 48
References 51

2
ExecutiveSummary
The rise of income inequality amidst the deceleration of GDP growthmust rank as two of themost
perplexing and challenging problems in contemporary American capitalism. Comparing 1935–80 with
1980–2013—that is, the Keynesian-inspired welfare regime and, later, neoliberal globalization—the
averageannualrateofGDPgrowthwasmorethanhalvedandincomeinequalitywentfromapostwar
lowin1976toapostwarhighin2012.Howdoweaccountforthisdouble-sidedphenomenon?
The conventional explanations of secular stagnation and elevated inequality are inadequate,
largely because mainstream (“neoclassical”) economics rejects the notion that the amassment and
exercise of institutional power play a role in the normal functioning of markets and business. This
analytical inadequacy has left important causal elements outside the purview of researchers,
policymakers,andthepublicatlarge.
This two-partanalysis investigates someof thecausesandconsequencesof income inequality
andsecularstagnation intheUnitedStates.Usinganalytical tools fromearlyAmerican institutionalism
and Post Keynesianism, I find that two explanatory variables—institutional power and distributive
conflict—play critical causal roles in the shifting patterns of American economic growth and income
inequalitybeginninginthelate19thcenturyandcontinuinguptothepresentday.
In this context, “institutional power” takes two key forms: corporate power, which is a
commodifiedformofpower;andtradeunion,or“countervailing,”power.(Thesovereignpowerofthe
UnitedStatesgovernmentisnotthefocusofthisanalysis.)“Corporatepower”maybedefinedaslarge
firmsoperatinginoligopolisticmarketstructures,while“tradeunionpower”isthecapacityofworkers
toactinconcertthroughalaborunion.
Thekey finding is that the commodifiedpowerof large firmsdepresseseconomicgrowthand
exacerbates income inequality while the countervailing power of organized labormitigates inequality
andproducessignificantinflationarypressure.ThisanalysispresentsnewestimatesofUSmergeractivity
(1895–2013), corporate concentration (1950–2013), and the earnings margins and fixed asset
investmentofthe100largestAmerican-listedfirms(1950–2013).
Theanalysisbeginswithaninvestigationofthecommodifiedpoweroflargefirmsandfindsthat
mergersandacquisitions (M&A) lead to thecentralizationofcorporateownershipmanifested inasset
concentration.Theperiodbetween1990and2013waswitnesstothemostsustainedperiodofmerger
activity in American corporate history and, as a result, asset concentrationmore than doubled, rising
from9percentto21percent.Thereareroughly5.7millionregisteredcorporationsintheUnitedStates,
3
but the 100 largest firms account for one-fifth of total assets, which is a very high degree of
concentration.Increasedconcentrationisalsoshowntoreducecompetitivepressure,increaseearnings
margins(i.e.,marketpower),andinflatethenationalincomeshareoflargefirms.
Because investment in fixed assets is a key driver of GDP growth, the diversion of corporate
resources away from industrial expansion in favor of M&A puts downward pressure on growth and
leavesmorecorporate income inthehandsof largefirms.Withtheriseofstockoptions inthe1980s,
executives were given an institutional incentive to divert income into share price–inflating stock
repurchase,whichincreasestheearningsofexecutivesandexacerbatespersonalincomeinequality.
In the decades between 1950 and the 1970s, investment by the 100 largest firmsmore than
doubled,risingfrom6percentto13percentofrevenue,onlytotrenddownward inthedecadesafter
1980.Thissuggests that large firmsmaybe leadingthestagnationtendenciesof recent timesthrough
fixed asset underinvestment. Stock repurchase was nearly nonexistent in the 1970s but grew in
significance in each subsequent decade, rising from less than 1 percent of revenue in the 1970s to 7
percentin2007.
AnotherfirstinAmericancorporatehistorywasseenin2005,whenthe100largestfirmsspent
moremoneyinstockbuybacks(inflatingtheirstockprice)thanonfixedassetinvestment(replenishing
theirindustrialbase).Largefirmshavealsobeenonabuyingspreeinrecentdecades,plowingenormous
resourcesintoacquisitions.Thus,thecreationofatop-heavycorporatedistributionsimultaneouslyputs
downwardpressureongrowthwhileelevatinginequality.
Thesecondpartof theanalysisdocuments the interplaybetween thecountervailingpowerof
organized labor, inflation, and income inequality from the late 19th century up to the present day.
Mainstreameconomics insists that “market forces”distribute income inaccordancewithproductivity,
but this assertion is rooted in deeply problematic assumptions, concepts, and measurements.
Historically,unionshaveplayedacrucialroleinredistributingfactorincomefromcapitaltolabor(profit
towages)andfromtheuppertothelowerstrataofthepersonalincomehierarchy.
The growth of American labor unions in tandem with the exercise of the strike weapon,
especially from the 1930s to the 1970s, helped create an inclusive prosperity, or “middle class.” The
erosionofunionssincethemid-1950sandthepacificationof theAmericanworkforcesincethe1970s
hascoincidedwithwagestagnation,ashrinkingnationalwagebill,andheightenedincomeinequality.
PostKeynesiantheoryviews inflationastheproductoftheexcessiveclaimsmadebydifferent
groupsover national income. It is in this context that inflationmay validly beunderstood as a power
process insofar as it is nourishedon social conflict and is closely associatedwith the redistributionof
4
incomebetweendifferentincomegroups.Overthepastcentury,USinflationhastendedtoredistribute
incomefromcapitaltolaborandfromtheuppertothelowerstrataofthepersonalincomehierarchy.If
this set of claims is true, then anti-inflationary monetary policy must not only be understood as a
political phenomenon; it must also be viewed as the use of state power to regressively redistribute
income.
Acknowledgments
TheauthorwouldliketothankJosephA.FrancisforsharinghisdatafilesontheHistoricalStatisticsof
the United States and for forwarding a copy of Simon Kuznets’s estimates on American business
investment.ScottAquannohelpedclarifymyunderstandingofheterodoxeconomicthinkingoninflation
andmonetarypolicy,whileJimStanford’sfeedbackwasinstrumentalinrefiningtheargument.

5
ListofFigures
Figure1:AmericanCorporateAmalgamation,1895–2013 10
Figure2:SecularRatesofGrowth:InvestmentandGDP,1920–2013 11
Figure3:BusinessInvestmentinIndustrialCapacity,1946–2014 12
Figure4:Top100Firms:InvestmentDecomposition,1950–2013 13
Figure5:AmalgamationandConcentration,1940–2013 15
Figure6:ConcentrationandProfitShare,1950–2013 16
Figure7:ProfitShareoftheTop100FirmsandCapitalistIncome,1940–2014 17
Figure8:CapitalistIncomeandAmericanIncomeInequality,1913–2014 19
Figure9:StockPriceInflationandAmericanIncomeInequality,1960–2013 21
Figure10:OrganizedAmericanLaborStrengthandtheNationalWageBill,1900–2013 29
Figure11:AmericanLaborDisobedienceandLaborRemuneration,1870–2013 31
Figure12:LaborDisobedienceandClassIncomeRedistribution,1880–2013 32
Figure13:AmalgamationandMarketPower,1940–2013 35
Figure14:MarketPowerandCapital-LaborRedistribution,1940–2013 36
Figure15:AmericanLaborRemunerationandInflation,1850–2013 37
Figure16:TheEarningsofLargeFirmsandInflation,1940–2013 39
Figure17:AmericanInflationandLabor-CapitalRedistribution,1930–2013 41
Figure18:“ClassStruggle”andIncomeEquality,1900–2013 42
Figure19:The“NaturalRightofInvestment”andIncomeInequality,1937–49 45

6
PartI:CorporateConcentration,SecularStagnation,andtheGrowingIncomeGap
Themoderncorporationhaswroughtsuchachangeinthefreemarketsystemthatnew
conceptsmustbeforgedandanewpictureofeconomicrelationshipscreated.
—GardinerC.Means(1983)
Commentaryoncontemporaryeconomicaffairs,notablythedeepstagnationandsoaringinequalitythat
plagues many advanced industrial societies, leaves the impression that there are important causal
elementsthatremainoutoffocus.High-resolutionexplanationsofAmericanincomeinequalitysuchas
technological change,globalization,andexecutive compensationpracticesarenecessaryandvaluable,
butwhatseemstobemissingfromthedebatearethelow-resolution,butpanoramicallywider,factors
behindeconomicgrowthandthedistributionofitsbenefits.1Conspicuouslyabsentfromthediscussion
isrecognitionthatgrowthandinequalityareshaped,inpart,byinstitutionalpower.
Conventional economic thinking treats power as something that resides outside the normal
functioningofmarketsandbusiness.Powerisapoliticalcategory,saysthemainstreameconomist,not
aneconomiccategory.2Thecommitmentbymainstreameconomiststoignorepowerwasn’talwaysthe
case,especiallyintheUnitedStates.InTheModernCorporationandPrivateProperty,forexample,Adolf
BerleandGardinerMeans(1968[1932])arguedthattheemergenceofthemoderncorporationushered
inarevolutionsufficientlytransformativethatitsimultaneouslyalteredthesystemofprivateownership
and rendered neoclassical economic doctrine obsolete. For Berle and Means, the concentration of
corporateassets—power,inotherwords—alteredthetheoryandpracticeofAmericancapitalism.
InwhatfollowsIexplorethedeephistoryofAmericanGDPgrowthandincomeinequality,and
find that both are shaped to a remarkable extent by the institutional power of large firms. For the
purposes of this study, “corporate power” will refer to large firms operating in oligopolistic market
structures.Largefirmshavetwobroadgrowthpathwaysopentothem:buildnewindustrialcapacityor
1Thesethreetheseshavetendedtodominatethedebate.Thefirstexplanatoryschemefocusesontechnologicalchangeandtheresultingalterationindemandforcertaintypesoflabor.Theskill-biasedtechnologicalchange(SBTC)thesis,asitisknown,suggests that technological change increases thedemand for high skilledworkers anddepresses thedemand for low skilledworkers,thusexplainingheightenedwageinequality(apositionendorsedbyMooreandRanjan[2005]andcontestedbyCardand DiNardo [2002]). Others identify globalization as the culprit behind American inequality (Krugman 2008). Heightenedinternationaltrade,particularlytheimportofmanufacturedgoodsbydevelopedsocietiesfromdevelopingsocieties,altersthewage distribution in rich societies. As developed countries importmore labor-intensivemanufactured goods from low-wagecountries,downwardpressureisexertedonthewagesoflesseducatedand/orlowerskilledworkers,thuselevatinginequality.A third candidate explanation centers on executive compensation practices. Gabaix and Landier (2008) argue that surgingexecutive compensation closely tracks firm size, and because pay is linked to performance, the growth of the former isexplainedbythegrowthofthelatter.2ThisproblematizationofpowerforthestudyofeconomicswasbroughttomyattentionbyNitzanandBichler(2009).

7
purchase it in themarket for corporate control (NitzanandBichler2009). Fixedasset investment (the
former process) accelerates GDP growth and disperses corporate ownership, while mergers and
acquisitions (the latter process) depresses growth and concentrates corporate ownership. The
concentrationof corporate assets leads to the centralizationof national income in thehandsof large
firms, some of which gets paid to capitalists in the form of dividends and some of which is used to
repurchase stock, thus inflating executive compensation. Dividend payments and executive
compensationaretwokeydeterminantsofAmericanincomeinequality.IntheUnitedStates,then,the
processes that fuel the growth of corporate power put downward pressure on GDP growth and
exacerbateincomeinequality.
Thisargumentispresentedinfivesections.ThesecondsectionexploresthehistoryofAmerican
mergers and acquisitions (M&A) to determine if there is any relationship between corporate
amalgamation and power. The key finding is that the quarter century since 1990 has seen an
unprecedentedsurgeinM&Aactivity,andbecausecorporateconcentrationisdrivenbyamalgamation,
asset concentration has soared to a postwar high. The third section disaggregates American business
investmentandfindsthatheightenedM&Aactivityisassociatedwithfixedassetunderinvestmentand,
consequently, slower GDP growth. The fourth section explores the relationship between corporate
concentrationand income inequalityand findsa strong, albeit indirect, relationshipbetween the two.
Thefifthsectionconcludesbysummarizingthekeyfindings,namelythatarelativeincreaseinthesizeof
largefirmshasdepressedgrowthandintensifiedinequality.Adetailedexplanationofthedatasources
andestimationtechniquesistobefoundintheAppendix.
ABriefHistoryofMergersandAcquisitions
Theacquisitionofcorporateorganizations throughM&A isa formofmarketexchange,but it isunlike
othermarketsinafewcrucialrespects.First,wenormallythinkofacommodityassomethingproduced
for sale on a market (Polanyi 2001 [1944]), but corporate organizations are not produced in the
conventionalsenseoftheterm,norarethereestablishedmarketplaces forthemtobeexchanged—at
leastnot in theordinarysenseof the term“marketplace.”Second,commoditiesare typicallyacquired
foroneoftwopurposes:eitherasinputsinaproductionprocessorfordirectconsumption.Acorporate
organizationdoesnot fiteitherpurpose.Third,and finally, theacquisitionofa corporateorganization
hasanunusualproperty insofaras ithasthepotentialtoeliminatemarketsasabasisforexchange. In
otherwords,corporateamalgamationisaformofmarket-destroyingmarketexchange.Theseaspectsof
corporate amalgamation create puzzling questions. Why do business owners engage in this type of

8
market exchange?Andwhat are someof the long-termconsequencesof corporate amalgamation for
theAmericanpoliticaleconomy?
ThenarrativearoundthedevelopmentofM&Afromthe late19th to theearly21stcentury is
one of a series of “waves,” each leading to different organizational forms and market structures
(McCarthy2013;JoandHenry2015).ThefirstUSmergerwavebeganafterthedepressionof1883and
lasteduntil1904.Themajor formthatM&Atookwas“horizontal,”meaningthat firmscombinedwith
competitorsintheirownindustriestoformmonopolisticmarketstructures.USSteel,forexample,was
formedwhenJ.P.MorganconjoinedCarnegieSteelwithhisFederalSteel.Bytheendofthefirstmerger
wave,USSteelcontrollednearlyone-halfoftheUSsteelindustry,havingcombined785separatesteel-
makingunits.Morganwantedtodislodge“aggressivecompetitormanagers”andreplacethemwithan
“orderlymarket” (Gaughan 2007). In practice, this meant restraining price competition, which would
produceamoreproprietor-friendlydistributionofincome.
ThesecondUSmergerwavelastedfrom1916to1929andwaschristenedthe“oligopolywave”
by Nobel laureate George Stigler (1950) because vertical mergers—combinations in the same sector
amongst firms that stand in a buyer-seller relationship—predominated. It is thought that the US
Congress’spassageoftheClaytonAntitrustActof1914,whichmade itmoredifficulttomergeforthe
purpose of creating amonopoly, was one reasonwhy firms chose to expand outside their industries
(Gaughan 2007). The third US merger wave lasted from 1965 to 1969 and was baptized the
“conglomerate wave” because large firms diversified their holdings by acquiring firms in unrelated
sectors. A fourth merger wave lasted from 1984 to 1989, the twin attributes of which were the
prevalenceofmegamergersandtheroleofhostile takeovers. Intheconglomeratewaveof the1960s,
largefirmsswallowedsmall-andmedium-sizefirmsinunrelatedsectors.Themergerwaveofthe1980s
saw large firms absorb other large firms, such that the number of $100 million dollar US mergers
increased23timesfrom1974to1986.
Afifthmergerwavebeganinthe1990sthatwasinternational inscope.Whereasmostmerger
activityinpriorwaveshadbeenconcentratedintheUS,thefifthwavesawintensivetakeoveractivityin
Britain, Germany, France, Asia, and Central and South America. In addition to being international in
scope, themergerwaveof the1990swas fueled, inpart,byaglobalprivatizationpushdrivenby the
widespreadadoptionofneoliberaldoctrine following theColdWar.Another featureof the fifthwave
wastheemergenceofadevelopingcountry–domiciledacquirer,whosesizewasusuallyaconsequence
oftheprivatizationofstateassets(Gaughan2007).

9
At a minimum, explanations for M&A activity usually try to account for two things: merger
motives (causes)andpostmergeroutcomes(effects).Growthandefficiency (the latteroftendescribed
asoperatingor financial “synergies”)are twoof themostcommonmotivationscited forM&Aactivity
(Gaughan2007).But fromaheterodoxperspective, larger relative firmsizeand theattendantmarket
power that greater size bestows is the real amalgamation prize. One way of measuring M&A is to
contrastitwithinvestmentinfixedassets.A“buy-to-build”indicatorcapturesthebasiccalculusopento
proprietors:purchaseexisting industrialcapacityonthemarket forcorporatecontrolorpaytohave it
builtanew.Fixedasset investment leads to thecreationofnew industrial structuresand ishistorically
associatedwith net new employment andmore rapid GDP growth.Mergers and acquisitions, on the
other hand, merely shuffles ownership claims between proprietors while leaving the industrial base
unchanged.Corporateamalgamationmayleadtoanetreductioninemployment,asthenewlyminted
organizationshedssomeduplicatedfunctionsandleavesproductivecapacityidle.
The evolution of American M&A activity is captured in the buy-to-build indicator plotted in
Figure 1. Three things command our attention. First, the series clearly demonstrates the wave-like
patternofM&Aoverthepastcentury.Thepeaksofmajormergerwavescorrespondwithbusinesscycle
peaksandareobservableonthechart.ThesecondfeaturetonoteistheincreasingimportanceofM&A
relative to investment in fixedassets,especially in recentdecades.Between1895and1990, forevery
dollarspentonbuildingnewindustrialcapacity,Americanbusinessesspentanaverageofjust18cents
onM&A.Inthequartercenturysincetheso-called“freetrade”erabegan,averageM&Aincreasedtoan
averageof68percentoffixedassetinvestment—anearfourfoldincreaseoverthepreviouscentury.The
thirdthingtonotice isthesustainednatureofM&Aactivity inrecentdecades.Ofthesixpeakmerger
wave values since 1895, three have occurred in the past 15 years. Even though 1999 represents the
historicalhigh,theperiodsince1990hasbeenunprecedentedinAmericancorporatehistory.3
Some questions follow: How have the merger waves of recent decades altered American
businessinvestment?WhatbearingdoesamalgamationhaveonthestructureoftheAmericancorporate
sector? And, if amalgamation is a form of corporate restructuring, are there consequences for GDP
growthandthedistributionofincome?
3SimilarresultsaretobefoundforCanadainBrennan(2014;2015).

10
InvestmentandGrowth
Since thepublicationofAdamSmith’sWealthofNations in1776,mainstreameconomistshave tolda
storyofdevelopmentthatputsthecapitalistatthecenterofeconomicprogress.Byconvertingsavings
intoinvestmentandbysubmittingtothedisciplineofintensepriceandproductcompetition,capitalists
helpsettheeconomicwheelsinmotionandensuretheefficientuseofsocioeconomicresources.Partof
thisstoryisinvestmentinindustrialcapacity,whichisakeydeterminantofGDPgrowth.Theconceptual
and statistical relationship between fixed asset investment and GDP iswell established (De Long and
Summers 1992; Dougherty and Jorgenson 1997; Jorgenson 2007). Figure 2maps that relationship by
plottingtherateofgrowthofbusinessinvestmentinnonresidentialstructuresandequipmentandGDP,
bothadjustedforinflationandsmoothedas10-yearmovingaveragestocapturethecyclicallyadjusted
(“secular”)trend.Therelationshipbetweenthesetwovariablesoverthepastcenturyisverystrong—a
correlationof0.70between1925and2013, rising to0.80over thepasthalf century—which suggests
thatbusinessinvestmentinfixedassetsisinfactakeydeterminantofgrowth.4
4AllcorrelationcoefficientsarePearsonianandaresignificantat1percent(two-tailed).

11
In the early decades of the postwar era, the US (and other Organisation for Economic Co-
operation and Development [OECD] countries) experienced heavy fixed asset investment and rapid
growth. In the decades since 1980 there has been a shift to under-investment and comparatively
sluggishgrowth.InsetwithinFigure2arethedecadeaverageratesofGDPgrowthadjustedforinflation
andpopulation.Usingthismetric,AmericanGDPgrowthaveraged2.8percentbetween1940and1980
andwasmorethanhalvedbetween1980and2013,fallingtojust1.3percent.Thus,thelowerlevelsof
growthinrecentdecadesappeartobeledbyunder-investmentinfixedassets.
Figure3crystallizestheevolutionofAmericaninvestmentinindustrialcapacityoverthepostwar
periodbyplotting theproportionofbusiness spendingonnonresidential structuresandequipment in
GDP.The chart clearly shows that in theearlypostwardecades (1946–80) fixedasset investmentwas
comparatively high and trended upward. In the decades since 1980, the American business sector
investedcomparativelylessinfixedassetsandthetrendwassharplydownward.Fixedassetinvestment
peaked at 18 percent of GDP in 1979 and by 2010 it reached a postwar low of just 10 percent. The
difference between the average inflation-adjusted rate of growth of spending on fixed assets is even

12
starker: between1945 and 1980 the growth rate averaged 7.3 percent, and it fell to just 1.7 percent
between1980and2013.
Given that investment fuels growth, how has investment by the largest American-listed firms
evolved inrecentdecades?Figure4decomposes investmentamongthetop100American-listedfirms
overthepostwarerabyplottinginvestment infixedassetsandstockrepurchase(bothasapercentof
revenue), a buy-to-build indicator for the top 100 firms, and a metric capturing “notional” total
investment,thelastmeasuredasfixedasset investmentplusacquisitionsandstockrepurchaseallasa
percentof revenue. Thenotional investment series indicates thedifferentways that firms candeploy
availableassetsforthesakeofgrowth.Whatdothefactstellus?
Inthetwodecadesbetween1950and1970,fixedassetinvestmenttrendedupward,risingfrom
6 percent to 13 percent of revenue, only to trend downward in the decades after 1970, falling to a
postwar low of 5 percent over the past decade. This suggests that large firms may be leading the
stagnation tendencies of recent times through fixed asset under-investment. Stock repurchase was
nearlynonexistent in the1970s,buthasgrown in significance ineachsubsequentdecade, rising from

13
lessthan1percentofrevenueinthe1970sto7percent in2007.5Tobeclear,thismeansthatforthe
first time in American corporate history, large firms spentmoremoney repurchasing their own stock
thanontheexpansionof their industrialbase.Large firmshavealsobeenonabuyingspree in recent
decades,plowingenormousresourcesintoacquisitions.
The notional total investment series clearly shows that if large firms had spent all their
acquisitionandstockrepurchaseresourcesonfixedassetinvestment,thedownwardtrendinfixedasset
investmentwouldhaveactuallybeenaninvestmentboom.Actualfixedassetinvestmentpeakedin1970
at13percentofrevenue,butnotionaltotalinvestmentpeakedin2007at16percentofrevenue,which
wasconsiderablyhigherthanthebusinesssectorasawhole(whichwas14percentofGDPinthatyear).
Given that investment in machinery and equipment is a key driver of GDP growth, the enormous
resourceredirectionwithin large firmsfromfixedasset investmenttowardM&Aandstockrepurchase
5AsJoandHenry(2015)explain,itwasonlywiththeadoptionofRule10b-18in1982thattheSECformallypermittedsharebuybacks(upto25percentofthestock’saveragedailytradingvolume).

14
put tremendous downward pressure on American growth.Why would large firms redirect resources
awayfromindustrialexpansioninfavorofacquisitions?
CorporateAmalgamation,CorporateConcentration,andtheDistributionofIncome
Bycapturing theoverallpositionof large firms in thecorporateuniverse,manyheterodoxeconomists
have utilized aggregate concentration as a broad proxy for corporate power. In the language of
neoclassical economics, “perfect competition” is a condition in which a large number of buyers and
sellers, perfect information, freeentry andexit, andhomogenousproductsprevail.Under thismarket
structure, sellers do not have the ability to influence price. But as firms combine and the market
structuremovesfromthecompetitiveendofthespectrumtotheoligopolisticend,largefirmsgofrom
being price takers to price shapers and price makers. John Blair (1972), for example, argues that as
aggregateconcentration increases,marketbehaviourchanges.“Communitiesof interest” formaround
powerful familiesandfinancialgroupsandthisenablesthemtocoordinatetheiractivitiestoagreater
extent thanwould otherwise be possible. Independent (read: competitive) behavior is lessened, Blair
continues, as dominantproprietors andexecutivesopenlyor tacitly agree that firms should avoid the
disruptionsassociatedwith“pricecompetition”andaim,instead,atahealthy“targetprofitrate.”
MancurOlson (1982) explains some of themechanics (and impediments) that individuals and
institutionsfaceinorganizingforcollectiveactionthroughthebuildingofcoalitions:
Thelargerthenumberofindividualsorfirmsthatwouldbenefitfromacollectivegood,
thesmaller theshareof thegains fromaction in thegroup interest thatwillaccrue to
the individual or firm that undertakes the action.… The incentive for group action
diminishes as group size increases, so that large groups are less able to act in their
commoninterestthansmallones.(Olson1982,p.31)
Thenumericscaleofgroupslike(nonunionized)workers,taxpayers,andconsumersmakesitdifficultto
organizeforcollectiveaction.Theincentives,Olsonexplains,arenotstrongenoughtopullsuchgroups
together.One reason for this is that the services provided by such coalitions are often distributed to
everymemberof the coalitionequally, andamongbroad coalitions, thismakes the “perunit”benefit
small.What’s more, the cost of organizing such coalitions may be large, which acts as an additional
impedimenttocollectiveaction.

15
Theoppositelogicisatplaywithsmallgroupslikelargefirmsoperatinginoligopolisticmarkets.
In the contextof the coordinating activitiesbetween large firms—activities thatwould include setting
marketprices,containingtherateofindustrialexpansion,orlobbying—becausetheyarefewinnumber,
theorganizationalburdenismuchsmaller.What’smore,suchfirmsstandtodisproportionatelybenefit
fromcollectiveaction.Smallergroups,Olsonasserts,possessdisproportionateorganizationalpoweror
“cartelisticpowerpercapita.” It is imperative tonote that theactivitiesof suchcoalitionswill tend to
benefitcoalitionmembers,eventhoughsaidactivitiesmayreducetotalsocietalefficiencyorhamperthe
growthofaggregate income.Thesenegativeeffectsarising fromcoalitionalbehaviorwillbe feltmore
stronglybynon-coalitionmembers(i.e.,bysocietyatlarge).
Figure5contrasts the (national)buy-to-build indicatorwithaggregateassetconcentration, the
lattermeasuredas the totalassetsof the top100American-listed firmsasapercentof thecorporate
assets. The two series are tightly and positively intertwined over six decades, which signals that
amalgamationwavestendtoconcentrateassets.Intandemwiththeconglomeratemergerwave,asset
concentration increased by one-half between 1950 and 1970, rising from 8 percent to 12 percent of

16
corporateassets.Withthesubsidingofmergeractivitybetween1970and1990,assetconcentrationfell
by one-quarter. Then, with the onset of the most sustained period of merger activity in American
corporatehistory,assetconcentrationmorethandoubled,risingfrom9percentin1990to21percentin
2006. There are roughly 5.7million registered corporations in theUnited States (according to theUS
CensusBureau), but the100 largest account for roughlyone-fifthof total assets,which is a veryhigh
degreeofconcentration.
If, as ThorsteinVeblen (1908a, 1908b)posited, capital is a claimonearnings—legal title to an
incomestream—it should followthat theconcentrationof corporateassets shouldbeassociatedwith
theredistributionofincome.Figure6contrastsaggregateassetconcentrationwiththeincomeshareof
thetop100American-listedfirms,thelattermeasuredasthepercentofnetprofitinGDP(withoutlying
valuesremoved in1992and2002).Thetwoseriesaretightlycorrelatedoversixdecades.The income
shareofthetop100firmsisstableovertheearlypostwardecades,havingaveraged1.9percentofGDP
between 1950 and 1990. The elevated merger activity of recent decades and the associated
concentration of assets coincided with a doubling of the income share of the largest firms, which
reachedapostwarhighof3.9percentofGDPin2013.

17
Forinstitutionalpowertobeameaningfulcategoryinpoliticaleconomy,itmustincludecontrol
over—redistributionof—income.The facts inFigures5and6aresignificantbecause theysuggest that
thestructureof thecorporatesector,which is fueledbycorporateamalgamation,concentratesassets
andcentralizesincome.Insofarasthedistributionofincomereflectstheorganizationalstructureofthe
political economy, power becomes a meaningful heuristic. Is there a relationship between the
centralizationofnationalincomeinthehandsofthelargestfirmsandincomeinequality?
Yes,buttherelationshipisindirect.Figure7contraststheprofitshareofthetop100American-
listed firmswith the net dividends paid by theAmerican corporate universe (as a percent of national
income).Thecorrelationoversixdecadesis0.76,orhigh.Despitethecyclicality,thelevelofeachseries
remainedrelativelystable in theearlydecadesof thepostwarera.Bothmetricsbegantoclimb in the
1980s and soared in the past two decades. Of the 5.7 million registered American corporations, 98
percenthavelessthan100employeesand90percenthavefewerthan20employees.Thisimpliesthat
theoverwhelmingmajorityofUSfirmsaresmallandmediumsize,andareunlikelytopaydividends.Itis
predominantlylargefirmswithcomplexownershipstructuresthatpaydividends.

18
Basedoncalculations fromtheauthor’sdataarchives, in the late1980s fullyhalfofAmerican
corporate dividendswere paid by the largest 100 firms. Inmore recent years, roughly one-quarter of
total dividends were accounted for by the largest 100 firms. This likely why the dividend share of
national incomemoves in tandemwith theprofit shareof largestAmerican-based firms,because it is
primarily large firms that pay dividends. The relationship in Figure 7 suggests that as the corporate
universe concentrates and large firms claim a greater share of national income through enhanced
market power, the potential to distribute that profit to owners of (large) corporations, via dividends,
increases.Logicallyandempirically,then,alargerprofitshareofnationalincome,whichisdrivenbythe
amalgamation-fueledconcentrationofcorporateassets,leadstoanenlargedcapitalistincomeshare.
Capitalist income is often defined as the sum of interest and profit payments. Inmainstream
economic thinking, the abstinence endured by the owners of corporate debt is rewarded with fixed
interestpaymentswhiletherisktakenbytheownersofcorporateequityisrewardedwithprofit.Froma
personal income standpoint, however, capitalist income is dividends. Defined in classical terms, a
capitalistisanemployerofwagedlabor.Theprofitearnedbyafirmhasfourpossibleuses:thefinancing
of expansion through some form of investment, retained earnings (often in the form of cash), stock
repurchase, anddividendpayments. In the final analysis, even thoughprofit and interest are the sum
total of “capitalist income,” from a personal income perspective capitalist income is solely dividends.
Giventhis,istherearelationshipbetweencapitalistincomeandAmericanincomeinequality?
Figure8plotsthelong-termrelationshipbetweentheincomeshareoftherichest1percentof
Americans—aproxyforoverallincomeinequality—andthedividendshareofnationalincome.Thetwo
series are nearmirror images on each other, registering a correlation of 0.89 over the past century.
Dividendpaymentsplummetedduring theGreatDepressionandagainduring the SecondWorldWar,
havingreachedahistoriclowof2.3percentofnationalincomein1945.Dividendshoveredaroundthat
leveltillthelate1980s,afterwhichtheybegantosoar,pullingtherichestAmericans’incomeshareup
withthem.Notably,thedividendshareofnationalincomereachedahistorichighof6.6percentin1930
andin2007,whichisroughlythesamemomentsintimethatAmericanincomeinequalitypeaked.
The implication is that American income inequality is driven, in part, by dividend payments.
However, because dividend payments are at least partially restricted by corporate profitability, the
relationship between corporate power and income inequality remains unclear. Elsewhere (Brennan
2014)IhavemappedtheAmericancorporateprofitshareofnationalincomefromthe1920sonward.I
foundthat itcollapsedduring theGreatDepression (1929–32)beforesoaringto13.6percent in1942.

19
Forthenexthalfcenturythecorporateprofitsharetrendeddownward,havingreachedapostwarlowof
8.3 percent in 1990. Over the past quarter century the profit share trended sharply upward, having
reachedanall-timehighof14.5percentin2013.Whatdoesallofthismean?
Inbroadstrokes,theprofitshareofnationalincomesetstheboundarieswithinwhichcapitalist
income(understoodasdividendpayments) isdetermined,anditappearsthatcapitalist incomeshapes
the overall level of American income inequality. The combined effect of the Great Depression and
SecondWorldWar was a halving of American income inequality (as registered in the top percentile
incomeshare).TheGreatDepressionwitnessedthedualcollapseofcorporateprofitabilityandthetop
incomeshare.However,profitsrecoveredfasterthanwages inthe1930s,whichmeantthattheprofit
shareofnationalincomeandthetopincomesharereboundedinthedecadeafter1933.Thetopincome
share collapsed again during the Second World War, but not because of a collapse in profitability;
instead,thedividendshareofprofitwasreducedbythree-quarters—thusreducingcapitalistincome—in
favoroftheheavyfixedassetinvestmentassociatedwithwartimemobilization.

20
Intheearlypostwardecades,incomeinequalitycontinuedtodecline.Thiswasnotbecauseofa
shift in dividend payments, however, which held steady at one-fifth of corporate profit. Instead, the
profitshareofnationalincomeitselfwasnearlyhalvedinthefourdecadesbetween1940and1980.So
incomeinequalityintheearlypostwardecadeswasastoryofdecliningrelativecorporateprofitability,at
least in part. Income inequality began to increase in the early 1980s, even though theprofit shareof
nationalincomedidnotsignificantlyrise.Theexplanationseemstobeadoublingofthedividendshare
ofprofit,whichrosefromone-fifthinthelate1970stotwo-fifthsby1990.After1990,theprofitshareof
nationalincomeandthedividendshareofprofitbothrosesharply.AtthetimeoftheGreatRecessionin
2008–09, the profit share of national income had reached a postwar high of 13.7 percent and the
dividendshareofprofithadreachedapostwarhighofthree-fifths.
So it is the combined effect of surging corporate profit and a higher dividend share of profit
distributedtocapitaliststhathasbeendrivingAmericanincomeinequalityinrecentdecades.Thehigher
dividend share of corporate profit implies that there are fewer resources available for fixed asset
investment.SotheprocessesthatrestrictinvestmentandGDPgrowtharealsotheprocessesthatinflate
thetopincomeshareandexacerbatepersonalincomeinequality.
Eventhoughdividendpaymentsappeartotheprimecandidate inexplainingAmerican income
inequality, it has been long understood that executive compensation practices also play a role in
Americanincomeinequality.Whilemanyexecutiveshavecompensationpackagesthatincludesharesin
thefirmstheymanage,weoftendistinguishthecapitalistclass(i.e.,theownersofcorporateequitywho
employworkers)fromthemanagerialclass(i.e.,thosewhoareemployedbythefirmtorunday-to-day
operations).HowdoesexecutivecompensationfitintotheAmericanincomeinequalitypicture?
Central to Berle and Means’s 1932 “separation thesis” was the positing of a three-pronged
process:anincreasingconcentrationofcorporateassets,coupledwithanincreasingdispersionofstock
ownership, resulting in a separationofownership fromcontrol. Putting aside the validityof the claim
thatcontrolhadactuallydelinkedfromownership,theideaexertedconsiderableinfluenceoneconomic
theorists and policymakers. If the large corporation was no longer under proprietary control (having
fallen under managerial control), the incentive structure would no longer compel those exercising
corporateauthoritytosteerthefirminaprofit-maximizingdirection,thusthreateningtheequilibrium-
seeking nature of laissez-faire capitalism (or so mainstream economists reasoned). Managers might
instead steer the firm in a direction that enriched themselves while sacrificing the interests of
stockholders,whoweretoonumerousanddispersedtochallengemanagerialauthority.

21
Theriseofstockoptionsinthe1980sandtheirexplosioninthe1990smaybethoughtofasone
institutional response to thealleged separationofownership fromcontrol (Frydmanand Jenter2010;
Murphy 2012). By compensating managers with stock, their interests and attendant behavior would
presumably realign with those of stockholders, thus transcending the separation thesis and ensuring
firms behave in a profit-maximizing manner (again, according to mainstream assumptions). Murphy
(2012)tellsusthatinthe10yearsafter1992,medianCEOcompensationforfirmslistedontheS&P500
morethantripled,fueledinlargepartbystockcompensation.Eventhoughthisisjustoneaspectofthe
so-called “shareholder revolution,” it has clearly led to important changes in the governance of large
firms.
Whatistherelationshipbetweenstockcompensation,whichhasbeendrivingtrendsinCEOpay
inrecentdecades,andpersonalincomeinequality?Figure9plotsthevalueofstockrepurchase(relative
to revenue) among the top 100 American-listed firms with the income share of the top percentile
incomegroup.Thetwoseriesaretightlysynchronizedandhaveacorrelationcoefficientof0.93between
1971and2013.Thissuggeststhat,inconjunctionwithheighteneddividendpayments,theredirectionof
corporate income away from fixed asset investment toward stock repurchase has not only slowed

22
growthbutalsoexacerbatedinequality.ThereisclearlymoretoAmericanincomeinequalitythanstock
options,but insofaras top incomeearnersdrive inequality trends,and insofarascorporateexecutives
make up a substantial proportion of the top income group, the evolution of executive compensation
playsakeyroleindeterminingtheoveralllevelofAmericaninequality.
Summation:CorporateConcentrationIsaMissingElementintheInequalityPuzzle
Recent decades have seen themost sustainedM&A activity in American corporate history. For every
dollar spent on expanding America’s industrial base, 68 cents was spent redistributing corporate
ownershipclaimsbetweenproprietors.Asaparallelphenomenon,theaveragerateofGDPgrowthinthe
threeplusdecadesafter1980washalvedincomparisonwiththefourpriordecades.Andbecausefixed
asset investment is an expansionary activity that is associated with job creation, the restructuring of
AmericaninvestmentinfavorofM&AhaslikelybeenasignificantfactorinthedeceleratingrateofGDP
growth.
Whenwedisaggregatethecorporatesector,focusingonthelargest100firms,wefindthatthe
level of fixed asset investment increased in each successive decade between 1950 and 1980 and
decreasedineachdecadesince1980.Asaproportionofrevenue,fixedasset investmentintheperiod
since2000was less thanhalfofwhat itwas in the1960sand1970s.Andwhile the largestAmerican-
listed firms have spent comparatively less on the expansion of industrial capacity, they have plowed
enormousresources intotheacquisitionofotherfirms(viaM&A)andon inflatingtheirsharepricevia
stock repurchase. For the first time in American corporate history, it appears that large firms are
spending more resources purchasing their own stock than on the expansion of their industrial base.
Significantly, when we combine fixed asset investment with acquisitions and stock repurchase (thus
arrivingat “notional’ total investment),wediscover that insteadof fixedassetunderinvestment there
hasbeenaninvestmentboom,albeitonecloakedinM&Aandsharebuybacks.
ThemotivationtodivertresourcesawayfromfixedassetinvestmentinfavorofM&Aappearsto
be the concentrationof corporateassetsand resulting increase inmarketpower. Elsewhere (Brennan
2012)Ihavedocumentedastrongandpersistentrelationshipbetweencorporateconcentrationandthe
earningsmargins,profit,andcashflowoflargeCanadian-basedfirms.Bymerging,largefirmsnotonlyto
absorbtheirrival’s income,theyreducecompetitivepressure,whichelevatesearningsmargins.Sothe
causal pathway runs from amalgamation through concentration toward enhancedmarket power and
profitability.

23
This set of relationships is present in the United States. Over the long haul, mergers and
acquisitions centralize corporate ownership and concentrate corporate assets. Increased corporate
concentration is associated with an enlarged income share for large firms. These firms have plowed
historicallyunprecedentedresourcesintostockrepurchase.Andbecausecorporateexecutivesareoften
compensatedwithstock,thishasbeenonefactor,viasharepriceinflation,ofheightedAmericanincome
inequality.AsecondfactorbehindAmericanincomeinequalityistheincreasingproportionofcorporate
profitdistributed to shareholders in the formofdividends.Thisappears tobe the keydeterminantof
Americanincomeinequalityoverthelongterm.
ThefactsdemonstratethatcorporateAmericadoesnotsufferfroma“shortageofinvestment”
in the general sense; rather, resource redirection within large firms, with comparatively less going
toward growth-enhancing industrial expansion and comparatively more going toward asset-
concentrating amalgamation and share price-inflating stock repurchase, helps explain the stagnant
growththatplaguestheUnitedStates.TherehasbeenaninvestmentboomintheUnitedStates,albeit
an invisible one, because it has been hidden in amalgamation and stock option-related activities. The
formerredistributescorporateownershipclaimsbetweenproprietorsandconcentratesassets,whilethe
latterinflatesshareprices.
Ultimately, themerger boom since 1990 has concentrated corporate power and redistributed
national income toward the largest American corporations. From the standpoint of the average
American worker, the casualties arising from this massive resource redirection are shrinking job
opportunitiesandsoaringincomeequality.

24
PartII:LaborUnions,Inflation,andtheMakingofanInclusiveProsperity
The produce of the earth … is divided among three classes of the community.… To
determine the lawswhich regulate this distribution is theprincipal problem in Political
Economy.
—DavidRicardo(1817)
The preservation of past experience in cultural memory can be lost, often with serious social
consequences.Without an adequate understanding of the past, we are bound tomisunderstand the
present.Andmisunderstandingthepresenthampersourabilitytorealizefuturegoals.Butcanweforget
somethingwedidnotunderstandinthefirstplace?Americanlaborunionshavelongbeenattackedby
factions of the business-government alliance. The success that this alliance has had in undermining
unions is fueled, inpart,bycollectiveculturalamnesia. It iseasiertobeapathetic,evencynical,about
assaultsonasocialinstitutionifonedoesnotunderstandwhythatinstitutionemergedorwhatrolethat
institution plays in enhancing the quality of human life. Many Americans do not have the luxury of
forgetting about the socially beneficial aspects of unions for the simple reason that they never
understoodthatroletobeginwith.
Astheepigraph indicates,DavidRicardo—thegreatclassicalpoliticaleconomist—believedthat
theprimarytaskofeconomicscienceistolaybaretheunderlyingpatternsandregularitiesthatgovern
thedistributionofincomeandwealth.Giventhecentralityofincomeinconditioninghumanpossibilities
on both an individual and a social scale, it’s no wonder he thought it imperative to come to a
satisfactoryaccountofdistribution. It is typically left toeconomics to sortouthow thedistributionof
income works. Indeed, orthodox (“neoclassical”) economics would confidently assert that is has firm
knowledge about how incomes are formed and, by implication, how they are distributed. However,
therearegoodreasonsfordoubtingthevalidityofneoclassicaldogmas.
ThestartingpointofthisinvestigationisthefactthatintheKeynesianwelfareregime(roughly
1935–80)GDPgrewatarapidclipandincomeinequalitywasmorethanhalved.Withtheemergenceof
neoliberalglobalization(1980–present),growthsharplydeceleratedandinequalitysoared.Theanalytical
andpolicychallengesassociatedwiththisdouble-sidedphenomenonhavebeenexploredbyresearchers
usingtools fromthestandardeconomictoolbox.Partofthe inadequacyofexistingexplanations is the
absenceof institutionalpoweranddistributiveconflictasexplanatoryvariables.Thefollowingseeksto
fill this gap using tools from early American institutionalism and Post Keynesianism.While there are

25
manymovingparts to thestoryofgrowthand inequality, theamassmentandexerciseof institutional
power in conjunctionwithdistributive conflict between competing incomegroups are two important,
thoughunderexplored,parts.
Specifically, I explore the points of contact between American unions, inflation, and income
inequality.Insteadofprobingtheconventionalcausesofinflation,adistinctlyheterodoxsetofquestions
is explored.Does inflation tend to appear amidst distributive conflict? Is inflation associatedwith the
redistribution of income between different income groups? Does the amassment and exercise of
institutional power have a bearing on changes in the price level? Putting the questions together: can
inflationbeviewedasapowerprocessthatisnourishedonsocialconflictandsystematicallyboundup
withtheredistributionofincomebetweenincomegroups?Thefollowingbuildsontheconflicttheoryof
inflationbydrawing togetherandassessinga complex rangeofempiricaldata to show thatAmerican
inflationcanbeviewedasapowerprocess.
Supplyingasatisfactory,albeittentative,answertotheforegoingquestionsentailsrespondingto
the following conditional statements: if it can be shown that inflation is closely associated with
outbreaks of distributive conflict,measured as strikes and lockouts, such that higher levels of conflict
entail more rapid inflation and lower levels of conflict entail disinflation or deflation; and if the
distributive conflict is associated with the redistribution of income between different categories of
owners, namely the owners of labor power and the owners of corporations, such that accelerating
inflationtendstoappearwiththeredistributionofincomefromcapitaltolabor(andviceversa);and if
distributive conflict is positively associated with the redistribution of personal income, such that
intensified conflict is progressively redistributive and diminished conflict is regressively redistributive;
thenwecanbereasonablyconfidentinthenestedassertionthat(1)inflationmayvalidlybethoughtof
asapowerprocess(2) insofaras its level isshapedbydistributiveconflictbetweencompeting income
groupsand(3)thewinnersofsaidconflicthaveincomeredistributedintheirfavor.
Theremainderofthisanalysisispresentedinsixsections.Thefirstsectionreviewsthe“conflict
inflation”approach,payingparticularattentiontothewayheterodoxscholarsimaginedpriceformation
and inflation in power-laden terms. It also discusses the interplay between institutional structure and
marketpower,arguingthat largefirmsandlaborunionspossessmeasurabledegreesofmarketpower
andthatthecommoditypricestheyshapereflecttherelativepowerofeachgroup.Thesecondsection
explores thepointsof contactbetween the“countervailingpower”of tradeunionsand labor income.
Over the longhaul,average laborcompensationandtheshareofnational incomegoingtoworkers in
the formofwagesandsalariesare shapedbyuniondensity (institutional structure)andstrikeactivity

26
(distributive conflict). The third section explores the commodified power of large firms and finds that
corporateamalgamationnotonlyfuelstheconcentrationofassets,afindingdisclosedinpartI,butalso
increases themarketpowerof large firms.Andelevatedmarketpower among large firms shapes the
distributionofincomebetweenworkersandcorporations.
The fourth section contrasts inflation with the income gains made by labor and capital. The
historical facts suggest that thehourlyearningsof laborandof large firmsarebothcloselyassociated
withinflation.Becausethenominalincomegainsoflaborandcapitalaresynchronizedwithinflation,the
fifthsectionshiftstheanalysistodifferentialterms(seeNitzanandBichler2009)inordertoassessthe
distributiveaspectsofAmerican inflation.Over thepast century, inflationhaspartiallymanifested the
conflict-fueledredistributionofincomefromcapitaltolaborandfromtheuppertothelowerstrataof
the personal income hierarchy. The sixth section summarizes the findings and makes some
recommendationsforhowneoliberalcapitalismcanbereformedinamannerthatbolstersgrowthand
reducesinequality.
Overall,Iarguethatlaborunionsareprogressivelyredistributive—theyredistributeincomefrom
capitaltolaborandfromtheuppertothelowerincomebrackets—atthecostofsignificantinflationary
pressure.TheimplicationisthatAmericaninflationmustbeunderstoodintermsofinstitutionalpower
anddistributiveconflict,bothbecausethesefactorsassistintheproductionofinflationarypressureand
becauseinflationhasbeensystematicallyassociatedwiththeredistributionofincome.
DistributiveConflictandInflation
Outsidemainstreameconomics,aschoolofheterodoxeconomistsemergedthatviewedinflationasthe
productof theexcessiveclaimsmadebydifferent incomegroupsovernational income—theso-called
“conflictinflation”approach(seeRosenbergandWeisskopf1981).Thewagebargainsecuredbyworkers
andthepricingpolicyofbusinesshasthepotential,RobertRowthorn(1977)argued,ofexceedingwhat
is available for each group from national income. The excess of income claims over available income
produces inflation, which Rowthorn asserts will always transfer “real income from workers to
capitalists,” implying that any inflationary redistributionwill always at the expenseofworkers. In this
perspective class conflict over national income fuels inflationary spirals. Richard Burdekin and Paul
Burkett (1996) tellus that the“winners” from inflationwillbe the“claimantsenjoying relativelygreat
economic and political power” (p. 24). Jonathan Nitzan and Shimshon Bichler (2009) make a similar
argumentwhen they tellus that inflation is the“surfaceconsequence”ofa“redistributional struggle”
foughtbetweendifferentgroups.Oneimplicationofthisclaimisthatthosewhoraisetheirpricefaster
27
thanothers simultaneously redistribute income in their favor, thuscreatingdistributive“winners”and
“losers.”
Ratherthanattributingcausalitytotheearningsmarginsoflargefirms,someputtheemphasis
onworkerwagedemands. SidneyWeintraub’s (1978, 1978–79) “wage costmarkup” theoryproclaims
that inflationisaconsequenceofwagesrisingfasterthanproductivity,andbecausetheflowofwages
and salaries are what determine societal purchasing power, there is no effective difference between
“demandpull”and“wagepush”(1978–79).WallacePeterson(1982)wouldhaveusbelievethatinsofar
as wages rise above productivity, power is what explains the gap. For Peterson (1980), “power” is
“control over income,” and is derived fromeither organizations like labor unions and corporations or
throughthepressureputongovernmentalbodiestoshapepoliciestoone’sadvantage.Finally,thework
ofPaulDalziel(1999–2000),MarcLavoie(1992;2014),andotherPostKeynesianscholarspositthatthe
wage bill determines firm claims on the bank system and ultimately influences the supply of money
(technically referred to as the “horizontality” and “endogeneity” of money). The implication is that
inflationisproducedatthelevelofwagebargaining.Dalzielconcludesthatinflationaryepisodescanbe
tracedtoproblemsofsocialprotestandcompetition,particularlythedistributiveconflictoverincome.
The writers surveyed here often speak of “market power” or “organizational power” as an
importantaspectoftheinflationaryprocess.Thisfliesinthefaceoforthodoxscholarship,whichfocuses
solelyontheneutralityofmoneyinadvancingamonetaryviewofinflation.Itisthislackofattentionto
thepowerdynamicsassociatedwithinflationthatformsacriticallimitationintheorthodoxscholarship.
While the conflict approach to inflationadvances the intellectual needle, this lineof thinking requires
concretesubstantiation.Whatisneeded,then,isanexaminationoftheinstitutionalpowerofdifferent
groupsasapointofentry into the interplaybetweendistributive conflictandvariation in the levelof
inflation.
TradeUnionPowerandLaborCompensation
Havingacceptedtheviewthat largefirmsno longeracceptpricesthatareset inperfectlycompetitive
markets, and so could no longer be thought of as being socially optimizing, John Kenneth Galbraith
(1952), the lateHarvardeconomist,wenton toposit that alternative institutional arrangementswere
neededtomakemoderncapitalismmorefunctionalandfair.Becausebusinessescombinewithaviewto
administeringprofit-friendlyprices,wageearnersought tocombine inunionswithaviewtoelevating
laborcompensation.Galbraithutilizedtheterm“countervailingpower”todenoteaninstitutionalsetting
inwhich thepowerof large firms isoffsetby thepowerof laborunionsand thewelfare state. In the

28
generalevolutionofpolicy,politicsandculture,laborunionsactasa“check”onthecommodifiedpower
oflargefirms,andthiscountervailenceisfeltinwaysasdiverseassocialpolicy,politics,andculture,not
justwages.
Thisviewstandsinoppositiontoneoclassicaleconomics,whichviewsthemarketpriceoflabor
powerlikeothercommodities—intheshortrunitisdeterminedbysupplyanddemand,andinthelong
run the “absolute”wage rateand thenationalwagebill reflectproportionalproductive contributions.
Forneoclassicists,organizedlabormaybeabletoelevatelaborcompensationto“artificially”highlevels,
butitdoessoattheexpenseofnonunionizedlaborand/oremployment.Inotherwords,unionscanonly
redistributeincomewithinagivennationalwagebill—theyareunabletoredistributenationalincomeas
such(SamuelsonandNordhaus2010). Iftheneoclassicalviewistrue,thereneednotbearelationship
betweentradeunionpowerandlaborcompensation.
Unionsrepresentworkersatthebargainingtablewithemployersand,becausetheyareableto
negotiateasacollectiveunit,theirbargainingpositionisenhancedrelativetowhatitwouldbeifeach
individual bargained in isolation. An enhanced bargaining position (often) enables unions to increase
their compensation and benefits to a greater extent than would otherwise occur. Furthermore, by
increasingtheremunerationoforganizedworkers,laborunionsservetoraisesocialexpectationsaround
thelevelofcompensationforworkmorebroadly.Thishasspillovereffectsinnonunionizedworkplaces.
What arewe tomakeof themainstreamargument thatunionized labor canonly redistribute income
within a given national wage bill, but not raise it? Oneway of assessing this claim is to contrast the
institutionalpowerof laborunionswith theshareofnational incomegoing toworkers. If the twoare
positivelycorrelatedoverthe longterm,thiswouldsuggestthattradeunionpowerdoes infactshape
thedistributionofincome.
Figure 10 plots union density, measured as the proportion of union membership in total
employment,andanadjustednationalwagebillfrom1900to2013—thelattermeasuredastotalwages
andsalariesdividedbyGDPlessthewagesandsalariessharepaidtothetoppercentileincomegroup.By
adjustingthenationalwagebill inthismannerweapproximatetheclass-baseddistributionof income.
And becausemost people in the top-percentile income group are not in a union, wewill be able to
determine if there is a relationshipbetween the levelof tradeunionpowerand the shareofnational
incomegoingtowhatusedtobecalledthe“workingclass.”Thecorrelationbetweenthetwovariablesis
0.86overthepastcentury,orveryhigh(andstatisticallysignificant).

29
In1900,unionizationwasbelow3percent,thoughittrendedupwarduntil1920.Thecombined
effect of demobilization after the First WorldWar and a deep recession in the early 1920s led to a
decline in union density. It was not until 1933, after four years of the Great Depression, that the
American unionization began to surge. Facilitated by the National Labor Relations Act of 1935 (the
WagnerAct)andotherNewDeal legislation,uniondensitysoaredfrom7percent in1933toahistoric
high of 29 percent in 1954. Antiunion legislation such as the Taft–Hartley Act6 in 1947 and the
reactionary political forces associated with McCarthyism in the early 1950s contributed to declining
unionization in the subsequent period. In the quarter century between 1954 and 1979, unionization
modestlydeclined,fallingfrom29percentto24percent.ThedeclineofAmericantradeunionsspedup
with the Reagan administration’s antiunion efforts as well as other economic and technological
developments,suchasoffshoringandautomation.By2013overallAmericanuniondensitystoodatjust
11percent.
6LaborManagementRelationsActof1947.

30
The adjusted national wage bill followed a similar pattern. The wage bill for the bottom 99
percentwas43percent in1929and rose inagradual fashion toahistorichighof54percent in1970
before falling to 42 percent in 2013—a historic low. It isn’t a coincidence that the national wage bill
declined from the 1970s onward. The main driver of a shared prosperity—unionization—markedly
declinedoverthatperiod.
In order to meaningfully analyze institutional power we must be able to distinguish the
amassment of power from the exercise of power. The facts in Figure 10 speak to the organizational
capacityofunionizedworkers (amassedpower),but theyare silenton theextentofworkplaceaction
thatAmerican laboractuallyundertook (theexerciseofpower).Theabilityofworkers to intentionally
act in concert represents a type of power. In addition to the level of density, the collective ability of
workerstorefusetoworkwithoutasatisfactorycontract—aworkstoppageorstrike—imposesapenalty
on employers who fail to meet demands around compensation, benefits and working conditions.
Arguably,thisisthemaininstitutional“weapon”thatlaborpossesses.Andastrikeisamongtheclearest
manifestations of the distributive conflict between different income groups, namely profit-seeking
proprietorsandwage-earningworkers.
Workers strike for reasons other thanwages, of course, but does the extent of strike activity
helpexplainchangesinAmericanlaborcompensation?Figure11contraststherateofchangeofaverage
nominalhourlyearningswiththeextentofstrikeactivity,bothsmoothedasthree-yearmovingaverages
toeasethevisualassessment.Thelatterisasuperindexcomposedoftheaverageoffoursub-indices:
the number of work stoppages, the number of workers involved, the number of days idle, and the
percent of work time lost.7 In the resulting super index, a value of 0 means strike activity is at its
historicalaverage,withpositiveandnegativevaluessignalingaboveaverageandbelowaveragestrike
activity, respectively. The extent of strike activity is tightly and positively correlated with the rate of
growthofhourlyearningsandthestrengthofthestatisticalrelationshipsteadilyincreasesovertime.
Over the past 130 years there have been three major strike waves. The first wave occurred
during the FirstWorldWar and peaked in 1919. Over the next 15 years the extent of strike activity
declined(intandemwithdeunionization),butasecondstrikewavebeganintheearly1930sthatpeaked
in1947.Strikeactivitytrendeddownwardtill1963whenathirdwavebegan,whichpeakedintheearly
1970s.Americanlabordisobediencedeclinedprecipitouslyinthelate1970sand,asof2013,stoodatan
7AmoredetailedexplanationofthisstrikeindexistobefoundintheAppendix.

31
all-timelow.Thepatternofwagegrowthalsowentthroughthreewavesofsimilarduration.Notethat
majorstrikewavesandepisodesofrapidwagegrowthcoincidewithsocialcrises—twoworldwars,the
GreatDepression,adomesticculturalrevolutionintheUnitedStatesduringthe1960sand1970s,andan
energycrisis–linkedwar in theMiddleEast.Thetimingof theseepisodeswillbecomemoresignificant
onceweexaminetherelationshipbetweenlaborcompensationandinflation.
It is not entirely clear why domestic labor developments are linked with outbreaks of
internationallyorganizedviolenceand/orcrisis.Inthecaseofthefirsttwostrikewaves,thebargaining
positionoflabormayhavebeenstrengthenedintheshiftfrommoderateorheavystagnationto(near)
fullemployment.Theexperienceof the1960sand1970swasdifferent,of course.Unemploymentdid
notdroptohistoriclows;itroseto(whatatthetimewere)postwarhighs.Itfollowsthatif(successful)
workerwagestrugglesleadtohigherlaborcompensation,thiswillbetransmittedtothenationalwage
bill,whichstrengthenstheclaimthattheinterplaybetweeninstitutionalpoweranddistributiveconflict
leadstotheredistributionofincome.

32
Figure 10 documents the relationship between the institutional power of organized American
labor and the national wage bill. Figure 11 shows that changes in average labor compensation are
shapedbydistributiveconflict,namelyworkerrevoltsagainstproprietors.Iftherelationshipspresented
in these two figuresare tobebelieved, thenstrikeactivity shouldhavea redistributiveproperty to it.
Does American strike activity redistribute income between capitalists and workers? The validity of
Galbraith’scountervailingpowerargumentisreaffirmedinFigure12,whichcontrastsstrikeactivitywith
ametric thatcaptures thedistributivestrugglebetween laborandcapitaloverwagesandprofits.The
latterismeasuredasaratioofaveragehourlyearningstotheS&P500priceindex.Whenthisindexrises,
workersredistributeincomefromcapitalists;whenitfalls,capitalistsredistributeincomefromworkers.8
Both series are smoothedas three-yearmoving averages andare tightly correlatedover thepast 130
years,withthestrengthofthestatisticalrelationshipincreasingovertime.
8ThismethodofcapturingthedistributivestrugglebetweenworkersandcapitalistswasfirstbroughttomyattentioninJonathanNitzan’spoliticaleconomygraduatecourseatYorkUniversity.

33
Therehavebeen threemajor strikewavesover thisperiod, twoofwhichunfoldedduring the
1930s–40s and the 1960s–70s. These outbreaks of labor disobediencewere hugely and progressively
redistributiveandappeartohaveplayedacrucialrole inthecreationofan inclusiveprosperity. Inthe
decades since1980, labormilitancyhas fallen toahistoric lowand,perhapsunsurprisingly, the labor-
capital redistribution index has reached a 130-year low. The pacification of the labor force, driven
partiallybyantiunionlaborlaws,hascontributedtowhatmightbethemostregressiveredistributionof
incomeinAmericanhistory.Thesharpdeclineinthelabor-capitalredistributionindexsincethe1980sis
consistentwithotherfindings,namelythatcapitalhastendedtoclaimalargershareofnationalincome
attheexpenseof labor.SonotonlyareAmericanworkersstrikinglessthaneverbefore,butthegains
fromgrowtharealsomoreheavilytiltedinfavorofcapitalthantheyeverhavebeen.
The orthodox economic argument that labor unions cannot enlarge the national wage bill or
increase laborcompensation isnotsupportedbythehistorical facts.Unionswere(andare) integral to
raisingtheaveragestandardoflivingintheUnitedStatesandindetermininghowthegainsfromgrowth
areshared(withinthefirm)betweenthetwomainincomeclasses.Ifuniondensityandstrikeactivityare
power processes that progressively redistribute income, why has American income been regressively
redistributed in recentdecades?Thedeclineofunionsand thedescentof strikeactivity appear tobe
causalvariables,buthowcanwemakesenseoftheamassmentandexerciseofpowerwithrespectto
business?
CorporatePowerandCapitalistIncome
Part I of this analysis presented new estimates of American mergers and acquisitions (M&A) and
aggregate asset concentration. The latter is understood by heterodox economists as a proxy for the
overall power of large firms. The deep historical facts suggest that corporate amalgamation fuels the
concentration of corporate assets. The analysis went on to show that as the corporate sector
concentrateslargefirmsclaimagreatershareofnationalincome.Thisisconsistentwiththeheterodox
viewthatmarketpowercomeswith firmsize. In the languageofclassicalandneoclassicaleconomics,
“perfectcompetition”isaconditioninwhichalargenumberofbuyersandsellers,perfectinformation,
freeentryandexit,andhomogenousproductsprevail.Underthismarketstructure,sellersdonothave
theabilitytoinfluenceprice.Butasfirmscombineandthemarketstructuremovesfromthecompetitive
endofthespectrumtotheoligopolisticandmonopolisticend,largefirmsgofrombeingpricetakersto
priceshapersandpricemakers.

34
GardinerMeans(1935)andMichałKalecki(1971[1938];1971[1943])arguedthatlargefirmsin
concentrated market structures behave differently than small- and medium-size firms operating in
competitivemarkets.Kaleckidevisedhisconceptofthe“degreeofmonopoly”tocapturethisdifference
in price behavior. Large firms have greater pricing discretion than smaller firms and their monopoly
powercanbeapproximated,Kaleckiargued,inthespreadbetweentheircostsandtheirsellingprice.For
thepurposesofthisinvestigation,theearningsmarginsoflargefirmscanbeusedasanapproximation
for market power. By merging, large firms not only absorb their rival’s income but also reduce
competitivepressure,whichelevatesearningsmargins.Sothecausalpathwayrunsfromamalgamation
throughconcentrationtowardmarketpower.
Thoughintuitivelycorrect,thislineoftheoreticalreasoningmustbetestedtoassessitsempirical
validity. If there is a relationship between M&A and corporate concentration, does this imply that
mergeractivityleadstoelevatedmarketpoweramongstlargefirms?Figure13replotsthebuy-to-build
indicator (measured as the percent of M&A in fixed asset investment) alongside the markup of the
largest100American-listedfirms,thelatteraproxyforKalecki’sdegreeofmonopoly(measuredasthe
percentofnetprofit in revenue,withoutlying values removed in1992and2002). The two series are
positivelycorrelatedoversixdecadesandthestrengthofthestatisticalrelationshipincreasesovertime.
Inthedecadeswhenmergeractivity increased,themarketpowerof largefirmstendedto increase. In
the decades when merger activity subsided, market power also declined. So the claim that
amalgamationandconcentrationleadstoelevatedmarketpowerhasconsiderableempiricalsupportin
theUnitedStates.9
Large corporations in “semi-monopolistic” settings not only tend to have greater pricing
discretion, as Means (1935) showed, but they tend to have deeper earnings margins. Kalecki (1971
[1943]) also argued that the degree of monopoly is of “decisive importance for the distribution of
incomebetweenworkersandcapitalists”(p.51).Thepowertoinflateearningsmargins,Kaleckiargued,
shapesthedistributionofincome:
The long-run changes in the relative share of wages … [are] determined by long-run
trendsinthedegreeofmonopoly.…Thedegreeofmonopolyhasageneraltendencyto
increase in the long run and thus to depress the relative share ofwages in income…
[although]thistendencyismuchstrongerinsomeperiodsthaninothers.(Kalecki1971
[1938],p.65)
9TheserelationshipsarealsopresentinCanadaoverthepostwarperiod.SeeBrennan(2012;2014;2015).

35
Forthepurposesofthepresentdiscussion,Kalecki’sbasicassertioncanberestatedasaquestion: is it
truethatthedegreeofmonopolyamonglargefirms(measuredusingthemarkup)hasabearingonthe
relative share of wages, and therefore shapes the distribution of income between workers and
capitalists?
Broadlyspeaking,incomewithinthefirmissharedbetweenworkers(intheformofwagesand
salaries) and capitalists (in the formof profit). At a national level, the totalwagebill andprofit share
capturetheseproportions.Whenwedivideaggregatecorporateprofitbythenationalwagebillforthe
bottom99percentoftheworkforce,excludingtherichest1percentincomegrouptoapproximatethe
class-based distribution of income, we arrive at a metric that approximates the distributive struggle
betweencorporationsandworkersoverprofitandwages.Whenthismetricincreases,corporationsare
redistributing national income fromworkers andwhen it declines workers are redistributing national
income fromcorporations. It is important tonote thatwhereasFigure12was comprisedofaverages,
these are aggregate figures, which means this metric captures how two of the main components of
nationalincome—wagesandprofits—arebeingsharedbetweenlaborandcapital.

36
Figure14plotsthemarkupofthetop100firms(withoutlyingvaluesremovedin1992and2002)
and the aggregate capital-labor redistribution metric. The two series are tightly and positively
intertwined over six decades. Between 1940 and 1980—the embedded liberal era—the capital-labor
redistribution metric trended downward, which signals that workers tended to win the distributive
struggleinthatperiod.The1980sservesasaninflectionpointandthen,intheperiodofafter1990—the
so-called “free trade” era—the redistributionmetric trended upward,which signals that corporations
tendedtowinthedistributivestruggleinthatperiod.Ifthemarkupisaproxyforthemarketpowerof
largefirms,andifthecapital-laborredistributionmetriccapturesthestrugglebetweenproprietorsand
workers,itishighlysignificantthattheformermovesintandemwiththelatterbecauseitsuggeststhat
corporatepowerisonedeterminantofthedistributionofAmericanincome.
Theprecedingtwosectionssubstantiatedtheassertionthattheinterplayofinstitutionalpower
and distributive conflict determines how national income is shared between various income groups.
Tradeunionpower,manifested inuniondensity and strikeactivity,progressively redistributes income

37
while corporate power, manifested in aggregate concentration and the markup, regressively
redistributesincome.Howaretheseprocessesrelatedtoinflation?
LaborIncome,CapitalistIncome,andInflation
Recall that some scholars viewed worker’s wage demands as a source of inflationary pressure while
othersarguedthat themarketpowerofoligopolisticcorporations is thedriving forcebehind inflation.
These claims were often advanced without the requisite evidence. This section will unpack these
hypotheses for the United States. We have already discussed the linkages between the institutional
powerof labor, distributive conflict, andmarket prices, noting that themarket priceof labor and the
nationalwagebillareshapedbytherelativesizeoflabororganizationsandextentofstrikeactivity.Are
there linkagesbetween laborcompensationand inflation?Andwhatrole, ifany,doesthe institutional
powerofbusinessplayingeneratinginflation?
Figure15contrasts inflationandlaborcompensationbyplottingthenominalrateofchangeof
averagehourlyearningsandtheannualrateofconsumerpriceinflationfrom1850through2013(both
series are smoothed as three-yearmoving averages). The statistical associationbetween inflation and

38
worker compensation is visually unmistakable. The correlation coefficient is very high (0.83) and
statistically significant. Note that in the embedded liberal era the annual inflation rate tended to be
relativelyhighand/orrising;intheneoliberaleraithasbeenrelativelylowand/orfalling.Averagelabor
compensationfollowedasimilarpattern.
Takentogether,Figures10–12and15indicatethatuniondensityandtheextentofstrikeactivity
shape labor compensation, and labor compensation is closely associated with inflation. When the
bargaining position of workers improved either as the result of a social crisis like a world war—a
situation in which society moves toward full employment—or when workers are able to successfully
utilizethestrikeweapontoincreasethevalueofwagesettlements,theresultisahigherproportionof
firmrevenueaccruingtoworkersintheformofwages.Thismaycompelproprietors/managerstoinflate
earnings margins to accommodate heightened wage demands. The resultant increase in worker
purchasingpowermaythenbetransmittedthroughtoahighersocietalpricelevel.
Thisfindingdoesnotimplythatworkersarethesoleorevenprimarycauseofinflation.Thefacts
portrayedinpartIofthisanalysisandinFigures4and5indicatethattherelativesizeofthetop100US-
basedfirmsispositivelyrelatedtotheirearningsmargins,whichisunderstoodtomeanthatthereisa
linear relationship between institutional size and market power. Given the evidence on the linkages
between laborpowerand inflationaswell as theearlier conclusionsof theconflict inflation theorists,
this suggests that theremayalsobea relationshipbetween theearningsof large firmsandAmerican
inflation.
Figure14 tests thevalidityof thisclaimbycontrastingAmerican inflation (measuredusing the
consumerprice index)with theaverageearningspershare (EPS)of thetop100American-listed firms.
Whereas Figure 15 contrasted inflationwith hourly earnings—aunit of ownership of labor power—in
utilizingcorporateEPS,Figure16disclosestheinflationarypressuregeneratedbylargefirmsperunitof
ownership.Thetwoseriesarepositivelycorrelatedoversixdecades.Whenweperiodizethedata,the
strength of the correlation increases. This implies that inflation and the earnings of large firms have
become increasingly synchronized over the past six decades. This also suggests that the accelerating
increase in prices between the 1960s and 1980s—the “crisis inflation” or “stagflation”—was at least
partiallydrivenbythemarketpoweroflargefirms.
Tosummarize,theevidencesuggeststhat inflation isat leastpartiallyaproductofthe income
gainsmadebyworkers andby capitalists. Labor income is shapedby strikeactivity anduniondensity
whereas the earnings of the 100 largest firms are shaped by their market power (manifested in
aggregateconcentrationandthemarkup).Therefore,thetwostreamsoftheconflictinflationliterature

39
fit ratherneatlywith theAmericanexperience. This doesnot indicate thatboth typesof inflation are
similarlypresent inallperiodsor that theyhaveanequal impacton theprice level. In theabsenceof
other intervening variables, American inflation reflects generalized forms of labor disobedience,
monopolypricingpower,or,mostlikely,acombinationofboth.Whenwecontrolforthefactthatwages
account for a much higher proportion of GDP than does corporate profits—the national wage bill is
anywherefromfourtoeighttimeslarger—twoconclusionsensue:(1)itisunlikelythatariseintheprice
level equally benefits both capital and labor; and (2) higher levels of inflation are more likely to be
reflectiveofintensifiedlabordisobedience.
WhoWinsfromInflation?
The research resultspresented thus far indicate thatAmerican inflationhasmultiplepointsof contact
withinstitutionalstructureanddistributiveconflict,whichimpliesthatthepowerdifferentialsbetween
differentgroups—notablylaborandcapital—maybesignificantifwearetounderstandthecauses(and
consequences)ofinflation.Thisbringsustoanotherimportantelementofthisargument,namely,that

40
changes in theoverallprice level are shapedby the complex interplayofpowerdifferentialsbetween
incomegroups.Onewayoftestingthisconclusionistoseeif,overthelongterm,thereisaredistributive
dimensiontoAmericaninflation.Thisentailsshiftingthemethodologicalemphasisfromabsoluteincome
gains todifferentialanddistributive incomegains.Thenecessityofdifferentialanalysis foruncovering
thepowerdimensionsofinflationisdescribedbyNitzanandBichler(2009).Theirargumentisvitaltothe
analysisthatfollowsandwequotethematlength:
…the conventional definition [of inflation] focuses wholly and only on averages and
totals. This fact is crucial, since to define inflation in this way is to miss the point
altogether. The crux of inflation is not that prices rise in general, but that they rise
differentially.…Althoughmostpricestendtoriseduringinflation,theyneverriseatthe
same rate. There is always a spread, with some prices rising faster and others more
slowly.Fromthisviewpoint, theengineof inflation isa redistributionalstruggle fought
throughrisingprices.Theoveralllevelofinflationismerelythesurfaceconsequenceof
thatstruggle.Sointheend,MiltonFriedmanisright—butonlyinpart.Inflationisalways
and everywhere a monetary phenomenon; but it is also always and everywhere a
redistributionalphenomenon.(NitzanandBichler2009,p.369)
ForNitzanandBichler,then,itispreciselybecausetheconsequencesofinflationdependontherelative
powerofcapitaland laborthattherelationshipbetweeninflationandpowercannotbeunderstoodin
absolute terms. They support their assertions by mapping postwar American inflation onto the
differential income gains of different income groups to find that inflation has tended to redistribute
incomefromworkerstocapitalistsandfromsmallfirmstolargefirms.
Shiftingouranalysisfromabsolutetodifferentialtermsmayassist indeterminingthepointsof
contact between inflation and distribution. Figure 17 plots inflation against the labor-capital
redistributionmetric, the latter computed as a ratio of average hourly earnings to the S&P 500 price
index.Bothseriesaresmoothedasthree-yearmovingaverages.Thisdifferentialindicatorcrystallizesthe
distributive strugglebetween theownersof laborpowerand theownersof corporateequity:when it
rises,laborisredistributingincomefromcapital,andwhenitfalls,capitalisredistributingincomefrom
labor.BasedontheevidencepresentedinFigures10–12andadjustingforthefactthatwagesrepresent
a considerably larger share of GDP, we would expect the labor-capital redistribution metric to rise
alongsidepositivechangesintheannualinflationrate.Thetwoseriesarepositivelycorrelatedandthe
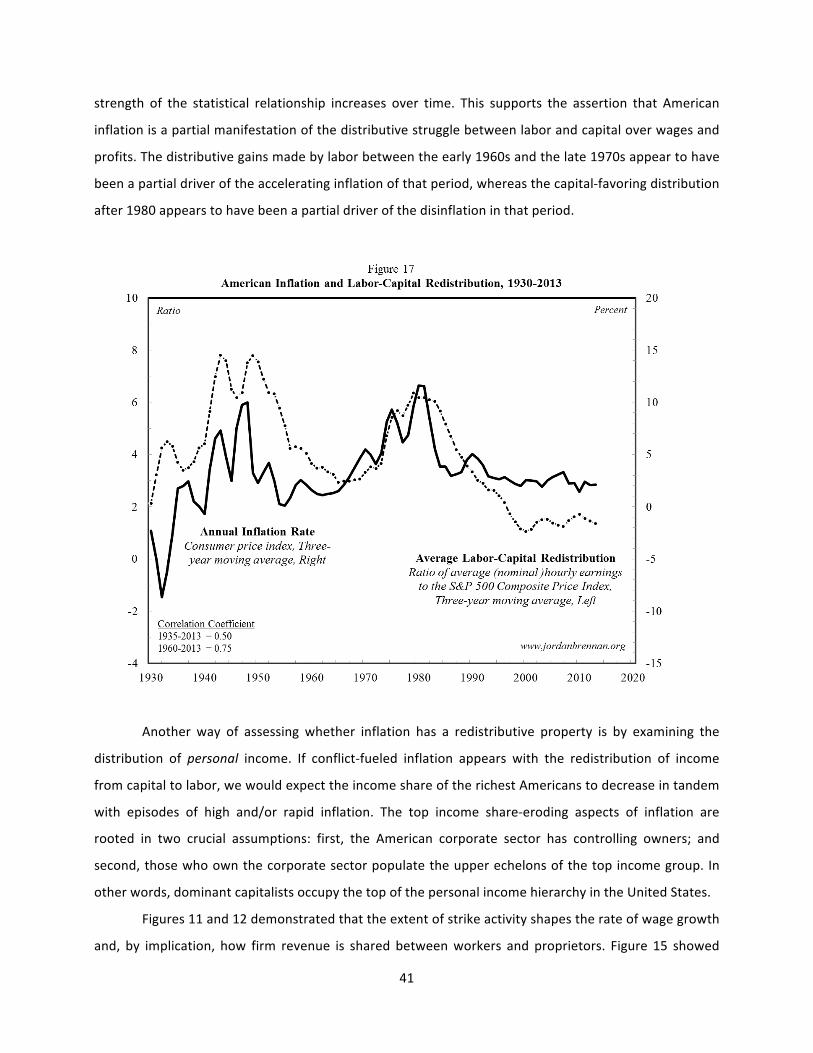
41
strength of the statistical relationship increases over time. This supports the assertion that American
inflationisapartialmanifestationofthedistributivestrugglebetweenlaborandcapitaloverwagesand
profits.Thedistributivegainsmadebylaborbetweentheearly1960sandthelate1970sappeartohave
beenapartialdriveroftheacceleratinginflationofthatperiod,whereasthecapital-favoringdistribution
after1980appearstohavebeenapartialdriverofthedisinflationinthatperiod.
Another way of assessing whether inflation has a redistributive property is by examining the
distribution of personal income. If conflict-fueled inflation appears with the redistribution of income
fromcapitaltolabor,wewouldexpecttheincomeshareoftherichestAmericanstodecreaseintandem
with episodes of high and/or rapid inflation. The top income share-eroding aspects of inflation are
rooted in two crucial assumptions: first, the American corporate sector has controlling owners; and
second,thosewhoownthecorporatesectorpopulatetheupperechelonsofthetopincomegroup. In
otherwords,dominantcapitalistsoccupythetopofthepersonalincomehierarchyintheUnitedStates.
Figures11and12demonstratedthattheextentofstrikeactivityshapestherateofwagegrowth
and, by implication, how firm revenue is shared betweenworkers and proprietors. Figure 15 showed
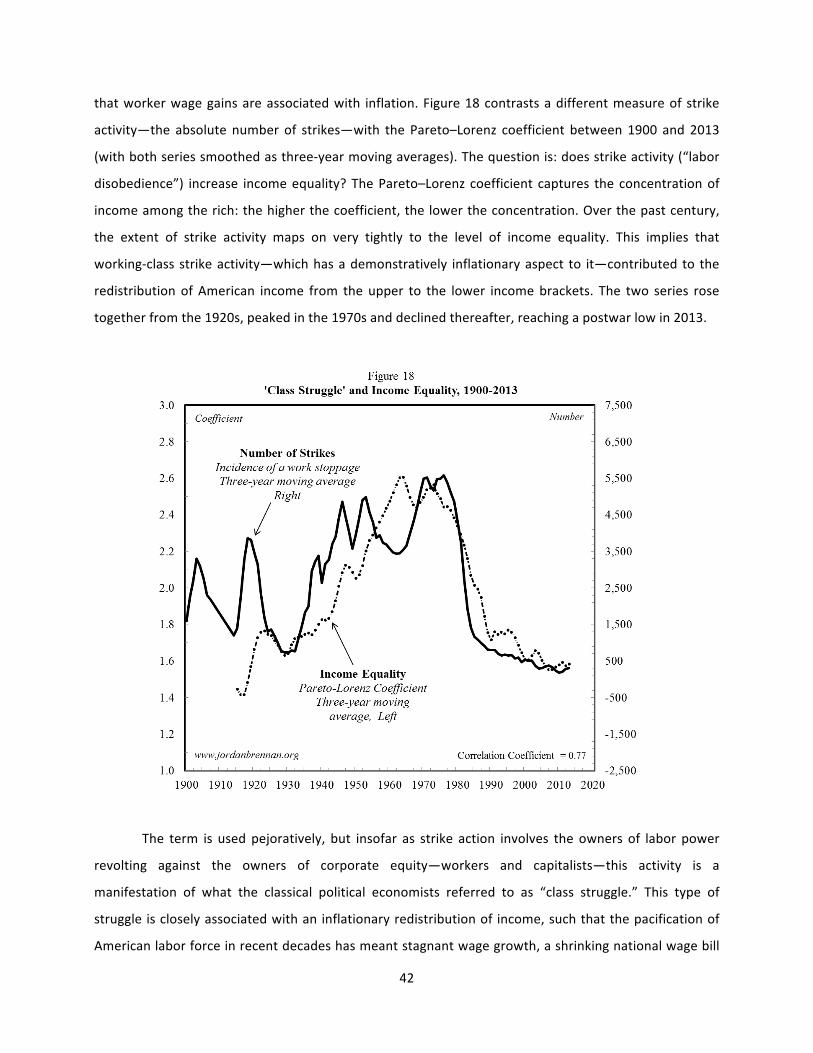
42
thatworkerwagegainsareassociatedwith inflation.Figure18contrastsadifferentmeasureof strike
activity—the absolute number of strikes—with the Pareto–Lorenz coefficient between 1900 and 2013
(withbothseriessmoothedasthree-yearmovingaverages).Thequestionis:doesstrikeactivity(“labor
disobedience”) increase incomeequality?ThePareto–Lorenz coefficient captures the concentrationof
incomeamongtherich:thehigherthecoefficient,thelowertheconcentration.Overthepastcentury,
the extent of strike activity maps on very tightly to the level of income equality. This implies that
working-classstrikeactivity—whichhasademonstratively inflationaryaspect to it—contributed to the
redistributionofAmerican income from theupper to the lower incomebrackets. The two series rose
togetherfromthe1920s,peakedinthe1970sanddeclinedthereafter,reachingapostwarlowin2013.
The term is used pejoratively, but insofar as strike action involves the owners of labor power
revolting against the owners of corporate equity—workers and capitalists—this activity is a
manifestation of what the classical political economists referred to as “class struggle.” This type of
struggle iscloselyassociatedwithaninflationaryredistributionof income,suchthatthepacificationof
Americanlaborforceinrecentdecadeshasmeantstagnantwagegrowth,ashrinkingnationalwagebill
43
andasurgingtopincomeshare.ThefactsinFigure18supportthenotionthatAmericaninflationis(1)
closely associated with distributive conflict and (2) it systematically manifests the redistribution of
income.Anadditional implicationseemstobethatwhatwetodaycallthe“middleclass”wasapartial
outcomeofclassconflict.
There are a number of implications to these findings. The first implication is that heightened
distributive conflict andworkplace revolt contributed to an inflationary scramble between large firms
andlabor.Overthelonghaul,thisconflicttendedtoredistributeincomefromcapitaltolaborandfrom
theupper to the lowerechelonsof thepersonal incomehierarchy.Second, theAmericanmiddleclass
was largely built between 1940 and 1980. This was a period of relatively high and/or accelerating
inflation, driven partially by union-backed worker wage struggles. Beginning in the late 1970s, the
American state and the Federal Reserve embraced an anti-inflationarymonetary policy. If inflation is
beneficial for the working and middle classes, and if inflation is harmful to larger firms and the top
incomegroup,thenoneinterpretationoftheshifttowardanti-inflationarymonetarypolicyisastheuse
ofstatepowertoredistributeincomefromlabortocapitalandfromthelowertotheupperechelonsof
thepersonalincomehierarchy.Farfromneoliberalglobalizationimplyingthe“retreat”ofstatepower,in
thisinstancethemeaningofneoliberalismistheutilizationofstatepowertorestrainthewagedemands
oftheworkingclassandtostrengthenthesocialpositionofbusiness,especiallylargefirms.Underthis
interpretation, what is sometimes referred to as “sound monetary policy” is, in effect, working-and-
middle-class-restraining,business-class-promotingstatepoliciesthatupwardlyredistributeincome.
ConclusionsandtheReformofNeoliberalCapitalism
Let’ssummarizethefindingsofthistwo-partanalysis.Thecentripetalforcesofcorporateamalgamation
lead to the centralization of corporate ownership manifested in asset concentration. Increased
concentrationreducescompetitivepressure,thusthickeningearningsmargins,andenlargestheincome
share of large firms. The diversion of corporate resources away from growth-expanding industrial
projects puts downwardpressureon growth and leaves evenmore corporate income in thehandsof
large firms.With the rise of stock-based forms of compensation, corporate executiveswere given an
institutional incentive to divert corporate income into share price-inflating stock repurchases, which
increases the income of executives and exacerbates inequality. Andwith higher earnings, large firms
distributed comparatively more to stockholders in the form of dividends. It is in this way that the
creationofatop-heavycorporatedistributionsimultaneouslyputsdownwardpressureongrowthwhile
elevatinginequality.
44
Ontheothersideoftheledger,thetradeunionpowermanifestinbothuniondensityandstrike
activity has systematically and progressively redistributed factor and personal income, such that the
weakenedpowerofAmericanunionssincethe1970shascontributedtoheightenedincomeinequality.
We have already seen that insofar as the American corporate sector goes, the institutional-
organizational structure (aggregate concentration) is closely shadowed by themarket power of large
firms (registered in themarkup). A similar, though countervailing, set of relationships are present for
organized labor. Union density, a proxy for the institutional power of organized labor, is positively
correlatedwith incomeequality.Density increasedmodestlyand inanonlinear fashionbetween1880
and 1930. Then, with the advent of New Deal legislation such as theWagner Act, density increased
fourfold,risingfrom7percentin1933toahistorichighof29percentin1954,beforefallingtoapostwar
lowof11percentin2013.Theconcentrationofincomeamongtherichwassignificantlyerodedinthe
decadesthatAmerican laborbuilt theirunions,and inthedecadesthattradeunionpowerdiminished
incomere-concentratedamongtherich.
So what does this mean for the reform of neoliberal capitalism? In comparison with the
Keynesian state-led model of capitalism that predominated between 1935 and 1980, the neoliberal
corporate-ledmodel in theUnitedStates (andelsewhere)has, since1980,beennotable for its slower
growthandinequality.Itappearsthatatop-heavycorporatedistributionamidthedeclineoforganized
laborhaveplayedacausal role in thisdouble-sidedphenomenon.Sowhatcanbedoneto reformthe
American economy in away that unleashes growth and reduces inequality? Three baskets of policies
standout:(1)fullemployment;(2)anamplifiedvoiceforlabor,includinglawsthatnurtureunions;and
(3)capitalcontrols.
Chronic unemployment (and underemployment) has been one of themost socially damaging
featuresofneoliberalcapitalism.Thestatecommitmenttofullemploymentwoulddramaticallyalterthe
labor market in a way that empowers workers, unleashes growth, and reduces income inequality.
ConsiderthefactsinFigure19,whichcapturethedistribution-compressingeffectsoffullemploymentby
contrasting income inequality (registered inthetop0.1percent incomeshare)andtheunemployment
rate,withtheSecondWorldWarshaded ingray.Prior tothewar,bothunemploymentand inequality
were comparatively high, but in the war years both were dramatically reduced. Why would both
unemploymentandinequalityfallinatightlysynchronizedfashionoverthisshortperiod?
RecallVeblen’sclaimaboutthe“naturalrightofinvestment”:namely,thatprivateownershipof
industrial equipment grants proprietors the legal right to enforce unemployment—an act of
institutionalized exclusion that restricts production below full socioeconomic potential and alters the

45
distributionofincomeinaproprietary(businessowner)favoringmanner(seeVeblen2004[1923]).Now
considerthereconfiguredroleoftheAmericanstateduringtheSecondWorldWar,theprimehistorical
exampleofthecommitmenttofullemployment.Until1939employment(industry)wasfirmlyunderthe
control of private proprietors (business). The SecondWorldWar partially changed that insofar as the
federal government oversaw themove toward a centrally planned economy. Business considerations,
althoughnottotallyeliminated,weregreatlydiminishedvis-à-visindustrialconsiderationsandcapitalists
lost(some)controloveremploymentandpricing.
The consequences for the American power elite were devastating, as evidenced by a near
halvingof the income share going to the richest1percent. In termsofprice formation,wage ceilings
wereimposed,producerandconsumerpriceswerefrozen,exchangerateswerecontrolled,andtherate
of profit was capped. As a result, unemployment shrank from 12 percent to less than 2 percent and
income inequality fell by more than a third. Gross domestic product (adjusted for inflation and
population)grewby10percentannually,onaverage, rising from$94billion in1939to$228billion in

46
1945.Withoutexception, the1940s represents themost rapidgrowthperiod inAmericanhistoryand
theclosestitevercametofullemployment.
Being nomere reform, the capitalist powermanifest in unemploymentwas severely curtailed
through the use of state power and the consequences included rapid GDP growth and a radically
redistribution of income. In the contemporarymilieu, the pathways to full employment could include
policy tools as conventional as infrastructure investment and growth-friendlymonetary policy (Stiglitz
2015) or as unconventional as the creation of a national development bank and public ownership in
strategicindustrieslikeenergyoradvancedmanufacturing.
If the state commitment to full employment would help solve the problem of stagnation, a
stronger voice for labor would help ensure the gains from growth are widely distributed. But labor
unions need a nurturing policy environment to grow. TheWagner Act enshrined the right to bargain
collectively and compelled private sector employers to recognize the representatives of unionized
workers. The National War Labor Board’s “maintenance of membership” rule (1942) automatically
included new hires in the union so long as the union had been recognized by the employer. It was
partially because of these (and other) policies that unionizationmore than tripled between 1935 and
1945,risingfrom8percentto25percent.Laborunionsintandemwiththeexerciseofthestrikeweapon
have a demonstratively and progressively redistributive property. Antiunion legislation like the Taft–
HartleyAct in1947andmanyother contemporarymanifestationsof that legislation, has aided in the
demobilizationoforganizedlaborinthepostwarera,withregressivelyredistributiveconsequences.
Anotherpathwaytowardtherebalancingofpowerbetweenlaborandcapitalistohaveworker
representationoncorporateboards.Thismodelofcorporategovernance—thestakeholderasopposed
toshareholdermodel—iscommoninGermany(ClarkeandBostock1997).Besidestendingtoflattenthe
compensationschemewithinfirms,thismodelreducestheproclivityofmanagementtoengageinhigh-
riskactivitythatmaybelucrativeforshareholdersintheshortrun,butwhichthreatensemploymentand
the long-term viability of the organization. Volkswagen has worker representation on its board of
directors and is 20 percent owned by the state government of Lower Saxony (the “VW law”)—an
additionallayerofstakeholderaccountability.AndwhileNorthAmericanautomakershavebeenclosing
assemblyplantsfordecades,becauseVWhaslaborandgovernmentrepresentationonitsboardithas
managedtoblockhostiletakeoversandhasnotallowedasingleVWassemblyplanttocloseinGermany
since1945—andthisdespitethefactthatGermanmanufacturingworkersarepaidroughlyone-quarter
morethantheirNorthAmericancounterparts.

47
Another democratizing policy pertaining to labor would see the establishment of sector
developmentcouncilsinstrategicareas,comprisingrepresentativesfromunions,employerassociations,
government, and colleges, universities, and trades schools. These multi-stakeholder councils could
undertake initiativesas simpleas long-termskills trainingprograms (tobettermanage innovationand
emerging labor market needs) to initiatives as transformative as the setting of sectoral standards,
including minimum standards pertaining to the conditions and compensation of work. Historically,
unionsprovidedworkerswithsomedegreeofcontrolover the laborprocess in theirownworkplaces.
Sectordevelopmentcouncilswouldprovideworkerswithsomedegreeofcontrolovertheevolutionof
entireindustries.
A third transformation would constrain the size and market power of large firms through
aggressiveantitrustlegislation.Inthe40yearsbetween1940and1980,M&Aactivityconstitutedjust20
percentofinvestmentinfixedassets.Intandemwithcapitalcontrols,thisperiodwasremarkableforits
elevated levels ofGDP growth and reduced income inequality. In the decades since 1980, large firms
have plowed enormous resources into acquiring competitors. The resulting semi-monopolisticmarket
structures and attendant market power concentrates income among large firms. By restricting the
oligopolistic drive of M&A, the intention would be to unleash the centrifugal forces of fixed asset
investment, which are associated with higher levels of GDP growth, job creation, and an inclusive
prosperity.
EarlyAmericanmergerwavestendedtobefollowedbyantitrustlegislation.Americanlegislators
werefearful thatcentralizedcorporateauthoritywouldharmthepublicgood.Thedriveformonopoly
associatedwiththefirstmergerwave,forexample,ledtotheShermanAntitrustActof1890,whichwas
institutedtocombat thepowerof large firms.Ageneration later, theUSCongresspassedtheClayton
Actof1914,whichalsomadeitmoredifficulttomergeformonopoly(Gaughan2007).Anti-monopolistic
policies designed for the 21st century could help diffuse the increasingly centralized corporate power
manifestinlargefirms,whichwouldhelpaccelerategrowthanddiminishinequality.
The statecommitment to fullemployment in conjunctionwitha rebuildingof the tradeunion
movement and restrictions on business consolidation are three democratizing policies that would
weakenthepoweroflargefirmswithouteliminatingthecapitalistcharacteroftheAmericaneconomy.
Therewouldstillbeprivateenterprise,investmentforprofit,andwagelabor,butthisbasketofpolicies
would make the accumulation of capital compatible with the national goals of widening economic
opportunityandaninclusiveprosperity.
48
Appendix
DataSources,Calculations,andEstimationTechniques
Buy-to-BuildIndicator(Figures1,5,13)
To the best of the author’s knowledge, internally consistent long-term data are not available for
AmericanM&A.ThedollarvalueofallreportedM&AcomesfromMergerStatthroughWilmerHaleLLP
(2014,Slide2) for2008–13andfromThomsonSecuritiesFinancialDatathroughthesoftwarepackage
associatedwith Gaughan (2007, Figure 2.7) for 2000–7. The estimated dollar value ofM&A for prior
yearscameinaseriesofsteps.Thefirststepwastocreateaunifiedandrebasedseriesofannounced
M&Atransactions.M&Aannouncements come fromGaughan (2007,Tables2.3and2.5) for1963–99.
Lamoreaux (2006a,chapter422;2006b,chapter416)suppliesM&Atransactions inmanufacturingand
mining for 1919–62 and 1895–1918, respectively. The second step involved multiplying the S&P 500
CompositePriceIndex(GlobalFinancialData,Code:GFD_SPXD)bythetotalnumberofannouncedM&A.
Inthethirdstep,arebasingnumberwascreatedsothatthetotalnumberofM&Acouldbemultipliedby
theS&P500proxyvalue. Instepfour,theresultingnumberwasmultipliedbytherebasingnumberto
produceanestimateofthedollarvalueofM&Afrom1895through1999.Stepfiveinvolvedcreatinga
unifiedseriesforthedollarvalueofgrossprivatedomesticinvestmentinnonresidentialstructuresand
equipment by splicing the Bureau of Economic Analysis, Table 1.1.5, from 1929–2013with a rebased
valueofSimonKuznets’s(n.d.)estimateofgrossfixedcapitalformation(1895–1928),thelatterbrought
totheauthor’sattentionbyFrancis(2013).
NationalAccounts(Figures2–3,6-8,10,14)
Total American corporate assets are the sum of nonfinancial and financial corporate business assets,
retrieved from theFederalReserve (Z1/Z1/FL102000005.AandZ1/Z1/FL792000095.A).Grossdomestic
productandbusinessexpenditureonnonresidentialstructuresandequipmentare fromtheBureauof
EconomicAnalysis(BEA),Table1.1.5.Nationalincomeand(national)netdividendsfromBEA,Table1.12.
Relevant seriesweredeflatedusing theconsumerprice indexandan industrial commoditiesproducer
price index, retrievedfromGlobalFinancialData (CodesCPUSAMandWPUSAICM).Civilian labor force
andtotalemploymentfromCarter(2006).

49
Top100Firms(Figures4–7,9,13-14,16)
Dataforthetop100American-listedfirms,rankedannuallybyequitymarketcapitalization,comesfrom
Compustat through Wharton Research Data Services. Variables include common shares outstanding,
closingshareprice,revenue,totalassets,acquisitions,pretaxprofit,aftertaxprofit,capitalexpenditures
andpurchaseofcommonandpreferredstock.
TopIncomeShare(Figures8–10,14,18-19)
Top1 percent income share (including capital gains),wages and salaries portionof the top 1 percent
incomeshare,andthePareto–LorenzCoefficientfromPikettyandSaez(2007),retrievedfromWorldTop
IncomesDatabase:topincomes.g-mond.parisschoolofeconomics.eu/,accessedDecember23,2014.
UnionDensity(Figure10)
To the best of the author’s knowledge, a continuous data series is not available for American
unionization.Membershipdatafrom1973–2013arefromHirschandMacpherson(2003),retrievedfrom
theironlinedatabase(www.unionstats.com/).Mayer(2004,TableA1,pp.22–23)suppliesmembership
datafrom1930–72.Estimatesfor1880–1929cameinaseriesofsteps.Thefirststepwastospliceand
rebaseabsolute figures forunionmembership from theBureauof Labor StatisticsHandbookof Labor
Statistics(1950)andG.Friedman,“NewEstimatesofUnionMembership:TheUnitedStates,1880–1914”
Historical Methods 32, no. 2 (1999), both retrieved from Rosenbloom (2006a, chapters Ba4783 and
Ba4789). The second step was to estimate the American workforce. Sobek (2006, chapter Ba340)
provides an absolute figure for eachdecadebeginning in 1850.Adecadeaverage rateof growthwas
imputedtocreateacompleteestimateoftheAmericanworkforce.Inthethirdstep,unionmembership
wasdividedbytheestimatedlaborforcetoarriveatafigureforuniondensity.
StrikeActivity(Figures11-12,18)
Workstoppagesincludestrikesandlockouts.Tothebestoftheauthor’sknowledge,internallyconsistent
long-termdataarenotavailableforAmericanworkstoppages.TheBureauofLaborStatistics(BLS)tracks
labor disputes from 1947 onward using fourmetrics: number ofwork stoppages, number ofworkers
involved,daysidle,andpercentofestimatedworkingtimelost.Thedifficultywiththesefiguresisthat
thenumberofworkstoppagesisrestrictedtoestablishmentswith1,000ormoreemployees.Between
automation, lean production, and the resulting decline in large establishments, the data will tend to
artificiallydepress strike intensityover recentdecades. To remedy thisdefect, anewstrike indexwas
50
built.Continuousestimatesfortheabsolutenumberof(1)workstoppages(from1881), (2)numberof
workersinvolved(from1881),(3)daysidle(from1927),and(4)percentofestimatedworkingtimelost
(from 1939), with proper rebasing, was created by fusing the BLS data with data from the Historical
StatisticsoftheUnitedStates.Withaviewtocombiningthefourmeasuresofstrikeactivityintoasingle
supermetric,eachserieswasindexed(theactualvalueineachyearlesstheseriesaveragevaluedivided
bythestandarddeviation).Intheresultingfourseries,avalueof0meansstrikeactivityisatitshistoric
average,withpositiveandnegativevaluessignallingaboveaverageandbelowaveragestrikeactivity.A
simpleaverageofthefour indexedserieswascomputedtocapturetheoverallstriketrendinAmerica
from1881to2013(withthedatagapfrom1906to1913interpolatedwithastraightline).SeeBureauof
Labor Statistics, Table 1, for data from 1947 to 2013 (www.bls.gov/news.release/wkstp.t01.htm),
accessedMay5,2015.Dataonnumberofworkstoppagesandworkersinvolved(1881–1905,1914–81),
person-days idle (1927–81), and days idle as a percent of estimated working time (1939–81) from
Rosenbloom(2006b,chaptersBa4954-4958).
ClassIncomeandItsRedistribution(Figures12,14,17)
Aggregate Capital-Labor Redistribution Index. National corporate profits (with inventory valuation
adjustmentandcapitalconsumptionallowance)andtotalcompensationofemployeesfromtheBureau
ofEconomicAnalysis,Tables1.12and2.1,respectively.AverageLabor-CapitalRedistributionIndex.S&P
500CompositePrice Index fromGlobal FinancialData (Code:GFD_SPXD).Averagehourlyearnings for
the years 1850–1940 are for unskilled labor, retrieved fromMargo (2006, chapter Ba4218); the years
1940–2013areformanufacturingworkers,retrievedfromGlobalFinancialData(Code:USAHEMANM).
InflationandUnemployment(Figures15-17,19)
Consumer price index fromGlobal Financial Data (Code: CPUSAM). Number of unemployed and total
civilianlaborforcefromCarter(2006).

51
References
Berle,A.A.,andG.C.Means.1968(1932).TheModernCorporationandPrivateProperty.Rev.ed.New
York:Harcourt,Brace&World.
Blair, J.M. 1972. Economic Concentration: Structure, Behavior, and Public Policy. New York: Harcourt
BraceJovanovich.
Brennan,J.2012.AShrinkingUniverse:HowConcentratedCorporatePowerIsShapingIncomeInequality
inCanada.Ottawa:CanadianCentreforPolicyAlternatives.
———. 2014. “The Business of Power: CanadianMultinationals in the Postwar Era.” Ph.D. diss., York
University.
———. 2015. Ascent of Giants: NAFTA, Corporate Power, and the Growing Income Gap. Ottawa:
CanadianCentreforPolicyAlternatives.
Burdekin, R. C., and P. Burkett. 1996. Distributional Conflict and Inflation: Theoretical and Historical
Perspectives.Houndmills,Basingstoke:PalgraveMacmillan.
Card,D.,andJ.E.DiNardo.2002.“SkillBiasedTechnologicalChangeandRisingWageInequality:Some
ProblemsandPuzzles.”JournalofLaborEconomics20,no.4(October):733–83.
Carter, S. B. 2006. “Labor Force, Employment, and Unemployment: 1890–1990.” In S. B. Carter, S. S.
Garter,M. R. Haines, A. L. Olmstead, R. Sutch, and G.Wright, eds.Historical Statistics of the
UnitedStates,EarliestTimestothePresent:MillennialEdition.NewYork:CambridgeUniversity
Press.TableBa470-477.
Clarke,T.,andR.Bostock.1997.“GovernanceinGermany:TheFoundationsofCorporateStructure?”In
K. Keasey, S. Thompson, andM.Wright, eds. Corporate Governance: Economic,Management
andFinancialIssues.NewYork:OxfordUniversityPress.
Dalziel, P. 1999–2000. “A Post Keynesian Theory of Asset Price Inflation with Endogenous Money.”
JournalofPostKeynesianEconomics22(2):227–45.
DeLong,J.B.,andL.Summers.1992.“EquipmentInvestmentandEconomicGrowth:HowStrongIsthe
Nexus?”BrookingsPapersonEconomicActivity23(2):157–211.
Dougherty,C.,andD.W.Jorgenson.1997.“ThereIsNoSilverBullet:InvestmentandGrowthintheG-7.”
NationalInstituteEconomicReview,no.162(October):57–74.
Francis,J.A.2013.“TheBuy-to-BuildIndicator:NewEstimatesforBritainandtheUnitedStates.”Review
ofCapitalasPower1(1):63–72.
Frydman, C., and D. Jenter. 2010. “CEO Compensation.” NBERWorking Paper No. 16585. Cambridge:
NationalBureauofEconomicResearch.AccessedMay12,2015.www.nber.org/papers/w16585.

52
Gabaix,X.,andA.Landier.2008.“WhyHasCEOPayIncreasedSoMuch?”QuarterlyJournalofEconomics
123(1):49–100.
Galbraith, J. K. 1952. American Capitalism: The Concept of Countervailing Power. Boston: Houghton
Mifflin.
Gaughan,P.A.2007.Mergers,Acquisitions,andCorporateRestructuring.4thed.Hoboken:JohnWiley&
Sons.
Hirsch,B.T.,andD.A.Macpherson.2003.“UnionMembershipandCoverageDatabasefromtheCurrent
PopulationSurvey:Note.”IndustrialandLaborRelationsReview56(2):349–54.Seriesupdated
bysameauthors.Dataavailableat:www.unionstats.com/.AccessedMay5,2015.
Jo, T.-H., and J. F. Henry. 2015. “The Business Enterprise in the Age ofMoney-Manager Capitalism.”
JournalofEconomicIssues49(1):23–46.
Jorgenson,D.W.2007.“InformationTechnologyandtheG7Economies.”InE.R.BerndtandC.R.Hulten,
eds.Hard-to-MeasureGoodsandServices:EssaysinHonorofZviGriliches.Chicago:Universityof
ChicagoPress.
Kalecki,M. 1971 (1938). “DistributionofNational Income.” InSelected Essays on theDynamics of the
CapitalistEconomy,1933–1970.Cambridge:CambridgeUniversityPress.
———.1971(1943).“CostsandPrices.” InSelectedEssaysontheDynamicsof theCapitalistEconomy,
1933–1970.Cambridge:CambridgeUniversityPress.
Krugman,P.R.2008.“TradeandWages,Reconsidered.”BrookingsPaperonEconomicActivity(Spring):
103–37.
Kuznets, S. n.d. “Annual Estimates, 1869–1955.” Technical tables underlying series in Capital in the
AmericanEconomy:ItsFormationandFinancing.Baltimore:JohnsHopkinsUniversity.Accessed
May6,2015.www.nber.org/data-appendix/c1454/appendix.pdf.
Lamoreaux,N.R.2006a.“Mergers,Acquisitions,andJointVentures—NumberandAssets:1919–1979.”
InS.B.Carter,S.S.Garter,M.R.Haines,A.L.Olmstead,R.Sutch,andG.Wright,eds.Historical
Statistics of the United States, Earliest Times to the Present: Millennial Edition. New York:
CambridgeUniversityPress,TableCh422-429.
———.2006b.“Mergers inManufacturingandMining—Entities,Capitalization,andType:1895–1930.”
InS.B.Carter,S.S.Garter,M.R.Haines,A.L.Olmstead,R.Sutch,andG.Wright,eds.Historical
Statistics of the United States, Earliest Times to the Present: Millennial Edition. New York:
CambridgeUniversityPress,TableCh416-421.
Lavoie,M.1992.FoundationsofPostKeynesianEconomicAnalysis.Aldershot:EdwardElgar.

53
———.2014.Post-KeynesianEconomics:NewFoundations.Northampton:EdwardElgar.
Margo,R.A.2006.“IndexofMoneyWagesforUnskilledLabor:1774–1974.”InS.B.Carter,S.S.Garter,
M. R. Haines, A. L. Olmstead, R. Sutch, and G.Wright, eds.Historical Statistics of the United
States,EarliestTimes to thePresent:MillennialEdition.NewYork:CambridgeUniversityPress,
TableBa4218.
Mayer, G. 2004. Union Membership Trends in the United States. Washington, D.C.: Congressional
ResearchService.AccessedMay5,2015.digitalcommons.ilr.cornell.edu/key_workplace/174.
McCarthy,K.J.2013.“TheBusinessEnvironment—MergersandMergerWaves:ACenturyofCauseand
Effect.” InK. J.McCarthyandW.Dolfsma,eds.UnderstandingMergersandAcquisitions in the
21stCentury.London:PalgraveMacmillan.
Means,G.C.1935.“PriceInflexibilityandtheRequirementsofaStabilizingMonetaryPolicy.”Journalof
theAmericanStatisticalAssociation30(190):401–13.
———.1983.“CorporatePowerintheMarketplace.”JournalofLawandEconomics26(2):467–85.
Moore,M.P.,andP.Ranjan.2005.“GlobalisationvsSkill-biasedTechnologicalChange:Implicationsfor
UnemploymentandWageInequality.”TheEconomicJournal115(503):391–422.
Murphy, K. J. 2012. “Executive Compensation: Where We Are, and How We Got There.” In G.
Constantinides, M. Harris, and R. Stulz, eds. Handbook of the Economics of Finance. Elsevier
ScienceNorthHolland(forthcoming);MarshallSchoolofBusinessWorkingPaperNo.FBE07.12.
AccessedMay12,2015.dx.doi.org/10.2139/ssrn.2041679.
NitzanJ.,andS.Bichler.2009.CapitalasPower:AStudyofOrderandCreorder.London:Routledge.
Olson,M. 1982. The Rise and Decline of Nations: Economic Growth, Stagflation, and Social Rigidities.
NewHaven:YaleUniversityPress.
Piketty,T.,andE.Saez.2007.“IncomeandWage Inequality in theUnitedStates,1913–2002.” InA.B.
Atkinson and T. Piketty, eds. Top Incomes Over the Twentieth Century. A Contrast Between
Continental European and English-speaking Countries, chap. 5. New York: Oxford University
Press.Seriesupdatedbythesameauthors.
Peterson,W.C.1980.“StagflationandtheCrisisofCapitalism.”ReviewofSocialEconomy38(3):277–87.
———.1982.“WorkerDiscontent,Wages,andStagflation.”JournalofEconomicIssues16(4):977–84.
Polanyi,K.2001(1944).TheGreatTransformation:ThePoliticalandEconomicOriginsofOurTime.2nd
ed.Boston:BeaconPress.
Pollin,R.2012.BacktoFullEmployment.Boston:TheMITPress.

54
Smith,A.1994(1776).AnInquiryintotheNatureandCausesoftheWealthofNations.EditedbyEdwin
Cannan.NewYork:RandomHouse.
Ricardo,D.1973(1817).ThePrinciplesofPoliticalEconomyandTaxation.IntroductionbyDonaldWinch.
Toronto:DentDutton.
Rosenberg,S., andT.E.Weisskopf.1981. “AConflictTheoryApproach to Inflation in thePostwarU.S.
Economy.”AmericanEconomicReview71(2):42–47.
Rosenbloom,J.L.2006a.“UnionMembership:1880–1999.”InS.B.Carter,S.S.Garter,M.R.Haines,A.
L.Olmstead,R.Sutch,andG.Wright,eds.HistoricalStatisticsoftheUnitedStates,EarliestTimes
tothePresent:MillennialEdition.NewYork:CambridgeUniversityPress,TableBa4783-4791.
———. 2006b. “Work Stoppages, Workers Involved, Average Duration, and Person-days Idle: 1881–
1998.” In S. B. Carter, S. S.Garter,M. R.Haines,A. L.Olmstead, R. Sutch andG.Wright, eds.
Historical Statistics of theUnited States, Earliest Times to the Present:Millennial Edition. New
York:CambridgeUniversityPress,TableBa4954-4964.
Rowthorn,R.E.1977.“Conflict,InflationandMoney.”CambridgeJournalofEconomics1(3):215–39.
Samuelson,P.A.,andW.D.Nordhaus.2010.Economics.19thed.NewYork:McGraw-Hill.
Sobek, M. 2006. “Labor Force Participation, Employment, and Unemployment, by Sex: 1850–1990
[Censusestimates].” InS.B.Carter,S.S.Garter,M.R.Haines,A.L.Olmstead,R.Sutch,andG.
Wright, eds.Historical Statistics of the United States, Earliest Times to the Present:Millennial
Edition.NewYork:CambridgeUniversityPress,TableBa340-354.
Stigler,G.1950.“MonopolyandOligopolybyMerger.”AmericanEconomicReview40(2):23–34.
Stiglitz, J. 2015. Re-writing the Rules of the American Economy: An Agenda for Growth and Shared
Prosperity.NewYork:W.W.Norton.
Veblen,T.1908a.“OntheNatureofCapital.”TheQuarterlyJournalofEconomics22(4):517–42.
———.1908b. “On theNatureofCapital: Investment, IntangibleAssets,and thePecuniaryMagnate.”
TheQuarterlyJournalofEconomics23(1):104–36.
———.2004(1923).AbsenteeOwnershipandBusinessEnterpriseinRecentTimes:TheCaseofAmerica.
NewBrunswickandLondon:TransactionPublishers.
Weintraub, S. 1978. Capitalism’s Inflation and Unemployment Crisis: Beyond Monetarism and
Keynesianism.London:Addison-Wesley.
———.1978–79.“TheMissingTheoryofWages.”JournalofPostKeynesianEconomics1(2):59–78.
Wilmer Cutler Pickering Hale and Dorr LLP. 2014. 2014 M&A Report. Accessed May 5, 2015.
www.wilmerhale.com/2014MAreport.
Recommended