RIAA Revenue & Shipment Data
MusicBiz 2015
Joshua Friedlander
"
PAGE 2!
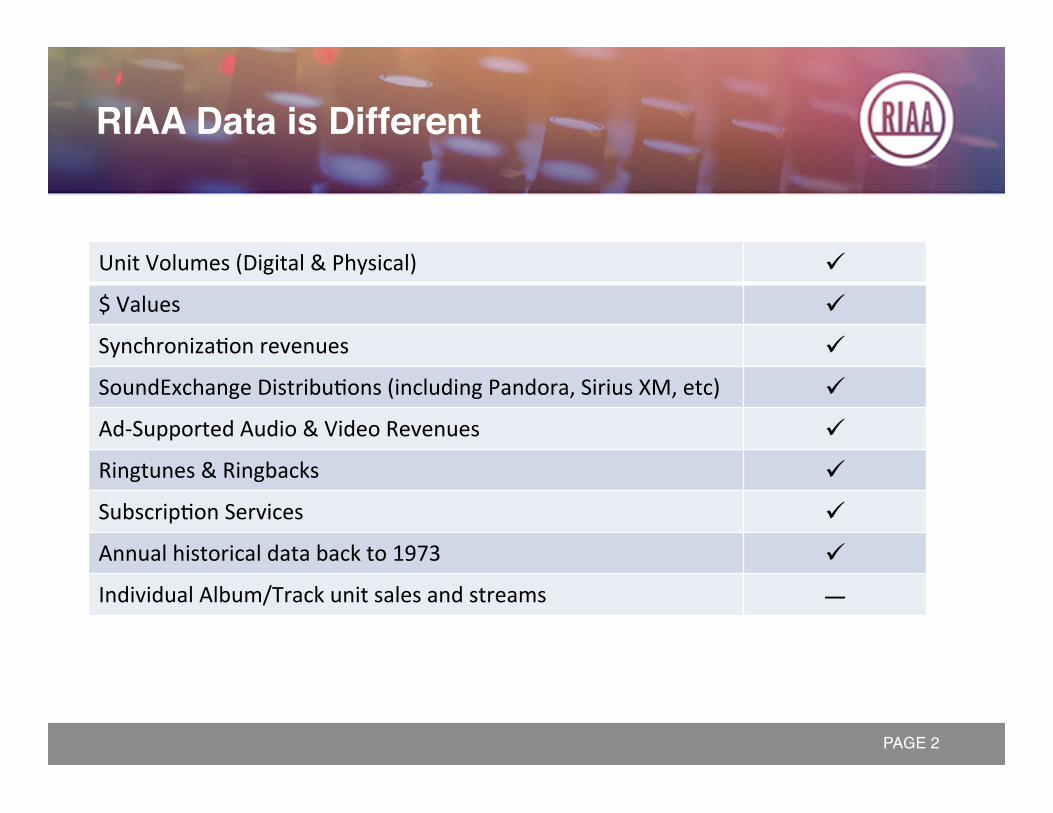
RIAA Data is Different"
Unit Volumes (Digital & Physical) ! $ Values ! Synchroniza;on revenues ! SoundExchange Distribu;ons (including Pandora, Sirius XM, etc) ! Ad-‐Supported Audio & Video Revenues ! Ringtunes & Ringbacks ! Subscrip;on Services ! Annual historical data back to 1973 ! Individual Album/Track unit sales and streams —
PAGE 3!
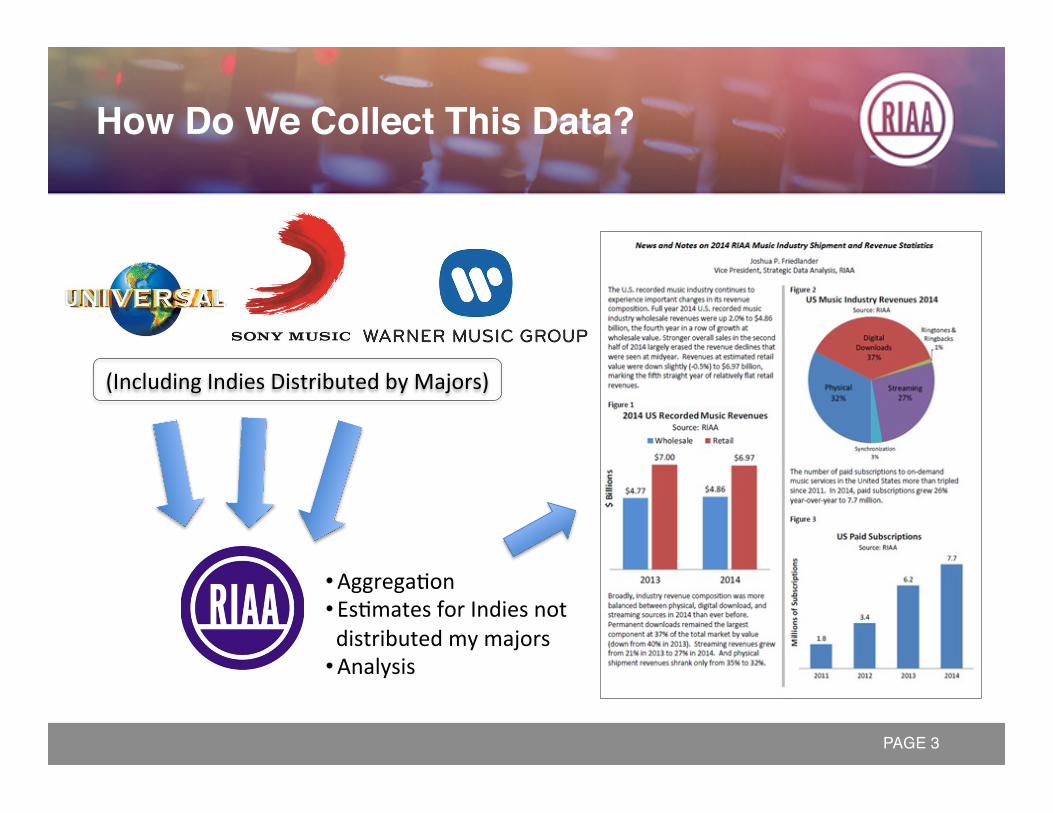
How Do We Collect This Data?"
• Aggrega;on • Es;mates for Indies not distributed my majors
• Analysis
(Including Indies Distributed by Majors)
2009 2010 2011 2012 2013 2014
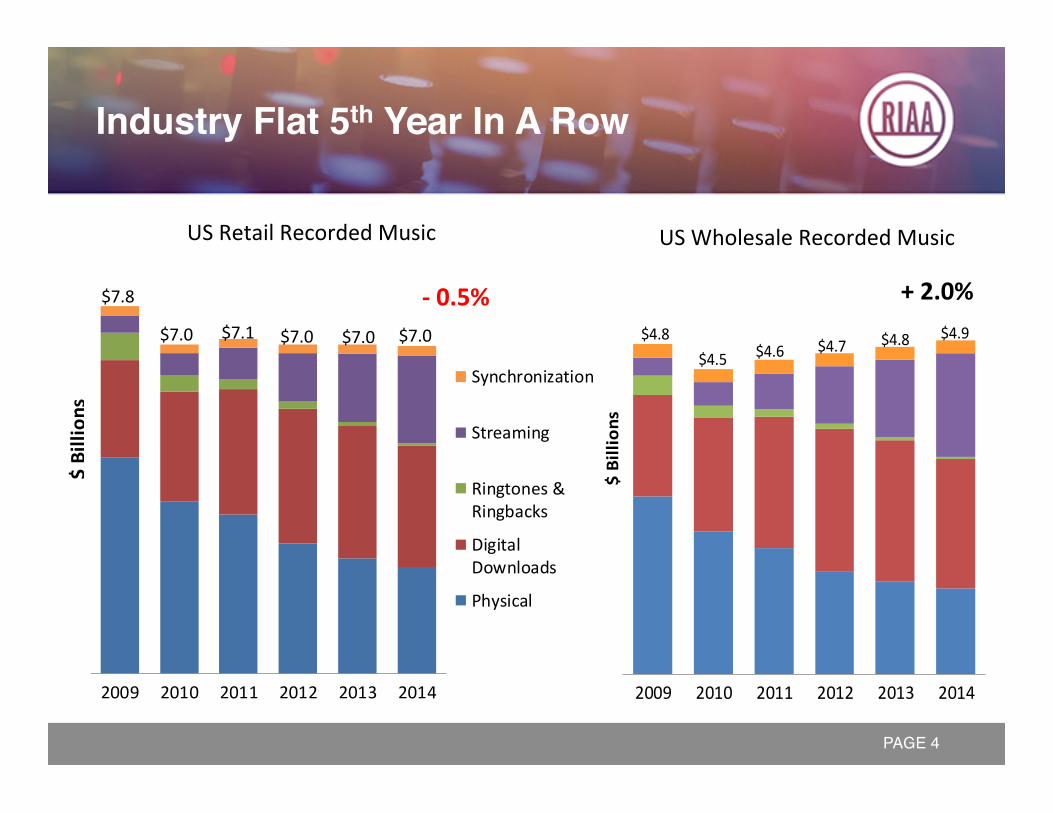
US Retail Recorded Music Shipments 2009 -‐ 2014
Synchronization
Streaming
Ringtones &Ringbacks
DigitalDownloads
Physical
$ Billion
s
$7.8
$7.0$7.0$7.1$7.0 $7.0 $4.8$4.5 $4.6 $4.7 $4.8 $4.9
2009 2010 2011 2012 2013 2014
$ Billion
s
US Wholesale Recorded Music Shipments 2009-‐2014
PAGE 4!
Industry Flat 5th Year In A Row"
US Retail Recorded Music US Wholesale Recorded Music
+ 2.0% -‐ 0.5%
PAGE 5!
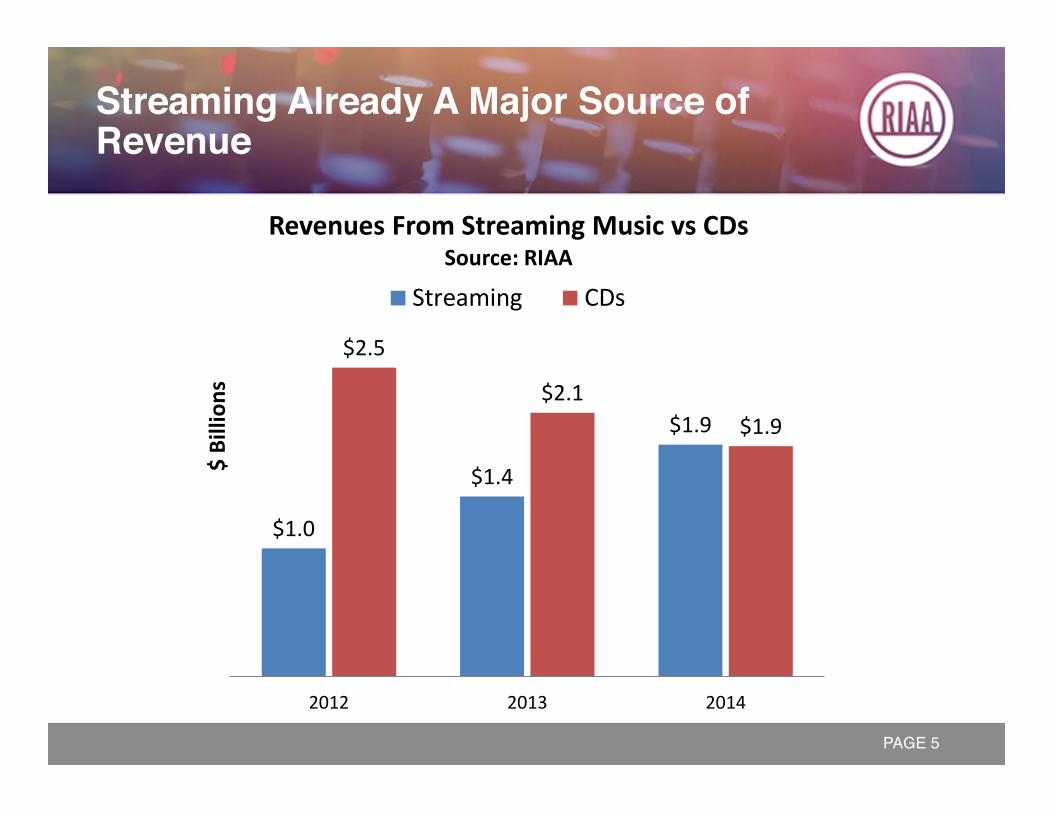
Streaming Already A Major Source of Revenue"
$1.0
$1.4
$1.9
$2.5
$2.1$1.9
2012 2013 2014
$ Billion
sRevenues From Streaming Music vs CDs
Source: RIAA
Streaming CDs
PAGE 6!
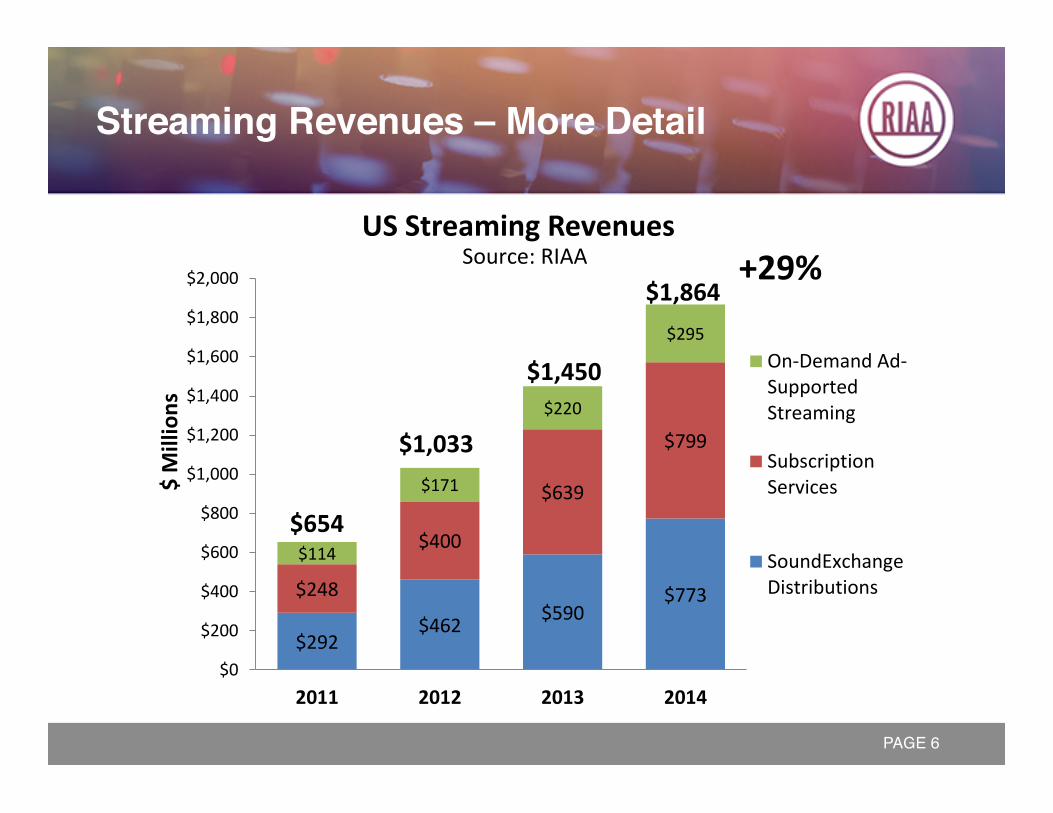
Streaming Revenues – More Detail"
+29%
$292$462 $590
$773$248
$400
$639
$799
$114
$171
$220
$295
$0
$200
$400
$600
$800
$1,000
$1,200
$1,400
$1,600
$1,800
$2,000
2011 2012 2013 2014
US Streaming Revenues
On-‐Demand Ad-‐SupportedStreaming
SubscriptionServices
SoundExchangeDistributions
$ Millions
$654
$1,033
$1,450
Source: RIAA$1,864
PAGE 7!
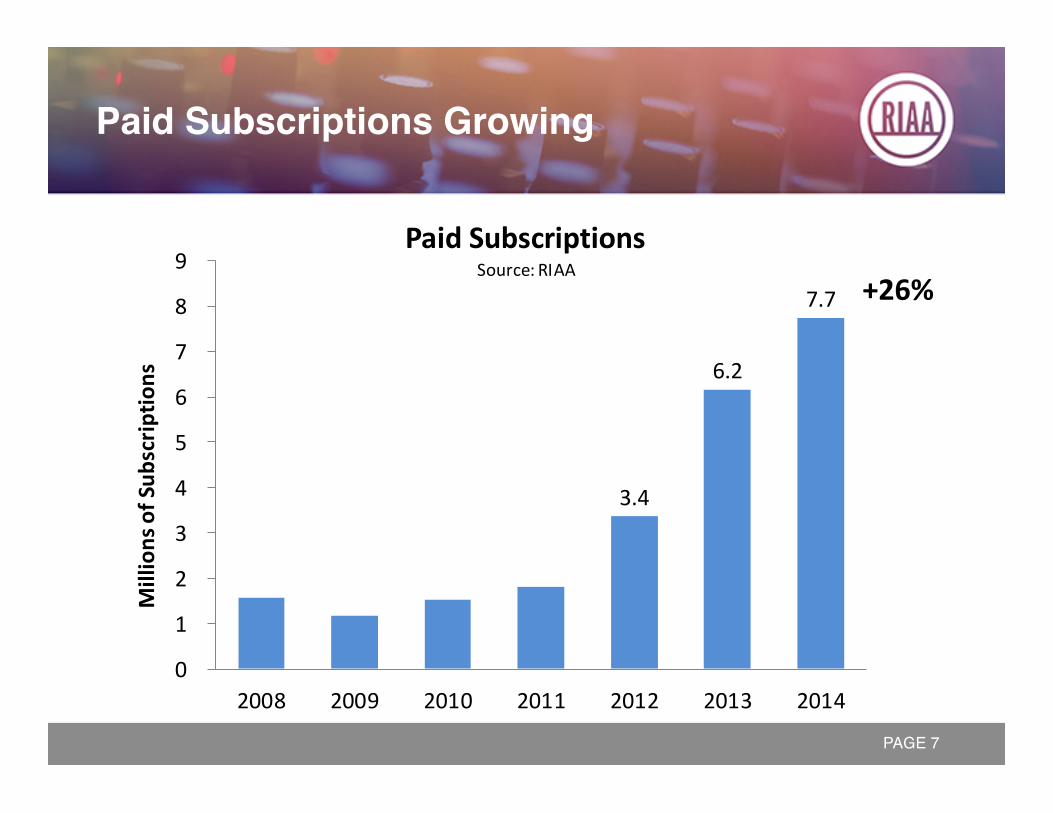
Paid Subscriptions Growing"
+26%
3.4
6.2
7.7
0
1
2
3
4
5
6
7
8
9
2008 2009 2010 2011 2012 2013 2014
Millions of Sub
scrip
tions
Paid SubscriptionsSource: RIAA
PAGE 8!
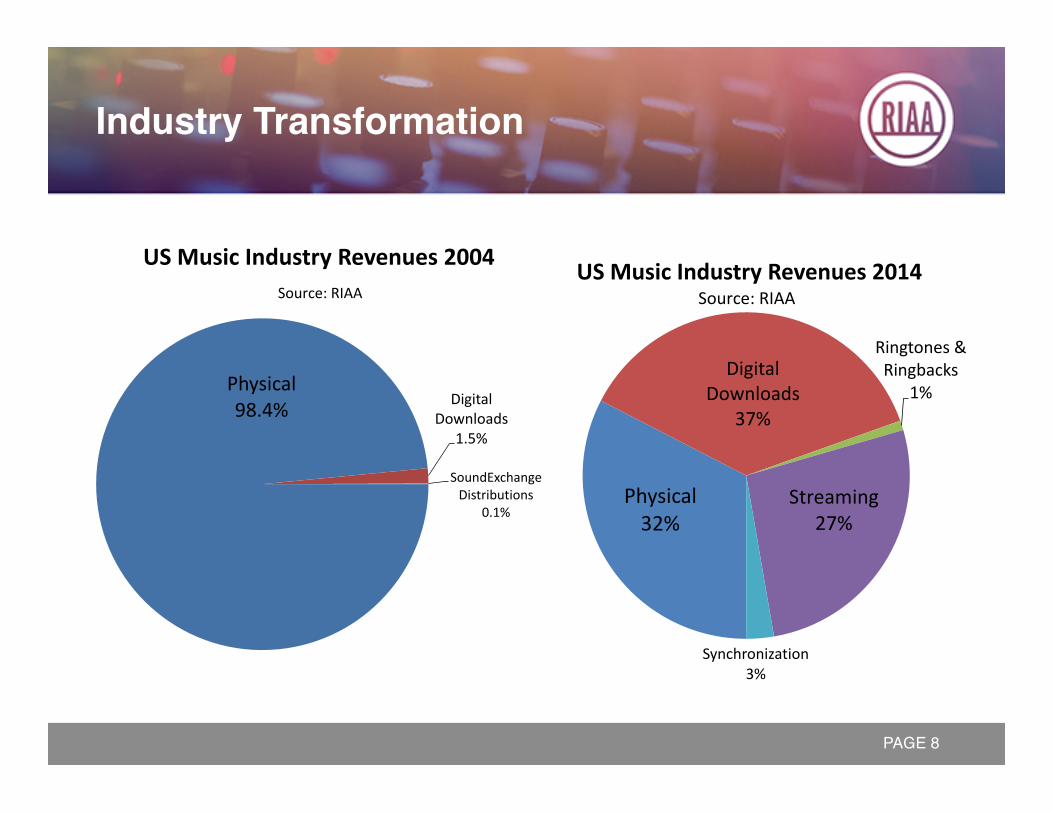
Industry Transformation"
Physical 98.4% Digital
Downloads1.5%
SoundExchange Distributions
0.1%
US Music Industry Revenues 2004Source: RIAA
Physical32%
Digital Downloads
37%
Ringtones & Ringbacks
1%
Streaming27%
Synchronization3%
US Music Industry Revenues 2014Source: RIAA
PAGE 9!
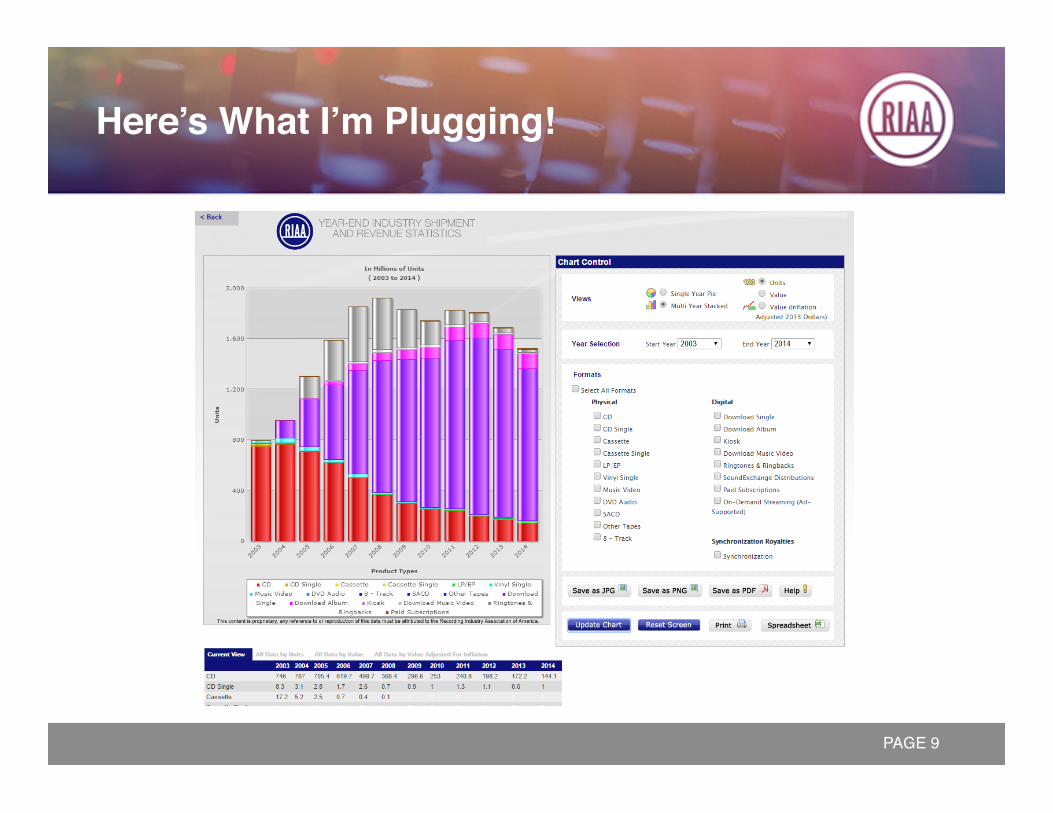
Here’s What I’m Plugging!"
Recommended