i
RHEOLOGICAL PROPERTIES & CORROSION CHARACTERISTICS OF
DRILLING MUD ADDITIVES
By
Annudeep Singh Dhiman
Submitted in partial fulfillment of the requirement for the degree of
Master of Engineering
at
Dalhousie University Halifax, Nova Scotia
September, 2012
© Copyright by Annudeep Singh Dhiman
DALHOUSIE UNIVERSITY
Faculty of Engineering
iv
Dedication
I dedicate this project wholeheartedly to my dear parents and my entire family for their
unconditional support. Thank you.
v
TABLE OF CONTENTS
CHAPTER 1 INTRODUCTION .......................................................................................................................... 1
1.1 DRILLING FLUID SELECTION ................................................................................................................ 2
1.2 RHEOLOGY OF DRILLING FLUID ........................................................................................................... 3
1.3 DRILLING FLUID ADDITIVES ................................................................................................................. 3
1.4 CLASSIFICATION OF DRILLING FLUIDS ................................................................................................. 4
Pneumatic Drilling Fluids....................................................................................................................... 5
Liquid Fluids .......................................................................................................................................... 5
Oil Based Drilling Muds ......................................................................................................................... 6
1.5 CORROSION IN DRILLING .................................................................................................................... 6
1.6 PROJECT OBJECTIVE AND SCOPE ........................................................................................................ 7
CHAPTER 2 LITERATURE REVIEW .................................................................................................................. 8
2.1 DRILLING MUD DIAGNOSTICS TEST .................................................................................................... 8
RHEOLOGY: VISCOSITY, YIELD POINT AND GEL STRENGTH .................................................................. 8
DRILLING MUD DENSITY (WEIGHT) ..................................................................................................... 14
2.2 FACTORS AFFECTING MUD PROPERTIES ........................................................................................... 16
2.3 CORROSION PROBLEM IN DRILLING ................................................................................................. 19
CHAPTER 3 EXPERIMENTAL ......................................................................................................................... 22
3.1 METHODOLOGY ................................................................................................................................ 22
RHEOLOGY METHODOLOGY ............................................................................................................... 22
CORROSION TEST METHODOLOGY ..................................................................................................... 24
3.2 EQUIPMENT USED ............................................................................................................................. 26
CHAPTER 4 RESULTS .................................................................................................................................... 30
4.1 RHEOLOGY TEST ................................................................................................................................ 30
Mud Density Results ........................................................................................................................... 30
Plastic Viscosity Test Results ............................................................................................................... 31
Yield Point Test Results ....................................................................................................................... 32
10-sec Gel Strength Test Results ......................................................................................................... 33
4.2 CORROSION TEST .............................................................................................................................. 33
Bentonite Mud (Control Mud). ........................................................................................................... 35
vi
Barite Mud .......................................................................................................................................... 36
Hematite Mud ..................................................................................................................................... 37
Barite Mud vs. Hematite Mud............................................................................................................. 38
4.3 COMPARISON TO ADEAGA (2010) .................................................................................................... 39
Bentonite Mud .................................................................................................................................... 39
Barite Mud .......................................................................................................................................... 40
Hematite Mud ..................................................................................................................................... 42
4.4 ERROR CORRECTION ......................................................................................................................... 43
Plastic Viscosity Error Correction ........................................................................................................ 43
Yield Point Error Correction ................................................................................................................ 45
10-sec Gel Strength Error Correction .................................................................................................. 47
Corrosion Test Error Correction .......................................................................................................... 50
CHAPTER 5 DISCUSSIONS ............................................................................................................................ 53
CHAPTER 6 CONCLUSIONS & RECOMMENDATIONS ................................................................................... 55
6.1 CONCLUSIONS ................................................................................................................................... 55
6.2 RECOMMENDATIONS........................................................................................................................ 55
REFERENCES ................................................................................................................................................ 57
APPENDIX .................................................................................................................................................... 60
vii
LIST OF TABLES
Table 1.1 Classification of Drilling Fluids 5
Table 2.1 Effect of dissolved gasses on endurance limit of steel 20
Table 3.1 Composition of Barite Mud samples 23
Table 3.2 Composition of Hematite Mud Samples 23
Table 3.3 Corrosion test mud samples compositions 24
Table 4.1 Corrosion test results for Bentonite (A1-A4), Barite (B1-B4) and
Hematite (H1-H4) mud samples. 34
Table 4.2 Corrosion rate of coupons in Bentonite Mud sample of Adeaga
(2010) 39
Table 4.3 Corrosion rate of coupons in Barite Mud sample of Adeaga (2010) 40
Table 4.4 Corrosion rate of coupons in Hematite Mud sample of Adeaga
(2010) 42
Table A.1 Rheological properties of barite mud sample at varying
concentration of barite 61
viii
Table A.2 Rheological Properties of hematite mud sample at varying
concentration of hematite 61
Table A.3 Error Correction for Plastic Viscosity of Barite Mud 62
Table A.4 Error Correction for Plastic Viscosity of Hematite Mud 62
Table A.5 Error Correction for Yield Point of Barite Mud 63
Table A.6 Error Correction for Yield Point of Hematite Mud 63
Table A.7 Error Correction for 10-sec Gel Strength of Barite Mud 64
Table A.8 Error Correction for 10-sec Gel Strength of Hematite Mud 64
Table A.9 Error Correction for Corrosion Test Results for Bentonite (A1-A4),
Barite (B1-B4) and Hematite (H1-H4) mud samples. 65
ix
LIST OF FIGURES
Figure 2.1 Shear rate-shear stress relationships of Newtonian fluids 9
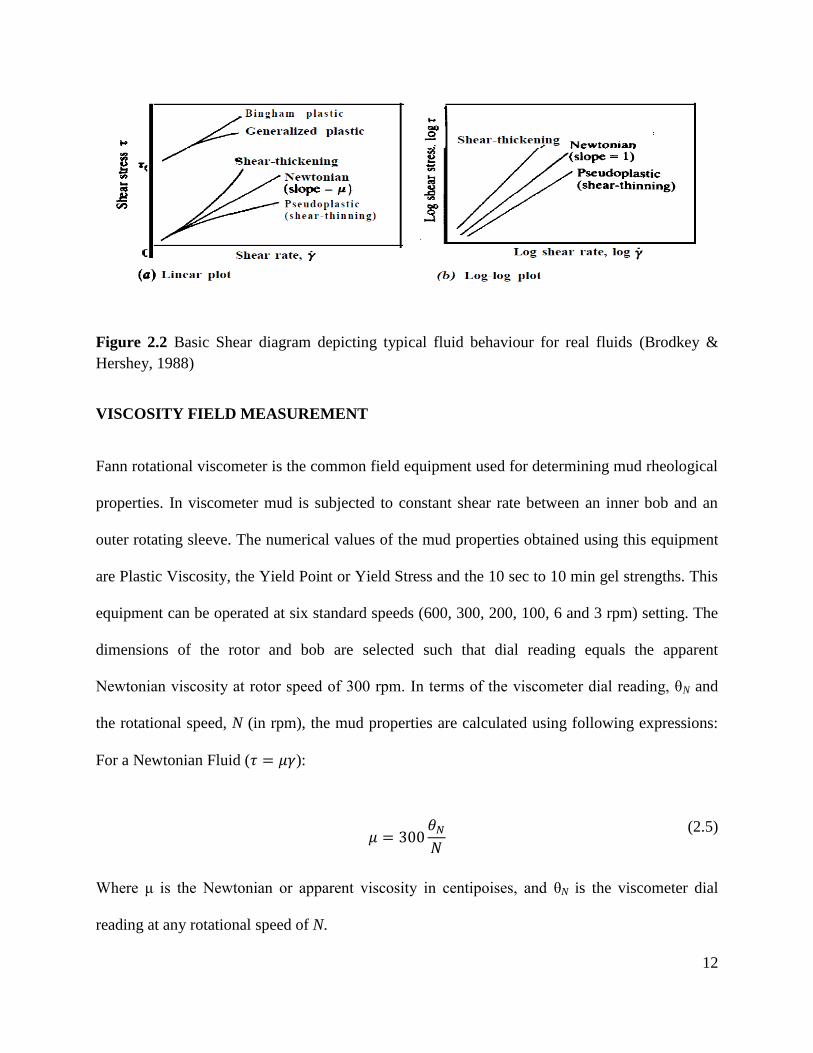
Figure 2.2 Basic Shear diagram depicting typical fluid behaviour for real
fluids
12
Figure 3.1 Viscometer 26
Figure 3.2 Mud Balance 27
Figure 3.3 Mixer 27
Figure 3.4 Aging cell assembly 28
Figure 3.5 Aging Cell 28
Figure 3.6 Roller oven 29
Figure 3.7 Roller Oven in operation 29
Figure 4.1 Effects of Additives on Mud Density of Mud Samples. 30
Figure 4.2 Effects of Additives on Plastic Viscosity of Mud Samples 31
Figure 4.3 Effects of Additives on Yield Point of Mud Samples 32
Figure 4.4 Effects of Additives on Yield Point of Mud Samples 33
Figure 4.5 Plot of Fractional Weight Loss of Steel Coupon in Bentonite Mud 35
x
Figure 4.6 Plot of Fractional Weight Loss of Steel Coupons in Barite Mud 36
Figure 4.7 Plot of Fractional Weight Loss of Steel Coupons in Hematite Mud 37
Figure 4.8 Plot comparing fractional weight loss of steel coupons caused by
Barite mud and Hematite mud
38
Figure 4.9 Plot comparing fractional weight loss of steel coupons in Bentonite
mud with that of Adeaga (2010).
40
Figure 4.10 Plot comparing fractional weight loss of steel coupons in Barite
mud with that of Adeaga (2010)
41
Figure 4.11 Plot comparing fractional weight loss of steel coupons in Hematite
mud with that of Adeaga (2010)
42
Figure 4.12 Plot showing error range for Barite Mud Plastic Viscosity 44
Figure 4.13 Plot showing error range for Hematite Mud Plastic Viscosity 45
Figure 4.14 Plot showing error range for Barite Mud Yield Point. 46
Figure 4.15 Plot showing error range for Hematite Mud Yield Point. 47
Figure 4.16 Plot showing error range for Barite Mud 10-sec Gel Strength 48
xi
Figure 4.17 Plot showing error range for Hematite Mud 10-sec Gel Strength 49
Figure 4.18 Plot depicting error range of Corrosion Test Results for Bentonite
Mud Coupons
50
Figure 4.19 Plot depicting error range of Corrosion Test Results for Barite Mud
Coupons
51
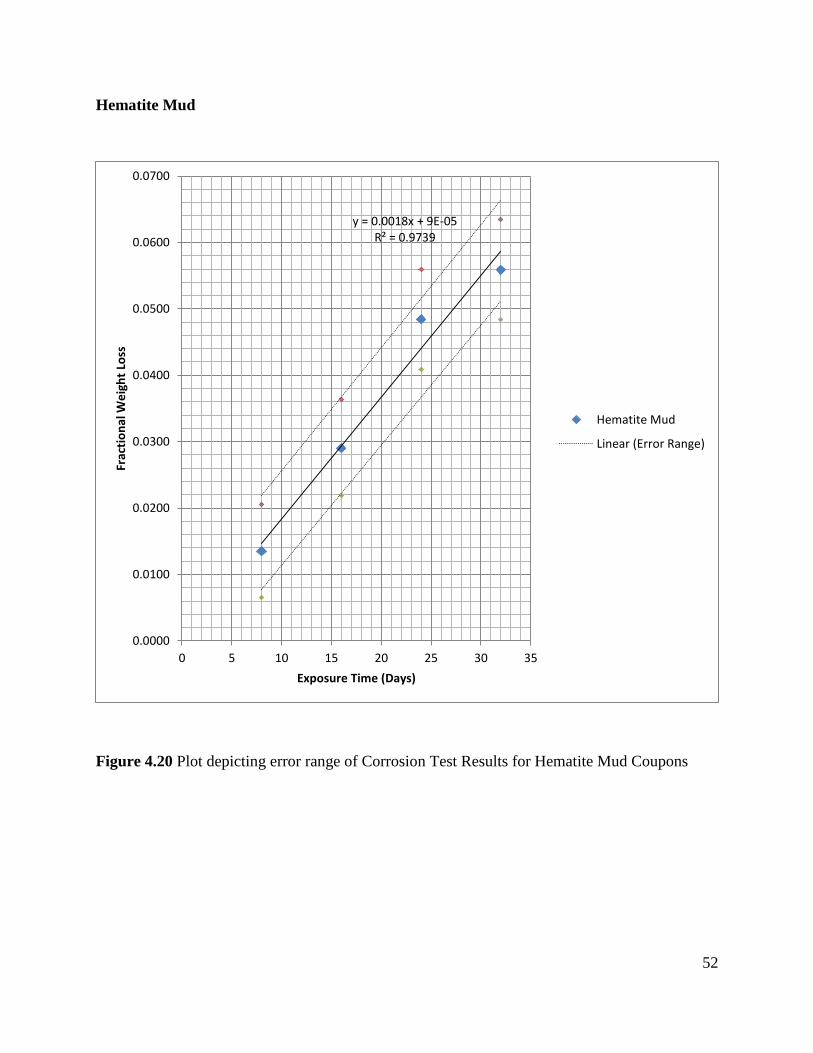
Figure 4.20 Plot depicting error range of Corrosion Test Results for Hematite
Mud Coupons
52
xii
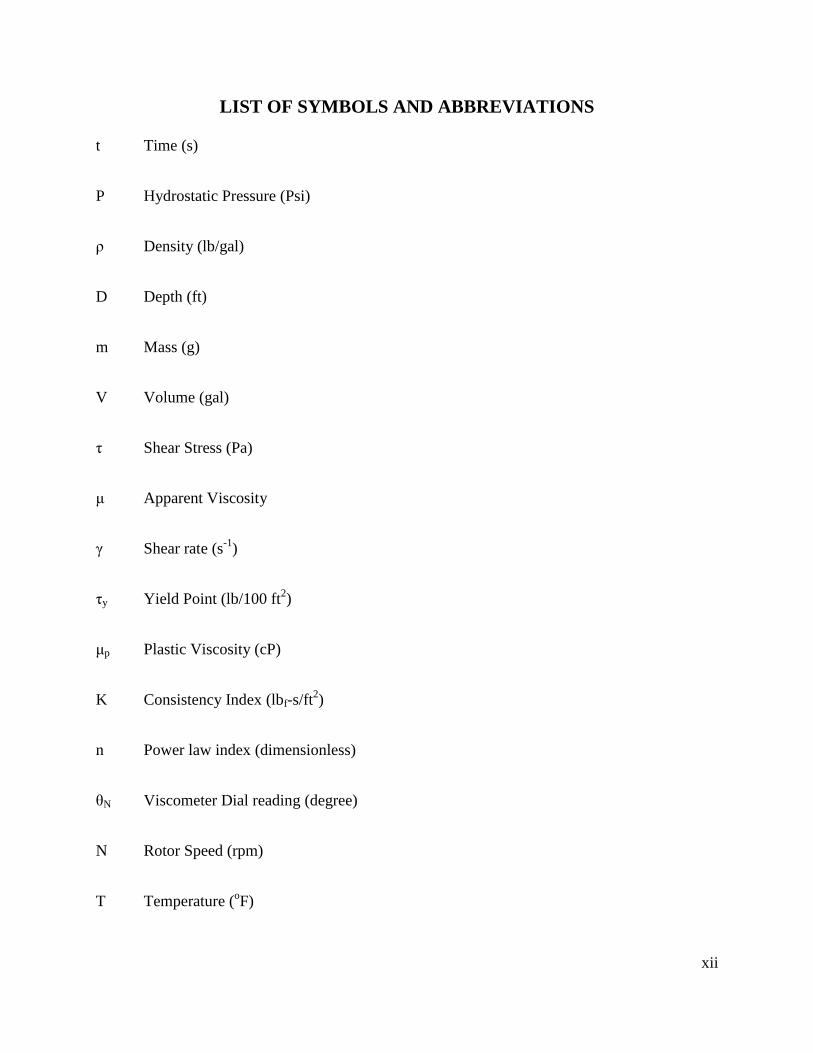
LIST OF SYMBOLS AND ABBREVIATIONS
t Time (s)
P Hydrostatic Pressure (Psi)
ρ Density (lb/gal)
D Depth (ft)
m Mass (g)
V Volume (gal)
τ Shear Stress (Pa)
μ Apparent Viscosity
γ Shear rate (s-1
)
τy Yield Point (lb/100 ft2)
μp Plastic Viscosity (cP)
K Consistency Index (lbf-s/ft2)
n Power law index (dimensionless)
θN Viscometer Dial reading (degree)
N Rotor Speed (rpm)
T Temperature (oF)
xiii
ACKNOWLEDGEMENTS
I would like to express my gratitude to Dr. Michael. J. Pegg for his guidance and support
throughout this work. I would also like to thank the entire Process Engineering Department staff
for their support and encouragement throughout the period of the project. I am also thankful to
Dr. George Jarjoura for his contributions; in straightening up of the project at end.
Furthermore, I am very grateful to Mr. Mumuni Amadu for his immense contributions to this
project; being it technical to moral support, he was always available to help.
xiv
ABSTRACT
Drilling fluids (muds) are complex fluids consisting of several additives. These additives are
added to enhance/control the rheological properties (such as density, viscosity, yield point and
gel strength) of the drilling mud. These properties are controlled for effective drilling of an oil or
gas well. Drilling muds are prepared using a great number of additives; however this project
work focused on only three mud additives: bentonite, barite and hematite. This study focused on
determining and comparing rheological properties of these mud additives. Barite (specific
gravity = 4.2 ~ 4.5) and hematite (specific gravity = 5) are density control additives, while
bentonite is a viscosifier.
In addition, corrosion characteristics of these mud additives were also compared. Coupons (4
no’s) of cold rolled steel grade A1008 were placed in each of the additive mud samples and then
were rolled in a rolling oven at 176oF; coupon samples were taken from each mud sample every
192h to observe the extent of corrosion. The fractional weight loss of coupons was determined
and compared for each of the additive mud samples.
Results indicate that hematite gives higher values for rheological parameters at the same
concentration as that of barite. Furthermore, barite gave a slightly higher average corrosion rate
than hematite and bentonite, but the differences in corrosion rate is very small. It can be
contemplated that the corrosion rates of the hematite, bentonite and barite are at same level.
Results also indicate that the observed weight loss was caused primarily due to erosion
corrosion, which can be attributed to the particle size of the mud additives.
1
CHAPTER 1 INTRODUCTION
Drilling fluids (muds) are complex heterogeneous fluids, consisting of several additives that
were employed in drilling of oil and natural gas wells since the early 1900. The original use of
the drilling fluids was to remove cuttings continuously. Progress in drilling engineering
demanded more sophistication from the drilling mud. In order to enhance the usage of drilling
fluids, numerous additives were introduced and a simple fluid became a complicated mixture of
liquids, solids and chemicals (Moore, 1974). As the drilling fluids evolved, their design changed
to have common characteristic features that aid in safe, economic and satisfactory completion of
a well. In addition, drilling fluids are also now required to perform following functions
(Growcock & Harvey, 2005; Darley & Gray, 1988)
Clean the rock formation beneath the bit for rock cuttings;
Transport these rock cuttings to surface through annulus;
Suspend cuttings in fluid if circulation is stopped;
Cool and clean the bit;
Manage formation pressure to maintain well-bore stability until the section of borehole
has been cased;
Assist in cementing and completion of well;
Seal the formation pores by forming low-permeability filter cake to prevent inflow of
formation fluids into the well;
Provide necessary hydraulic power to down-hole equipment;
Minimize reservoir damage;
2
Aid in collection and interpretation of data available through drill cuttings, cores, and
electrical logs;
Be favourable for freshly drilled bore hole’s integrity and assessment;
Minimise any damaging effects on the sub-surface equipment and piping;
Provide frictionless environment between the drilling string and the sides of the hole; and
Have minimum negative impact to the environment.
In order to ensure proper functionality of drilling fluid appropriate drilling fluid is selected, an
adequate understanding of the key factors governing the selection of the fluid is critical.
1.1 DRILLING FLUID SELECTION
Drilling engineers select specific drilling fluid with most favourable properties for the job. Most
of the drilling fluid functions are controlled by its rheological properties. A drilling fluid
specialist or a “Mud Engineer” is often on site to maintain and revaluate these properties as
drilling proceeds. The main factors governing the selection of drilling fluids are;
The types of formation to be drilled;
The range of temperatures; and
Strength, permeability and pore fluids pressure exhibited by the formation.
While, in addition to the above, selection of the drilling fluid can be informed through
consideration of other factors such as - production concerns, environmental impact, safety and
3
logistics, the most important factor that governs selection of drilling fluid is the “overall well
cost”.
1.2 RHEOLOGY OF DRILLING FLUID
Rheology is the study of the deformation of fluids and flow of matter. Its importance is
recognised in the analysis of fluid flow velocity profiles, fluid viscosity (marsh funnel viscosity,
apparent viscosity and plastic viscosity), friction pressure losses and annular borehole cleaning.
Rheological properties are basis for all analysis of well bore hydraulics and to assess the
functionality of the mud system. Rheological characteristics of drilling mud also include yield
point and gel strength. Rheological properties (such as density, viscosity, gel strength etc.) are
tested throughout the drilling operations. It is critical to control and maintain rheological
properties as a failure to do so can result in financial and loss of time, and in extreme cases, it
could result in the abandonment of the well (Darley & Gray, 1988). Besides rheological other
tests such as filtration tests, pH, chemical analysis (alkalinity and lime content, chloride, calcium,
etc.), resistivity are conducted throughout drilling process.
1.3 DRILLING FLUID ADDITIVES
To match the requirements of different depth intervals, the properties for drilling fluids are
modified using various additives for the drilling process. Properties such as density, flow
properties or rheology, filtration and solid content as well as chemical properties must be
accurately measured, controlled and appropriately maintained at their pre-selected level
throughout drilling process.
4
Additives commonly used in drilling muds are broadly classified into
Viscosifiers;
Viscosity reducers;
Weighting materials;
Fluid-loss reducers;
Emulsifiers;
Lost circulation materials;
Flocculants;
Corrosion control chemicals;
Defoamers; and
pH control additives.
A detailed description of each is presented in next chapter.
1.4 CLASSIFICATION OF DRILLING FLUIDS
Physical and chemical properties of the drilling fluids largely depend on the type of solids in the
mud. These solids are categorized as either active or inactive solids. The active solids are those
that react with water phase and the dissolved chemicals. On the other hand, the inactive solids
are those that do not react with the water and chemical to a significant degree (Bourgoyne Jr.,
Millheim, Chenevert, & Young Jr., 1986; Azar & Samuel, 2007). Some examples of the inactive
solids include - Barite and Hematite, these are added to drilling fluids as weighing agents.
5
Examples of inactive fluids include - clays, polymers and other chemicals, which are viscosity
enhancers.
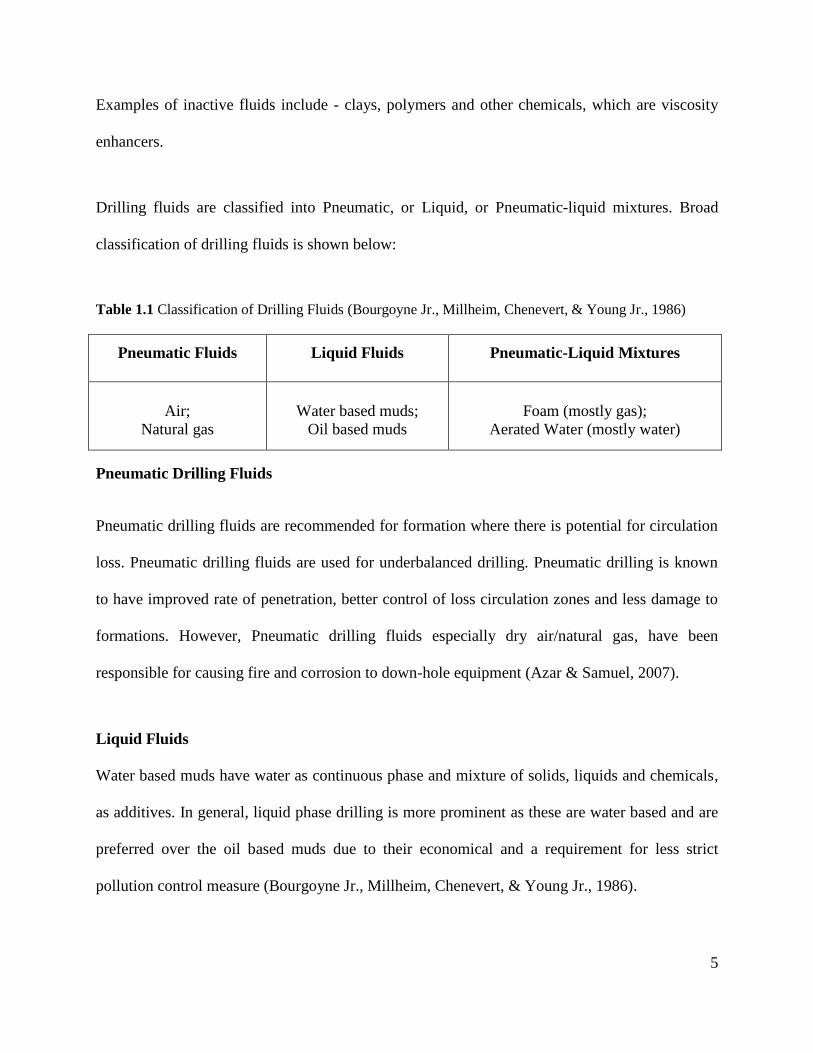
Drilling fluids are classified into Pneumatic, or Liquid, or Pneumatic-liquid mixtures. Broad
classification of drilling fluids is shown below:
Table 1.1 Classification of Drilling Fluids (Bourgoyne Jr., Millheim, Chenevert, & Young Jr., 1986)
Pneumatic Fluids Liquid Fluids Pneumatic-Liquid Mixtures
Air;
Natural gas
Water based muds;
Oil based muds
Foam (mostly gas);
Aerated Water (mostly water)
Pneumatic Drilling Fluids
Pneumatic drilling fluids are recommended for formation where there is potential for circulation
loss. Pneumatic drilling fluids are used for underbalanced drilling. Pneumatic drilling is known
to have improved rate of penetration, better control of loss circulation zones and less damage to
formations. However, Pneumatic drilling fluids especially dry air/natural gas, have been
responsible for causing fire and corrosion to down-hole equipment (Azar & Samuel, 2007).
Liquid Fluids
Water based muds have water as continuous phase and mixture of solids, liquids and chemicals,
as additives. In general, liquid phase drilling is more prominent as these are water based and are
preferred over the oil based muds due to their economical and a requirement for less strict
pollution control measure (Bourgoyne Jr., Millheim, Chenevert, & Young Jr., 1986).
6
Oil Based Drilling Muds
Oil based drilling muds have liquids phase as oil (diesel, mineral or synthetics). All solids in oil
based muds are considered inactive as they do not react with oil. Oil based muds are highly
temperature-stable fluids. However, use of oil based muds requires strict safeguards for
environmental protection and safety. Oil based muds are preferred for high temperature
formations, water sensitive shale’s, thick salt sections and low-pore-pressure formations.
1.5 CORROSION IN DRILLING
Corrosion is the degradation of metal due to reaction with its environment. Metal degradation is
implied by deterioration of physical properties of metal, it can either be loss of weight, corrosion
fatigue or stress corrosion cracking. Oxford Jr. and Foss (1958) classified corrosion in oil and
gas industry into following types
1. Sweet corrosion;
2. Sour corrosion;
3. Oxygen corrosion; and
4. Electrochemical corrosion.
Corrosion costs billions of dollars to the industry every year, some of which is avoidable. Cron
and Marsh (1983) stated that cost of corrosion in the US was $70 billion (approx.), of which $10
billion was considerably avoidable. According to the 2002 U.S. corrosion study, the direct cost
of metallic corrosion is $276 billion on an annual basis (Koch, Brongers, Virmani, & Payer,
2002).
7
1.6 PROJECT OBJECTIVE AND SCOPE
The objectives of this project work were to:
1. Determine effects on the rheology of drilling mud due to increase in concentration of
mud additives using three mud additives; Wyoming bentonite, barite and hematite.
2. Determine the corrosion contribution of these mud additives towards weight loss of steel
coupons.
3. Compare finding to Adeaga (2010)
The scope of this project is limited to water based muds only.
8
CHAPTER 2 LITERATURE REVIEW
Drilling engineering is one of the challenging disciplines in the petroleum industry. Significant
advancements have been made in past decades which have allowed the petroleum industry
worldwide to economically and successfully exploit underground reverses that were not been
possible before. Considerable research studies have been done in drilling fluid technology to
understand drilling fluid properties for successful and economical completion of an oil well. The
cost of the drilling fluid itself is relatively small, but the maintenance of the right properties
while drilling profoundly influence total well costs. American Petroleum Institute has a
recommended practice for testing liquid drilling fluid properties; regular interval testing of
drilling fluid properties help mud engineers determine proper functioning of drilling fluid.
Bourgoyne Jr. (1986) mentioned that drilling fluid is related directly or indirectly to most of
drilling problems.
2.1 DRILLING MUD DIAGNOSTICS TEST
Diagnostic testing of drilling mud is not limited to type of drilling mud for each hole interval but
also to properties of such muds; density, rheology (flow properties), filtration and solid content,
as well as chemical properties. Mud properties are field controlled and properly maintained at
their preselected values; to avoid drilling problems.
RHEOLOGY: VISCOSITY, YIELD POINT AND GEL STRENGTH
Rheology is the study of deformation of all forms of matter but its greatest development has been
in study of the flow behaviour of fluids through conduits and pipes. Drilling fluids are classified
9
into two major groups: Newtonian fluids where viscosity, µ, is independent of shear rate where
as non-Newtonian fluids, viscosity is function of shear rate µ = µ (γ). Viscosity measures the
resistance to flow. Excessive viscosity is undesirable because of the pressures that can be
generated by higher viscosity in the borehole when pumping horizontally.
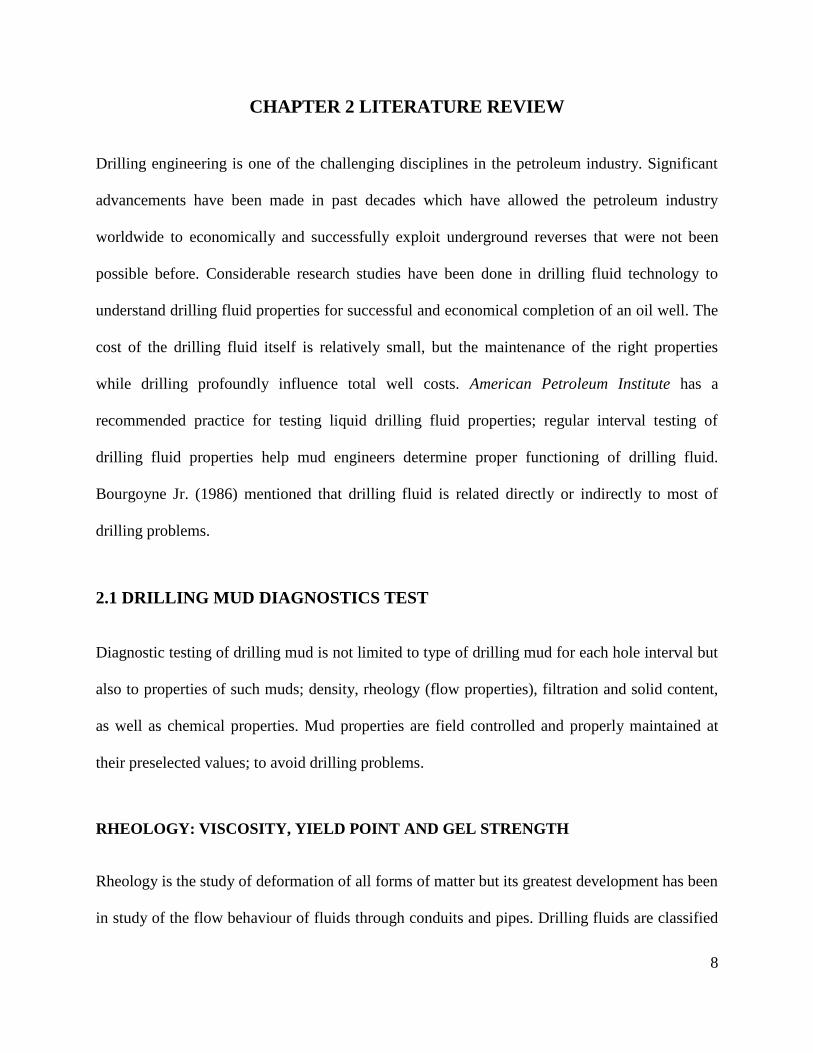
Newtonian fluids are those whose flow behaviour can be fully described by a single term called
the Newtonian viscosity, µ. For these fluids, examples of which include water and light oil, the
shear stress (τ; force per unit area) is directly proportional to the shear rate (γ; in time−1), see fig.
2.1. This implies if the shear stress is doubled, the shear rate is also doubled and vice versa. The
rheological equation is given as
(2.1)
The equation shows that fluid begin to flow as soon as a shearing force is applied. The fraction,
is constant at constant temperature and pressure and is called the dynamic viscosity of
the fluid expressed in poise or centipoise (cP); 1 cP = 0.001 kg/m∙s (Bourgoyne Jr., Millheim,
Chenevert, & Young Jr., 1986).
Non-Newtonian fluids are those whose viscous
properties cannot be described by a single term.
Rather the viscous properties are approximated to
behave in accordance with one of the following
assumed models; Bingham Plastic; Power law Figure 2.1 Shear rate-shear stress
relationship of Newtonian fluids (Azar &
Samuel, 2007)
10
models or Herschel–Bulkley (HB) Model.
Moreover, Non-Newtonian fluids exhibit shear rate dependency; if the apparent viscosity
decreases with increasing shear rate they are called pseudo-plastic fluids and if the apparent
viscosity increases with increasing shear rate they are referred to as dilatant fluids. Bourgoyne
(1986) mentioned that if fluid behaviour is shear-time dependent then they could be classified
into thixotropic, if apparent viscosity decrease with time after shear rate is increased to new
constant values; and rheopectic, if apparent viscosity increases with time after shear rate is
increased to a new constant value.
Bingham (1922) initially recognized plastic fluids; therefore they are referred to as Bingham
plastics fluids; which are distinguished from Newtonian fluids as they require a finite stress to
initiate flow. Bingham Plastic fluids, do not flow until the applied shear stress τ, exceeds a
certain minimum value (τy) known as the yield point. Once the yield point has been exceeded,
changes in shear stress are proportional to changes in shear rate and the constant of
proportionality is called plastic viscosity (µp) (Clark, 1995). Bingham plastic fluids flow
behaviour for laminar flow is described by following equation:
(2.2)
Plastic Viscosity is part of the flow resistance of the fluid caused by mechanical friction within
the fluid. This friction is due to interaction of individual solid particles, the interaction between
solid and liquid particles and the deformation of the liquid particles under shear stress. Units for
plastic viscosity are the same as of Newtonian viscosity, i.e. poise or centipoise. Yield Point is
11
also part of flow resistance of fluid caused by electrochemical forces within the fluid (Azar &
Samuel, 2007). Yield point is expressed in units of dynes per square centimetre, or in field units
of pounds per 100 square feet. The Bingham Plastic model is used as a standard viscosity model
all over the industry. However, Bingham Plastic model overvalues the low shear-rate viscosity
for most drilling fluids (Growcock & Harvey, 2005). The Power Law model or the Ostwald de
Waele model is also characterized by two parameters like Bingham plastic fluids. The Power
Law model can be expressed as follows:
(2.3)
Parameter K is termed as the consistency and n as the flow behaviour index. The Power Law
model underestimates the low-shear-rate viscosity. In this model, the value of shear stress (τ) at
zero shear-rate (γ) is always zero. Herschel-Bulkley (1926) invented a model to alleviate this
problem at low shear-rates. Herschel-Bulkley fluid model is a hybrid between the Power Law
and Bingham Plastic model and is fundamentally the Power Law model with a yield stress
(Growcock & Harvey, 2005). Herschel-Bulkley model is expressed as following:
(2.4)
Herschel-Bulkley model is sometimes also referred to as generalized plastic model, when n=1, k
become the plastic viscosity and the equation reduces to Bingham plastic model or when
the equation reduces to power law model. Maglione, Robotti & Romagnoli (2000) mentioned
that Herschel-Bulkley fluid model can be applied to determine the characteristic parameters a
drilling fluid.
12
Figure 2.2 Basic Shear diagram depicting typical fluid behaviour for real fluids (Brodkey &
Hershey, 1988)
VISCOSITY FIELD MEASUREMENT
Fann rotational viscometer is the common field equipment used for determining mud rheological
properties. In viscometer mud is subjected to constant shear rate between an inner bob and an
outer rotating sleeve. The numerical values of the mud properties obtained using this equipment
are Plastic Viscosity, the Yield Point or Yield Stress and the 10 sec to 10 min gel strengths. This
equipment can be operated at six standard speeds (600, 300, 200, 100, 6 and 3 rpm) setting. The
dimensions of the rotor and bob are selected such that dial reading equals the apparent
Newtonian viscosity at rotor speed of 300 rpm. In terms of the viscometer dial reading, θN and
the rotational speed, N (in rpm), the mud properties are calculated using following expressions:
For a Newtonian Fluid ( ):
(2.5)
Where μ is the Newtonian or apparent viscosity in centipoises, and θN is the viscometer dial
reading at any rotational speed of N.
13
The plastic viscosity of the mud is usually obtained by
(2.6)
For N= 300, 600 rpm,
(2.7)
Where θ600, θ300 are the viscometer dial readings at N= 600 rpm and N= 300 rpm, respectively.
The yield point (τy) in unit’s lb/100 ft is obtained using
(2.8)
The gel strength in units lb./100 ft2, is measured by taking the maximum dial deflection when
the rotational viscometer is turned at low rotor speed (i.e. 3 rpm) after the mud has been static for
a period of time generally 10 seconds or 10 minutes.
VISCOSITY CONTROL ADDITIVES
Viscosity control additives are basically categorized as viscosifiers (viscosity enhancers) and
viscosity reducers. Bentonite (clay) is the most commonly used additive for increasing viscosity
of the drilling fluid. Clays are natural absorbent, their ability to swell and gel, make them perfect
viscosity enhancers. Bentonite when exposed to water attracts water to its negative face. This
unique characteristic allows bentonite to adsorb 7 to 10 times its own weight in water, and
swelling up to 18 times its dry volume. Wyoming Bentonite is the most common form of
14
viscosity enhancer used commercially. It is composed essentially of montmorillonite clay, also
known as hydrous silicate of alumina (Dyke, 2000). Several other viscosifiers commonly used
are asbestos, attapulgite and polymer (such as starch and carboxymethylcellulose).
Viscosity reducers are used to reduce viscosity and gel strength and to provide some fluid-loss
control. Commonly used viscosity reducers are phosphates, tannates and lignites. Viscosity
reducers are temperature dependent as their viscosity reducing properties have temperature
limitation. Phosphates generally are limited to a temperature environment of 150oF, whereas
lignites are stable in temperature up to 375oF (Azar & Samuel, 2007); (Fink, 2003).
DRILLING MUD DENSITY (WEIGHT)
Density of drilling mud is defined as weight per unit volume. It is expressed in field units as
pounds per gallon (lb/gal). Density of drilling mud is an important parameter which is controlled
during drilling operation. In order to prevent formation fluids to inflow into the well bore and to
seal the well bore with a thin, low-permeability filter cake; the density of drilling fluid must
exceed the pore pressure of the formation (Darley & Gray, 1988). However, the mud column
density should not be high enough to cause formation fracture. Numerous weighing agents can
be used to increase mud density to desired value using high specific gravity solid, such as barite,
hematite, galena, calcium carbonate, and ilmenite. Barite is most widely used weighing agent.
The hydrostatic pressure exerted by a static mud column depends on both the density and the
depth. The hydrostatic pressure at depth D, for a column of mud having density (ρ) is derived by
using following equation.
15
(2.9)
Where P = Hydrostatic pressure (psi)
ρ = Mud Density (lb/gal)
D = Depth (ft)
All materials present in mud contribute to its density. The resulting mud mixture from all the
additives and water is assumed to be ideal; hence the total volume is equal to sum of the
component volumes (Bourgoyne Jr., Millheim, Chenevert, & Young Jr., 1986).
(2.10)
Where, the volume Vi of given additives, having density ρi and sample mass of mi is given by
following equation
(2.11)
Hence, the resulting mud density can be computed using following expression
(2.12)
MUD WEIGHT FIELD MEASUREMENT
Mud balance is the most commonly used device to measure mud weight. Mud balance is a beam
balance with lidded mud cup on one end and a counterweight on the other end. Mud balance has
a graduated beam with slider weight which is adjusted to calculate the density of fluid filled in
16
mud cup. Density is noted, at the position of slider weight, when beam is level. Calibration is
done using a liquid of known density (often water) by adjusting the counter weight. If mud
sample has entrapped air/gas bubbles, the device does not give true mud weight of sample.
MUD WEIGHT CONTROL ADDITIVES
Mud weight control additives are high specific gravity substances that are added to the drilling
mud to increase its density. Barite, Hematite, Calcium carbonate and galena are commonly used
weighing additives. Barite is by far most widely used weighing agent in industry (Bourgoyne Jr.,
1986; Darley & Gray, 1988). Barite has API specific gravity of 4.2 ~ 4.5, which makes it
possible to increase mud weight up to 21 lb/gal. However barite is linked with “barite sag”
problem, in which there is an unwanted fluctuation in mud weight which is caused by suspension
of barite particles (Hanson, Trigg Jr., Rachal, & Zamora, 1990; McNerlin & Oakey, 2011).
Menzel (1973) and Haaland (1976) reported that iron oxides can be used as weighing agents in
drilling mud. Iron oxides have higher specific gravity 4.6 to 5.3 which permits smaller amounts
of material to give same mud density as compared to barite (Bourgoyne Jr., Millheim, Chenevert,
& Young Jr., 1986). Iron oxides also showed lesser contribution to steel coupon corrosion than
Barite (Haaland, Pettersen, & Tuntland, 1976). However use of Iron oxides has been limited due
to cost factor and availability.
2.2 FACTORS AFFECTING MUD PROPERTIES
Drilling fluids (muds) are complex mixtures of interacting components and their properties
markedly change during drilling, with change in temperature and pressure, time, solid content,
17
rate of penetration, formation zone being drilled and so on. It’s significant to understand drilling
fluid properties changes to eliminate any drilling problems which may arise. Numerous studies
have been conducted to effectively understand change in fluid properties under down-hole
conditions.
One of these studies reported that major cause of flocculation, is a process wherein colloids come
out of suspension, in drilling mud was high temperature (Annis & ESSO, 1967). Flocculation
causes variation in drilling mud properties; it results in high yield point at low shear rate and
high viscosities at high gel strengths. Flocculated mud shows normal plastic viscosity but an
abnormally high yield point (Bourgoyne Jr., Millheim, Chenevert, & Young Jr., 1986).
Bourgoyne Jr. (1986) reported major cause of flocculation in drilling mud as high active solids,
high electrolyte concentration and high temperature. Annis and ESSO (1967) reported proper
treatment of mud with NaOH and ligmosulfonate reduces the effects of dispersion and
flocculation at high temperature. It was also reported that if temperature of the mud is not
excessive then the cause of flocculation is probably a high electrolyte concentration in the mud
(Bourgoyne Jr., Millheim, Chenevert, & Young Jr., 1986). Alderman (1988) reported that
rheological properties of drilling mud, under temperature of 130oC and pressure up to 1000 bar,
can be best fitted using three parameter HB power law for low temperature and high pressure
conditions. It was also reported that model behaviour of the continuous phase is weakly pressure
dependent and an exponential temperature dependent. The pressure dependence increased with
mud density. In all cases the fluid yield stress was essentially independent of pressure.
(Alderman, Gavignet, Guillot, & Maitland, 1988). Similarly Ali & Al-Marhoun (1990)
conducted an extensive research on the effects of temperature, pressure and aging on water based
18
muds, they reported that high pressure increases the values of the rheological properties of the
drilling fluids.
Aging of drilling mud also affects mud properties. Aging tests are conducted to determine how
bottom-hole conditions affect mud properties. Aged drilling mud samples are obtained after
samples have been put in a hot rolling oven in a sealed aging cell for desired period of time.
Aged mud samples (before stirring) are tested for shear strength which determines gelling
tendencies of fluid in the borehole. Setting of mud solid in an aged mud indicates formation of a
layer (hard/soft) of sediment in the borehole (Lyons & Plisga, 2005). After stirring aged mud
sample their rheological properties are determined. It was reported by Ali and Al-Marhoun
(1990) that effective viscosity, plastic viscosity, yield point and gel strengths (10 sec. and 10
min.) of aged mud sample increase with the increase in aging time and vice-versa. It was also
observed in study that shear stress at a given shear rate increases with increase in aging time.
Solids in drilling mud are classified into active solids and inert solids (as mentioned in chapter
1). Inert solids are undesirable in drilling mud as they increase frictional pressure drop in fluid
flow but do not greatly alter the ability to carry the rock cutting to the surface. Also filter cake
formed by these solids is thick and permeable which cause many drilling problem. Inert solids
have been found reason for problems such as stuck pipe, excessive pipe torque and drag, loss of
circulation and poor cement bonding to the formation (Bourgoyne Jr., Millheim, Chenevert, &
Young Jr., 1986). Low solid content in mud has proven to provide better control and faster rate
of penetration of drill bit in most areas of operations. However higher rate of penetration increase
mud weight rapidly unless mechanical solids removal equipment is used and sufficient water is
19
added to the system. Low solid content has also been advantageous for longer bit and pump life.
(Azar & Samuel, 2007).
Drilling fluid’s physical and chemical compatibility with the rock formation is important. It is
widely known that while drilling in fractured formations there is significant mud loss. Drilling
fluid’s invasion of fractured zone has caused severe problems in the past. Industry recently
started monitoring mud loses in order to identify the fractured zones. Mathematical modelling of
these fractured formations is being done in order to describe the physical phenomenon and the
mechanism under which the flow within the fractures will take place, so that causes of the
problem and methods to minimize it could be determined (Majidi, Miska, Yu, Thompson, &
Zhang, 2008). Wenwu & Stephens (2011) reported that particle size could limit fluid loss to
formation and minimize solid plugging in reservoir pores. It was also reported that optimization
of drilling fluid could be achieved by distribution of bridging particle sizes. However, a
combination of pore size, fluid property, and filter cake quality considerations will be needed to
achieve the most effective particle size distribution.
2.3 CORROSION PROBLEM IN DRILLING
Corrosion is the cause of various forms of drill string failures. Corrosion collectively with
mechanical cyclic loading causes corrosion fatigue which results in major drill string premature
failure. It is an extreme cause of concern for those in drilling business. The cost implication of
corrosion during drilling operation is significant. It is important to prevent and understand
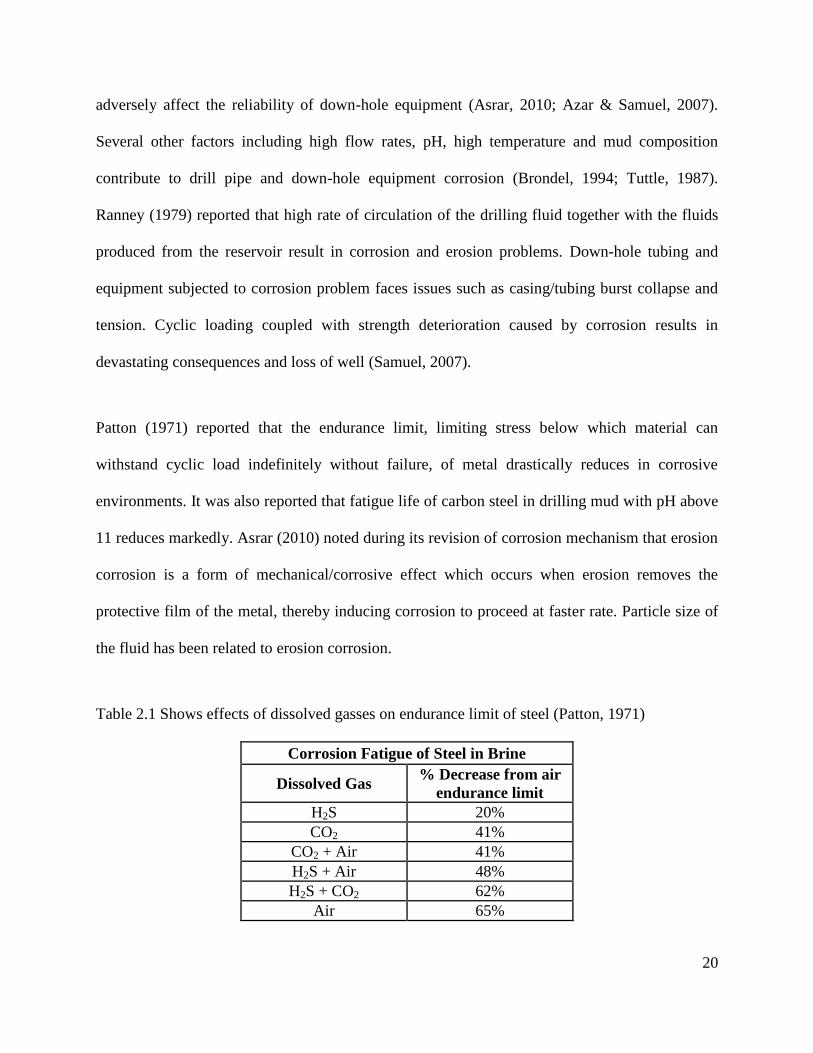
fundamentals of corrosion (Patton, 1974).It has also been shown that the presence of dissolved
gasses such as O2, CO2, H2S and Cl-, in drilling muds exacerbate the corrosion problem and
20
adversely affect the reliability of down-hole equipment (Asrar, 2010; Azar & Samuel, 2007).
Several other factors including high flow rates, pH, high temperature and mud composition
contribute to drill pipe and down-hole equipment corrosion (Brondel, 1994; Tuttle, 1987).
Ranney (1979) reported that high rate of circulation of the drilling fluid together with the fluids
produced from the reservoir result in corrosion and erosion problems. Down-hole tubing and
equipment subjected to corrosion problem faces issues such as casing/tubing burst collapse and
tension. Cyclic loading coupled with strength deterioration caused by corrosion results in
devastating consequences and loss of well (Samuel, 2007).
Patton (1971) reported that the endurance limit, limiting stress below which material can
withstand cyclic load indefinitely without failure, of metal drastically reduces in corrosive
environments. It was also reported that fatigue life of carbon steel in drilling mud with pH above
11 reduces markedly. Asrar (2010) noted during its revision of corrosion mechanism that erosion
corrosion is a form of mechanical/corrosive effect which occurs when erosion removes the
protective film of the metal, thereby inducing corrosion to proceed at faster rate. Particle size of
the fluid has been related to erosion corrosion.
Table 2.1 Shows effects of dissolved gasses on endurance limit of steel (Patton, 1971)
Corrosion Fatigue of Steel in Brine
Dissolved Gas % Decrease from air
endurance limit
H2S 20%
CO2 41%
CO2 + Air 41%
H2S + Air 48%
H2S + CO2 62%
Air 65%
21
Several approaches for corrosion prevention are being employed in drilling operation. Both field
experience and published data have suggested that extending corrosion fatigue life of metal to be
more beneficial than preventing metal loss. Higher strength carbon steel or low alloy steels with
better fatigue life can be used to combat corrosion. However, use of such material is limited due
financial burden and economic justification. So conventional techniques are widely utilized for
corrosion prevention but not limited to methods such as; coating, neutralizing the corrodent,
using corrosion inhibitors, and mud de-aeration techniques (Patton, Corrosion Control in Drilling
Operations, 1974).It is also prominent in industry to adjust mud properties to favour drilling
equipment and decrease corrosion rates. Mud pH values are adjusted (between 9.5-10.5; higher
than 10.5 if H2S is anticipated) by adding alkaline material to mud, commonly NaOH.
22
CHAPTER 3 EXPERIMENTAL
The purpose of this experiment was to investigate the effects of additives on rheological
properties of drilling mud and corrosion of steel coupons. The experimental work for this project
was divided into 2 parts. The first part focused on the effect of the additives on the rheological
properties of the drilling mud and second part focused on the effect of additives on the corrosion
of steel coupons. All mud samples were prepared in the order of addition was deionised water to
bentonite followed by the addition of additive and thorough mixing using a variable speed mixer.
3.1 METHODOLOGY
This section outlines methodologies used to determine effects of mud additives on rheology of
drilling mud and corrosion of steel coupons.
RHEOLOGY METHODOLOGY
Base mud sample, containing only water and bentonite clay, was prepared by adding 32 g of
bentonite to 400 g of water to obtain a bentonite mass fraction of 7.41% and a bentonite-to-water
ratio of 8%. This mud sample was named “mud A”. The bentonite-to-water ratio was maintained
constant for all subsequent mud samples used in this project work. The rheological properties of
“mud A” were measured and recorded. Other mud samples with varying additive concentrations
were prepared and their rheological properties were measured and recorded. All rheological
properties were measured at ambient conditions (at 75oF).
23
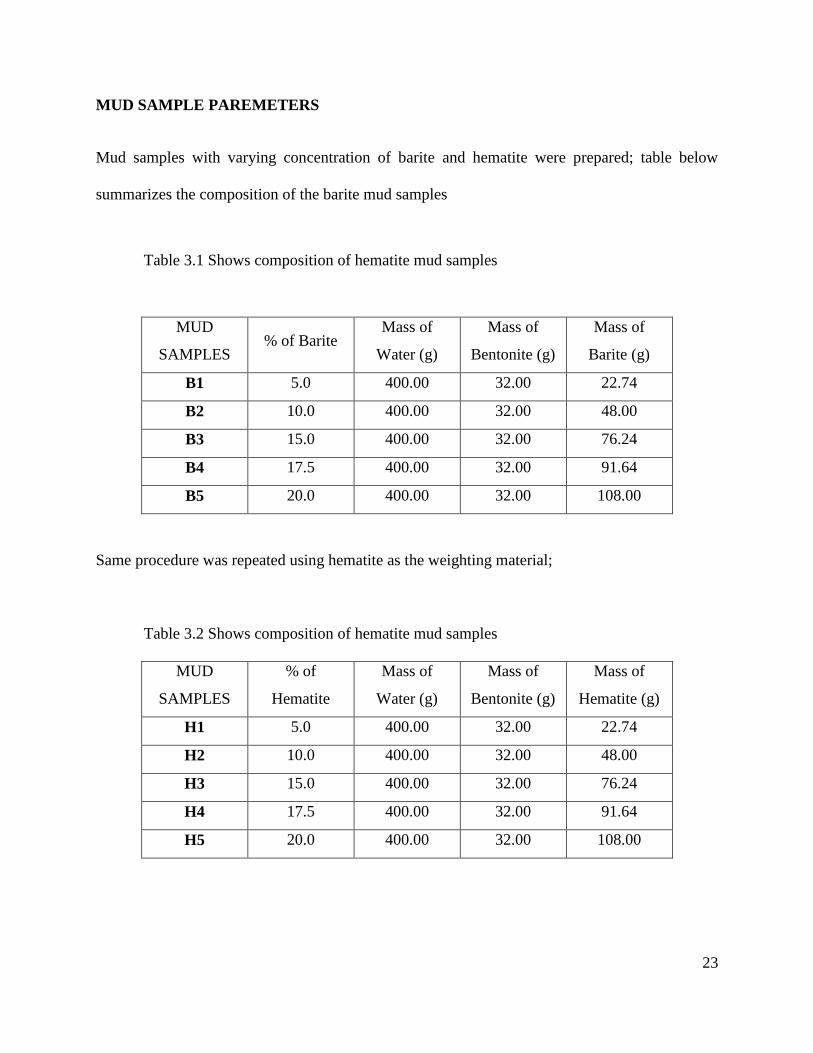
MUD SAMPLE PAREMETERS
Mud samples with varying concentration of barite and hematite were prepared; table below
summarizes the composition of the barite mud samples
Table 3.1 Shows composition of hematite mud samples
MUD
SAMPLES % of Barite
Mass of
Water (g)
Mass of
Bentonite (g)
Mass of
Barite (g)
B1 5.0 400.00 32.00 22.74
B2 10.0 400.00 32.00 48.00
B3 15.0 400.00 32.00 76.24
B4 17.5 400.00 32.00 91.64
B5 20.0 400.00 32.00 108.00
Same procedure was repeated using hematite as the weighting material;
Table 3.2 Shows composition of hematite mud samples
MUD
SAMPLES
% of
Hematite
Mass of
Water (g)
Mass of
Bentonite (g)
Mass of
Hematite (g)
H1 5.0 400.00 32.00 22.74
H2 10.0 400.00 32.00 48.00
H3 15.0 400.00 32.00 76.24
H4 17.5 400.00 32.00 91.64
H5 20.0 400.00 32.00 108.00
24
CORROSION TEST METHODOLOGY
MUD SAMPLE PARAMETERS
Three mud samples were used in this part of the project work, with each mud sample containing
one of the two additives while the last sample served as the control mud with none of the
additives. Sodium hydroxide (NaOH) was used to adjust the pH of mud samples to ensure that
each sample has same pH value of 10.5. Both barite mud sample (mud Bc) and hematite mud
sample (mud Hc) were prepared to have the same density of 9.5 lb/gal. The composition of the
mud samples are as following
Table 3.3 Shows mud samples composition for corrosion test
MUD
SAMPLE
Mass of water
(g)
Mass of
Bentonite (g)
Mass of
NaOH (g)
Mass of
Barite (g)
Mass of
Hematite (g)
Ac 375.00 30.00 0.20 - -
Bc 375.00 30.00 0.59 65.00 -
Hc 375.00 30.00 0.59 - 55.00
25
EXPERIMENTAL PROCEDURE
An experimental procedure was developed with the purpose of studying effects of additives on
corrosion of steel coupons:
Fourteen steel coupons (cold rolled steel grade A1008), of size 1inch by 1nch, were
labelled according to mud in which they were to be placed. Coupons A1 to A4 were
placed in control mud sample (Ac). B1 to B4 were placed in barite mud sample (Bc). H1 to
H4 were placed in hematite mud sample (Hc).
Coupons were treated with absolute ethanol followed by acetone to degrease them. Then
the coupons were washed with deionised water followed by drying.
Weight of each coupon was recorded accurately using a minimum air disturbance
weighing scale.
Mud samples prepared were thoroughly mixed to release dissolved gases; 200 ml of each
mud sample was placed in a 260 ml capacity high temperature aging cell.
The aging cells were then loaded in a roller oven and time noted. The roller oven was
operated at 50 rpm and the temperature maintained at 176oF (80
oC) throughout the
project work.
After 8 days (192 h), a coupon was taken from each aging cell and the cells immediately
returned to the oven with the remaining three coupons. The coupon was then washed with
deionised water, then in 15% hcl to remove the corrosion products, and finally rinsed
with deionised water. The coupons were then dried and weighted to obtain the new mass.
The above step was repeated after 16, 24 and 32 days.
26
3.2 EQUIPMENT USED
This section enlists all the equipment used for this experimental work
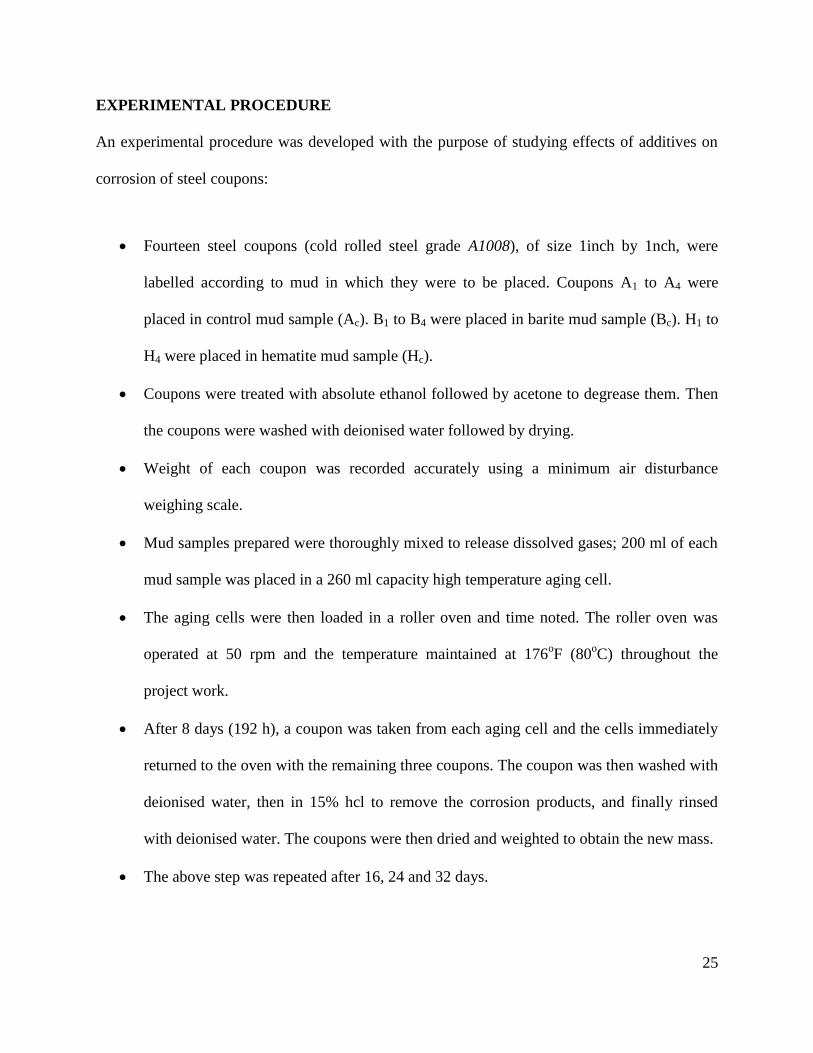
Viscometer: Fann viscometer (Model 35A) was used to determine viscosity of the mud
samples. The Fann rotational viscometer was calibrated as described in manual before being
used for this project work.
Figure 3.1 Viscometer
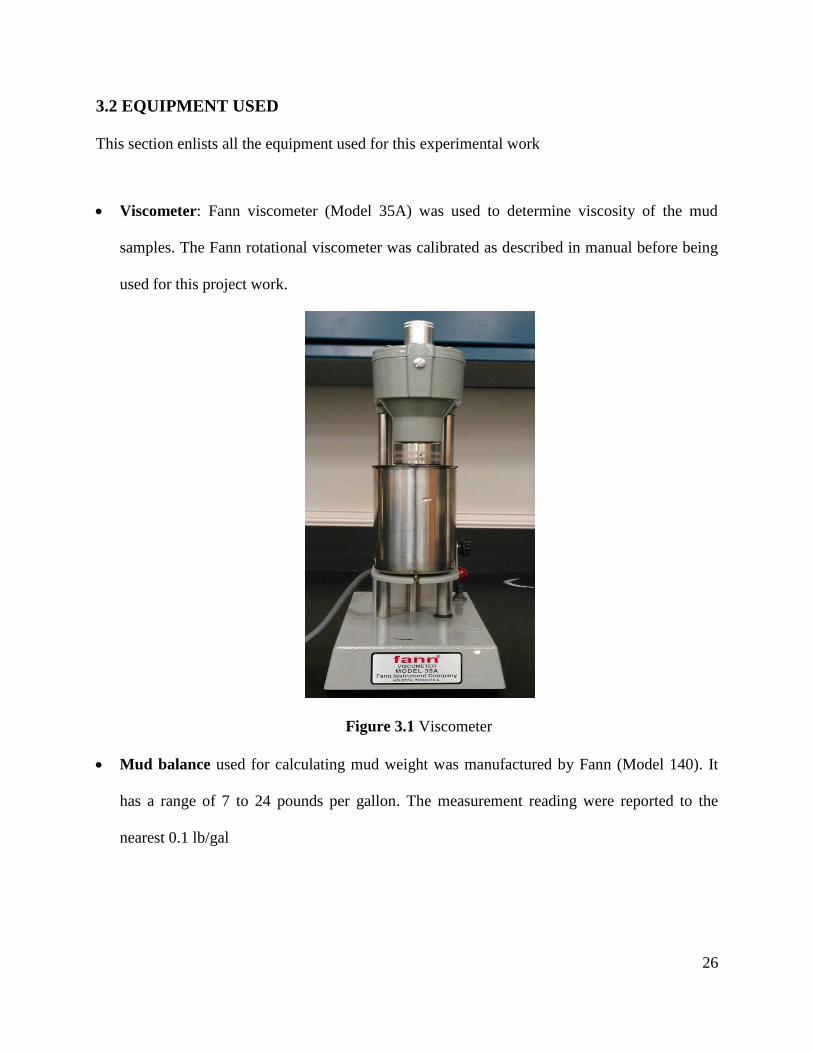
Mud balance used for calculating mud weight was manufactured by Fann (Model 140). It
has a range of 7 to 24 pounds per gallon. The measurement reading were reported to the
nearest 0.1 lb/gal
27
Figure 3.2 Mud balance
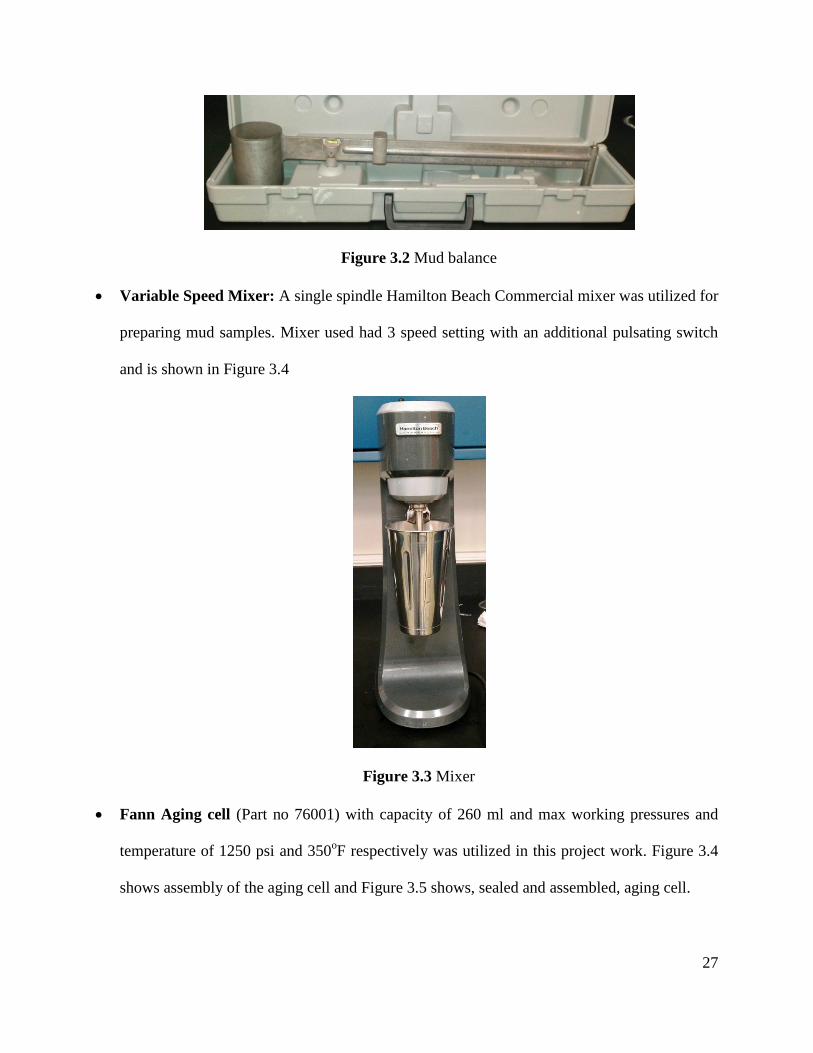
Variable Speed Mixer: A single spindle Hamilton Beach Commercial mixer was utilized for
preparing mud samples. Mixer used had 3 speed setting with an additional pulsating switch
and is shown in Figure 3.4
Figure 3.3 Mixer
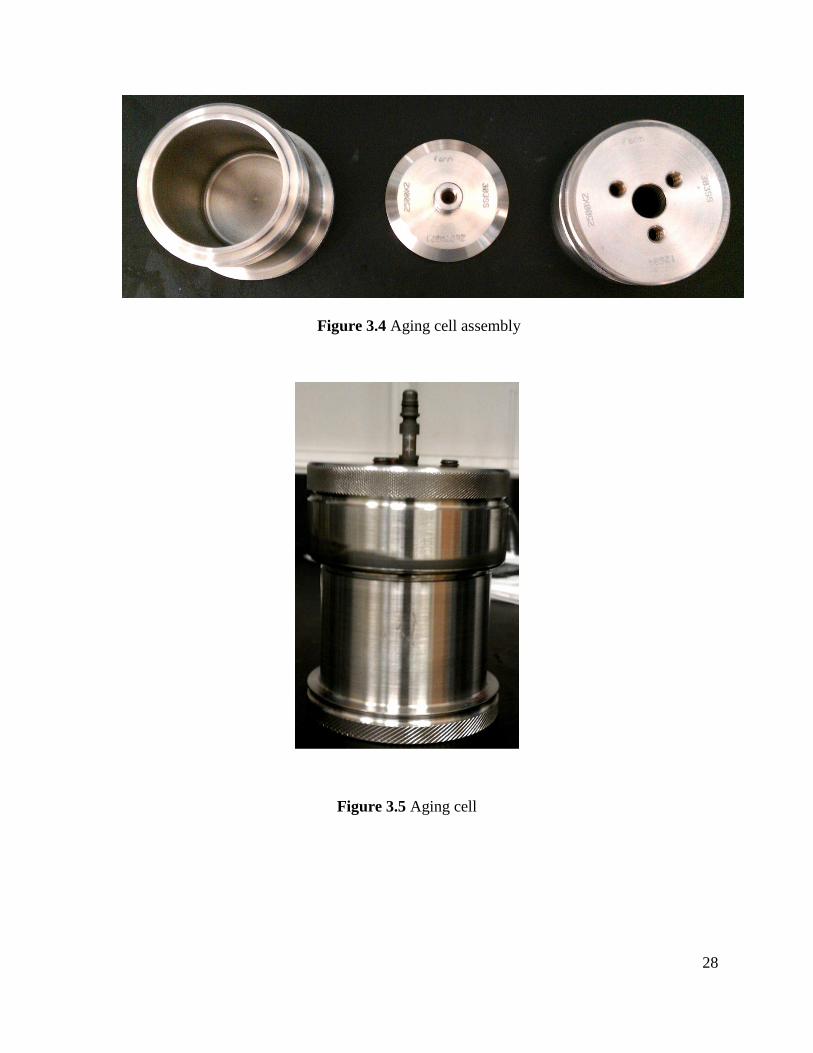
Fann Aging cell (Part no 76001) with capacity of 260 ml and max working pressures and
temperature of 1250 psi and 350oF respectively was utilized in this project work. Figure 3.4
shows assembly of the aging cell and Figure 3.5 shows, sealed and assembled, aging cell.
28
Figure 3.4 Aging cell assembly
Figure 3.5 Aging cell
29
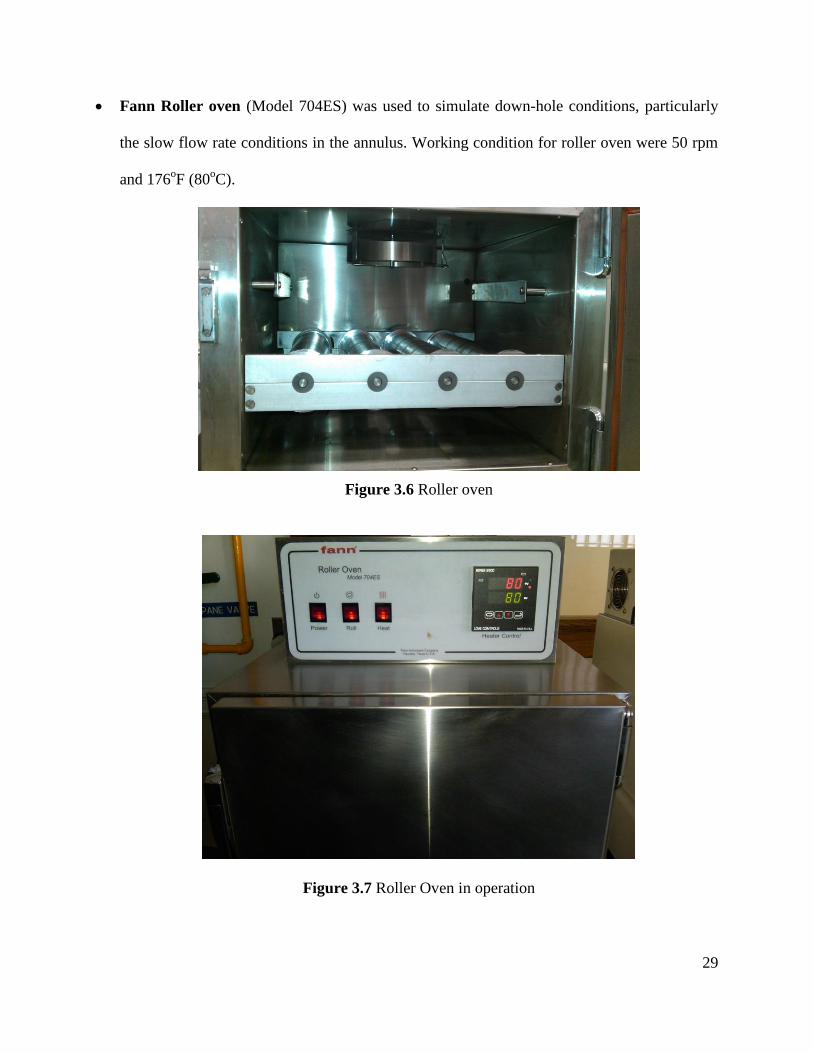
Fann Roller oven (Model 704ES) was used to simulate down-hole conditions, particularly
the slow flow rate conditions in the annulus. Working condition for roller oven were 50 rpm
and 176oF (80
oC).
Figure 3.6 Roller oven
Figure 3.7 Roller Oven in operation
30
CHAPTER 4 RESULTS
4.1 RHEOLOGY TEST
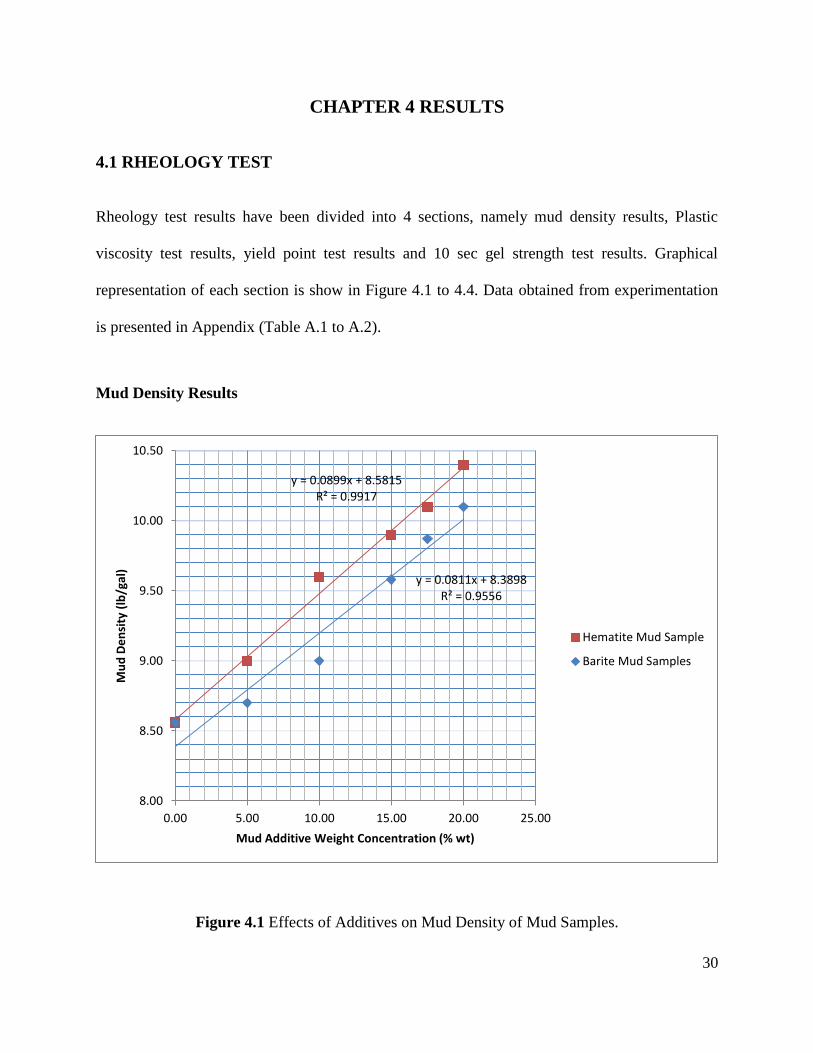
Rheology test results have been divided into 4 sections, namely mud density results, Plastic
viscosity test results, yield point test results and 10 sec gel strength test results. Graphical
representation of each section is show in Figure 4.1 to 4.4. Data obtained from experimentation
is presented in Appendix (Table A.1 to A.2).
Mud Density Results
Figure 4.1 Effects of Additives on Mud Density of Mud Samples.
y = 0.0899x + 8.5815 R² = 0.9917
y = 0.0811x + 8.3898 R² = 0.9556
8.00
8.50
9.00
9.50
10.00
10.50
0.00 5.00 10.00 15.00 20.00 25.00
Mu
d D
en
sity
(lb
/gal
)
Mud Additive Weight Concentration (% wt)
Hematite Mud Sample
Barite Mud Samples
31
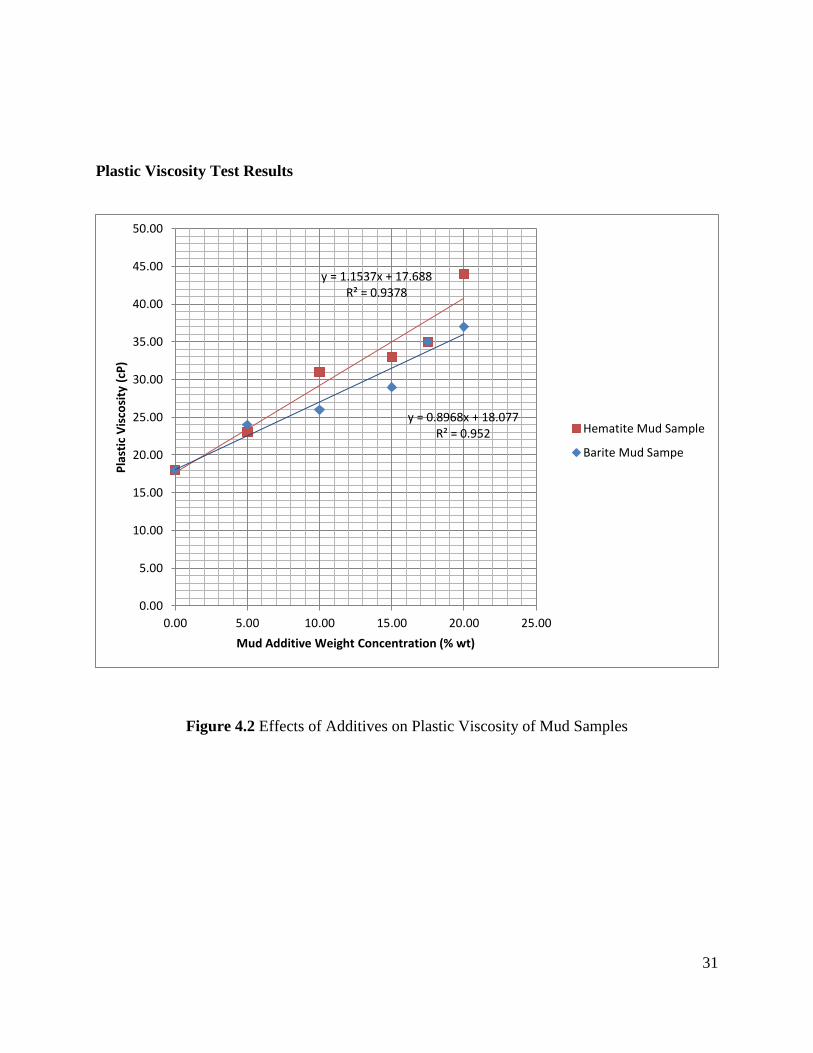
Plastic Viscosity Test Results
Figure 4.2 Effects of Additives on Plastic Viscosity of Mud Samples
y = 1.1537x + 17.688 R² = 0.9378
y = 0.8968x + 18.077 R² = 0.952
0.00
5.00
10.00
15.00
20.00
25.00
30.00
35.00
40.00
45.00
50.00
0.00 5.00 10.00 15.00 20.00 25.00
Pla
stic
Vis
cosi
ty (
cP)
Mud Additive Weight Concentration (% wt)
Hematite Mud Sample
Barite Mud Sampe
32
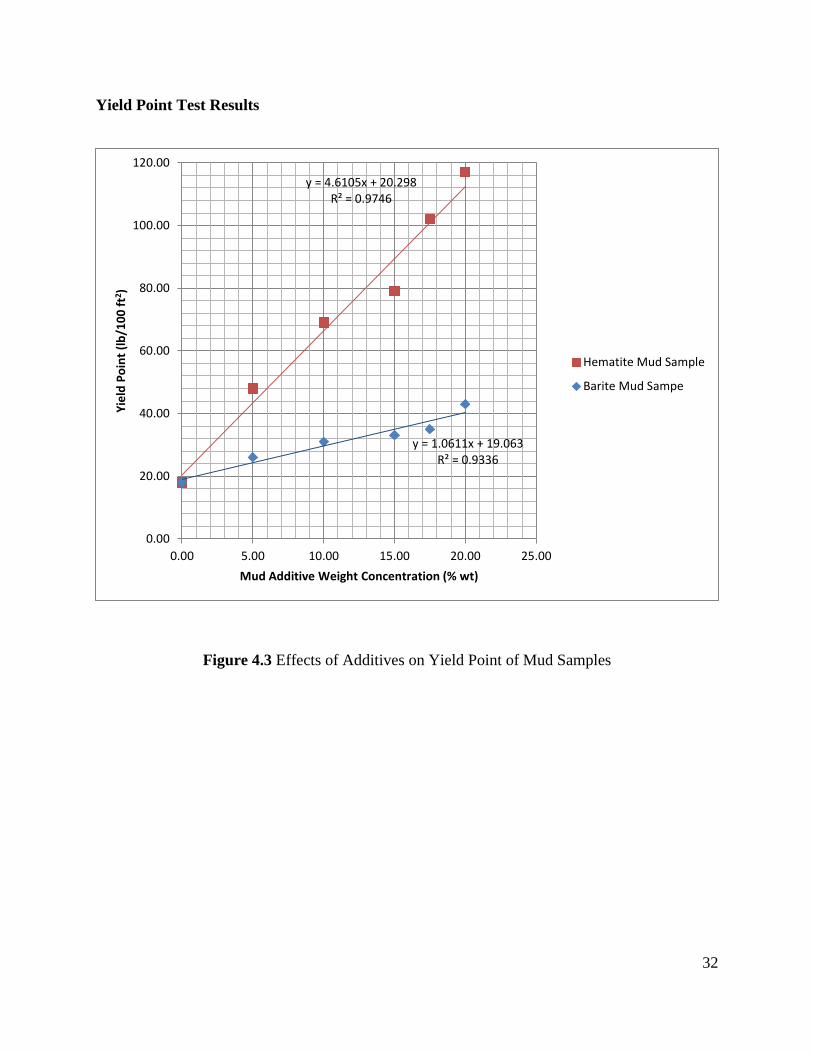
Yield Point Test Results
Figure 4.3 Effects of Additives on Yield Point of Mud Samples
y = 4.6105x + 20.298 R² = 0.9746
y = 1.0611x + 19.063 R² = 0.9336
0.00
20.00
40.00
60.00
80.00
100.00
120.00
0.00 5.00 10.00 15.00 20.00 25.00
Yie
ld P
oin
t (l
b/1
00
ft2
)
Mud Additive Weight Concentration (% wt)
Hematite Mud Sample
Barite Mud Sampe
33
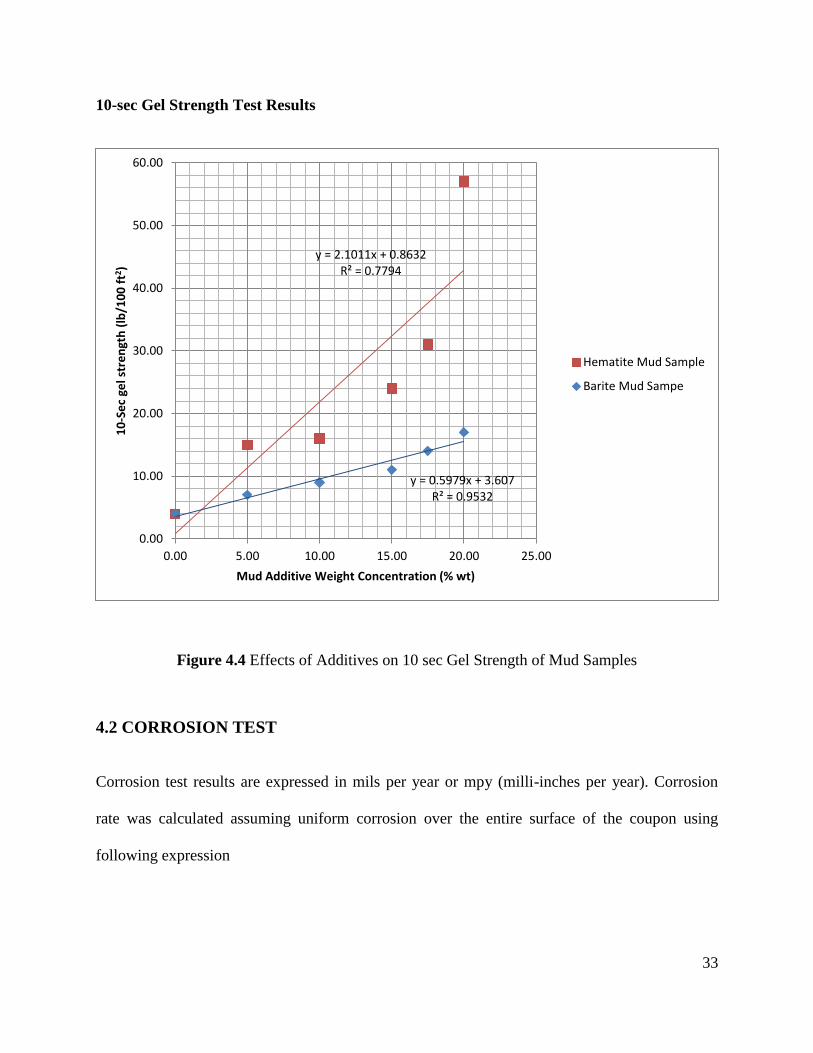
10-sec Gel Strength Test Results
Figure 4.4 Effects of Additives on 10 sec Gel Strength of Mud Samples
4.2 CORROSION TEST
Corrosion test results are expressed in mils per year or mpy (milli-inches per year). Corrosion
rate was calculated assuming uniform corrosion over the entire surface of the coupon using
following expression
y = 2.1011x + 0.8632 R² = 0.7794
y = 0.5979x + 3.607 R² = 0.9532
0.00
10.00
20.00
30.00
40.00
50.00
60.00
0.00 5.00 10.00 15.00 20.00 25.00
10
-Se
c ge
l str
en
gth
(lb
/10
0 f
t2 )
Mud Additive Weight Concentration (% wt)
Hematite Mud Sample
Barite Mud Sampe
34
(
)
(4.1)
Where mpy = Corrosion rate (milli-inches per year penetration)
W = Weight Loss (g)
A = area of coupon (in2)
ρ = metal density of coupon (g/cm3)
T = time of exposure in corrosive environment (days).
22300 is conversion factor used for converting SI units to field units.
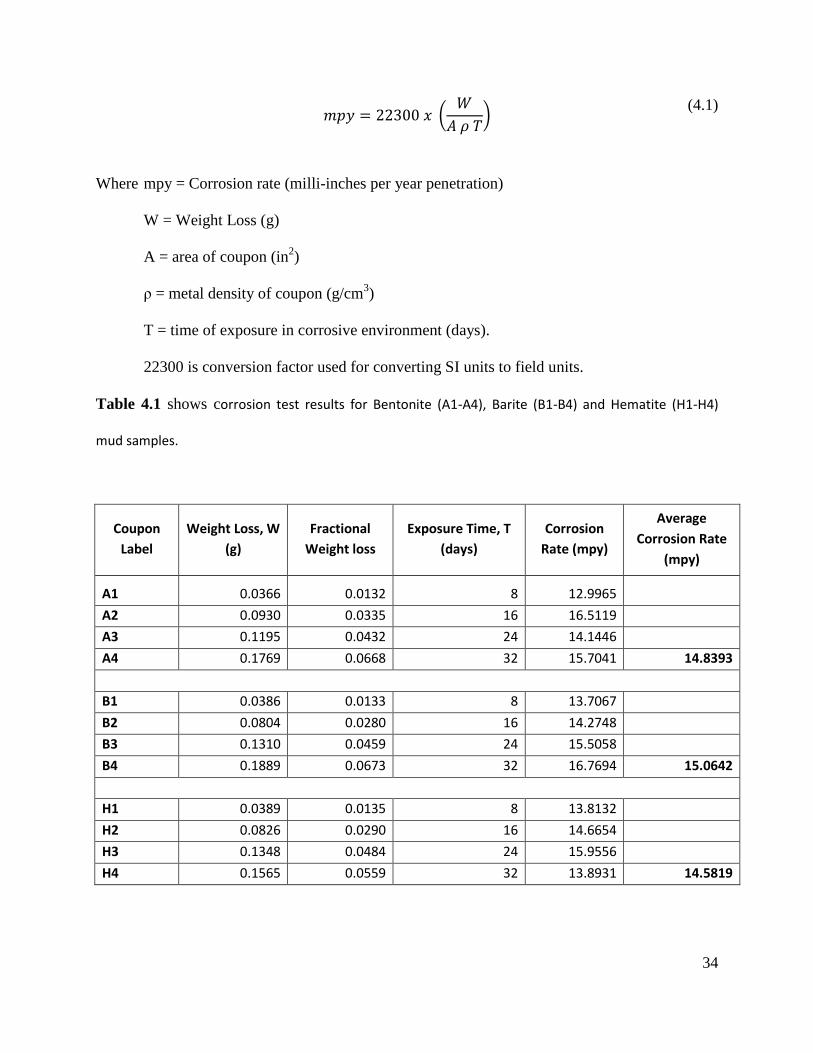
Table 4.1 shows corrosion test results for Bentonite (A1-A4), Barite (B1-B4) and Hematite (H1-H4)
mud samples.
Coupon
Label
Weight Loss, W
(g)
Fractional
Weight loss
Exposure Time, T
(days)
Corrosion
Rate (mpy)
Average
Corrosion Rate
(mpy)
A1 0.0366 0.0132 8 12.9965
A2 0.0930 0.0335 16 16.5119
A3 0.1195 0.0432 24 14.1446
A4 0.1769 0.0668 32 15.7041 14.8393
B1 0.0386 0.0133 8 13.7067
B2 0.0804 0.0280 16 14.2748
B3 0.1310 0.0459 24 15.5058
B4 0.1889 0.0673 32 16.7694 15.0642
H1 0.0389 0.0135 8 13.8132
H2 0.0826 0.0290 16 14.6654
H3 0.1348 0.0484 24 15.9556
H4 0.1565 0.0559 32 13.8931 14.5819
35
Graphical representation of each mud sample; Bentonite, Barite and Hematite; is shown in
Figure 4.5 to 4.6
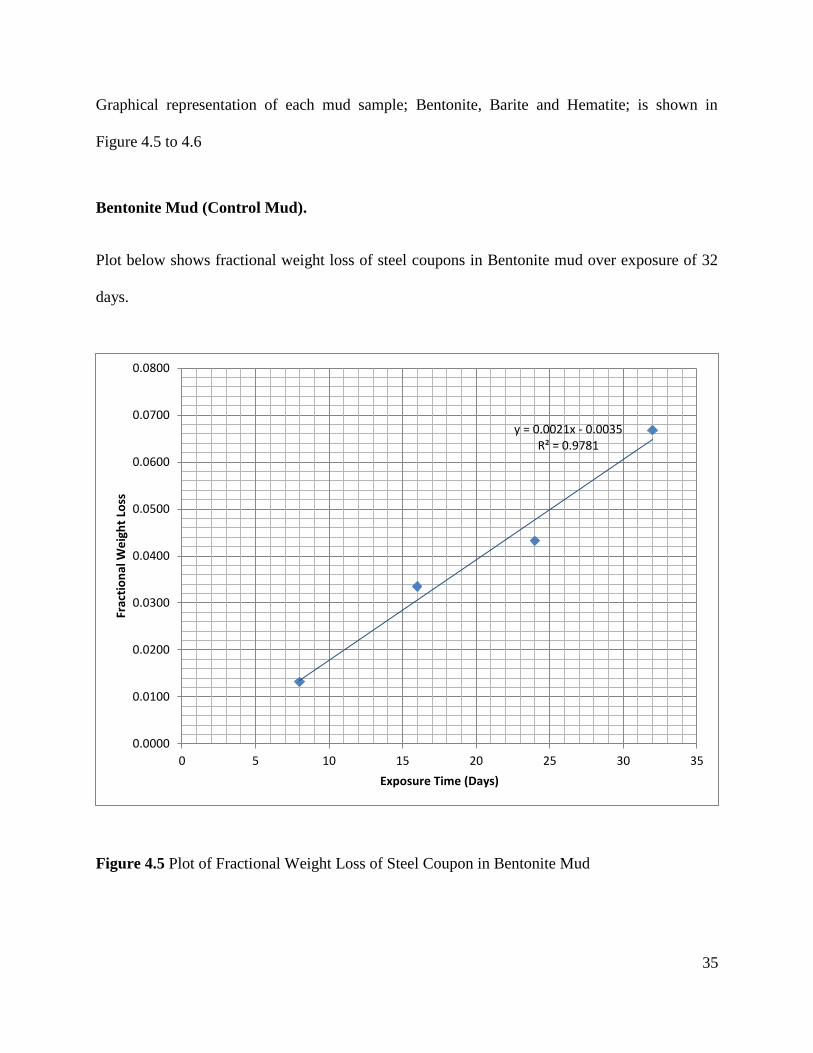
Bentonite Mud (Control Mud).
Plot below shows fractional weight loss of steel coupons in Bentonite mud over exposure of 32
days.
Figure 4.5 Plot of Fractional Weight Loss of Steel Coupon in Bentonite Mud
y = 0.0021x - 0.0035 R² = 0.9781
0.0000
0.0100
0.0200
0.0300
0.0400
0.0500
0.0600
0.0700
0.0800
0 5 10 15 20 25 30 35
Frac
tio
nal
We
igh
t Lo
ss
Exposure Time (Days)
36
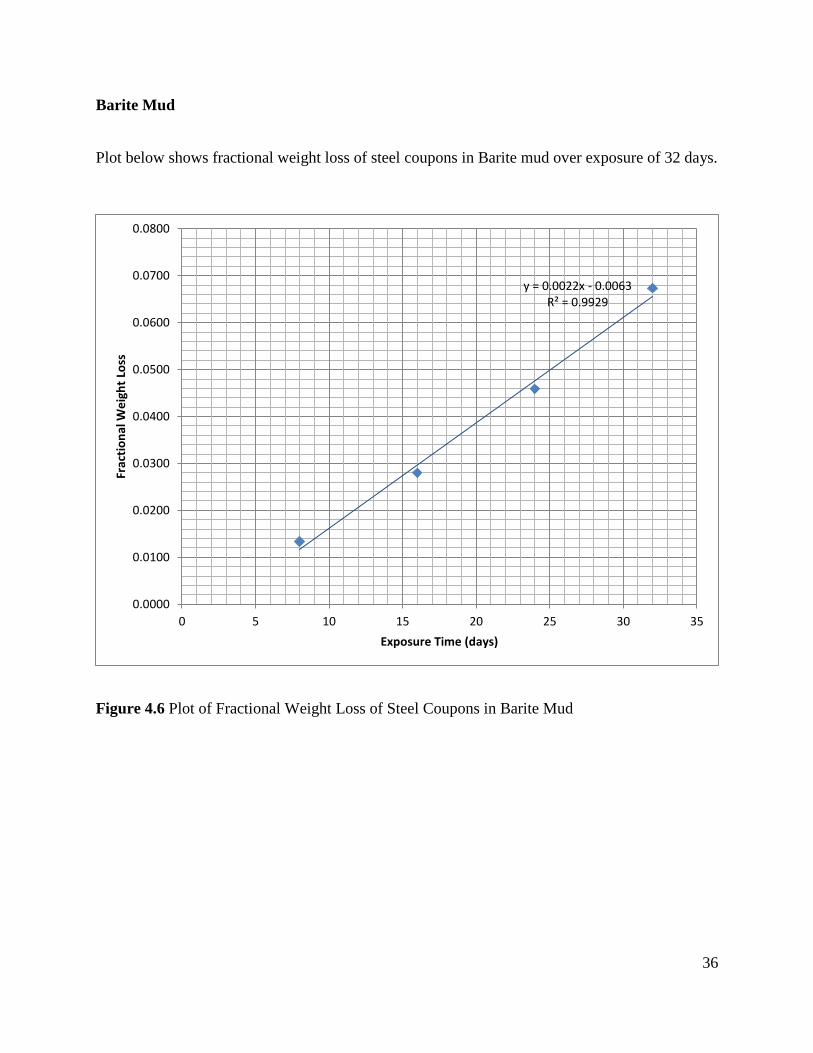
Barite Mud
Plot below shows fractional weight loss of steel coupons in Barite mud over exposure of 32 days.
Figure 4.6 Plot of Fractional Weight Loss of Steel Coupons in Barite Mud
y = 0.0022x - 0.0063 R² = 0.9929
0.0000
0.0100
0.0200
0.0300
0.0400
0.0500
0.0600
0.0700
0.0800
0 5 10 15 20 25 30 35
Frac
tio
nal
We
igh
t Lo
ss
Exposure Time (days)
37
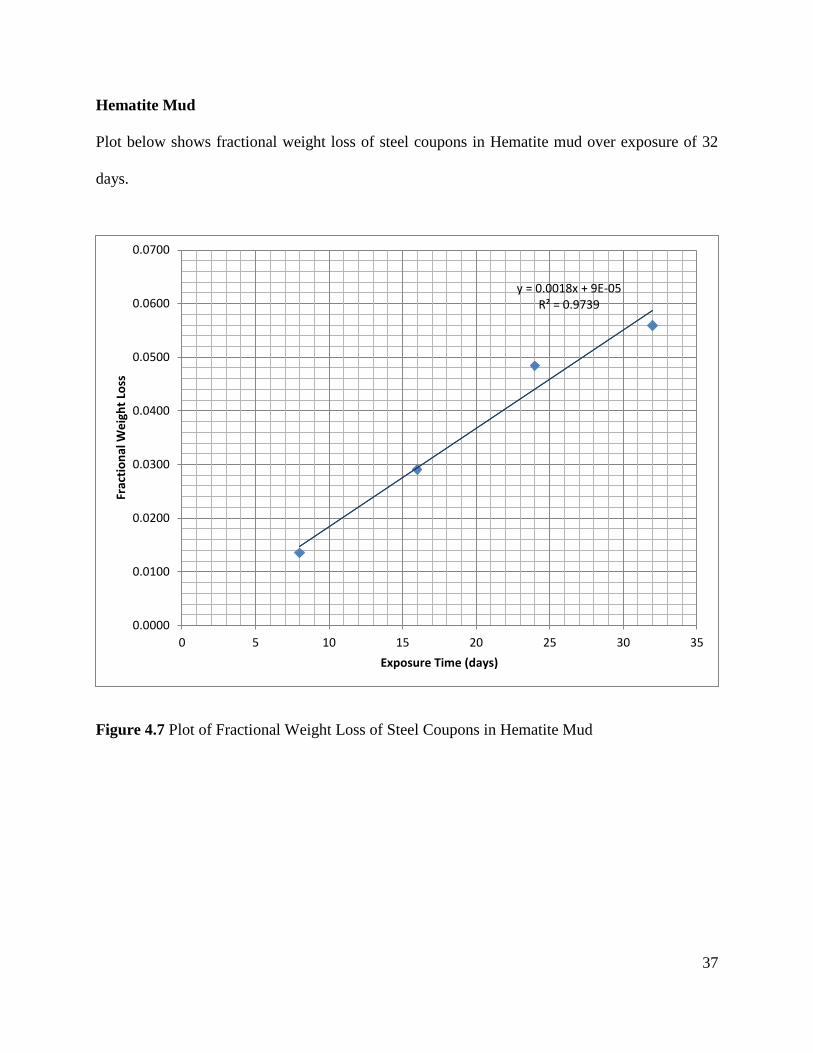
Hematite Mud
Plot below shows fractional weight loss of steel coupons in Hematite mud over exposure of 32
days.
Figure 4.7 Plot of Fractional Weight Loss of Steel Coupons in Hematite Mud
y = 0.0018x + 9E-05 R² = 0.9739
0.0000
0.0100
0.0200
0.0300
0.0400
0.0500
0.0600
0.0700
0 5 10 15 20 25 30 35
Frac
tio
nal
We
igh
t Lo
ss
Exposure Time (days)
38
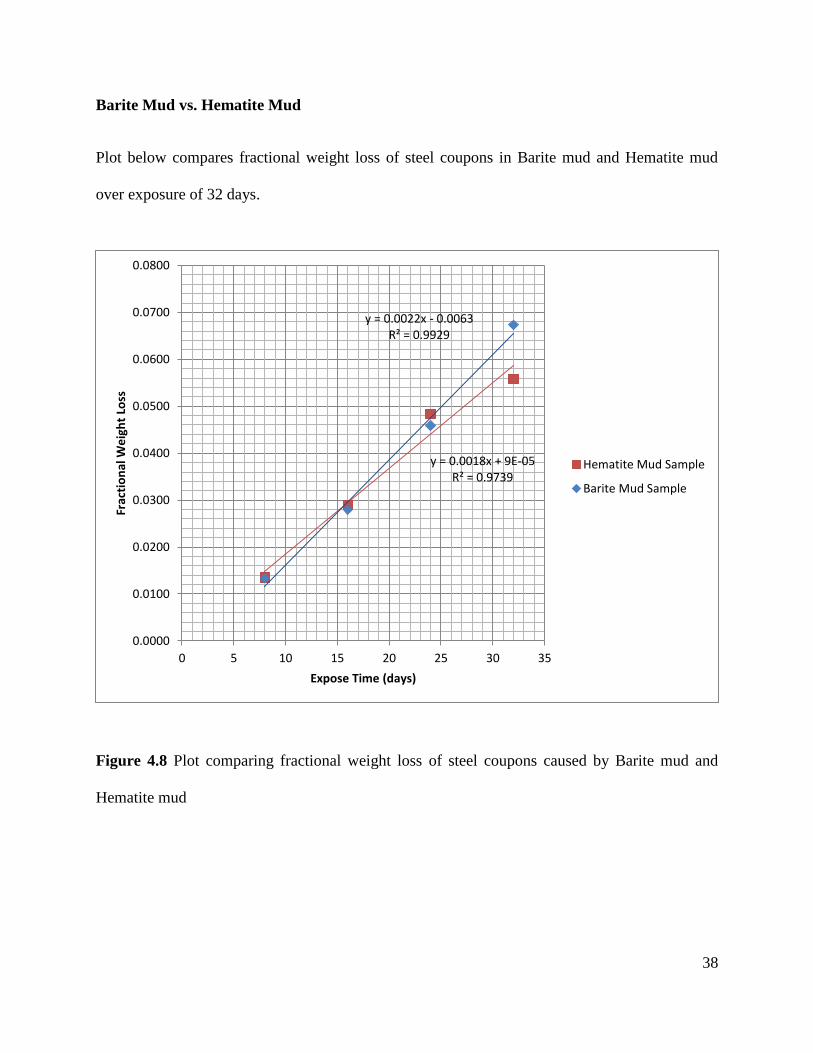
Barite Mud vs. Hematite Mud
Plot below compares fractional weight loss of steel coupons in Barite mud and Hematite mud
over exposure of 32 days.
Figure 4.8 Plot comparing fractional weight loss of steel coupons caused by Barite mud and
Hematite mud
y = 0.0018x + 9E-05 R² = 0.9739
y = 0.0022x - 0.0063 R² = 0.9929
0.0000
0.0100
0.0200
0.0300
0.0400
0.0500
0.0600
0.0700
0.0800
0 5 10 15 20 25 30 35
Frac
tio
nal
We
igh
t Lo
ss
Expose Time (days)
Hematite Mud Sample
Barite Mud Sample
39
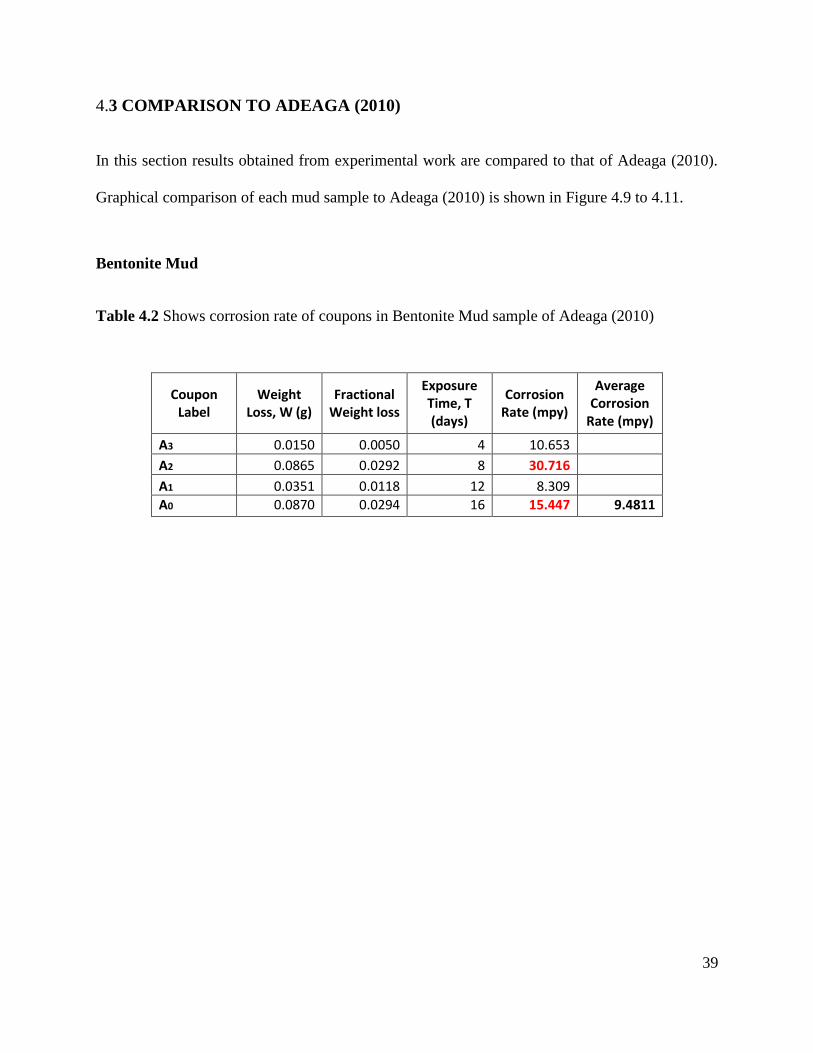
4.3 COMPARISON TO ADEAGA (2010)
In this section results obtained from experimental work are compared to that of Adeaga (2010).
Graphical comparison of each mud sample to Adeaga (2010) is shown in Figure 4.9 to 4.11.
Bentonite Mud
Table 4.2 Shows corrosion rate of coupons in Bentonite Mud sample of Adeaga (2010)
Coupon Label
Weight Loss, W (g)
Fractional Weight loss
Exposure Time, T (days)
Corrosion Rate (mpy)
Average Corrosion
Rate (mpy)
A3 0.0150 0.0050 4 10.653
A2 0.0865 0.0292 8 30.716
A1 0.0351 0.0118 12 8.309 A0 0.0870 0.0294 16 15.447 9.4811
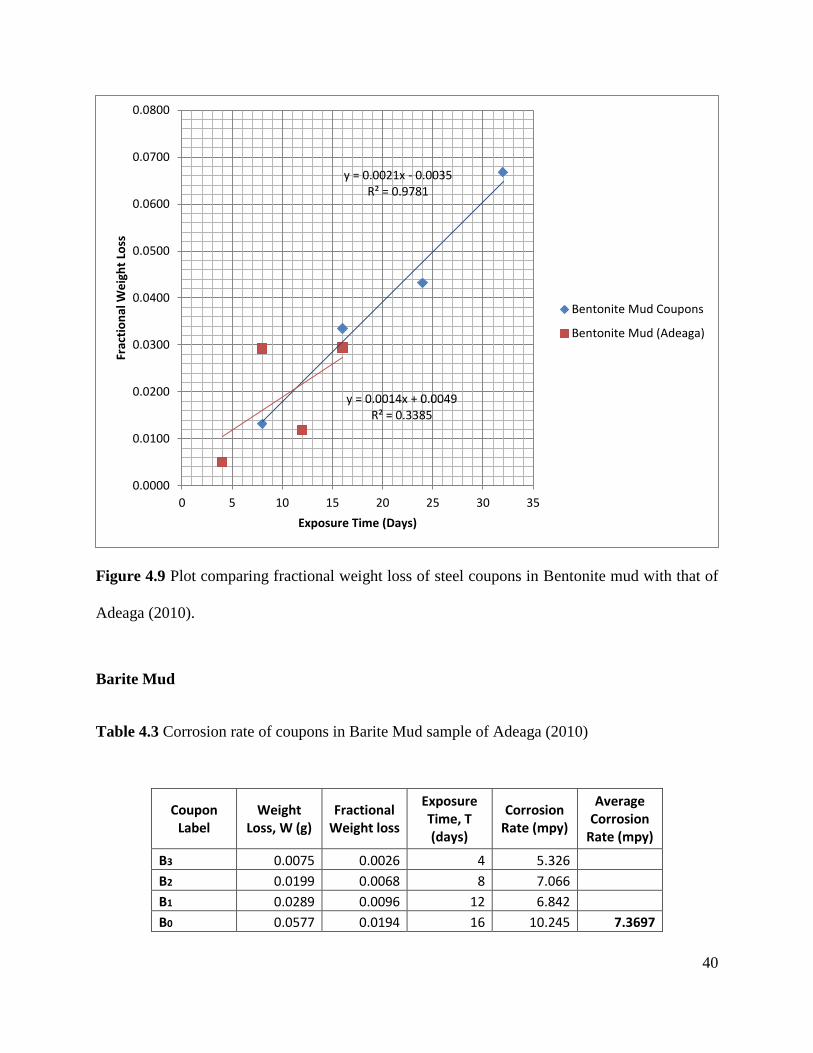
40
Figure 4.9 Plot comparing fractional weight loss of steel coupons in Bentonite mud with that of
Adeaga (2010).
Barite Mud
Table 4.3 Corrosion rate of coupons in Barite Mud sample of Adeaga (2010)
Coupon Label
Weight Loss, W (g)
Fractional Weight loss
Exposure Time, T (days)
Corrosion Rate (mpy)
Average Corrosion
Rate (mpy)
B3 0.0075 0.0026 4 5.326
B2 0.0199 0.0068 8 7.066
B1 0.0289 0.0096 12 6.842
B0 0.0577 0.0194 16 10.245 7.3697
y = 0.0021x - 0.0035 R² = 0.9781
y = 0.0014x + 0.0049 R² = 0.3385
0.0000
0.0100
0.0200
0.0300
0.0400
0.0500
0.0600
0.0700
0.0800
0 5 10 15 20 25 30 35
Frac
tio
nal
We
igh
t Lo
ss
Exposure Time (Days)
Bentonite Mud Coupons
Bentonite Mud (Adeaga)
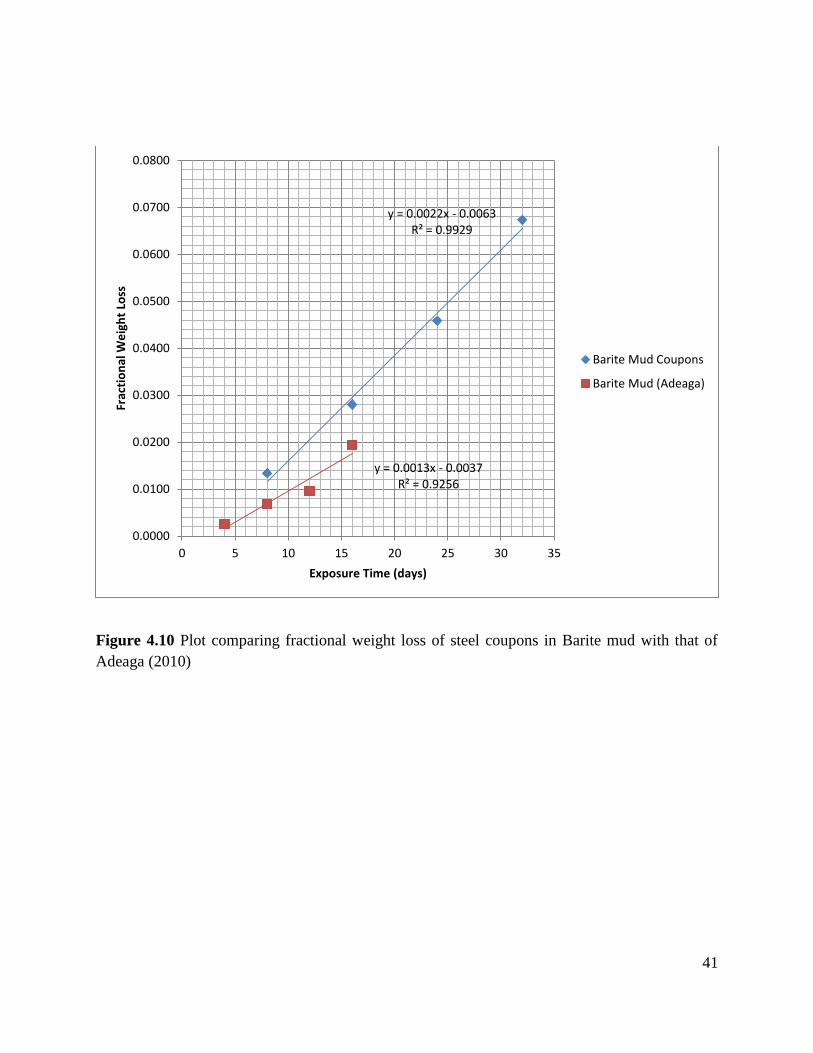
41
Figure 4.10 Plot comparing fractional weight loss of steel coupons in Barite mud with that of
Adeaga (2010)
y = 0.0022x - 0.0063 R² = 0.9929
y = 0.0013x - 0.0037 R² = 0.9256
0.0000
0.0100
0.0200
0.0300
0.0400
0.0500
0.0600
0.0700
0.0800
0 5 10 15 20 25 30 35
Frac
tio
nal
We
igh
t Lo
ss
Exposure Time (days)
Barite Mud Coupons
Barite Mud (Adeaga)
42
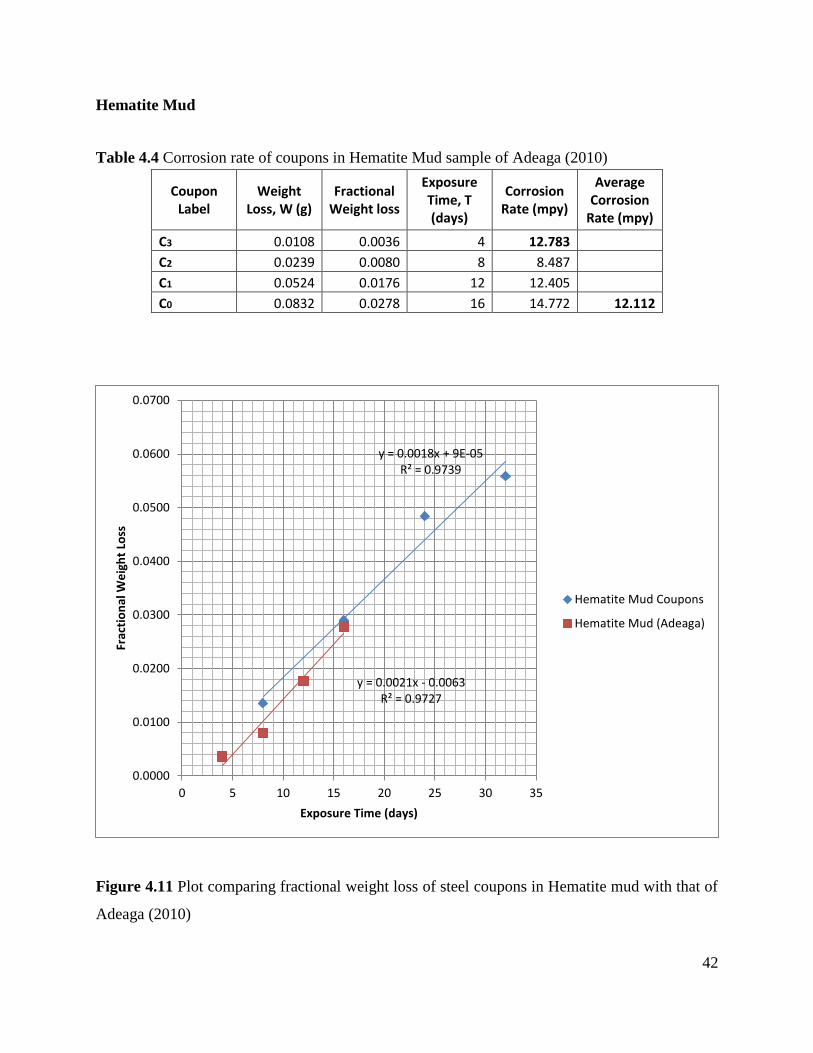
Hematite Mud
Table 4.4 Corrosion rate of coupons in Hematite Mud sample of Adeaga (2010)
Coupon Label
Weight Loss, W (g)
Fractional Weight loss
Exposure Time, T (days)
Corrosion Rate (mpy)
Average Corrosion
Rate (mpy)
C3 0.0108 0.0036 4 12.783
C2 0.0239 0.0080 8 8.487
C1 0.0524 0.0176 12 12.405
C0 0.0832 0.0278 16 14.772 12.112
Figure 4.11 Plot comparing fractional weight loss of steel coupons in Hematite mud with that of
Adeaga (2010)
y = 0.0018x + 9E-05 R² = 0.9739
y = 0.0021x - 0.0063 R² = 0.9727
0.0000
0.0100
0.0200
0.0300
0.0400
0.0500
0.0600
0.0700
0 5 10 15 20 25 30 35
Frac
tio
nal
We
igh
t Lo
ss
Exposure Time (days)
Hematite Mud Coupons
Hematite Mud (Adeaga)
43
4.4 ERROR CORRECTION
Experimental data from rheology test and corrosion test were corrected for instrument error and
graphical representation of error analysis is presented in Figure 4.12 to 4.20. Data obtained after
error correction is presented in Appendix (Table A.3 to A.9).
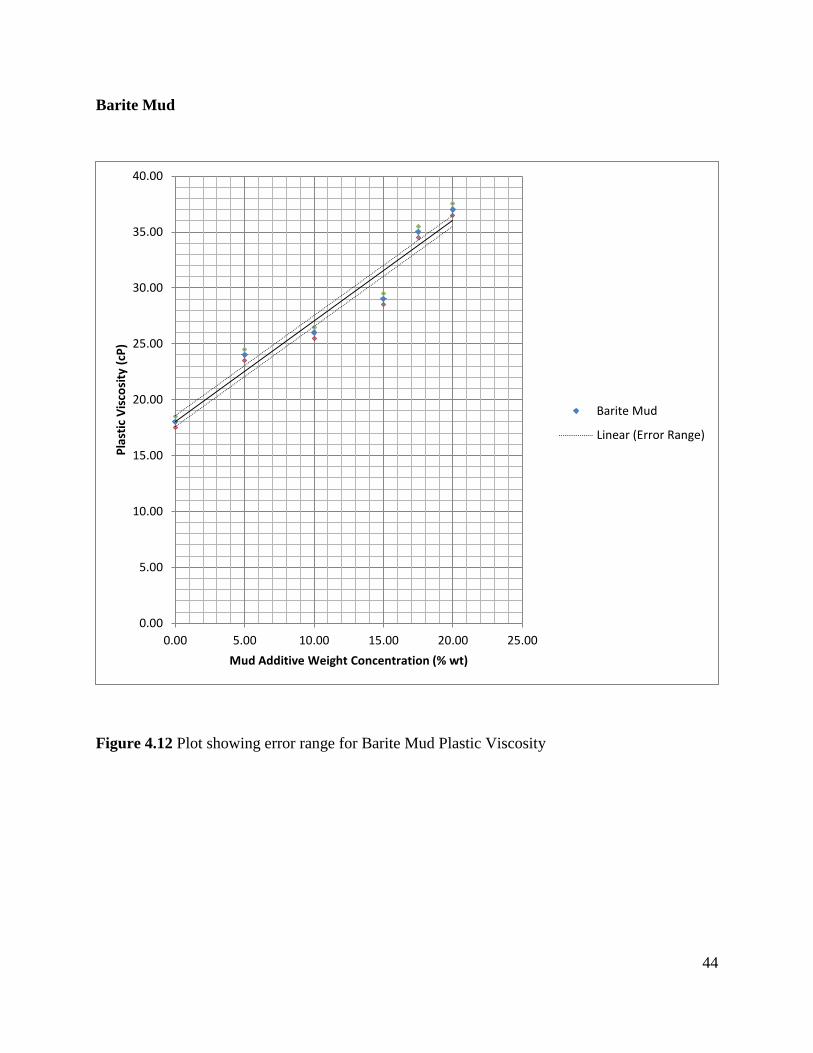
Plastic Viscosity Error Correction
Plastic viscosity for mud samples was obtained using Fann Viscometer (Model 35A), accuracy
for this particular model ranges within ± 0.5 of dial reading at ambient conditions.
44
Barite Mud
Figure 4.12 Plot showing error range for Barite Mud Plastic Viscosity
0.00
5.00
10.00
15.00
20.00
25.00
30.00
35.00
40.00
0.00 5.00 10.00 15.00 20.00 25.00
Pla
stic
Vis
cosi
ty (
cP)
Mud Additive Weight Concentration (% wt)
Barite Mud
Linear (Error Range)
45
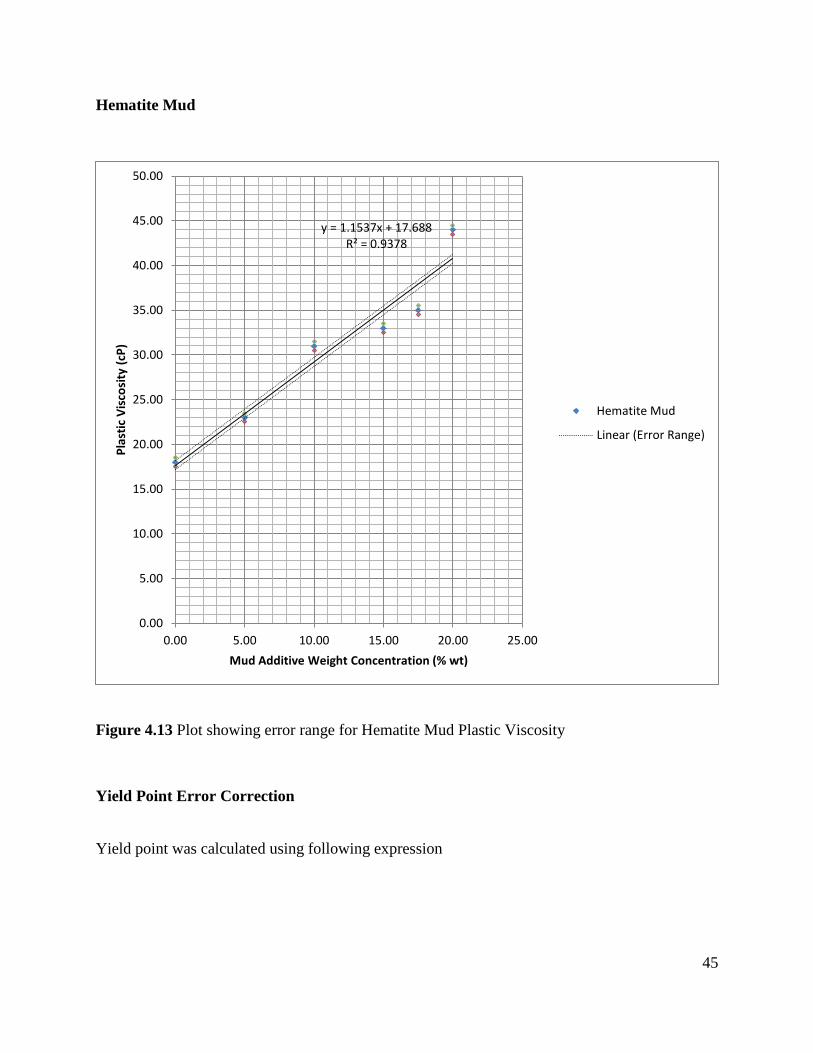
Hematite Mud
Figure 4.13 Plot showing error range for Hematite Mud Plastic Viscosity
Yield Point Error Correction
Yield point was calculated using following expression
y = 1.1537x + 17.688 R² = 0.9378
0.00
5.00
10.00
15.00
20.00
25.00
30.00
35.00
40.00
45.00
50.00
0.00 5.00 10.00 15.00 20.00 25.00
Pla
stic
Vis
cosi
ty (
cP)
Mud Additive Weight Concentration (% wt)
Hematite Mud
Linear (Error Range)
46
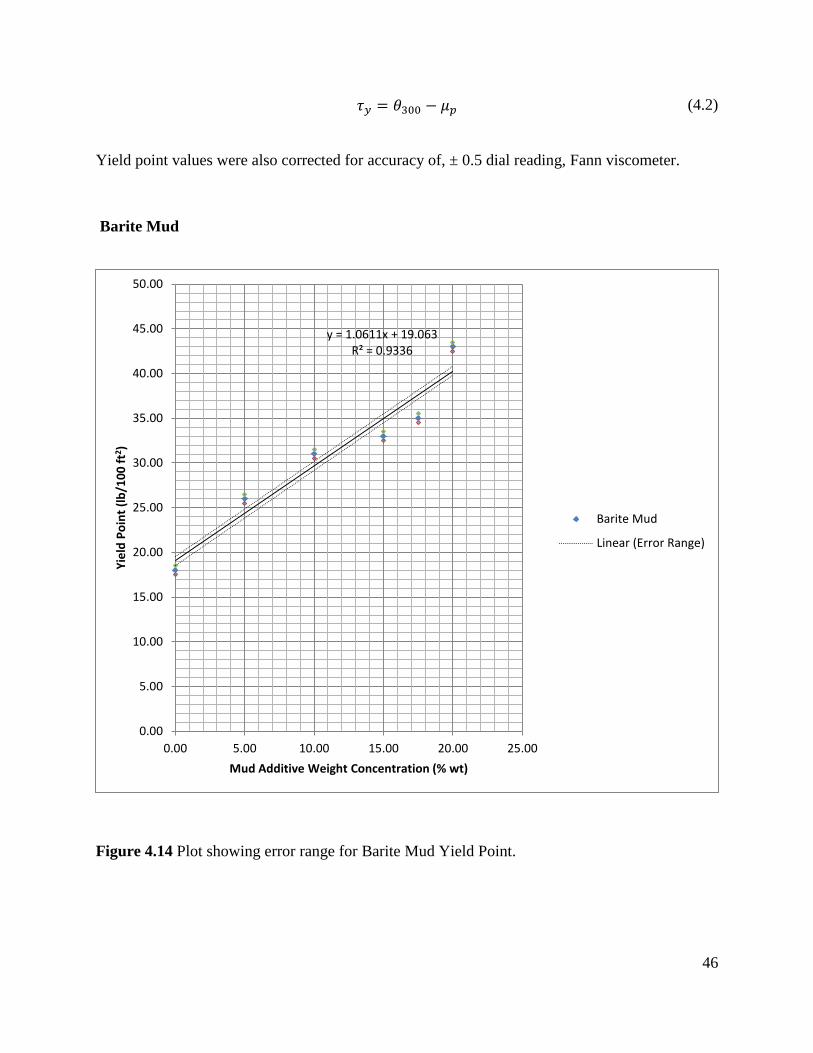
(4.2)
Yield point values were also corrected for accuracy of, ± 0.5 dial reading, Fann viscometer.
Barite Mud
Figure 4.14 Plot showing error range for Barite Mud Yield Point.
y = 1.0611x + 19.063 R² = 0.9336
0.00
5.00
10.00
15.00
20.00
25.00
30.00
35.00
40.00
45.00
50.00
0.00 5.00 10.00 15.00 20.00 25.00
Yie
ld P
oin
t (l
b/1
00
ft2 )
Mud Additive Weight Concentration (% wt)
Barite Mud
Linear (Error Range)
47
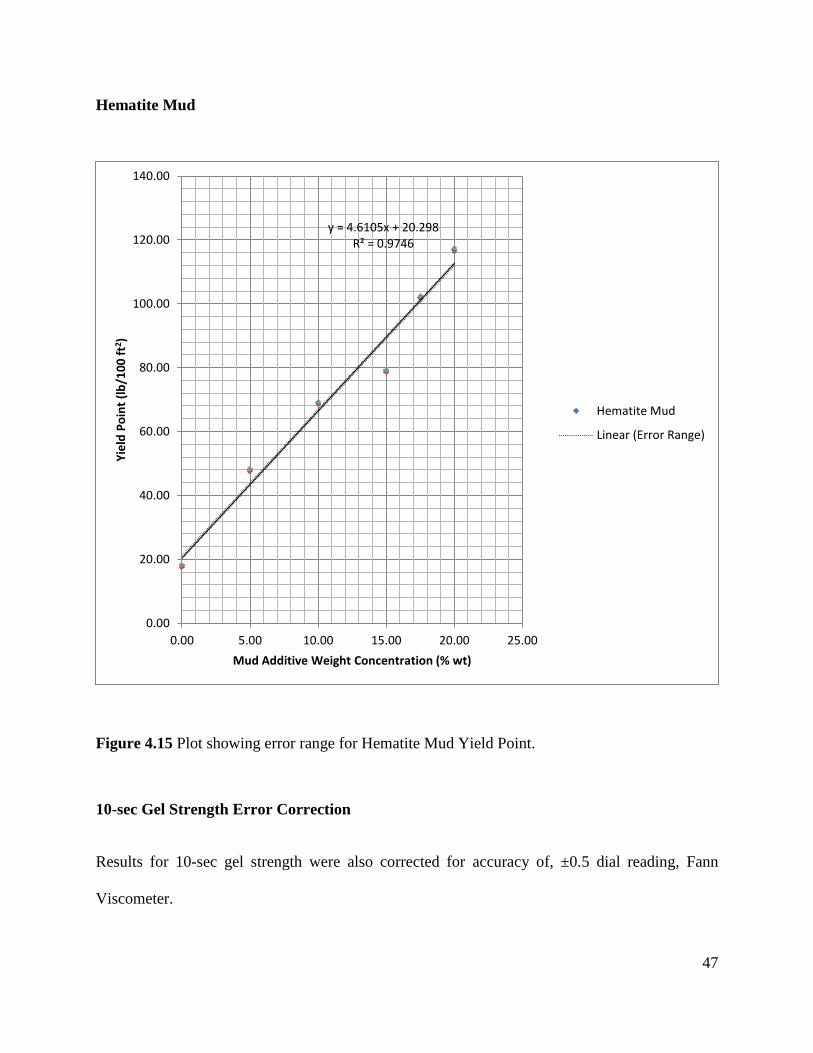
Hematite Mud
Figure 4.15 Plot showing error range for Hematite Mud Yield Point.
10-sec Gel Strength Error Correction
Results for 10-sec gel strength were also corrected for accuracy of, ±0.5 dial reading, Fann
Viscometer.
y = 4.6105x + 20.298 R² = 0.9746
0.00
20.00
40.00
60.00
80.00
100.00
120.00
140.00
0.00 5.00 10.00 15.00 20.00 25.00
Yie
ld P
oin
t (l
b/1
00
ft2 )
Mud Additive Weight Concentration (% wt)
Hematite Mud
Linear (Error Range)
48
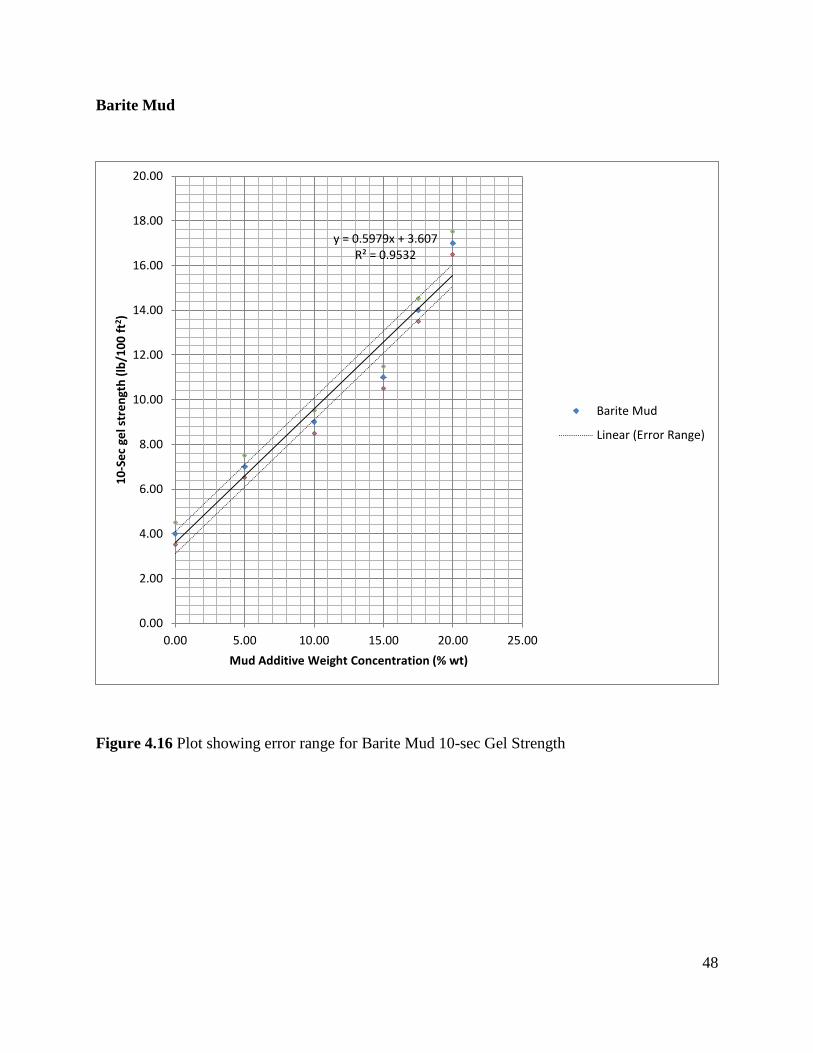
Barite Mud
Figure 4.16 Plot showing error range for Barite Mud 10-sec Gel Strength
y = 0.5979x + 3.607 R² = 0.9532
0.00
2.00
4.00
6.00
8.00
10.00
12.00
14.00
16.00
18.00
20.00
0.00 5.00 10.00 15.00 20.00 25.00
10
-Se
c ge
l str
en
gth
(lb
/10
0 f
t2 )
Mud Additive Weight Concentration (% wt)
Barite Mud
Linear (Error Range)
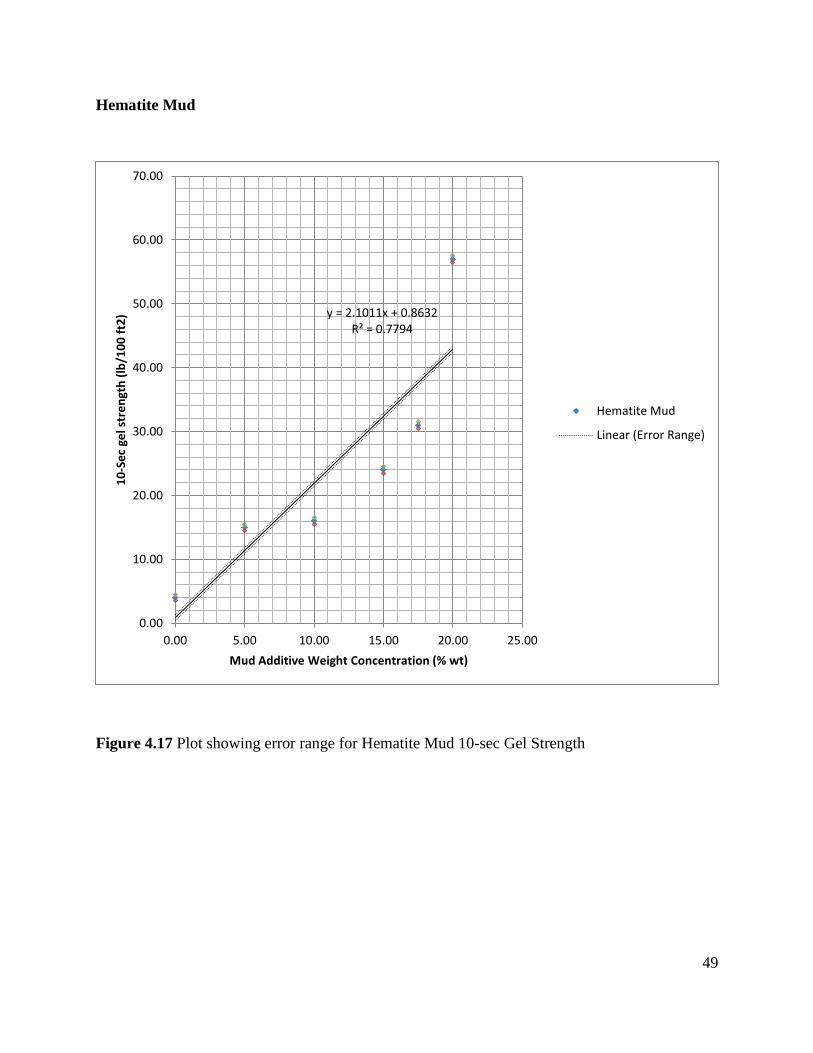
49
Hematite Mud
Figure 4.17 Plot showing error range for Hematite Mud 10-sec Gel Strength
y = 2.1011x + 0.8632 R² = 0.7794
0.00
10.00
20.00
30.00
40.00
50.00
60.00
70.00
0.00 5.00 10.00 15.00 20.00 25.00
10
-Se
c ge
l str
en
gth
(lb
/10
0 f
t2)
Mud Additive Weight Concentration (% wt)
Hematite Mud
Linear (Error Range)
50
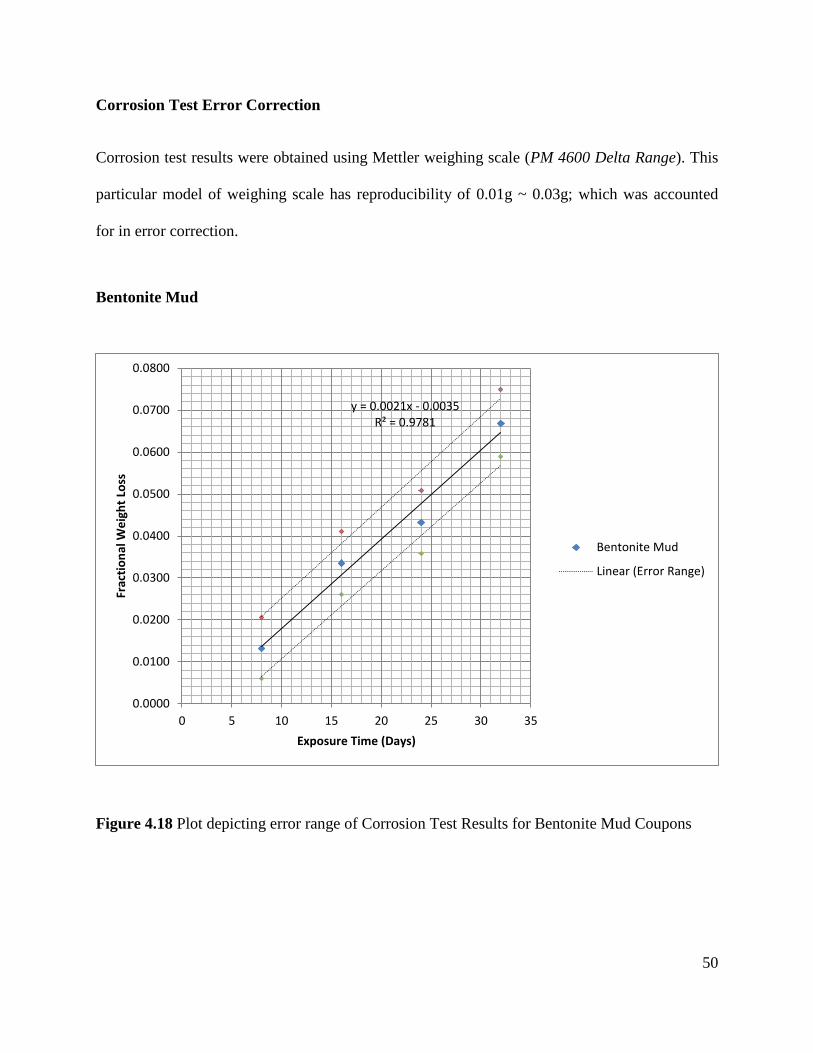
Corrosion Test Error Correction
Corrosion test results were obtained using Mettler weighing scale (PM 4600 Delta Range). This
particular model of weighing scale has reproducibility of 0.01g ~ 0.03g; which was accounted
for in error correction.
Bentonite Mud
Figure 4.18 Plot depicting error range of Corrosion Test Results for Bentonite Mud Coupons
y = 0.0021x - 0.0035 R² = 0.9781
0.0000
0.0100
0.0200
0.0300
0.0400
0.0500
0.0600
0.0700
0.0800
0 5 10 15 20 25 30 35
Frac
tio
nal
We
igh
t Lo
ss
Exposure Time (Days)
Bentonite Mud
Linear (Error Range)
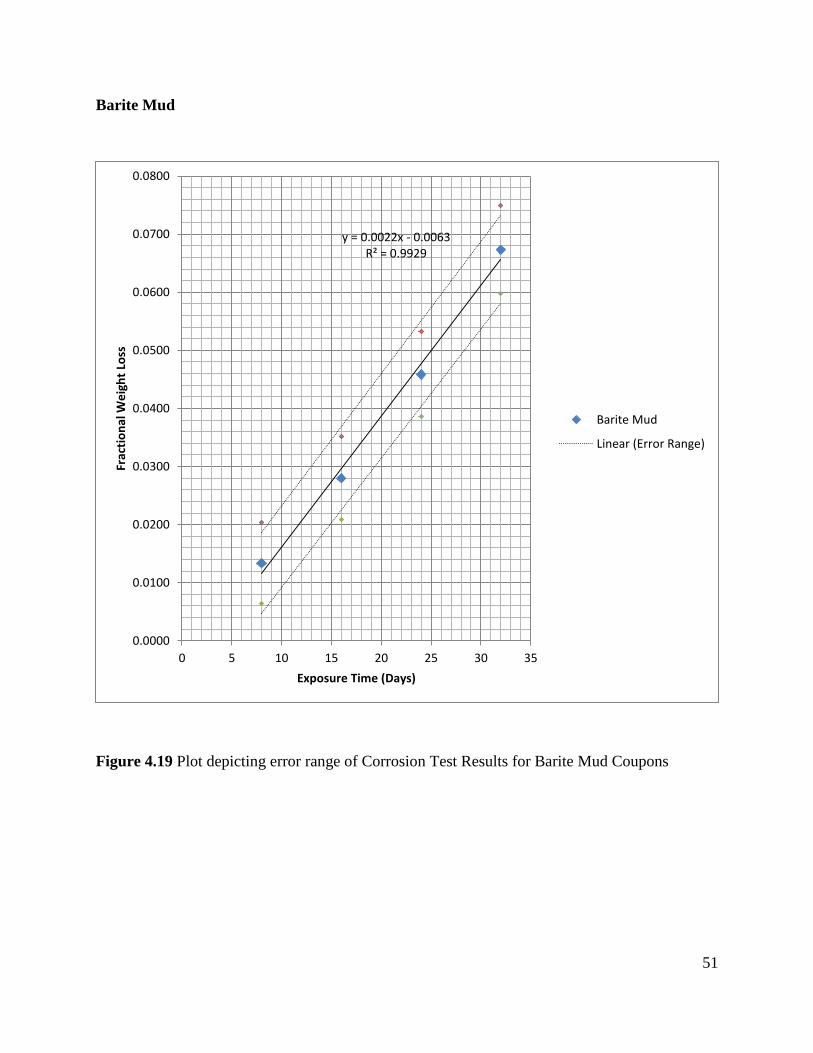
51
Barite Mud
Figure 4.19 Plot depicting error range of Corrosion Test Results for Barite Mud Coupons
y = 0.0022x - 0.0063 R² = 0.9929
0.0000
0.0100
0.0200
0.0300
0.0400
0.0500
0.0600
0.0700
0.0800
0 5 10 15 20 25 30 35
Frac
tio
nal
We
igh
t Lo
ss
Exposure Time (Days)
Barite Mud
Linear (Error Range)
52
Hematite Mud
Figure 4.20 Plot depicting error range of Corrosion Test Results for Hematite Mud Coupons
y = 0.0018x + 9E-05 R² = 0.9739
0.0000
0.0100
0.0200
0.0300
0.0400
0.0500
0.0600
0.0700
0 5 10 15 20 25 30 35
Frac
tio
nal
We
igh
t Lo
ss
Exposure Time (Days)
Hematite Mud
Linear (Error Range)
53
CHAPTER 5 DISCUSSIONS
Drilling fluid properties are directly or indirectly related to most of drilling problems. Even a
slight variation in the properties of drilling fluid can cause unpredictable problems. In this
experiment, rheological properties and corrosion characteristics of drilling mud additives were
studied. Mud samples with a varying concentration of additives were prepared; their properties
were studied and compared.
Rheological properties of drilling fluids with a varying concentration of additives are graphically
represented in section 4.1. The results indicate that rheological properties vary with a varying
concentration of additives. The mud density comparison of barite mud and hematite mud
indicated that a similar amount of hematite will give a higher mud density than barite. This is the
result of the specific gravity of hematite as it greater than of barite. The other rheological
parameters tested showed that hematite gave better values than barite when using the same
concentration. This result is supported by Menzel (1973) who mentioned that mud weighted with
iron oxides give better rheological properties and have lower rate of sedimentation than with
barites.
Before the corrosion test was conducted, three mud samples, two of which contained one of the
two additives while the third contained only bentonite, were treated with NaOH to adjust the pH
to 10.5. The other two mud samples were prepared to have the same density (9.5 lb/gal). The
corrosion test results (table 4.1) indicate that the barite mud sample showed the highest average
corrosion rate (15.0642 mpy). However when the results were compared to the hematite test
results, it showed that the differences in corrosion were very small. It can be concluded that the
54
corrosion rates of the iron oxides tested are on the same level as barite. It is possible that the
variation in the last reading of hematite mud sample was caused by the age of the mud.
The fractional weight loss of coupons in the tested mud samples was caused primarily by erosion
corrosion. There were no signs of any significant pitting corrosion. The lack of pitting corrosion
implies that the weight loss of steel coupons is due to the simulated down-hole stress of the roller
oven. This result could be indicative that in the absence of any corrosive agent (such as H2S,
Oxygen etc.), the weight loss in down-hole drilling equipment is largely caused by the
circulation of drilling mud. Haaland (1976) mentioned that particle size, abrasivity and the
hardness of the additives could lead to erosion corrosion.
Error analysis for experimental data was done. Experimental data was corrected for instrument
error and accuracy; and is graphically represented in section 4.4. Error corrections were done on
results obtained from Fann Viscometer (Model 35A) and Mettler weighing scale (PM 4600 Delta
Range). Viscometer has an accuracy of ± 0.5 of dial reading. Since experiments were performed
at room temperature, error analyses for temperature variation were not done. Mettler weighing
scale is a minimum air resistance weighing scale with reproducibility of 0.01g ~ 0.03g, which
was accounted for in error analysis. Reproducibility is defined as the ability of a weighing
instrument to display corresponding results under constant testing conditions. In general, the
difference between the largest and the smallest result is used to specify this quantity. Error
corrections are generally quantified by readability, standard deviation, resolution, accuracy class
of weighing instrument.
55
CHAPTER 6 CONCLUSIONS & RECOMMENDATIONS
6.1 CONCLUSIONS
This experiment studied the effects of drilling mud additives on rheology and the corrosion
characteristics of drilling mud. Studies compared the rheological properties and the corrosion
characteristics of bentonite, barite and hematite mud additives. The following conclusions can be
drawn from this study:
The concentration of mud additives is vital to control the rheological properties of drilling
mud. Significant changes in mud density, plastic viscosity, yield point and gel strength were
noted to correspond to changes in the concentration of mud additives.
Hematite gave a significantly higher value of density, yield point, gel strength and plastic
viscosity when used at the same concentration as barite.
Bentonite, Barite and Hematite mud samples caused erosion corrosion in steel coupons with
barite having the highest average corrosion rate. The absence of any corrosive agents
indicates that erosion corrosion in test samples could possibly be due to the particle size of
the mud additives.
6.2 RECOMMENDATIONS
Based on the results and conclusion provided in this study, the following recommendations are
suggested for future work on this subject matter
It is recommended to use actual drilling equipment steel grade coupons.
It is recommended to determine effects of aging on rheological properties of drilling mud.
56
It is recommended to determine the effects that the temperature and pH of drilling mud
has on the corrosion rate of steel coupons.
It is recommended to determine the effect of dissolved gases on mud density of drilling
fluid.
It is recommended to determine the effect of dissolved gases, in drilling fluid, on the rate
of corrosion of steel coupons.
It is recommended to determine the effect of the particle size of mud additives on erosion
corrosion.
57
REFERENCES
Adeaga, A. (2010). Effects of Additives on the Rheology and Corrosion Characteristics of
Drilling Mud. Halifax, NS: Dalhousie University.
Alderman, N. J., Gavignet, A., Guillot, D., & Maitland, G. C. (1988). High-Temperature, High-
Pressure Rheology of Water-Based Muds. Society of Petroleum Engineers , 187-195.
Ali, M., & Al-Marhoun, M. (1990). The Effect of High Temperature, High Pressure, and Aging
on Water-Based Drilling Fluids. Society of Petroleum Engineers , Unsolicited.
Annis, M. R., & ESSO, P. R. (1967). High-Temperature Flow Properties of Water-Base Drilling
Fluids. Journal of Petroleum Technology [Volume 19, Number 8] , 1074-1080.
API Recommented Practice 13B-1, I. 1.-1. (2003, December). Recommended Practice for Field
Testing water-based Drilling Fluids. American Petroleum Institute.
Asrar, N. (2010). Corrosion Control of Drilling Tools Through Chemical Treatments-
Effectiveness and Challenges. SPE International Conference on Oilfliled Corrosion .
Azar, J. J., & Lummus, J. L. (1975, 28 September-1 October 1975,). The Effect of Drill Fluid pH
on Drill Pipe Corrosion Fatigue Performance. Fall Meeting of the Society of Petroleum
Engineers of AIME .
Azar, J., & Samuel, G. R. (2007). Drilling Engineering. PennWell Corporation.
Bingham, C. E. (1922). Fluidity and Plasticity. New York: McGraw-Hill.
Bourgoyne Jr., A. T., Millheim, K. K., Chenevert, M. E., & Young Jr., F. (1986). Applied
Drilling Engineering. Richardson, TX: Society of Petroleum Engineering.
Brodkey, S. R., & Hershey, C. H. (1988). Transport Phenomena: A Unified Approach. McGraw-
Hill Books Co.
58
Brondel, D., Edwards, R., Hayman, A., Hill, D., Mehta, S., & Semerad, T. (1994). Corrosion in
Oil Industry. Oilfield Review 6(2) , 4-18.
Caenn, R., Darley, H. C., & Gray, G. R. (2011). Composition and Properties of Drilling and
Completion Fluids. Gulf Professional Pub.
Clark, E. P. (1995). Drilling Mud Rheology and the API recommended Measurements. Society of
Petroleum Engineers, Inc.
Cron, C. J., & Marsh, G. A. (1983). Overview of Economic and Engineering Aspects of
Corrosion in oil and Gas Production. SPE Journal Paper .
Darley, H. C., & Gray, G. R. (1988). Composition and Properties of Drilling and Completion
Fluids. Gulf Professional Pub.
Dyke, K. V. (2000). Drilling Fluids: Rotary Drilling Series (Unit II). Austin, TX: The University
of Texas.
Fink, J. (2003). Oil Field Chemicals. Gulf Professional Pub.
Growcock, F., & Harvey, T. (2005). Drilling Fluids. In ASME Shale Shaker Committe, Drilling
Fluids Processing Handbook. Elsevier.
Haaland, E., Pettersen, G., & Tuntland, O. B. (1976). Testing of Iron Oxides as Weight Material
for Drilling Muds (Unsolicited). Society of Petroleum Engineers of AIME .
Hanson, P., Trigg Jr., T., Rachal, G., & Zamora, M. (1990). Investigation of Barite "Sag" in
Weighted Drilling Fluids in Highly Deviated Wells. Society of Petroleum Engineers, Inc. , 223-
230.
Herschel, H. V., & Bulkley, R. (1926). Measurement of consistency as applied to rubber-benzene
solution. Proc ASTM Part II .
Lyons, W. C., & Plisga, G. J. (2005). Standard Handbook of Petroleum & Natural Gas
Engineering. Elsevier Inc.
59
Maglione, R., Robotti, G., & Romagnoli, R. (2000). In-Situ Rheological Characterization of
Drilling Mud. SPE Journal 5 (4) , 377-386.
Majidi, R., Miska, S. Z., Yu, M., Thompson, L. G., & Zhang, J. (2008). Modelling of Drilling
Fluid Losses in Naturally Fractured Formations. Society of Petroleum Engineers .
McNerlin, B., & Oakey, N. (2011). Barite Sag Occurrence and Resolution during Angolan
Completion Operations. Society of Petroleum Engineers .
Menzel, D. (1973). A New Weighting Material for Drilling Fluids Based on Synthetic Iron
Oxide. American Institute of Mining, Metallurgical, and Petroleum Engineers, Inc. , 4517-MS.
Moore, P. L. (1974). Drilling Practice Manual. PennWell Pub. Co.
Oxford Jr., W., & Foss, R. (1958). Corrosion of Oil and Gas Well Equipment. American
Petroleum Institute.
Patton, C. C. (1974). Corrosion Control in Drilling Operations. In P. L. Moore, Drilling Practice
Manual (pp. 381-399). The Petroleum Publishing Co.
Patton, C. C. (1971). Corrosion Fatigue Problems in Petroleum Production. National Conference
of NACE .
Ranney, M. W. (1979). Crude Oil Drilling Fluids. Park Ridge, N.J.: Noyes Data Corp.
Samuel, G. (2007). Downhole Drilling Tools. Houston, TX: Gulf Pbulishing Company.
Tuttle, R. N. (1987). Corrosion in Oil and Gas Production. Journal of Petroleum Technology ,
756-762.
Weintritt, D. J., & Cowan, J. C. (1967, October). Unique Characteristics of Barium Sulfate Scale
Deposition. Journal of Petroleum Technology Vol.19 (10) , 1381-1394.
Wenwu, H., & Stephens, M. (2011). Bridging Particle Size Distribution in Drilling Fluid and
Formation Damage. Society of Petroleum Engineers .
60
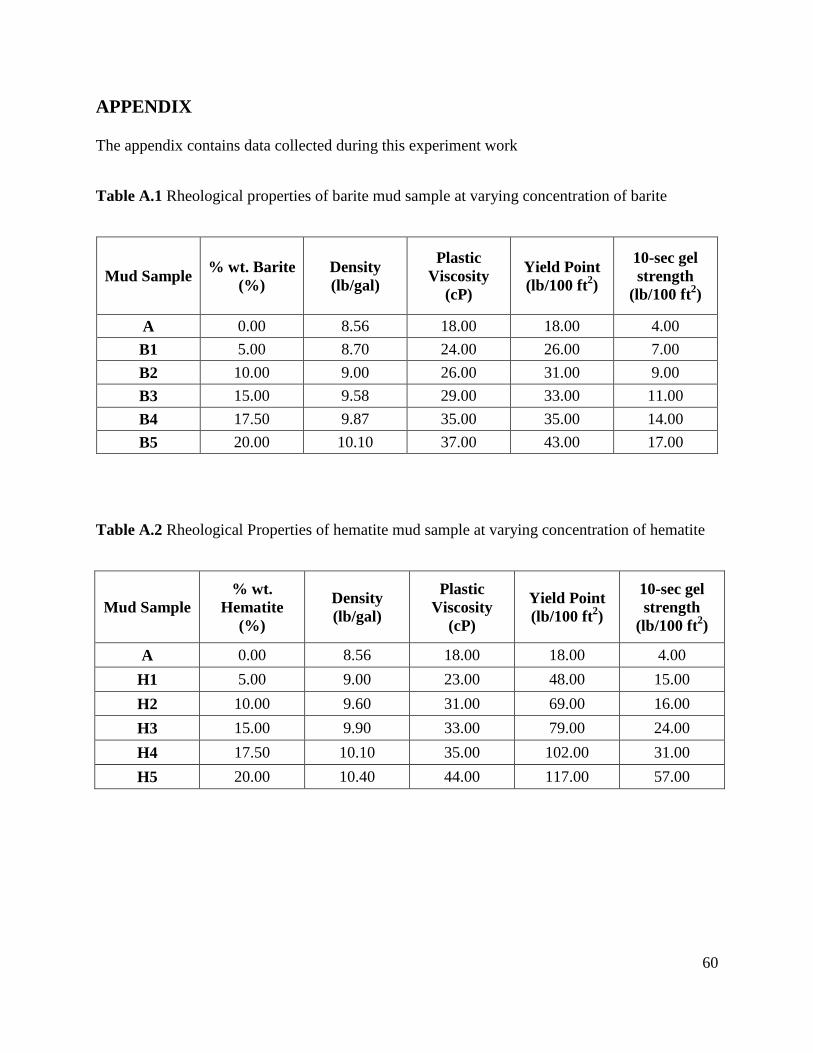
APPENDIX
The appendix contains data collected during this experiment work
Table A.1 Rheological properties of barite mud sample at varying concentration of barite
Mud Sample % wt. Barite
(%)
Density
(lb/gal)
Plastic
Viscosity
(cP)
Yield Point
(lb/100 ft2)
10-sec gel
strength
(lb/100 ft2)
A 0.00 8.56 18.00 18.00 4.00
B1 5.00 8.70 24.00 26.00 7.00
B2 10.00 9.00 26.00 31.00 9.00
B3 15.00 9.58 29.00 33.00 11.00
B4 17.50 9.87 35.00 35.00 14.00
B5 20.00 10.10 37.00 43.00 17.00
Table A.2 Rheological Properties of hematite mud sample at varying concentration of hematite
Mud Sample
% wt.
Hematite
(%)
Density
(lb/gal)
Plastic
Viscosity
(cP)
Yield Point
(lb/100 ft2)
10-sec gel
strength
(lb/100 ft2)
A 0.00 8.56 18.00 18.00 4.00
H1 5.00 9.00 23.00 48.00 15.00
H2 10.00 9.60 31.00 69.00 16.00
H3 15.00 9.90 33.00 79.00 24.00
H4 17.50 10.10 35.00 102.00 31.00
H5 20.00 10.40 44.00 117.00 57.00
61
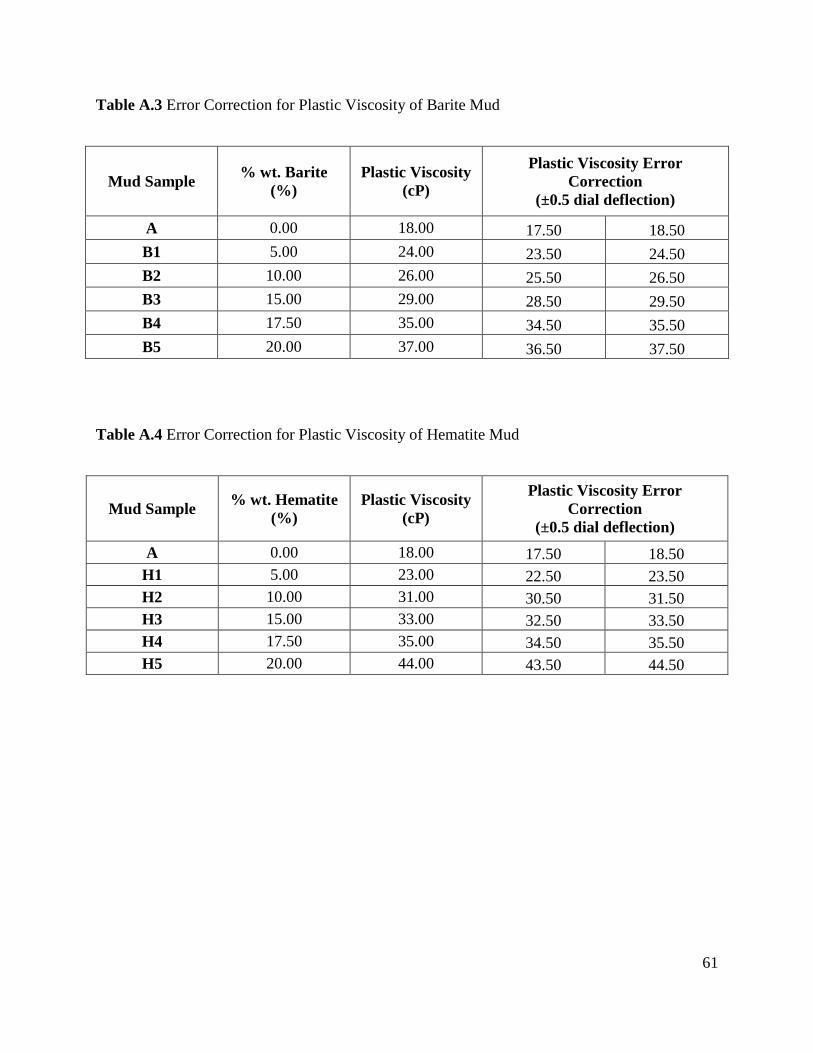
Table A.3 Error Correction for Plastic Viscosity of Barite Mud
Mud Sample % wt. Barite
(%)
Plastic Viscosity
(cP)
Plastic Viscosity Error
Correction
(±0.5 dial deflection)
A 0.00 18.00 17.50 18.50
B1 5.00 24.00 23.50 24.50
B2 10.00 26.00 25.50 26.50
B3 15.00 29.00 28.50 29.50
B4 17.50 35.00 34.50 35.50
B5 20.00 37.00 36.50 37.50
Table A.4 Error Correction for Plastic Viscosity of Hematite Mud
Mud Sample % wt. Hematite
(%)
Plastic Viscosity
(cP)
Plastic Viscosity Error
Correction
(±0.5 dial deflection)
A 0.00 18.00 17.50 18.50
H1 5.00 23.00 22.50 23.50
H2 10.00 31.00 30.50 31.50
H3 15.00 33.00 32.50 33.50
H4 17.50 35.00 34.50 35.50
H5 20.00 44.00 43.50 44.50
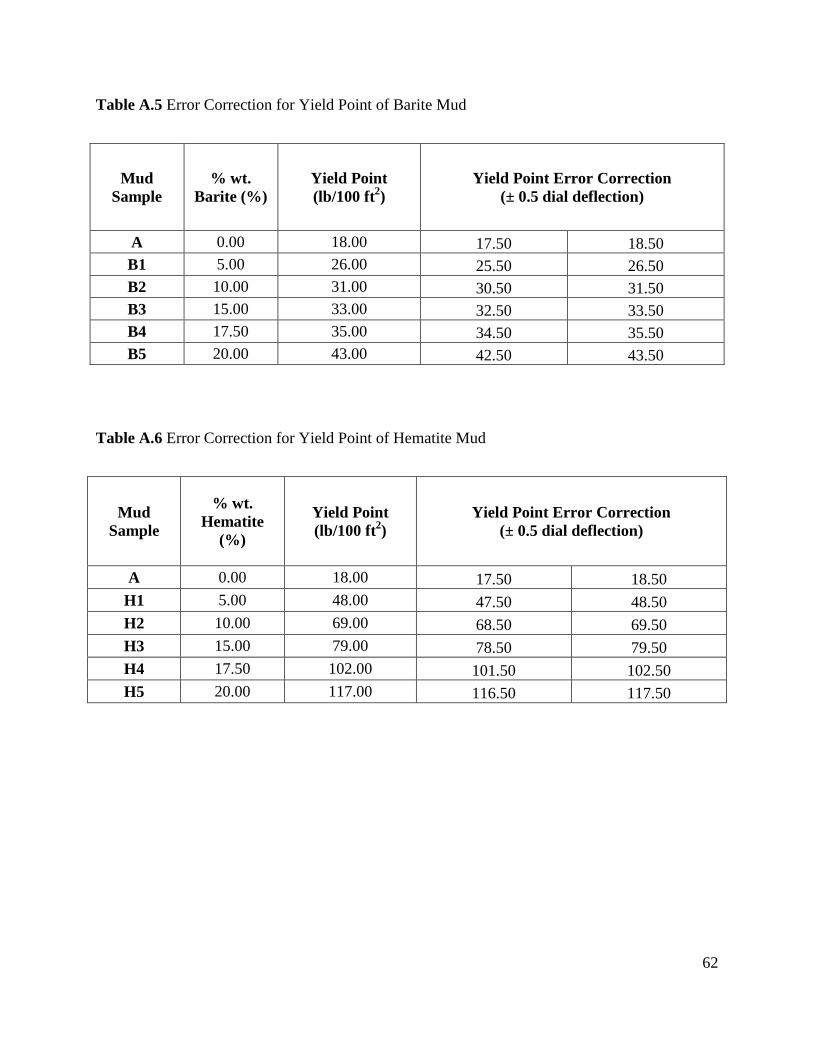
62
Table A.5 Error Correction for Yield Point of Barite Mud
Mud
Sample
% wt.
Barite (%)
Yield Point
(lb/100 ft2)
Yield Point Error Correction
(± 0.5 dial deflection)
A 0.00 18.00 17.50 18.50
B1 5.00 26.00 25.50 26.50
B2 10.00 31.00 30.50 31.50
B3 15.00 33.00 32.50 33.50
B4 17.50 35.00 34.50 35.50
B5 20.00 43.00 42.50 43.50
Table A.6 Error Correction for Yield Point of Hematite Mud
Mud
Sample
% wt.
Hematite
(%)
Yield Point
(lb/100 ft2)
Yield Point Error Correction
(± 0.5 dial deflection)
A 0.00 18.00 17.50 18.50
H1 5.00 48.00 47.50 48.50
H2 10.00 69.00 68.50 69.50
H3 15.00 79.00 78.50 79.50
H4 17.50 102.00 101.50 102.50
H5 20.00 117.00 116.50 117.50
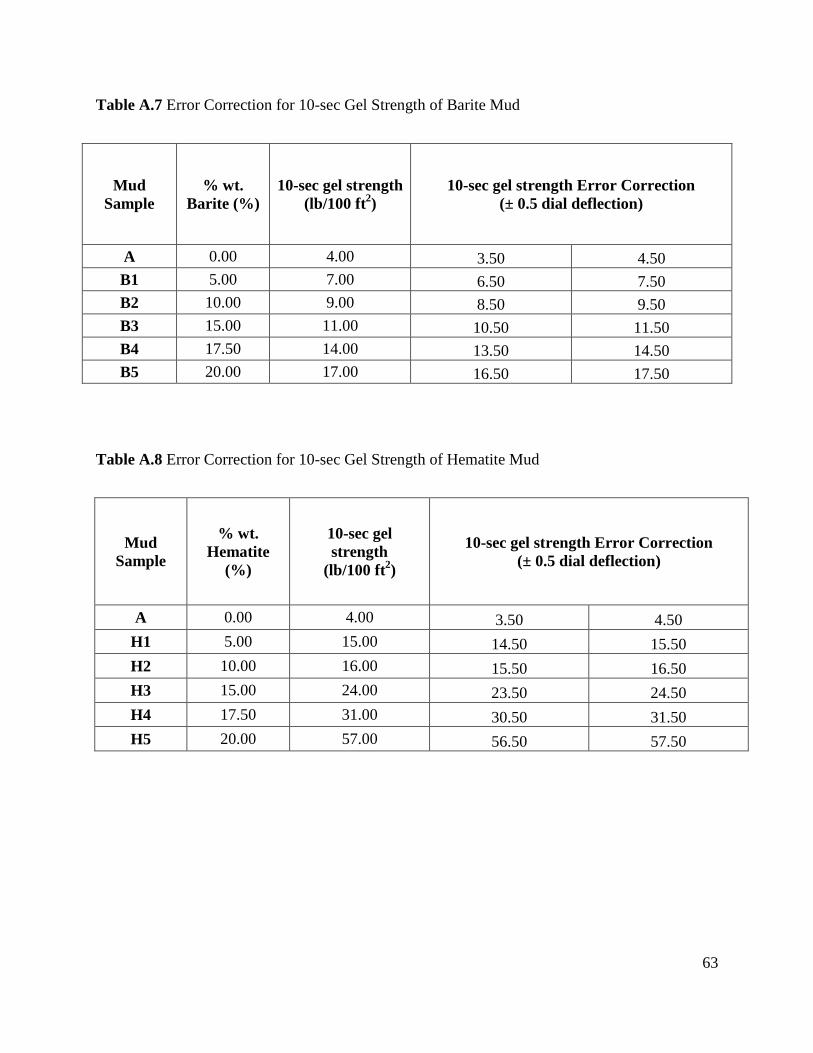
63
Table A.7 Error Correction for 10-sec Gel Strength of Barite Mud
Mud
Sample
% wt.
Barite (%)
10-sec gel strength
(lb/100 ft2)
10-sec gel strength Error Correction
(± 0.5 dial deflection)
A 0.00 4.00 3.50 4.50
B1 5.00 7.00 6.50 7.50
B2 10.00 9.00 8.50 9.50
B3 15.00 11.00 10.50 11.50
B4 17.50 14.00 13.50 14.50
B5 20.00 17.00 16.50 17.50
Table A.8 Error Correction for 10-sec Gel Strength of Hematite Mud
Mud
Sample
% wt.
Hematite
(%)
10-sec gel
strength
(lb/100 ft2)
10-sec gel strength Error Correction
(± 0.5 dial deflection)
A 0.00 4.00 3.50 4.50
H1 5.00 15.00 14.50 15.50
H2 10.00 16.00 15.50 16.50
H3 15.00 24.00 23.50 24.50
H4 17.50 31.00 30.50 31.50
H5 20.00 57.00 56.50 57.50
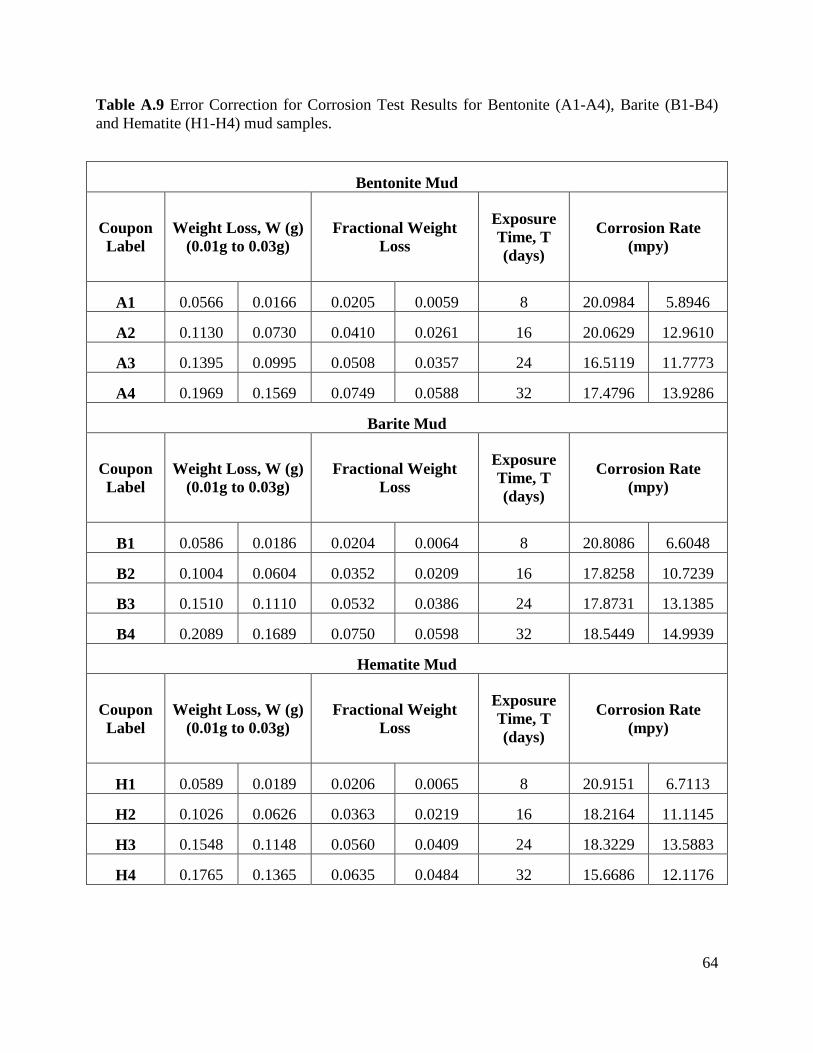
64
Table A.9 Error Correction for Corrosion Test Results for Bentonite (A1-A4), Barite (B1-B4)
and Hematite (H1-H4) mud samples.
Bentonite Mud
Coupon
Label
Weight Loss, W (g)
(0.01g to 0.03g)
Fractional Weight
Loss
Exposure
Time, T
(days)
Corrosion Rate
(mpy)
A1 0.0566 0.0166 0.0205 0.0059 8 20.0984 5.8946
A2 0.1130 0.0730 0.0410 0.0261 16 20.0629 12.9610
A3 0.1395 0.0995 0.0508 0.0357 24 16.5119 11.7773
A4 0.1969 0.1569 0.0749 0.0588 32 17.4796 13.9286
Barite Mud
Coupon
Label
Weight Loss, W (g)
(0.01g to 0.03g)
Fractional Weight
Loss
Exposure
Time, T
(days)
Corrosion Rate
(mpy)
B1 0.0586 0.0186 0.0204 0.0064 8 20.8086 6.6048
B2 0.1004 0.0604 0.0352 0.0209 16 17.8258 10.7239
B3 0.1510 0.1110 0.0532 0.0386 24 17.8731 13.1385
B4 0.2089 0.1689 0.0750 0.0598 32 18.5449 14.9939
Hematite Mud
Coupon
Label
Weight Loss, W (g)
(0.01g to 0.03g)
Fractional Weight
Loss
Exposure
Time, T
(days)
Corrosion Rate
(mpy)
H1 0.0589 0.0189 0.0206 0.0065 8 20.9151 6.7113
H2 0.1026 0.0626 0.0363 0.0219 16 18.2164 11.1145
H3 0.1548 0.1148 0.0560 0.0409 24 18.3229 13.5883
H4 0.1765 0.1365 0.0635 0.0484 32 15.6686 12.1176
Recommended