1
The Ohio State UniversityAerospace Research Center
J.P. Bons, A. Ameri, J. Gregory, R. Prenter, A. Hossain(4 Nov 2015 – NETL UTSR Workshop)
Revolutionizing Turbine Cooling with Micro-Architectures Enabled by Direct
Metal Laser Sintering
2
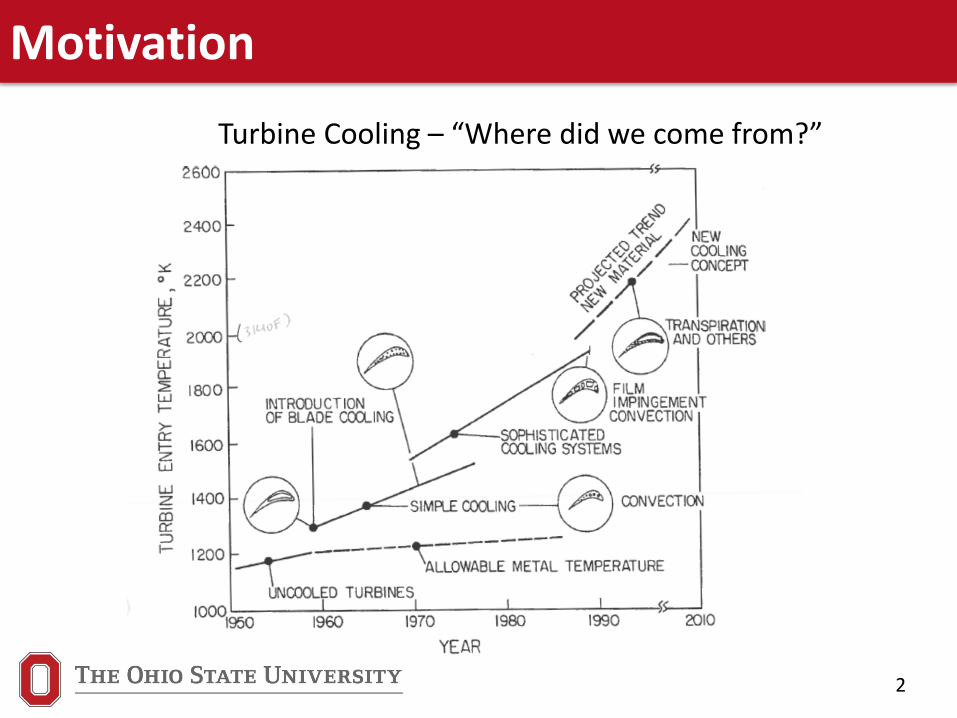
Motivation
Turbine Cooling – “Where did we come from?”
3
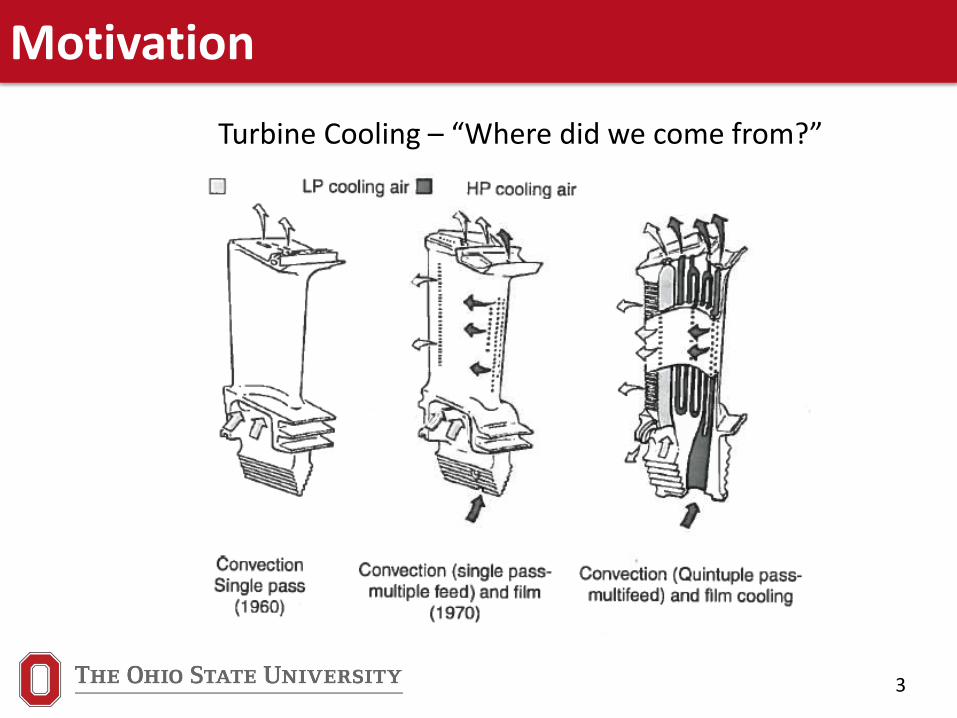
Motivation
Turbine Cooling – “Where did we come from?”
4
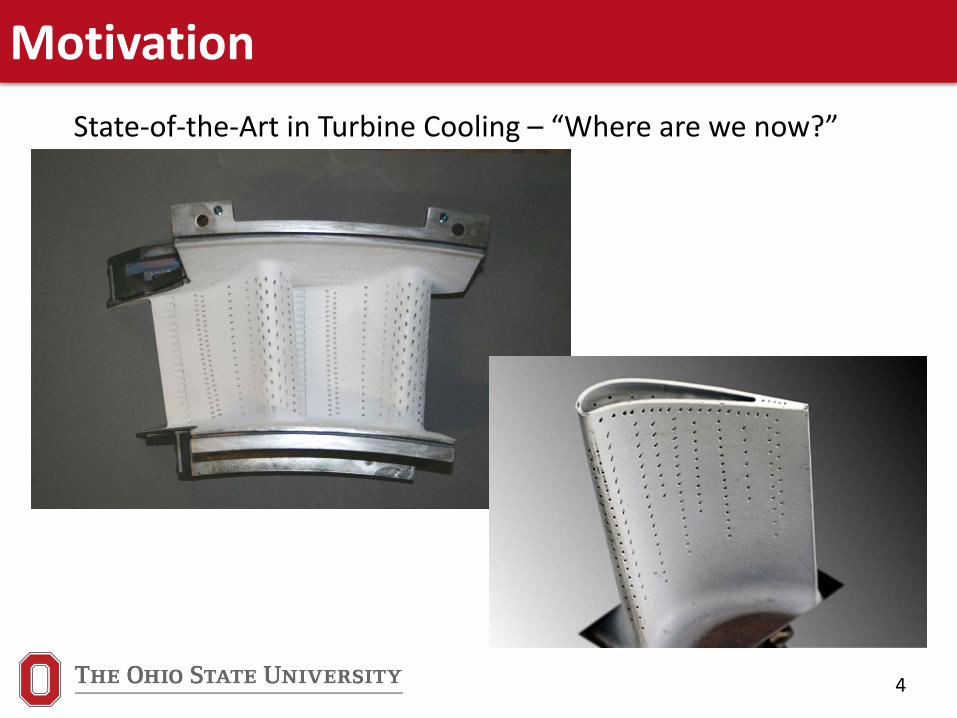
MotivationState-of-the-Art in Turbine Cooling – “Where are we now?”
5
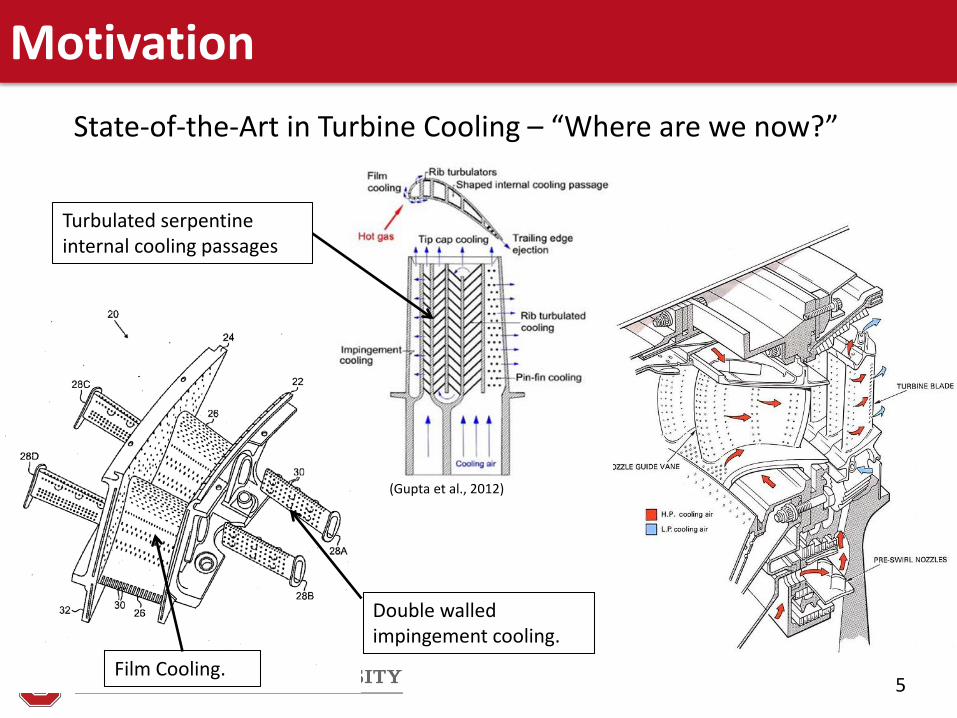
MotivationState-of-the-Art in Turbine Cooling – “Where are we now?”
Double walled impingement cooling.
Film Cooling.
Turbulated serpentine internal cooling passages
(Gupta et al., 2012)
6
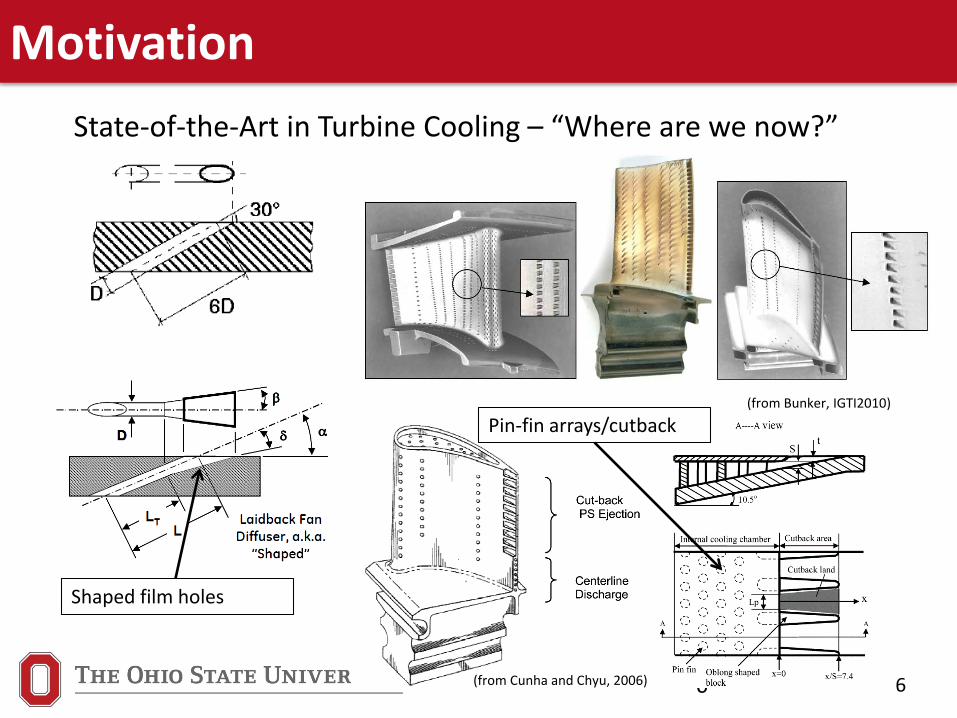
MotivationState-of-the-Art in Turbine Cooling – “Where are we now?”
6
Shaped film holes
(from Bunker, IGTI2010)
Pin-fin arrays/cutback
(from Cunha and Chyu, 2006)
7
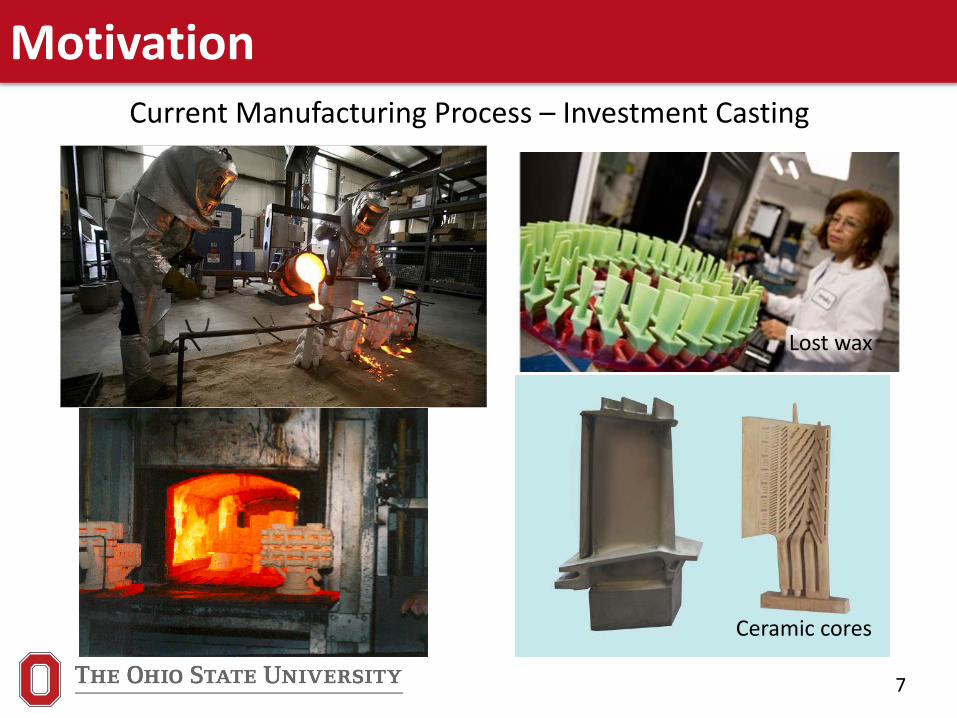
MotivationCurrent Manufacturing Process – Investment Casting
Ceramic cores
Lost wax
8
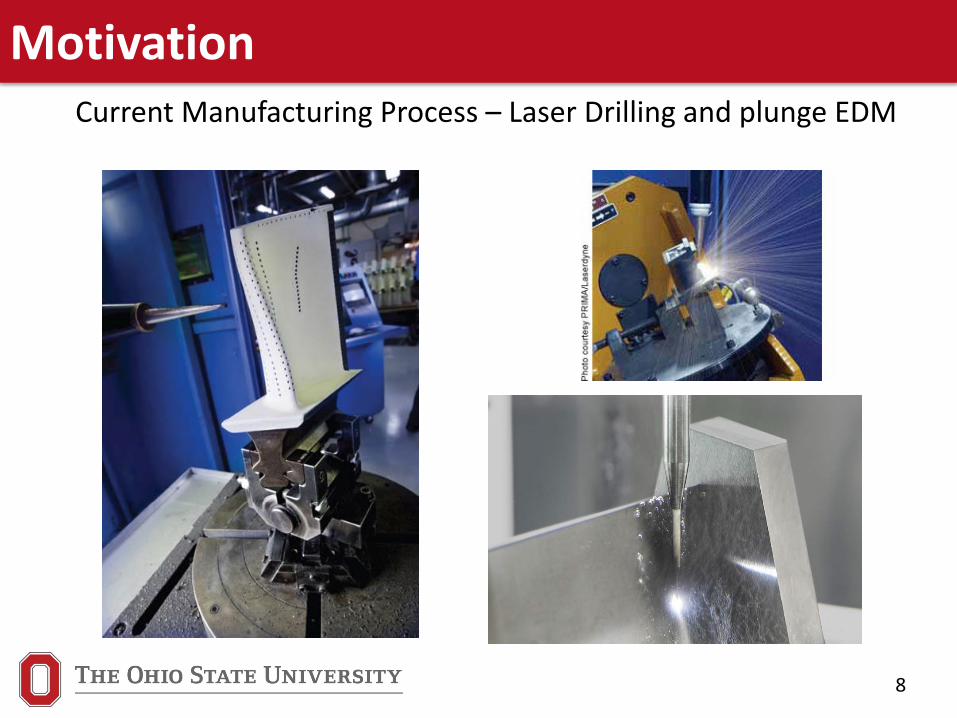
MotivationCurrent Manufacturing Process – Laser Drilling and plunge EDM
9
Critical Need
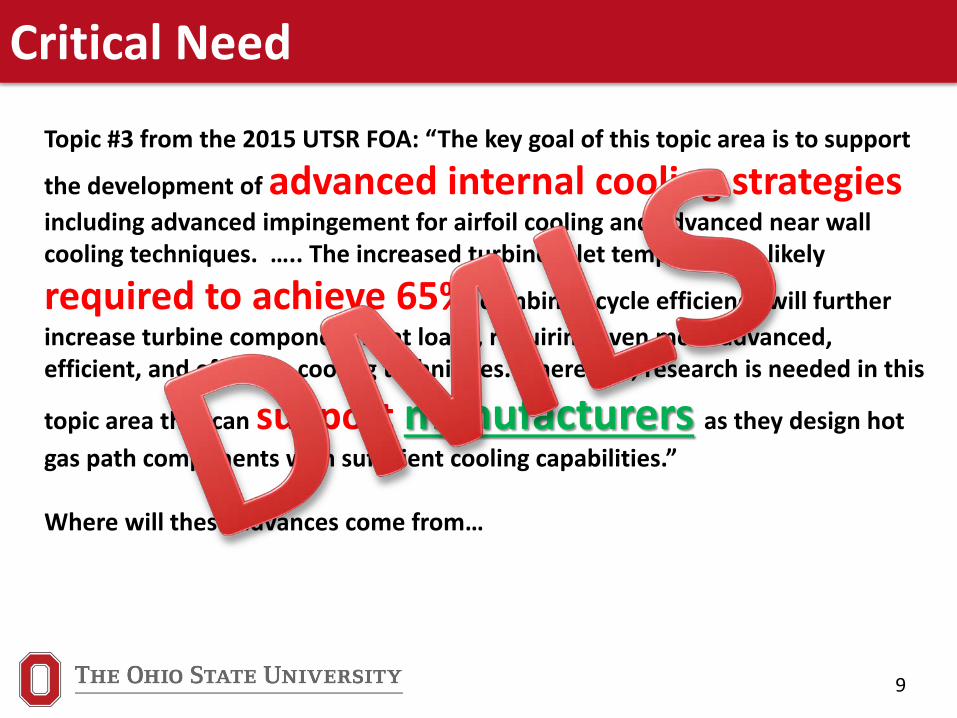
Topic #3 from the 2015 UTSR FOA: “The key goal of this topic area is to support
the development of advanced internal cooling strategiesincluding advanced impingement for airfoil cooling and advanced near wall cooling techniques. ….. The increased turbine inlet temperatures likely
required to achieve 65% combined cycle efficiency will further increase turbine component heat loads, requiring even more advanced, efficient, and effective cooling techniques. Therefore, research is needed in this
topic area that can support manufacturers as they design hot gas path components with sufficient cooling capabilities.”
Where will these advances come from…
10
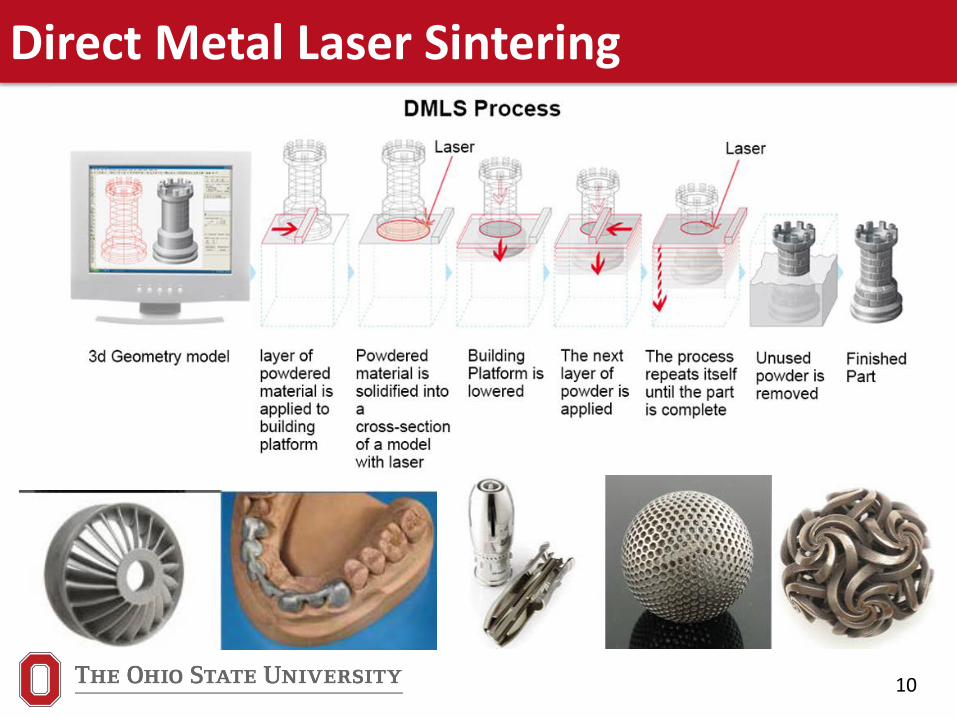
Direct Metal Laser Sintering
11
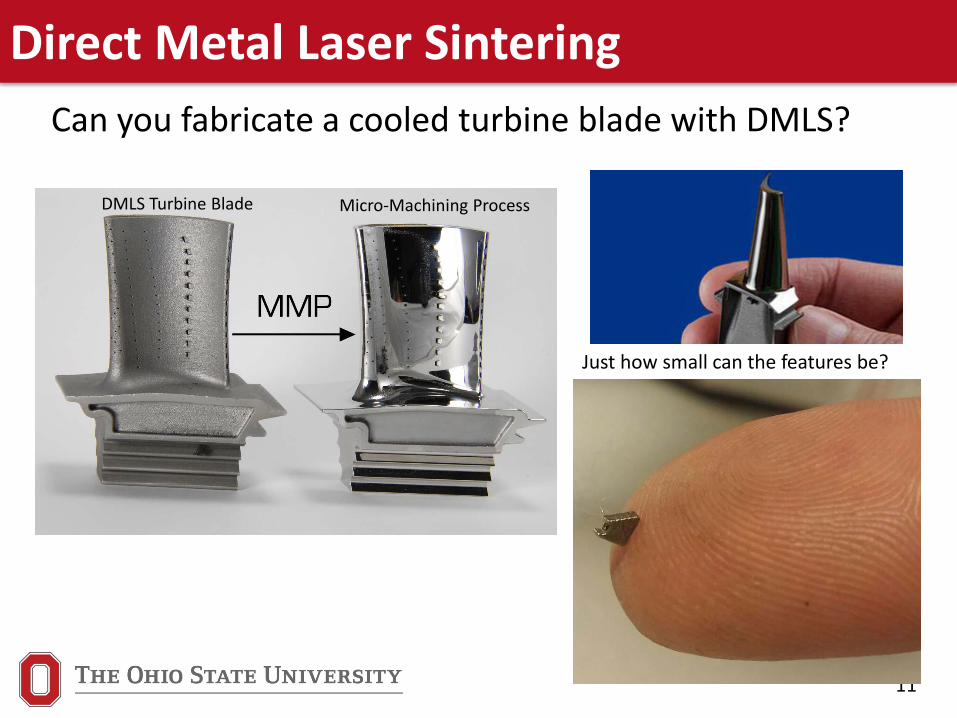
Direct Metal Laser Sintering
Just how small can the features be?
Can you fabricate a cooled turbine blade with DMLS?
Micro-Machining ProcessDMLS Turbine Blade
12
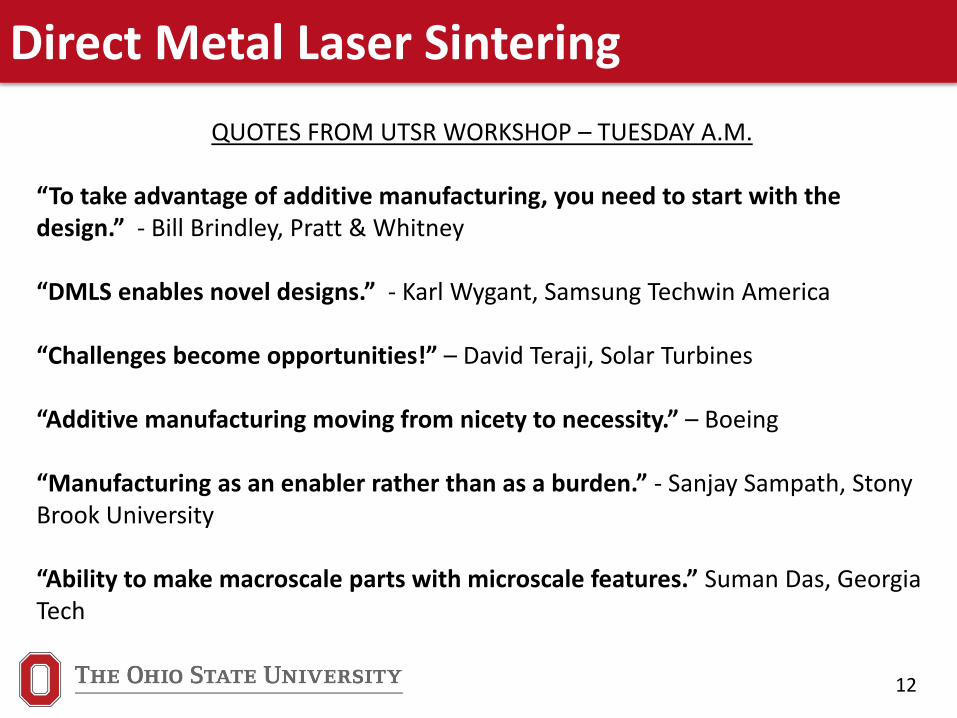
Direct Metal Laser SinteringQUOTES FROM UTSR WORKSHOP – TUESDAY A.M.
“To take advantage of additive manufacturing, you need to start with the design.” - Bill Brindley, Pratt & Whitney
“DMLS enables novel designs.” - Karl Wygant, Samsung Techwin America
“Challenges become opportunities!” – David Teraji, Solar Turbines
“Additive manufacturing moving from nicety to necessity.” – Boeing
“Manufacturing as an enabler rather than as a burden.” - Sanjay Sampath, Stony Brook University
“Ability to make macroscale parts with microscale features.” Suman Das, Georgia Tech
13
Objectives
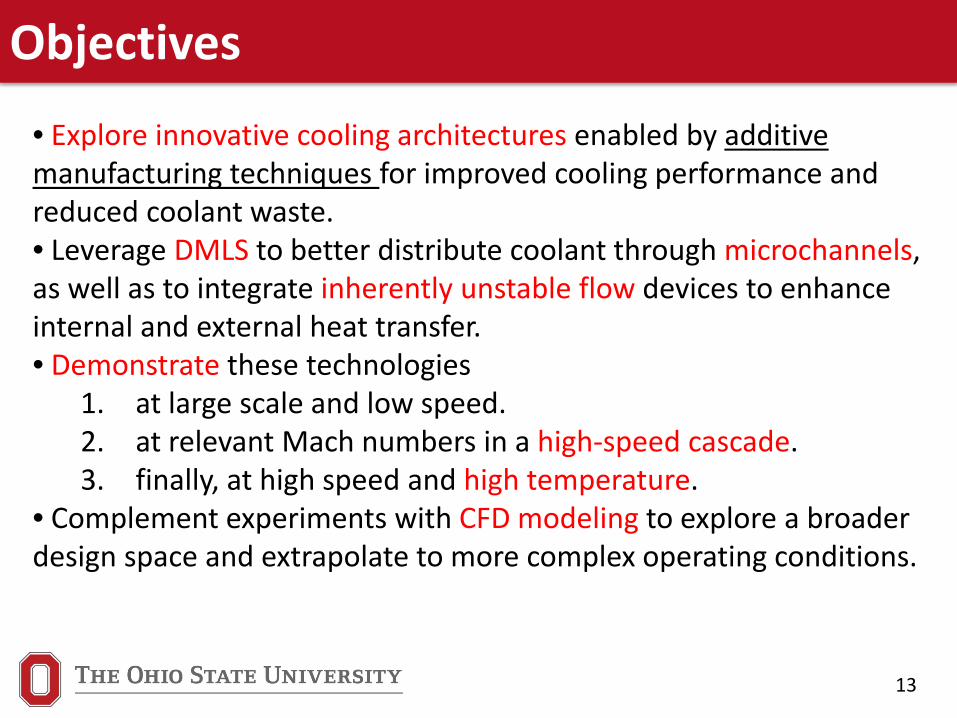
• Explore innovative cooling architectures enabled by additive manufacturing techniques for improved cooling performance and reduced coolant waste. • Leverage DMLS to better distribute coolant through microchannels, as well as to integrate inherently unstable flow devices to enhance internal and external heat transfer. • Demonstrate these technologies
1. at large scale and low speed. 2. at relevant Mach numbers in a high-speed cascade. 3. finally, at high speed and high temperature.
• Complement experiments with CFD modeling to explore a broader design space and extrapolate to more complex operating conditions.
14
Research TeamDr. Jeffrey BonsProfessorDepartment of Mechanical and Aerospace EngineeringOhio State UniversityColumbus, OH
Dr. Ali AmeriResearch ScientistDepartment of Mechanical and Aerospace EngineeringOhio State UniversityColumbus, OH
TEAM LEADFocus: Experimental Fluid Mechanics and Heat Transfer
Co-PIFocus: Computational Fluid Dynamics and Heat Transfer
Dr. Jim GregoryAssociate ProfessorDepartment of Mechanical and Aerospace EngineeringOhio State UniversityColumbus, OH
Co-PIFocus: Experimental Fluid Mechanics, Fluidic Oscillator Development
Robin PrenterPhD Candidate
Arif HossainPhD Candidate
15
Cooling Designs Enabled by DMLS
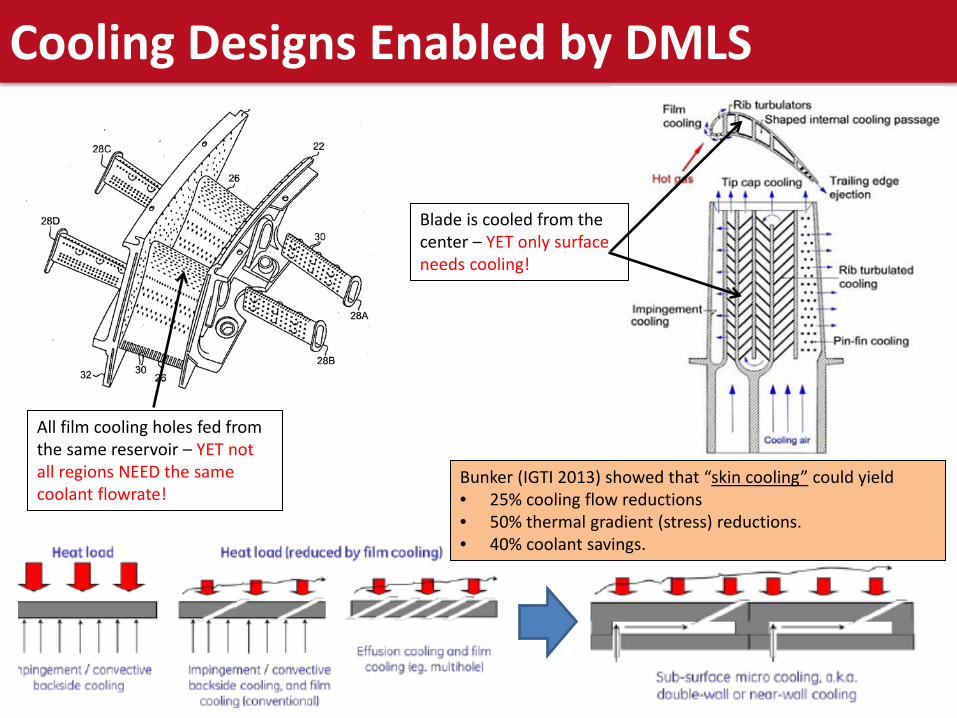
All film cooling holes fed from the same reservoir – YET not all regions NEED the same coolant flowrate!
Blade is cooled from the center – YET only surface needs cooling!
Bunker (IGTI 2013) showed that “skin cooling” could yield • 25% cooling flow reductions• 50% thermal gradient (stress) reductions. • 40% coolant savings.
16
Cooling Designs Enabled by DMLS
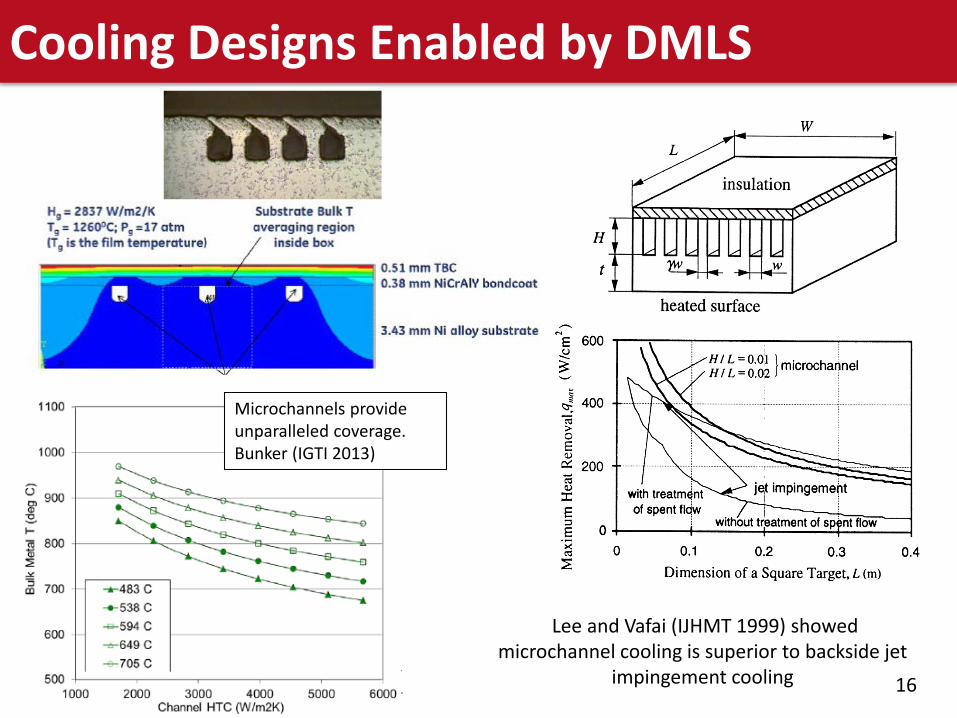
Lee and Vafai (IJHMT 1999) showed microchannel cooling is superior to backside jet
impingement cooling
Microchannels provide unparalleled coverage.Bunker (IGTI 2013)
17
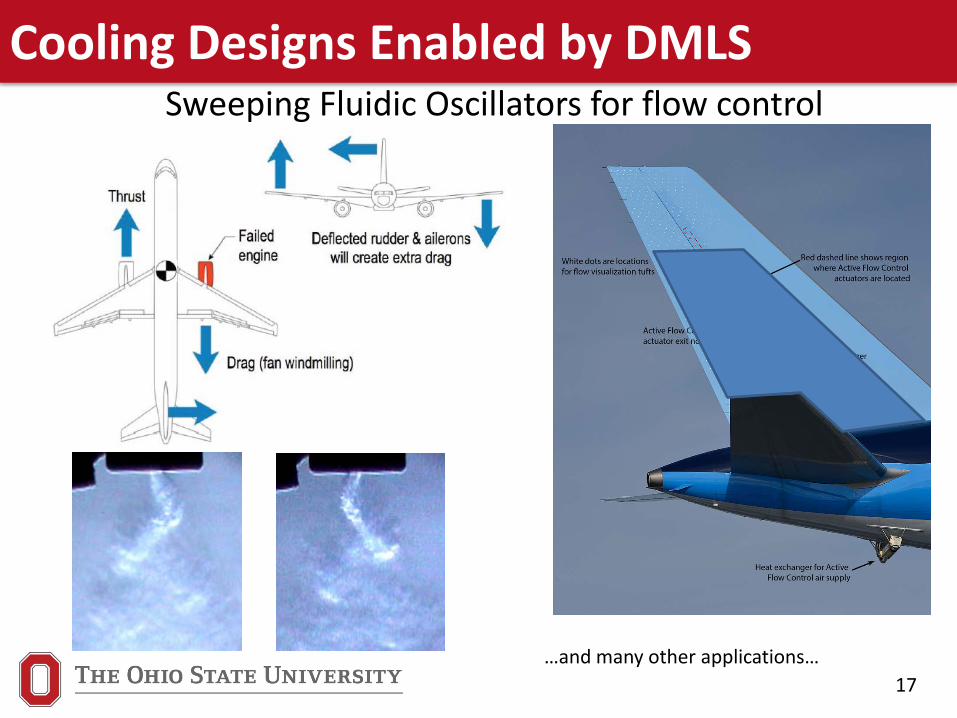
Cooling Designs Enabled by DMLS
…and many other applications…
Sweeping Fluidic Oscillators for flow control
18
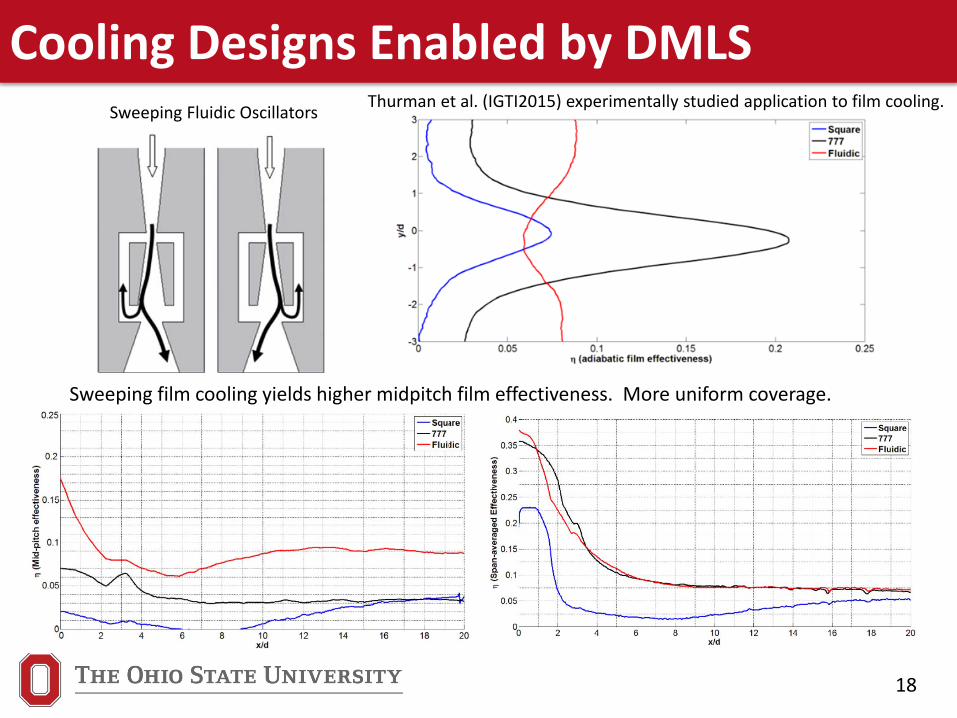
Cooling Designs Enabled by DMLS
Sweeping film cooling yields higher midpitch film effectiveness. More uniform coverage.
Sweeping Fluidic Oscillators Thurman et al. (IGTI2015) experimentally studied application to film cooling.
19
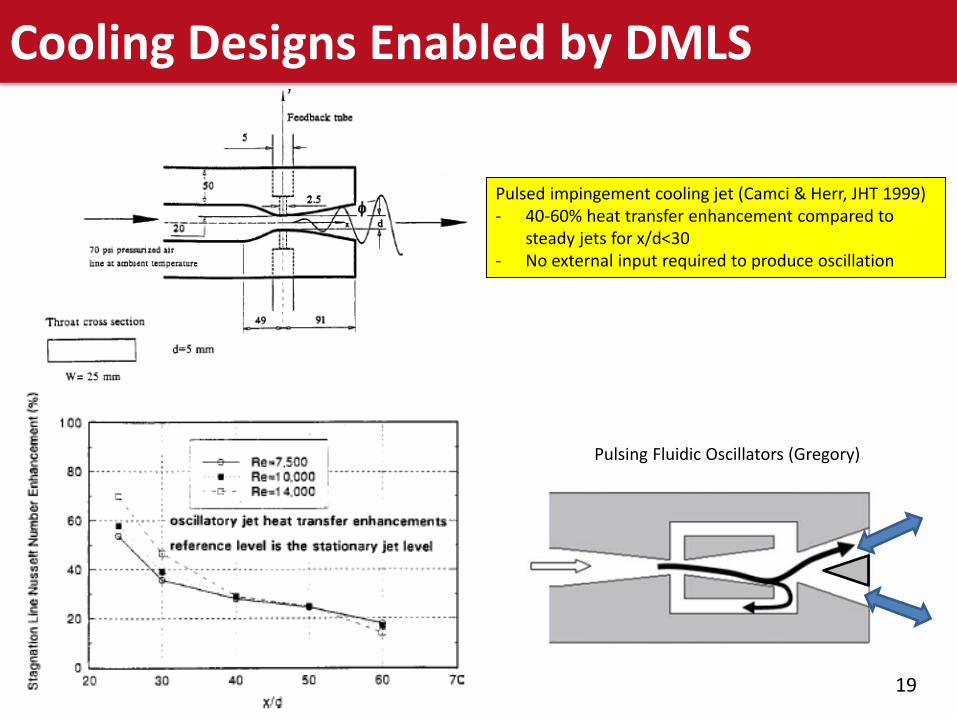
Cooling Designs Enabled by DMLS
Pulsing Fluidic Oscillators (Gregory)
Pulsed impingement cooling jet (Camci & Herr, JHT 1999)- 40-60% heat transfer enhancement compared to
steady jets for x/d<30 - No external input required to produce oscillation
20
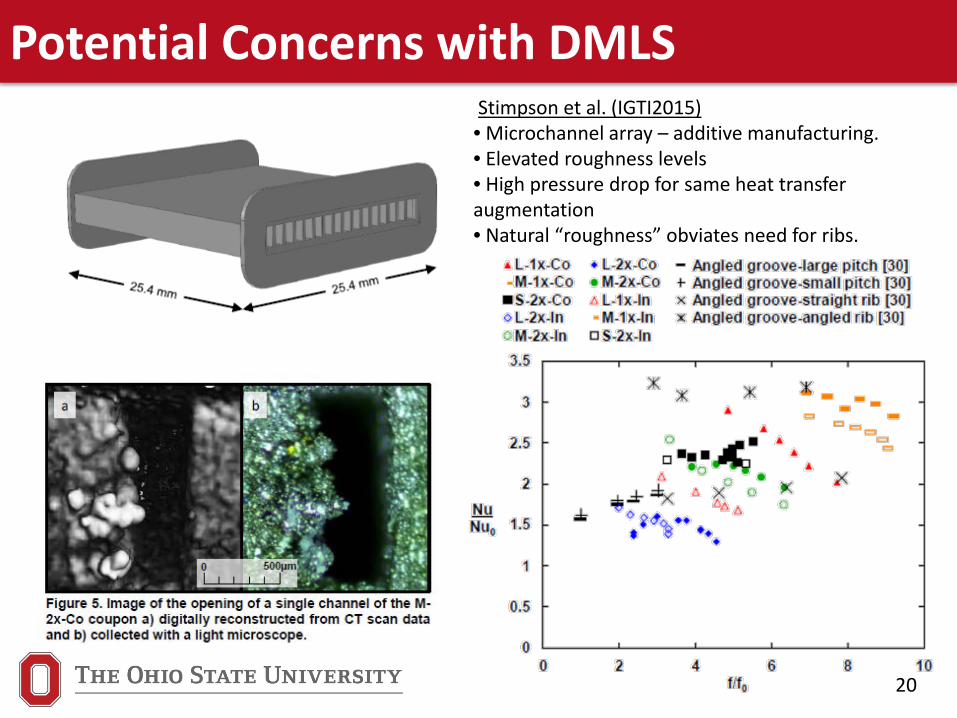
Potential Concerns with DMLSStimpson et al. (IGTI2015)• Microchannel array – additive manufacturing.• Elevated roughness levels• High pressure drop for same heat transfer augmentation• Natural “roughness” obviates need for ribs.
21
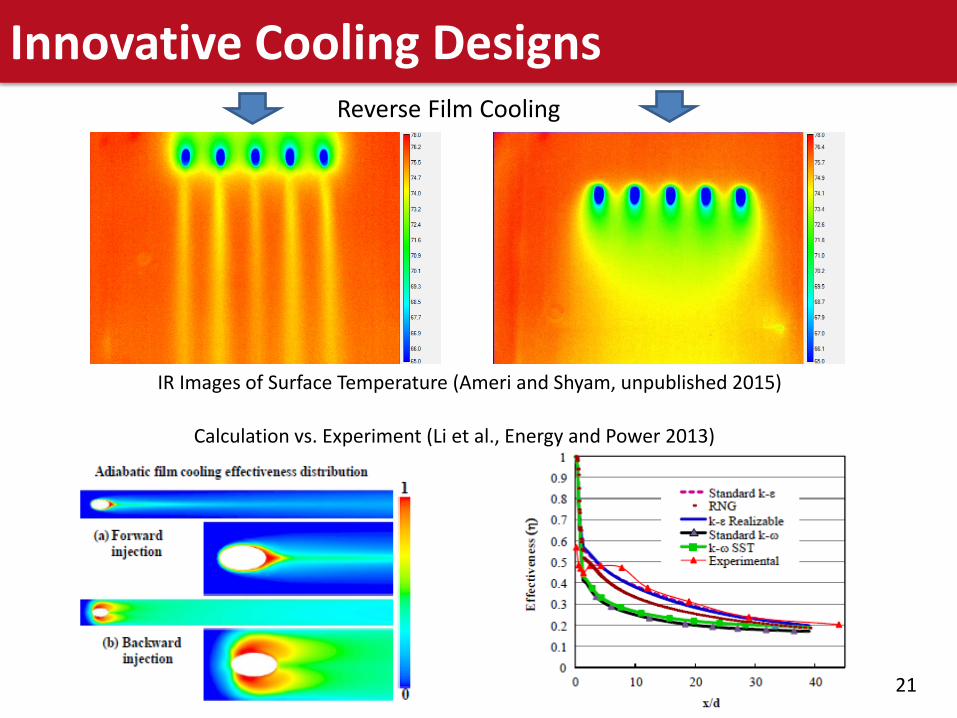
Innovative Cooling DesignsReverse Film Cooling
IR Images of Surface Temperature (Ameri and Shyam, unpublished 2015)
Calculation vs. Experiment (Li et al., Energy and Power 2013)
22
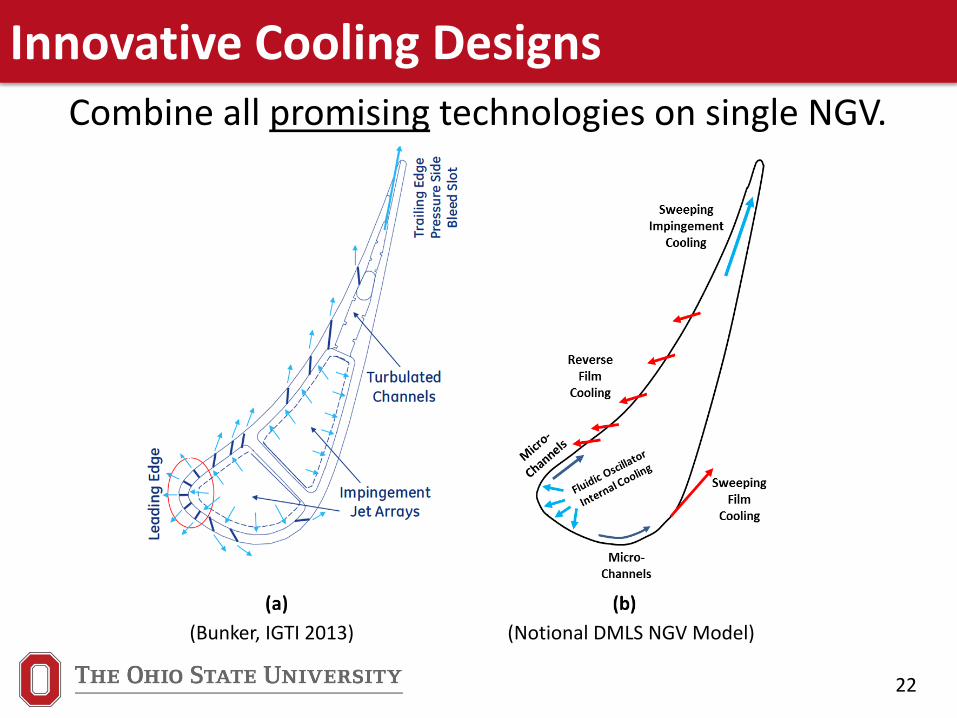
Innovative Cooling DesignsCombine all promising technologies on single NGV.
(Bunker, IGTI 2013) (Notional DMLS NGV Model)
23
Turbine Heat Transfer Facilities
• For innovative concepts to be viable, must be vetted in facilities that simulate the real operating environment
• Graduated complexity– Low speed, large scale– High speed, smaller scale– High speed, high temperature, small scale
24
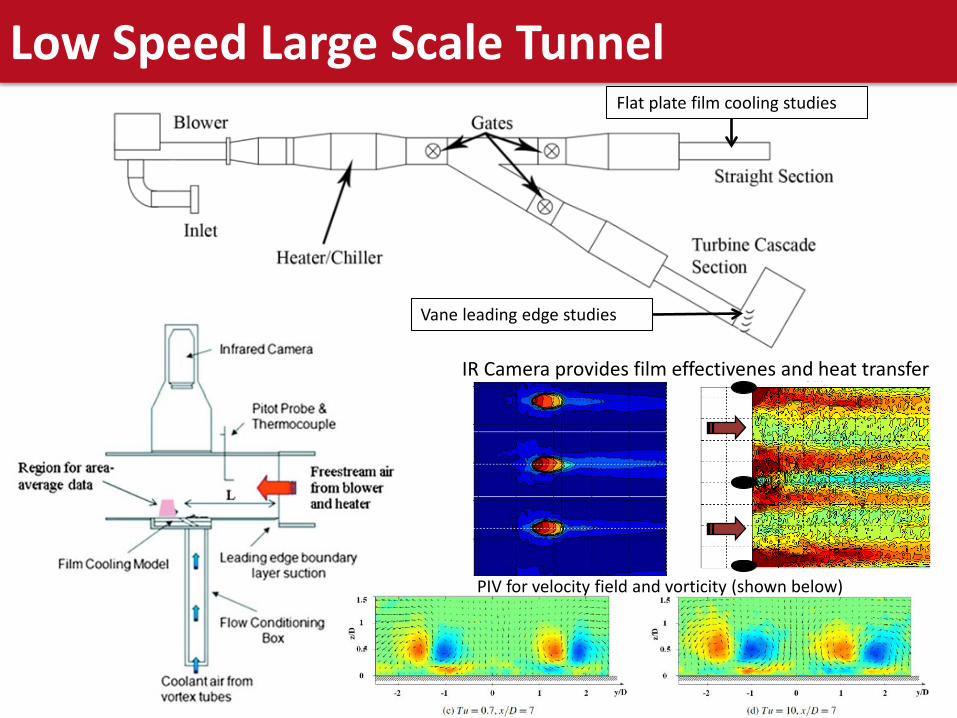
Low Speed Large Scale TunnelFlat plate film cooling studies
Vane leading edge studies
IR Camera provides film effectivenes and heat transfer
PIV for velocity field and vorticity (shown below)
25
Transonic Turbine Cascade
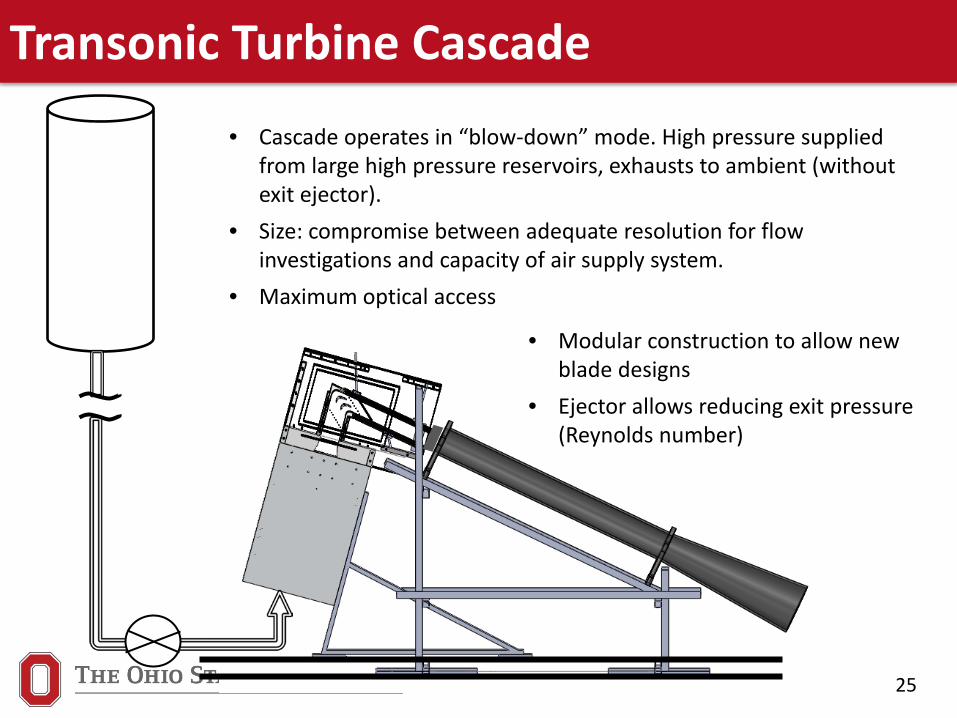
• Cascade operates in “blow-down” mode. High pressure supplied from large high pressure reservoirs, exhausts to ambient (without exit ejector).
• Size: compromise between adequate resolution for flow investigations and capacity of air supply system.
• Maximum optical access
• Modular construction to allow new blade designs
• Ejector allows reducing exit pressure (Reynolds number)
26
Transonic Turbine Cascade
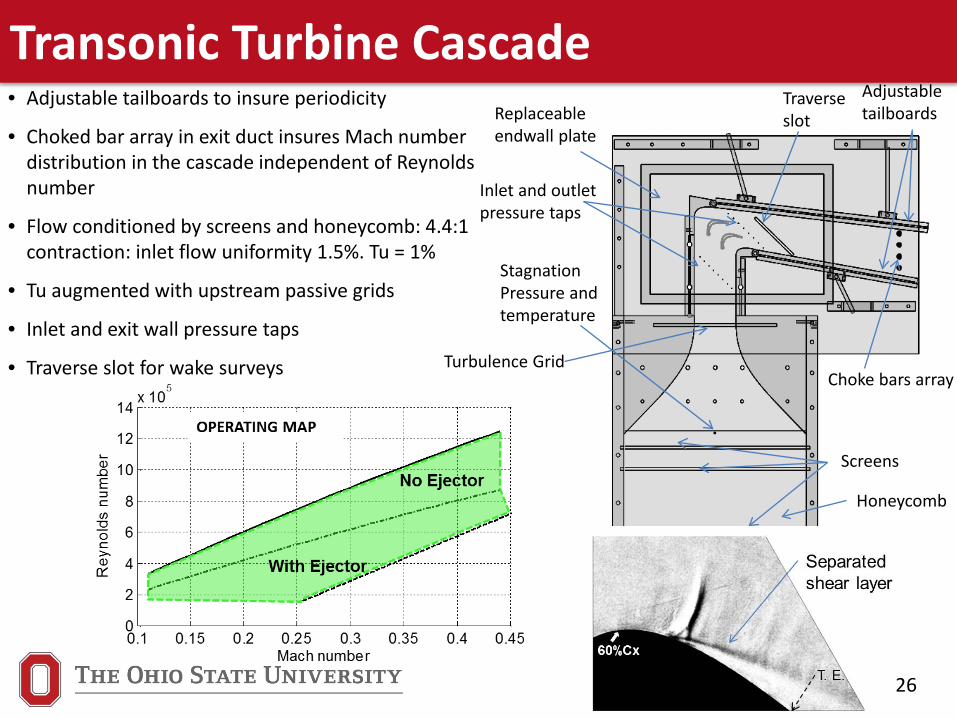
Honeycomb
Screens
Adjustable tailboardsReplaceable
endwall plate
Choke bars array
Inlet and outlet pressure taps
Traverse slot
Stagnation Pressure and temperature
Turbulence Grid
• Adjustable tailboards to insure periodicity
• Choked bar array in exit duct insures Mach number distribution in the cascade independent of Reynolds number
• Flow conditioned by screens and honeycomb: 4.4:1 contraction: inlet flow uniformity 1.5%. Tu = 1%
• Tu augmented with upstream passive grids
• Inlet and exit wall pressure taps
• Traverse slot for wake surveys
27
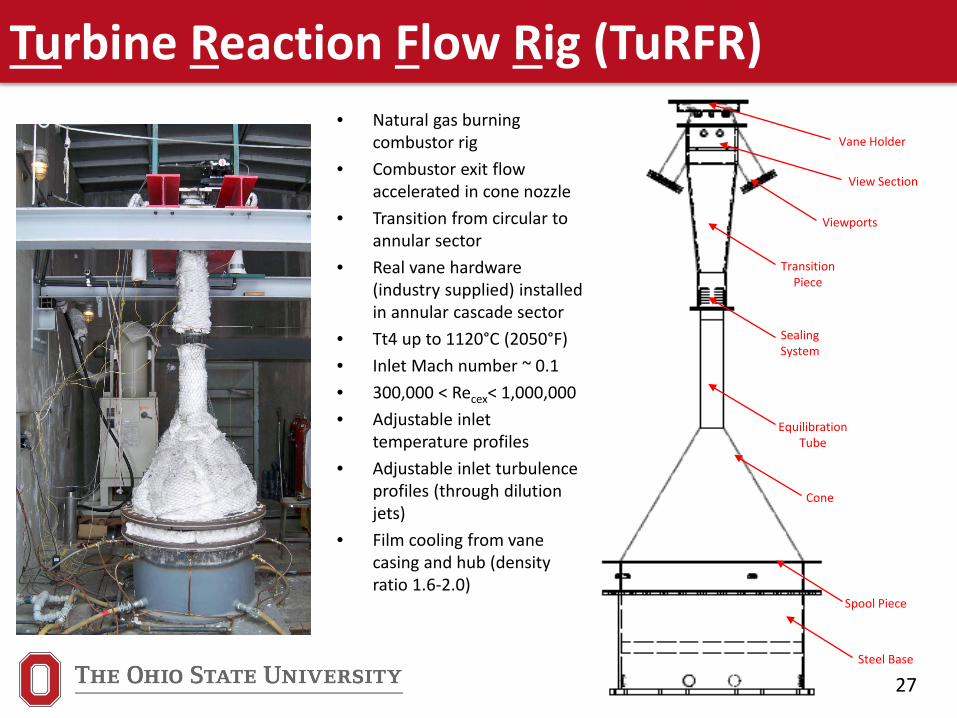
Turbine Reaction Flow Rig (TuRFR)• Natural gas burning
combustor rig• Combustor exit flow
accelerated in cone nozzle• Transition from circular to
annular sector• Real vane hardware
(industry supplied) installed in annular cascade sector
• Tt4 up to 1120°C (2050°F)• Inlet Mach number ~ 0.1• 300,000 < Recex< 1,000,000• Adjustable inlet
temperature profiles• Adjustable inlet turbulence
profiles (through dilution jets)
• Film cooling from vane casing and hub (density ratio 1.6-2.0)
27Steel Base
Equilibration Tube
Cone
Spool Piece
View Section
Viewports
Transition Piece
Sealing System
Vane Holder
28
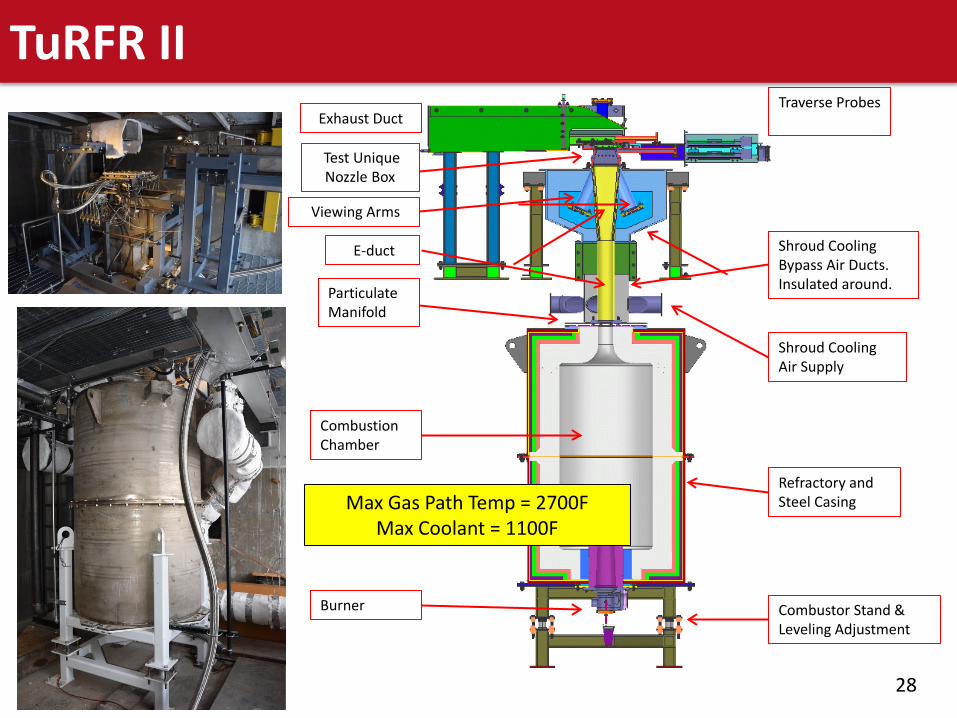
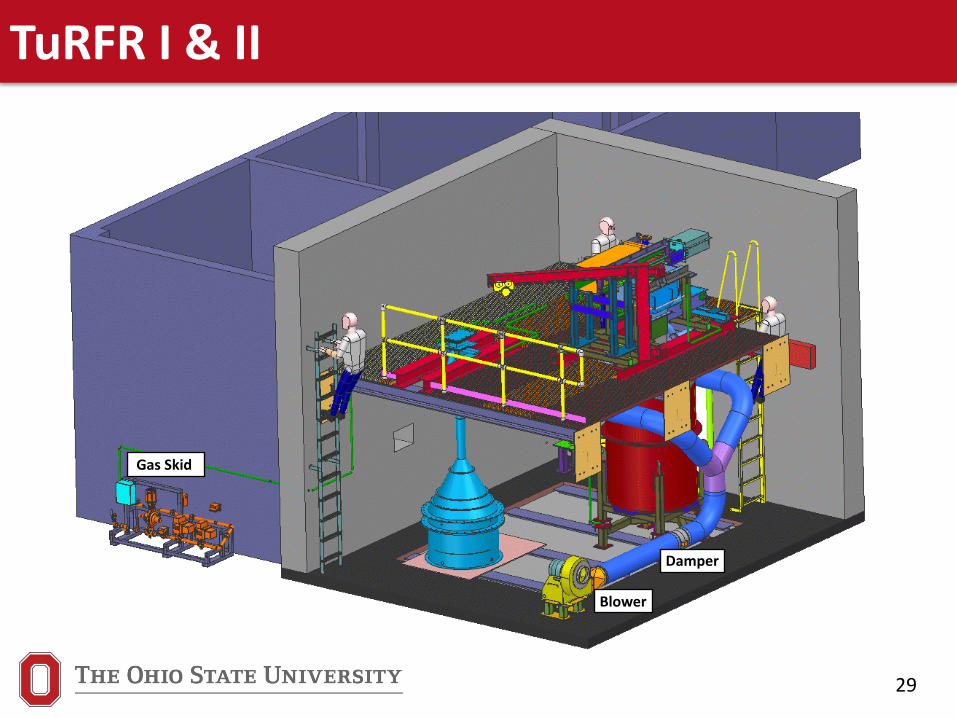
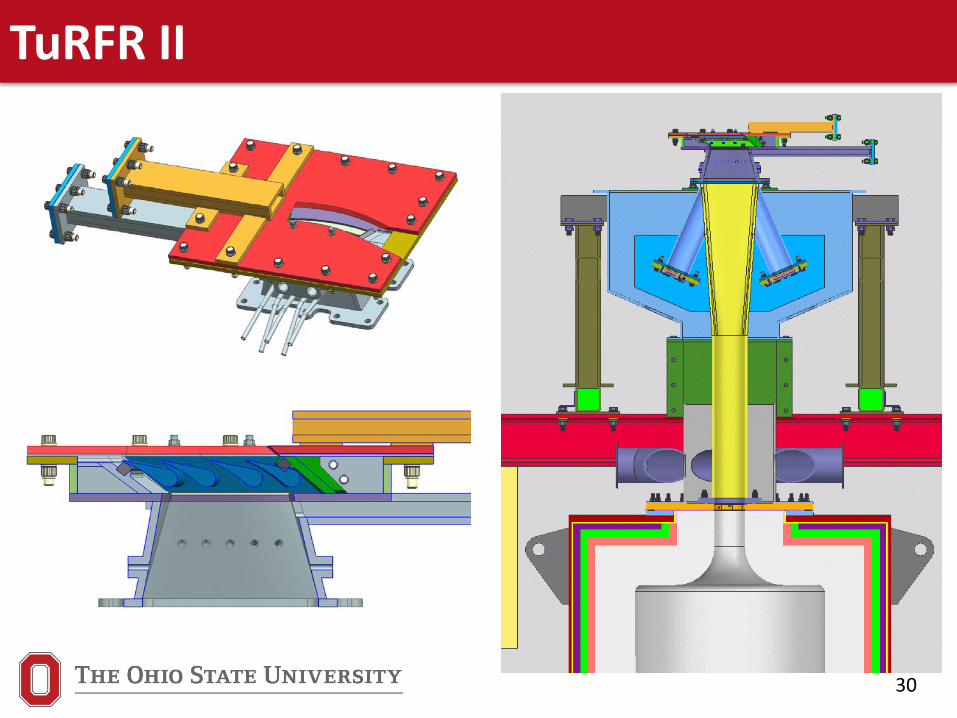
TuRFR IIExhaust Duct
Test Unique Nozzle Box
E-duct
ParticulateManifold
CombustionChamber
Combustor Stand & Leveling Adjustment
Refractory andSteel Casing
Shroud CoolingAir Supply
Shroud CoolingBypass Air Ducts.Insulated around.
Traverse Probes
Viewing Arms
Burner
Max Gas Path Temp = 2700FMax Coolant = 1100F
29
TuRFR I & II
Gas Skid
Blower
Damper
30
TuRFR II
31
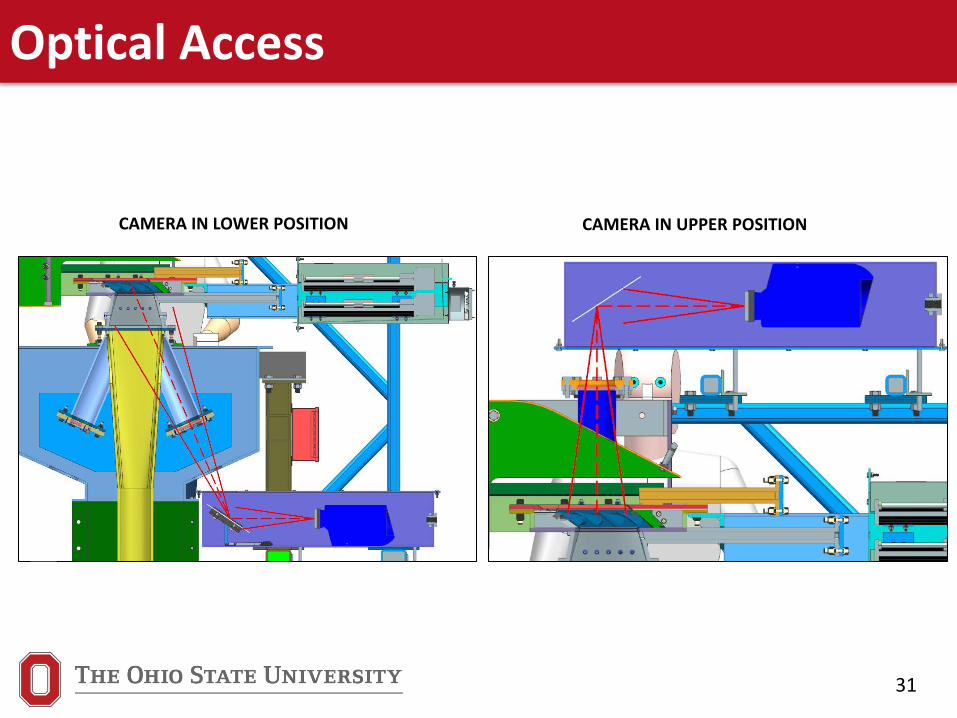
Optical Access
CAMERA IN LOWER POSITION CAMERA IN UPPER POSITION
32
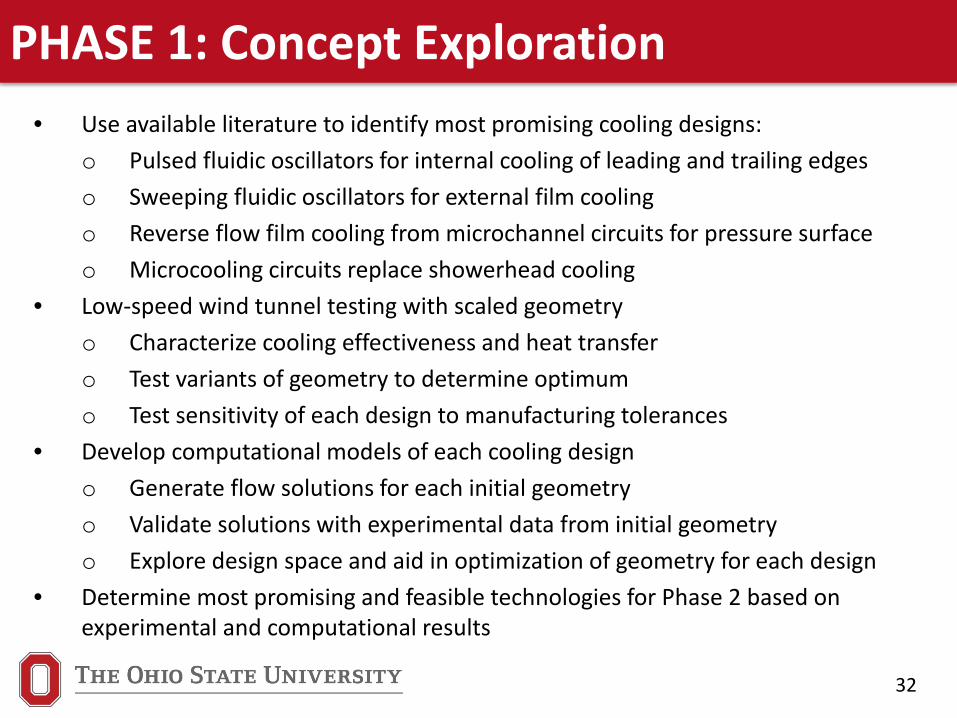
PHASE 1: Concept Exploration• Use available literature to identify most promising cooling designs:
o Pulsed fluidic oscillators for internal cooling of leading and trailing edgeso Sweeping fluidic oscillators for external film coolingo Reverse flow film cooling from microchannel circuits for pressure surfaceo Microcooling circuits replace showerhead cooling
• Low-speed wind tunnel testing with scaled geometryo Characterize cooling effectiveness and heat transfer o Test variants of geometry to determine optimumo Test sensitivity of each design to manufacturing tolerances
• Develop computational models of each cooling designo Generate flow solutions for each initial geometryo Validate solutions with experimental data from initial geometryo Explore design space and aid in optimization of geometry for each design
• Determine most promising and feasible technologies for Phase 2 based on experimental and computational results
33
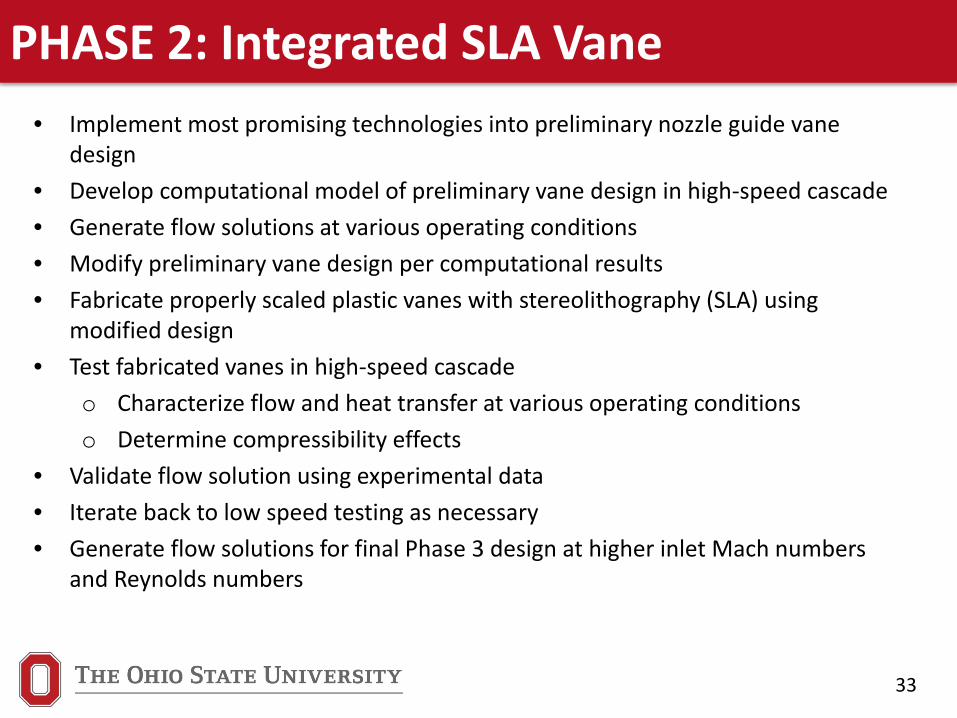
PHASE 2: Integrated SLA Vane• Implement most promising technologies into preliminary nozzle guide vane
design • Develop computational model of preliminary vane design in high-speed cascade • Generate flow solutions at various operating conditions• Modify preliminary vane design per computational results• Fabricate properly scaled plastic vanes with stereolithography (SLA) using
modified design• Test fabricated vanes in high-speed cascade
o Characterize flow and heat transfer at various operating conditionso Determine compressibility effects
• Validate flow solution using experimental data• Iterate back to low speed testing as necessary• Generate flow solutions for final Phase 3 design at higher inlet Mach numbers
and Reynolds numbers
34
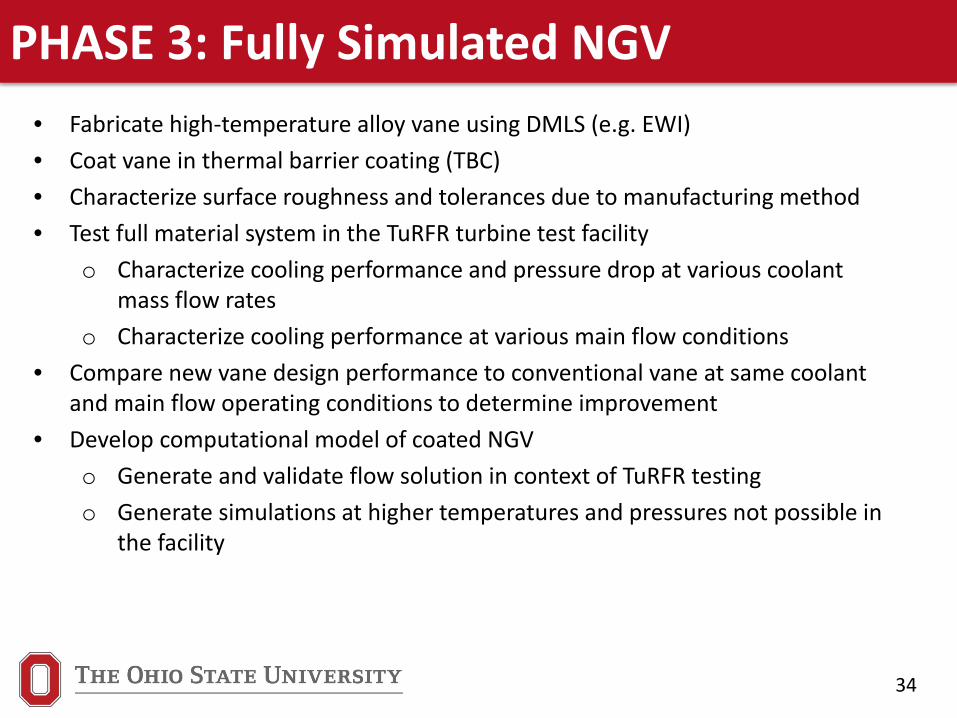
PHASE 3: Fully Simulated NGV• Fabricate high-temperature alloy vane using DMLS (e.g. EWI)• Coat vane in thermal barrier coating (TBC) • Characterize surface roughness and tolerances due to manufacturing method• Test full material system in the TuRFR turbine test facility
o Characterize cooling performance and pressure drop at various coolant mass flow rates
o Characterize cooling performance at various main flow conditions• Compare new vane design performance to conventional vane at same coolant
and main flow operating conditions to determine improvement• Develop computational model of coated NGV
o Generate and validate flow solution in context of TuRFR testingo Generate simulations at higher temperatures and pressures not possible in
the facility
35
Motivation for CFD• CFD can be used to elucidate and complement
experimental results and to inform the flow physics.
• Allows for extrapolation of flow outside the pressure and temperature limits of experiments.
• Understand unsteady and rotating frame of reference effects
• Allows exploration of the broader design space to find promising combinations of feasible variables for the application.
• CFD will be used at every stage of our research.
36
CFD Methods Utilized• CFD is a research tool not a goal.• The CFD, as much as possible, will be validated by
the experiments to ensure accuracy.• Our team has demonstrated capability to use
various CFD methods for solving fluid flow and heat transfer problems relevant to gas turbine flows.
• Any of RANS, URANS, DES or LES will be used, as needed, with structured or unstructured or meshless methods.
• Examples follow:
37
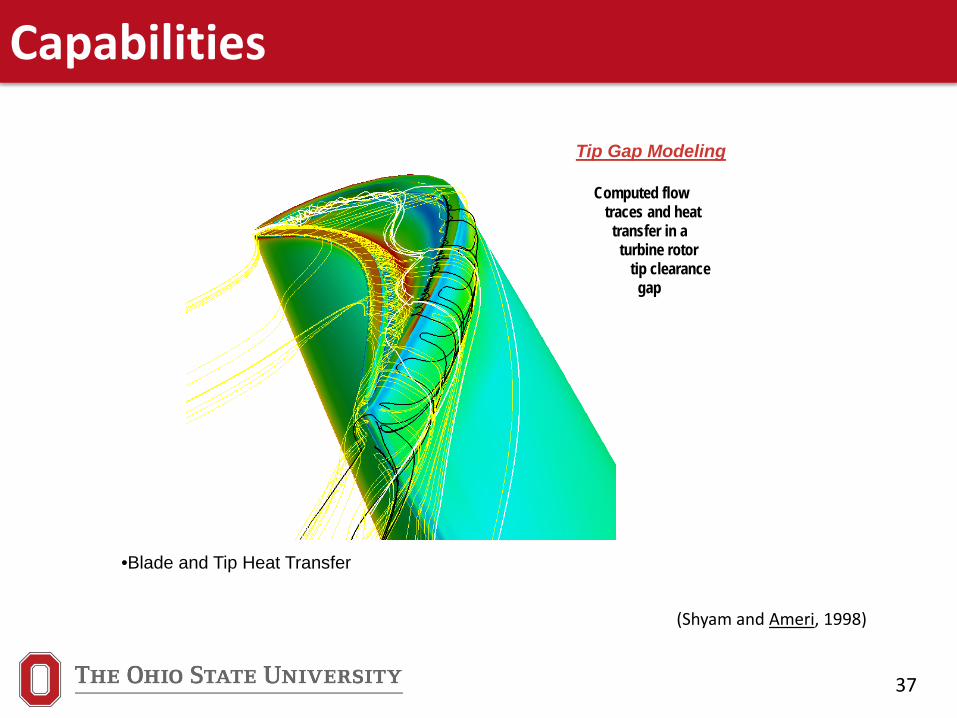
Capabilities
Computed flowtraces and heattransfer in a
turbine rotortip clearance
gap
Tip Gap Modeling
•Blade and Tip Heat Transfer
(Shyam and Ameri, 1998)
38
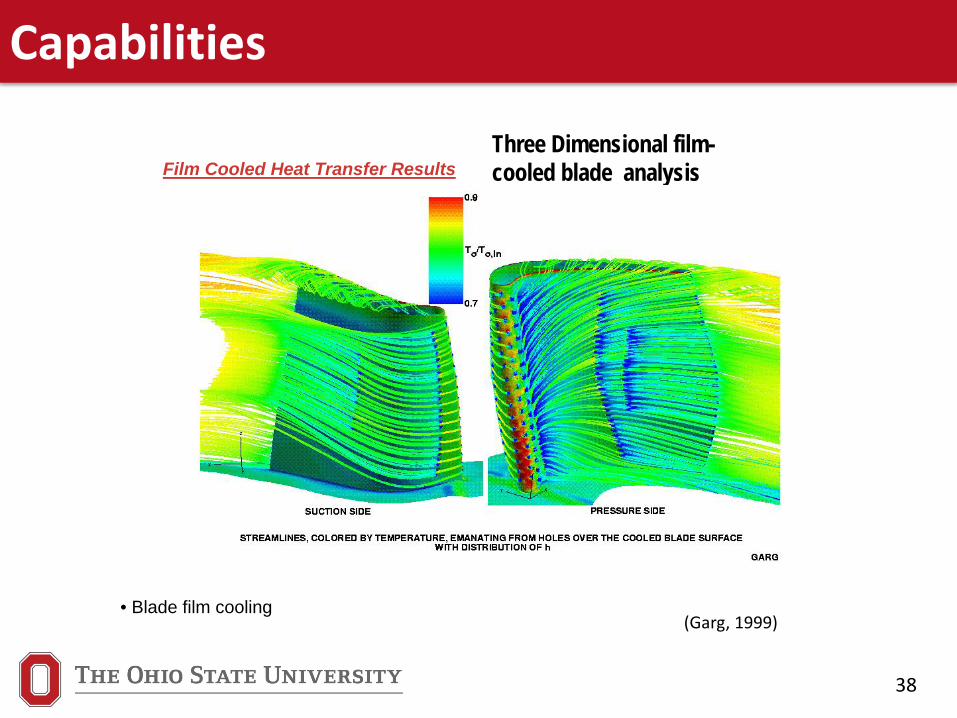
Capabilities
Film Cooled Heat Transfer ResultsThree Dimensional film-cooled blade analysis
• Blade film cooling(Garg, 1999)
39
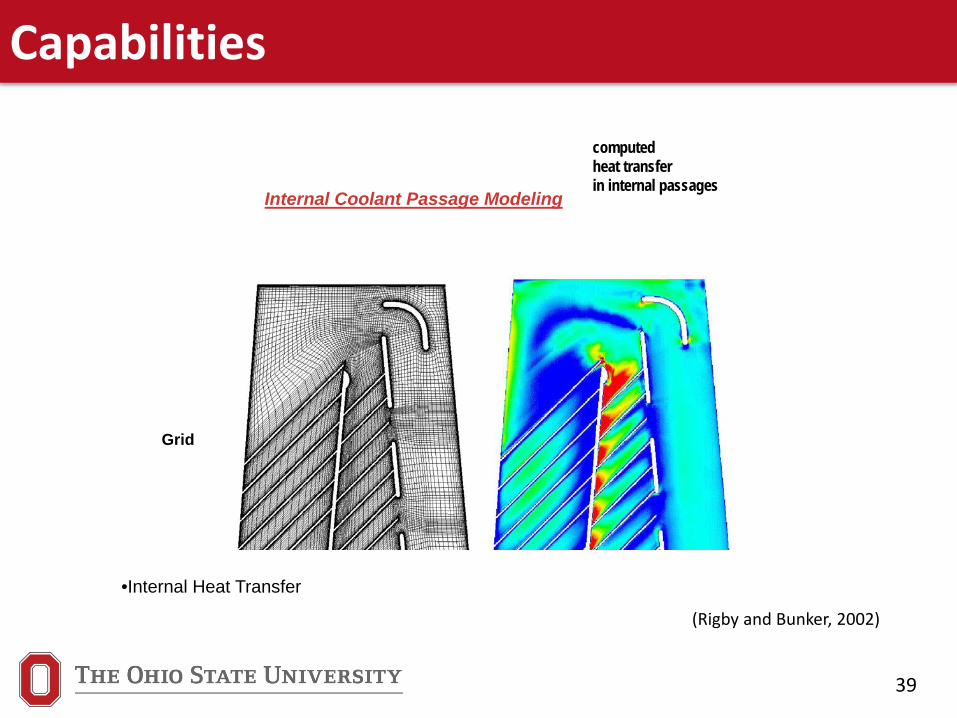
Capabilities
Internal Coolant Passage Modeling
computed heat transfer in internal passages
Grid
•Internal Heat Transfer
(Rigby and Bunker, 2002)
40
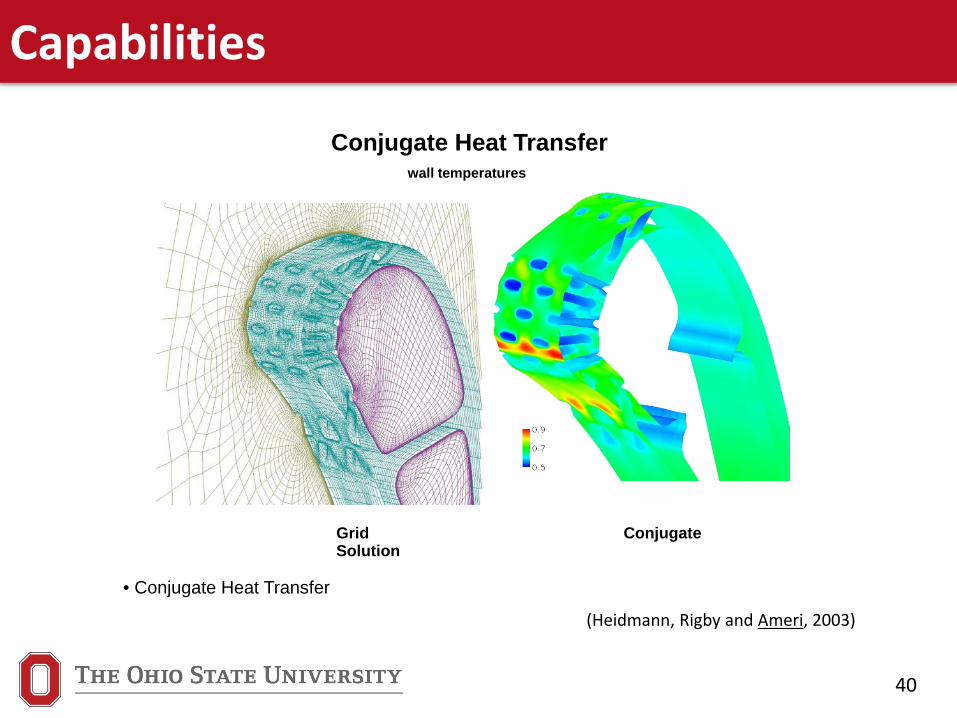
Capabilities
Conjugate Heat Transfer
Grid Conjugate Solution
Tw/To
wall temperatures
• Conjugate Heat Transfer
(Heidmann, Rigby and Ameri, 2003)
41
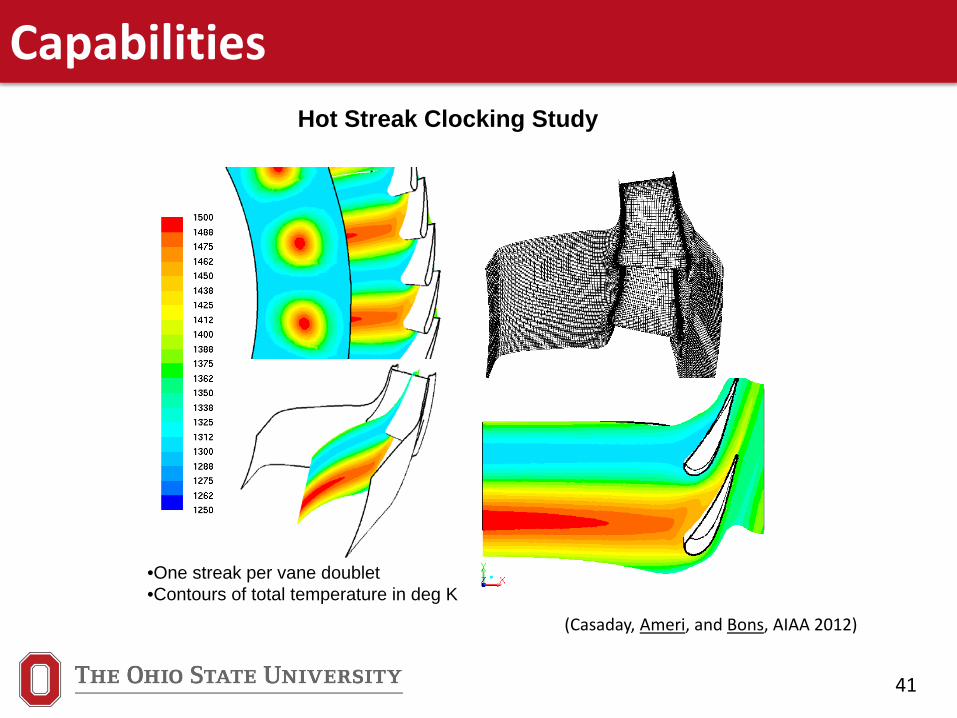
CapabilitiesHot Streak Clocking Study
•One streak per vane doublet•Contours of total temperature in deg K
(Casaday, Ameri, and Bons, AIAA 2012)
42
Capabilities
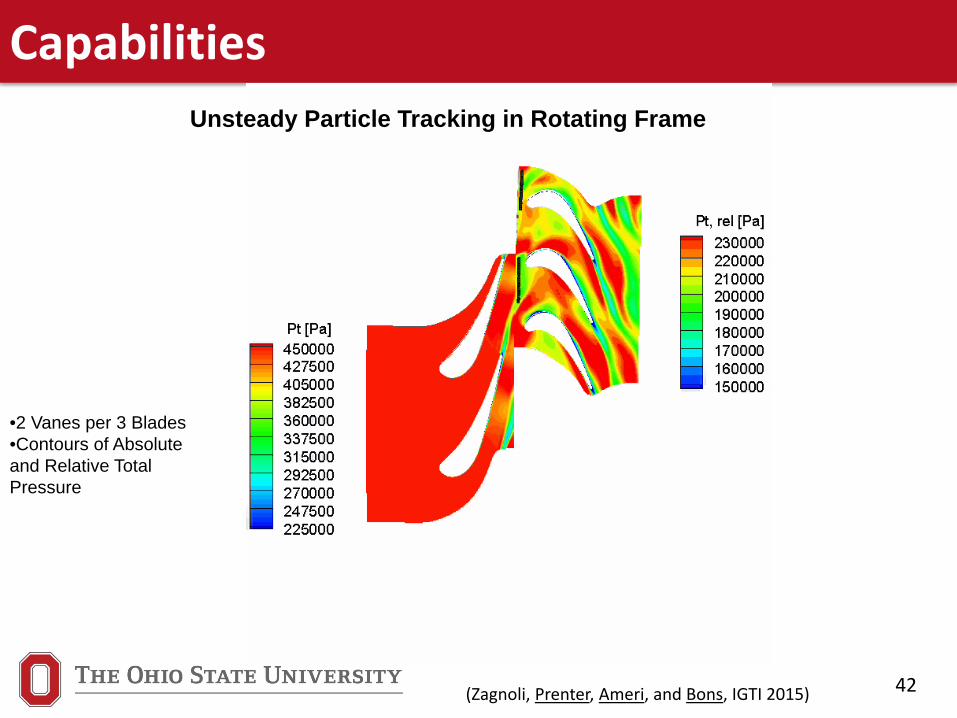
•2 Vanes per 3 Blades•Contours of Absolute and Relative Total Pressure
(Zagnoli, Prenter, Ameri, and Bons, IGTI 2015)
Unsteady Particle Tracking in Rotating Frame
43
Capabilities
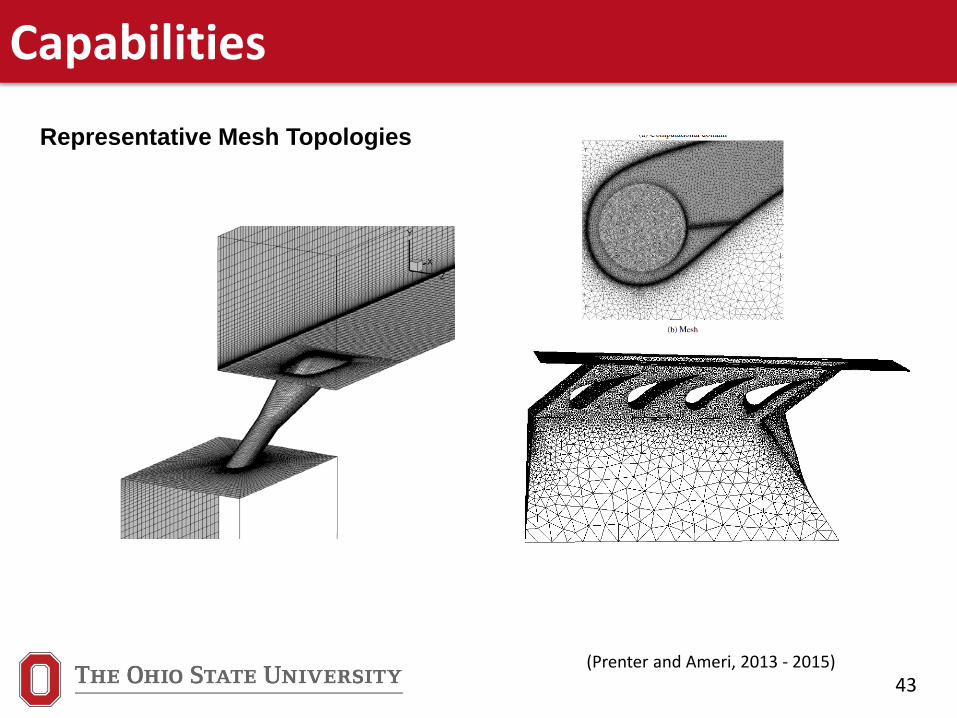
Representative Mesh Topologies
(Prenter and Ameri, 2013 - 2015)
44
Efficient Cooling
• Will seek to improve cooling by using methods that are more coolant efficient.
• Using fluidic devices can reduce blow off and the sweeping action can improve spanwise uniformity .
• Fluidic devices can be made to film cool by sweeping or impingement cool by pulsing.
• Reverse blowing may be an effective way of film cooling at high blowing-ratios.
• Internal micro-channels are shown to be capable of being more effective than impingement cooling.
45
CFD - Conclusions
• Validated CFD will be used, side by side, with bench top and more physically realistic configurations to extend the design space and explore more realistic physical conditions.
• We have the availability and have developed the expertise and gained the experience to perform such analyses using various steady and unsteady CFD methods to fulfil this task.
46
Accomplishments to Date
• Literature Search
• CFD Study
• Fluidic Oscillator development/preliminary study
• Reverse film cooling preliminary study

47
Preliminary CFD Studies
48
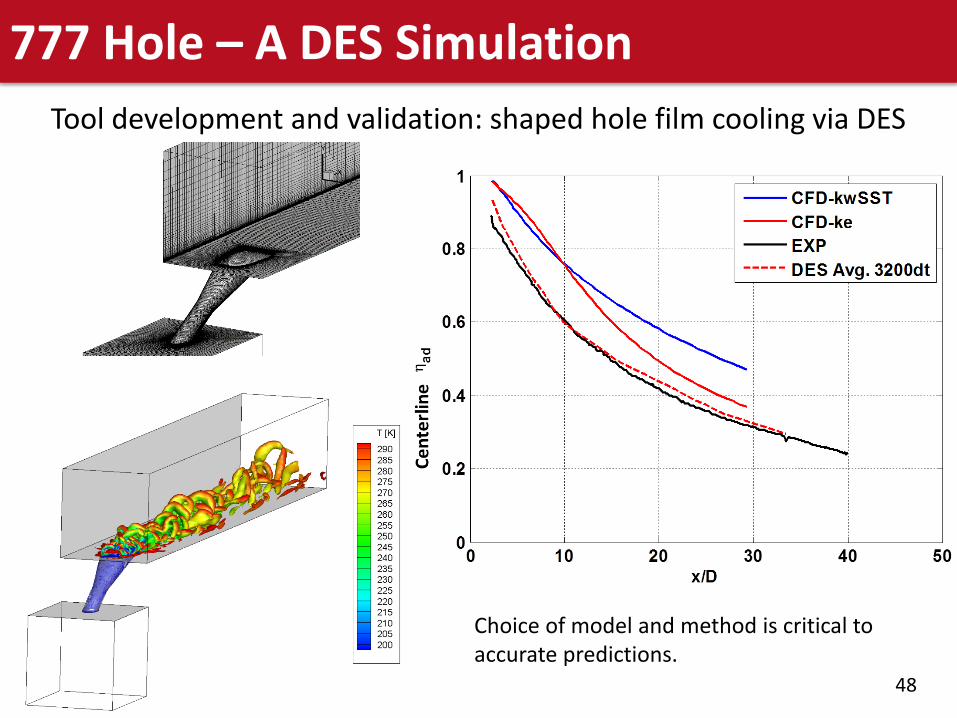
777 Hole – A DES SimulationTool development and validation: shaped hole film cooling via DES
Choice of model and method is critical to accurate predictions.
49
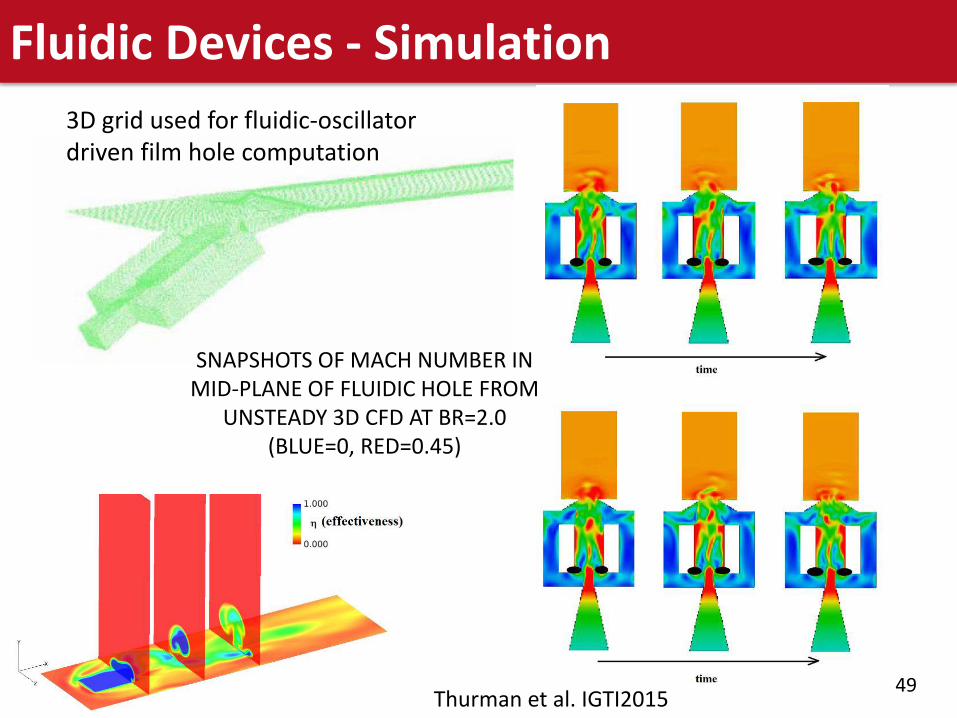
Fluidic Devices - Simulation3D grid used for fluidic-oscillator driven film hole computation
SNAPSHOTS OF MACH NUMBER IN MID-PLANE OF FLUIDIC HOLE FROM
UNSTEADY 3D CFD AT BR=2.0 (BLUE=0, RED=0.45)
Thurman et al. IGTI2015

50
Preliminary Testing Oct. 2015
Reverse Film Cooling
51
Preliminary Testing – Reverse Film Cooling
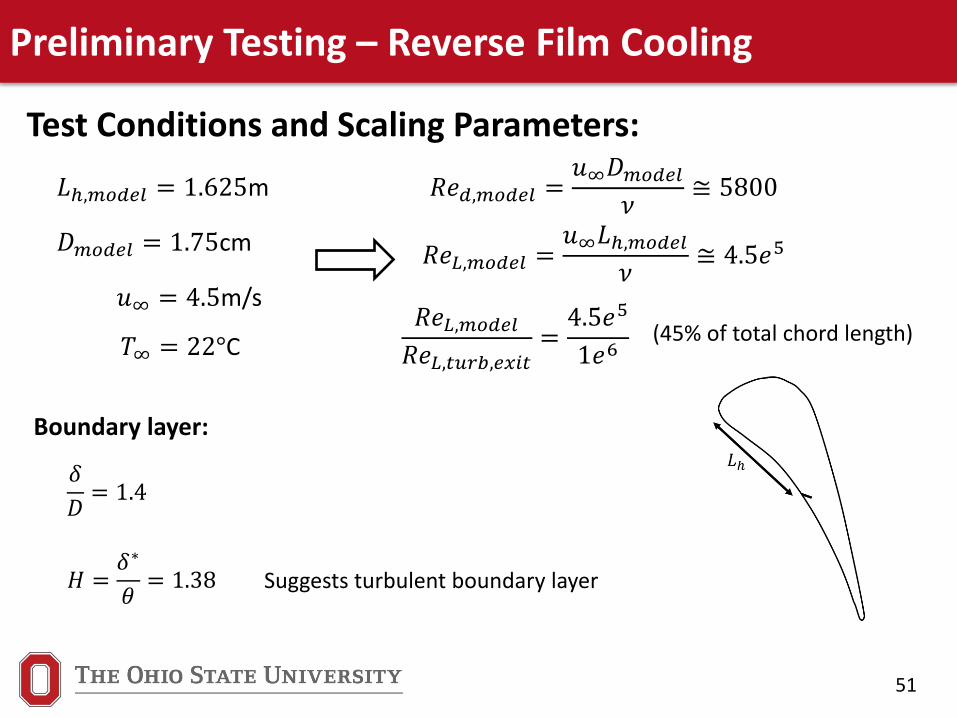
Test Conditions and Scaling Parameters:
𝑅𝑅𝑅𝑅𝐿𝐿,𝑚𝑚𝑚𝑚𝑚𝑚𝑚𝑚𝑚𝑚 =𝑢𝑢∞𝐿𝐿ℎ,𝑚𝑚𝑚𝑚𝑚𝑚𝑚𝑚𝑚𝑚
𝜈𝜈≅ 4.5𝑅𝑅5
𝑅𝑅𝑅𝑅𝑚𝑚,𝑚𝑚𝑚𝑚𝑚𝑚𝑚𝑚𝑚𝑚 =𝑢𝑢∞𝐷𝐷𝑚𝑚𝑚𝑚𝑚𝑚𝑚𝑚𝑚𝑚
𝜈𝜈≅ 5800
𝑅𝑅𝑅𝑅𝐿𝐿,𝑚𝑚𝑚𝑚𝑚𝑚𝑚𝑚𝑚𝑚
𝑅𝑅𝑅𝑅𝐿𝐿,𝑡𝑡𝑡𝑡𝑡𝑡𝑡𝑡,𝑚𝑚𝑒𝑒𝑒𝑒𝑡𝑡=
4.5𝑅𝑅5
1𝑅𝑅6(45% of total chord length)
𝐿𝐿ℎ,𝑚𝑚𝑚𝑚𝑚𝑚𝑚𝑚𝑚𝑚 = 1.625m
𝐷𝐷𝑚𝑚𝑚𝑚𝑚𝑚𝑚𝑚𝑚𝑚 = 1.75cm
𝑢𝑢∞ = 4.5m/s
𝑇𝑇∞ = 22°C
Boundary layer:
𝛿𝛿𝐷𝐷
= 1.4
𝐻𝐻 =𝛿𝛿∗
𝜃𝜃= 1.38 Suggests turbulent boundary layer
52
Preliminary Testing – Reverse Film Cooling
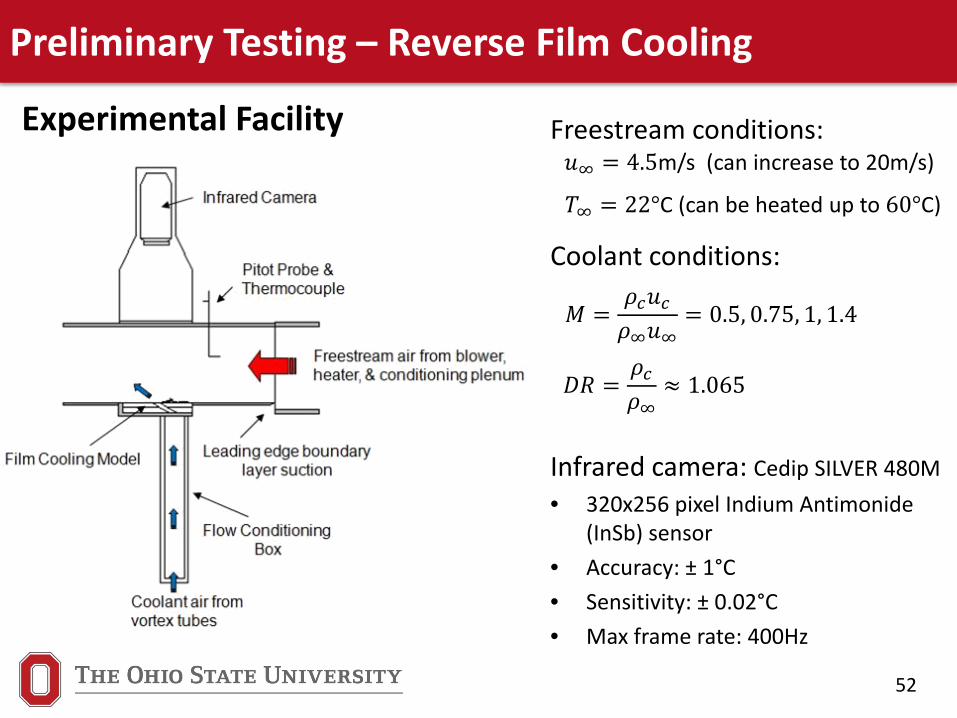
Experimental Facility Freestream conditions:
Coolant conditions:
Infrared camera: Cedip SILVER 480M• 320x256 pixel Indium Antimonide
(InSb) sensor• Accuracy: ± 1°C• Sensitivity: ± 0.02°C• Max frame rate: 400Hz
𝑢𝑢∞ = 4.5m/s (can increase to 20m/s)
𝑀𝑀 =𝜌𝜌𝑐𝑐𝑢𝑢𝑐𝑐𝜌𝜌∞𝑢𝑢∞
= 0.5, 0.75, 1, 1.4
𝐷𝐷𝑅𝑅 =𝜌𝜌𝑐𝑐𝜌𝜌∞
≈ 1.065
𝑇𝑇∞ = 22°C (can be heated up to 60°C)
53
Preliminary Testing – Reverse Film Cooling
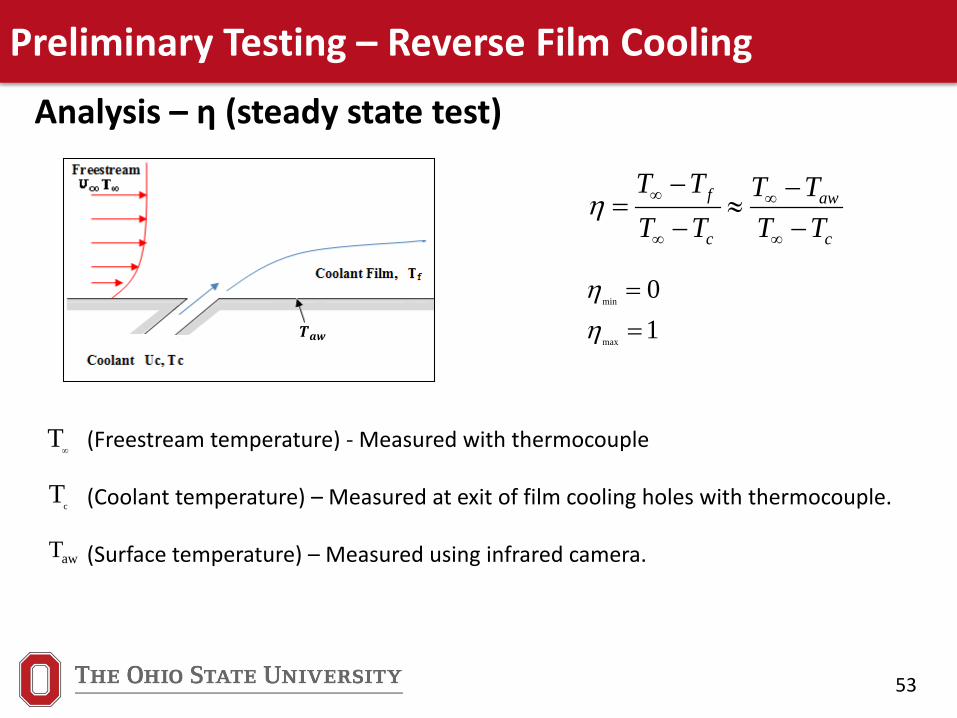
Analysis – η (steady state test)
c
aw
c
f
TTTT
TTTT
−−
≈−
−=
∞
∞
∞
∞η
(Freestream temperature) - Measured with thermocouple
(Coolant temperature) – Measured at exit of film cooling holes with thermocouple.
(Surface temperature) – Measured using infrared camera.
10
max
min
==
ηη
∞T
awT
cT
𝑻𝑻𝒂𝒂𝒂𝒂
54
Preliminary Testing – Reverse Film Cooling
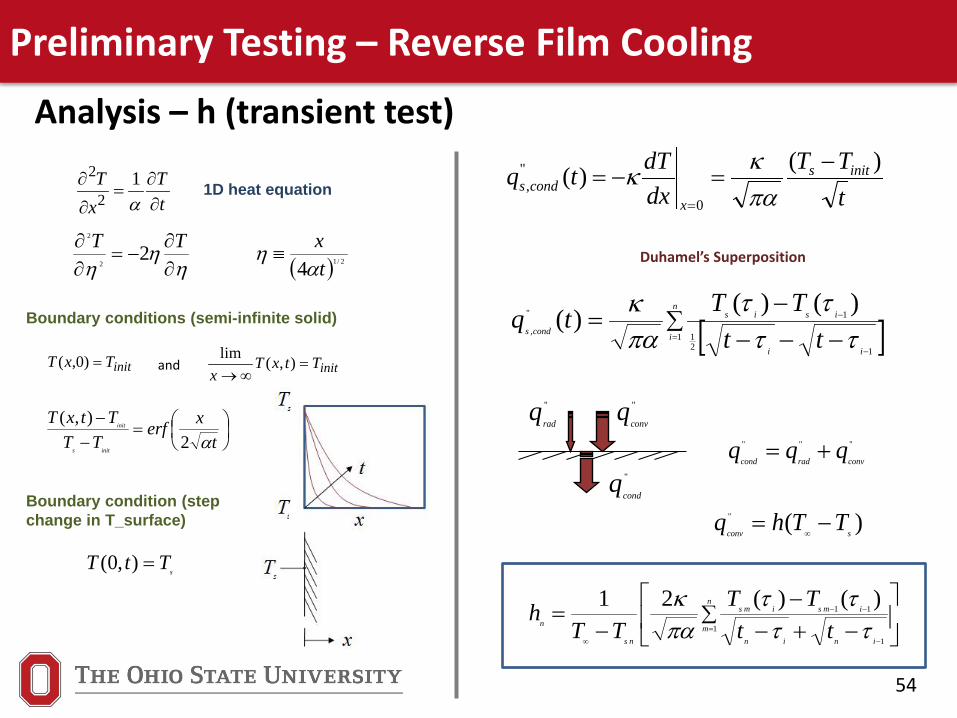
Analysis – h (transient test)
tT
xT
∂∂
=∂
∂α1
2
2
ηη
η ∂∂
−=∂∂ TT 2
2
2
( ) 2/14 txα
η ≡
initTxT =)0,( initTtxTx
=∞→
),(limand
=
−−
txerf
TTTtxT
inits
init
α2),(
tTT
dxdTtq inits
xconds
)()(0
",
−=−=
= πακκ
[ ]∑=
−
−
−−−−
=n
iii
isis
conds ttTTtq
112
1
1"
,
)()()(ττ
ττπακ
"""
convradcondqqq +=
)("
sconvTThq −=
∞
1D heat equation
Boundary conditions (semi-infinite solid)
Boundary condition (step change in T_surface)
sTtT =),0(
Duhamel’s Superposition
"
convq"
radq
"
condq
−+−
−−
= ∑=
−
−−
∞
n
minin
imsims
ns
n ttTT
TTh
11
11)()(21
ττττ
πακ
55
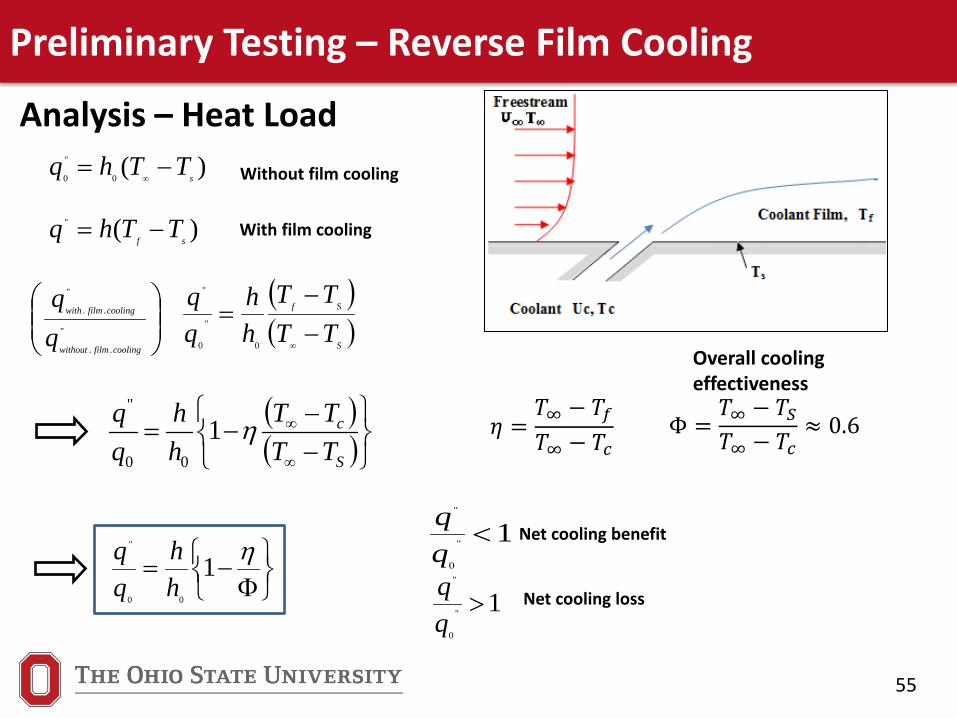
Preliminary Testing – Reverse Film Cooling
Analysis – Heat Load
( )( )
S
Sf
TTTT
hh
−−
=∞0
"
0
"
1"
0
"
( )( )
−−
−=∞
∞
S
c
TTTT
hh
qq η1
00
"
Net cooling benefit
Overall cooling effectiveness
)("
sfTThq −=
)(0
"
0 sTThq −=
∞ Without film cooling
With film cooling
1"
0
"
>qq Net cooling loss
Φ−=η1
00
"
hh
"
..
"
..
coolingfilmwithout
coolingfilmwith
𝜂𝜂 =𝑇𝑇∞ − 𝑇𝑇𝑓𝑓𝑇𝑇∞ − 𝑇𝑇𝑐𝑐
Φ =𝑇𝑇∞ − 𝑇𝑇𝑆𝑆𝑇𝑇∞ − 𝑇𝑇𝑐𝑐
≈ 0.6
56
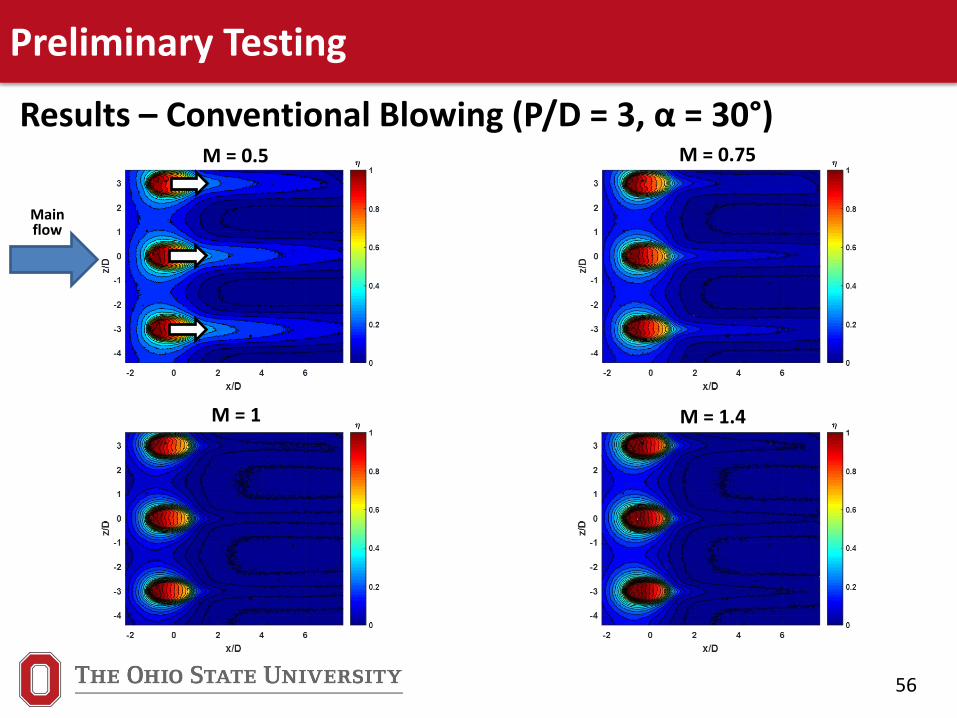
Preliminary Testing
Results – Conventional Blowing (P/D = 3, α = 30°)M = 0.5 M = 0.75
M = 1 M = 1.4
Main flow
57
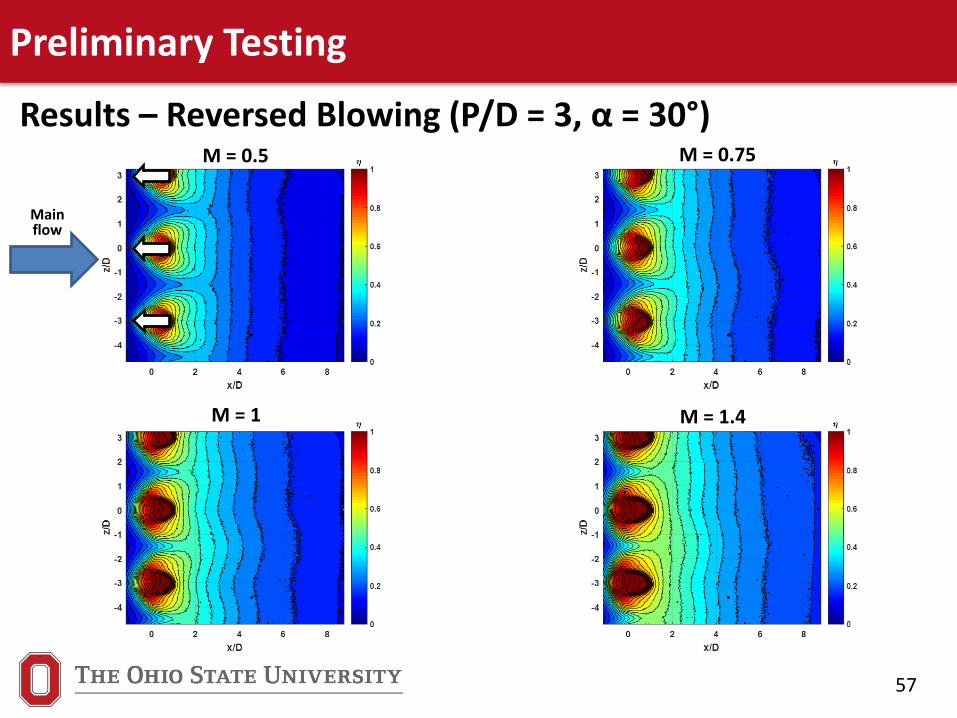
Preliminary Testing
Results – Reversed Blowing (P/D = 3, α = 30°)M = 0.5 M = 0.75
M = 1 M = 1.4
Main flow
58
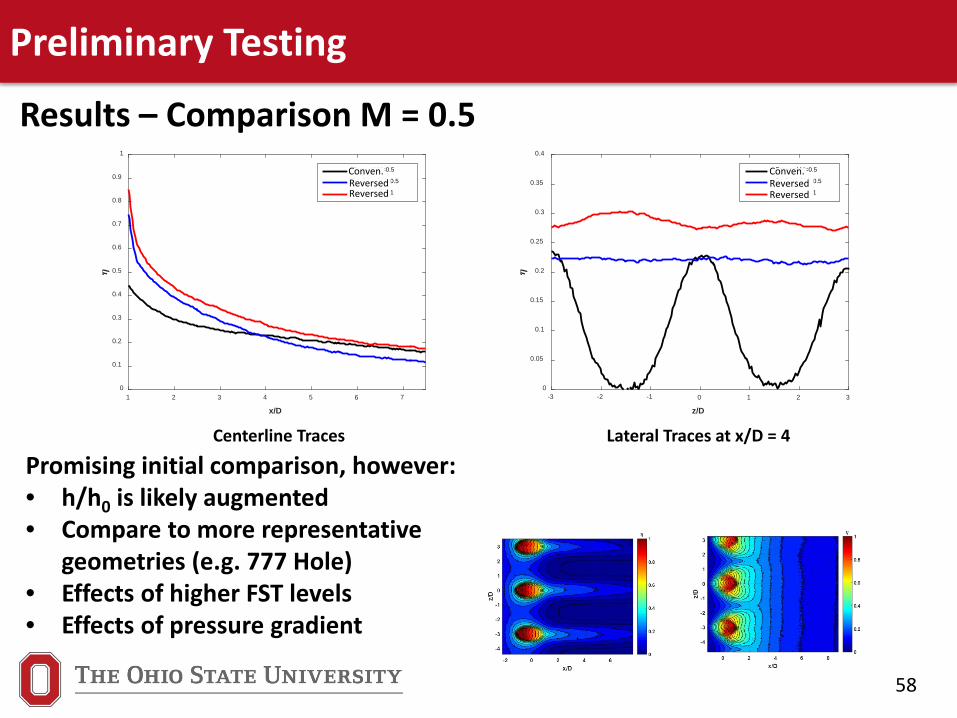
Preliminary Testing
Results – Comparison M = 0.5
Centerline Traces
Promising initial comparison, however:• h/h0 is likely augmented• Compare to more representative
geometries (e.g. 777 Hole)• Effects of higher FST levels• Effects of pressure gradient
1 2 3 4 5 6 7
x/D
0
0.1
0.2
0.3
0.4
0.5
0.6
0.7
0.8
0.9
1
Forward M=0.5
Backward M=0.5
Backward M=1
Conven.ReversedReversed
-3 -2 -1 0 1 2 3
z/D
0
0.05
0.1
0.15
0.2
0.25
0.3
0.35
0.4
Forward M=0.5
Backward M=0.5
Backward M=1
Lateral Traces at x/D = 4
Conven.ReversedReversed

59
Preliminary Testing
Oscillating Impingement Jets
60
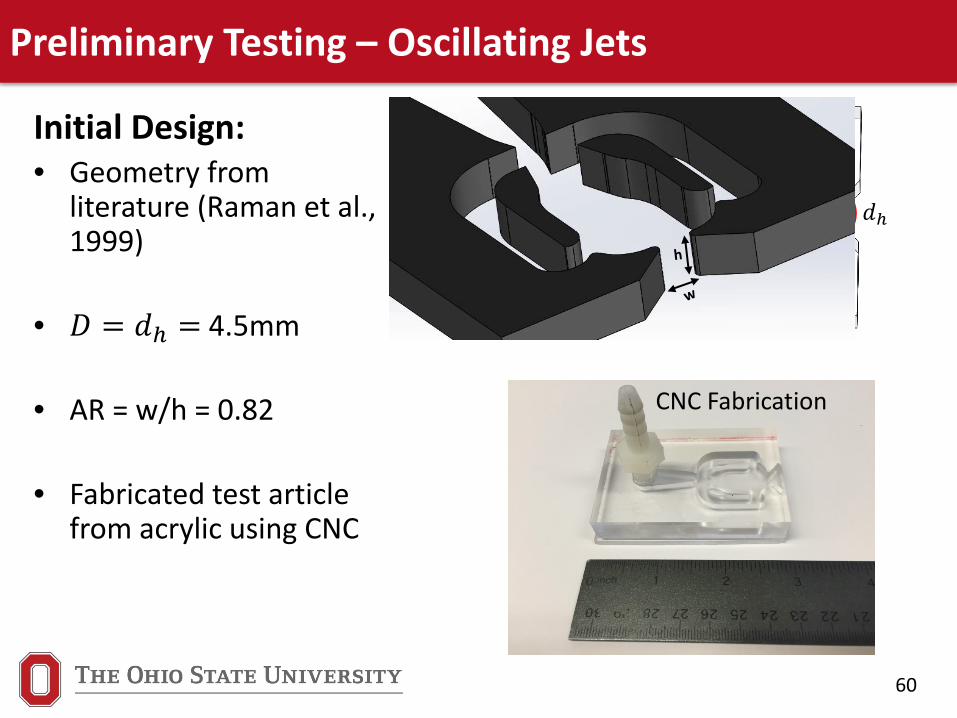
Preliminary Testing – Oscillating Jets
Initial Design:• Geometry from
literature (Raman et al., 1999)
• 𝐷𝐷 = 𝑑𝑑ℎ = 4.5mm
• AR = w/h = 0.82
• Fabricated test article from acrylic using CNC
1. CAD design
CNC Fabrication
𝑑𝑑ℎ
61
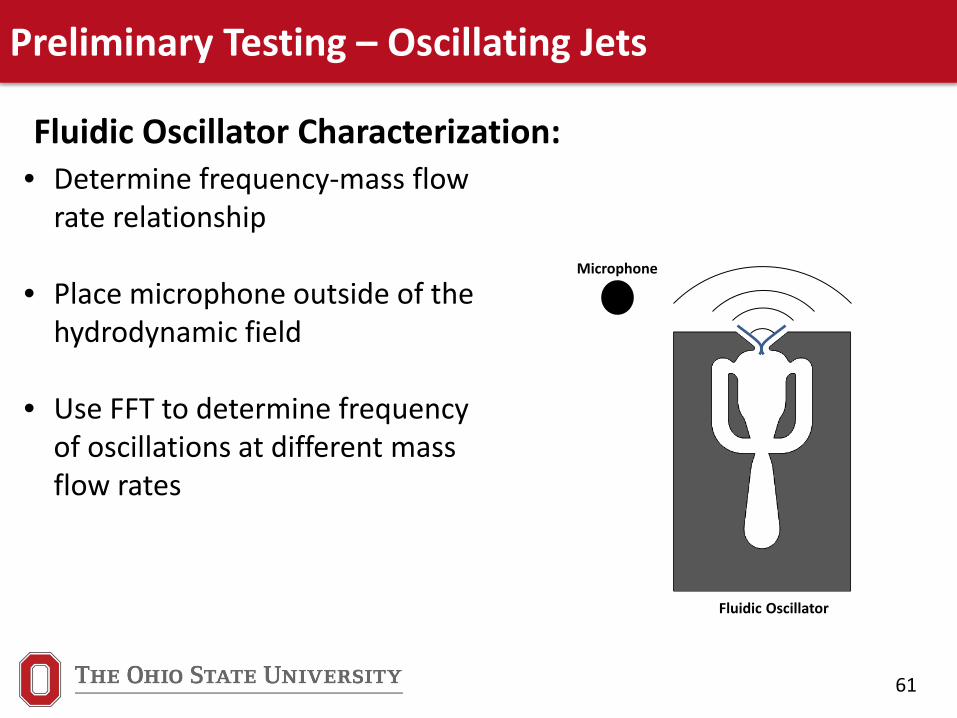
Preliminary Testing – Oscillating Jets
Fluidic Oscillator Characterization:
Microphone
Fluidic Oscillator
• Determine frequency-mass flow rate relationship
• Place microphone outside of the hydrodynamic field
• Use FFT to determine frequency of oscillations at different mass flow rates
62
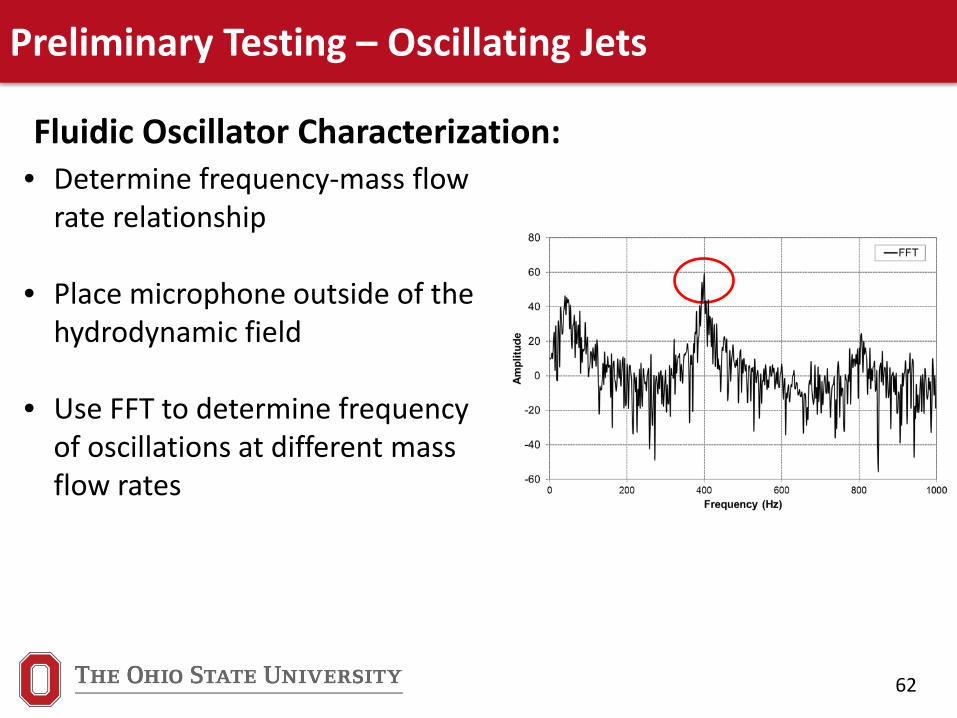
Preliminary Testing – Oscillating Jets
Fluidic Oscillator Characterization: • Determine frequency-mass flow
rate relationship
• Place microphone outside of the hydrodynamic field
• Use FFT to determine frequency of oscillations at different mass flow rates
63
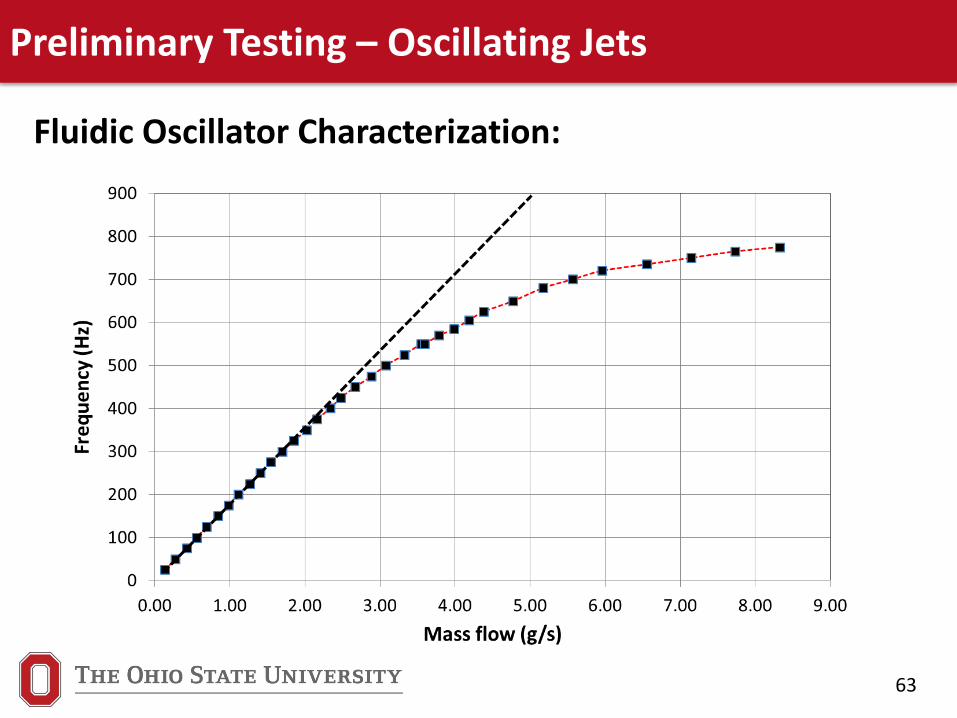
Preliminary Testing – Oscillating Jets
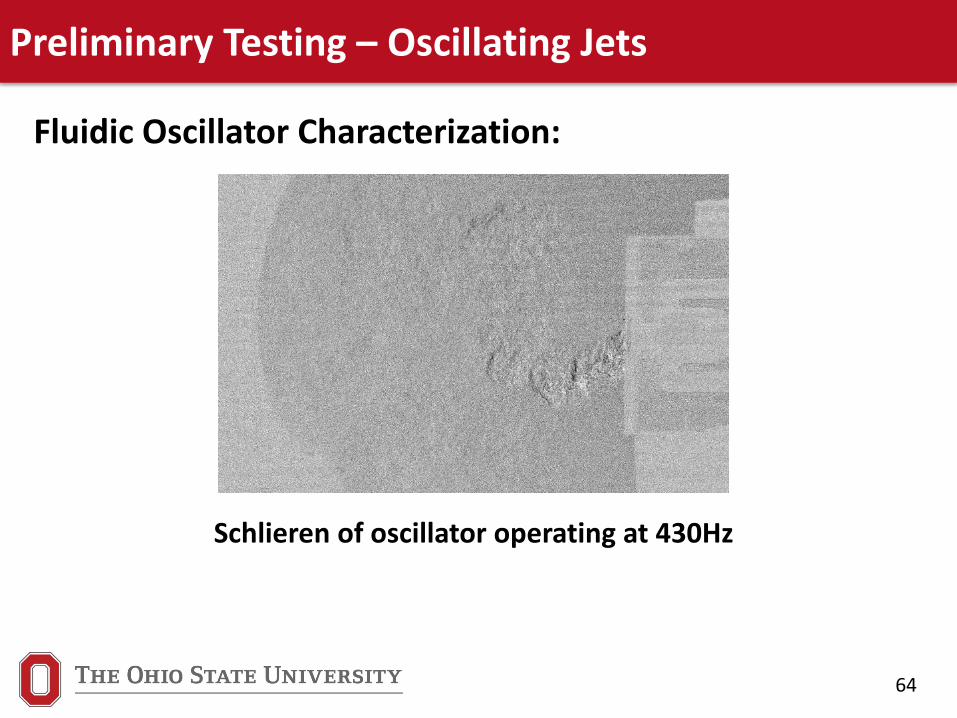
Fluidic Oscillator Characterization:
64
Preliminary Testing – Oscillating Jets
Fluidic Oscillator Characterization:
Schlieren of oscillator operating at 430Hz
65
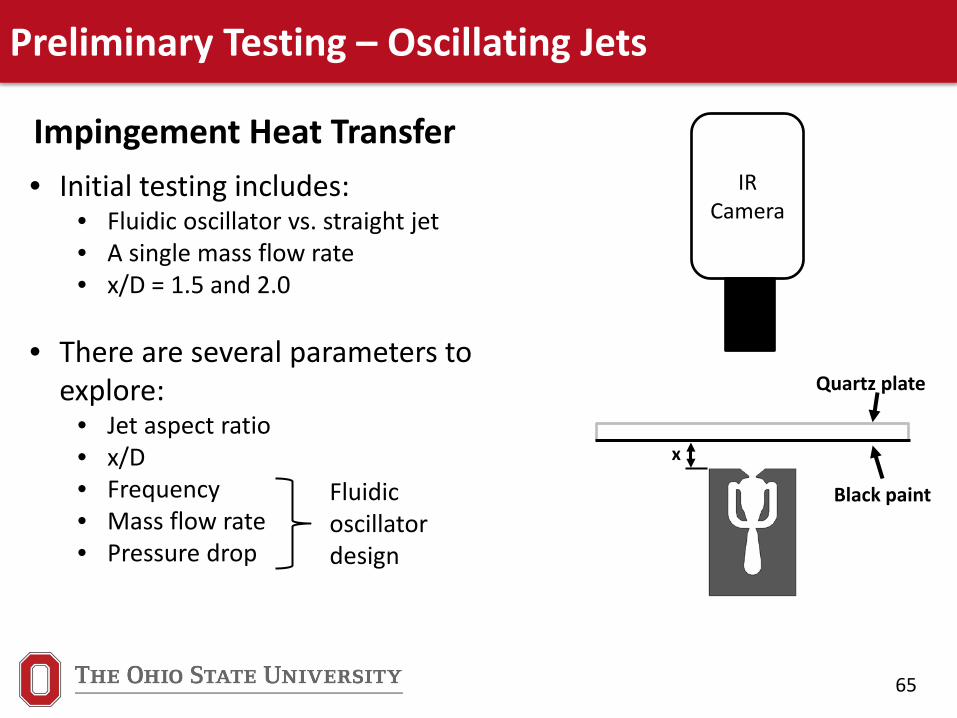
Preliminary Testing – Oscillating Jets
Impingement Heat Transfer IR
Camera
Quartz plate
Black paint
• Initial testing includes:• Fluidic oscillator vs. straight jet• A single mass flow rate• x/D = 1.5 and 2.0
• There are several parameters to explore:
• Jet aspect ratio• x/D• Frequency• Mass flow rate• Pressure drop
x
Fluidic oscillator design
66
Preliminary Testing – Oscillating Jets
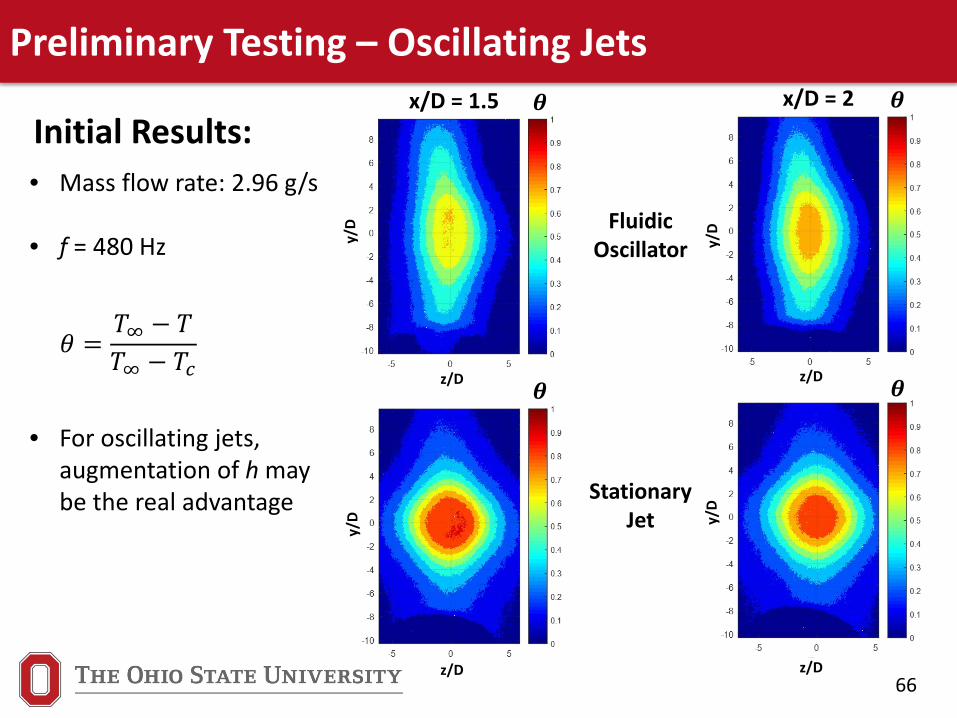
Initial Results:
z/D z/D
z/D z/D
y/D
y/D
y/D y/
D
𝜽𝜽 𝜽𝜽
𝜽𝜽 𝜽𝜽
x/D = 1.5 x/D = 2
• Mass flow rate: 2.96 g/s
• f = 480 Hz
• For oscillating jets, augmentation of h may be the real advantage
𝜃𝜃 =𝑇𝑇∞ − 𝑇𝑇𝑇𝑇∞ − 𝑇𝑇𝑐𝑐
Fluidic Oscillator
Stationary Jet
67
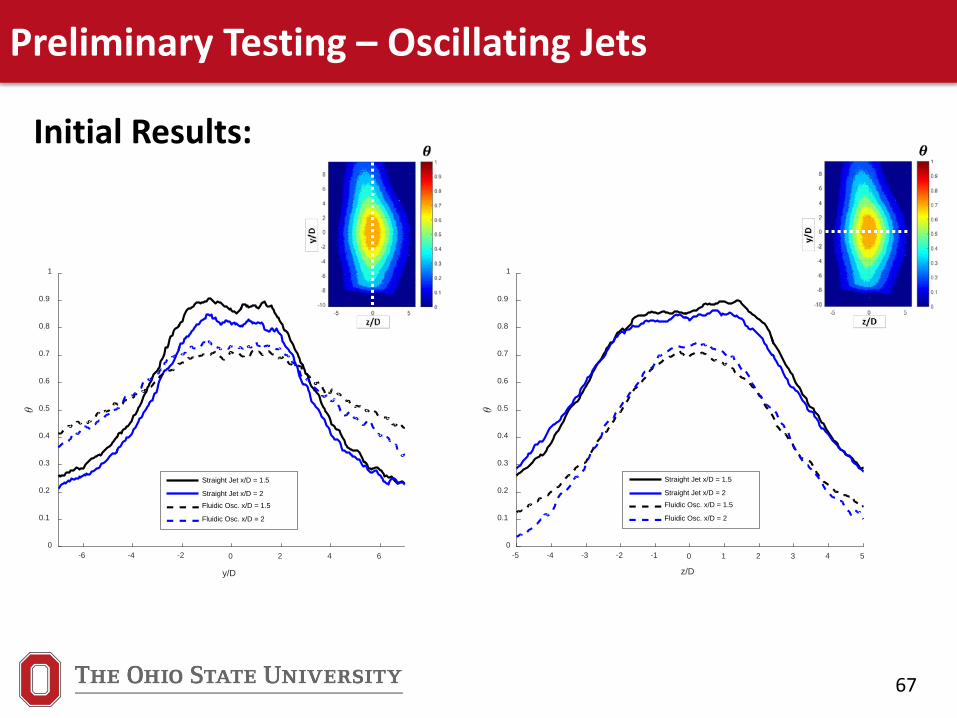
-5 -4 -3 -2 -1 0 1 2 3 4 5
z/D
0
0.1
0.2
0.3
0.4
0.5
0.6
0.7
0.8
0.9
1
Straight Jet x/D = 1.5
Straight Jet x/D = 2
Fluidic Osc. x/D = 1.5
Fluidic Osc. x/D = 2
-6 -4 -2 0 2 4 6
y/D
0
0.1
0.2
0.3
0.4
0.5
0.6
0.7
0.8
0.9
1
Straight Jet x/D = 1.5
Straight Jet x/D = 2
Fluidic Osc. x/D = 1.5
Fluidic Osc. x/D = 2
Preliminary Testing – Oscillating Jets
Initial Results:
68
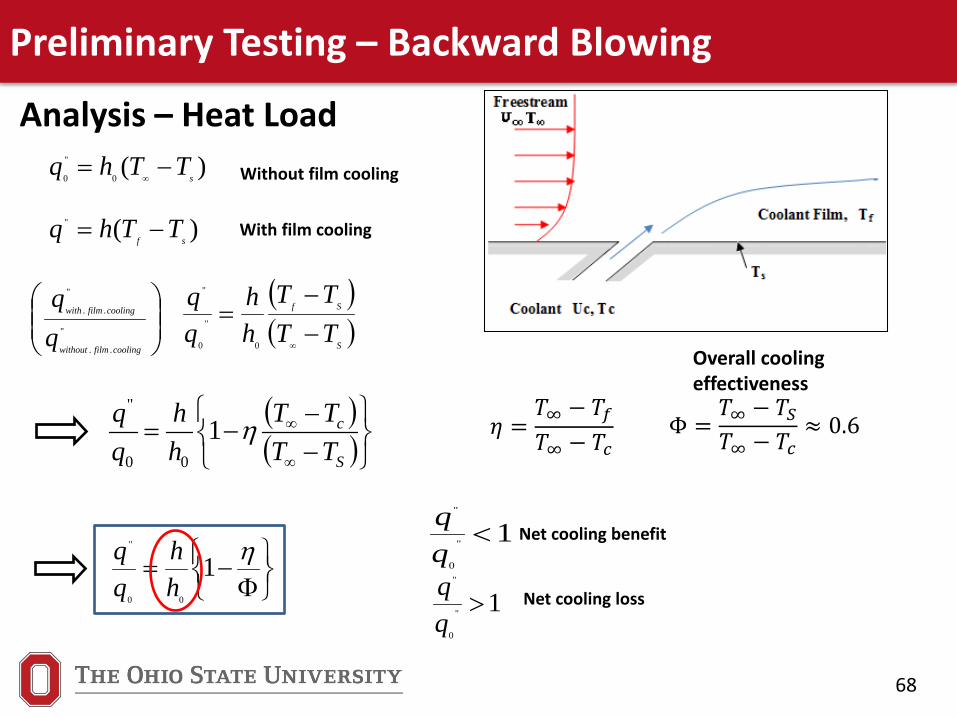
Preliminary Testing – Backward Blowing
Analysis – Heat Load
( )( )
S
Sf
TTTT
hh
−−
=∞0
"
0
"
1"
0
"
( )( )
−−
−=∞
∞
S
c
TTTT
hh
qq η1
00
"
Net cooling benefit
Overall cooling effectiveness
)("
sfTThq −=
)(0
"
0 sTThq −=
∞ Without film cooling
With film cooling
1"
0
"
>qq Net cooling loss
Φ−=η1
00
"
hh
"
..
"
..
coolingfilmwithout
coolingfilmwith
𝜂𝜂 =𝑇𝑇∞ − 𝑇𝑇𝑓𝑓𝑇𝑇∞ − 𝑇𝑇𝑐𝑐
Φ =𝑇𝑇∞ − 𝑇𝑇𝑆𝑆𝑇𝑇∞ − 𝑇𝑇𝑐𝑐
≈ 0.6

69
Next Steps
70
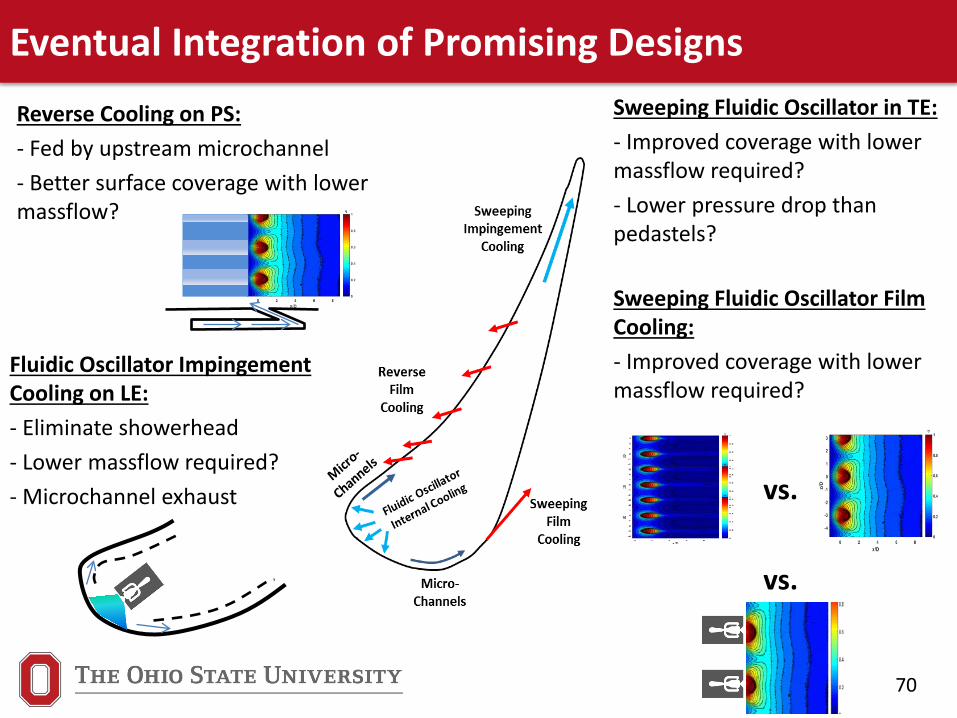
Eventual Integration of Promising DesignsReverse Cooling on PS:- Fed by upstream microchannel- Better surface coverage with lower massflow?
Fluidic Oscillator Impingement Cooling on LE:- Eliminate showerhead- Lower massflow required?- Microchannel exhaust
Sweeping Fluidic Oscillator in TE:- Improved coverage with lower massflow required?- Lower pressure drop than pedastels?
Sweeping Fluidic Oscillator Film Cooling:- Improved coverage with lower massflow required?
vs.
vs.
71
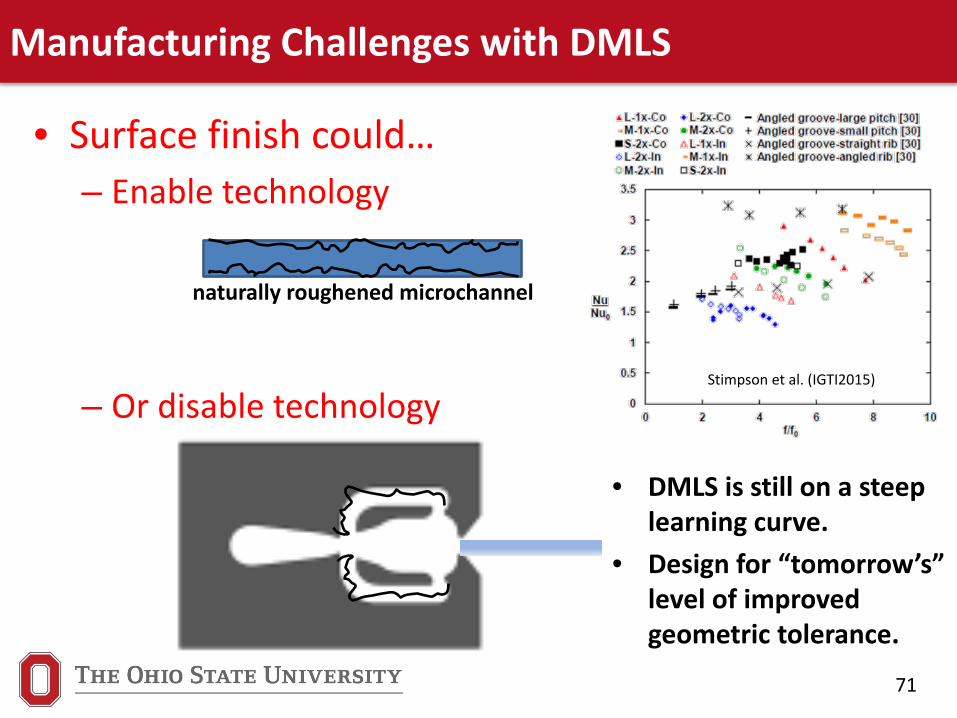
• Surface finish could…– Enable technology
– Or disable technology
Manufacturing Challenges with DMLS
naturally roughened microchannel
• DMLS is still on a steep learning curve.
• Design for “tomorrow’s” level of improved geometric tolerance.
Stimpson et al. (IGTI2015)
72
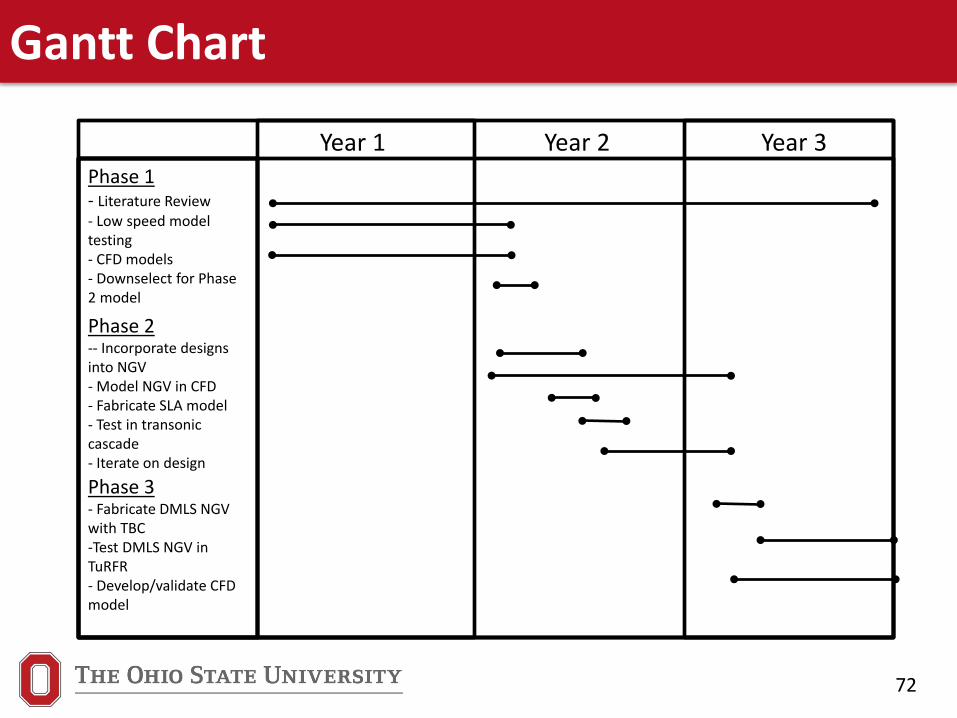
Gantt Chart
Year 1 Year 2 Year 3Phase 1- Literature Review- Low speed model testing- CFD models- Downselect for Phase 2 model
Phase 2-- Incorporate designs into NGV- Model NGV in CFD- Fabricate SLA model- Test in transonic cascade- Iterate on design
Phase 3- Fabricate DMLS NGV with TBC-Test DMLS NGV in TuRFR- Develop/validate CFD model
Recommended