Australian Rainfall
& Runoff
Revision Projects
PROJECT 10
Appropriate Safety Criteria for
People
STAGE 1 REPORT
P10/S1/006
APRIL 2010
AUSTRALIAN RAINFALL AND RUNOFF REVISION PROJECT 10: APPROPRIATE SAFETY CRITERIA FOR PEOPLE
STAGE 1 REPORT
APRIL 2010 Project Australian Rainfall and Runoff Revision Project 10: Appropriate Safety Criteria for People
AR&R Report Number P10/S1/006
Date 12 April 2010
ISBN 978-085825-9454
Contractor Water Research Laboratory
Contractor Reference Number
08077.01
Authors R. J. Cox, T. D. Shand, and M. J. Blacka
Verified by
Australian Rainfall and Runoff Revision Project 10: Appropriate Safety Criteria for People
P10/S1/006 :Apr 2010 i
COPYRIGHT NOTICE
This document, Project 10: Appropriate Safety Criteria for People , is licensed under the Creative Commons Attribution 4.0 Licence, unless otherwise indicated.
Please give attribution to: © Commonwealth of Australia (Geoscience Australia) 2009
We also request that you observe and retain any notices that may accompany this material as part of the
attribution.
Notice Identifying Other Material and/or Rights in this Publication:
The authors of this document have taken steps to both identify third-party material and secure permission
for its reproduction and reuse. However, please note that where these third-party materials are not
licensed under a Creative Commons licence, or similar terms of use, you should obtain permission from
the rights holder to reuse their material beyond the ways you are permitted to use them under the ‘fair
dealing’ provisions in the Copyright Act 1968.
Further Information
For further information about the copyright in this document, please contact:
Intellectual Property and Copyright Manager
Corporate Branch
Geoscience Australia
GPO Box 378
CANBERRA ACT 2601
Phone: +61 2 6249 9367 or email: [email protected]
DISCLAIMER The Creative Commons Attribution 4.0 Licence contains a Disclaimer of Warranties and Limitation of
Liability.
Australian Rainfall and Runoff Revision Project 10: Appropriate Safety Criteria for People
P10/S1/006 :Apr 2010 ii
ACKNOWLEDGEMENTS
This project was made possible by funding from the Federal Government through the
Department of Climate Change. This report and the associated project are the result of a
significant amount of in kind hours provided by Engineers Australia Members.
Contractor Details
Water Research Laboratory The University of New South Wales
110 King Street Manly Vale, NSW 2093
Tel: (02) 8071 9800 Fax: (02) 9949 4188
Web: www.wrl.unsw.edu.au
Australian Rainfall and Runoff Revision Project 10: Appropriate Safety Criteria for People
P10/S1/006 :Apr 2010 iii
FOREWORD
AR&R Revision Process
Since its first publication in 1958, Australian Rainfall and Runoff (AR&R) has remained one of
the most influential and widely used guidelines published by Engineers Australia (EA). The
current edition, published in 1987, retained the same level of national and international acclaim
as its predecessors.
With nationwide applicability, balancing the varied climates of Australia, the information and the
approaches presented in Australian Rainfall and Runoff are essential for policy decisions and
projects involving:
• infrastructure such as roads, rail, airports, bridges, dams, stormwater and sewer
systems;
• town planning;
• mining;
• developing flood management plans for urban and rural communities;
• flood warnings and flood emergency management;
• operation of regulated river systems; and
• estimation of extreme flood levels.
However, many of the practices recommended in the 1987 edition of AR&R are now becoming
outdated, no longer representing the accepted views of professionals, both in terms of technique
and approach to water management. This fact, coupled with greater understanding of climate
and climatic influences makes the securing of current and complete rainfall and streamflow data
and expansion of focus from flood events to the full spectrum of flows and rainfall events, crucial
to maintaining an adequate knowledge of the processes that govern Australian rainfall and
streamflow in the broadest sense, allowing better management, policy and planning decisions to
be made.
One of the major responsibilities of the National Committee on Water Engineering of Engineers
Australia is the periodic revision of AR&R. A recent and significant development has been that
the revision of AR&R has been identified as a priority in the Council of Australian Governments
endorsed National Adaptation Framework for Climate Change.
The Federal Department of Climate Change announced in June 2008 $2 million of funding to
assist in updating Australian Rainfall and Runoff (AR&R). The update will be completed in three
stages over four years with current funding for the first stage. Further funding is still required for
Stages 2 and 3. Twenty one revision projects will be undertaken with the aim of filling knowledge
gaps. The 21 projects are to be undertaken over four years with ten projects commencing in
Stage 1. The outcomes of the projects will assist the AR&R editorial team compiling and writing
of the chapters of AR&R. Steering and Technical Committees have been established to assist
the AR&R editorial team in guiding the projects to achieve desired outcomes.
Australian Rainfall and Runoff Revision Project 10: Appropriate Safety Criteria for People
P10/S1/006 :Apr 2010 iv
Project 10: Appropriate Safety Criteria for People
Emergency management of flood situations in both urban and rural areas is directly concerned
about the safety of people in floods. Over the past two decades there has been increasing
concern about these safety issues and there is a need to revisit and update the criteria currently
used. The current approach is based on the results of some studies undertaken in the 1970s. A
body of research has been undertaken since then and there is a need to collate this research
and to develop guidelines for authorities. As a result, it is anticipated that most of the work
involved in this project will be the collation of research in this field and the development of
appropriate guideline information.
The aim of Project 10 is to provide guidance on pedestrian safety and stability in floods.
Mark Babister Dr James Ball
Chair National Committee on Water Engineering AR&R Editor
Australian Rainfall and Runoff Revision Project 10: Appropriate Safety Criteria for People
P10/S1/006 :Apr 2010 v
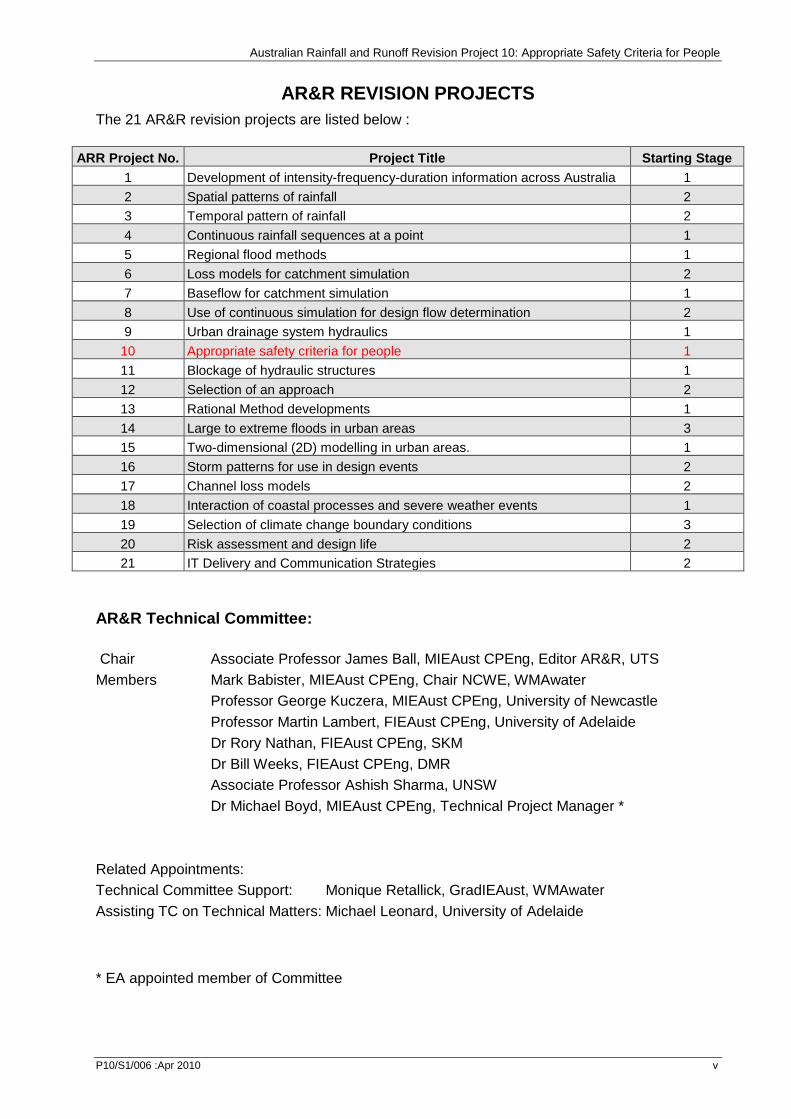
AR&R REVISION PROJECTS
The 21 AR&R revision projects are listed below :
ARR Project No. Project Title Starting Stage
1 Development of intensity-frequency-duration information across Australia 1
2 Spatial patterns of rainfall 2
3 Temporal pattern of rainfall 2
4 Continuous rainfall sequences at a point 1
5 Regional flood methods 1
6 Loss models for catchment simulation 2
7 Baseflow for catchment simulation 1
8 Use of continuous simulation for design flow determination 2
9 Urban drainage system hydraulics 1
10 Appropriate safety criteria for people 1
11 Blockage of hydraulic structures 1
12 Selection of an approach 2
13 Rational Method developments 1
14 Large to extreme floods in urban areas 3
15 Two-dimensional (2D) modelling in urban areas. 1
16 Storm patterns for use in design events 2
17 Channel loss models 2
18 Interaction of coastal processes and severe weather events 1
19 Selection of climate change boundary conditions 3
20 Risk assessment and design life 2
21 IT Delivery and Communication Strategies 2
AR&R Technical Committee:
Chair Associate Professor James Ball, MIEAust CPEng, Editor AR&R, UTS
Members Mark Babister, MIEAust CPEng, Chair NCWE, WMAwater
Professor George Kuczera, MIEAust CPEng, University of Newcastle
Professor Martin Lambert, FIEAust CPEng, University of Adelaide
Dr Rory Nathan, FIEAust CPEng, SKM
Dr Bill Weeks, FIEAust CPEng, DMR
Associate Professor Ashish Sharma, UNSW
Dr Michael Boyd, MIEAust CPEng, Technical Project Manager *
Related Appointments:
Technical Committee Support: Monique Retallick, GradIEAust, WMAwater
Assisting TC on Technical Matters: Michael Leonard, University of Adelaide
* EA appointed member of Committee
Australian Rainfall and Runoff Revision Project 10: Appropriate Safety Criteria for People
P10/S1/006 :Apr 2010 vi
PROJECT TEAM
Project team:
Assoc Prof. Ronald J. Cox, UNSW#
Dr Thomas D. Shand, UNSW
Mr Matthew J. Blacka, UNSW This report was independently reviewed by:
Geoff O’Loughlin
Australian Rainfall and Runoff Revision Project 10: Appropriate Safety Criteria for People
P10/S1/006 :Apr 2010 vii
EXECUTIVE SUMMARY
The safety of people on floodways or flooded streets is of major concern in urban stormwater
design and floodplain management. Human activity in floodways is inevitable with much
development already in flood prone areas. The safety of people can be compromised when
exposed to flows which exceed their ability to remain standing and/or traverse a waterway. The
current Australian Rainfall and Runoff (ARR) guidelines (I.E.Aust, 1987) stipulate that “to prevent
pedestrians being swept along streets and other drainage paths during major storm events, the
product of velocities (V) and depths (D) in streets and major flow paths generally should not
exceed D.V = 0.4 m2/s”. The 2005 Floodplain Development Manual (DECCW, 2005) do not
indicate constant D.V relationships, but do place upper bounds on both depth (0.8 m) and
velocity (2.0 ms-1) for people to wade safely.
Over the last four decades, a number of laboratory-based experimental studies have been
undertaken within Australia and internationally to define the limits of stability within differing flow
regimes. This report reviews and discusses previous experimental investigations of human
stability as well as empirical expressions and safety guidelines derived from these studies. The
entire data-set of relevant experimental results is re-analysed and tolerable flow conditions
related to human safety and safe working conditions are produced. These are presented as a
set of guideline values together with discussion on the limitations of their validity and other
factors which may adversely affect stability.
Significant scatter is observed within individual experimental data sets and, to a more significant
degree, when all data sets are combined. Additionally, markedly differing tolerable D.V values
are observed for identical subjects. Discussion with investigators has indicated that “training” of
the subject (Abt, pers. com, 2009) may enable higher flow values to be resisted as the subject
learns how to position the body so to best resist the flow. The lowest stability values (D.V) for
each subject is, in most cases, the first exposure test and more applicable to the general
population whom have not had the benefit of such training prior to encountering flood water.
While distinct relationships exist between a subjects height and mass (H.M; mkg) and the
tolerable flow value (D.V; m2s-1), definition of general flood flow safety guidelines according to
this relation is not considered practical given the wide range in such characteristics within the
population. In order to define safety limits which are applicable for all persons, hazard regimes
are defined for adults (H.M > 50 mkg) and children (H.M = 25 to 50 mkg). Infants and very young
children (H.M < 25 mkg) are considered unsafe in any flow without adult support.
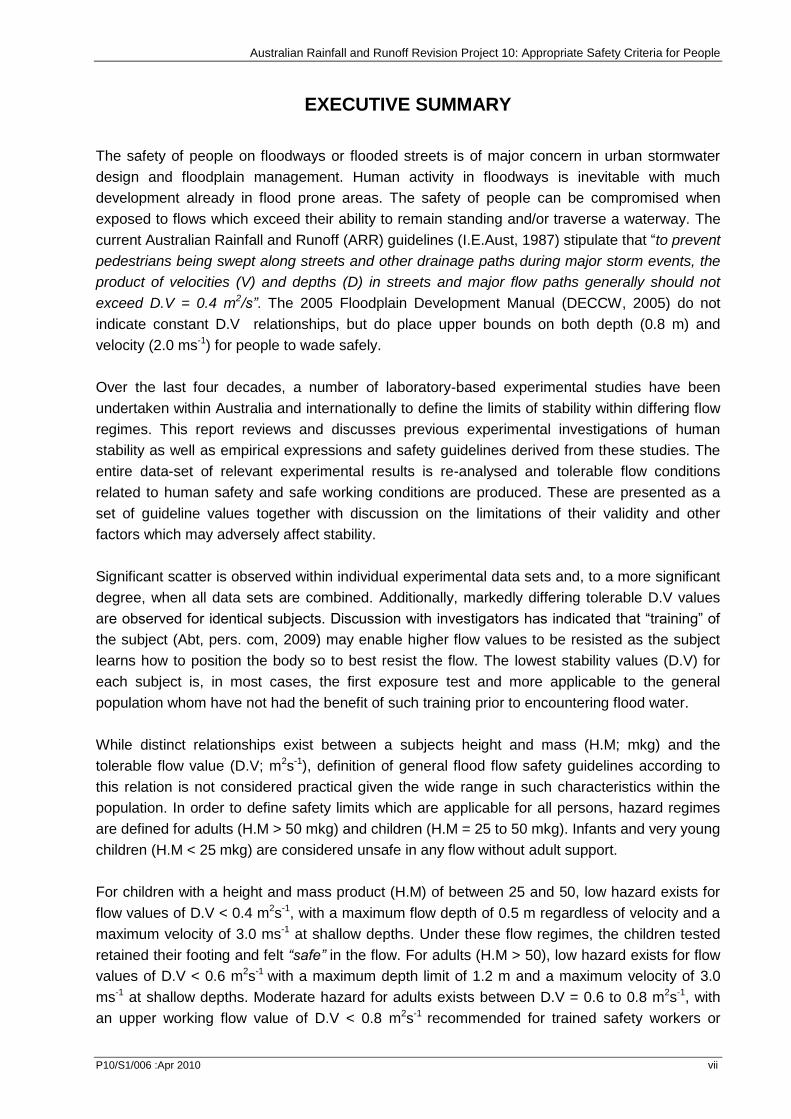
For children with a height and mass product (H.M) of between 25 and 50, low hazard exists for
flow values of D.V < 0.4 m2s-1, with a maximum flow depth of 0.5 m regardless of velocity and a
maximum velocity of 3.0 ms-1 at shallow depths. Under these flow regimes, the children tested
retained their footing and felt “safe” in the flow. For adults (H.M > 50), low hazard exists for flow
values of D.V < 0.6 m2s-1 with a maximum depth limit of 1.2 m and a maximum velocity of 3.0
ms-1 at shallow depths. Moderate hazard for adults exists between D.V = 0.6 to 0.8 m2s-1, with
an upper working flow value of D.V < 0.8 m2s-1 recommended for trained safety workers or
Australian Rainfall and Runoff Revision Project 10: Appropriate Safety Criteria for People
P10/S1/006 :Apr 2010 viii
experienced and well equipped persons. Significant hazard for adults exists between D.V = 0.8
to 1.2 m2s-1. For flow values D.V > 1.2 m2s-1 the majority of tests for adults indicated instability -
the hazard is extreme and should not be considered safe for standing or wading.
DV (m2s
-1) Infants, small children
(H.M ≤ 25) and
frail/older persons
Children
(H.M = 25 to 50)
Adults
(H.M > 50)
0 Safe Safe Safe
0 – 0.4 Low Hazard1
Low Hazard1 0.4 – 0.6 Significant Hazard;
Dangerous to most
0.6 – 0.8 Extreme Hazard;
Dangerous to all
Moderate Hazard;
Dangerous to some2
0.8 – 1.2 Extreme Hazard;
Dangerous to all
Significant Hazard;
Dangerous to most3
> 1.2 Extreme Hazard;
Dangerous to all
1 Stability uncompromised for persons within laboratory testing program at these flows (to maximum flow depth of
0.5 m for children and 1.2 m for adults and a maximum velocity of 3.0 ms-1
at shallow depths). 2 Working limit for trained safety workers or experienced and well equipped persons (D.V < 0.8 m
2s
-1)
3 Upper limit of stability observed during most investigations (D.V > 1.2 m
2s
-1)
It should however be noted that loss of stability could occur in milder flow regimes when adverse
conditions are encountered including:
Bottom conditions: uneven, slippery, obstacles;
Flow conditions: floating debris, low temperature, poor visibility, unsteady flow and flow
aeration;
Human subject: standing or moving, experience and training, clothing and footwear,
physical attributes additional to height and mass including muscular development and/or
other disability, psychological factors;
Others: strong wind, poor lighting, definition of stability limit (i.e. feeling unsafe or
complete loss of footing).
As described within Cox et al. (2003), there is a lack of test data for very young children and
frail/older persons. These populations are unlikely to be safe in any flow regimes and as such,
care is required in locating aged care and retirement villages as well as childcare centres and
kindergartens.
Australian Rainfall and Runoff Revision Project 10: Appropriate Safety Criteria for People
P10/S1/006 :Apr 2010 ix
TABLE OF CONTENTS
1. Introduction ............................................................................................................... 1
2. Review of Previous Investigations .......................................................................... 3
2.1 Experimental Data ...................................................................................... 3
2.1.1 Foster and Cox (1973) ................................................................................ 4
2.1.2 Abt et al. (1989) .......................................................................................... 4
2.1.3 Takahashi et al. (1992) ............................................................................... 5
2.1.4 Karvonen et al. (2000) ................................................................................ 5
2.1.5 Yee (2003) .................................................................................................. 6
2.1.6 Jonkman and Penning-Rowsell (2008) ....................................................... 7
2.1.7 Summary .................................................................................................... 7
2.2. Empirical and Theoretical Analysis ............................................................. 9
2.2.1 Takahashi et al. (1992) ............................................................................... 9
2.2.2 Keller and Mitsch (1993) ............................................................................. 9
2.2.3 Lind et al. (2004) ....................................................................................... 10
2.2.4 Yee (2003) ................................................................................................ 11
2.2.5 Ramsbottom et al. (2004; 2006) ................................................................ 11
2.2.6 Ishigaki et al. (2005; 2008; 2009) .............................................................. 13
3. Reanalysis of Experimental Data ........................................................................... 15
4. Conclusions and Recommendations .................................................................... 18

Australian Rainfall and Runoff Revision Project 10: Appropriate Safety Criteria for People
P10/S1/006 :Apr 2010 1
1. Introduction
The safety of people on floodways or flooded streets is of major concern in urban stormwater
design and floodplain management. Human activity in floodways is inevitable with much
development already in flood prone areas. The safety of people can be compromised when
exposed to flows which exceed their ability to remain standing and/or traverse a waterway.
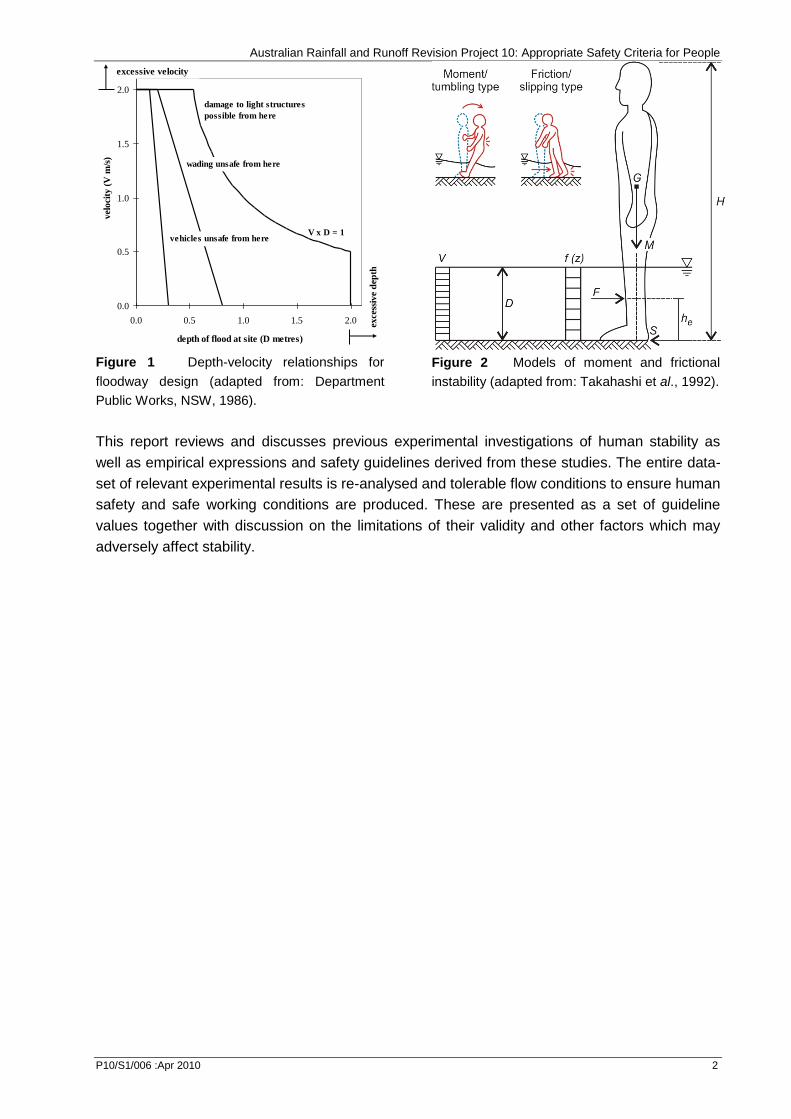
Current design guidelines for safety of people on floodways in Australia are simplistic, generally
based on the product of flow depth (D) and velocity (V). The current Australian Rainfall and
Runoff (ARR) guidelines (I.E.Aust, 1987) stipulate that “to prevent pedestrians being swept
along streets and other drainage paths during major storm events, the product of velocities and
depths in streets and major flow paths generally should not exceed 0.4 m2/s”. In contrast, the
velocity-depth relationships that define unsafe wading and vehicle instability as presented within
the 1986 NSW Floodplain Development Manual (DPW, 1986) and adopted within the 2005
Floodplain Development Manual (DECCW, 2005) do not indicate constant D.V relationships
(Figure 1), but do place upper bounds on both depth (0.8 m) and velocity (2.0 ms-1) for people to
wade safely.
Besides the safety of the general community, safety on floodways is important to rescue workers
who are frequently required to operate in hazardous conditions. Emergency Management
Australia (EMA) is the national government agency responsible for managing disaster situations.
EMA has published a series of manuals to assist other agencies and local governments in the
planning of emergency situations regarding flooding. In regard to “Flood Hazard”, EMA advice is
that “wading by able-bodied adults becomes difficult and dangerous when the depth of still water
exceeds 1.2 m or when the velocity of shallow water exceeds 0.8 ms-1 and for various
combinations of depth and velocity between these limits” (EMA, 1999). EMA acknowledge other
local site factors other than depth and velocity need to be taken into account.
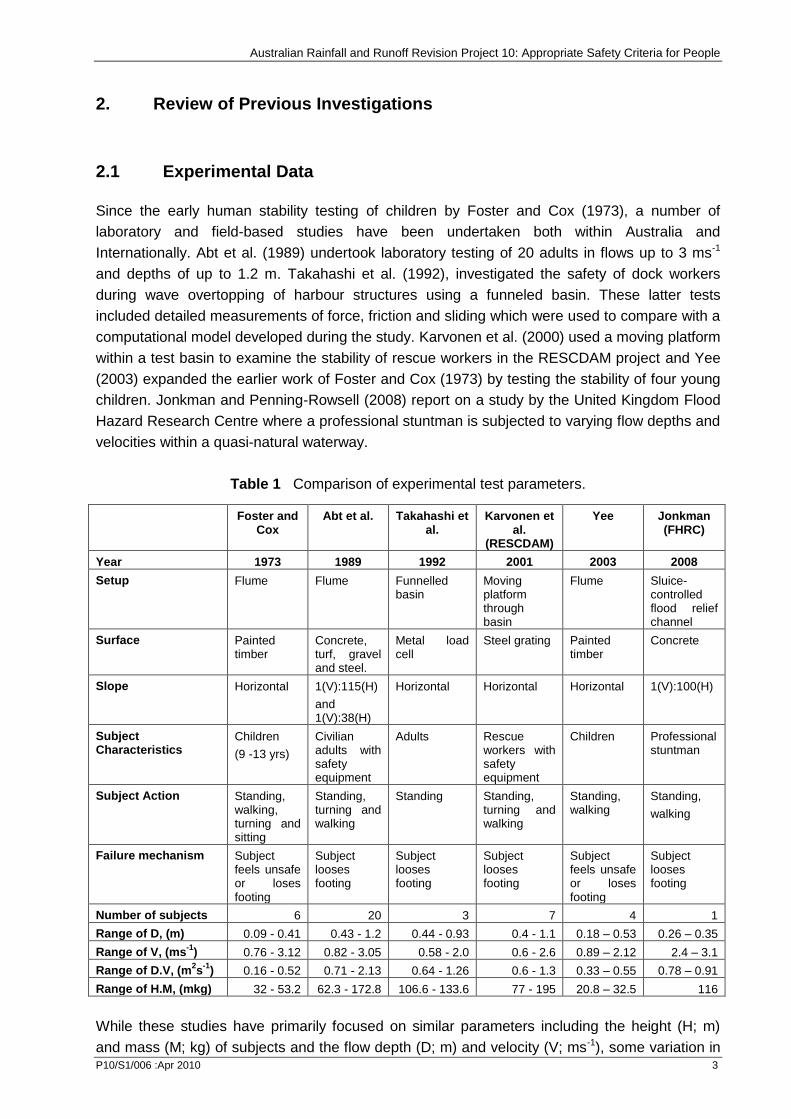
The two recognised hydrodynamic mechanisms by which stability is lost include moment
instability and friction instability (Figure 2). A more comprehensive discussion is presented within
Jonkman and Penning-Rowsell (2008) but, in brief, moment (toppling) instability occurs when a
moment induced by oncoming flow exceeds that generated by the weight of the body (Abt et al.,
1989). This stability parameter is sensitive to the buoyancy of a person within a flow and to body
positioning and weight distribution. These factors are further discussed within the following
analysis. Frictional (sliding) instability occurs when the drag force induced by the horizontal flow
is larger than the frictional resistance between a persons feet and the ground surface. This
stability parameter is sensitive to weight and buoyancy, clothing, footwear and ground
conditions. A third cause of instability described within Jonkman and Penning-Rowsell (2008) is
floating, which occurs when the water depth reaches a significant level and buoyancy forces lift
the person from the ground regardless of velocity. Under floating conditions neither sliding or
moment instability are applicable.
Australian Rainfall and Runoff Revision Project 10: Appropriate Safety Criteria for People
P10/S1/006 :Apr 2010 2
0.0
0.5
1.0
1.5
2.0
0.0 0.5 1.0 1.5 2.0
depth of flood at site (D metres)
vel
oci
ty (
V m
/s)
exce
ssiv
e d
epth
excessive velocity
vehicles unsafe from here
wading unsafe from here
damage to light structures
possible from here
V x D = 1
Figure 1 Depth-velocity relationships for
floodway design (adapted from: Department
Public Works, NSW, 1986).
Figure 2 Models of moment and frictional
instability (adapted from: Takahashi et al., 1992).
This report reviews and discusses previous experimental investigations of human stability as
well as empirical expressions and safety guidelines derived from these studies. The entire data-
set of relevant experimental results is re-analysed and tolerable flow conditions to ensure human
safety and safe working conditions are produced. These are presented as a set of guideline
values together with discussion on the limitations of their validity and other factors which may
adversely affect stability.
Australian Rainfall and Runoff Revision Project 10: Appropriate Safety Criteria for People
P10/S1/006 :Apr 2010 3
2. Review of Previous Investigations
2.1 Experimental Data
Since the early human stability testing of children by Foster and Cox (1973), a number of
laboratory and field-based studies have been undertaken both within Australia and
Internationally. Abt et al. (1989) undertook laboratory testing of 20 adults in flows up to 3 ms-1
and depths of up to 1.2 m. Takahashi et al. (1992), investigated the safety of dock workers
during wave overtopping of harbour structures using a funneled basin. These latter tests
included detailed measurements of force, friction and sliding which were used to compare with a
computational model developed during the study. Karvonen et al. (2000) used a moving platform
within a test basin to examine the stability of rescue workers in the RESCDAM project and Yee
(2003) expanded the earlier work of Foster and Cox (1973) by testing the stability of four young
children. Jonkman and Penning-Rowsell (2008) report on a study by the United Kingdom Flood
Hazard Research Centre where a professional stuntman is subjected to varying flow depths and
velocities within a quasi-natural waterway.
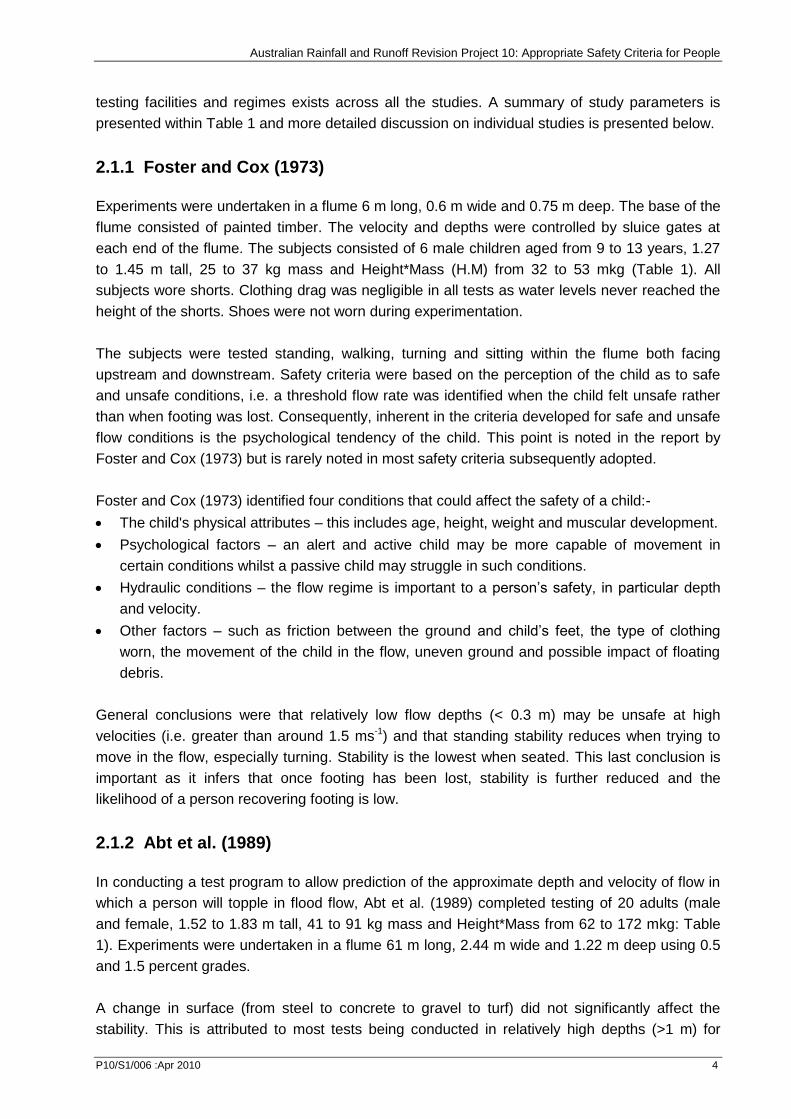
Table 1 Comparison of experimental test parameters.
Foster and Cox
Abt et al. Takahashi et al.
Karvonen et al.
(RESCDAM)
Yee Jonkman (FHRC)
Year 1973 1989 1992 2001 2003 2008
Setup Flume Flume Funnelled basin
Moving platform through basin
Flume Sluice-controlled flood relief channel
Surface Painted timber
Concrete, turf, gravel and steel.
Metal load cell
Steel grating Painted timber
Concrete
Slope Horizontal 1(V):115(H)
and 1(V):38(H)
Horizontal Horizontal Horizontal 1(V):100(H)
Subject Characteristics
Children
(9 -13 yrs)
Civilian adults with safety equipment
Adults Rescue workers with safety equipment
Children Professional stuntman
Subject Action Standing, walking, turning and sitting
Standing, turning and walking
Standing Standing, turning and walking
Standing, walking
Standing,
walking
Failure mechanism Subject feels unsafe or loses footing
Subject looses footing
Subject looses footing
Subject looses footing
Subject feels unsafe or loses footing
Subject looses footing
Number of subjects 6 20 3 7 4 1
Range of D, (m) 0.09 - 0.41 0.43 - 1.2 0.44 - 0.93 0.4 - 1.1 0.18 – 0.53 0.26 – 0.35
Range of V, (ms-1
) 0.76 - 3.12 0.82 - 3.05 0.58 - 2.0 0.6 - 2.6 0.89 – 2.12 2.4 – 3.1
Range of D.V, (m2s
-1) 0.16 - 0.52 0.71 - 2.13 0.64 - 1.26 0.6 - 1.3 0.33 – 0.55 0.78 – 0.91
Range of H.M, (mkg) 32 - 53.2 62.3 - 172.8 106.6 - 133.6 77 - 195 20.8 – 32.5 116
While these studies have primarily focused on similar parameters including the height (H; m)
and mass (M; kg) of subjects and the flow depth (D; m) and velocity (V; ms-1), some variation in
Australian Rainfall and Runoff Revision Project 10: Appropriate Safety Criteria for People
P10/S1/006 :Apr 2010 4
testing facilities and regimes exists across all the studies. A summary of study parameters is
presented within Table 1 and more detailed discussion on individual studies is presented below.
2.1.1 Foster and Cox (1973)
Experiments were undertaken in a flume 6 m long, 0.6 m wide and 0.75 m deep. The base of the
flume consisted of painted timber. The velocity and depths were controlled by sluice gates at
each end of the flume. The subjects consisted of 6 male children aged from 9 to 13 years, 1.27
to 1.45 m tall, 25 to 37 kg mass and Height*Mass (H.M) from 32 to 53 mkg (Table 1). All
subjects wore shorts. Clothing drag was negligible in all tests as water levels never reached the
height of the shorts. Shoes were not worn during experimentation.
The subjects were tested standing, walking, turning and sitting within the flume both facing
upstream and downstream. Safety criteria were based on the perception of the child as to safe
and unsafe conditions, i.e. a threshold flow rate was identified when the child felt unsafe rather
than when footing was lost. Consequently, inherent in the criteria developed for safe and unsafe
flow conditions is the psychological tendency of the child. This point is noted in the report by
Foster and Cox (1973) but is rarely noted in most safety criteria subsequently adopted.
Foster and Cox (1973) identified four conditions that could affect the safety of a child:-
The child's physical attributes – this includes age, height, weight and muscular development.
Psychological factors – an alert and active child may be more capable of movement in
certain conditions whilst a passive child may struggle in such conditions.
Hydraulic conditions – the flow regime is important to a person’s safety, in particular depth
and velocity.
Other factors – such as friction between the ground and child’s feet, the type of clothing
worn, the movement of the child in the flow, uneven ground and possible impact of floating
debris.
General conclusions were that relatively low flow depths (< 0.3 m) may be unsafe at high
velocities (i.e. greater than around 1.5 ms-1) and that standing stability reduces when trying to
move in the flow, especially turning. Stability is the lowest when seated. This last conclusion is
important as it infers that once footing has been lost, stability is further reduced and the
likelihood of a person recovering footing is low.
2.1.2 Abt et al. (1989)
In conducting a test program to allow prediction of the approximate depth and velocity of flow in
which a person will topple in flood flow, Abt et al. (1989) completed testing of 20 adults (male
and female, 1.52 to 1.83 m tall, 41 to 91 kg mass and Height*Mass from 62 to 172 mkg: Table
1). Experiments were undertaken in a flume 61 m long, 2.44 m wide and 1.22 m deep using 0.5
and 1.5 percent grades.
A change in surface (from steel to concrete to gravel to turf) did not significantly affect the
stability. This is attributed to most tests being conducted in relatively high depths (>1 m) for
Australian Rainfall and Runoff Revision Project 10: Appropriate Safety Criteria for People
P10/S1/006 :Apr 2010 5
which friction underfoot is less important and instability is biased towards tumbling (moment)
failure as opposed to clear sliding (friction) failure. If tests were undertaken at lower depths with
high velocities, it would be expected that there would be a measurable difference in safety on
different surfaces. An equation defining the threshold of instability of a person in flood flow was
found by linear regression of the experimental data (Eqn. 1) where D.V is the flow regime, M is
the subjects mass (kg) and H, their height (m). The resulting r2 value of 0.48 indicated significant
scatter in the data however, and inherent uncertainty in the derived expression.
209.1)4.25/2.2(022.00929.0. HMeVD (1)
2.1.3 Takahashi et al. (1992)
Takahashi et al. (1992) included detailed measurements of drag, friction and force moments
when testing 3 adult males 1.64 to 1.83 m tall, 63 to 73 kg mass and Height*Mass from 107 to
134 mkg (Table 1). The research (published in Japanese) focus was the safety of dock workers
in conditions of wave overtopping of harbour structures. The experiments were undertaken in a
basin of 50 m length and 20 m width. As opposed to other experiments which used a flume, this
facility operated by funnelling large amounts of water to generate higher velocities and depths.
The subjects stood on a load cell platform that was capable of measuring force, friction and
sliding. The subjects were exposed to increasing combinations of flow depth and velocity until
they were physically washed off their feet in either "sliding" or "tumbling" mode as sketched in
Figure 2.
Testing was undertaken for three different types of clothing (long boots, dry waterproof suit, and
normal cotton trousers) and for a range of leather and rubber soled shoes on a range of
surfaces including smooth and rough concrete as well as concrete covered with algae and
seaweed. Coefficients of friction were measured and found to be typically around 0.6 and 1.0
respectively for smooth and rough concrete under wet conditions. The lowest values reported for
concrete covered with relatively slippery seaweed are around 0.4. No data exists for asphalt
road surfaces and/or grassed floodway surfaces.
With the benefit of continuous monitoring of depth, velocity and resultant forces (on the
persons/subjects) during each test, Takahashi et al. (1992) were able to specifically calculate
drag force coefficients and examine the stability of persons for water exposure from different
directions. For front on water exposure and feet together the drag coefficient was found to vary
between 0.6 and 1.1 depending upon the subject and the clothing being worn.
2.1.4 Karvonen et al. (2000)
The Helsinki University of Technology study (Karvonen et al., 2000) primarily focussed on
defining the limits of human stability for a safe rescue action in a dam break situation. The study,
referred to as the RESCDAM project, recognised that the limit of safety is affected by other
factors such as lighting and turbidity.
Seven adult subjects were used in these experiments, consisting of 5 males and 2 females, 1.6
Australian Rainfall and Runoff Revision Project 10: Appropriate Safety Criteria for People
P10/S1/006 :Apr 2010 6
to 1.95 m tall, 48 to 100 kg in mass and Height*Mass from 77 to 195 mkg (Table 1). Two of the
subjects were professional rescue personnel. As the focus of this study was on rescue worker
mobility, all subjects wore Gore Tex rescue suits (equivalent to a dry suit) and one subject also
wore waders. Subjects also wore fall arrest harnesses for safety. It is assumed that all subjects
wore boots. Experiments were undertaken in a basin 130 m long, 11 m wide and 5.5 m deep.
The water temperature was approximately 16 degrees. The water within the basin was stagnant,
with a moving platform used to replicate flow. The platform consisted of two steel grates
resulting in a 1.13 m wide and 1.17 m long platform. To define the limits for safe rescue action
the velocity and depth of the platform was increased until the subject “lost stability or
manoeuvrability”.
The method of this study is unique in that a platform was moved through stagnant water as
opposed to exposing subjects to flowing turbulent water in a flume or the like. The RESCDAM
study resulted in expressions defining the limits of human manoeuvrability in good (Eqn. 2a),
normal (Eqn. 2b) and poor (Eqn. 2c) conditions, defined according to bed (uneven, slippery,
obstacles), water (floating debris, low temperature, ice, poor visibility) and human subject
(additional loads, disabilities, aged) conditions.
3.0.006.0. MHVD (2a)
2.0.004.0. MHVD (2b)
1.0.002.0. MHVD (2c)
2.1.5 Yee (2003)
Observing a lack in worldwide laboratory test data on the stability of very small/young children or
very frail/older persons, Yee (2003) carried out stability testing of 4 young children (2 male and 2
female, ages 6 to 8 years, 1.09 to 1.25 m tall, 19 to 25 kg mass and Height*Mass from 20.7 to
32.5 mkg: Table 1).
The testing procedures were similar in most aspects to those previously reported by Foster and
Cox (1973). Testing of the subjects in a sitting position was not however carried out. Failure was
determined through observation and consultation with the subject. Video recording of all subject
tests allowed failure scenarios to be clearly identified as either:
a loss in stability resulting in the subject slipping or falling with assistance required; or
a situation where the subject did not feel confident in undertaking set movements in the
generated flow (depth and velocity) and stabilised themselves by grabbing the flume
sides or an assistant.
The two failure definitions are not the same. The first defines failure of stability whilst the second
defines the perceived limit of safety. The results are seen to be consistent with whilst extending
the stability criteria originally determined for older and larger children by Foster and Cox (1973).
Subjects 1, 2 and 3 (with similar H.M values between 27.5 and 32.5 mkg) exhibited very similar
failure behaviour with critical D.V values from 0.51 - 0.55 m2s-1. Subject 4 with a H.M of 20.7
mkg had a significantly lower critical failure value of D.V from 0.33 - 0.38 m2s-1. The lower
stability of subject 4 cannot be explained merely in terms of his smaller height and mass. Based
Australian Rainfall and Runoff Revision Project 10: Appropriate Safety Criteria for People
P10/S1/006 :Apr 2010 7
on detailed observations of behaviour of all subjects during testing, it is postulated that the
difference in behaviour of subject 4 is due to his lower level of muscular development and
coordination.
2.1.6 Jonkman and Penning-Rowsell (2008)
Controlled field experiments of human stability in sluice-control flow within the Lea River
Catchment in the United Kingdom were undertaken by the Flood Hazard Research Centre
(FHRC). The test subject was a professional stuntman 1.7 m tall and 68 kg in weight giving a
combined Height*Mass of 116 mkg (Table 1). The subject wore rubber soled shoes and a
drysuit (Water temp = 10° C) tightly drawn around his legs so cross-sectional area and drag
were not unduly exaggerated. The subject undertook manoeuvres including standing and
walking at right angles and into the flow.
At a depth of 0.35 m, flows inducing failure while attempting to remain standing ranged between
2.4 and 2.6 ms-1 (D.V = 0.84 and 0.91), although the subject began sliding without losing footing
or balance at 1.8 ms-1. At a depth of 0.26 m, the subject fell when attempting to walk into, or
perpendicular to the flow at flow velocities of 3.0 ms-1 and 3.1 ms-1 (D.V = 0.78 and 0.81
respectively).
In all cases, failure was observed to occur after slipping backwards (i.e. frictional instability). This
is likely biased by the relatively low water depths tested. The subject reported that ‘staying still’
was much easier than walking and that walking through the flowing water was ‘exhausting’. The
subject additionally reported that carrying extra weight such as a child would have made
balancing more difficult despite the higher resultant H.M value.
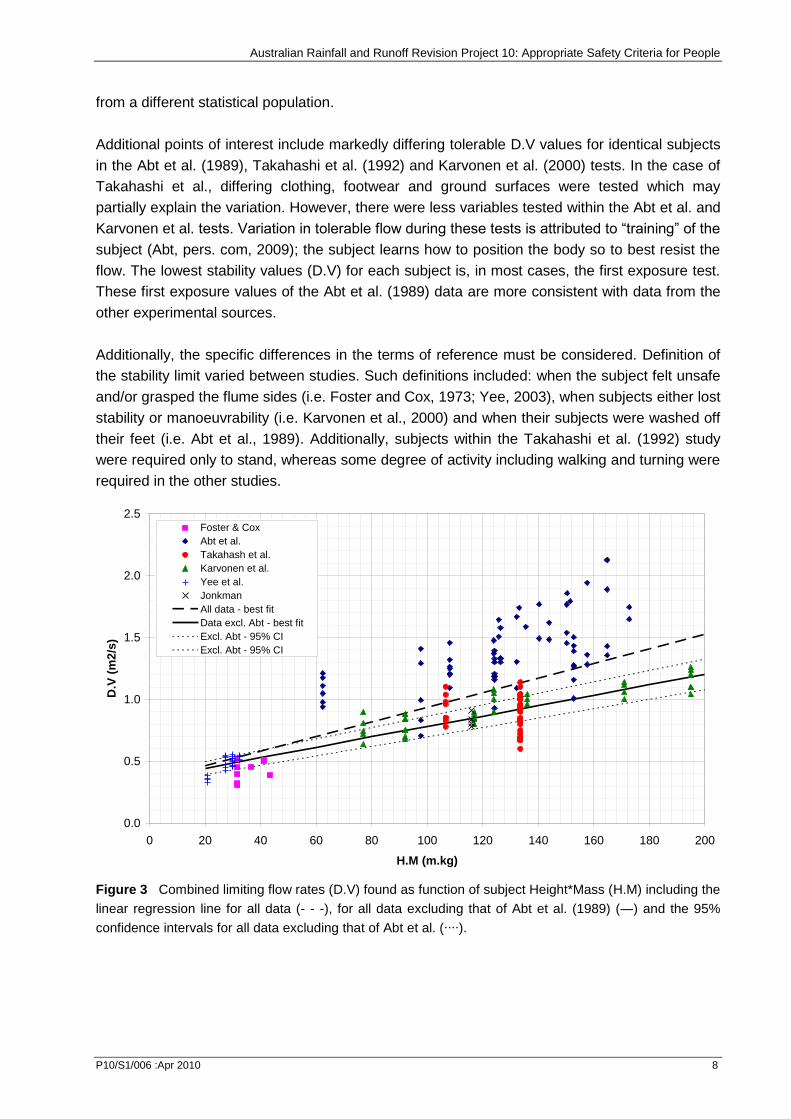
2.1.7 Summary
A comparison of the observed limiting flow regimes (D.V) as function of subject Height*Mass
(H.M) for all experiments is presented within Figure 3. The data shows significant scatter,
although a general increase in tolerable flow with increased subject (H.M) is evident. The linear
regression line is indicated for all data and for all data excluding that of Abt et al. (1989), with
regression coefficients of r2 = 0.50 and 0.80 respectively.
The Abt et al. (1989) data indicates substantially higher stability than all other data for adults
(Figure 3). This cannot fully be explained. It is partially explained in that the purpose of the
experiments was to determine the absolute limit of stability of the subjects to failure (personal
communication with Abt, SR, 10 October 2003), that is the subjects were made to fail as
opposed to determining if safety was compromised and the limits for a safe rescue action which
was the objective of the Karvonen et al. (2000) study. Clothing had lower drag than that
applicable to testing by Takahashi et al. (1992) and Karvonen et al. (2000) and subject
performance was noted to improve with practice.
Ramsbottom et al. (2004) analysed both the Abt et al. (1989) and Karvonen et al. (2000) data
and concluded that, based on a Student T test, the data sets were statistically significantly
different. The remainder of experimental data analysed during this study is more consistent with
that of Karvonen et al. (2000); thus supporting the hypothesis that the Abt. et al. (1989) tests are
Australian Rainfall and Runoff Revision Project 10: Appropriate Safety Criteria for People
P10/S1/006 :Apr 2010 8
from a different statistical population.
Additional points of interest include markedly differing tolerable D.V values for identical subjects
in the Abt et al. (1989), Takahashi et al. (1992) and Karvonen et al. (2000) tests. In the case of
Takahashi et al., differing clothing, footwear and ground surfaces were tested which may
partially explain the variation. However, there were less variables tested within the Abt et al. and
Karvonen et al. tests. Variation in tolerable flow during these tests is attributed to “training” of the
subject (Abt, pers. com, 2009); the subject learns how to position the body so to best resist the
flow. The lowest stability values (D.V) for each subject is, in most cases, the first exposure test.
These first exposure values of the Abt et al. (1989) data are more consistent with data from the
other experimental sources.
Additionally, the specific differences in the terms of reference must be considered. Definition of
the stability limit varied between studies. Such definitions included: when the subject felt unsafe
and/or grasped the flume sides (i.e. Foster and Cox, 1973; Yee, 2003), when subjects either lost
stability or manoeuvrability (i.e. Karvonen et al., 2000) and when their subjects were washed off
their feet (i.e. Abt et al., 1989). Additionally, subjects within the Takahashi et al. (1992) study
were required only to stand, whereas some degree of activity including walking and turning were
required in the other studies.
0.0
0.5
1.0
1.5
2.0
2.5
0 20 40 60 80 100 120 140 160 180 200
H.M (m.kg)
D.V
(m
2/s
)
Foster & Cox
Abt et al.
Takahash et al.
Karvonen et al.
Yee et al.
Jonkman
All data - best fit
Data excl. Abt - best fit
Excl. Abt - 95% CI
Excl. Abt - 95% CI
Figure 3 Combined limiting flow rates (D.V) found as function of subject Height*Mass (H.M) including the
linear regression line for all data (- - -), for all data excluding that of Abt et al. (1989) (―) and the 95%
confidence intervals for all data excluding that of Abt et al. (∙∙∙∙).
Australian Rainfall and Runoff Revision Project 10: Appropriate Safety Criteria for People
P10/S1/006 :Apr 2010 9
2.2. Empirical and Theoretical Analysis
2.2.1 Takahashi et al. (1992)
Based on their experimental results, Takahashi et al. (1992) developed a computational model
for stability incorporating the resolution of forces and moments including weight, flow drag and
friction. Based on human ergonomic data, they adopted a human shape standardised in respect
of height. For any given person's height and weight, computational resolution of weight, drag
and frictional forces enables an estimate of critical velocity for either “sliding” or “tumbling
rotation” modes of stability in a given water depth. In comparisons with the experimental
measurements for the exposed human subjects, the calculated critical conditions using the
computational procedure proved quite reliable for front and side exposure with either feet
together or braced feet wide apart.
For water depths less than "in seam" (less than 0.48 person height), only two feet and legs are
exposed to drag forces. Under such conditions for a relatively slippery surface such as concrete
covered with seaweed or algae, critical values of D.V were found in the experiments to be 0.4 to
0.6 m2/s for front or rear exposure and 0.7 to 0.8 m2/s for side on exposure. If exposed in a
sitting position, increased body drag reduces the critical D.V value to 0.3 to 0.5 m2/s. This finding
is in agreement to that of Foster and Cox (1973) who found stability to be lower in a seated
position than standing.
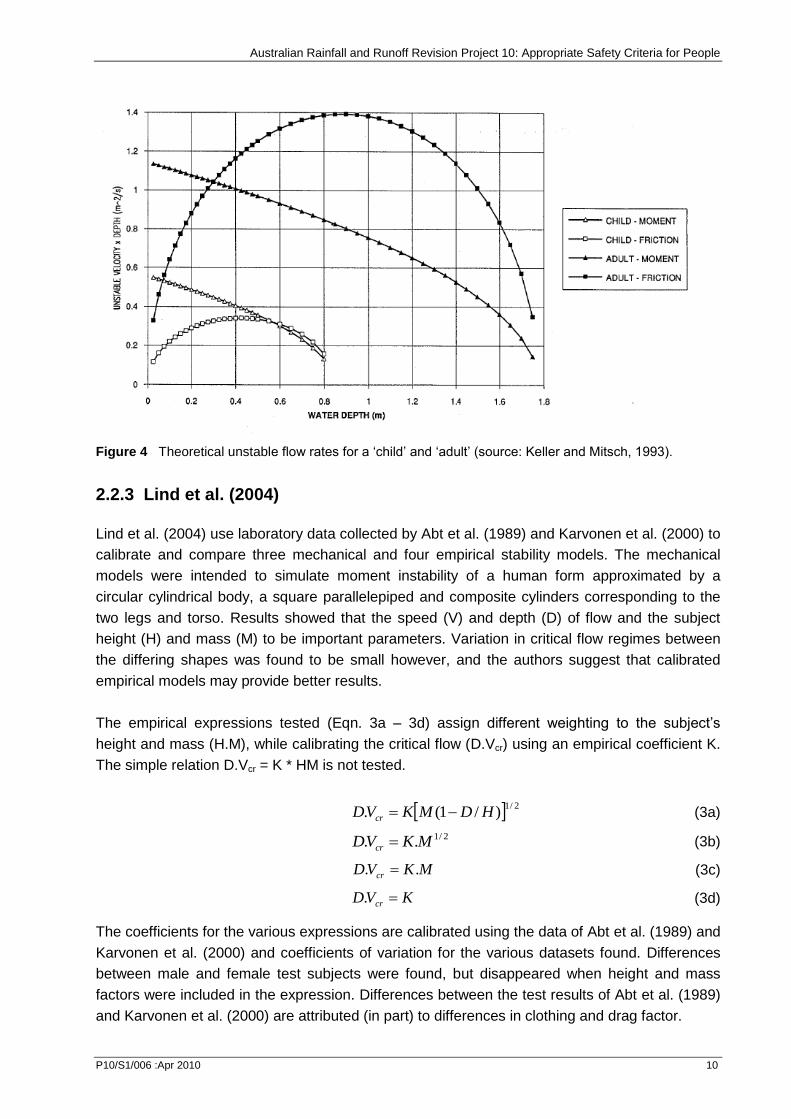
2.2.2 Keller and Mitsch (1993)
Keller and Mitsch (1993) undertook a purely theoretical study of the stability of both cars and
people. The study considered both moment and friction instability of a cylinder intended to
represent a subject child, with an H.M value of 21 and an adult with a non-specified H.M value.
The moment instability was defined as occurring when the overturning moment induced by the
flow around a pivot point at the base of the cylinder exceeded the restoring moment due to
subject weight. Frictional instability was defined as occurring when the drag force due to flow
exceeds the frictional resistance of the subject’s feet. The study found the frictional mode of
instability to be dominant in flow depths less than 0.55 m and moment instability to be dominant
in depths greater than 0.55 m, with unstable D.V values ranging between 0.12 and 0.55 for the
‘child’ and between 0.35 and 1.4 for the adult (Figure 4).
The purely theoretical method described above is, however, highly dependent on the selection
of friction and drag coefficients. A friction coefficient of 0.3 and drag coefficient of 1.2 were
adopted within the study with no sensitivity assessment evident. Takahashi et al. (1992)
measured friction coefficient values generally between 0.6 and 1.0 with a lowest value of 0.4 for
concrete covered with relatively slippery seaweed. Similarly, Takahashi et al. (1992) found
coefficient of drag values to range between 0.6 and 1.1 depending on the subject and clothing
worn.
Australian Rainfall and Runoff Revision Project 10: Appropriate Safety Criteria for People
P10/S1/006 :Apr 2010 10
Figure 4 Theoretical unstable flow rates for a ‘child’ and ‘adult’ (source: Keller and Mitsch, 1993).
2.2.3 Lind et al. (2004)
Lind et al. (2004) use laboratory data collected by Abt et al. (1989) and Karvonen et al. (2000) to
calibrate and compare three mechanical and four empirical stability models. The mechanical
models were intended to simulate moment instability of a human form approximated by a
circular cylindrical body, a square parallelepiped and composite cylinders corresponding to the
two legs and torso. Results showed that the speed (V) and depth (D) of flow and the subject
height (H) and mass (M) to be important parameters. Variation in critical flow regimes between
the differing shapes was found to be small however, and the authors suggest that calibrated
empirical models may provide better results.
The empirical expressions tested (Eqn. 3a – 3d) assign different weighting to the subject’s
height and mass (H.M), while calibrating the critical flow (D.Vcr) using an empirical coefficient K.
The simple relation D.Vcr = K * HM is not tested.
2/1)/1(. HDMKVD cr (3a)
2/1.. MKVD cr (3b)
MKVD cr .. (3c)
KVD cr . (3d)
The coefficients for the various expressions are calibrated using the data of Abt et al. (1989) and
Karvonen et al. (2000) and coefficients of variation for the various datasets found. Differences
between male and female test subjects were found, but disappeared when height and mass
factors were included in the expression. Differences between the test results of Abt et al. (1989)
and Karvonen et al. (2000) are attributed (in part) to differences in clothing and drag factor.
Australian Rainfall and Runoff Revision Project 10: Appropriate Safety Criteria for People
P10/S1/006 :Apr 2010 11
Lind et al. (2004) suggest that the simplest formula (Eqn 3d) with critical flow depending solely
on a calibrated coefficient should be used, with different coefficients used for males and females
and for differing (summer and winter) clothing types. This however, contradicts earlier
conclusions that height and weight parameters are important and that incorporation of these
parameters resolves differences observed between male and female cases.
2.2.4 Yee (2003)
Yee (2003) developed a predictive computational model based on the work of both Takahashi et
al. (1992) and Keller and Mitsch (1993) with the incorporation of parameters for velocity, depth
(up to 1.5 m), subject height, mass and body shape, drag, friction, buoyancy and moment
stability mass lever arm (distance from heel to centre of gravity). The model examined both
sliding (friction) or tumbling (moment) failure. Adopting coefficients of 1.1 and 0.4 for drag and
friction respectively and a fixed moment stability lever arm value of 0.1m, the model was found
to reliably predict stability criteria comparable with the test results of Takahashi et al. (1992),
Foster and Cox (1973) and all but the smallest subject in Yee (2003). Adjustment of the drag
and frictional coefficients and the lever arm was required to improve the fit of the Abt et al.
(1989) and Karvonen et al. (2000) data.
The Yee (2003) predictive computational model has been re-applied to all the data sets with
improved agreement utilising consistent relative values of friction, drag and moment stability
lever arm (as fraction of subject Height H) given in Table 2.
Table 2 Re-application of Yee (2003) model to various data sets
Foster and Cox (1973)
Yee (2003) Takahashi et al. (1992)
Karvonen et al. (2000)
Abt et al. (1989)
Friction coefficient
0.4 0.4 0.6 0.45 0.6
Drag coefficient
0.8 0.8 1.0 1.0 0.8
Moment stability mass lever arm
0.04 H 0.04 H 0.06 H 0.06 H 0.12 H
It is noteworthy that the lever arm for the Abt et al. data had to be increased to 0.12 H as the
reported “trained” subjects used muscle/body balance to better resist the flow - effectively
increasing the moment stability mass lever arm.
2.2.5 Ramsbottom et al. (2004; 2006)
Ramsbottom et al. (2004; 2006) (the UK DEFRA Flood Risk to People Report) tested various
empirical equations (Eqn. 4a – 4c) using the Abt et al. (1989) and Karvonen et al. (2000)
experimental data. The D.V values for each test subject in the experimental datasets were
‘averaged’, presumably to reduce scatter. However, as discussed earlier, training of subjects
was observed, particularly in the Abt et al. (1989) data. By averaging values, an assumption of
some training is incorporated into the derived hazard predictors. This assumption is not,
however, necessarily valid with respect to the general population who may experience instability
Australian Rainfall and Runoff Revision Project 10: Appropriate Safety Criteria for People
P10/S1/006 :Apr 2010 12
and safety risk at their first exposure to a flood hazard.
The equations are compared to the experimental datasets individually and combined, with linear
regression values used as an indicator of goodness of fit. The strongest relationship was
observed for Eqn. 4a, and much stronger relationships were observed for the individual datasets
than combined. This indicates significant disparity between the two datasets, which, as
discussed within Section 2.1.7, was confirmed using a student T test to show significant
statistical difference.
CVDKMH ).(. (4a)
CVDKMH ).(. 2 (4b)
CVDKMH )5.1(. (4c)
Despite Eqn. 4a showing the best statistical fit to data, Eqn. 4c is adopted to undertake hazard
rating analysis and combined with a factor to account for debris within the flow. The justification
given for this selection is that some risk is posed by deep flows at low velocities. Additionally, the
debris factor (DF) is not supported by experimental testing but assigned a value of 0, 1 or 2. A
review of the 2004 study within Ramsbottom et al. (2006) revised the velocity coefficient from
+1.5 to +0.5 and the debris factor (DF) from between 0 and 2 to between 0 and 1 to define
various classes of flood hazard based on the term DFVD )5.0( . Flood hazard regimes as
proposed within Ramsbottom et al. (2006) are shown within Table 3.
Table 3 Suggested stability thresholds (Ramsbottom et al. (2006).
Flood hazard
D.(V+0.5)+DF
Description Alternative name/
hazard class
0 Safe (dry) None
0 – 0.75 Caution Low
0.75 – 1.5 Dangerous for some Moderate
1.5 – 2.5 Dangerous for most Significant
> 2.5 Dangerous for all Extreme
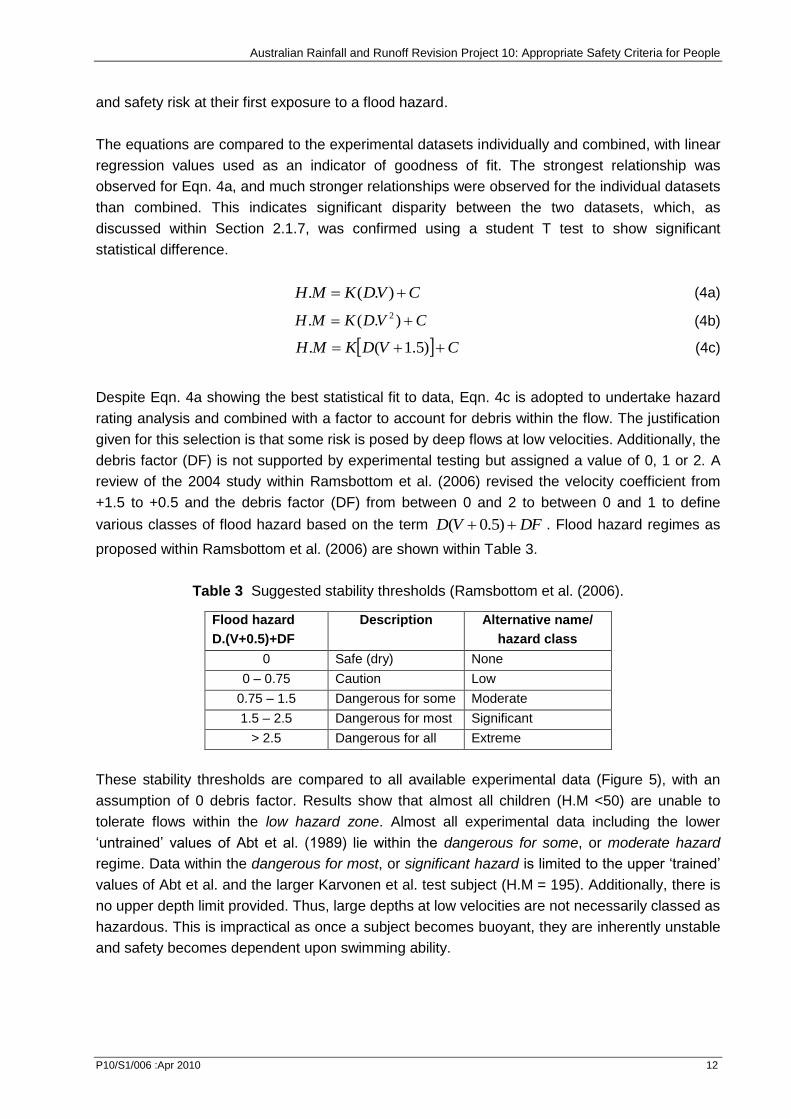
These stability thresholds are compared to all available experimental data (Figure 5), with an
assumption of 0 debris factor. Results show that almost all children (H.M <50) are unable to
tolerate flows within the low hazard zone. Almost all experimental data including the lower
‘untrained’ values of Abt et al. (1989) lie within the dangerous for some, or moderate hazard
regime. Data within the dangerous for most, or significant hazard is limited to the upper ‘trained’
values of Abt et al. and the larger Karvonen et al. test subject (H.M = 195). Additionally, there is
no upper depth limit provided. Thus, large depths at low velocities are not necessarily classed as
hazardous. This is impractical as once a subject becomes buoyant, they are inherently unstable
and safety becomes dependent upon swimming ability.
Australian Rainfall and Runoff Revision Project 10: Appropriate Safety Criteria for People
P10/S1/006 :Apr 2010 13
0.0
0.2
0.4
0.6
0.8
1.0
1.2
1.4
0.0 0.5 1.0 1.5 2.0 2.5 3.0 3.5
Velocity (m/s)
De
pth
(m
)Foster & Cox
Abt et al.
Takahashi et al.
Karvonen et al.
Yee et al.
Jonkman
Ramsbottom (D[V+0.5] = 0.75)
Ramsbottom (D[V+0.5] = 1.5)
Ramsbottom (D[V+0.5] = 2.5)
Figure 5 Comparison of Ramsbottom et al. (2006) stability thresholds with all available experimental
data (note: debris factor is assumed 0).
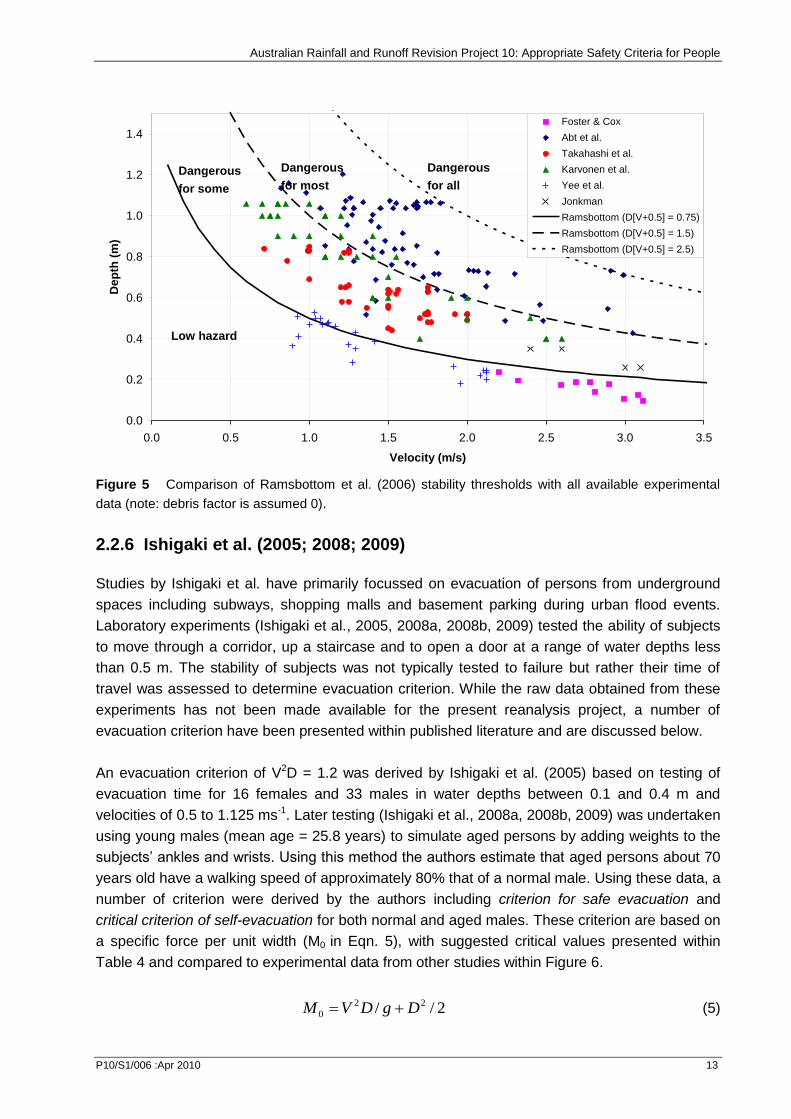
2.2.6 Ishigaki et al. (2005; 2008; 2009)
Studies by Ishigaki et al. have primarily focussed on evacuation of persons from underground
spaces including subways, shopping malls and basement parking during urban flood events.
Laboratory experiments (Ishigaki et al., 2005, 2008a, 2008b, 2009) tested the ability of subjects
to move through a corridor, up a staircase and to open a door at a range of water depths less
than 0.5 m. The stability of subjects was not typically tested to failure but rather their time of
travel was assessed to determine evacuation criterion. While the raw data obtained from these
experiments has not been made available for the present reanalysis project, a number of
evacuation criterion have been presented within published literature and are discussed below.
An evacuation criterion of V2D = 1.2 was derived by Ishigaki et al. (2005) based on testing of
evacuation time for 16 females and 33 males in water depths between 0.1 and 0.4 m and
velocities of 0.5 to 1.125 ms-1. Later testing (Ishigaki et al., 2008a, 2008b, 2009) was undertaken
using young males (mean age = 25.8 years) to simulate aged persons by adding weights to the
subjects’ ankles and wrists. Using this method the authors estimate that aged persons about 70
years old have a walking speed of approximately 80% that of a normal male. Using these data, a
number of criterion were derived by the authors including criterion for safe evacuation and
critical criterion of self-evacuation for both normal and aged males. These criterion are based on
a specific force per unit width (M0 in Eqn. 5), with suggested critical values presented within
Table 4 and compared to experimental data from other studies within Figure 6.
2// 22
0 DgDVM (5)
Low hazard
Dangerous
for some
Dangerous
for most
Dangerous
for all
Australian Rainfall and Runoff Revision Project 10: Appropriate Safety Criteria for People
P10/S1/006 :Apr 2010 14
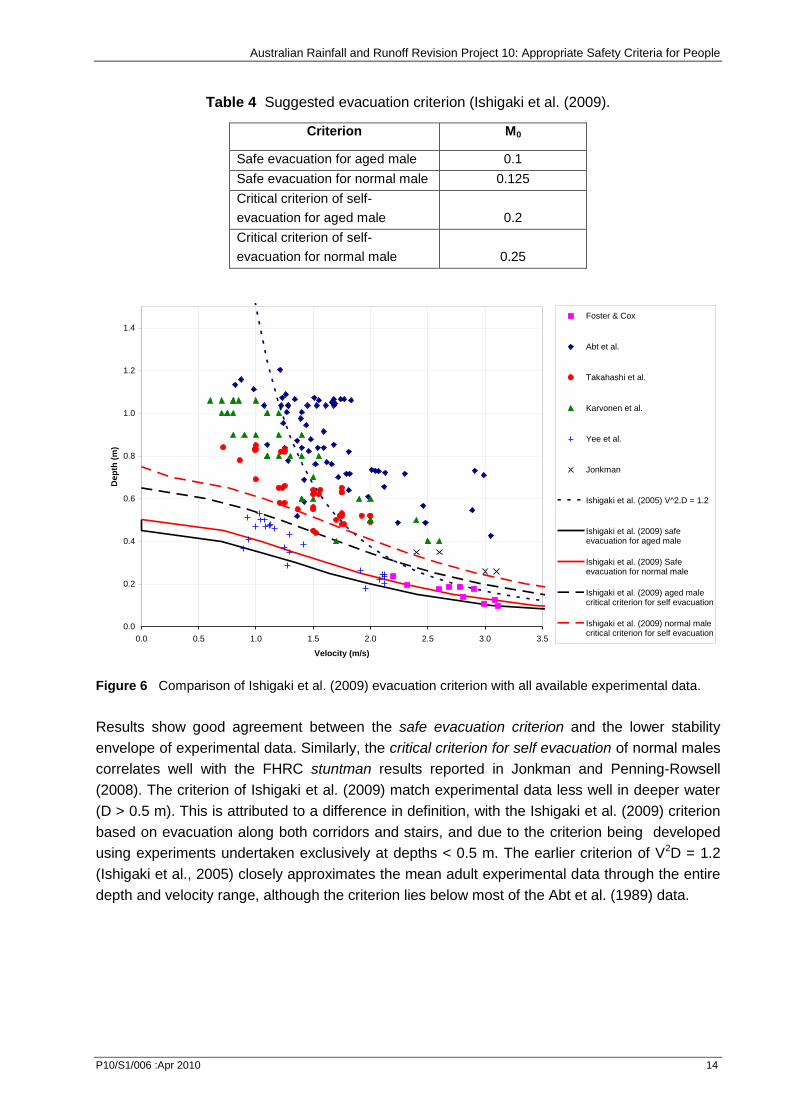
Table 4 Suggested evacuation criterion (Ishigaki et al. (2009).
Criterion M0
Safe evacuation for aged male 0.1
Safe evacuation for normal male 0.125
Critical criterion of self-
evacuation for aged male 0.2
Critical criterion of self-
evacuation for normal male 0.25
0.0
0.2
0.4
0.6
0.8
1.0
1.2
1.4
0.0 0.5 1.0 1.5 2.0 2.5 3.0 3.5
Velocity (m/s)
Dep
th (
m)
Foster & Cox
Abt et al.
Takahashi et al.
Karvonen et al.
Yee et al.
Jonkman
Ishigaki et al. (2005) V^2.D = 1.2
Ishigaki et al. (2009) safeevacuation for aged male
Ishigaki et al. (2009) Safeevacuation for normal male
Ishigaki et al. (2009) aged malecritical criterion for self evacuation
Ishigaki et al. (2009) normal malecritical criterion for self evacuation
Figure 6 Comparison of Ishigaki et al. (2009) evacuation criterion with all available experimental data.
Results show good agreement between the safe evacuation criterion and the lower stability
envelope of experimental data. Similarly, the critical criterion for self evacuation of normal males
correlates well with the FHRC stuntman results reported in Jonkman and Penning-Rowsell
(2008). The criterion of Ishigaki et al. (2009) match experimental data less well in deeper water
(D > 0.5 m). This is attributed to a difference in definition, with the Ishigaki et al. (2009) criterion
based on evacuation along both corridors and stairs, and due to the criterion being developed
using experiments undertaken exclusively at depths < 0.5 m. The earlier criterion of V2D = 1.2
(Ishigaki et al., 2005) closely approximates the mean adult experimental data through the entire
depth and velocity range, although the criterion lies below most of the Abt et al. (1989) data.
Australian Rainfall and Runoff Revision Project 10: Appropriate Safety Criteria for People
P10/S1/006 :Apr 2010 15
3. Reanalysis of Experimental Data
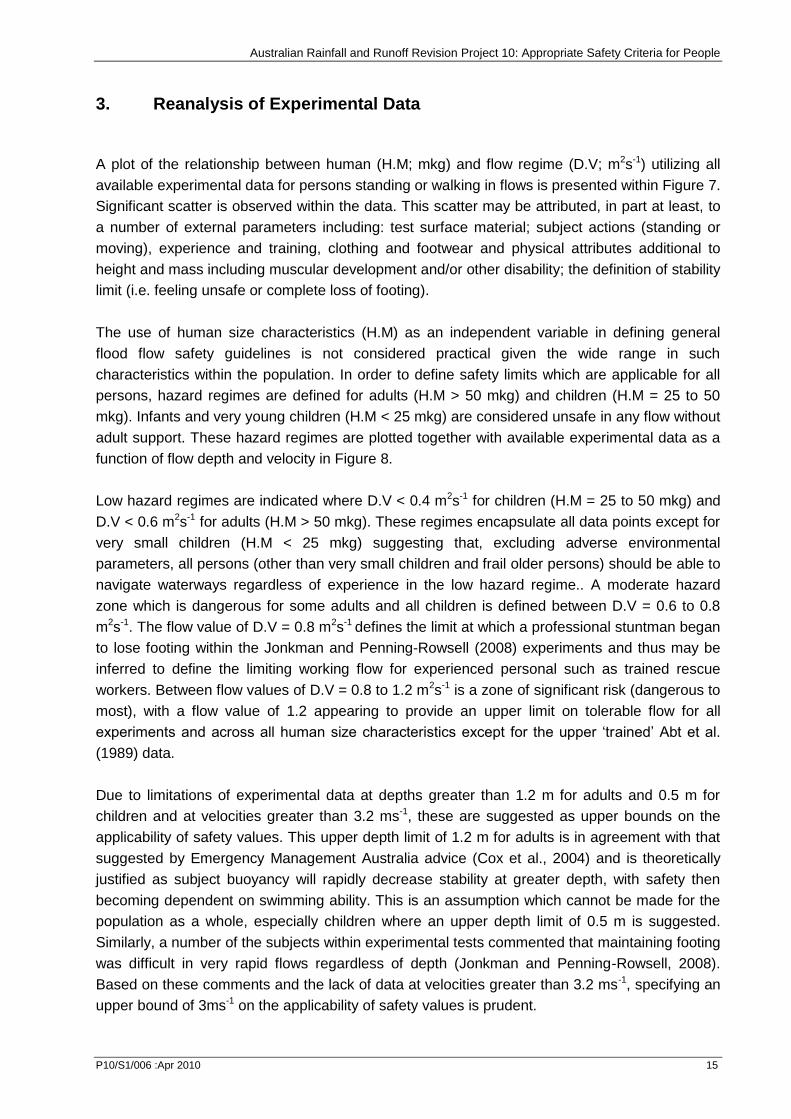
A plot of the relationship between human (H.M; mkg) and flow regime (D.V; m2s-1) utilizing all
available experimental data for persons standing or walking in flows is presented within Figure 7.
Significant scatter is observed within the data. This scatter may be attributed, in part at least, to
a number of external parameters including: test surface material; subject actions (standing or
moving), experience and training, clothing and footwear and physical attributes additional to
height and mass including muscular development and/or other disability; the definition of stability
limit (i.e. feeling unsafe or complete loss of footing).
The use of human size characteristics (H.M) as an independent variable in defining general
flood flow safety guidelines is not considered practical given the wide range in such
characteristics within the population. In order to define safety limits which are applicable for all
persons, hazard regimes are defined for adults (H.M > 50 mkg) and children (H.M = 25 to 50
mkg). Infants and very young children (H.M < 25 mkg) are considered unsafe in any flow without
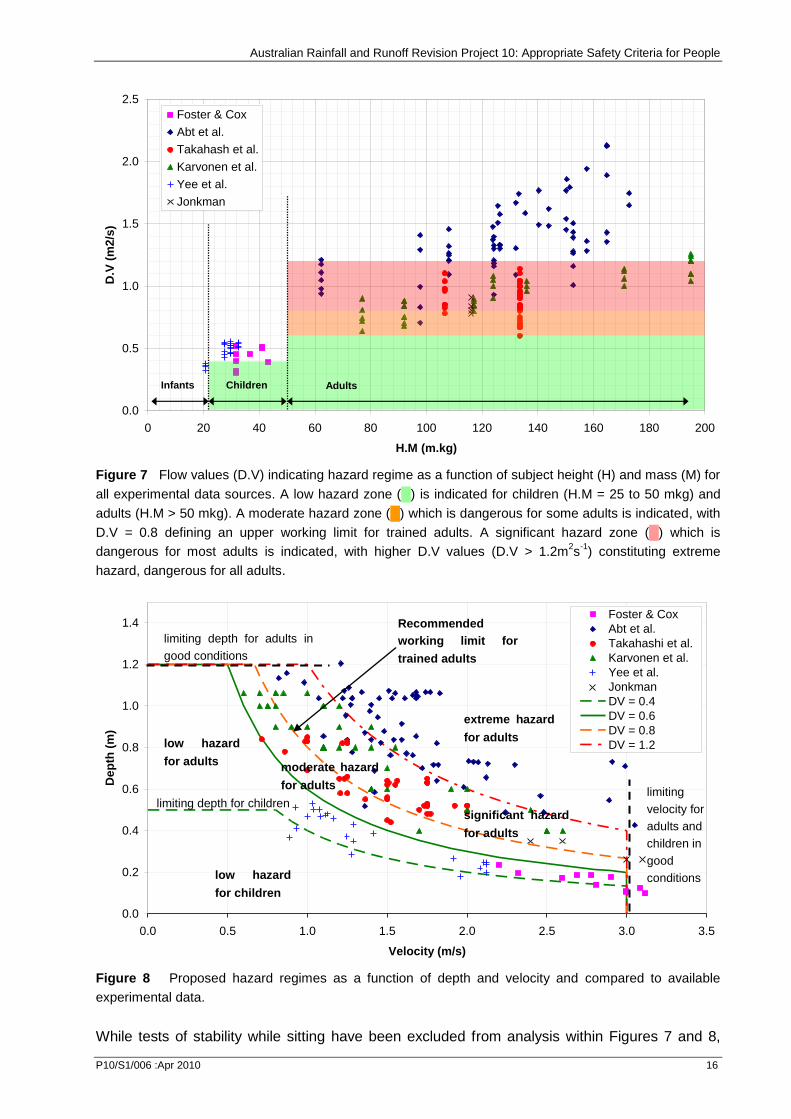
adult support. These hazard regimes are plotted together with available experimental data as a
function of flow depth and velocity in Figure 8.
Low hazard regimes are indicated where D.V < 0.4 m2s-1 for children (H.M = 25 to 50 mkg) and
D.V < 0.6 m2s-1 for adults (H.M > 50 mkg). These regimes encapsulate all data points except for
very small children (H.M < 25 mkg) suggesting that, excluding adverse environmental
parameters, all persons (other than very small children and frail older persons) should be able to
navigate waterways regardless of experience in the low hazard regime.. A moderate hazard
zone which is dangerous for some adults and all children is defined between D.V = 0.6 to 0.8
m2s-1. The flow value of D.V = 0.8 m2s-1 defines the limit at which a professional stuntman began
to lose footing within the Jonkman and Penning-Rowsell (2008) experiments and thus may be
inferred to define the limiting working flow for experienced personal such as trained rescue
workers. Between flow values of D.V = 0.8 to 1.2 m2s-1 is a zone of significant risk (dangerous to
most), with a flow value of 1.2 appearing to provide an upper limit on tolerable flow for all
experiments and across all human size characteristics except for the upper ‘trained’ Abt et al.
(1989) data.
Due to limitations of experimental data at depths greater than 1.2 m for adults and 0.5 m for
children and at velocities greater than 3.2 ms-1, these are suggested as upper bounds on the
applicability of safety values. This upper depth limit of 1.2 m for adults is in agreement with that
suggested by Emergency Management Australia advice (Cox et al., 2004) and is theoretically
justified as subject buoyancy will rapidly decrease stability at greater depth, with safety then
becoming dependent on swimming ability. This is an assumption which cannot be made for the
population as a whole, especially children where an upper depth limit of 0.5 m is suggested.
Similarly, a number of the subjects within experimental tests commented that maintaining footing
was difficult in very rapid flows regardless of depth (Jonkman and Penning-Rowsell, 2008).
Based on these comments and the lack of data at velocities greater than 3.2 ms-1, specifying an
upper bound of 3ms-1 on the applicability of safety values is prudent.
Australian Rainfall and Runoff Revision Project 10: Appropriate Safety Criteria for People
P10/S1/006 :Apr 2010 16
0.0
0.5
1.0
1.5
2.0
2.5
0 20 40 60 80 100 120 140 160 180 200
H.M (m.kg)
D.V
(m
2/s
)Foster & Cox
Abt et al.
Takahash et al.
Karvonen et al.
Yee et al.
Jonkman
AdultsChildrenInfants
Figure 7 Flow values (D.V) indicating hazard regime as a function of subject height (H) and mass (M) for
all experimental data sources. A low hazard zone (█) is indicated for children (H.M = 25 to 50 mkg) and
adults (H.M > 50 mkg). A moderate hazard zone (█) which is dangerous for some adults is indicated, with
D.V = 0.8 defining an upper working limit for trained adults. A significant hazard zone (█) which is
dangerous for most adults is indicated, with higher D.V values (D.V > 1.2m2s
-1) constituting extreme
hazard, dangerous for all adults.
0.0
0.2
0.4
0.6
0.8
1.0
1.2
1.4
0.0 0.5 1.0 1.5 2.0 2.5 3.0 3.5
Velocity (m/s)
Dep
th (
m)
Foster & Cox
Abt et al.
Takahashi et al.
Karvonen et al.
Yee et al.
Jonkman
DV = 0.4
DV = 0.6
DV = 0.8
DV = 1.2
Figure 8 Proposed hazard regimes as a function of depth and velocity and compared to available
experimental data.
While tests of stability while sitting have been excluded from analysis within Figures 7 and 8,
low hazard
for adults
Recommended
working limit for
trained adults
limiting depth for adults in
good conditions
limiting depth for children limiting
velocity for
adults and
children in
good
conditions low hazard
for children
moderate hazard
for adults
significant hazard
for adults
extreme hazard
for adults
Australian Rainfall and Runoff Revision Project 10: Appropriate Safety Criteria for People
P10/S1/006 :Apr 2010 17
studies have shown that once footing is lost stability is further reduced due to the greater surface
area presented to the flow and that footing is unlikely to be regained unless a reduction in flow
conditions occurs (Cox et al., 2004).
Australian Rainfall and Runoff Revision Project 10: Appropriate Safety Criteria for People
P10/S1/006 :Apr 2010 18
4. Conclusions and Recommendations
Human stability within floodways has been found to be dependent on many factors. The two
most important factors are flow depth and velocity, with depth found to dictate whether loss of
stability is by sliding (friction) or tumbling (moment) failure. High depths increase buoyancy and
reduce friction underfoot typically resulting in tumbling failure while low depth-high velocity flows
may cause sliding instability. Cox et al. (2004) suggest that high depth, low velocity flows are
more dangerous as, once footing is lost, a person is more likely to be swept away and drowned.
Over the last four decades, a number of laboratory-based experimental studies have been
undertaken within Australia and internationally to define the limits of stability within differing flow
regimes. Significant scatter is observed within the individual data sets and, to a more significant
degree, when all data sets are combined. This scatter may be attributed to a number of external
parameters including the test surface material, required subject actions, subject experience,
clothing and footwear and the definition of stability limit.
Based on the results of these studies, a number of empirical and computational models have
been derived to predict safe flow thresholds. However, due to the typical exclusion of the above
variables, model agreement with experimental data has often been poor. The current Australian
Rainfall and Runoff (ARR) guidelines (I.E.Aust, 1987) stipulate that “to prevent pedestrians
being swept along streets and other drainage paths during major storm events, the product of
velocities and depths in streets and major flow paths generally should not exceed 0.4 m2/s”.
Two sets of safety criteria have been developed based on re-analysis of data collected during
previous laboratory and field investigations. For children with a height and mass product (H.M)
of between 25 and 50, low hazard exists for flow values of D.V < 0.4 m2s-1, with a maximum flow
depth of 0.5 m regardless of velocity and a maximum velocity of 3.0 ms-1 at shallow depths (D <
0.2 m). Under these flow regimes, the children tested retained their footing and felt “safe” in the
flow. For adults (H.M > 50), low hazard exists for flow values of D.V < 0.6 m2s-1 with a maximum
depth limit of 1.2 m and a maximum velocity of 3.0 ms-1 at shallow depth (D < 0.3 m). Moderate
hazard exists between D.V = 0.6 and 0.8 m2s-1, with a tolerable working flow regime of D.V < 0.8
m2s-1 recommended for trained safety workers or experienced and well equipped persons.
Significant hazard exists between D.V = 0.8 to 1.2 m2s-1, with the upper limit of stability observed
during the majority of investigations of D.V = 1.2 m2s-1. Above this flow rate hazard is extreme
and should not be considered safe for standing or traversing.
Hazard regimes as a function of limiting flow values for infants, children and adults are
presented within Table 5
Australian Rainfall and Runoff Revision Project 10: Appropriate Safety Criteria for People
P10/S1/006 :Apr 2010 19
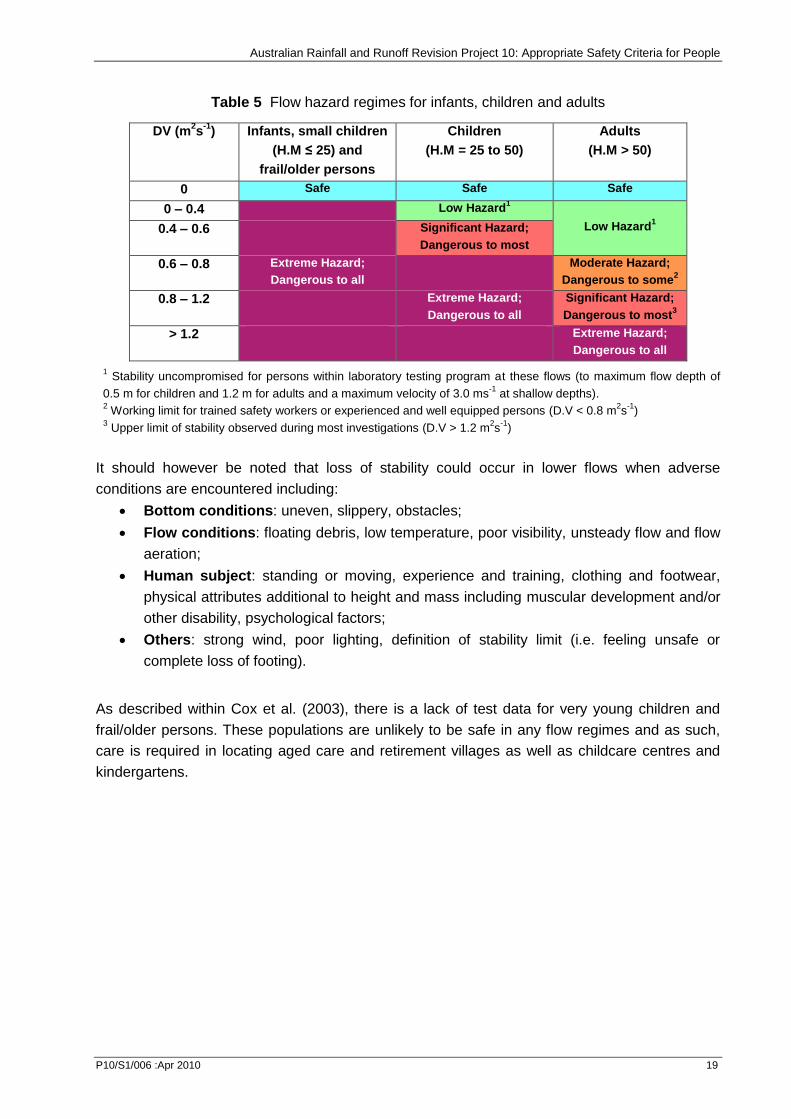
Table 5 Flow hazard regimes for infants, children and adults
DV (m2s
-1) Infants, small children
(H.M ≤ 25) and
frail/older persons
Children
(H.M = 25 to 50)
Adults
(H.M > 50)
0 Safe Safe Safe
0 – 0.4 Low Hazard1
Low Hazard1 0.4 – 0.6 Significant Hazard;
Dangerous to most
0.6 – 0.8 Extreme Hazard;
Dangerous to all
Moderate Hazard;
Dangerous to some2
0.8 – 1.2 Extreme Hazard;
Dangerous to all
Significant Hazard;
Dangerous to most3
> 1.2 Extreme Hazard;
Dangerous to all
1 Stability uncompromised for persons within laboratory testing program at these flows (to maximum flow depth of
0.5 m for children and 1.2 m for adults and a maximum velocity of 3.0 ms-1
at shallow depths). 2 Working limit for trained safety workers or experienced and well equipped persons (D.V < 0.8 m
2s
-1)
3 Upper limit of stability observed during most investigations (D.V > 1.2 m
2s
-1)
It should however be noted that loss of stability could occur in lower flows when adverse
conditions are encountered including:
Bottom conditions: uneven, slippery, obstacles;
Flow conditions: floating debris, low temperature, poor visibility, unsteady flow and flow
aeration;
Human subject: standing or moving, experience and training, clothing and footwear,
physical attributes additional to height and mass including muscular development and/or
other disability, psychological factors;
Others: strong wind, poor lighting, definition of stability limit (i.e. feeling unsafe or
complete loss of footing).
As described within Cox et al. (2003), there is a lack of test data for very young children and
frail/older persons. These populations are unlikely to be safe in any flow regimes and as such,
care is required in locating aged care and retirement villages as well as childcare centres and
kindergartens.
Australian Rainfall and Runoff Revision Project 10: Appropriate Safety Criteria for People
P10/S1/006 :Apr 2010 20
References
Abt, S.R, Wittler, R.J, Taylor, A and Love, DJ. (1989). Human Stability in a High Flood Hazard
Zone, Water Resources Bulletin, American Water Resources Association, 25 (4), pp 881-890.
Cox, R.J. & Ball, J.E. (2001). Stability and Safety in Flooded Streets, Conference on Hydraulics
in Civil Engineering, Hobart, The Institution of Engineers, Australia.
Cox, R.J., Yee, M. and Ball, J.E. (2004). Safety of People in Flooded Streets and Floodways. 8th
National Conference on Hydraulics in Water Engineering, Gold Coast. The Institution of
Engineers, Australia.
Department of Public Works, (1986), Floodplain Development Manual, New South Wales
Government, Sydney, Australia.
Department of Environment, Climate Change and Water, (2005) NSW Floodplain Development
Manual, New South Wales Government, Sydney, Australia.
EMA (1999) Managing the Floodplain. Australian Emergency Management Series, Part 3,
Volume 3, Guide 3, Emergency Management Australia, Canberra.
Foster, D.N. and Cox, R.J. (1973). Stability of Children on Roads Used as Floodways, Technical
Report No. 73/13, Water Research Laboratory, The University of New South Wales, Manly
Vale, NSW, Australia.
Institution of Engineers, Australia (1987) Australian Rainfall and Runoff, Vol. 1&2. (Ed: Pilgrim,
D.H.) Institution of Engineers, Australia.
Ishigaki, T., Baba, Y., Toda, K. and Inoue, K. (2005): Experimental study on evacuation from
underground space in urban flood, Proc. of 31st IAHR Congress on CD-ROM, Seoul.
Ishigaki T., Onishi Y., Asai Y., Toda K. and Shimada H. (2008a). Evacuation criteria during
urban flooding in underground space, Proc. of 11th ICUD, Scotland, UK. (on CD-ROM).
Ishigaki T., Kawanaka R., Onishi Y., Shimada H., Toda K. and Baba Y. (2008b). Assessment of
safety on evacuation route during underground flooding, Proc. of 16th APD-IAHR, Nanjing,
China,141-146.
Ishigaki, T., Asai, Y., Nakahata, Y., Shimada, H., Baba, Y. and Toda, K. (2009) Evacuation of
aged persons from inundated underground space, in Proceedings of the 8th International
Conference on Urban Drainage Modelling, Tokyo, 2009.
Jonkman, S.N. and Penning-Rowsell, E. (2008). Human Instability in Flood Flows. Journal of the
American Water Resources Association, Vol. 44, No. 4, pp 1 – 11.
Karvonen, R.A., Hepojoki, H.K., Huhta, H.K. and Louhio, A. (2000). The Use Of Physical
Models In Dam-Break Flood Analysis, Development of Rescue Actions Based on Dam-Break
Flood Analysis (RESCDAM). Final report of Helsinki University of Technology, Finnish
Environment Institute.
Keller, R.J and Mitsch, B. (1993). Safety Aspects of the Design of Roadways as Floodways,
Research Report No. 69, Urban Water Research Association of Australia.
Australian Rainfall and Runoff Revision Project 10: Appropriate Safety Criteria for People
P10/S1/006 :Apr 2010 21
Lind, N., Hartford, D. and Assaf, H. (2004). Hydrodynamic models of human stability in a flood.
Journal of the American Water Resources Association. February 2004.
New South Wales State Flood Plan, (2001). Sub-Plan of the New South Wales State Disaster
Plan (DISPLAN), State Emergency Management Committee, Sydney.
O'Loughlin, G.G. and Robinson, D.K. (1998). Urban Stormwater Management - Book 8,
Australian Rainfall and Runoff - A guide to Flood Estimation, Edited by DH Pilgrim, The
Institution of Engineers, Australia.
Ramsbottom, D. Floyd, P. and Penning-Towsell, E. (2004). Flood Risks to People, Phase 2:
Draft Inception Report.
Ramsbottom, D. Floyd, P. and Penning-Towsell, E. (2006). Flood Risks to People; Phase 2:
Project Record. FD 2321/PR. Department for Environment Food and Rural Affairs, United
Kingdom. 166p.
Takahashi, S., Endoh, K. and Muro, Z-I, (1992). Experimental Study on People’s Safety against
Overtopping Waves on Breakwaters, Report on the Port and Harbour Institute, 34 (4), pp 4-31
(in Japanese).
Yee, M. (2003). Human Stability in Floodways, Undergraduate Honours Thesis, School of Civil
and Environmental Engineering , University of New South Wales, Sydney, Australia.
Recommended