Review of Recent NZ Modelling on Costs and Effectiveness to Mitigate Agricultural GHG Emissions
Dr. Adam Daigneault, University of Maine, USA
January 22 2019
Review Summary
Overview The purpose of this work is to provide a review of recent modelling on the mitigation potential and costs
of mitigation of New Zealand’s agricultural greenhouse gas (GHG) emissions. The review was asked to
consist of the following:
1. Identification of critical assumptions in individual reports that limit realism/applicability of results in real-world situations and actual policy context
2. Evaluation of consistency/compatibility of results across reports 3. Identification of additional modelling work to fill remaining knowledge gaps
The review consisted of seven recent reports that have included agricultural GHG modelling as part of
their analysis. Some of these reports have already been released to the public, while others are in near
final draft form. The specific reports included in this review are listed in Table 1.
Table 1. List of reports included NZ agricultural GHG emissions review
Lead Report Title Short Name
Motu Land-use Change as a Mitigation Option for Climate Change
Motu – Land use change
Landcare Research
Assessing the Nationwide Economic Impacts of Farm Level Biological GHG Emission Mitigation Options
Landcare – Farm Level Mitigation
NZAGRC On-farm options to reduce agricultural GHG emissions in New Zealand
NZAGRC – Current
NZAGRC Future options to reduce biological GHG emissions on-farm: critical assumptions and national-scale impact
NZAGRC – Future
Vivid Modelling the transition to a lower net emissions New Zealand: Interim results
Vivid – Transition to a lower net emissions
NZIER Economic impact analysis of 2050 emissions targets: A dynamic Computable General Equilibrium
NZIER – 2050 Targets
Westpac Westpac NZ Climate Change Impact Report Westpac – CC Impact
Estimated impacts produced in these modelling exercises are typically driven by the following
assumptions and methodologies:
- Purpose of the report (scoping, specific target analysis)
- Baseline, counter-factual, or business as usual pathway through 2030 and 2050
- Emissions reduction targets (i.e., how much from which point and by when)
- Sectors included in analysis (e.g., livestock, forestry, non-land use)

- Sources, cost, and effectiveness of mitigation practices (e.g., new tech, land use change)
- Policy approach (e.g., emissions cap, GHG price/tax)
- Modelling framework (e.g., partial equilibrium, general equilibrium, hybrid)
This review attempts to summarize how each of these components are applied in the various analyses.
It also compiles the key findings from each report, focusing on land use sector impacts such as changes
in GHG emissions and economic indicators like GHG price, farm profitability and output, and sector-level
employment. In addition, it highlights some of the strengths and weaknesses of each report and
provides some suggestions on how future analyses could be conducted.
Finally, it should be noted that although the review does present some key outputs across all of the
analyses, this does not mean that the reports are directly comparable. This is because each analysis was
intended to answer a specific question and thus employed its own set of data, models, assumptions, and
scenarios to do so.
General Approach - There are generally three ‘methods’ that can be employed to estimate the cost and
effectiveness of reducing agricultural GHGs: bottom-up or engineering focused farm-level
mitigation practices; partial equilibrium (PE) models that often explicitly incorporate farm-level
mitigation practices to quantify the impacts to the land use sector; and computable general
equilibrium (CGE) models that account for all major sectors of the New Zealand economy.
- The seven reports considered for this review used a mix of all three methods (Figure 1). Two of
the studies explicitly employed all three methods into their analysis in the form of incorporating
explicit costs and effectiveness of farm-level practices (including land use change) into their land
use sector model, estimating pathways to achieve a specific GHG reduction target in the land
use sector, and then ‘passing’ on estimates such as carbon price and farm-level output to the
CGE model to estimate broader economic impacts such as employment and GDP.
-
Figure 1. Overview of Agricultural GHG Mitigation Modelling Approach
- Each study had a specific objective that motivated the analysis. All studies had a common
objective of modelling the reduction in GHG emissions from various sectors of the NZ economy,
including agriculture and forestry. However, all of the reports differed in their specification of
how much GHGs should be reduced by what sector and when, how to model mitigation
practices, and which components of the analysis were exogenous (i.e. specified by modeller) vs.

endogenous (i.e., solved within the model). Even in the case where the same models were
employed for multiple reports (e.g., LURNZ, ESSAM), the study objectives, sectors covered, and
source of mitigation all differed slightly.
- The PE and CGE models all required the specification of ‘exogenous shocks’ in their analysis. This
came in the form of a GHG price, defined level of land use change to forestry and/or
horticulture, and/or introduction of a CH4 vaccine in 2030. These assumptions were
exogenously introduced in the cases where a model did not have the ability to ‘endogenously’
adjust these aspects on its own (e.g., NZIER does not have forest carbon sequestration in their
CGE model) or was explicitly part of the study objective (e.g., Landcare modelled four exogenous
GHG price paths to estimate difference in on-farm mitigation).
- Each of the methods employed in the specific studies are deemed to be ‘robust’ and generally
accepted by the economic and farm modelling community. The key differences in estimates –
even between studies where the same modelling approach was employed – is driven more by
assumptions about how economic agents may actually employ specific practices and how
agricultural output, GHGs, and profitability may change if a given practice were employed.
Overall assessment - All of the analyses followed well-accepted modelling practices and presented logical and robust
results based on their model frameworks and reported assumptions. The relatively wide
variation in the results is most likely due to the range in objectives, methods, and assumptions
used in each report.
- Table 2 provides a list of the key indicators in GHG price and mitigation assumptions employed
by each analysis. The table highlight how each study had its own set of objectives, model
approach, models used, mitigation practices, sectors, exogenous assumptions, and more. As a
result, it is difficult to clearly identify the exact reasons why each study differs. Thus, my review
focuses on identifying the key differences across the studies and hypothesizes why results may
differ. As mentioned above, even when models were used in more than report (e.g., LURNZ,
ESSAM), the study objectives, sectors covered, links to other models, and source of mitigation all
differed slightly.
- The key exogenous assumptions in these studies include: the model and mitigation timeframe,
the area of pasture that can change to forest or horticulture, accounting for forest carbon
sequestration, whether the methane (CH4) vaccine is used as a mitigation practice, the rate of
change for farm productivity and emissions intensity, and what other mitigation practices are
available within the model framework. Most of the studies included more than one of these
assumptions, making it difficult to clearly isolate which component had the largest effect on the
results.
- The level of a specific exogenous assumption varied across the studies. For example, the Motu
and Vivid studies both used the LURNZ model and included expanding horticulture as a
mitigation option, with the Vivid analysis specifying that up to 1.5 million hectares (Mha) of
pasture could be converted, while Motu included scenarios ranging from 0 to 1.0 Mha.
- Most of the PE and CGE studies endogenously estimated GHG prices as a mechanism to achieve
a specified emissions reduction target. NZAGRC’s reports estimated average costs in terms of
$/tCO2e for each mitigation practice, while Landcare used a set of four exogenous GHG price
paths.

- I provide more details on some of the key differences across the analyses as well as summarize
how the results vary below.
Table 2. List of key indicators used in NZ GHG mitigation studies
Indicator NZAGRC - Current Mitigation
Landcare - Farm Level GHG Mitigation
Motu - Land Use Change
Vivid - Net Zero 2050
NZIER - Econ impacts 2050 GHG targets
Westpac - CC Impact Report
NZAGRC - Future Mitigation
Report objective
Provide an overview of currently (2018) available options to reduce NZ’s biological GHG emissions, primarily from cattle and sheep.
Assess the economic and environmental impacts of adopting mitigation for four exogenous GHG price scenarios on agricultural biological GHGs
Explore how land use change can mitigate GHG emissions. Focused on cost-effective land-use responses but not recommend who should bear the costs
Use PE models and techno-policy pathways to assess impacts of adopting GHG reduction targets to 2050. Use multiple sectors of economy to achieve targets.
Examine economic impacts from various 2050 emissions targets. Estimate carbon prices for scenarios with innovation in energy, transport, agriculture, and forest carbon sequestration.
Use CGE model to analyze the transitionary impacts of climate change consistent with achieving ‘two-degree future’ emissions scenarios.
Evaluate on-farm options that may be available in future (2030 and 2050) to reduce biological GHG emissions.
Method Bottom up, regional/industry averages, static
bottom-up data, top down scenario analysis, quasi-static, PE and GE
bottom-up land use data, top down scenario analysis, dynamic PE,static GE
bottom-up land use data, top down scenario analysis, dynamic PE models
top down scenario analysis, dynamic CGE
top down scenario analysis, recursive dynamic CGE
Bottom up, regional/industry averages, static; expert judgement
Model(s) OVERSEER, FARMAX
NZFARM, ESSAM
LURNZ, NZFARM, ESSAM
LURNZ, ENZ MNZG ViEW CGE model
National Inventory only (no economic models)
Analysis boundary
Farm-gate Farm-gate and Economy-wide
Farm-gate and Economy-wide
Land use and energy sectors
Land use and energy sectors
Economy-wide Farm-gate
Analysis timeframe
2018 2012, 2030, 2050
2015 to 2050 2015 to 2050 2017 to 2050 2015 to 2050 2018 to 2050
Total GHG Reductions
varies by practice
12 to 25% below BAU gross agricultural emissions by 2050
15 to 50% below 2005 gross agricultural emissions by 2050
Net emissions of 25 and 0 MtCO2e by 2050
50, 75, and 100% below 1990 emissions of 64.6 MtCO2e (all sectors)
50 to 60% below 2015 total net emissions (50MtCO2e) by 2050
12-24% below 2005 ag GHGs by 2030; 9-40% below 1990 GHGs by 2050
GHG emissions pricing
Average cost for individual practices
Exogenous Endogenous
Exogenous: 2015-2030; Endogenous: 2031-2050
Endogenous Endogenous
Average cost for individual practices (when data available)
On-farm Mitigation Approach
Individual practices (incl. trees on farm), not optimized systems
Individual practices (incl. trees on farm), not optimized systems
Exogenous CH4 vaccine for livestock in 2030
Exogenous CH4 vaccine for livestock in 2030
Generic abatement via labor and capital switching; exogenous CH4 vaccine for livestock in 2030
Generic abatement via labor and capital switching and efficiency improvements
Individual practices (incl. trees on farm), not optimized systems

Land use change mitigation
Not evaluated quantitatively; derives upper limit of 1.5 million ha (Mha) from livestock to horticulture
None
Exogenous pasture to horticulture, Endogenous increase in forestry
Exogenous pasture to horticulture, Endogenous increase in forestry
Expansion of horticulture and forestry (mostly exogenous)
n/a (not reported)
None
Forestry mitigation
Exogenous, on-farm only
Endogenous, on-farm only
Endogenous, afforestation
Endogenous, afforestation
Exogenous, afforestation
Exogenous, afforestation
Exogenous, on-farm only
Horticulture mitigation
Bioclimatic suitability only; Exogenous limit of 1.5 Mha
No Exogenous, up to 1.0 Mha
Exogenous, up to 1.0 Mha
Endogenous Endogenous No
Methane vaccine mitigation
Yes - 2030 No Yes - 2030 Yes - 2030 Yes - 2030 No Yes - 2030
- There was no single methodology that was found to produce more ‘robust’ or ‘biased’
estimates. The divergence in the estimated GHG prices faced by the land use sector and
resulting emissions reductions were based more on the assumptions about the relative cost and
effectiveness of mitigation practices available in the respective studies (including purchasing
international emissions reduction credits) and/or technological change and innovation over
time. For example, the Westpac and NZIER studies both used CGE models, but NZIER was found
to be significantly more costly to the overall NZ economy. I believe that this result was primarily
driven by the assumption about the exogenous rate of agricultural emissions intensity over time
(~1.5% for Westpac vs. 0.75% for NZIER). As a result, agriculture emissions do not increase as
much in the business as usual (BAU) scenario for the Westpac study, thereby making it much
cheaper to meet similar reduction targets.
- Results were primarily driven by input assumptions. Two assumptions stuck out in particular 1)
the role of forestry and forest carbon sequestration and 2) the availability of methane inhibitors
and other low-cost practices that could reduce agricultural GHG emissions over time. To the
degree that these two options were available, then costs could be reduced by 50% or more
relative to a model exercise or scenario where these were omitted.
- GHG price estimates were relatively consistent across studies. Comparing GHG prices across
studies revealed that, on average, the studies estimated relatively consistent GHG prices (with
the upper bound of NZIER being the outlier) 1. Furthermore, most of the studies had prices
within the range of estimates from international assessments of requirements to achieve the 2
degree C target set forth under the Paris Agreement (Figure 2).
1 The NZAGRC studies analyzed individual and bundled mitigation practices, where costs were presented as average $/tCO2e, when data was available. The studies published in Figure 2 modelled sector-wide impacts, of which all but the Landcare study endogenously estimated GHG prices required to meet a given emissions reduction target.

Figure 2. Range of GHG prices ($/tCO2e) for partial and general equilibrium studies.
- Ag GHG mitigation and forest carbon sequestration varied significantly across studies.
Comparing GHG mitigation across studies revealed that there was greater variation in
abatement than GHG prices. Figure 3 shows the estimated amounts of abatement in 2050
relative to a business as usual projection for the same year. This variation was largely driven by
the assumptions discussed above: whether the analysis included the exogenous uptake of the
low-cost CH4 mitigation and/or the amount of forest carbon sequestration. Note that the NZIER
and Westpac studies both assumed that the level of forest carbon sequestration update was
exogenous (as their CGE models could not account for this endogenously). In addition, some of
the farm-level and PE studies did not include forest carbon sequestration via land-use change as
an explicit mitigation practice (rather, it was incorporated only into an on-farm option). In
addition, NZIER did not report agricultural GHG mitigation, although it is highly likely that a
proportion of their total abatement estimate did come from that sector.
$0
$100
$200
$300
$400
$500
$600
$700
Lan
dca
re
Mo
tu
Viv
id
NZI
ER
Wes
tpac
Ave
rage
Par
is A
gre
e
Lan
dca
re
Mo
tu
Viv
id
NZI
ER
Wes
tpac
Ave
rage
Par
is A
gre
e
Lan
dca
re
Mo
tu
Viv
id
NZI
ER
Wes
tpac
Ave
rage
Par
is A
gre
e
2020 . 2030 . 2050
GHG Price Ranges ($/tCO2e)

Figure 3. Range of 2050 agricultural GHG abatement and additional forest carbon sequestration (MtCO2e) relative to business
as usual projections reported in studies2.
Key drivers of mitigation cost and effectiveness The variation in estimates of GHG prices and mitigation across the studies appeared to be driven by
model assumptions than the model frameworks themselves. In summary, the key drivers are:
- Rate and flexibility of mitigation practice uptake. The more flexible economic agents in the
model were to respond to GHG prices, the lower the cost to achieve a given target. CGE and PE
models typically represent this with elasticities of substitution or transformation, where the
model algorithm uses info about cost, effectiveness, and agent’s willingness to change to ‘select’
the optimal pathway to achieve a given objective. Bottom-up approaches often estimate an
average ‘break-even’ price ($/tCO2e) before farmers would be willing to employ a given
practice, followed by a qualitative assessment on what proportion of farms are likely to
implement a practice, often through expert opinion (e.g., NZAGRC future mitigation report).
- Including forestry as a mitigation option. All studies included this to some degree, but the level
and aspect in which it was ‘allowed’ (on-farm only, or land-use change) varied significantly.
- Forest carbon accounting. The studied included a wide range of estimates applied on a
tCO2e/ha/yr. Select planting as riparian to full afforestation meant that ‘forestry’ could
contribute anywhere from about 1.0 to 31 tCO2/ha/yr. Most studies were in the 10-20
tCO2/ha/yr range.
2 NZAGRC-current study only modelled individual mitigation practices that were not necessarily additive. NZIER did not report agricultural GHG abatement. Landcare did not include full afforestation as a mitigation option.
0
10
20
30
40
50
60
Lan
dca
re
Mo
tu
Viv
id
NZI
ER
Wes
tpac
NZA
GR
C -
fu
ture
Ave
rage
Lan
dca
re
Mo
tu
Viv
id
NZI
ER
Wes
tpac
NZA
GR
C -
fu
ture
Ave
rage
Ag GHG Mitigation . Forest C Sequest
MtC
O2
e/yr
2050 GHG Mitigation Ranges Relative to BAU (MtCO2e/yr)

- Methane vaccination. Several studies accounted for this coming ‘online’ in 2030, although the
level of effectiveness varied, especially for sheep-beef enterprises (20-30% reduction). In all
cases, there was a noticeable reduction in agricultural emissions and/or cost of mitigation to
achieve a given emissions target at the point that it became available.
- Suite of mitigation practises available to be implemented. Studies that included a larger suite
of mitigation practices typically had lower costs. Although more is not always better, the studies
that included practices with different degrees of cost and effectiveness that represented a
possible ‘envelope’ of mitigation potential tended to find that it was cheaper than others to
meet a specific GHG target.
- Innovation or technological change. Studies that included higher rates of technological change
(e.g, Vivid assumed agricultural emissions intensity decreased 1.5%/yr) were found to meet
targets at a lower GHG price.
Potential for improvement - Forest Carbon Sequestration Accounting. More effort could be made to compare and contrast
the forest carbon sequestration accounting assumptions employed in these models. Given that
NZ already has established accounting methods, it would be beneficial for all models to
incorporate those figures to some degree. The studies reviewed for this study showed that the
total ‘cost’ of meeting specific GHG reduction targets can vary significantly based on the
assumption about how much carbon a forest can sequester, how long landowners can receive
carbon payments after planting trees, and how these payments translate into economic
incentives. Furthermore, the assumption about whether carbon stored in harvested wood
products could ‘count’ towards the GHG reduction target also varied across studies.
- Current Farm Practice Cost Assumptions. The current farm practice costs estimated for the
NZAGRC and Landcare Research (LR) reports appeared to vary significantly. In some cases, the
same practice (e.g,. reduced stocking rates) was estimated to be cost-saving in the NZAGRC
report, while relatively costly in some scenarios of the LR report. I realize that each study makes
their own assumptions, but the wide variation in results for what I consider to be readily
employed or ‘proven’ practices suggests that the farming and modelling community need to
continue discussions about the most appropriate way to represent and model mitigation
practices (e.g., average vs. feasible potential).
- Cost of CH4 Vaccine. Most studies deemed the CH4 vaccine to be administered at low to no
cost, although it could be implied that the vaccine was only administered because there was a
carbon price. Additional sensitivity analysis could look at the degree to which the vaccine would
be taken up relative to other options using a partial equilibrium land use modelling approach.
- Future mitigation practices. A new study could be undertaken to quantify the sector and
economy wide impacts if the suite of future options explored by NZAGRC to reduce GHG
emissions in NZ became more readily available. I realize that additional work will have to be
undertaken to estimate the potential costs of each option (the quantitative aspect of the study
largely focused on the effectiveness), but doing so could help identify which emerging practices
could be targeted for additional investment.
Detailed Model and Report Assessment
This remainder of the report outlines the individual assessment for each of the seven reports included in
the review. The review consisted of thoroughly reading each report and attempting to synthesize the

key methods, assumptions, and results across the suite of documents. To the extent possible, the review
also highlighted the key strengths and weaknesses of each report/model and identified the major
overlaps and outliers (e.g., scenario focus, carbon price assumptions, mitigation practices included,
adoption constraints, etc.).
In addition, the review was asked to consider the following key questions:
1. Considering each report separately, are the modelled results for agricultural GHG emissions plausible and (drawing on the reviewer’s familiarity with work in New Zealand) consistent with other reports that have addressed similar questions? If not, what is driving such results?
2. Do the reports sufficiently clarify where the model design, inputs, and assumptions, drive outcomes? If not, what additional information needs to be provided to make this clear, and to what extent does missing information drive outcomes?
3. Looking across the reports, how consistent are the reports on the actual mitigation potential and costs of mitigating agricultural emissions (when considering both on-farm options and land-use change), now, in 2030, and in 2050?
4. Where results are inconsistent or contradictory, what drives those inconsistencies? To what extent can any inconsistencies be reconciled and explained by different model design, inputs and assumptions?
In my experience, the impacts estimated in these modelling exercises are typically driven by the
following assumptions and methodologies:
- Purpose of the report (scoping, specific target analysis)
- Baseline, counter-factual, or business as usual (BAU) pathway through 2030 and 20503
- Emissions reduction targets (i.e., how much from which point and by when)
- Sectors included in analysis (e.g., livestock, forestry, non-land use)
- Sources, cost, and effectiveness of mitigation practices (e.g., new tech, land use change)
- Policy approach (e.g., emissions cap, GHG price/tax)
- Modelling framework (e.g., partial equilibrium, general equilibrium, hybrid)
This review attempts to summarize how each of these components are applied in the various analyses.
It also compiles the key findings from each report, focusing on land use sector impacts such as changes
in GHG emissions and economic indicators like GHG price, farm profitability and output, and sector-level
employment. In addition, it highlights some of the strengths and weaknesses of each report.
The detailed assessment first addresses each report in the order that they are presented in Table 1. It
follows with a short synthesis of how the key input assumptions and findings compare across the seven
studies.
Motu – Land-use Change as a Mitigation Option for Climate Change
The purpose of this report was to explore how changes in the way land is used can mitigate greenhouse
gas (GHG) emissions. It focused on cost-effective land-use responses that could be implemented by
landowners but it did not recommend who should bear the costs of those changes. The scenarios
3 N.B., An initial model scenario that estimates a plausible future absent of the policy in question (in this case, agricultural GHG mitigation). Business-as-usual scenarios have long been considered an essential point of reference in policymaking, planning and investment – a baseline to compare alternative scenarios, or a starting point for analysis of a system. This pathway typically tracks historical trends into the future.

presented were developed by the Biological Emissions Reference Group with input from the modelling
team. The main project objective is to predict the likely extent and nature of land-use change as part of
a cost-effective response to land-sector mitigation targets and the potential economic, water quality,
and social impacts of these changes. It also explored a) how those land-use changes, and the intensity
of effort required to achieve them, vary with the timing and stringency of targets and with different
assumptions about new land uses and technology; (b) corresponding national environmental impacts;
and (c) national impacts on gross domestic product (GDP), production of key export commodities, and
employment.
The analysis used three models. Two were land use sector specific: Motu’s Land Use in Rural New
Zealand model (LURNZ) and Manaaki Whenua – Landcare Research’s New Zealand Forestry and
Agricultural Regional Model (NZFARM), while the third was an economy-wide model: Infometrics’
Energy Substitution, Social Accounting Matrix (ESSAM). The land-use models simulated how land use
might change to achieve a given emission target in the lowest cost way. Each model takes a different
approach (statistical versus optimisation) to identify the combination of land-use changes that is likely to
achieve this at lowest cost. In both models this is done through modelling the effect of an implicit price
for emissions (i.e,. GHG or carbon price) on the economic returns to landowners for different products.
The report only considered the impact of on-farm mitigation in terms of how an assumed reduction
target or level might affect the land-use changes needed. (i.e., it excluded the potential for mitigation
via changing farming practices). However, it did examine the potential impacts of horticultural
expansion and/or a viable methane vaccine (or equivalent other mitigation technology such as an
inhibitor or significant change in farm practice).
A schematic of how the models were linked is shown in Figure 4, while key findings of the assessment
are listed in Table 3.
Figure 4. Motu – Land use change report modelling approach

Table 3. Key findings of Motu – Land use change report assessment
Indicator Motu – Land Use Change
Report Status Final
Analysis Level Regional to National
Analysis boundary Farm-gate and Economy-wide
Analysis timeframe 2015 to 2050
Method bottom-up land use data, top down scenario analysis, dynamic PE and static GE
Models LURNZ, NZFARM, ESSAM
Economic Indicators Farm Output (Revenue), Farm Profitability (EBIT); $/tCO2e, GDP, RGNDI
Total GHG Reductions 15 to 50% below 2005 gross agricultural emissions
Average GHG Price (2020 to 2050)4 $35 in 2020 to 90/tCO2e in 2050
Livestock GHG price range5 $15 to $192/tCO2e across all periods and scenarios
Forest GHG price range $15 to $192/tCO2e across all periods and scenarios
Other Land Use GHG price range $15 to $192/tCO2e across all periods and scenarios
Discount rate n/a
Dairy Profit (mean$/ha/yr) NZFARM: $1275 (no figures reported for LURNZ)
S&B Profit (mean$/ha/yr) NZFARM $326 (no figures reported for LURNZ)
Hort & Arable Profit (mean$/ha/yr) NZFARM: Fruit: $7,315; Pipfruit: $6,312; Veg: $11,946; Vit: $15,857
Forestry Profit (mean$/ha/yr) NZFARM: $565 (no figures reported for LURNZ)
Hort Potential (ha) up to 1,000,000 ha
Mitigation Approach land use change driven by carbon price on forestry/scrub; generic vaccine for livestock in 2030; exogenous horticultural expansion
Mitigation: Dairy 2: Land use change; CH4 vaccine for 1 scenario
Mitigation: Sheep & Beef 2: Land use change; CH4 vaccine for 1 scenario
Mitigation: Deer n/a
Mitigation: Hort & Arable n/a
Mitigation: Land Use Change 0, 0.5 and 1.0 million from pasture to horticulture (exogenous). Endogenous increase in forestry
Forest Carbon Accounting LURNZ: Mean radiata is 31.83 tCO2e/ha/yr for 21 years based on National Inventory lookup table; Scrub/native: 6.5t CO2e/ha throughout simulation period. NZFARM: 11 tCO2e/ha/yr based on current inventory average
Farm Profit/Output Impacts NZFARM profit: -0 to -0.2% ESSAM output: +3 to +6%
Other Economic Impacts Total Employment; LURNZ: +1 to +21% ESSAM: +1 to +4%
Co-benefits N and P for Dairy (explicit). Other implicit from LU change
Notable Caveats Only focuses on land use change. ESSAM only used to estimate changes in agricultural sector output (although can do other sectors of the economy)
Strengths 2 PE model approach can quantify range of estimates under technically the same assumption. Not all scenarios conducted using NZFARM.
Limitations/Weaknesses CH4 vaccine is exogenously applied to all stock in 2030 at no cost. Hard to assess what estimates are linked across models besides GHG price.
Additional notes on this report were as follows:
4 The average price is the mean $/tCO2e across all modelled scenarios. The range presented in this and subsequent tables is for the mean in the 2020 and 2050 periods. 5 The range lists the full spectrum of GHG prices modelled for all periods from 2020 to 2050.

Some scenarios have widely differing results between LURNZ and NZFARM (e.g., NZFARM has
less increase in horticulture, more increase in forestry). Would like to see more explanation
within the report (Section 4.4) on why.
I hypothesize that it is due to (a) contrasting model frameworks/algorithms (LURNZ is statistical
–based while NZFARM is optimization focused), (b) different GHG sequestration factors in each
model (e.g., LURNZ assumes forests sequester 31.83 tonnes per year for 21 years after planting
(then nothing more) while NZFARM in contrast assumes that all forest sequesters 10.9 tonnes
ha on average for each model period).
Assume that NZFARM not as responsive/bullish on land use change to horticulture due to
functional form of model, static model framework, and elasticity parameterization. I think that
you would have seen more change if NZFARM used a recursive-dynamic framework that allowed
changes over time.
Hard to compare impacts between LURNZ and ESSAM because many of the ESSAM estimates
were just % change, but with no initial baseline value to compare that to.
LURNZ reports agricultural sector output, not profit/net revenue. Thus, unable to compare with
NZFARM or other studies that use net farm revenue or relative change in total agricultural
sector output.
NZFARM and LURNZ have significantly different Forest Carbon Sequestration accounting
approaches. Thus, sequestration estimates for LURNZ should be much higher over simulation
period.
Appreciate that study has some qualitative discussion about barriers to mitigation uptake. It
would be good to see similar discussions in other analyses, noting that some do discuss this to
some degree (e.g., NZAGRC).
Study is most comparable to Vivid because both use LURNZ. Both had very similar range in GHG
prices when using similar model assumptions ($50-100/tCO2e in 2050). Motu study has greater
range in agriculture GHG abatement, which I think is because there was a greater exogenous
increase in horticulture.
Hard to compare with Landcare study because although both use NZFARM, the Landcare study
focused on on-farm abatement only and hence had a different objective and assumptions about
on-farm mitigation options than the Motu study.
Landcare Research – Assessing the Nationwide Economic Impacts of Farm Level Biological GHG
Emission Mitigation Options
The Landcare Research analysis explores the synergies and trade-offs between climate change on-farm mitigation options, greenhouse gas (GHG) emissions, and agricultural profitability. It sought to assess the economic and environmental impacts of adopting mitigation options under four different GHG emission price scenarios for biological GHG emissions from agriculture. These impacts were projected to 2030 and 2050 at both regional and national levels. The analysis focused on on-farm mitigation. It did not consider land use change (except partial planting of forestry on-farm), the adoption of innovative technologies to increase agricultural productivity (except for one mitigation option in one of the analyses) or the abandonment of farming activity (i.e. reversion to scrub or fallow land).
The main objectives of the analysis were to: (a) determine the likely mitigation options and the possible adoption of these to reduce GHG emissions in the dairy and sheep and beef sectors; (b) outline barriers to the adoption of mitigation options; (c) estimate the subsequent economic impacts in terms of

changes in agricultural productivity and profitability that result from the adoption of these mitigation options; (d) estimate the wider national impacts on gross domestic product (GDP), trade, and employment from pricing biological GHG emissions; (e) estimate the reduction in GHG emissions that result from the adoption of mitigation options; and (f) outline the likely environmental co-benefits or costs associated with pricing biological GHG emissions.
The analysis used a mix of qualitative and quantitative approaches. To inform the modelling effort, researchers convened workshops with BERG members to (a) agree on the farm level data and farm systems to be used in the analysis, (b) confirm the mitigation options to include in the analysis, and (c) explore the barriers to why different mitigation options may or may not be adopted.
Two analyses were undertaken for the agricultural sector. Analysis I included a wide array of scenarios and mitigation options for the dairy and sheep and beef sectors, while Analysis II updated the draft report with an additional mitigation option for the dairy sector that reduced cow numbers while increasing milk production per cow (so that it was more closely aligned to a mitigation option featured in the NZAGRC Current Mitigation report). The impacts of different GHG prices on the adoption of mitigation options and subsequent profits (i.e. earnings before interest and taxes) and GHG emissions were estimated using LR’s New Zealand Forestry and Agricultural Regional Model (NZFARM). The wider economic consequences of pricing biological GHG emissions were then estimated using Infometrics’s general equilibrium model (ESSAM). Additional costs and benefits not captured by the economic modelling approaches were described using a qualitative ecosystem services assessment.
A schematic of how the models were linked is shown in Figure 5, while key findings of the assessment
are listed in Table 4.
Figure 5. Landcare – Farm level modelling report modelling approach
Table 4. Key findings of Landcare – Farm level modelling report assessment
Indicator Landcare – Farm Level Modelling
Report Status Final
Analysis Level Regional to National
Analysis boundary Farm-gate and Economy-wide
Analysis timeframe 2012, 2030, 2050
Method bottom-up data, top down scenario analysis, quasi-static, PE and GE
Models NZFARM, ESSAM
Economic Indicators Farm Profitability (EBIT); $/tCO2e, GDP, RGNDI
Total GHG Reductions Dairy: 2 to 19% by 2050; S&B: 21 to 29% by 2050; Total: 12 to 25% by 2050

Average GHG Price (2020 to 2050) $22 to $145/tCO2e
Livestock GHG price range $15 to $191.54/tCO2e
Forest GHG price range $5 to 37.75/tCO2e
Other Land Use GHG price range n/a
Discount rate 1.8% (based on real interest rate)
Dairy Profit (mean$/ha/yr) $1,275
S&B Profit (mean$/ha/yr) $326
Deer Profit (mean$/ha/yr) $584
Hort & Arable Profit (mean$/ha/yr) Fruit: $7,315; Pipfruit:$ ,6312; Veg: $11,946; Vit: $15,857
Forestry Profit ($/ha/yr) $578
Hort Potential (ha) n/a
Mitigation Approach Individual practices, not optimized systems
Mitigation: Dairy 6: Output (farm system) based, reduce fertilizer, change input feed, stock reduction, OAD milking, forestry
Mitigation: Sheep & Beef 3: forestry, reduce stocking rate, replace breeding cows
Mitigation: Deer n/a
Mitigation: Hort & Arable n/a
Mitigation: Land Use Change Land area fixed; afforestation assumed to occur only as partial change of existing pastoral system
Forest Carbon Accounting Mean sequestration of ~12 tCO2e/yr based on current annual rates.
Farm Profit/Output Impacts Dairy: -14 to -98% by 2050; S&B: -15% to -123% by 2050; Total -6% to -61 by 2050
Other Economic Impacts GDP reduced by 0.1%, RGNDI unchanged?
Co-benefits N, P, forest ecosystem services, recreation
Notable Caveats No guarantee that farmers will uptake mitigation;
Strengths Links farm-practice, PE, and GE for holistic approach to estimating impacts. Models impacts over a range of GHG prices. PE approach is highly flexible
Limitations/Weaknesses
No land use change. Largest mitigation option is partial forestry, which reduces emissions by ~30%. Farm-based mitigation appears to be relatively pessimistic in terms of cost and effectiveness. Although model is flexible, results are constrained by mitigation options included in analysis.
Additional notes on this report were as follows:
Model assumed that on-farm productivity and GHGs (output per ha) were constant across time.
This means that emissions intensities remained constant as well, while they declined in many
other studies. As a result, may overestimate the total GHG abatement because does not assume
any technological improvement absence of a GHG policy. However, animal numbers also
assumed to remain constant, which could underestimate total abatement if stocking rates
increase over time due to technological change. Thus, total impact on results are potentially
ambiguous (i.e., not sure whether there is an over or under estimate due to static productivity
and stocking rate assumption).
Profit losses are VERY high for scenarios where there are relatively high carbon prices. This is
because there does not appear to be any 'backstop' technology (practices) that farmers can
implement at this price level. Seems like forestry should win out over a 98% loss in dairy profits.

Dairy: low prices triggered changing feed inputs, using an output approach, OAD milking and
planting forestry; reduced fertilizer and stock rates at higher prices. Seems different than the
NZAGRC report. Why is there so much variation?
S&B: forestry, reducing stocking rates, then removing breeding cows.
Breeding cow removal more profitable, but capped at 5% of total area…claims already been
taken up and hence in baseline.
2030 and 2050 timeframe simulated by using LURNZ estimated land use maps. All else (e.g.,
stocking rate, productivity, and emissions intensity) held constant
Dairy profit significantly lower than NZAGRC analysis. On average, it should be higher than
$1,275/ha. This will make costs look much higher across the 2 reports
Forestry profit significantly higher than the NZAGRC analysis. This figure is closer to what I have
seen.
Low forest C sequestration rates driven by assumption that 'new' rates are equal to current
forest mean, which is relatively low as most of the radiata pine is close to maturity
Mitigation includes a mix of targets. E.g., Farm system change to achieve 5-20% in on farm
GHGs. Seems reasonable. 20% reduction is 'largest' target.
Dairy mitigation from DairyNZ; SNB mitigation from NZAGRC (2017) current mitigation report
(but not all of them). DairyNZ mitigation options tend to be less cost-effective than NZAGRC-
current. Suggest two groups get together and try to resolve differences or collectively explain
why they chose to take different assumptions about existing/current farming practices.
Industry-driven mitigation options: S&B 'do not consider reducing stocking rate with increase in
productivity' (potentially a profitable option>), which varies form NZAGRC report. Suggest
difference is explained or resolved by both groups.
Section 3 has some insight on barriers to uptake, including anecdotal evidence from DairyNZ and
S+B. Would like to see more reasoning behind the statements.
Data. Baseline figures in Tables 22-26 do not necessarily line up with Table 2 reference case.
Could suggest that not 100% calibrated to match tables in appendix (or a larger issue!)
Reduction in stock number costs are much higher than NZAGRC (which all had net benefits).
Probably a function of no assumed increase in productivity as a result of implementing
mitigation? This study also had almost twice as much reduction in GHGs too.
In theory, output-based mitigation should be the cheapest as are using a combination of options
to achieve a GHG reduction target.
Wide range of mitigation taken up for different GHG prices (Table 9), highlights strength of
model to account for multiple practices at once. Not sure why some do not change/increase
(e.g., dairy planting forestry) with carbon price
GHG1 and GHG2 have exact same mitigaiton area. Why? No practices become economically
feasible between these two price points?
Strength is that there are %iles of costs and benefits for SNB and Dairy. Not sure how that is
distributed across the landscape in NZFARM
N leaching and P loss highlights co-benefits to Dairy. There are also co-benefits to S&B, but for
some reason they have claimed that current data not good enough. Even using an average
figure for the whole country could be useful to understand relative magnitude
CGE model applies GHG price to horticulture, deer, and poultry, but not sure that NZFARM does
the same. Inconsistency, because no mitigation here? Why not use the same assumptions?

NZFARM passes GHG price and farm production to ESSAM to model economy-wide impacts, but
report did not include any results on change in farm output (just profits and GHGs)
ESSAM closure rules seem reasonable and are in-line with previous gov't analyses. #1 is
unnecessary though, as this analysis does not allow purchasing of international emissions units.
Results are driven mostly by large costs of most mitigation practices. If you input the costs from
NZAGRC, then impacts would likely be less…to some degree. Neither have options that reduce
dairy GHGs by more than 30%
Not sure why large loss in farm profits does not translate to same loss in farm 'output'
GDP/RGNDI impacts are relatively low. I assume this has to do with how GHG price revenue is
recycled in the economy. Thus, impacts to farmers may not be as high as NZFARM results
indicate (could get a tax rebate)
What proportion of land, on average would have to be forested for GHGs to be equal to zero?
This would likely be the maximum WTP farmers have to maintain S&B. Just have a hard time
seeing that landowners would be willing to accept 'negative' profit instead of converting their
land to something else.
Inputs to this report are most comparable with NZAGRC-current report. As noted above, the
results are different between the two reports for a number of reasons. Hard to compare this
study to other reports because of the narrow objective (on-farm mitigation only). Good to see
that exogenous GHG price pathways are similar in range to other analyses with endogenous
prices
NZAGRC – On-farm options to reduce agricultural GHG emissions in New Zealand
This NZARGC on-farm mitigation report provides an overview of currently available options to reduce
(mitigate) New Zealand’s biological GHG emissions. The vast majority of those emissions comes from
cattle and sheep. They investigated a wide range of mitigation options involving changes in farm
systems (including potential land use change), which were quantified for a set of model farms that
represent regional average dairy farms and various regional average sheep and beef systems. Off-farm
emissions embedded in supplementary feeds were also included in the analysis where relevant,
primarily for the dairy sector.
Environmental and economic outcomes were evaluated using the two farm-scale models: FARMAX and
OVERSEER®. The authors note correctly that two models differ somewhat in their assumptions regarding
the metabolisable energy content of key animal feeds and the feeding levels required to achieve given
levels of animal production. The combination of these two models, together with details of how farm
systems and mitigation scenarios are characterised in the models, requires careful interpretation of the
results. For example, the authors report that known issues in the OVERSEER® GHG calculations mean
that emissions for dairy systems are overestimated by about 15%. As a result, the implied carbon cost of
mitigation – measured as change in farm profit divided by change in GHG emissions – could be
underestimated by almost the same amount. However, these issues in GHG estimation do not affect the
relative efficacy of the different modelled mitigation options.
The analysis only considered the biophysical feasibility and environmental and economic consequences
at the farm level. The models did not consider changing risks as a result of climate or market variability
or limitations in farmer skills, or the diversity of actual farms within a region. In some cases, such issues
could constitute a significant barrier to implementation. At the same time, the mitigation options did

not explicitly attempt to optimise farms with regard to GHG emissions and profitability. Thus, combining
interventions and optimising farm systems could further reduce costs relative to the single interventions
that form the basis of this analysis.
The analysis did not model farmer behaviour in response to price or other policy signals. In addition,
national benefits or costs arising from widespread implementation of any mitigation action were not
modelled either, but the authors did provide commentary where such considerations were relevant.
A key limitation is that the interventions explored in the study are not necessarily additive. This is
because the modelling was on individual scenarios, not system optimisation. As a result, the total
mitigation potential cannot be estimated by taking the sum of individual mitigation options as some
interventions are strict alternatives (e.g. some interventions reduce stocking rates whereas others
increase them).
A schematic of how the models were linked is shown in Figure 6, while key findings of the assessment
are listed in Table 5.
Figure 6. NZAGRC – current mitigation report modelling approach
Table 5. Key findings of NZAGRC – current mitigation report assessment
Indicator NZAGRC – current mitigation
Report Status Final
Analysis Level Regional Farm Averages (~4 regions)
Analysis boundary Farm-gate
Analysis timeframe 2018
Method Bottom up, regional/industry averages, static
Models OVERSEER, FARMAX

Economic Indicators Farm Profitability (EBIT); $/tCO2e
Total GHG Reductions varies by practice
Average GHG Price (2020 to 2050) n/a
Livestock GHG price -$1175 to $1,029 (estimated as average change in profit/tCO2e relative to baseline practice )
Forest GHG price same as above
Other Land Use GHG Price same as above
Discount rate 5%, 8%
Dairy Profit ($/ha/yr) $1820-2303
S&B Profit ($/ha/yr) $118-344
Deer Profit ($/ha/yr) $515
Hort & Arable Profit ($/ha/yr) Vineyards: 5-10k; Pipfruit: 15-20k; Kiwifruit 15k+
Forestry Profit ($/ha/yr) $X to $280
Hort Potential (ha) up to 1,500,000 ha
Mitigation Approach Individual practices, not optimized systems
Mitigation: Dairy 6: reducing stocking rates, once-a-day milking, supplemental feed, N removal, summer crop removal, forestry
Mitigation: Sheep & Beef 4: forestry, reducing stocking rates, replacing breeding cows
Mitigation: Deer 3: reducing stocking rates, reducing N, forestry
Mitigation: Hort & Arable 1: efficient use of fertilisers and irrigation
Mitigation: Land Use Change 1.5 million ha from livestock to horticulture; marginal land in forestry
Forest Carbon Accounting ETS Look-up tables. 2 options: Safe (residual after harvest) and Full (stock at 28yrs); No 'credit' for harvested wood products
Farm Profit/Output Impacts varies by practice
Other Economic Impacts n/a
Co-benefits water quality
Notable Caveats Some profitable mitigation options require skill and/or technological change; lack of deer data; no guarantee farmers will uptake mitigation; OVERSEER overestimates GHGs by ~15%.
Strengths Quantifies cost and effectiveness for a wide range of practices; clearly presents assumptions; goes beyond dairy and sheep-beef enterprises
Limitations/Weaknesses Mitigation not additive; analysis stops at farm-gate; yes/no uptake (no partial); OVERSEER and FARMAX not hard linked
Additional notes on this report were as follows:
Study is most comparable to Landcare and NZAGRC-future. Would be interested to see how
Landcare study estimates differed if used figures from this report instead. As discussed above,
two groups should try and get together and explain or resolve differences in estimated cost and
effectiveness for similar mitigation practices. NZFARM is only model in this review capable of
incorporating range of mitigation practices and endogenously estimating uptake. However,
other models could incorporate similar exogenous assumptions following similar methodology
that was used to incorporate forest carbon sequestration and CH4 vaccine implementation.
Recognize that this study did not look at additive effect of implementing multiple practice at
same time. Would have liked to see the estimated impact of implementing mitigation bundles,
as was done in the NZAGRC-future report.

Farm averaging is typical. Could benefit from using more than 4 regional farms per stock type,
although not sure how wide distribution could look. For example, an updated analysis could use
the same farm regions as DairyNZ.
FARMAX - OVERSEER approach is typical for NZ farm system analysis. Noted issues suggest
modellers are well aware of limitations.
EBIT is typical measurement of on-farm profitability
Static/constant implied price of carbon. This makes sense as all other economic and productivity
indicators are constant too.
Ignored housing and/or stand-off pads and inhibitors for obvious reasons. See no issue with this
assumption.
Forest carbon accounting different than other studies. Hard to compare directly
Costs of $100-600/tCO2-e for converting dairy to forestry seem somewhat high, but believable
compared to other studies (which tend to afforest less profitable marginal land)
Another approach to carbon accounting could be to use a 'rental' rate approach. Would avoid
the issues associated with determining if permanent or not.
Reduced dairy stocking benefits look too good to be true for the average farmer. Arguably more
optimistic than other studies, although this is likely because the assumption about farmer
capability differs (e.g, average vs. in-principle or feasible practice). Which is more realistic in
terms of impact on productivity (increased, or constant per SU?)
OAD milking is equally profitable as Twice-a-day. Reasoning: reduced yields but reduced costs
too. Overly optimistic?
N Fertilizer removal - wide variation in costs, but 8-13% reduction in GHGs. Not truly 'organic'
though?
Forest profitability appears to be lower than other studies ($250/ha/yr). Hence, different results
from afforesting marginal land. This is reasonable as only looking at on-farm forestry and not
widespread afforestation.
Acknowledges afforestation would have an impact on rural labour supply/demand and flow on
economy. Does not elaborate further, but other reports do
A number of unquantified risks for removing breeding cows suggests estimates are overly-
optimistic
Reducing stocking rate and N fertilizer seems to have large benefits or be close to 'costless'.
Reasonable findings, as farmers perceive implementing this practice to be 'risky' event though
implementation is likely to have potential benefits.
NZAGRC – Future options to reduce biological GHG emissions on-farm: critical assumptions and
national-scale impact
This NZAGRC future mitigation report evaluates on-farm options that may be available in future (2030
and 2050) to reduce biological GHG emissions. The authors qualitatively expresses their confidence that
the various options would be technically available and the drivers and barriers to uptake of each option.
The report also quantifies how much each option might reduce GHG emissions below baseline
projections, taking into account both efficacy and potential adoption rates that account for potential
cost/benefit and other drivers and barriers. The authors also discuss possible packages of mitigation
practices, taking into account the extent to which the various options would be additive and mutually
consistent from a farm systems perspective. The quantitative assessment component used the NZ

national GHG inventory tool and baseline projections provided by MPI to 2030, which the researchers
extended to 2050.
The analysis only considered on-farm mitigation options within an existing land use. We did not include
mitigation options that rely on land-use change either between different livestock systems or away from
livestock entirely as that was outside the scope of this report. Based on these criteria, the report
evaluated 12 individual mitigation options ranging from administering a methane vaccine or inhibitor to
increased tree planting.
The assumptions about future efficacy and adoption rates of each mitigation option reflect the researchers’ collective judgement and were not based on detailed economic or other modelling. Some mitigation options were claimed to be well-proven and currently implemented, while others are the subject of active research and have not yet reached proof of concept. Given the inherent uncertainty in their assumptions, the authors provide high and low estimates for many of the options. For any option that is not commercially available at present, researchers assumed appropriate on-going research and development investment to bring these technologies to market, and that the necessary technological breakthroughs will be achieved. They caveat that the amount of investment needed for some practices to be adopted could be substantial. In addition, the authors note that some mitigation options could be very costly at farm level or have significant economic impacts if adopted nationally and affect New Zealand’s international trade position or environmental credentials, while other options could offer strong synergies with non-climate and marketing objectives.
A schematic of how the models were linked is shown in Figure 7.
Figure 7. NZAGRC – current mitigation report modelling approach report modelling approach
The structure of how results were presented in the analysis – most of which were qualitative – make it
difficult to summarize the key findings in the same manner as the other reports. Thus, I have only
included my key notes on this report:
Table 1 is great way to concisely summarize findings. Would be good to see in other reports.
Summary tables and figures with uncertainty are good way to summarize and illustrate key
findings.
Lots of information on many mitigation options. Would be good to see mitigation options
presented in similar way in other reports.
Mitigation percentages in Table 1 are initially confusing. This is for all biological emissions, not
the specific land use that it applies to. At quick glance, does not appear to be a lot of GHG
benefit to employing many of these practices, but it became clear once I realized that it applied
to all agriculture and not just the sector that the mitigation was applied to. Table could be
extended to include both total ag and specific land use emissions reductions.
Would be useful to ‘test’ some of these mitigation options in the economic models to see how
estimates may change for the same scenarios. Realize that would need to make further
assumptions about cost for some of the options, but could still explore impact using sensitivity
analysis.
Could add further insight in Table 1 by potentially translating the cost-benefit and market
colours into $/tCO2e or change in farm profit/output. There must be some logic behind how the
colours were divided up across the different options (e.g., confidence, risk rating).
Includes a number of individual mitigation options as well as packages that have a suite of
practices. The latter is an improvement over the NZAGRC current case as it’s likely that
landowners would implement more than one option.
Well caveated. Acknowledges that some of the technologies and assumptions are overly
optimistic today and thus there is uncertainty.
States that constant animal numbers but increasing performance results in a reduction of
emissions intensity but could result in a rise in absolute GHG emissions if there is no constraint
on total production or emissions. Note that other studies have both emissions intensities and
total emissions reducing over time. This is potentially because the other studies include
constraint on output increases. The difference could also be likely in how each study defines
‘intensity’ (e.g. GHGs per animal vs. per ha vs. per commodity production). For example, CGE
models do not explicitly track animal numbers or physical output (e.g., kg milksolids), but they
do specify exogenous improvements in GHG efficiency over time as per $ output.
Some methane figures are in $/tCO2e while others are in $/stock. Need more insight on how to
scale estimates so that they can be compared across options.
Forest carbon sequestration uses averages from MfE look up table and then spreads that rate
across several harvest cycles. Slightly different approach than the other PE and CGE modelling
report, but average of 12tCO2e/ha/yr is within the range of most studies.
Mentions additional carbon stored in harvested wood products. Could explore this more in this
report and others as it could increase the annual estimate from forests.
Difficult to compare report to other studies because of unique objective (future mitigation
potential). It also lacks explicit cost estimates for several of the practices (although I do
appreciate the qualitative cost-benefit indicator in Table 1). Range of abatement of 12-24%
below 1990
Vivid – Modelling the transition to a lower net emissions New Zealand: Interim results
The Vivid Modelling the Transition to Lower Net Emissions Report modelling report was requested by
the Productivity Commission to identify actions NZ might take to reduce its GHG emissions. The
modelling approach sought to set out the impacts of decision making under uncertainty by considering
how different decisions or scenarios have varying impacts on economic activities and GHGs. Two partial
equilibrium models were employed in the analysis. Concept Consulting’s energy and industry model
(ENZ), and Motu Economic and Policy Research’s Land Sector in Rural New Zealand (LURNZ) model

The analysis follows three techno-policy pathways that comprise different technological developments
and matching policy and investment strategies that may be utilised by the NZ government and private
actors to reduce GHGs: (a) Policy Driven Decarbonisation; (b) Disruptive Decarbonisation; and (c)
Techno-optimist. The report provides an assessment of these pathways under different emissions
reductions targets but does not yet explore how strategies perform across uncertain future states of the
world. The results seek to provide insights on the potential impacts of adopting different domestic
emissions reductions targets – and sectors, including land use, that could be used to achieve these
targets – to 2050. Initial findings suggest that New Zealand is likely to be able to decarbonise its
economy at a cost comparable to that expected in the rest of the developed world. Estimates suggest
NZ could move to a pathway consistent with net zero in the second half of the century at a 2050
emissions price of between $75/tCO2e and $150/tCO2e; and reach a more stringent net zero emissions
constraint by mid-century with a 2050 emissions price of between $150/tCO2e to $250/tCO2e. These
estimates were found to be lower than, or within the range of, emissions prices that are likely to be
needed internationally to deliver the objectives of the Paris Agreement.
With respect to the land use sector, the analysis found that the expansion of forestry is central to the
achievement of large reductions of emissions. The authors note, however, that the expansion of forest
sinks cannot continue indefinitely, but this is not a reason for immediate concern, with technological
developments likely to provide the potential for further cost-effective mitigation from non-forestry
activities after 2050, which is a reasonable caveat. In all three pathways, emissions reductions in the
agricultural sector are delivered through a mix of technological and structural change that primarily lead
to emissions intensity improvements.
A schematic of how the models were linked is shown in Figure 8, while key findings of the assessment are listed in
Table 6.

Figure 8. Vivid – Transition to Lower Net Emissions report modelling approach
Table 6. Key findings of Vivid – Transition to Lower Net Emissions report assessment
Indicator Vivid – Transition to Lower Net Emissions
Report Status Final
Analysis Level National
Analysis boundary Land use and energy sectors
Analysis timeframe 2015 to 2050
Method bottom-up land use data, top down scenario analysis, dynamic PE models
Models LURNZ, ENZ
Economic Indicators $/tCO2e; farm output
Total GHG Reductions Net emissions of 25 and 0 MtCO2e by 2050
Average GHG Price (2020 to 2050) $40 to $110/tCO2e
Livestock GHG price range $25 to $250/tCO2e
Forest GHG price range $25 to $250/tCO2e
Other Land Use GHG price range $25 to $250/tCO2e
Discount rate n/a
Dairy Profit ($/ha/yr) n/a
S&B Profit ($/ha/yr) n/a
Deer Profit ($/ha/yr) n/a
Hort & Arable Profit ($/ha/yr) n/a
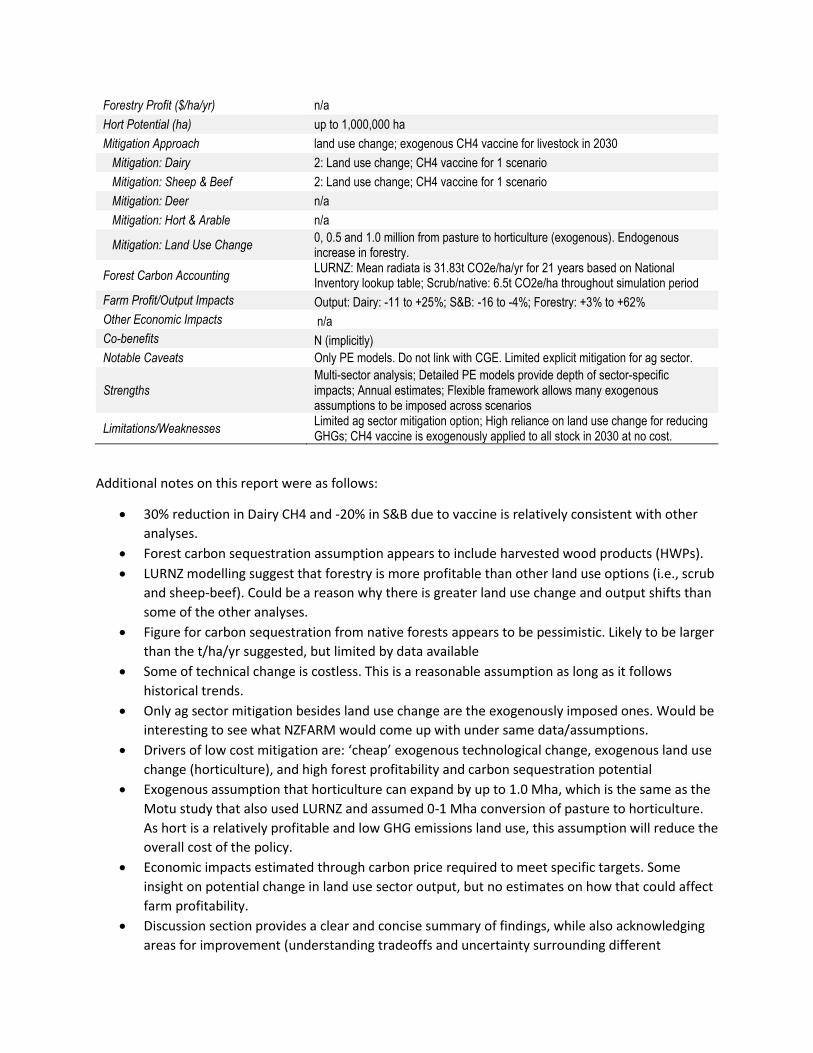
Forestry Profit ($/ha/yr) n/a
Hort Potential (ha) up to 1,000,000 ha
Mitigation Approach land use change; exogenous CH4 vaccine for livestock in 2030
Mitigation: Dairy 2: Land use change; CH4 vaccine for 1 scenario
Mitigation: Sheep & Beef 2: Land use change; CH4 vaccine for 1 scenario
Mitigation: Deer n/a
Mitigation: Hort & Arable n/a
Mitigation: Land Use Change 0, 0.5 and 1.0 million from pasture to horticulture (exogenous). Endogenous increase in forestry.
Forest Carbon Accounting LURNZ: Mean radiata is 31.83t CO2e/ha/yr for 21 years based on National Inventory lookup table; Scrub/native: 6.5t CO2e/ha throughout simulation period
Farm Profit/Output Impacts Output: Dairy: -11 to +25%; S&B: -16 to -4%; Forestry: +3% to +62%
Other Economic Impacts n/a
Co-benefits N (implicitly)
Notable Caveats Only PE models. Do not link with CGE. Limited explicit mitigation for ag sector.
Strengths Multi-sector analysis; Detailed PE models provide depth of sector-specific impacts; Annual estimates; Flexible framework allows many exogenous assumptions to be imposed across scenarios
Limitations/Weaknesses Limited ag sector mitigation option; High reliance on land use change for reducing GHGs; CH4 vaccine is exogenously applied to all stock in 2030 at no cost.
Additional notes on this report were as follows:
30% reduction in Dairy CH4 and -20% in S&B due to vaccine is relatively consistent with other
analyses.
Forest carbon sequestration assumption appears to include harvested wood products (HWPs).
LURNZ modelling suggest that forestry is more profitable than other land use options (i.e., scrub
and sheep-beef). Could be a reason why there is greater land use change and output shifts than
some of the other analyses.
Figure for carbon sequestration from native forests appears to be pessimistic. Likely to be larger
than the t/ha/yr suggested, but limited by data available
Some of technical change is costless. This is a reasonable assumption as long as it follows
historical trends.
Only ag sector mitigation besides land use change are the exogenously imposed ones. Would be
interesting to see what NZFARM would come up with under same data/assumptions.
Drivers of low cost mitigation are: ‘cheap’ exogenous technological change, exogenous land use
change (horticulture), and high forest profitability and carbon sequestration potential
Exogenous assumption that horticulture can expand by up to 1.0 Mha, which is the same as the
Motu study that also used LURNZ and assumed 0-1 Mha conversion of pasture to horticulture.
As hort is a relatively profitable and low GHG emissions land use, this assumption will reduce the
overall cost of the policy.
Economic impacts estimated through carbon price required to meet specific targets. Some
insight on potential change in land use sector output, but no estimates on how that could affect
farm profitability.
Discussion section provides a clear and concise summary of findings, while also acknowledging
areas for improvement (understanding tradeoffs and uncertainty surrounding different

pathways). Agree that these should be explored further, although I think it would not
necessarily produce a wider range of results.
Analysis had a relatively wide range of estimates due to different assumptions across scenarios.
Higher cost scenarios explained primarily by (a) more stringent reduction target and (b) reduced
sources of land-based mitigation.
Study is most comparable with the Motu report as both used LURNZ to estimate land use
impacts. Similar assumptions include: forest carbon accounting, endogenous afforestation,
exogenous horticulture expansion, exogenous CH4 vaccine available in 2030. The ‘disruptive’
scenario in the Vivid study is most comparable to the Motu report in terms of model
assumptions and thus produced very similar results in terms of GHG abatement, carbon
sequestration, and GHG prices. Cannot look at direct impact of including CH4 vaccine as that
was only included in techno-optimist scenario, which changed a number of assumptions
compared to other two pathways.
NZIER – Economic impact analysis of 2050 emissions targets: A dynamic Computable General
Equilibrium
NZIER’s analysis focused on exploring the economic impacts of New Zealand adopting different
greenhouse gas emissions targets in 2050. To do so, they use a dynamic Monash-New Zealand-Green
(MNZG) CGE model of the New Zealand economy, split into 111 industries, to investigate a range of
potential scenarios and 2050 targets. The report examines how the economy changes in response to the
imposition of various emissions targets – and hence carbon prices – under a range of scenarios that
consider innovation in energy, transport and agriculture, along with increased rates of net sequestration
from forestry.
The modelled scenarios (outlined overleaf in Table 1) were developed with officials, drawing on Vivid,
Motu and Concept (i.e., the Vivid report). We analysis did not assess the likelihood of the various
assumptions underpinning these innovation scenarios occurring. For example, the authors are explicit
that the model cannot predict if or when a methane vaccine might be introduced to New Zealand, but it
can estimate how the economy and its emissions profile would likely adjust in response to such an
introduction.
The scenarios described below are assessed against a range of potential emissions targets, which reflect
different levels of ambition: (a) 100% reduction on 1990 gross levels by 2050, or ‘zero net emissions’; (b)
75% reduction on 1990 gross levels by 2050; and (c) Existing target of 50% reduction on 1990 gross
levels by 2050. These targets use the ‘gross-net’ methodology to estimate reductions from a 1990
starting point of 64.6Mt CO2-e. The analysis then included a set of three core scenarios (ag, energy, and
wide innovation) and additional sensitivity analysis to estimate a range of GHG prices required to meet
the three targets and the resulting economic impacts.
Note that the CGE model could not track forest carbon. As a result, the analysis used a method that
subtracted an assumed level of forest carbon sequestration at various points in time for each scenario to
estimate the maximum permissible gross emissions in 2050 after having accounted for the effects of
forestry in meeting each target.

Model estimates revealed GHG prices significantly higher than many of the other reports included in this
review. Potential reasons for why that may be the case are discussed in the notes below. The authors do
caution that because there were estimated to be very high carbon prices in some scenarios, it is difficult
to be confident in how firms and households will respond, and the implied changes in relative prices are
well beyond the range over which our model has been calibrated.
A schematic of how the models were linked is shown in Figure 9, while key findings of the assessment
are listed in Table 7.
Figure 9. NZIER – Econ impacts 2050 GHG targets report modelling approach
Table 7. Key findings of NZIER – Econ impacts 2050 GHG targets report assessment
Indicator NZIER - Econ impacts 2050 GHG targets
Report Status Final
Analysis Level National
Analysis boundary Land use and energy sectors
Analysis timeframe 2017 to 2050
Method top down scenario analysis, dynamic CGE
Models CGE - Monash-New Zealand-Green (MNZG)
Economic Indicators $/tCO2e, GDP, RGNDI, Sectoral GDP
Total GHG Reductions 50, 75, and 100% below 1990 emissions of 64.6 MtCO2e (all sectors)
Average GHG Price (2020 to 2050) $386 to 605/tCO2e for ag-only scenarios. $109 to $272 for economy-wide reduction scenarios (i.e., 'Wide')
Livestock GHG price $386 to 605/tCO2e for ag-only scenarios. $109 to $272 for economy-wide reduction scenarios
Forest GHG price n/a (exogenous land use change based on Vivid report)
Other Land Use GHG Price $386 to 605/tCO2e for ag-only scenarios. $109 to $272 for economy-wide reduction scenarios
Discount rate n/a

Dairy Profit ($/ha/yr) n/a
S&B Profit ($/ha/yr) n/a
Deer Profit ($/ha/yr) n/a
Hort & Arable Profit ($/ha/yr) n/a
Forestry Profit ($/ha/yr) n/a
Hort Potential (ha) Uncertain. Scenario overview simply states 'expansion of horticulture'
Mitigation Approach generic abatement via labor and capital switching; exogenous CH4 vaccine for livestock in 2030
Mitigation: Dairy CH4 vaccine, lower global dairy demand
Mitigation: Sheep & Beef CH4 vaccine, lower global meat demand
Mitigation: Deer n/a
Mitigation: Hort & Arable n/a
Mitigation: Land Use Change expansion of horticulture and forestry
Forest Carbon Accounting loosely based on Vivid report (derived from LURNZ)
Farm Profit/Output Impacts 2050 Ag GDP impacts relative to baseline. Dairy: -23%; S&B: -27%; Horticulture: -19%
Other Economic Impacts 2050 GDP: 4-21% decline; RGNDI 4-17%
Co-benefits n/a
Notable Caveats Heavily caveated, even in the executive summary. Do not predict breakthrough technologies that reduce emissions at very low cost. Thus, results will over-estimate costs of transition to a low GHG economy
Strengths
Economy-wide model accounts for changes in all major sectors of NZ. Scenarios highlight 'benefit' of including land use sector in reduction policy. Doing so can reduce costs by 50% or more relative to energy/industry only case (also assuming no int'l trading).
Limitations/Weaknesses
Do not estimate costs of various innovations or determine who bears costs/impacts. Exogenous emission intensity and technological change small compared to other studies. Lack of explicit ag sector mitigation beyond exogenous CH4 vaccine and forest carbon sequestration
Additional notes on this report were as follows:
Very high GHG prices compared to other analyses. Even 'status' quo of 50% reduction by 2050
has a price of $227/tCO2e. Possible reasons include: low technological change and limited
mitigation potential (e.g., generic labour and capital substitution; CH4 vaccine in 2030). Study
does note that economic costs of meeting any given reduction target can be reduced
significantly by greater afforestation.
The GHG price estimates from NZIER are generally higher than the other CGE-based study in this
review (Westpac). I believe that this is because Westpac assumes that ag GHG emissions
intensity (measured as GHG per unit output) improves at a rate of 1.5%/yr while NZIER appears
to assume about half that rate. From what I can tell in the Westpac NZ report, this is a relatively
costless assumption (more below). Westpac also assumes that 20% of abatement can be met
from purchasing international credits. Comparing the NZIER 50% reduction study with high
afforestation rates, which is most similar to scenarios in the Westpac study, yields similar GHG
prices ($100/tCO2e).

$300 to 400/tCO2e by 2030 before CH4 vaccine is very high. Not unheard of though with CGE
models with limited mitigation and no int'l trading. See Landcare and Infometrics 2015 MfE
reports for NZ’s INDC with $300/tCO2e figures.
30% reduction in livestock CH4 due to vaccine is relatively consistent with other analyses
Up to 40 (50?) MtCO2e of net sequestration from forestry
No endogenous technical change is typical for many CGE models.
Unable to estimate response of forestry to higher carbon prices, thus make exogenous
assumptions about change in sector.
Kinked response to mitigation at time when CH4 vaccine is introduced. Consistent with other
models.
Shift in global preferences for emissions intensive agricultural commodities also affects sector
output
More sectors = lower cost to achieve target. Economically consistent.
Ag and Wide innovation results are driven strongly by forest sequestration
50Mt scenario sees a 40 Mt increase in forest carbon, requires 140% increase in forestry area
Model is very sensitive to exogenous forest carbon sequestration assumptions. Move from 35Mt
to 40, price declines rom $243/t to $131/t. On contrary, go from 50 to 40Mt, and price increases
from $272 to 569/t
Agree with all comments when comparing to the high carbon prices in their analysis to Vivid
report (p.26). Vivid used highly detailed energy and land use model which provides a lot of
insight into specific sectors, but cannot estimate national level economy-wide impacts; NZIER’s
model has more constraints such as household budgets, government spending, labour and
capital, etc, which will tend to increase prices relative to PE models; Different assumptions
about how much dairy sector could grow in baseline (Vivid has no new dairy after 2025),
thereby making it more expensive to mitigate that sector in NZIER.
Higher carbon prices --> greater declines in industry GDP than other models (-20 to 25% by
2050)
Notable increases in forest sector output (100+ %) due to increased land use. Calculations are
done outside of model, which is fine.
Horticulture impacts are more negative than other models. Does not explicitly account for land
use change or mitigation. Odd finding considering it claimed that 'horticulture expansion' was a
component of the ag mitigation (and 'wide') scenarios.
Westpac –NZ Climate Change Impact Report
The Westpac NZ analysis modelled the transitionary impacts of climate change under different ‘two-
degree aligned’ scenarios. In addition, it conducted a literature review to develop an assessment of
potential physical risks posed to different economic sectors under a range of climate scenarios. The
report aimed to provide long-term insights to inform Westpac NZ of the impact of climate change from a
transition to a two-degree future and from the physical changes expected as climate change eventuates.
Two types of climate change implications were referenced in this report: (a) Transition implications:
reflecting the risks and opportunities associated with changes in the economy, including growth
impacts, sector re-weighting, and other macro-economic factors, and (b) Physical implications: reflecting

the changes in the physical climate (e.g. altered rainfall amounts, intensities and timing) that may
impact future business activities.
The report modelled and analysed two scenarios that were deemed to be consistent with achieving a
‘two-degree future’. Each scenario represented key economic, policy, and technology factors. The
central scenario modelled earlier and smoother phased action to tackle climate change, whilst the shock
scenario modelled delays in action for over a decade followed by a shock event which drove more rapid
action to meet NZ’s targets. Quantitative impacts were estimated using the ViEW recursive dynamic CGE
model run by Vivid Economics and analysed by EY.
A schematic of how the inputs, key assumptions, and models were linked is shown in Figure 10, while key findings of the assessment are listed in
Table 8 .
Figure 10. Westpac - CC Impact report modelling approach
Table 8. Key findings of Westpac - CC Impact report assessment
Indicator Westpac - CC Impact
Report Status Final
Analysis Level National
Analysis boundary Economy-wide
Analysis timeframe 2015 to 2050
Method top down scenario anlaysis, recursive dynamic
Models ViEW CGE model
Economic Indicators $/tCO2e, GDP
Total GHG Reductions 50 to 60% below 2015 net emissions (50MtCO2e) by 2050
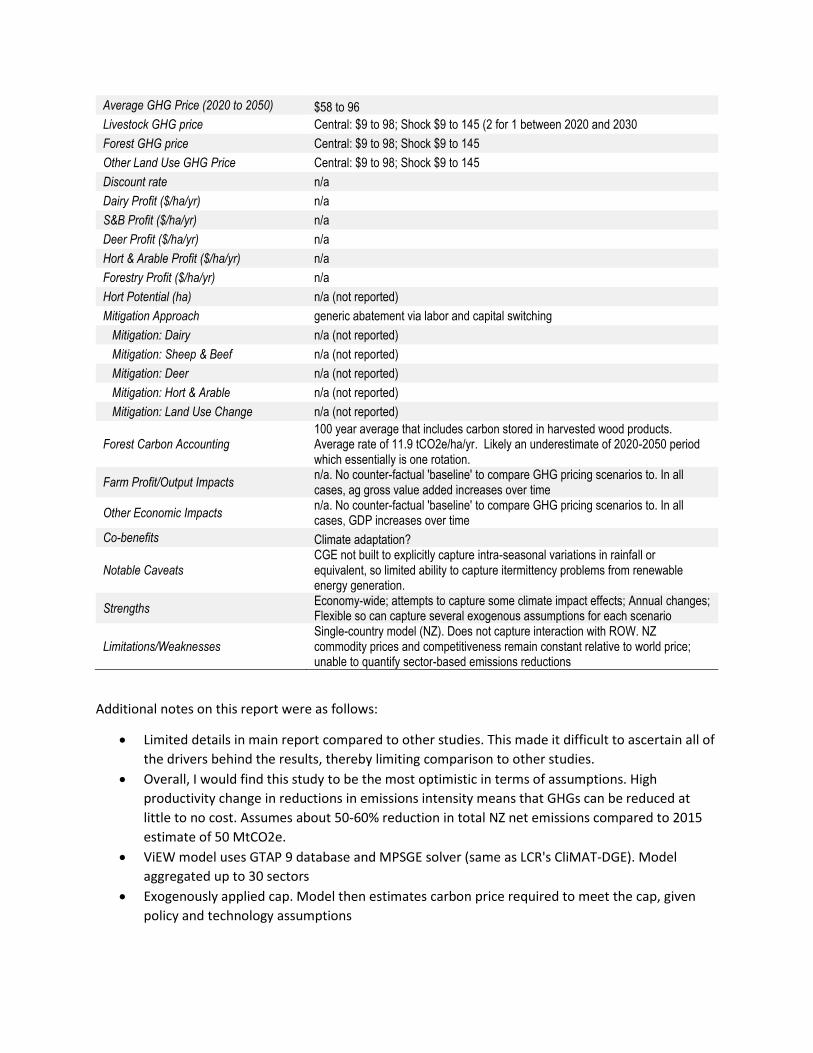
Average GHG Price (2020 to 2050) $58 to 96
Livestock GHG price Central: $9 to 98; Shock $9 to 145 (2 for 1 between 2020 and 2030
Forest GHG price Central: $9 to 98; Shock $9 to 145
Other Land Use GHG Price Central: $9 to 98; Shock $9 to 145
Discount rate n/a
Dairy Profit ($/ha/yr) n/a
S&B Profit ($/ha/yr) n/a
Deer Profit ($/ha/yr) n/a
Hort & Arable Profit ($/ha/yr) n/a
Forestry Profit ($/ha/yr) n/a
Hort Potential (ha) n/a (not reported)
Mitigation Approach generic abatement via labor and capital switching
Mitigation: Dairy n/a (not reported)
Mitigation: Sheep & Beef n/a (not reported)
Mitigation: Deer n/a (not reported)
Mitigation: Hort & Arable n/a (not reported)
Mitigation: Land Use Change n/a (not reported)
Forest Carbon Accounting 100 year average that includes carbon stored in harvested wood products. Average rate of 11.9 tCO2e/ha/yr. Likely an underestimate of 2020-2050 period which essentially is one rotation.
Farm Profit/Output Impacts n/a. No counter-factual 'baseline' to compare GHG pricing scenarios to. In all cases, ag gross value added increases over time
Other Economic Impacts n/a. No counter-factual 'baseline' to compare GHG pricing scenarios to. In all cases, GDP increases over time
Co-benefits Climate adaptation?
Notable Caveats CGE not built to explicitly capture intra-seasonal variations in rainfall or equivalent, so limited ability to capture itermittency problems from renewable energy generation.
Strengths Economy-wide; attempts to capture some climate impact effects; Annual changes; Flexible so can capture several exogenous assumptions for each scenario
Limitations/Weaknesses Single-country model (NZ). Does not capture interaction with ROW. NZ commodity prices and competitiveness remain constant relative to world price; unable to quantify sector-based emissions reductions
Additional notes on this report were as follows:
Limited details in main report compared to other studies. This made it difficult to ascertain all of
the drivers behind the results, thereby limiting comparison to other studies.
Overall, I would find this study to be the most optimistic in terms of assumptions. High
productivity change in reductions in emissions intensity means that GHGs can be reduced at
little to no cost. Assumes about 50-60% reduction in total NZ net emissions compared to 2015
estimate of 50 MtCO2e.
ViEW model uses GTAP 9 database and MPSGE solver (same as LCR's CliMAT-DGE). Model
aggregated up to 30 sectors
Exogenously applied cap. Model then estimates carbon price required to meet the cap, given
policy and technology assumptions

Assumptions are all reasonable for single-country model. Assuming that all other countries have
similar policies, not a huge issue. But, could affect relative competitiveness in sectors where NZ
has higher/lower emissions intensities relative to other places
2 for 1 for ag 2020 to 2030. Targets appear lower than other CGE studies
Very optimistic in terms of land productivity and Ag GHG intensity improvements (1-1.5%/yr).
Also suggests a 1.5% decline per annum in autonomous GHG Intensity (not sure if typo or
double counting of ag intensity improvements). This is a key difference between Westpac and
NZIER analysis, which makes Westpac cost of abatement significantly cheaper.
Generic ag tech improvements not attributed to any particular product. This is an okay
approach, but should be aligned with findings from a more detailed study (i.e., NZIER) to
properly compare/contrast
Emission reduction targets/levels not as large as some of the other studies. Not necessarily an
apples-to-apples comparison
International trading and land use change an option, but not sure how much because not
explicitly stated anywhere. Says that up to '20%' of target can be met by int'l trading, but not
sure if that target was met or not. This will also make it cheaper to reach an abatement target
relative to NZIER study
Study does not have a traditional 'baseline' or counter-factual to compare climate mitigation
policy estimates to. Just a central GHG reduction and a 'shock' scenario that both include GHG
pricing. Makes it difficult to estimate how much abatement actually has to be achieved (i.e., are
2050 baseline emissions much higher than 2015?)
Claims to have 'endogenous' land use change in the model, but no results to highlight this
assumption. Thus, unable to determine how much land area could change into forestry and
other uses, thereby making it difficult to compare with the studies with explicit land use change.
Additional Figures for Study Comparison
The final component of this comprehensive review is to compare some of the key inputs and findings
across the various studies. Most of these aspects are discussed above in the individual modelling report
sections. However, it is worth summarizing a few of these aspects again, but in a way that they can be
compared across all analyses.
First, the reports included a wide mix of mitigation practices, as well as assumptions about their relative
cost-effectiveness (Table 9). For example, the NZAGRC and Landcare reports both included several
mitigation options for dairy and sheep & beef enterprises, but the cost and effectiveness for each option
were not necessarily consistent. Second, many of the other analyses included an emerging technology
such as methane vaccine and/or expanded horticultural land (often exogenously) as a viable mitigation
option, even if it is not necessarily available or prevalent today. As a result of the wide variation in
assumptions about mitigation practices, cost, and effectiveness, it is difficult to directly compare the
estimates across all seven studies in this review. However, Table 9 does note how some studies could be
more comparable than others, at least in terms of understanding how specific mitigation practices could
play a role in reducing agricultural GHG emissions or increasing forest carbon sinks.
Table 9. Mitigation practices included in each report

Mitigation Practice NZAGRC -
Current Mitigation
Landcare - Farm Level
GHG Mitigation
Motu - Land Use Change
Vivid - Net Zero 2050
NZIER - Econ
impacts 2050 GHG
targets
Westpac - CC Impact
Report
NZAGRC - Future
Mitigation*
Dairy
reduce stocking rates X X X
once-a-day milking X X X
supplemental feed X X X
reduce fertilizer X X X
summer crop removal X
forestry X X X X X
output (farm system) based X
methane vaccine X X X X
expand horticulture X X
Sheep & Beef
forestry X X X X X
reduce stocking rates X X X
replace breeding cows X X X
reduce N X X
expand horticulture X X X
methane vaccine X X X X
Hort & Arable
efficient use of fert and irrigation X X
Land Use Change
Afforestation within current land X X
Pasture to Horticulture X X X
Full afforestation X X X X X
* Only accounting for mitigation included in at least one other study
Second, the GHG price assumptions/estimates were relatively consistent across studies. Comparing GHG
prices across studies revealed that, on average, the studies estimated or used relatively consistent GHG
prices (with the upper bound of NZIER again being the outlier). Furthermore, most of the studies had
prices within the range of estimates from international assessments of requirements to achieve the 2
degree C target set forth under the Paris Agreement (Figure 11). This suggests that although each study
had its own set of objectives, models, and assumptions, it is likely that NZ will require a policy that
establishes a GHG price of at least $50-100/tCO2e in 2030 and $100-200/tCO2e in order to achieve its
emission reduction targets, especially if it intends to focus on domestic-level abatement of biological
emissions.

Figure 11. Range of GHG prices ($/tCO2e) for partial and general equilibrium studies.
Third, the agricultural GHG mitigation and forest carbon sequestration varied significantly across studies.
Comparing GHG mitigation across studies revealed that there was greater variation in abatement than
GHG prices (Figure 12). This variation was largely driven by the assumptions about uptake of CH4
mitigation and forest carbon sequestration. Note that the NZIER and Westpac studies both assumed
that the level of forest carbon sequestration update was exogenous (as their CGE models could not
account for this endogenously). In addition, some of the farm-level and PE studies did not include forest
carbon sequestration as an explicit mitigation practice (rather, it was incorporated into an on-farm
option). In addition, NZIER did not report agricultural GHG mitigation.
$0
$100
$200
$300
$400
$500
$600
$700
Lan
dca
re
Mo
tu
Viv
id
NZI
ER
Wes
tpac
Ave
rage
Par
is A
gre
e
Lan
dca
re
Mo
tu
Viv
id
NZI
ER
Wes
tpac
Ave
rage
Par
is A
gre
e
Lan
dca
re
Mo
tu
Viv
id
NZI
ER
Wes
tpac
Ave
rage
Par
is A
gre
e
2020 . 2030 . 2050
GHG Price Ranges ($/tCO2e)

Figure 12. Range of 2050 agricultural GHG abatement and additional forest carbon sequestration (MtCO2e) relative to business
as usual projections reported in studies6.
6 NZAGRC-current study only modelled individual mitigation practices that were not additive. NZIER did not report agricultural GHG abatement. Landcare did not include full afforestation as a mitigation option.
0
10
20
30
40
50
60
Lan
dca
re
Mo
tu
Viv
id
NZI
ER
Wes
tpac
NZA
GR
C -
fu
ture
Ave
rage
Lan
dca
re
Mo
tu
Viv
id
NZI
ER
Wes
tpac
NZA
GR
C -
fu
ture
Ave
rage
Ag GHG Mitigation . Forest C Sequest
MtC
O2
e/yr
2050 GHG Mitigation Ranges Relative to BAU (MtCO2e/yr)
Recommended