Reversible Liquid Carriers for an integrated Production, Storage and Delivery of
HydrogenBernie Toseland and Alan Cooper
Air Products and Chemicals, Inc.
May 21, 2009
# pd_38_toseland
This presentation does not contain any proprietary, confidential, or otherwise restricted information

2
Overview
• Start: Date 8/2005• Team Kickoff 10/2008• Project end March 2011• 49% Complete
• Barriers addressedE. Solid and Liquid Carrier TransportA. Hydrogen/Carrier and Infrastructure
Options AnalysisF. Hydrogen Delivery Infrastructure Cost
• Total project $4,131,138– DOE share (75%)
– Contractor share (25%)
• Funding received in FY08: $1,971,670
• Funding for FY09
Timeline
Budget
Barriers
• Pacific Northwest National Laboratory/Battelle
• United Technologies Research Center (UTRC)
• BMW Group
Partners
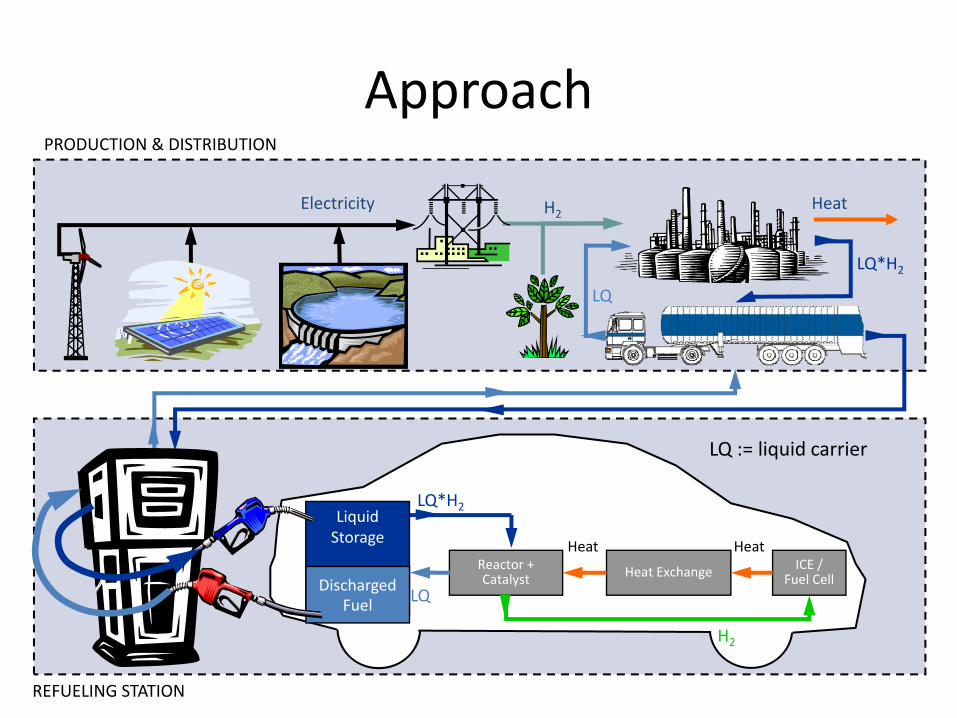
Approach
REFUELING STATION
ICE /Fuel CellHeat ExchangeReactor +
Catalyst
LiquidStorage
LQ*H2
PRODUCTION & DISTRIBUTION
DischargedFuel
Heat
Heat
Heat
LQ := liquid carrier
LQ
LQ*H2
LQ
H2
Electricity H2
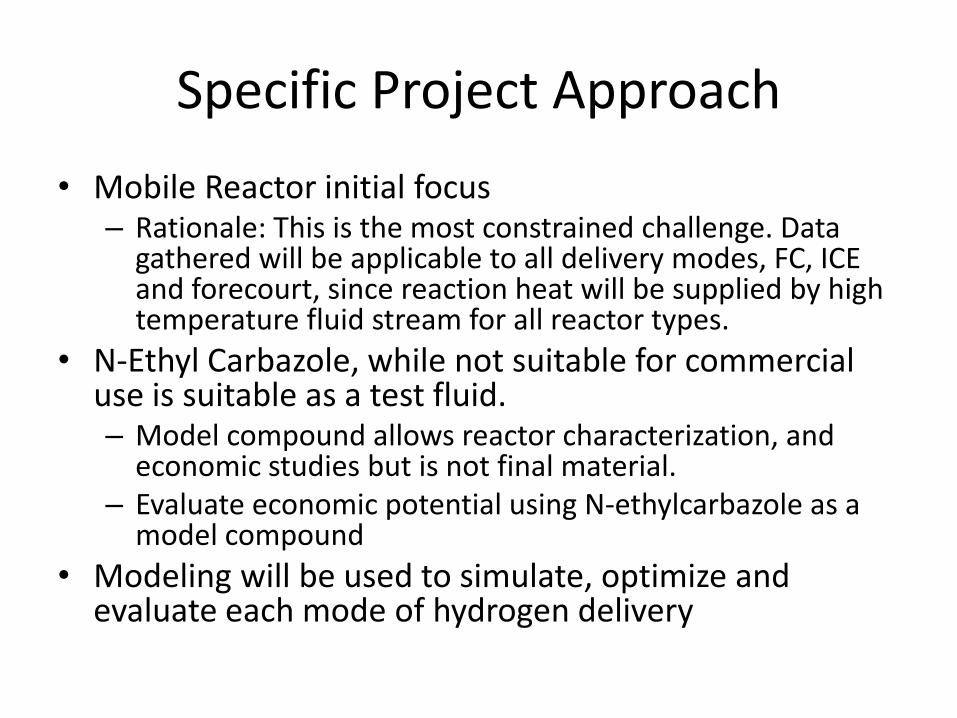
Specific Project Approach
• Mobile Reactor initial focus– Rationale: This is the most constrained challenge. Data gathered will be applicable to all delivery modes, FC, ICE and forecourt, since reaction heat will be supplied by high temperature fluid stream for all reactor types.
• N‐Ethyl Carbazole, while not suitable for commercial use is suitable as a test fluid.– Model compound allows reactor characterization, and economic studies but is not final material.
– Evaluate economic potential using N‐ethylcarbazole as a model compound
• Modeling will be used to simulate, optimize and evaluate each mode of hydrogen delivery

Collaboration• BMW
– Model integration of ICE and automobile– Testing prototypes
• Evaluate performance• Provide operational parameters
• UTRC– Model integration of FC and reactor.
• Forecourt• Automobile
• PNNL– Design of microreactors– Fabrication of prototype(s)
• AP– Testing of single microchannel reactors and packing for forecourt reactors– Providing materials– Testing prototypes (ICE)– Project Coordination

6
Technical Accomplishments
Microchannel Reactor Results
Single-tube microchannel reactors performed well– Stable catalyst coating method was established.– Reactor diameters from 2.55-0.5mm were demonstrated. (5 mm for
particles) – Single-pass conversions as high as 90% achieved.– Temperatures from 190-2500C were achieved.
Catalyst Feed Rate H2 Flow Conversion(ml/min.) (sccm) (% available H2)
Pt 0.1 52 800.4 193 741 421 65
Pd 0.1 23 350.4 50 201 75 12
Pd (particles) 0.1 59 911 458 71
Typical Results 2500C

Technical Accomplishments
Efficiencies of Microchannel ReactorsPd Catalyst microchannel Reactor shows low catalyst efficiency and little effect of reactor length.
Pt Catalyst microchannel Reactor shows low catalyst efficiency and little effect of reactor length.
0
50
100
150
200
250
300
350
400
450
220 230 240 250 260
Hyd
roge
n Fl
ow, s
ccm
Temperature, 0C
Expt. 15 mg Pt
Sim. 0.195 mg Pt
Expt. 7.5 mg Pt
Sim. 0.0975 mg Pt
Catalyst efficiency is 1.3% for both cases
05
101520253035404550556065
0 0.1 0.2 0.3 0.4 0.5 0.6 0.7 0.8
Hyd
roge
n Fl
ow, s
ccm
Catalyst , Mg. Pd
Rate Calculated using Pd KineticsMeasured Rate ‐4 mg PdMeasure Rated ‐2 mg Pd
MeasuredRate4 mg. Pd
Measured rate2 mg. PdEfficiency‐ 15%
Efficiency =11%Calculated by comparingactual catalyst amountto that calculated from kinetics
What is Primary cause of low efficiency?

Technical Accomplishments
Kinetics Modeling• Dehydrogenation modeled
adequately as three reactions in series.
• Batch experiments using slurry catalyst (small particles to eliminate mass transfer resistances) used for primary data.
• Activity of other catalyst forms done on the basis of the weight of the metal. (We expect some reduced efficiency when used in a thin film (typically 50% reduction based on APCI monolith experience))
• Kinetic expressions used in process models and to evaluate reactor performance or strategy. E.g., for Pd takes 40% more metal to go from 90 to 95 % conversion. 0
20
40
60
80
100
0 0.005 0.01 0.015 0.02
Con
vers
ion,
%
.
Pd vs. Pt 2500C and 0.25 ml/min.
Pd Catalyst
Pt catalyst
Weight of Metal, gms.
225
230
235
240
245
250
255
0200400600800100012001400160018002000
0 100 200 300 400
Tempe
rature (C
)
H2flo
w (sccm)
Time (min)
Fit
Data
Temp
Typical Fit to Slurry Data

Technical Accomplishment
CFD analysis of microchannel reactor flowRe-analysis of tubular flow pattern in microchannel
CFD Analysis of Liquid Distribution in Annular Microchannel Reactor
Region shown where liquid volume fraction
1
N‐ethylcarbazole conc. max = 0.01
Conclusion: Extremely low amount of liquid at Catalyst Surface limits catalyst efficiency
Profile of liquid along a line 5 μm away from the Catalyst Surface (annular outer wall)
Liquid Volume Fraction at catalyst surface decrease dramatically along Tube LengthN‐ethylcarbazole conc.
min= 0.0
Increased calculation precision shoes liquid breaks up into droplets
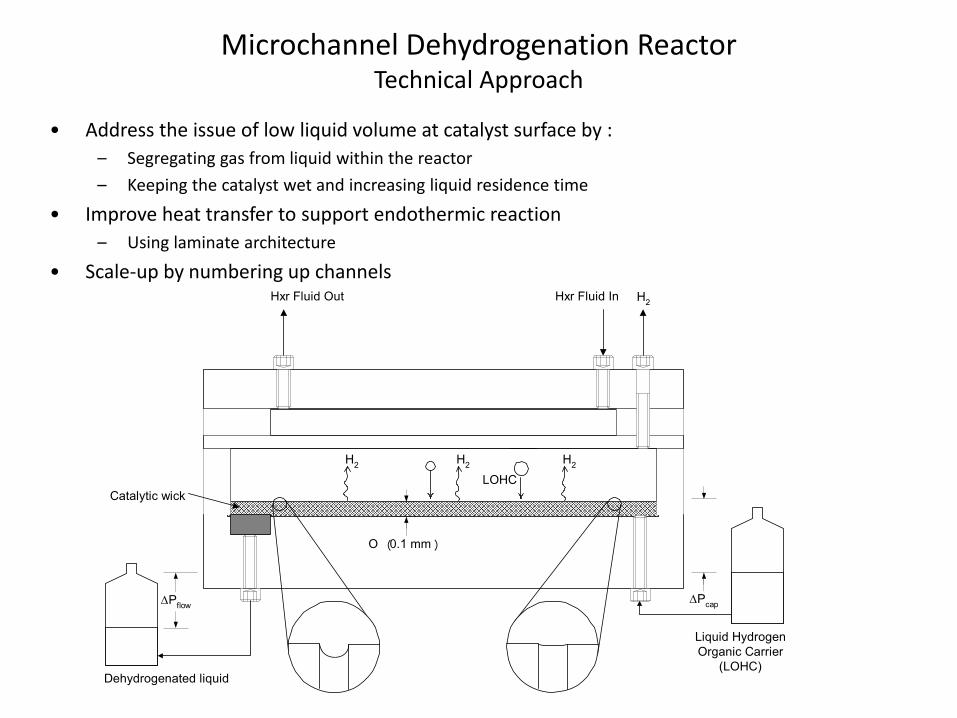
Microchannel Dehydrogenation ReactorTechnical Approach
• Address the issue of low liquid volume at catalyst surface by :– Segregating gas from liquid within the reactor
– Keeping the catalyst wet and increasing liquid residence time
• Improve heat transfer to support endothermic reaction– Using laminate architecture
• Scale‐up by numbering up channelsHxr Fluid InHxr Fluid Out
ΔPflow ΔPcap
O ︵0.1 mm ︶
Catalytic wick
H2
Liquid HydrogenOrganic Carrier
(LOHC)Dehydrogenated liquid
H2 H2 H2
LOHC
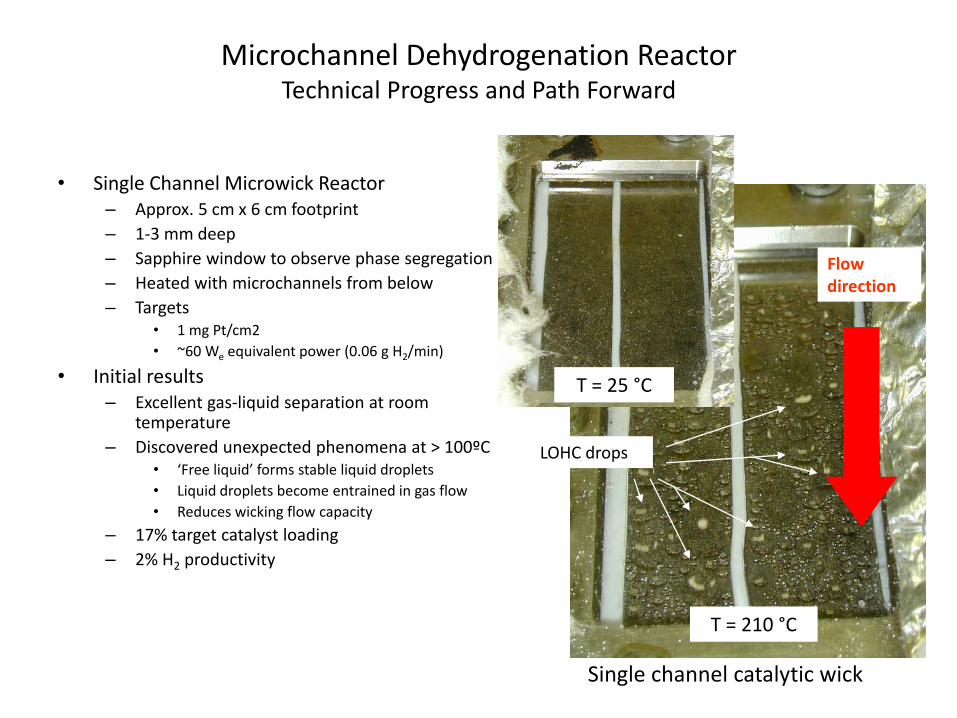
Microchannel Dehydrogenation ReactorTechnical Progress and Path Forward
• Single Channel Microwick Reactor– Approx. 5 cm x 6 cm footprint– 1‐3 mm deep– Sapphire window to observe phase segregation– Heated with microchannels from below– Targets
• 1 mg Pt/cm2• ~60 We equivalent power (0.06 g H2/min)
• Initial results– Excellent gas‐liquid separation at room
temperature– Discovered unexpected phenomena at > 100ºC
• ‘Free liquid’ forms stable liquid droplets• Liquid droplets become entrained in gas flow• Reduces wicking flow capacity
– 17% target catalyst loading– 2% H2 productivity
Single channel catalytic wick
LOHC drops
Flow direction
T = 25 °C
T = 210 °C
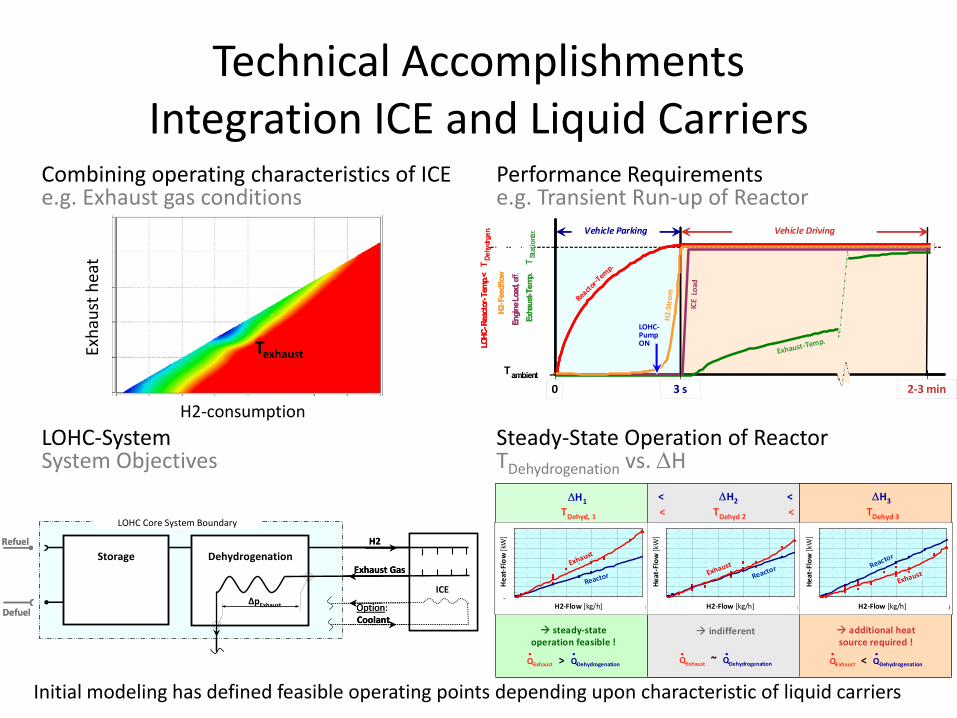
Technical AccomplishmentsIntegration ICE and Liquid Carriers
Defuel
ICE
Exhaust Gas
Option:Coolant
LOHC Core System Boundary
H2
Storage Dehydrogenation
ΔpExhaust
Refuel
Defuel
ICE
Exhaust Gas
Option:Coolant
LOHC Core System Boundary
H2
Storage Dehydrogenation
ΔpExhaust
Refuel
LOHC‐SystemSystem Objectives
Combining operating characteristics of ICEe.g. Exhaust gas conditions
H2‐consumption
Exhaust he
at
Texhaust
Performance Requirementse.g. Transient Run‐up of Reactor
Initial modeling has defined feasible operating points depending upon characteristic of liquid carriers
Steady‐State Operation of ReactorTDehydrogenation vs. ΔH
steady‐state operation feasible !
QExhaust > QDehydrogenation
TDehyd 3
ΔH3
TDehyd 2
ΔH2
TDehyd, 1
ΔH1
indifferent
QExhaust ~ QDehydrogenation
additional heat source required !
QExhaust < QDehydrogenation
< << <
010203040506070
0 2 4 6 8 10
Heat‐Flow[kW]
010203040506070
0 2 4 6 8 10
Heat‐Flow
[kW]
010203040506070
0 2 4 6 8 10
Heat‐Flow
[kW]
Exhaust
Reactor
Exhaust
Reactor
Exhaust
Reactor
H2‐Flow [kg/h] H2‐Flow [kg/h] H2‐Flow [kg/h]
H2-F
eedf
low
Engi
neLo
ad, e
ff.
LOHC
-Rea
ctor
-Tem
p.<
Exha
ust-T
emp.
Tambient
Vehicle Parking Vehicle Driving
Exhaust‐Temp.
ICE Load
H2 ‐Strom
Reactor‐Temp.
TSt
atio
när.
TDe
hydr
gen.
LOHC‐PumpON
0 3 s 2‐3 min
H2-F
eedf
low
Engi
neLo
ad, e
ff.
LOHC
-Rea
ctor
-Tem
p.<
Exha
ust-T
emp.
Tambient
Vehicle Parking Vehicle Driving
Exhaust‐Temp.
ICE Load
H2 ‐Strom
Reactor‐Temp.
TSt
atio
när.
TDe
hydr
gen.
LOHC‐PumpON
0 3 s 2‐3 min

Tech Accomplishments/RelevanceEstimation of full‐size core reactor:• Target: 10 kg H2/h , 60 kW thermal• Heat transfer limiting reactor size
– Current reaction rate (no mass transfer issues) support this– Case 1: Demonstrated in commercial‐ready devices – Case 2: Laboratory demonstrated
500 [m2 / m3] 1000 [m2 / m3]
60 [kW] 60 [kW]
Reactor Volume 2,8 [l] 1,4 [l]
Heat Exchange Area 1,4 [m2] 1,4 [m2]
Reactor Mass 11 [kg] 6 [kg]
Reactor Volume 0,5 [l] 0,2 [l]
Heat Exchange Area 0,24 [m2] 0,24 [m2]
Reactor Mass 2 [kg] 1 [kg]Oil
heat
ed
Demonstrated Laboratory
Gas
hea
ted
Conclusion:Reactor size estimations should be suitable for use in automobile
VolumeReactorAreaExchangeHeatHeat transfer limit

14
Leveraging UTRC Fuel Cell modeling (gPROMS), system models are being constructed to evaluate on‐board performance and apply waste heat sources to drive the dehydrogenation process at the forecourt.
Fuel Cell / Forecourt Integration Modeling
• On‐board– Extend Argonne National Lab on‐board analysis:
modify configuration, incorporate PNNL reactor performance, conduct trade‐off studies (weight, volume, kinetics, efficiency).
• Forecourt baseline configuration– Burn H2 for dehydrogenation process
“System Level Analysis of Hydrogen Storage Options”,Ahluwalia, R.K. et al., 2007 DOE H2 Program Review,May 2007.
Reactor
Forecourt
Combustor
Working fluid
100% H2
100 + x%
x%
Q1 Q2
Th
Tank
Recuperator
LOHCH
LOHCDH
Air
Exhaust

15
Forecourt/FC Modeling
• Forecourt modeling: Several system configurations for hydrogen generation using the liquid carrier are being modeled leveraging existing models to improve heat utilization efficiency for the overall plant.
2
2
2
2:R32:R22:R1
HDCHCBHBA
+→+→+→
⎟⎟⎠
⎞⎜⎜⎝
⎛⎟⎟⎠
⎞⎜⎜⎝
⎛−=TT
RTE
kk ref
ref
iaoii 1exp ,,
Tref = 400 K
N
C2H5
N
C2H5
N
C2H5
N
C2H5
0.0
0.1
0.2
0.3
0.4
0.5
0.6
0.7
0.8
0.9
1.0
0 100 200 300 400
liqu
id m
ole
fract
ions
Time [min]
230
232
234
236
238
240
242
244
246
248
250
252
T [C]
A (left) B (left) C (left) D (left) T (right)
-20
-15
-10
-5
0
5
10
15
20
0 200 400 600 800 1000
Temperature [K]
Kca
l/mol
e
R1 dHR1 dGR2 dHR2 dGR3 dHR3 dG
ΔH, ΔG
• Reactor kinetics– Air Products model incorporated into UTRC gPROMS models
Implementation validated

Summary
• Microchannel reactors – Dehydrogenation successful over a variety of conditions– Low catalyst efficiency was traced tothe high gas flow rate.– Experimental work to separate gas flow and increase liquid
contact is underway.• Modeling
– Forecourt/FC: We have begun building system models • to evaluate on‐board performance and • the dehydrogenation process at the forecourt.
– Initial modeling of ICE• determined that the reactor size should be feasible for an automobile• defined stable operating point depending upon the characteristics of the carrier fluid

Future Work
Project Overview• Reactor Testing
– Test novel catalyst forms (foams) for forecourt reactor – Improve the gas-liquid separation in a Microwick Reactor
• Modeling– Incorporate reactor models into Fuel Cell/ Forecourt
Modeling and perform trade-off analysis– Continue high-level system evaluation for ICE by adding
necessary components with the goal of evaluating dynamic system characteristics
• Supply– Provide hydrogenated feed for all partners– Scale up hydrogenation process

Future Work –Microchannel Reactor Development Milestones
Phase II
Phase I
2009
JvW, Oct 29 2008
2010`08
Microchannel
Oil heated
100 W
06/09PoP I ready
Microchannel
Oil heated
100 W
09/09PoP II ready
Microchannel
Gas heated
100 W
11/09PoP III ready
03/10Prototype ready
Microchannel
tbd.
1000 W
06/09GO / NO GO decision
Proof of Principles (P.o.P.s) Proof of Concept
Recommended