Retail Strategies | 120 18th Street South, Suite 201 | Birmingham, AL 35233 | 205.313.3676 | 205.313.3677 | www.retailstrategies.com
Retail Market Research & Strategic Plan Overview

our research| Retail Strategies
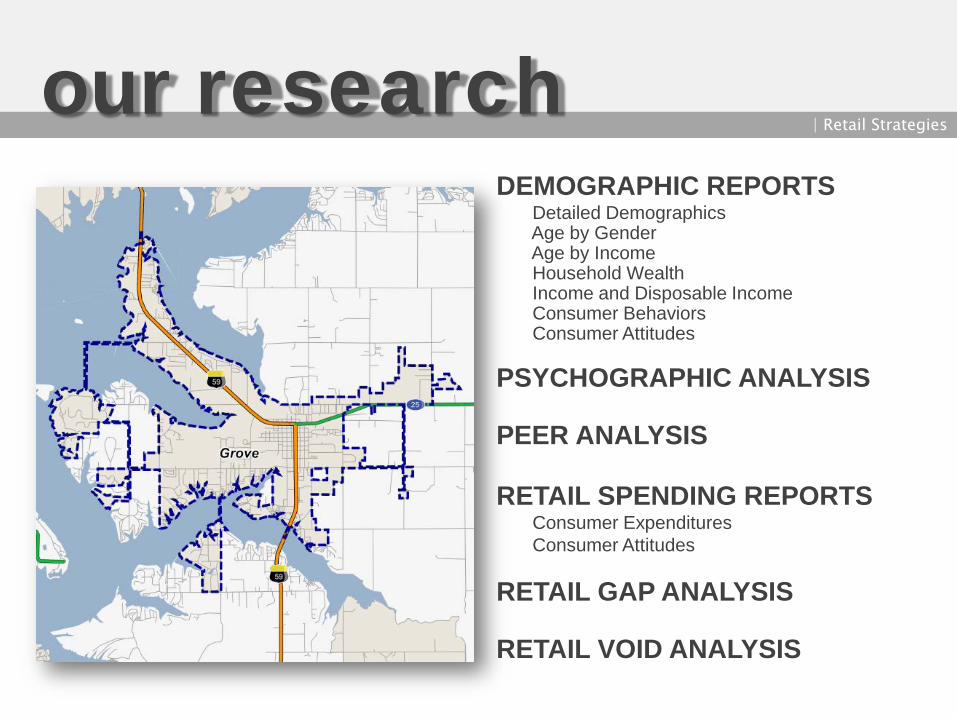
DEMOGRAPHIC REPORTSDetailed DemographicsAge by GenderAge by IncomeHousehold WealthIncome and Disposable IncomeConsumer BehaviorsConsumer Attitudes
PSYCHOGRAPHIC ANALYSIS
PEER ANALYSIS
RETAIL SPENDING REPORTSConsumer ExpendituresConsumer Attitudes
RETAIL GAP ANALYSIS
RETAIL VOID ANALYSIS
our research| Retail Strategies
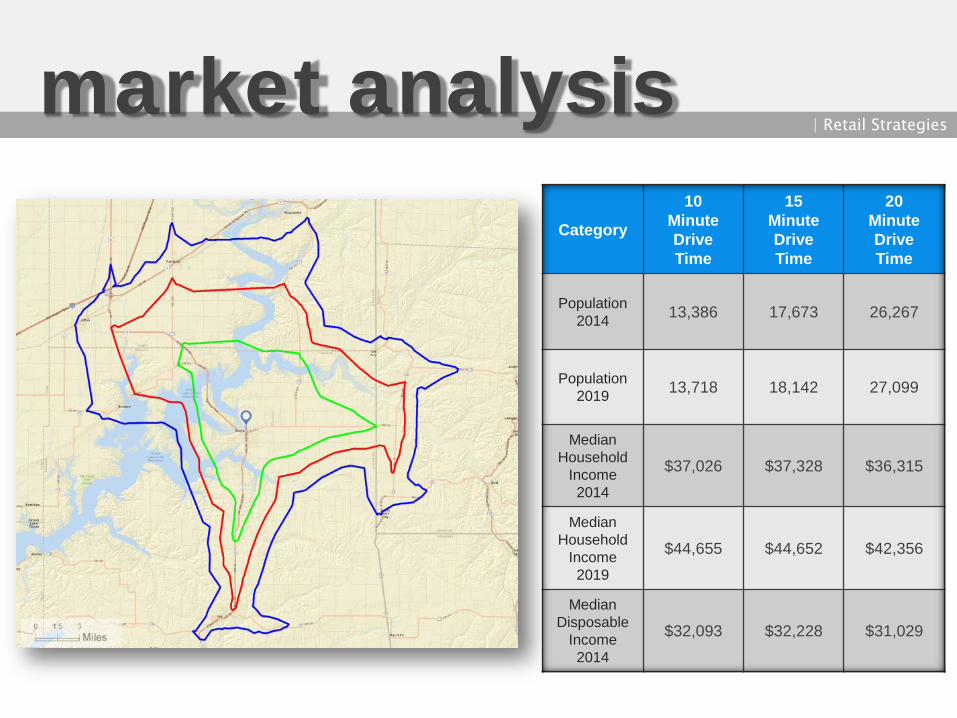
market analysis | Retail Strategies
Category
10Minute Drive Time
15MinuteDrive Time
20MinuteDrive Time
Population2014 13,386 17,673 26,267
Population2019 13,718 18,142 27,099
MedianHousehold
Income 2014
$37,026 $37,328 $36,315
MedianHousehold
Income 2019
$44,655 $44,652 $42,356
MedianDisposable
Income 2014
$32,093 $32,228 $31,029
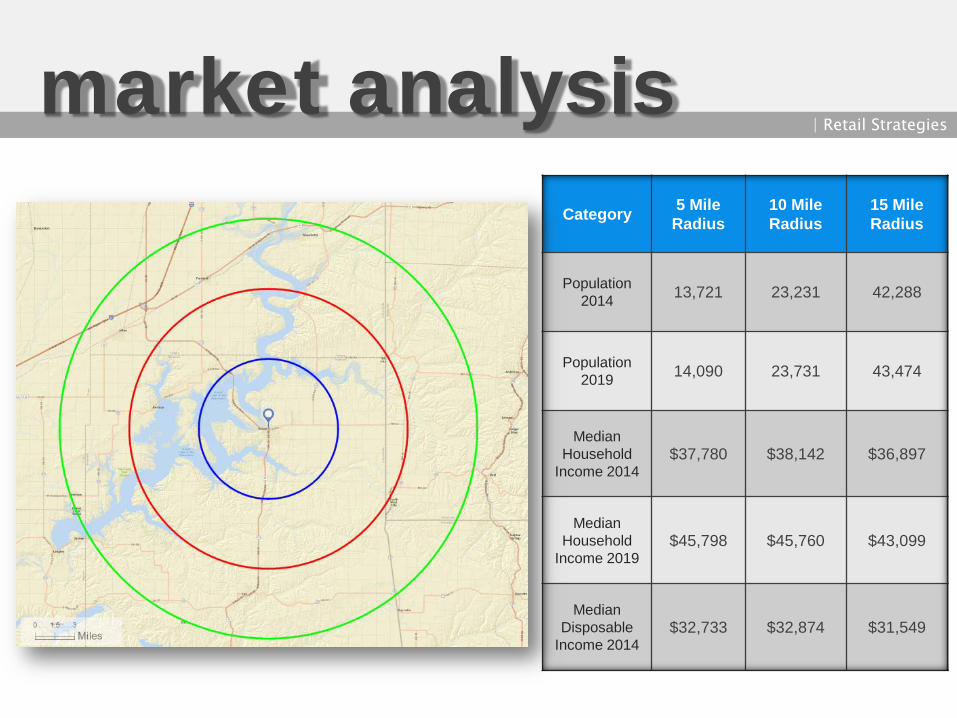
market analysis | Retail Strategies
Category 5 Mile Radius
10 Mile Radius
15 Mile Radius
Population2014 13,721 23,231 42,288
Population2019 14,090 23,731 43,474
MedianHousehold
Income 2014$37,780 $38,142 $36,897
MedianHousehold
Income 2019$45,798 $45,760 $43,099
MedianDisposable
Income 2014$32,733 $32,874 $31,549

| Retail Strategies
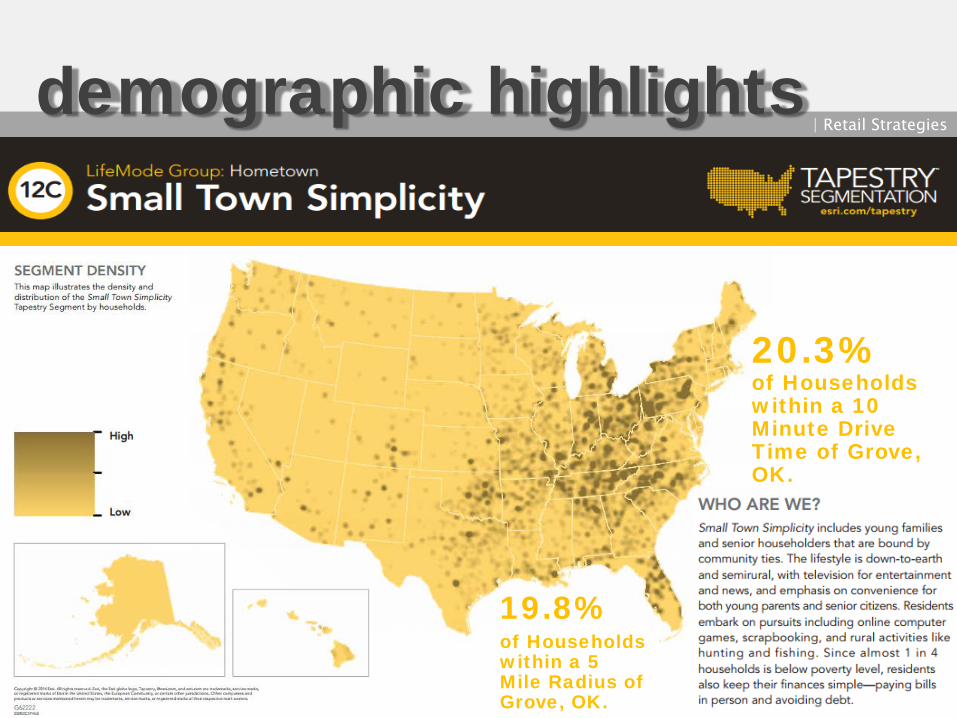
demographic highlights| Retail Strategies
| Retail Strategies demographic highlights
19.8%of Households within a 5 Mile Radius of Grove, OK.
20.3% of Households within a 10 Minute Drive Time of Grove, OK.
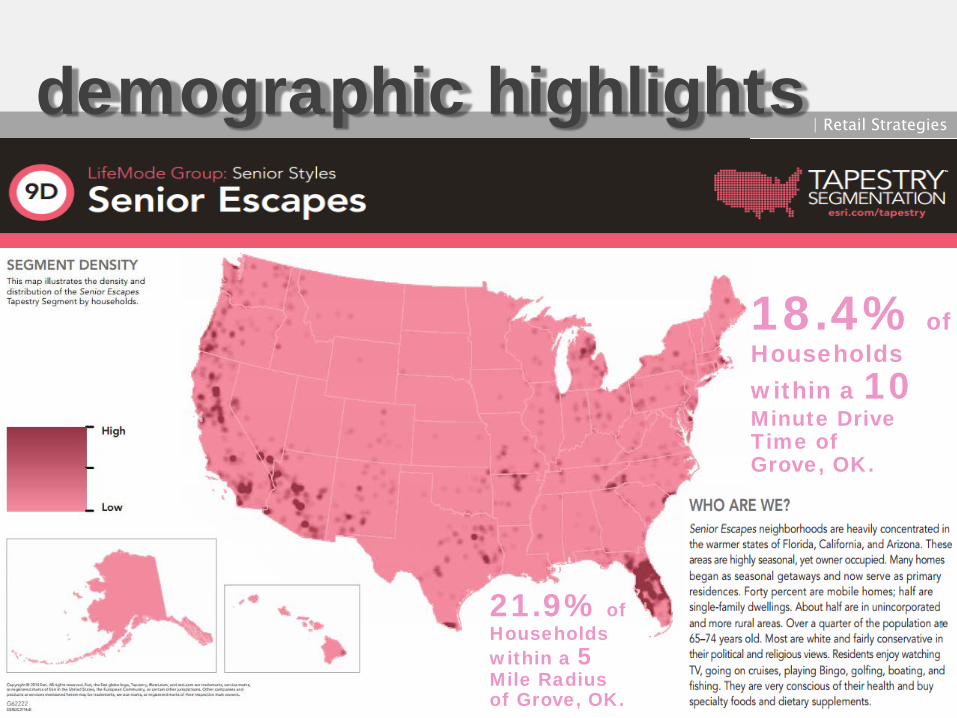
18.4% of Households within a 10Minute Drive Time of Grove, OK.
| Retail Strategies demographic highlights
21.9% of Households within a 5Mile Radiusof Grove, OK.
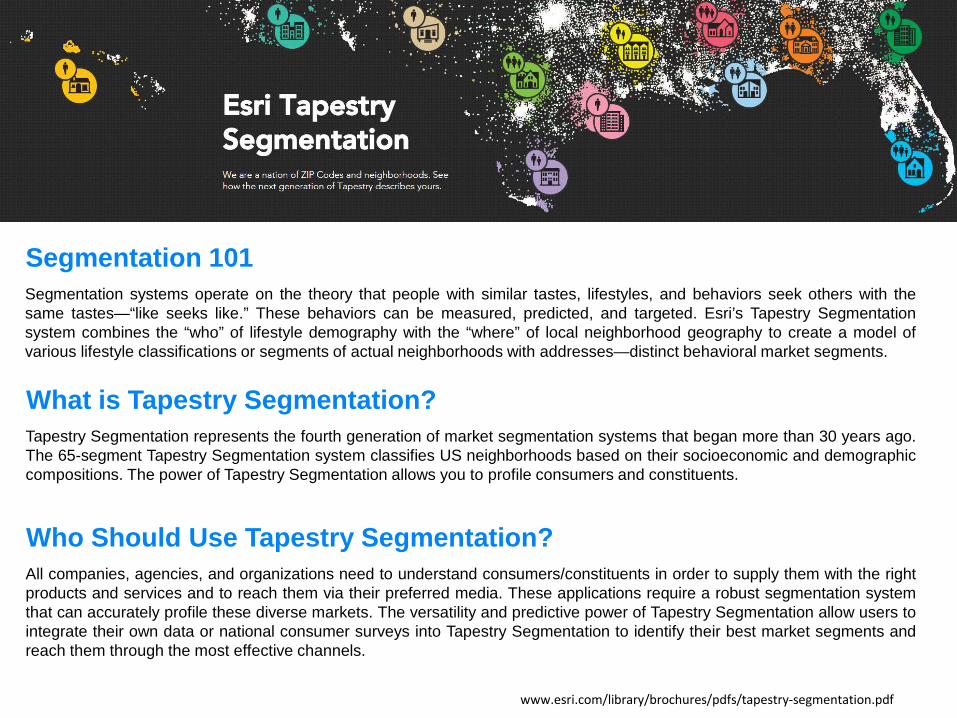
Segmentation systems operate on the theory that people with similar tastes, lifestyles, and behaviors seek others with thesame tastes—“like seeks like.” These behaviors can be measured, predicted, and targeted. Esri’s Tapestry Segmentationsystem combines the “who” of lifestyle demography with the “where” of local neighborhood geography to create a model ofvarious lifestyle classifications or segments of actual neighborhoods with addresses—distinct behavioral market segments.
Segmentation 101
Tapestry Segmentation represents the fourth generation of market segmentation systems that began more than 30 years ago.The 65-segment Tapestry Segmentation system classifies US neighborhoods based on their socioeconomic and demographiccompositions. The power of Tapestry Segmentation allows you to profile consumers and constituents.
What is Tapestry Segmentation?
All companies, agencies, and organizations need to understand consumers/constituents in order to supply them with the rightproducts and services and to reach them via their preferred media. These applications require a robust segmentation systemthat can accurately profile these diverse markets. The versatility and predictive power of Tapestry Segmentation allow users tointegrate their own data or national consumer surveys into Tapestry Segmentation to identify their best market segments andreach them through the most effective channels.
Who Should Use Tapestry Segmentation?
www.esri.com/library/brochures/pdfs/tapestry-segmentation.pdf
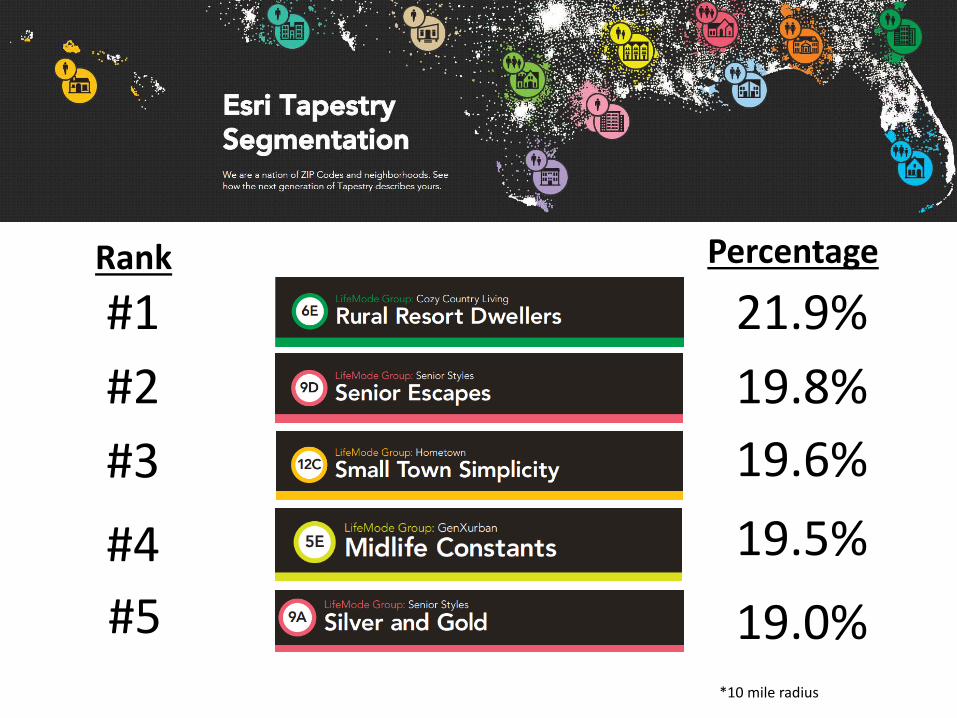
#1#2#3#4#5
21.9%19.8%19.6%19.5%19.0%
Rank Percentage
*10 mile radius
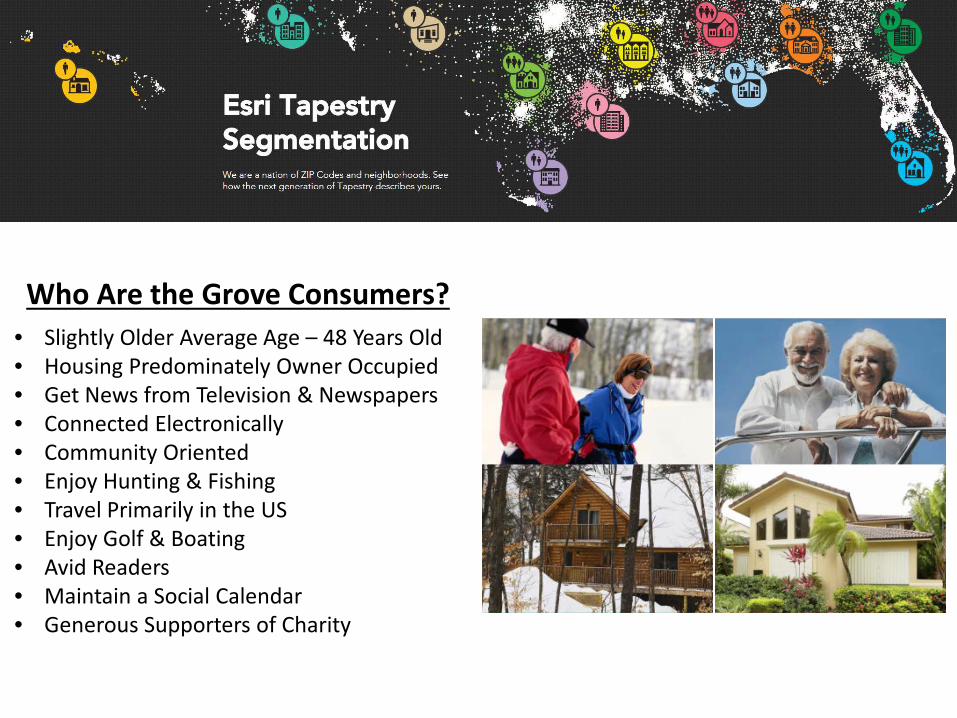
Who Are the Grove Consumers?• Slightly Older Average Age – 48 Years Old• Housing Predominately Owner Occupied• Get News from Television & Newspapers• Connected Electronically• Community Oriented• Enjoy Hunting & Fishing• Travel Primarily in the US• Enjoy Golf & Boating• Avid Readers• Maintain a Social Calendar• Generous Supporters of Charity
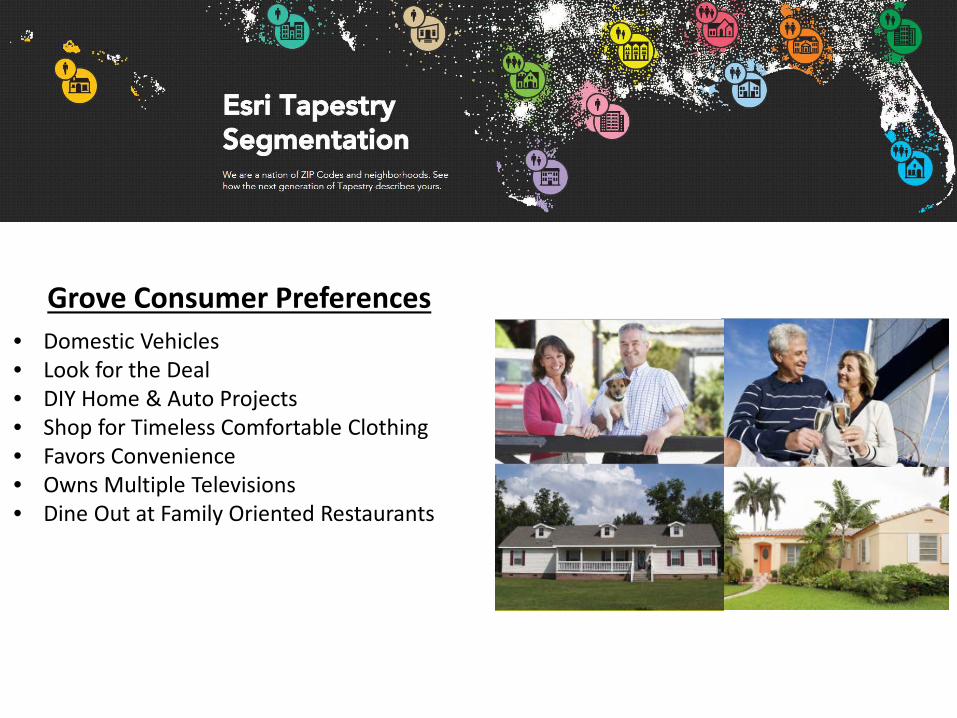
Grove Consumer Preferences• Domestic Vehicles• Look for the Deal• DIY Home & Auto Projects• Shop for Timeless Comfortable Clothing• Favors Convenience• Owns Multiple Televisions• Dine Out at Family Oriented Restaurants
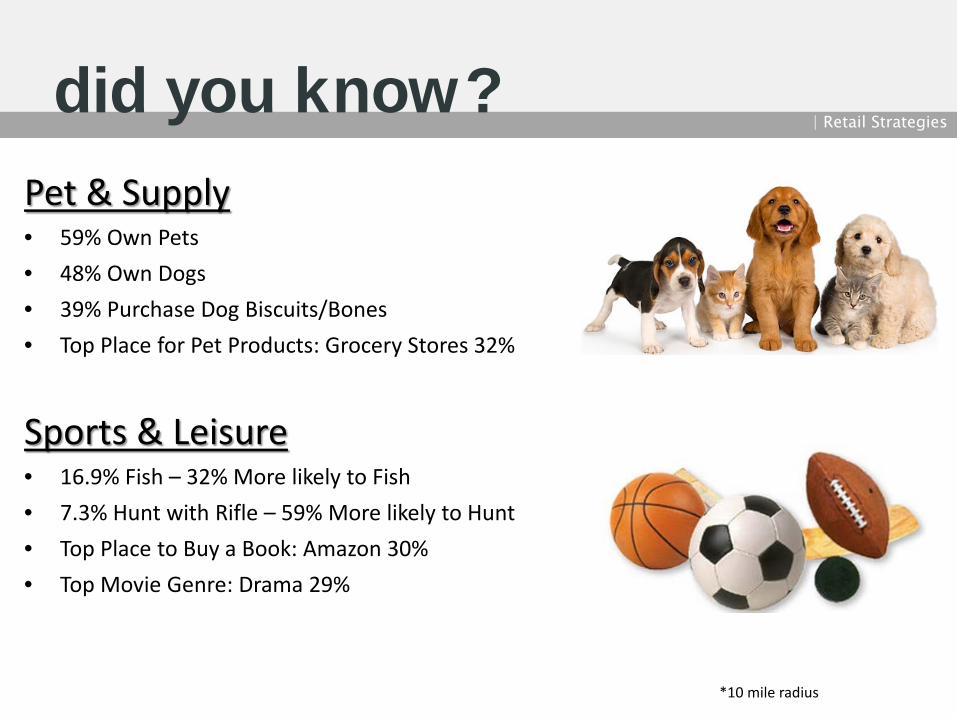
did you know?| Retail Strategies
Pet & Supply• 59% Own Pets• 48% Own Dogs• 39% Purchase Dog Biscuits/Bones• Top Place for Pet Products: Grocery Stores 32%
*10 mile radius
Sports & Leisure• 16.9% Fish – 32% More likely to Fish• 7.3% Hunt with Rifle – 59% More likely to Hunt• Top Place to Buy a Book: Amazon 30% • Top Movie Genre: Drama 29%
| Retail Strategies peer&gap analysis
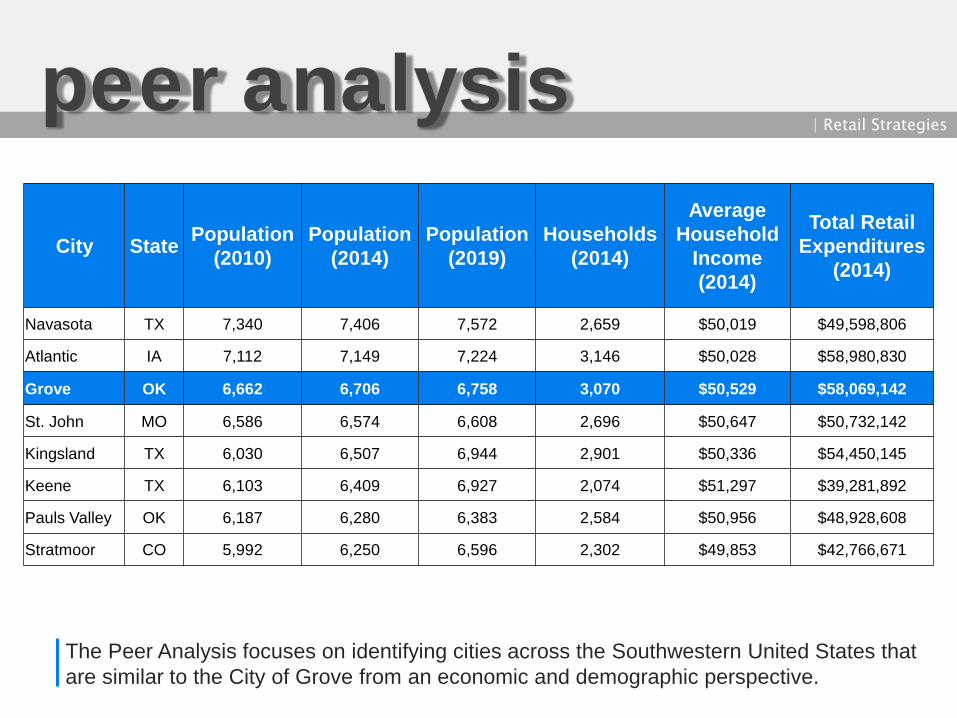
The Peer Analysis focuses on identifying cities across the Southwestern United States that are similar to the City of Grove from an economic and demographic perspective.
peer analysis| Retail Strategies
City State Population (2010)
Population (2014)
Population (2019)
Households (2014)
Average Household
Income (2014)
Total Retail Expenditures
(2014)
Navasota TX 7,340 7,406 7,572 2,659 $50,019 $49,598,806
Atlantic IA 7,112 7,149 7,224 3,146 $50,028 $58,980,830
Grove OK 6,662 6,706 6,758 3,070 $50,529 $58,069,142
St. John MO 6,586 6,574 6,608 2,696 $50,647 $50,732,142
Kingsland TX 6,030 6,507 6,944 2,901 $50,336 $54,450,145
Keene TX 6,103 6,409 6,927 2,074 $51,297 $39,281,892
Pauls Valley OK 6,187 6,280 6,383 2,584 $50,956 $48,928,608
Stratmoor CO 5,992 6,250 6,596 2,302 $49,853 $42,766,671
gap analysis| Retail Strategies
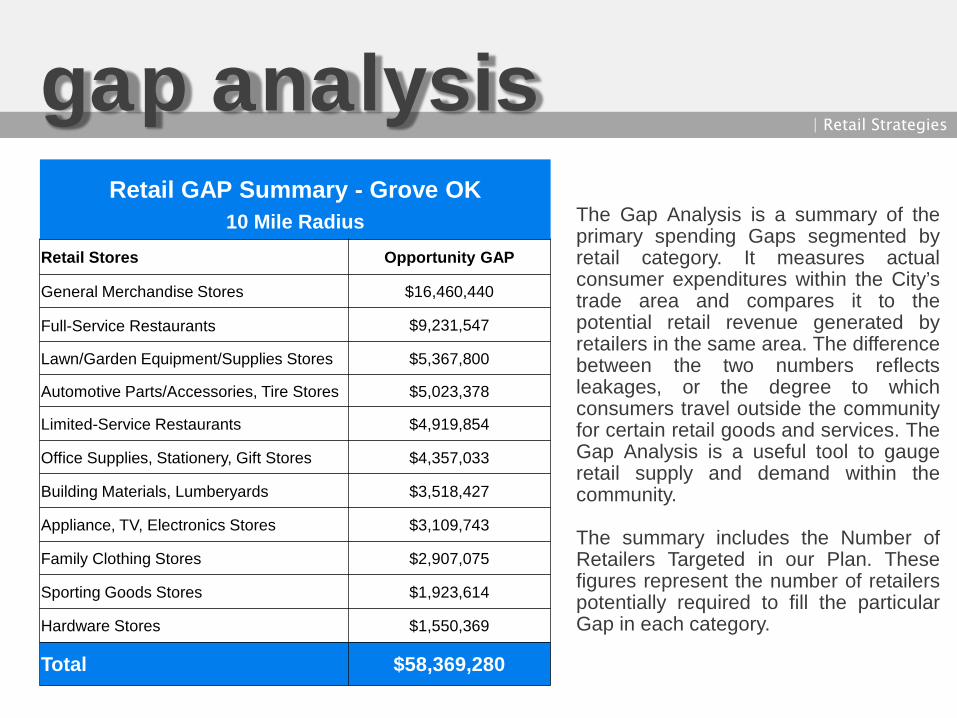
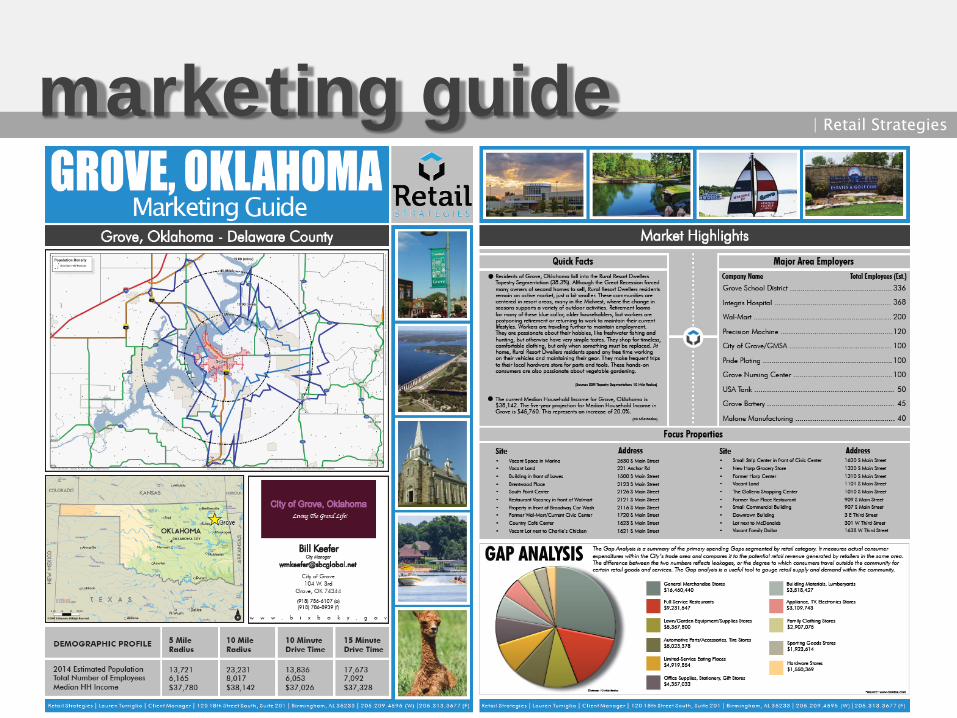
The Gap Analysis is a summary of theprimary spending Gaps segmented byretail category. It measures actualconsumer expenditures within the City’strade area and compares it to thepotential retail revenue generated byretailers in the same area. The differencebetween the two numbers reflectsleakages, or the degree to whichconsumers travel outside the communityfor certain retail goods and services. TheGap Analysis is a useful tool to gaugeretail supply and demand within thecommunity.
The summary includes the Number ofRetailers Targeted in our Plan. Thesefigures represent the number of retailerspotentially required to fill the particularGap in each category.
Retail GAP Summary - Grove OK10 Mile Radius
Retail Stores Opportunity GAP
General Merchandise Stores $16,460,440
Full-Service Restaurants $9,231,547
Lawn/Garden Equipment/Supplies Stores $5,367,800
Automotive Parts/Accessories, Tire Stores $5,023,378
Limited-Service Restaurants $4,919,854
Office Supplies, Stationery, Gift Stores $4,357,033
Building Materials, Lumberyards $3,518,427
Appliance, TV, Electronics Stores $3,109,743
Family Clothing Stores $2,907,075
Sporting Goods Stores $1,923,614
Hardware Stores $1,550,369
Total $58,369,280
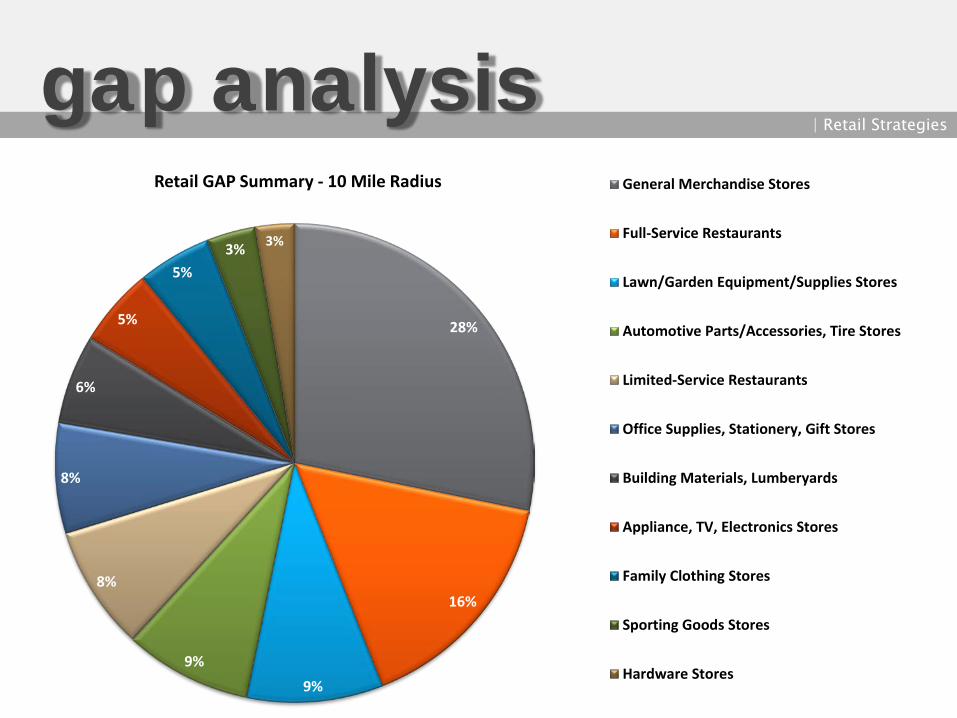
gap analysis| Retail Strategies
28%
16%
9%9%
8%
8%
6%
5%
5%3% 3%
Retail GAP Summary - 10 Mile Radius General Merchandise Stores
Full-Service Restaurants
Lawn/Garden Equipment/Supplies Stores
Automotive Parts/Accessories, Tire Stores
Limited-Service Restaurants
Office Supplies, Stationery, Gift Stores
Building Materials, Lumberyards
Appliance, TV, Electronics Stores
Family Clothing Stores
Sporting Goods Stores
Hardware Stores
| Retail Strategies
retail overview
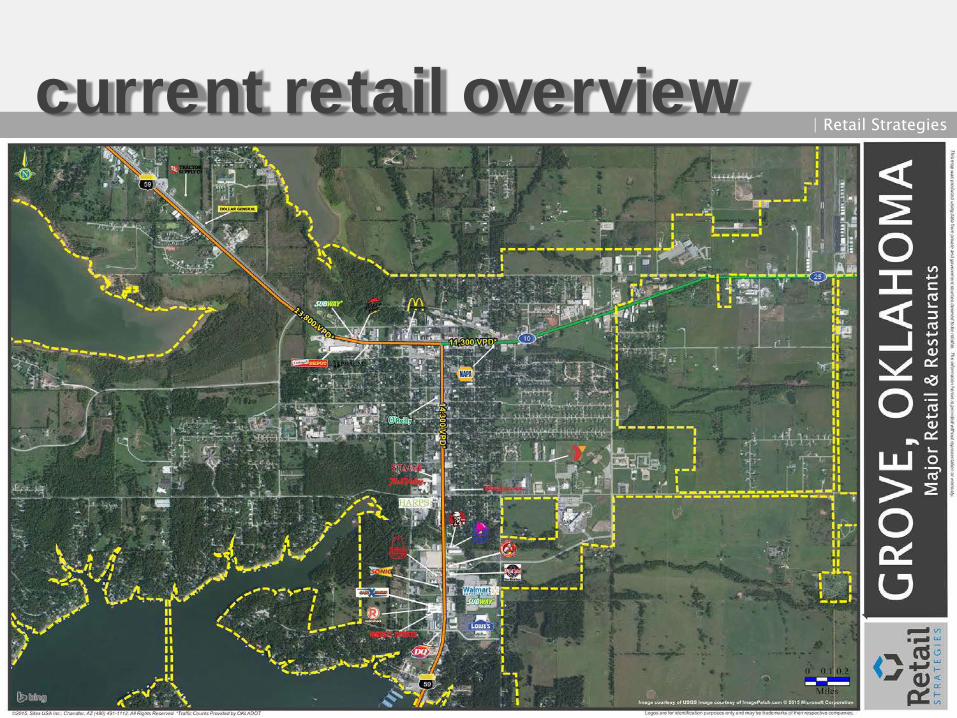
current retail overview| Retail Strategies
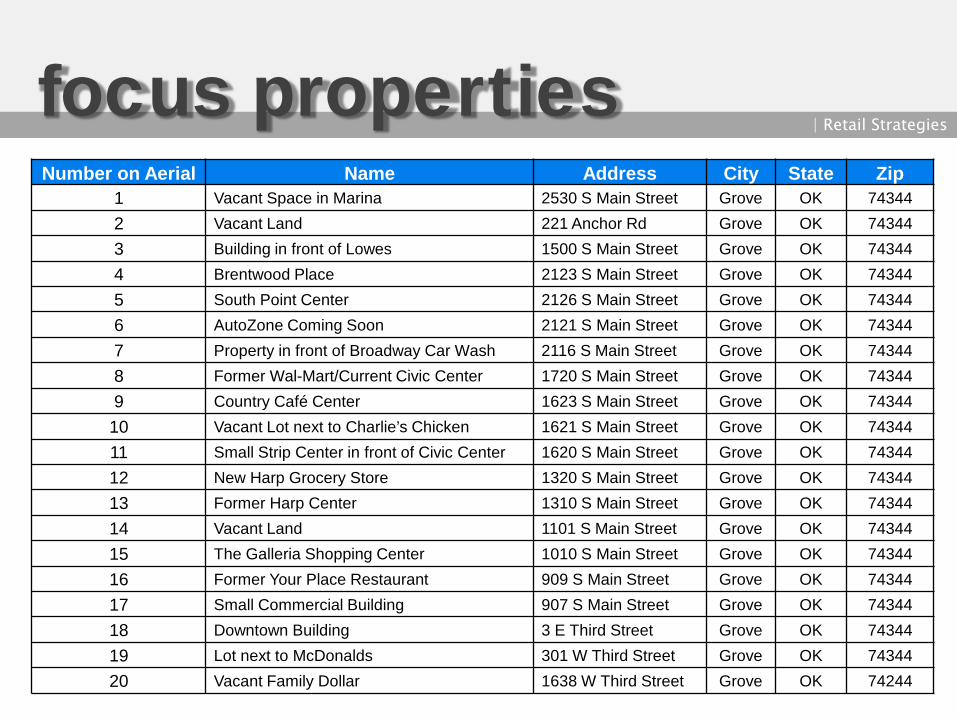
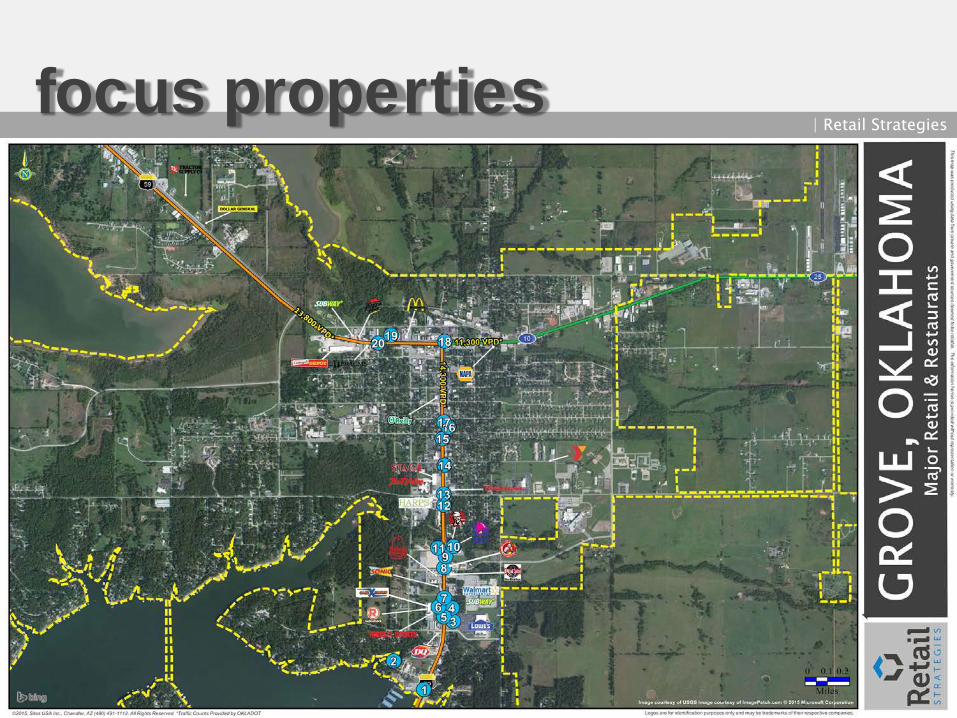
focus properties| Retail Strategies
Number on Aerial Name Address City State Zip1 Vacant Space in Marina 2530 S Main Street Grove OK 743442 Vacant Land 221 Anchor Rd Grove OK 743443 Building in front of Lowes 1500 S Main Street Grove OK 743444 Brentwood Place 2123 S Main Street Grove OK 743445 South Point Center 2126 S Main Street Grove OK 743446 AutoZone Coming Soon 2121 S Main Street Grove OK 743447 Property in front of Broadway Car Wash 2116 S Main Street Grove OK 743448 Former Wal-Mart/Current Civic Center 1720 S Main Street Grove OK 743449 Country Café Center 1623 S Main Street Grove OK 7434410 Vacant Lot next to Charlie’s Chicken 1621 S Main Street Grove OK 7434411 Small Strip Center in front of Civic Center 1620 S Main Street Grove OK 7434412 New Harp Grocery Store 1320 S Main Street Grove OK 7434413 Former Harp Center 1310 S Main Street Grove OK 7434414 Vacant Land 1101 S Main Street Grove OK 7434415 The Galleria Shopping Center 1010 S Main Street Grove OK 7434416 Former Your Place Restaurant 909 S Main Street Grove OK 7434417 Small Commercial Building 907 S Main Street Grove OK 7434418 Downtown Building 3 E Third Street Grove OK 7434419 Lot next to McDonalds 301 W Third Street Grove OK 7434420 Vacant Family Dollar 1638 W Third Street Grove OK 74244
focus properties| Retail Strategies
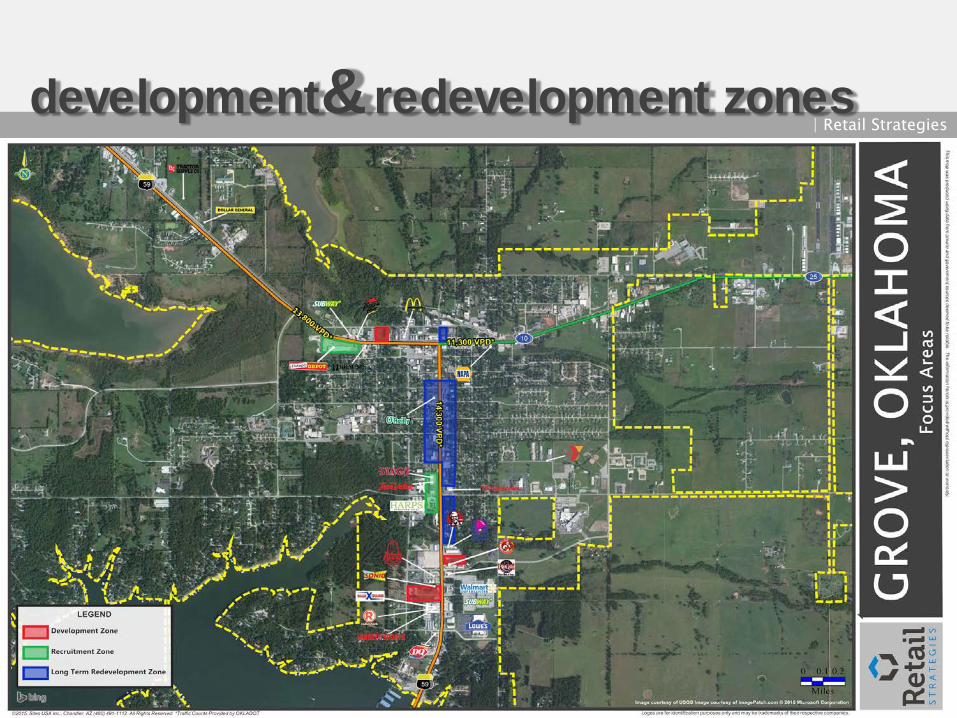
development&redevelopment zones| Retail Strategies
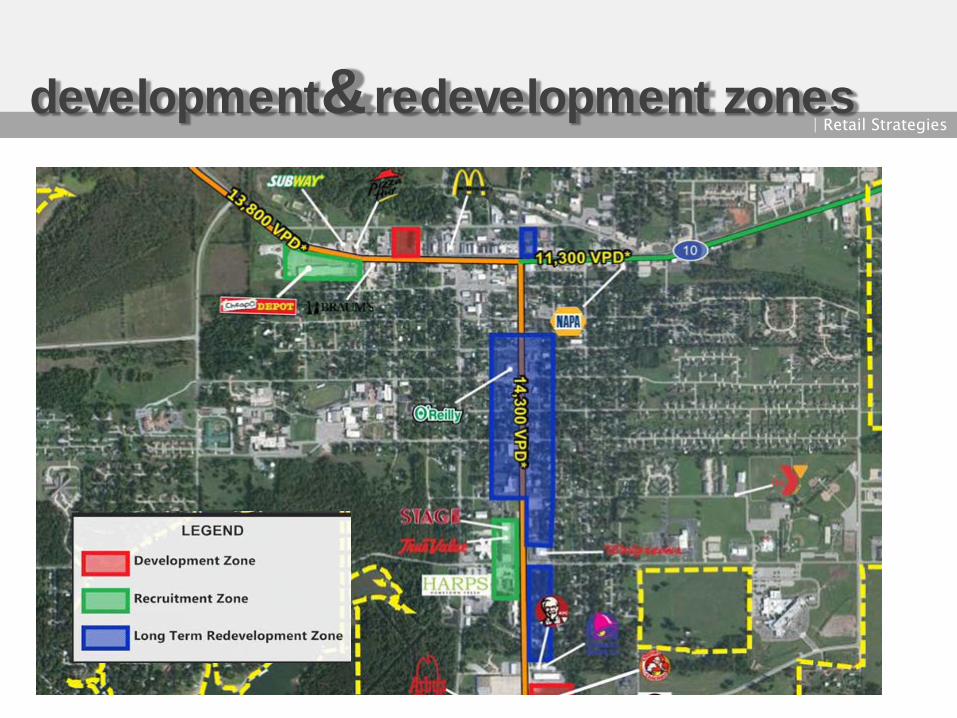
development&redevelopment zones| Retail Strategies
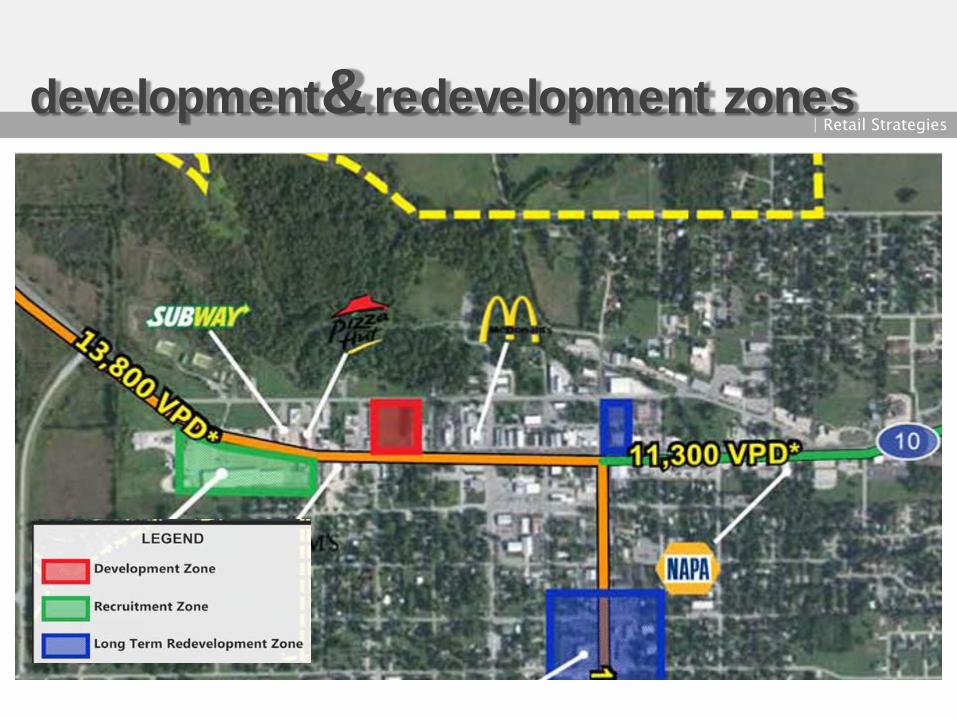
development&redevelopment zones| Retail Strategies
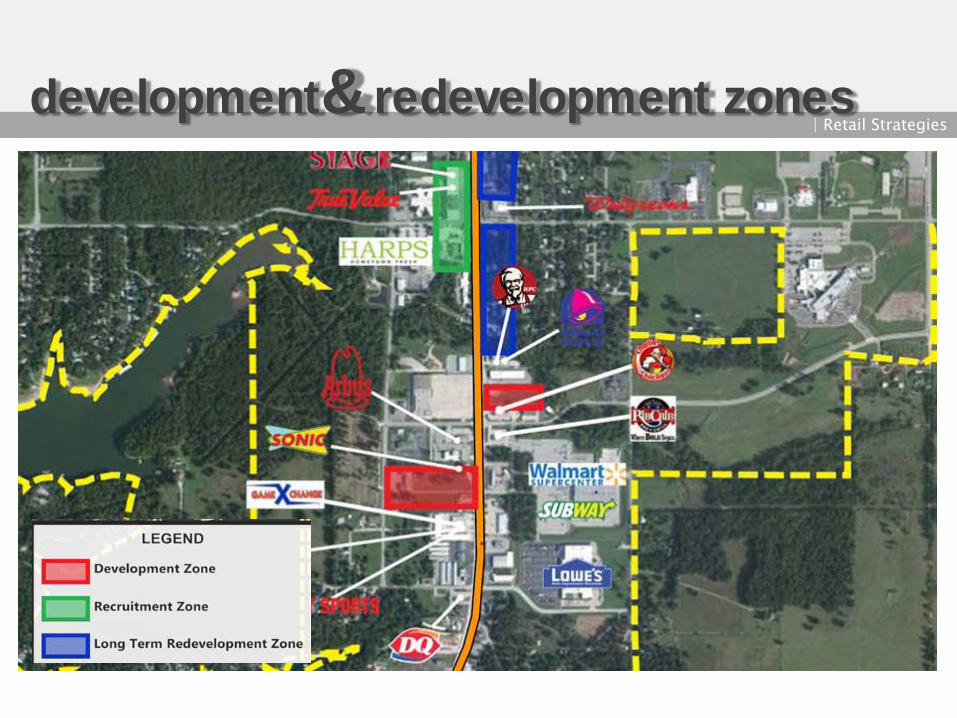
development&redevelopment zones| Retail Strategies
| Retail Strategies objectives
marketing objectives| Retail Strategies
• Leverage Retail Strategies’ national network of retail, restaurant, developer andinvestor relationships on behalf of Grove
• Focus on marketing the primary retail redevelopment, new development and infillopportunities and zones
• Communicate with local real estate professionals and support their efforts whereneeded
• Continue aggressive outreach/marketing campaign to targeted retailers andrestaurant prospects through direct contact, tenant representatives, preferreddeveloper relationships as well as industry conferences/trade shows (ICSC)
• Connect landowners with out of market developers as appropriate• Connect leasing/brokerage professionals with potential tenants based on location
and real estate requirements• Focus on reviving any stalled projects• Present opportunities to retailers during Portfolio Reviews – already taking place
recruitment objectives| Retail Strategies
• Create and execute a marketing, development, and recruitment plan around theprimary “Gaps” including General Merchandise and Full-Service Restaurants
• Identify and pro-actively reach out to the “dated” retail centers and retail propertyowners to determine their willingness to invest in their assets in order to bepositioned to accommodate new retail -OR- determine their interest in sellingtheir property(s) to new owners who would re-develop
• Focus on recruiting fashion retailers to the existing Walmart shadow center• Study the possibility of recruiting a department store to the market• Aggressively market the City of Grove to “new to market” restaurant and food
service concepts as well as national sit down restaurants• Focus for a new development will be on the parcels surrounding the new Harp’s
market• Identify through Retail Strategies resources – retailers planning to expand into
the Oklahoma market over the next several years• Develop a Retail Incentives Strategy internally and communicate that Grove is
“open for business” to retail developers in and outside the market
| Retail Strategies marketing guide
marketing guide| Retail Strategies
Recommended