1
Please read Disclaimer on the back
November 2016 Results Summary of Listed Companiesin the Saudi Market3Q2016
© All rights reserved
Dar Alarkan had the lowest P/BV (0.3x) in the Saudi market, followed by
Saudi Arabian Amiantit Co.(0.45x).
The TTM P/BV for the Saudi market stood at 1.4x.
Mohammad Al Mojil Group, Bishah Agriculture Development, Al-Baha
Development Co. lost 291.1%, 135.7%, and 123.6% of capital (since inception), respectively.
6 of the top 15 highest accumulated loss to capital are from the Insurance sector.
Alsagr Co-op Ins, Saudi Hollandi Bank, and Arab National Bank posted the
lowest P/E (3.9x-5.5x) in the Saudi market for the trailing 12 months (TTM),
followed by Middle East Paper Co. (5.7x).
The average TTM P/E for the Saudi market stood at 14.8x.
Yanbu Cement had the highest dividend yield (16.9%) during the last 12
months in the Saudi market. The Cement sector dominated the market
in terms of dividend yield, with 11 companies ranking among the top 15
companies.
Overall, the dividend yield in the Saudi market stood at 4.4%.
Company D/Y(%)* P/Bv (x) P/E TTM (x)
Yanbu Cement 16.9 1.3 6.0Yamamah Cement 13.3 0.9 6.3City Cement Co. 12.8 1.0 9.0Arabian Cement 11.8 1.1 6.2Saudi Cement Co. 11.5 2.6 8.5Saudi Arabian Amiantit Co. 11.5 0.5 25.5Najran Cement 11.2 0.8 9.2Qassim Cement Co. 11.2 2.6 8.8Eastern Cement Co. 10.9 0.9 6.7Saudi Vitrified Clay Pipe Co. 10.7 3.0 8.1Southern Province Cement Co. 10.6 2.4 7.5Hail Cement Co. 10.2 0.9 8.8Arriyadh Development Co. 10.0 1.3 7.1National Glass Manufacturing Co. 9.8 0.8 13.7Northern Cement Co. 9.8 0.9 9.5
Source: Bloomberg, AlJazira Capital
Company P/E TTM (x) P/BV (x) D/Y (%)*
Sagr Insurance 3.9 1.5 6.4Saudi Hollandi Bank 5.5 0.9 6.3Arab National Bank 5.5 0.7 6.2Middle East Paper Co. 5.7 0.9 4.0Zamil Industrial 5.9 0.7 9.4Bahri 6.0 1.4 7.5Yanbu Cement Co. 6.0 1.3 16.9Saudi Ceramics 6.1 0.6 8.4Arabian Cement 6.2 1.1 11.8Yamama Cement 6.3 0.9 13.3The Saudi British Bank 6.4 0.9 3.7Al-Jazira Bank 6.6 0.6 -Lazurde 6.6 1.4 -Al Tayyar Travel Group Holding 6.6 1.2 -Bank Saudi Fransi 6.7 1.0 4.9
Source: Bloomberg, AlJazira Capital
* Trailing 12 months (TTM)
Company Bk Value P/Bv (x) L/C (%)
Mohammad Al Mojil Group - - 291.14%Bisha Agri. Development - - 135.68%Al-Baha Development Co. - - 123.58%Sanad - - 85.14%Atheeb Telecom 2.6 1.2 73.12%Al Ahlia 3.5 1.5 67.87%Saudi Fisheries Co. 3.5 2.7 67.19%Amana Insurance 3.4 2.2 65.59%Malath Insurance 3.9 2.0 58.17%Enaya 9.2 1.4 55.96%Solidarity 3.9 1.8 54.29%Saudi Cable Co. 4.9 1.0 46.83%Zain Saudi 6.8 1.1 36.38%Tihama Advertising Co. - - 35.92%Saudi Kayan 8.5 0.8 14.75%
L /C refers to accumulated losses to capital Source: Bloomberg, AlJazira Capital
Top 15 Companies
Lowest 15 Companies
Top 15 Companies
Highest 15 Companies
Lowest P/E (TTM)
Accumulated Loss to Capital
Highest D/Y (TTM)
Lowest P/BV
Company P/Bv (x) P/E TTM (x) D/Y (%)*
Dar Al-Arkan 0.30 22.7 -Saudi Arabian Amiantit Co. 0.45 25.5 11.5Methanol Chemicals Co. 0.48 - -ALKHODARI 0.48 - -Saudi Real Estate Co. 0.57 17.5 6.1Saudi Advanced Industries 0.57 - -Jouf Cement 0.58 12.5 -Bank Al-Jazira 0.60 6.6 -Nama Chemical 0.60 - -Aseer 0.62 63.6 8.4Saudi Ceramics 0.63 6.0 8.4Saudi Investment Bank 0.63 6.7 7.0National Gypsum Co. 0.65 26.1 6.3Saudi Cooperative Reinsurance 0.65 - -AlSorayai Group 0.65 - -
Source: Bloomberg, AlJazira Capital * Trailing 12 months (TTM)
Note: All statistics in this report are based on market close prices on October 30, 2016

2
Please read Disclaimer on the back
November 2016 Results Summary of Listed Companiesin the Saudi Market3Q2016
© All rights reserved
Al Rajhi Bank, at 11.0%, has the highest share of the Saudi market, followed
by Saudi Basic Industries Corp (9.2%), and Jabal Omar Development Co
(5.1%). These three companies account for 25.2% of the market index.
The most influential stocks in the Saudi market are from the Banking, Petrochemical, and Telecommunication sectors.
Walaa Insurance Company has been the best performing stock since the
beginning of 2016 (up 54.8% YTD), followed by Basic Chemical Industries
Company - BCI (up 54.6% YTD).
The list indicates that just 6 companies have provided price gains of 20%
or more, since the start of 2016.
Al Alamiya Coop Insurance Co. has been the worst performer (down 69.4%
YTD), followed by Fawaz Abdulaziz AlHokair (down 67.0% YTD).
The list indicates that 15 companies lost more than 53.5% of their value
since the start of the year.
Company YTD % P/Bv (x) P/E TTM (x)
Al Alamiya Coop Insurance Co -69.4 2.3 16.2Fawaz Abdulaziz AlHokair -67.0 1.7 7.9Saudi Research and Marketing -66.8 1.6 -Malath Co-op Insurance -64.8 2.0 -Saudi Enaya insurance -60.6 1.4 -Takween Advanced Industries -60.3 0.9 -AlAbdullatif Indust. Investment -59.9 0.8 14.7United Electronics Co. -58.1 1.2 -Saudi Paper Manufacturing Co. -57.6 0.7 -Al Tayyar Travel Group Co. -57.3 1.2 6.6Khaleej Training and Education -55.4 1.6 14.5Abdulmohsen Alhokair group -55.4 2.1 10.2Saudi Printing and Packaging -54.4 0.8 -AlSorayai Group -54.0 0.7 -Al-Hassan Ghazi Shaker -53.6 0.7 8.0
Source: Bloomberg, AlJazira Capital
Company YTD % P/Bv (x) P/E TTM (x)
Walaa Insurance 54.8 1.8 15.2BCI 54.6 1.9 19.6Yanbu National Petrochemical 43.6 1.7 14.7Advanced Petrochemical 24.3 3.0 10.8National Industrialization 23.5 1.1 -Dallah Healthcare Holding 21.0 3.5 25.8National Medical Care 16.8 3.0 19.2Saudi Electricity Company 16.5 1.3 49.9Saudi Arabian Mining Company 13.7 1.6 117.4Saudi Basic Industries Corp 10.8 1.6 15.1Jabal Omar Development 9.1 6.0 -Al Rajhi Bank 8.5 1.9 11.9Tawuniya 6.3 3.4 14.1Al Rajhi Takaful 5.6 2.5 19.6Saudia Dairy and Foodstuff Co. 4.6 3.6 13.2
Source: Bloomberg, AlJazira Capital
Company Issued Shares (mn)
Free Shares (mn) F/I (%)
Kingdom Holding Co. 3,705.9 185.2 5.00%Saudi Telecom 2,000.0 323.3 16.17%Saudi Electricity Co. 4,167.0 713.6 17.13%National Petrochemical Co. 480.0 82.9 17.27%Saudi Basic Industries Corp 3,000.0 630.9 21.03%Rabigh Refining & Petrochem. 876.0 190.2 21.72%Saudi Hollandi Bank 1,143.1 315.2 27.58%Saudi German Hospital 92.0 27.1 29.54%Al Hammadi Development Co. 120.0 35.8 29.89%Lazurde Company for Jewelry 43.0 12.9 30.00%Saudi Ground Services Co. 188.0 56.4 30.00%Alandalus Property Co. 70.0 21.0 30.00%Jazira Takaful 35.0 10.5 30.00%Al Alamiya 40.0 12.0 30.01%Al Yamamah Steel Industries 50.8 15.2 30.01%
Source: Tadawul, Bloomberg, AlJazira Capital F/I refers to free to issued shares
Best 15 Companies
Top 15 Companies
Worst 15 Companies
Least 15 Companies
Top price performers
Weight to the market index
Worst price performers
Ratio of free to issued shares
Company % of TASI No. of Free Shares (000) P/E TTM (x)
Al Rajhi Bank 11.0% 1,179.6 11.9Saudi Basic Industries Corp. 9.2% 630.9 15.1Jabal Omar Development 5.1% 557.4 -National Commercial Bank 4.2% 713.2 9.5Saudi Telecom 3.2% 323.3 13.6Samba Financial Group 3.2% 1,005.4 7.6Riyad Bank 2.8% 1,570.2 7.4Banque Saudi Fransi. 2.4% 646.9 6.7Almarai Company 2.4% 250.1 23.0Savola Group 2.3% 398.8 13.6Alinma Bank 2.3% 1,109.8 12.9Saudi Arabian Mining Co. 2.2% 403.7 117.4Saudi Electricity Company 2.1% 713.6 49.9Saudi Arabia Fertilizers Co. 2.0% 167.2 16.9Makkah Development Co. 1.7% 108.7 43.4
Source: Tadawul, Bloomberg, AlJazira Capital
Kingdom Holding Co. has the lowest ratio of free-to-issued shares, with just
5.0% of the shares issued being traded in the market.
According to the data, four companies have less than 20.0% of free floats, as government funds hold a substantial portion of STC and Saudi Electricity.

3
Please read Disclaimer on the back
November 2016 Results Summary of Listed Companiesin the Saudi Market3Q2016
© All rights reserved
On a TTM basis Saudi Airlines Catering Co. has the highest return on equity
(RoE) at 48.0%, followed by Jarir Marketing Co. at 46.2%. The top 15
companies have RoE of over 24.2%.
Saudi Airlines Catering Co and Jarir Marketing Co. registered the highest
return on assets (RoA) in the Saudi market at 32.8% and 28.7% on a TTM
basis, followed by Southern Province Cement Co. at 24.5%.
The top 15 companies have RoA of over 14.2%.
Company YTD % P/Bv (x) ROA (%)
Saudi Airlines Catering Co. -26.6 5.6 32.79%Jarir Marketing Co. -43.8 5.5 28.65%Southern Province Cement Co. -19.3 2.4 24.52%The Qassim Cement Co. -29.3 2.6 22.80%Saudi vitrified clay pipes co. -38.6 3.0 21.65%Saudi Cement Co. -21.0 2.6 21.42%Saudia Dairy and Foodstuff Co. 6.2 3.6 20.71%Saudi Ground Services Co. -2.8 3.0 20.45%Arabian Cement -19.4 1.1 16.47%Yanbu Cement Co. -38.5 1.3 16.27%Advanced Petrochemical Co. 24.9 3.0 16.25%Saudi German Hospital - 3.9 15.25%Saudi Company for Hardware -36.9 3.1 14.85%Al Yamamah Steel - 1.8 14.59%Saudi Arabia Fertilizers Co. -23.9 4.0 14.30%
Source: Bloomberg, AlJazira Capital
Company YTD % P/Bv (x) ROE (%)
Saudi Airlines Catering Co. -26.6 5.6 48.03%Jarir Marketing Co. -43.8 5.5 46.23%Al Sagr Co-op Ins -0.5 1.5 36.40%Southern Province Cement Co. -19.3 2.4 32.86%Saudi vitrified clay pipes co. -38.6 3.0 32.43%Bupa Arabia 4.4 5.7 32.28%Saudi Cement Co. -21.0 2.6 28.96%Saudia Dairy and Foodstuff Co. 6.2 3.6 27.45%Herfy Food Services Co -33.4 4.0 27.38%Al Yamamah Steel - 1.8 26.69%Saudi German Hospital - 3.9 25.86%The Qassim Cement Co. -29.3 2.6 25.67%Saudi Ground Services Co. -2.8 3.0 25.57%Advanced Petrochemical Co. 24.9 3.0 24.30%Saudi Company for Hardware -36.9 3.1 24.29%
Source: Bloomberg, AlJazira Capital
Best 15 Companies Best15 CompaniesReturn on Equity (ROE) Return on Assets (ROA)
The overall net earnings of the companies listed on the TASI declined 1.4% YoY to SAR 27.7bn in 3Q2016 from SAR 28.1bn in 3Q2015. Banks and
Petrochemicals accounted for 60.0% of total earnings. SABIC, Saudi Electricity Co., and Al Rajhi Bank were major drivers, accounting for 18.9%, 15.9%, and
7.2% share of earnings, respectively, in 3Q2016.
Earnings (Prior Year TTM) Earnings (Current Year TTM) % YoY (RHS)
-20.0%
-10.0%
0.0%
0
10,000
20,000
30,000
40,000
Q32015/2016 Q42014/2015 Q12015/2016 Q22015/2016
(SA
R M
n) -2.1%
-12.6% -11.4%
-1.4%
Total net profit for listed companies in the Saudi Market
Source: Bloomberg, AlJazira Capital

4
Please read Disclaimer on the back
November 2016 Results Summary of Listed Companiesin the Saudi Market3Q2016
© All rights reserved
h The Saudi market’s net profit declined 1.4% YoY to SAR 27.7 in 3Q2016 from SAR 28.1bn in 3Q2015.
h The market’s earnings per share (EPS) in 3Q2016 stood at SAR 0.53.
h Index heavyweights Banks & Financial Services and Petrochemicals contributed the most to total earnings (36.0% and 24.0%, respectively), while the Media & Publishing was the only sector to post losses.
h The Insurance sector was the best performer in the Saudi market, with a 64.5% YoY increase in net profit at SAR SAR 892.5mn (before ZAKAT) in 3Q2016, compared with a net profit of SAR542.6mn in 3Q2015. This improvement was primarily led by TAWUNIYA Insurance Co, which posted a net profit of SAR 283.2 in 3Q2016 vis-à-vis SAR 226.9 in 3Q2015.
h In 3Q2016, only Insurance sector witnessed YoY growth, while the rest fourteen sectors registered YoY decline in net profit. The combined net profit of the total Saudi stock market declined 0.7% YoY, led by higher weightage of the Banks & Financial Services.
Dec-
15
Jan-
16
Feb-
16
Mar
-16
Apr-1
6
May
-16
Jun-
16
Jul-1
6
Aug-
16
Sep-
16
YTD TASI Index Performance
5,000
5,500
6,000
6,500
7,000
-70.00%-60.00%-50.00%-40.00%-30.00%-20.00%-10.00%
0.00%10.00%20.00%30.00%
Hote
l & T
ouris
m
Med
ia &
Pub
lishi
ng
Mul
ti - I
nves
tmen
ts
Reta
il
Agri.
& F
ood
Tele
com
& IT
Tran
spor
t
Bank
s
Build
ing
& Co
nst.
Cem
ent
Indu
stria
l Inve
stm
ent
Petc
hem
Insu
ranc
e
Real
Est
ate
Ener
gy &
Utili
ties
YTD 2016 Sector Performance
-11.9% YTD
Sector
3Q2015 3Q2016YoY
Change%
3Q2016
Net Profit (SARmn)
EPS(SAR)
Net Profit (SARmn)
EPS(SAR)
Sector profit to Total
Banks & Financial Services 10,497.18 0.63 9,950.51 0.60 -5.2% 36.0%Petrochemicals 6,634.74 0.72 6,627.35 0.71 -0.1% 24.0%Cement 1,096.87 0.60 849.58 0.46 -22.5% 3.1%Retail 711.34 0.67 671.46 0.63 -5.6% 2.4%Energy & Utilities 2,953.49 0.70 4,434.42 1.05 50.1% 16.0%Agri & Food 1,367.39 0.72 1,093.89 0.58 -20.0% 4.0%Telecom & IT 1,891.95 0.54 1,713.56 0.49 -9.4% 6.2%Insurance 542.55 0.43 892.48 0.70 64.5% 3.2%Multi-Investment 348.20 0.09 146.41 0.04 -58.0% 0.5%Industrial Investment 173.64 0.09 71.94 0.04 -58.6% 0.3%Real Estate Development 419.11 0.11 306.29 0.08 -26.9% 1.1%Transport 825.52 1.05 643.66 0.82 -22.0% 2.3%Media & Publishing 15.72 0.10 -104.58 -0.67 - -0.4%Hotel & Tourism 365.16 0.97 276.41 0.74 -24.3% 1.0%Building & Construction 216.76 0.21 87.19 0.09 -59.8% 0.3%Total Saudi Market 28,059.62 0.54 27,660.57 0.53 -1.4% 100.0%
Source: Tadawul, Bloomberg, AlJazira Capital
Sectors Performance

5
Please read Disclaimer on the back
November 2016 Results Summary of Listed Companiesin the Saudi Market3Q2016
© All rights reserved
The Banking sector’s net profit declined 5.2% YoY to SAR 9.9bn in 3Q2016. The sector’s EPS stood at SAR 0.60 per share.
Most banking stocks posted a YoY decrease in net profit, with Saudi Hollandi Bank registering the highest decline(down 46.7% YoY). Heavyweight Al Rajhi
Bank’s net profit rose 16.7% YoY, while National Commercial Bank’s net profit declined 1.6% YoY. Samba Financial Group’s net profit declined 2.2% YoY.
Riyad Bank and SAIB registered the sector’s highest dividend yield at 7.0%.
Key factors that affected the net profit of some companies during 3Q2016 in the sector were:
h Al Rajhi Bank: Net income increased due to an increase in total operating income by 16.7%, this increase was mainly driven by higher net special commission income and an increase in other operating income and fees income from banking services. Furthermore, the total operating expense increased by 26.7%YoY in 3Q2016.
h Bank AlJazira: Net income has decreased by 3% YoY mainly due to increase in operating expenses by 14% YoY. This is primarily due to increase in the net impairment charge for credit losses. For operating income, there is an increase by 8% due to an increase in net trading income, net banking fees and commission income and net exchange income.
h National Commercial Bank (NCB): Net income decreased due to the increase in total operating expenses by 18.7% YoY on account of higher impairment charges on financing and impairment charges and a higher other G&A expenses. On the other hand, total operating income increased by 9.5% YoY due to the increase in net special commission income and the increase in income from FVIS investments in 3Q2016
h Riyad Bank: Net income decreased because of higher total operating expenses by 16.3% YoY, mainly due to higher G&A expenses. The total operating income saw a marginal decline of 0.4% YoY, mainly due to decrease in fee and commission income and gains on non-trading investments.
h Saudi British Bank (SABB): The decrease in income was primarily driven by higher operating expenses which increased by 23.3% YoY mainly due to increase in impairment charge for credit losses and G&A expenses, total operating income slightly decreased by 0.1% YoY due to a decrease in fee and commission income, and trading income.
h Samba Financial Group: Net income decreased due to increase in total operating expenses by 9.4% YoY as a result of increase in provision for credit and increase in G&A expenses. The decrease was offset by increase in total operating income by 1.5% YoY in 3Q2016
Dec-
15
Jan-
16
Feb-
16
Mar
-16
Apr-1
6
May
-16
Jun-
16
Jul-1
6
Aug
-16
Sep
-16
Banking Sector
11,000
12,000
13,000
14,000
15,000
16,000
-30% -23% -16%
-9% -2% 5%
12% 19%
SAIB
Bank
Al
Jazi
ra NC
B
SABB
Arab
N
atio
nal
BSF
Saud
i H
olla
ndi
Sam
ba
Bank
AlB
ilad
Riy
ad
Alin
ma
Al R
ajhi
YTD 2016 Banking Sector
-14.6 YTD
Company Name
3Q2015 3Q2016YoY
Change%
3Q2016
Net Profit (SARmn)
EPS(SAR)
Net Profit (SARmn)
EPS(SAR)
P/E (x) P/Bv (X) D/Y (%)*
Alinma Bank 375.2 0.25 311.6 0.21 -17.0% 12.9 1.1 3.7
Al Rajhi Bank 1,721.0 1.06 2,009.0 1.24 16.7% 11.9 1.9 3.1
NCB 1,994.0 1.00 1,962.0 0.98 -1.6% 9.5 1.5 3.1
Banque Saudi Fransi 1,020.0 0.85 1,010.0 0.84 -1.0% 6.6 0.9 4.9
Riyad Bank 898.5 0.30 729.4 0.24 -18.8% 7.4 0.8 7.0
Saudi British Bank 1,139.5 0.76 994.8 0.66 -12.7% 6.4 0.9 3.7
Saudi Hollandi Bank 493.0 0.43 262.8 0.23 -46.7% 5.5 0.8 1.3
Samba Financial 1,371.0 0.69 1,341.0 0.67 -2.2% 7.6 1.0 4.6
Arab National Bank 764.2 0.76 721.7 0.72 -5.6% 5.5 0.7 6.2
BANK ALBILAD 203.4 0.34 227.8 0.38 12.0% 13.6 1.5 -
SAIB 351.4 0.50 219.4 0.31 -37.6% 6.7 0.6 7.0
Bank AlJazira 166.0 0.42 161.0 0.40 -3.0% 6.6 0.6 -
Total 10,497.2 0.63 9,950.5 0.60 -5.2% 8.5 1.1 4.0Source: Tadawul, Bloomberg, AlJazira Capital
Banking Sector

6
Please read Disclaimer on the back
November 2016 Results Summary of Listed Companiesin the Saudi Market3Q2016
© All rights reserved
The net profit of Saudi Arabia’s Petrochemical sector slightly declined by 0.1% YoY to SAR 6,627bn in 3Q2016 from SAR 6,635bn in 3Q2015. Index
heavyweight Saudi Basic Industries Corp and Saudi Arabia Fertilizers Co. reported a decline of 6.8% YoY and 68.0% YoY , respectively. The sector’s EPS
stood at SAR 0.71 per share.
Saudi Arabia Fertilizers, Saudi International Petrochemical Co. (SIPCHEM), and Rabigh Refining Co. were the worst performers in terms of YoY decline in net
profit; SAFCO net profit dropped to SAR 181.4mn, while SIPCHEM and Rabigh Refining recorded a loss of SAR 58.9 and 216.7mn respectively.
Saudi Arabia Fertilizers Company and Advanced Petrochemical Company had a high dividend yield in the sector at 7.2% and 6.5%, respectively.
The following factors impacted the net profit of some companies in the sector during 3Q2016:
h Advanced: The company’s net profit declined 19.7% YoY to SAR 188.4mn in 3Q2016, mainly due to a decrease in polypropylene market prices.
h Kayan: Kayan posted a net profit of SAR 156.3mn in 3Q2016 compared with a net loss of SAR 13.8 in 3Q2015 due to an increase in the quantities produced and sold, improved operating performance and lower cost feedstock despite the decline in average selling in most products and a higher financial expenses in 3Q2016.
h Petro Rabigh: The company’s net loss declined 52.8% YoY to SAR 217.0 in 3Q2016, the drop in net loss primarily to a higher crude oil prices compared to the huge decline for the same period of the previous year, which led to a loss in the inventory carry-over rate.
h SABIC: SABIC’s net profit fell 6.8% YoY to SAR 5,224.3mn 3Q2016 the decrease in net income is attributable to lower average sales prices and lower sales quantity and increase in the Zakat provision.
h SAFCO: SAFCO’s net profit declined 68.0% YoY to SAR 181.4mn in 3Q2016 due to a decline in selling prices for the company’s products and rising feedstock and electricity costs.
h SIIG: The company’s net profit dropped 21.5% YoY to SAR 162.6mn in 3Q2016.due to a decrease in SIIGs portion of the National Petrochemical Company profits to SAR96mn in the current quarter compared to SAR161mn in 3Q2015.
h Yansab: Yansab’s net profit increased 101.4% YoY to SAR 607.6mn in 3Q2016, driven by an increase in sales volumes and decrease in cost of sales .
Company Name
3Q2015 3Q2016YoY
Change%
3Q2016
Net Profit (SARmn)
EPS(SAR)
Net Profit (SARmn)
EPS(SAR)
P/E TTM (x)
P/Bv (X)
D/Y (%)*
Sahara Petrochemical 121.0 0.28 105.3 0.24 -12.9% 20.0 0.8 4.9Yansab 301.7 0.54 607.6 1.08 101.4% 14.7 1.7 5.4Saudi Basic Industries 5,603.5 1.87 5,224.3 1.74 -6.8% 15.1 1.6 5.9Advanced Petrochem. 234.2 1.19 188.4 0.96 -19.5% 10.8 3.0 6.5Alujain Corporation 45.6 0.66 36.2 0.52 -20.6% 8.6 0.9 -National Petrochem. 321.1 0.67 191.2 0.40 -40.5% 9.3 1.2 -SIIG 207.1 0.46 162.6 0.36 -21.5% 10.3 0.8 -SAFCO 566.1 1.36 181.4 0.44 -68.0% 16.9 4.0 7.2SIPCHEM 71.6 0.20 (58.9) -0.16 - 27.3 0.8 -Rabigh Refining (460.1) -0.53 (216.7) -0.25 52.9% - 1.0 -National Industrialization (296.3) -0.44 122.2 0.18 - - 1.1 -Saudi Kayan (13.8) -0.01 156.3 0.10 - - 0.8 -Methanol Chemicals (42.9) -0.36 (39.9) -0.33 7.0% - 0.5 -Nama Chemicals Co. (24.0) -0.19 (32.6) -0.25 -36.1% - 0.6 -Total 6,634.7 0.72 6,627.4 0.71 -0.1% 18.9 1.5 6.0
Source: Tadawul, Bloomberg, AlJazira Capital
Petrochemical Sector
Dec-
15
Jan-
16
Feb-
16
Mar
-16
Apr-1
6
May
-16
Jun-
16
Jul-1
6
Aug-
16
Sep-
16
Petrochemicals Sector
3,0003,2003,4003,6003,8004,0004,2004,4004,6004,8005,000
SAFC
O
Nam
a
Petro
Rab
igh
SIPC
HEM
Met
hano
l
Aluj
ain
Nat
iona
l
Saud
i Kay
an
SIIG
SABI
C
Saha
ra
Adva
nced
TASN
EE
Yanb
u
-40%
-20%
0%
20%
40%
60%
% YTD 2016 Petrochemical Sector
9.6% YTD

7
Please read Disclaimer on the back
November 2016 Results Summary of Listed Companiesin the Saudi Market3Q2016
© All rights reserved
The Cement sector’s net profit decreased 22.5% YoY to SAR 849.6mn in 3Q2016 from SAR 1,096.9mn in 3Q2015. The sector’s EPS stood at SAR 0.46 per
share.
12 companies in this sector registered a decline in profit. Najran Cement Company’s profit (down 52.1% YoY) declined the most, followed by Northern
Region Cement (down 42.8% YoY). However, Hail and Arabian Cement showed an increase of 15.3% and 8.6% YoY, respectively.
Key factors that affected the net profit of some companies in the sector during 3Q2016 were:
h Arabian Cement: The company’s net profit increased 8.6% YoY to SAR 97.1 in 3Q2016 due to an increase of group share in the results of associate company by SAR 1.0mn, and an increase of other net revenues by SAR 5.9mn in 3Q2016.
h City Cement: City Cement’s net profit declined 32.6% YoY to SAR 31.9mn in 3Q2016 due to a high cost of sales and Zakat in addition to other expenses despite the increase in sales and a decrease in selling expenses and general and administrative expenses.
h Hail Cement: The company’s net profit increased 15.3% YoY to SAR 20.1mn in 3Q2016 due to unrealized investment loss recognized during same quarter last year.
h Qassim Cement: Qassim Cement’s net profit decreased 38.8% YoY to SAR 70.4mn in 3Q2016 due to a decline in sales value and volume driven by lower demand of cement, in addition to increase in cost of goods sold due to increase in power and fuel prices and decrease in other income.
h Saudi Cement: The company’s net profit fell 3.8% YoY to SAR 200mn in 3Q2016 due to a decrease in sales, increase in Selling and Distribution Expenses and Decrease in other Income.
h Tabuk Cement: Tabuk Cement’s net profit dropped 14.1% YoY to SAR 7.9mn in 3Q2016 due to lower average selling price and higher cost of sales and the impact of rising energy prices and the decline in other revenue.
h Yamama Cement: The company’s net profit fell 41.1% YoY to SAR 56.3mn in 3Q2016 due to high cost of goods sold as a result of an increase the price of fuel and an increase in depreciation of fixed assets in 3Q2016.
Company Name
3Q2015 3Q2016
YoY Change%
3Q2016
Net Profit (SARmn)
EPS(SAR)
Net Profit (SARmn)
EPS(SAR)
P/E TTM (x)
P/Bv (X)
D/Y (%)*
Southern Province 202.2 1.44 173.3 1.24 -14.3% 7.5 2.4 10.6Saudi Cement Co. 207.6 1.36 200.4 1.31 -3.5% 8.5 2.6 11.5Hail Cement Co. 17.5 0.18 20.1 0.21 15.3% 8.8 0.9 10.2City Cement Co. 47.4 0.25 31.9 0.17 -32.6% 9.0 1.0 12.8Arabian Cement Co. 89.5 0.89 97.2 0.97 8.6% 6.2 1.1 11.8Al Jouf Cement Co. 18.6 0.14 14.9 0.11 -20.0% 12.5 0.6 -Tabuk Cement Co. 9.2 0.10 7.9 0.09 -14.1% 13.5 0.9 8.0Northern Region 52.6 0.29 30.1 0.17 -42.8% 9.5 0.9 9.8Qassim Cement 115.1 1.28 70.4 0.78 -38.8% 8.7 2.6 11.2Yanbu Cement Co. 144.6 0.92 93.3 0.59 -35.5% 6.0 1.3 16.9Yamamah Saudi 95.5 0.47 56.3 0.28 -41.1% 6.3 0.9 13.3Eastern Province 66.7 0.78 42.7 0.50 -36.0% 6.7 0.9 10.9Najran Cement 32.1 0.19 15.4 0.09 -52.1% 9.2 0.8 11.2Umm Al-Qura Cement (1.7) -0.03 (4.3) -0.08 -146.0% - 1.5 -
Total 1,096.9 0.60 849.6 0.46 -22.5% 7.8 1.4 12.0Source: Tadawul, Bloomberg, AlJazira Capital
Cement Sector
Dec
-15
Jan-
16
Feb-
16
Mar
-16
Apr-1
6
May
-16
Jun-
16
Jul-1
6
Cement Sector
2,500
3,000
3,500
4,000
4,500
5,000
Aug-
16
Sep-
16
Yam
amah
Qas
sim
Um
m A
l Al J
ouf
No
rth
ern
Naj
ran
Hai
l E
aste
rn
Yan
bu Tab
uk
Sau
di
Ara
bia
n
City
So
uth
ern
٪٦٠-
٪٥٠-
٪٤٠-
٪٣٠-
٪٢٠-
٪١٠-
٪٠
YTD 2016 Cement Sector
-24.3% YTD

8
Please read Disclaimer on the back
November 2016 Results Summary of Listed Companiesin the Saudi Market3Q2016
© All rights reserved
Saudi Arabia’s Retail sector recorded a 5.61% YoY decline in net profit in 3Q2016. Net profit fell to SAR 671.5mn in 3Q2016 from SAR 711.3mn in 3Q2015.
The sector’s EPS stood at SAR 0.63 per share.
Heavyweight Jarir dominated the sector earnings also, the net profit was up 0.7% YoY to SAR 220mn in 3Q2016. However, another heavyweight Fawaz
Abdulaziz AlHokair Company’s net profit decline 35.6% YoY to SAR 58.7mn in 3Q2016. Dallah Healthcare Holding Company reported the highest YoY
growth in earnings at SAR 61.1mn in 3Q2016.
In terms of dividend yield, Jarir Marketing Co. topped the sector with a 7.8% yield.
The following factors affected the net profit of some of the companies in the sector during 3Q2016:
h Aldrees: Aldrees’ net income decreased 42.7% YoY to SAR 18.5mn in 3Q2016 due to a fall of transport sector sales and Increase in cost of sales and operating expenses.
h Al Othaim: The company’s net income declined 1.2% YoY to SAR 36.6mn in 3Q2016 due to increased S&D, G&A.
h Dallah Healthcare: Dallah Healthcare’s net income rose 128.0% YoY to SAR 61.1mn in 3Q2016, led by an increase in sales volume, rise in the number of inpatients and outpatients, other revenues increased as a result of realization of gains from sale of some investments.
h Mouwasat Medical: The company’s net income increased 17.2% YoY to SAR 50.3mn in 3Q2016, due to the increase in revenue as a result of growth so contributed by Riyadh branch and with expansion in sub specialty clinics operations in particular.
h Jarir: Jarir’s net income increased 0.7% YoY to SAR 220mn in 3Q2016 due to a decrease in non operating expenses.
Company Name
3Q2015 3Q2016YoY
Change%
3Q2016
Net Profit (SARmn)
EPS(SAR)
Net Profit (SARmn)
EPS(SAR)
P/E TTM (x)
P/Bv (X)
D/Y (%)*
Dallah Healthcare 26.8 0.45 61.1 1.04 128.0% 25.8 3.5 1.8
National Medical Care 25.5 0.57 29.3 0.65 15.0% 19.2 3.0 1.2
Saudi Automotive 6.5 0.12 7.1 0.13 10.2% 34.9 0.9 4.3
Mouwasat Medical 42.9 0.86 50.3 1.01 17.2% 26.4 5.2 1.6
United Electronics Co. 12.2 0.34 7.3 0.20 -40.2% - 1.2 -
Saudi Co.for Hardware 18.5 0.77 20.4 0.85 10.1% 12.5 3.1 4.3
AlHokair Co. 91.2 0.43 58.7 0.28 -35.6% 7.9 1.7 -
Abdullah Al Othaim 37.1 0.82 36.6 0.81 -1.2% 16.6 3.3 2.4
Lazurde Co. 25.0 0.58 0.3 0.01 -98.6% 6.6 1.4 -
Middle East Healthcare 90.8 0.99 92.0 1.00 1.4% 14.0 3.9 3.5
Jarir Marketing Co. 218.5 2.43 220.0 2.44 0.7% 11.1 5.5 7.8
Saudi Marketing Co. 29.0 0.64 23.2 0.52 -19.9% 10.1 1.7 -
National Agriculture 1.4 0.14 1.3 0.13 -6.5% 28.1 1.2 2.4
Aldrees Co. 32.3 0.81 18.5 0.46 -42.7% 10.1 2.0 6.5
Al Hammadi 27.7 0.23 21.5 0.18 -22.5% 36.1 2.8 2.4
Alkhaleej Co. 16.5 0.41 20.5 0.51 24.4% 14.5 1.2 6.5
Fitaihi Holding Group 9.7 0.18 3.3 0.06 -65.8% - 0.8 -
Total 711.3 0.67 671.5 0.63 -5.6% 15.3 2.9 4.5Source: Tadawul, Bloomberg, AlJazira Capital
Retail Sector
Dec-
15
Jan-
16
Feb-
16
Mar
-16
Apr-1
6
May
-16
Jun-
16
Jul-1
6
Aug-
16
Sep-
16
Retail Sector
7,0008,0009,000
10,00011,00012,00013,000
-50%
-30%
-10%
10%
30%
AlH
okai
r Ja
rir
Extra
Al
khal
eej
SASC
O
Aldr
ees
Al
Ham
mad
i TH
IMAR
Sa
udi M
arke
ting
Saud
i Com
pany
Fi
taih
i Hol
ding
M
ouw
asat
Al
Oth
aim
D
alla
h
Car
e La
zurd
e Sa
udi G
erm
an
YTD 2016 Retail Sector
-34.0% YTD

9
Please read Disclaimer on the back
November 2016 Results Summary of Listed Companiesin the Saudi Market3Q2016
© All rights reserved
Net earnings of Saudi Arabia’s Agriculture and Food sector decreased 20.0% YoY to SAR 1093.9mn in 3Q2016 from SAR 1,367.4mn in 3Q2015. The sector’s EPS stood at SAR 0.58 per share.
The sector’s weak performance was due to the decline in the net profit of index heavyweights Savola Group (down 53.3% YoY) and Saudi Airlines Catering Company (down 9.1% YoY). This decline in the sector’s net earnings was partially offset by stable YoY performance of another major player Almarai Co. (up 10.0% YoY).
Saudi Airlines Catering Co. had the highest dividend yield (7.8%) in the sector.
The following factors affected the net profit of some companies in the sector during 3Q2016:
h Almarai: Almarai’s net profit rose 10.0% YoY to SAR 654.6mn in 3Q2016, driven by The growth in Net Income for the third quarter of 10.0% YoY as compared to the corresponding quarter of the previous year is due to a growth in Sales of 2.5%, as a result of continuous growth in the main segments from Dairy & Juice by 1.4% YoY, Bakery by 17.4% YoY and a decrease in Poultry by 9.4% YoY.
h Saudi Airlines Catering: The company’s net income declined 9.1% YoY to SAR 149.6mn in 3Q2016. Total revenue increased by 2.3% with the related growth attributed to Business Lounge (+16.4%) and to Non airline revenue (+12.0%). Inflight catering revenue decreased by 1.1% mainly due to an end of a contract to export frozen meals.
h SADAFCO: SADAFCO’s net profit surged 7.6% YoY to SAR 73.3mn in 3Q2016, due to increase in net deposit income by SAR 2mn, and 13.5% decrease in cost of sales.
h Savola: The company’s net profit decreased 53.3% YoY to SAR 173.4mn in 3Q2016, mainly due to lower gross profit, higher operating expenses, increased financial charges, higher zakat & tax despite decrease in share of minority and higher share of income from associates.
Company Name
3Q2015 3Q2016YoY
Change%
3Q2016
Net Profit (SARmn)
EPS(SAR)
Net Profit (SARmn)
EPS(SAR)
P/E TTM (x)
P/Bv (X) D/Y(%)*
Qassim Agriculture Co. -4.2 -0.08 0.1 0.00 - 11.9 1.0 -SADAFCO 68.1 2.10 73.29 2.22 7.6% 13.2 3.6 3.4Wafrah for Industry -5.5 -0.27 -9.3 -0.47 -69.7% - 1.6 -Halwani Bros 27.4 0.96 22.5 0.79 -17.9% 13.1 2.4 4.9Almarai Company 595.1 0.74 654.6 0.82 10.0% 23.1 3.8 1.5Al-Jouf Agriculture 43.4 1.45 33.7 1.12 -22.2% 8.8 1.0 3.6Herfy Food Services 56.7 1.23 58.8 1.27 3.9% 15.0 4.0 4.5NADEC 45.7 0.54 30.1 0.36 -34.0% 11.3 1.2 2.4Jazan Development 7.2 0.14 6.5 0.13 -10.4% 16.8 0.7 -Anaam International 10.5 0.53 1.9 0.10 -81.6% 11.6 1.2 -Saudi Airlines Catering 164.5 2.01 149.6 1.82 -9.1% 11.4 5.6 7.8Savola Group 371.6 0.70 173.4 0.32 -53.3% 13.6 1.6 4.0SHADCO 0.6 0.07 -5.5 -0.73 - - 3.0 -Tabuk Agriculture 3.6 0.08 -12.8 -0.28 - - 0.7 5.8Saudi Fisheries Co. -16.9 -0.32 -9.5 -0.18 43.9% - 2.7 -Bishah Agriculture -0.3 -0.06 -0.4 -0.08 -39.9% - - -Total 1367.4 0.72 1093.9 0.58 -20.0% 17.7 2.7 3.2
Source: Tadawul, Bloomberg, AlJazira Capital
Agriculture & Food Industries Sector
Dec-
15
Jan-
16
Feb-
16
Mar
-16
Apr-1
6
May
-16
Jun-
16
Jul-1
6
Aug-
16
Sep-
16
Agri & Food Sector
5,5006,0006,5007,0007,5008,0008,5009,0009,500
Jaza
n D
ept. Sa
vola
Ash-
Shar
qiya
h
Her
fy F
ood
Saud
i Airl
ines
Cat
.
NAD
EC
Hal
wan
i Bro
s
Saud
i Fis
herie
s
Anaa
m
Qas
sim
Agr
i Al-J
ouf A
gri
Alm
arai
Waf
rah f
or In
dustr
y and
Bish
ah A
gri
Tabu
k Ag
ri SAD
AFC
O
-75%
-50%
-25%
0%
25%YTD 2016 Agriculture & Food Industries Sector
-22.6% YTD

10
Please read Disclaimer on the back
November 2016 Results Summary of Listed Companiesin the Saudi Market3Q2016
© All rights reserved
Net earnings of Saudi Arabia’s Telecom sector declined 9.4% YoY to SAR 1,713.6mn in 3Q2016
from SAR 1,892.0mn in 3Q2015. The sector’s EPS stood at SAR 0.49 per share. Saudi Zain Co.
was the worst performer during the quarter, reporting a net loss of SAR 266.7mn in 3Q2016.
Key factors that affected the net profit of major companies in the sector during 3Q2016 were:
h Etihad Etisalat: The company posted a net loss of SAR 158.3mn in 3Q2016 compared with a loss of SAR 158.2mn in 3Q2015, largely led by the decrease in gross profit by SAR 284 million, which was offset by the decrease in operating expenses reflecting continuous cost optimization efforts.
h Saudi Zain: The company’s net loss increased to SAR 266.7mn in 3Q2016 from a loss of SAR 222.9mn in 3Q2015, mainly due to revenues decreased by 7% YoY reaching SAR 1,634mn which is driven by a decrease in MTR, biometric fingerprint requirement, slow summer season and the decline in number of pilgrims; Gross profits slightly decreased by 0.15% YoY reaching SAR 1,061 million.
h Saudi Telecom: Saudi Telecom’s net profit decreased 7.5% YoY to SAR 2,148mn in 3Q2016 due to SAR1,160mn increase in cost of services, and SAR120mn increase in operating expenses during 3Q2016, and SAR192mn decrease in (Losses from investments accounted for under equity method) during the 3rd quarter compared to the same quarter last year
Company Name
3Q2015 3Q2016YoY
Change%
3Q2016
Net Profit (SARmn)
EPS(SAR)
Net Profit (SARmn)
EPS(SAR)
P/E TTM (x)
P/Bv (X) D/Y (%)*
Saudi Telecom 2,322.0 1.16 2,148.0 1.07 -7.5% 13.6 1.9 6.9Saudi Zain -222.9 -0.38 -266.7 (0.46) -19.6% - 1.0 -Etihad Atheeb -48.9 -0.31 - 9.00 - - 1.2 -Etihad Etisalat Co -158.3 -0.21 -167.7 (0.22) -6.0% - 0.9 -
Total 1,892.0 0.54 1,713.6 0.49 -9.4% 18.8 1.7 6.9Source: Tadawul, Bloomberg, AlJazira Capital
Telecom.& I T Sector
Dec-
15
Jan-
16
Feb-
16
Mar
-16
Apr-1
6
May
-16
Jun-
16
Jul-1
6
Aug-
16
Sep-
16
Telecom & IT Sector
1,0001,1001,2001,3001,4001,5001,6001,7001,800
Athe
eb T
elec
om
Mob
ile T
elec
om
Mob
ily
STC
-50%
-40%
3-0%
-20%
-10%
0%
YTD 2016 Telecom.& I T Sector
-20.2% YTD

11
Please read Disclaimer on the back
November 2016 Results Summary of Listed Companiesin the Saudi Market3Q2016
© All rights reserved
The Insurance sector’s net profit increased 64.5% YoY to SAR 892.5mn in 3Q2016 from SAR 542.6mn in 3Q2015. The sector posted EPS of SAR 0.70 per
share during the quarter.
Sector heavyweights, Bupa Arabia for Cooperative Insurance’s net profit declined 8.0% YoY to 260.3mn in 3Q2016 from SAR 285.7mn in 3Q2015, while
The Company for Cooperative Insurance (TAWUNIYA) reported a net profit of SAR 283.2mn in 3Q2016. With 21 of the 35 companies in the sector
reporting gains, the sector’s overall performance was very strong.
In terms of YoY gain in net profit, Trade Union Company for Co- operative Insurance (up 695.3% YoY), Salama Co-operative Insurance Co (up 506.9%
YoY), and Arabian Shield Cooperative Insurance Company (up 193.9% YoY), were the best performers.
The following factors led to YoY fluctuations in the net profit of some of the companies in the sector during 3Q2016:
h Tawuniya: Tawuniya’s net profit surged 24.8% YoY to SAR 283.2mn in 3Q2016, driven by insurance operation surplus, which grew 13.53% YoY due to a 22.3% YoY increase in premiums earned.
h Bupa Arabia: The company’s net profit declined 8.9% YoY to SAR 260.3mn in 3Q2016 due to a an increase in net claims incurred which has resulted in a decrease in net underwriting result by 11% YoY decrease of SAR 68,355.
Company Name
3Q2015 3Q2016YoY
Change%
3Q2016
Net Profit (SARmn)
EPS(SAR)
Net Profit (SARmn)
EPS(SAR)
P/E TTM (x)
P/Bv (X) D/Y(%)
Saudi Indian Company -13.6 -0.66 8.7 0.42 - - 2.6 -Al Sagr Co-op Ins 30.6 1.22 26.7 1.07 -12.9% 3.9 1.5 6.4Arabia Insurance Coo -19.8 -0.75 -1.7 -0.06 91.4% - 1.0 -Arabian Shield Co-op 6.4 0.32 18.7 0.94 193.9% 8.3 1.5 -Saudi Arabian Co-op 11.2 0.45 17.4 0.69 55.8% 8.6 1.3 -United Cooperative 12.1 0.25 26.1 0.53 116.2% - 1.7 -Buruj Co-op Ins 8.9 0.36 4.0 0.16 -54.6% 10.1 1.6 -Al-Rajhi Company 14.6 0.37 29.6 0.74 102.5% 19.6 2.5 -Salama Cooperative 1.4 0.06 8.7 0.35 506.9% - 1.4 -Ace Arabia -0.8 -0.08 9.5 0.95 - 15.9 1.6 -Allied Cooperative Ins 4.0 0.20 4.7 0.24 18.3% 21.3 2.1 -Al Alamiya 11.2 0.28 12.2 0.31 8.7% 16.2 2.3 -Solidarity Saudi -4.6 -0.08 14.1 0.25 - 19.8 1.8 -Aljazira Takaful 4.3 0.12 6.4 0.18 47.2% 35.4 2.1 2.3AXA Cooperative 4.5 0.10 11.2 0.25 150.9% 19.7 1.2 -TAWUNIYA 226.9 2.27 283.2 2.83 24.8% 14.1 3.4 1.2Allianz Saudi Fransi 5.5 0.28 6.3 0.32 14.5% 17.1 2.0 -Alahli Takaful Co. 6.3 0.38 7.1 0.43 13.4% 16.7 2.4 1.7Bupa Arabia 285.8 3.57 260.4 3.25 -8.9% 8.6 5.7 1.7Sanad Insurance -4.9 -0.25 -4.2 -0.21 15.8% - - -SABB Takaful 6.4 0.19 2.8 0.08 -56.8% - 1.9 -Trade Union Co-op Ins 3.4 0.12 27.2 0.99 695.3% 33.0 1.3 -Amana Cooperative 2.6 0.08 2.1 0.07 -16.5% 22.4 2.2 -Gulf General Co-op -5.3 -0.26 7.0 0.35 - - 1.4 -Wataniya Insurance 3.9 0.19 8.1 0.40 107.5% - 2.3 -MEDGULF 51.8 0.52 60.1 0.60 15.9% - 2.0 -Malath Co-op Ins 19.2 0.64 14.5 0.48 -24.7% - 2.0 -Saudi Re -57.2 -0.57 2.7 0.03 - - 0.6 -Al-Ahlia Insurance Co. -17.5 -0.55 -8.6 -0.27 50.7% - 1.5 -Saudi Enaya -18.8 -0.94 -6.7 -0.34 64.1% - 1.4 -Alinma Tokio Marine -7.2 -0.16 -1.1 -0.02 84.7% - 2.3 -Gulf Union Co-op Ins 7.2 0.33 -0.2 -0.01 - 8.9 1.5 -Saudi United -18.6 -0.46 40.0 1.00 - 15.3 1.8 -Weqaya Takaful -9.7 -0.48 - - - -MetLife AIG ANB -7.7 -0.22 -4.2 -0.12 45.5% - 2.7 -Total 542.6 0.43 892.5 0.70 64.5% 17.8 2.6 1.7
Source: Tadawul, Bloomberg, AlJazira Capital
Insurance Sector
Dec-
15
Jan-
16
Feb-
16
Mar
-16
Apr-1
6
May
-16
Jun-
16
Jul-1
6
Aug-
16
Sep-
16
Insurance Sector
800
900
1,000
1,100
1,200
1,300
1,400
Wat
aniy
a In
sura
nce
Al A
lam
iya
Insu
ranc
e M
alat
h M
etLi
fe
Enay
a In
sura
nce
Trad
e U
nion
SA
BB T
akaf
ul
ACE
Insu
ranc
e M
edgu
lf
Gul
f Gen
eral
Al
lianz
Al
inm
a To
kio
AL
AHLI
TAK
AFU
L Al
jazi
ra T
akaf
ul
Rei
nsur
ance
Ar
abia
n Sh
ield
-80%
-60%
-40%
-20%
0%
AC
IG
AX
A In
sura
nce
SA
ICO
SA
LAM
A
Gul
f Uni
on
Weq
aya
San
ad In
sura
nce
Al-A
hlia
Al-R
ajhi
Insu
ranc
e
Uni
ted
Ass
ur.
BU
RU
J In
sura
nce
Bup
a In
sura
nce
Coo
pera
tive
Insu
ranc
e
Am
ana
Ara
bia
Sol
idar
ity T
akaf
ul
WA
FA In
sura
nce
WA
LAA
Al S
agr I
nsur
ance
-60%
-40%
-20%
0%
20%
40%
60%
% YTD 2016 Insurance Sector
% YTD 2016 Insurance Sector
-12.4% YTD
12
Please read Disclaimer on the back
November 2016 Results Summary of Listed Companiesin the Saudi Market3Q2016
© All rights reserved
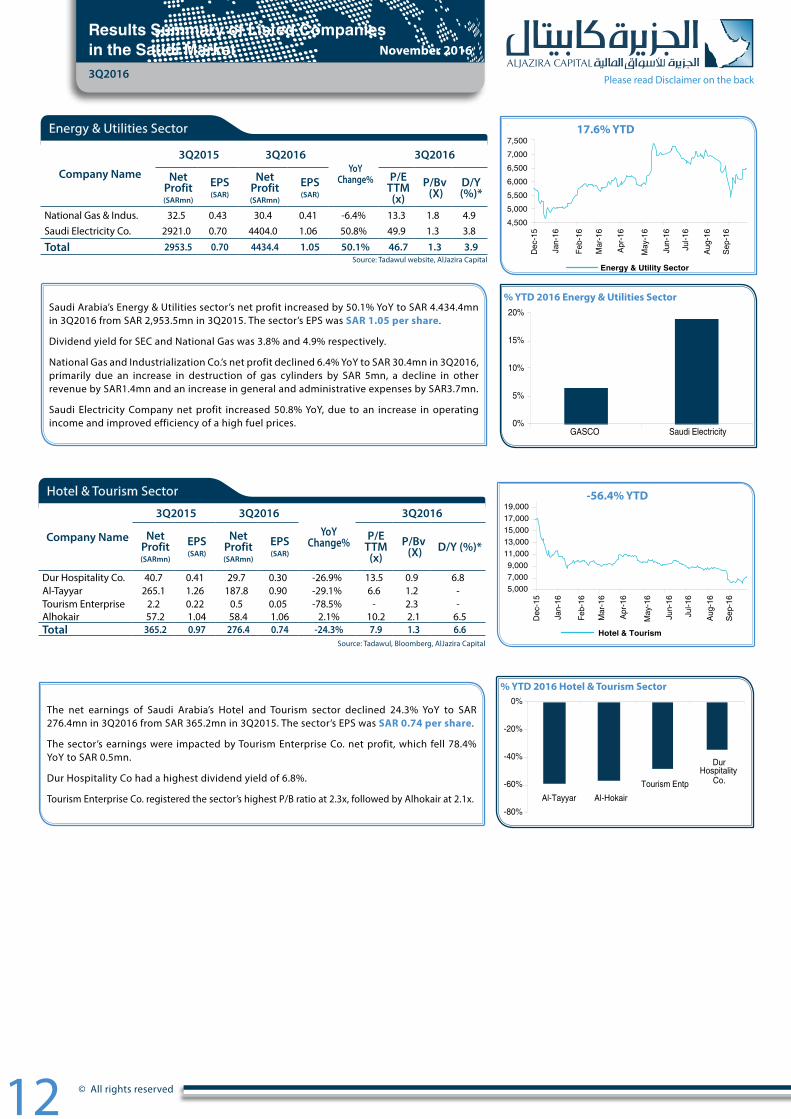
The net earnings of Saudi Arabia’s Hotel and Tourism sector declined 24.3% YoY to SAR 276.4mn in 3Q2016 from SAR 365.2mn in 3Q2015. The sector’s EPS was SAR 0.74 per share.
The sector’s earnings were impacted by Tourism Enterprise Co. net profit, which fell 78.4% YoY to SAR 0.5mn.
Dur Hospitality Co had a highest dividend yield of 6.8%.
Tourism Enterprise Co. registered the sector’s highest P/B ratio at 2.3x, followed by Alhokair at 2.1x.
Company Name
3Q2015 3Q2016
YoY Change%
3Q2016
Net Profit (SARmn)
EPS(SAR)
Net Profit (SARmn)
EPS(SAR)
P/E TTM (x)
P/Bv (X) D/Y (%)*
Dur Hospitality Co. 40.7 0.41 29.7 0.30 -26.9% 13.5 0.9 6.8Al-Tayyar 265.1 1.26 187.8 0.90 -29.1% 6.6 1.2 -Tourism Enterprise 2.2 0.22 0.5 0.05 -78.5% - 2.3 -Alhokair 57.2 1.04 58.4 1.06 2.1% 10.2 2.1 6.5Total 365.2 0.97 276.4 0.74 -24.3% 7.9 1.3 6.6
Source: Tadawul, Bloomberg, AlJazira Capital
Hotel & Tourism Sector
Al-Tayyar Al-Hokair Tourism Entp
Dur Hospitality
Co.
-80%
-60%
-40%
-20%
0%
Hotel & Tourism
Dec-
15
Jan-
16
Feb-
16
Mar
-16
Apr-1
6
May
-16
Jun-
16
Jul-1
6
Aug-
16
Sep-
16 5,000
7,0009,000
11,00013,00015,00017,00019,000
% YTD 2016 Hotel & Tourism Sector
-56.4% YTD
Saudi Arabia’s Energy & Utilities sector’s net profit increased by 50.1% YoY to SAR 4.434.4mn in 3Q2016 from SAR 2,953.5mn in 3Q2015. The sector’s EPS was SAR 1.05 per share.
Dividend yield for SEC and National Gas was 3.8% and 4.9% respectively.
National Gas and Industrialization Co.’s net profit declined 6.4% YoY to SAR 30.4mn in 3Q2016, primarily due an increase in destruction of gas cylinders by SAR 5mn, a decline in other revenue by SAR1.4mn and an increase in general and administrative expenses by SAR3.7mn.
Saudi Electricity Company net profit increased 50.8% YoY, due to an increase in operating income and improved efficiency of a high fuel prices.
Company Name
3Q2015 3Q2016YoY
Change%
3Q2016
Net Profit (SARmn)
EPS(SAR)
Net Profit (SARmn)
EPS(SAR)
P/E TTM (x)
P/Bv (X)
D/Y (%)*
National Gas & Indus. 32.5 0.43 30.4 0.41 -6.4% 13.3 1.8 4.9Saudi Electricity Co. 2921.0 0.70 4404.0 1.06 50.8% 49.9 1.3 3.8
Total 2953.5 0.70 4434.4 1.05 50.1% 46.7 1.3 3.9Source: Tadawul website, AlJazira Capital
Energy & Utilities Sector
Dec-
15
Jan-
16
Feb-
16
Mar
-16
Apr-1
6
May
-16
Jun-
16
Jul-1
6
Aug-
16
Sep-
16
Energy & Utility Sector
4,5005,0005,5006,0006,5007,0007,500
GASCO Saudi Electricity 0%
5%
10%
15%
20%% YTD 2016 Energy & Utilities Sector
17.6% YTD

13
Please read Disclaimer on the back
November 2016 Results Summary of Listed Companiesin the Saudi Market3Q2016
© All rights reserved
The net earnings of Saudi Arabia’s Industrial Investment sector declined 58.6% YoY to SAR 71.9mn in 3Q2016 from SAR 173.6mn in 3Q2015. The sector’s
EPS for the quarter was SAR 0.04 per share.
The sector was impacted by index heavy weight Shaker Company’s net profit, which declined 94.9% YoY to SAR 2.4mn in 3Q2016 from SAR 46.2mn in
3Q2105.
Saudi Chemical Company had the sector’s highest dividend yield at 7.0%.
Key factors that affected the net profit of some companies in the sector during 3Q2016 were:
h Al Abdullatif Industrial Investment Co.: The company’s net profit fell 94.5% YoY to SAR 1.5mn in 3Q2016 due to a decline in sales, rise in cost of sales, and an increase in general & administrative expenses.
h MAADEN: MAADEN’s net profit increased 4.6% YoY to SAR 83.6mn in 3Q2016 due to a 24% drop in general and administrative expenses and 18% decline in selling, marketing and logistic expenses. Net income benefited from short term investments which increased by 514%.
h Saudi Chemical: The company’s net profit fell 43.4% YoY to SAR 20.2mn in 3Q2016, led by a decrease in sales and to the increase in expenses resulted mainly from one subsidiary since its plant is still in perpetrating stage.
h Saudi Paper: Saudi Paper incurred a net loss of SAR 20.7mn in 3Q2016, mainly due to a decrease in sales and export sales.
Company Name
3Q2015 3Q2016
YoY Change%
3Q2016
Net Profit (SARmn)
EPS(SAR)
Net Profit (SARmn)
EPS(SAR)
P/E TTM (x)
P/Bv (X) D/Y(%)*
Middle East Paper 9.6 0.19 -2.1 -0.04 - 5.7 0.8 3.9Basic Chemical 2.3 0.08 6.6 0.24 186.6% 19.6 1.9 3.2MAADANIYAH 8.9 0.32 2.0 0.07 -78.1% 15.5 1.2 2.9Astra Indust.Group 9.5 0.12 1.4 0.02 -85.0% - 0.7 -FIPCO 4.7 0.41 0.2 0.01 -96.8% 23.6 1.6 -The National Glass 6.3 0.21 3.9 0.13 -38.3% 13.7 0.8 4.9Saudi Chemical Co. 35.8 0.57 20.2 0.32 -43.4% 9.4 1.1 7.0Shaker 46.2 0.73 2.4 0.04 -94.9% 8.0 0.7 -Takween Advanced -2.3 -0.02 5.1 0.05 - - 0.9 -Saudi Arabian Mining 79.9 0.07 83.6 0.07 4.6% - 1.6 -AlAbdulllatif 27.6 0.34 1.5 0.02 -94.5% 14.7 0.8 2.5Saudi Pharmaceutical 29.2 0.24 6.8 0.06 -76.7% 20.6 1.3 3.3Saudi Industrial Export 1.9 0.18 -2.5 -0.23 - - 2.3 -Saudi Paper -71.1 -1.58 -20.8 -0.46 70.8% - 0.7 -Al Sorayai -14.9 -0.40 -36.3 -0.97 -144.3% - 0.6 -Total 173.6 0.09 71.9 0.04 -58.6% 59.6 1.4 5.3
Source: Tadawul website, AlJazira Capital
Industrial Investment Sector
Industrial Investment Sector
Dec-
15
Jan-
16
Feb-
16
Mar
-16
Apr-1
6
May
-16
Jun-
16
Jul-1
6
Aug-
16
Sep-
16 4,500
5,0005,5006,0006,5007,0007,500
AlAb
dulla
tif
Takw
een
Saud
i Pap
er
AlSo
raya
i
Mid
dle
East
Pap
er C
o.
Saud
i Che
mic
al
Shak
er
Zouj
aj
Astra
Indu
stria
l
Maa
dani
yah
SPIM
ACO
SIEC
O
Maa
den
FIPC
O
Basi
c C
hem
ical
-80%-60%-40%-20%
0%20%40%60%80%
% YTD 2016 Industrial Investment Sector
-11.0% YTD

14
Please read Disclaimer on the back
November 2016 Results Summary of Listed Companiesin the Saudi Market3Q2016
© All rights reserved
Saudi Arabia’s Building & Construction sector’s net profit declined 59.8% YoY to SAR 87.2 in 3Q2016 from SAR 216.7mn in 3Q2015. The sector’s EPS for
the quarter stood at SAR 0.09 per share.
Of the 18 companies in the sector, just 8 reported a YoY gain in net profit in 3Q2016, with index heavyweights Saudi Arabian Amiantit Company
recorded a loss of 32.9mn in 3Q2016, while Zamil Industrial Investment Company reporting a decline of 30.2% YoY.
Saudi Arabian Amiantit Co. had the sector’s highest dividend yield at 11.5%.
The following factors affected the net profit of some companies in the sector:
h National Gypsum: National Gypsum’s net profit increased 7.4% YoY to SAR 5.0mn in 3Q2016. An increase in gross profit and operating profit and net profit due to increased net sales and lower cost of sales
h Saudi Ceramic: The company’s reported a net loss of SAR 45.8mn in 3Q2016, primarily due to a decrease in sales caused by shrinking local market demand and the reduction in selling prices which led to decrease in gross profit. In addition to increase in General & Administrative expenses and financing cost.
h United Wire Factories Co.: The company’s net profit decreased 32.5% YoY to SAR 14.3mn in 3Q2016 from SAR 21.2mn, driven by a decrease in sales, decrease in gross margin and the increase of general and administrative expenses.
h Zamil: Zamil’s net profit decreased 30.2% YoY to SAR 40.1mn in 3Q2016 due to lower sales of core products in AC and Steel sectors, and an increase in financial charges, non-controlling interests, taxes and zakat.
Company Name
3Q2015 3Q2016
YoY Change%
3Q2016
Net Profit (SARmn)
EPS(SAR)
Net Profit (SARmn)
EPS(SAR)
P/E TTM (x)
P/Bv (X)
D/Y (%)*
Bawan Company 20.1 0.34 21.8 0.36 8.1% 8.3 1.2 6.9Red Sea Housing 1.9 0.03 12.7 0.21 568.4% 15.2 1.4 3.2United Wire Factories 21.2 0.48 14.3 0.33 -32.5% 10.1 1.6 8.1Al Yamamah Steel 54.5 1.07 66.5 1.31 22.0% 6.9 1.8 6.3Al-Babtain 32.5 0.76 35.5 0.83 9.2% 7.0 1.4 8.0Saudi vitrified clay Co. 21.7 1.45 10.9 0.73 -49.8% 8.1 3.0 10.7Zamil Industrial 57.5 0.96 40.1 0.67 -30.2% 5.9 0.7 9.4SIDC -11.6 -0.29 -9.3 -0.23 19.8% - 0.8 -Electric Industries Co 9.5 0.21 10.2 0.23 7.7% 15.8 1.2 3.1Saudi Ceramic Co. 62.7 1.25 -45.8 -0.92 - 6.1 0.6 8.4Saudi Steel Pipe Co. 8.0 0.16 5.8 0.11 -28.1% 33.5 0.9 -National Gypsum Co. 4.7 0.15 5.1 0.16 7.4% 26.1 0.7 6.3Saudi Arabian Amiantit 27.1 0.23 -32.9 -0.29 - 25.5 0.4 11.5Al-Khodari -14.3 -0.26 -47.8 -0.86 -234.5% - 0.5 -Saudi Cable Co -2.9 -0.04 14.3 0.19 - - 2.6 -Arabian Pipes Co. -8.9 -0.22 4.4 0.11 - - 0.9 -MESC -3.2 -0.05 3.8 0.06 - 33.5 0.8 -Mohammad Al Mojil -63.7 -0.51 -22.3 -0.18 65.0% - - -Total 216.8 0.21 87.2 0.09 -59.8% 13.6 1.1 7.9
Source: Tadawul, Bloomberg, AlJazira Capital
Building & Construction Sector
Dec-
15
Jan-
16
Feb-
16
Mar
-16
Apr-1
6
May
-16
Jun-
16
Jul-1
6
Aug-
16
Sep-
16
B&C Sector
1,0001,2001,4001,6001,8002,0002,2002,400
Al-K
hoda
ri EI
C
Saud
i Cer
amic
G
ypsu
m
Saud
i Ste
el P
ipe
SID
C
Saud
i Cab
le
Zam
il M
ESC
Am
iant
it AL
-BAB
TAIN
Vi
trifie
d cl
ay
Baw
an Al
Moj
il R
ed S
ea
Pipe
s AS
LAK
Yam
amah
Ste
el
-60%
-40%
-20%
0%
20%
% YTD 2016 Building & Construction Sector
-29.6% YTD

15
Please read Disclaimer on the back
November 2016 Results Summary of Listed Companiesin the Saudi Market3Q2016
© All rights reserved
The Transport sector’s net profit declined 22.0% YoY to SAR 643.7mn in 3Q2016 from SAR
825.5mn in 3Q2015. The sector’s EPS stood at SAR 0.8 per share.
Of the 5 companies, 2 registered growth in net earnings, with Saudi Ground Services Co.
(up 15.6% YoY) gaining the most. It was followed by Saudi Public Transport (up 1.3% YoY).
National Shipping Co. had the sector’s highest dividend yield at 7.5%.
h National Shipping Co.: The company’s net profit declined 37.6% YoY to SAR
318.3mn in 3Q2016, led by a decrease in average Time Charter Equivalent
(TCE) rate in crude oil transportation spot market during 3Q2016 compared to
3Q2015. In addition to a decrease in the company share in profits of Petredec
limited (30.3% owned by Bahri).
Company Name
3Q2015 3Q2016YoY
Change%
3Q2016
Net Profit (SARmn)
EPS(SAR)
Net Profit (SARmn)
EPS(SAR)
P/E TTM (x)
P/Bv (X) D/Y (%)*
National Shipping Co. 510.3 1.30 318.4 0.81 -37.6% 5.9 1.4 7.5Saudi Ground Services 167.1 0.89 193.2 1.03 15.6% 11.7 3.0 5.7Saudi Public Transport 81.4 0.65 82.4 0.66 1.3% 17.8 1.0 4.2Budget Saudi 48.7 0.80 43.4 0.71 -11.0% 7.6 1.6 5.2MUBARRAD 18.0 1.00 6.3 0.35 -65.1% 14.6 2.7 -Total 825.5 1.05 643.7 0.82 -22.0% 7.8 1.7 6.6
Source: Tadawul website, AlJazira Capital،
Transport Sector
SAPT
CO
Bahr
i
Budg
et S
audi
Mub
arra
d
Saud
i Gro
und
Serv
ices
Co.
-45%
-30%
-15%
0%
15%% YTD 2016 Transport Sector
Dec-
15
Transport Sector
Jan-
16
Feb-
16
Mar
-16
Apr-1
6
May
-16
Jun-
16
Jul-1
6
Aug-
16
Sep-
16 4,500
5,0005,5006,0006,5007,0007,5008,0008,500
-23.6% YTD
The net earnings of Saudi Arabia’s Multi-investment sector declined 58.0% YoY to SAR
146.4mn in 3Q2016 from SAR 348.2mn in 3Q2015. The sector’s EPS stood at SAR 0.04 per
share in 3Q2016.
Saudi Advanced Industries Co. reported the highest earnings growth of 56.5% whereas
Kingdom Holding Co.’s net profit declined 38.3% YoY.
Aseer Trading, Tourism & Manufacturing Co. had the sector’s highest dividend yield at 8.4%.
Company Name
3Q2015 3Q2016
YoY Change%
3Q2016
Net Profit (SARmn)
EPS(SAR)
Net Profit (SARmn)
EPS(SAR)
P/E TTM (x)
P/Bv (X) D/Y (%)*
SAIC 1.6 0.03 2.5 0.05 56.5% - 0.6 -SISCO 24.8 0.36 16.3 0.24 -34.3% 8.1 0.8 4.1AlBaha - - - - - - - -Kingdom Holding Co. 291.6 0.08 179.9 0.05 -38.3% 62.7 1.5 4.8Aseer Trading 22.5 0.18 -48.1 -0.38 -313.8% 63.7 0.6 8.4SARCO 0.1 0.01 -1.3 -0.09 -1400.0% - 1.2 2.1Al-Ahsa Development 7.6 0.16 -2.9 -0.06 - - 1.0 -Total 348.2 0.09 146.4 0.04 -58.0% 58.4 1.4 5.1
Source: Tadawul, Bloomberg, AlJazira Capital
Multi-Investment Sector
Multi-investment Sector
Oct
-16
Jan-
16
Feb-
16
Mar
-16
Apr-1
6
May
-16
Jun-
16
Jul-1
6
Aug-
16
Sep-
16 2,000
2,2002,4002,6002,8003,0003,2003,400
Ase
er
Kin
gdom
Hol
ding
SA
RC
O
SA
IC
Al-A
hsa
SIS
CO
Al-B
aha
-50%
-40%
-30%
-20%
-10%
0%
% YTD 2016 Multi-Investment Sector
-31.4% YTD

16
Please read Disclaimer on the back
November 2016 Results Summary of Listed Companiesin the Saudi Market3Q2016
© All rights reserved
The net profit of Saudi Arabia’s Real Estate Development sector declined 26.9% YoY to SAR 306.3mn in 3Q2016 from SAR 419.1mn in 3Q2015. The
sector’s EPS for the quarter was SAR 0.08 per share.
Arriyadh Development Co.(down 45.3% YoY),Taiba Holding Co. (down 26.4% YoY), as well as Emaar Company which recorded a net loss of 80.6mn,
leading the decline in the sector’s net profit in 3Q2016, while gains of Alandalus Property Co. grew by 8.6% YoY.
Arriyadh Development Co. had the sector’s highest dividend yield at 10.0%.
The following factors affected the net profit of some companies in the sector during 3Q2016:
h Alandalus Property Co.: The company’s net profit rose 8.6% YoY to SAR 26.2mn in 3Q2016 from SAR 24.1mn in 3Q2015, led by the increase in rent revenues which led to the increase in gross profit. In addition to the increase in income from investment in associates.
h Knowledge Economic City: The company reported a net loss of SAR 7.22mn in 3Q2016 due to lower revenue.
h Saudi Real Estate: Saudi Real Estate’s net profit declined 48.3% YoY to SAR 19.8mn in 3Q2016 from SAR 38.6mn due to financing charges of SAR 16.7mn , and a decline in operating profit which due to a provision for doubtful debts of proving debts of SAR 8.6mn and an increase the studies and consulting expenses of SAR 3mn.
Company Name
3Q2015 3Q2016
YoY Change%
3Q2016
Net Profit (SARmn)
EPS(SAR)
Net Profit (SARmn)
EPS(SAR)
P/E TTM (x)
P/Bv (X) D/Y(%)*
Arriyadh Development 67.9 0.51 37.1 0.28 -45.3% 7.1 1.3 10.0Emaar 8.2 0.01 -80.6 -0.09 - 53.2 1.3 -Taiba Holding Co. 102.1 0.68 75.2 0.50 -26.4% 16.9 1.4 5.1Alandalus Property Co. 24.2 0.35 26.3 0.38 8.6% 10.6 1.1 3.5Dar Alarkan 92.7 0.09 112.5 0.10 21.4% 22.7 0.3 -Saudi Real Estate Co. 38.4 0.32 19.8 0.17 -48.3% 17.5 0.6 6.1Makkah Construction * 82.7 0.50 113.7 0.69 37.5% 43.4 1.7 2.9Jabal Omar ** 8.7 0.01 9.5 0.01 9.5% - 6.0 -Knowledge Economic -5.7 -0.02 -7.2 -0.02 -25.8% - 1.6 -Total 419.1 0.11 306.3 0.08 -26.9% 74.2 1.8 4.6
Source: Tadawul, Bloomberg, AlJazira Capital
*Hijri Calender, ** Hijri Calender
Real Estate Development Sector
SR
EC
O KE
C
Tai
ba
Mak
kah
Con
stru
ctio
n
Dar
Al A
rkan
Em
aar
EC
Jab
al O
mar
Arr
iyad
h
Ala
ndal
us
Pro
per
ty C
o.
-30%
-15%
0%
15%% YTD 2016 Real Estate Development Sector
Real Estate
4,0004,5005,0005,5006,0006,5007,000
Dec-
15
Jan-
16
Feb-
16
Mar
-16
Apr-1
6
May
-16
Jun-
16
Jul-1
6
Aug-
16
Sep-
16
0.9% YTD

17
Please read Disclaimer on the back
November 2016 Results Summary of Listed Companiesin the Saudi Market3Q2016
© All rights reserved
Saudi Arabia’s Media & Publishing sector recorded loss of SAR 104.6mn in 3Q2016,as compared to profit of SAR 15.72mn in 3Q2015
The sector’s EPS for the quarter stood at a loss of SAR 0.67 per share.
Key factors that affected the net loss of some companies in the sector during 3Q2016:
h Saudi Printing and Packaging Co.: The company’s reported a loss of SAR 11.88mn in 3Q2016, led by a decrease in gross profit (which was ascribed to a fall in sales due to adverse economic conditions in some overseas markets), lower selling prices due to fall in international oil prices.
h Saudi Research and Marketing Group: The company reported a net loss of SAR 80.90mn in 3Q2106 due to 10.4% YoY decline in revenue, and a rise in operating cost.
Company Name
3Q2015 3Q2016
YoY Change%
3Q2016
Net Profit (SARmn)
EPS(SAR)
Net Profit (SARmn)
EPS(SAR)
P/E TTM (x)
P/Bv (X) D/Y (%)*
Saudi Printing 10.9 0.18 -11.9 -0.20 - - 0.8 -Saudi Research -6.7 -0.08 -80.9 -1.01 -1107.5% - 1.6 -Tihama Advertising 11.5 0.77 -11.8 -0.79 - - - -Total 15.7 0.10 -104.6 -0.67 - - 1.4 0
Source: Tadawul, Bloomberg, AlJazira Capital
Media and Publishing Sector
-40% -35% -30% -25% -20% -15% -10%
-5% 0%
SRMG SPPC
TAPRCO
% YTD 2016 Media and Publishing Sector
-56.9% YTD
Media Sector
1,0001,5002,0002,5003,0003,5004,000
Dec-
15
Jan-
16
Feb-
16
Mar
-16
Apr-1
6
May
-16
Jun-
16
Jul-1
6
Aug-
16
Sep-
16

Asset Management | Brokerage | Corporate Finance | Custody | Advisory
Head Office: King Fahad Road, P.O. Box: 20438, Riyadh 11455, Saudi Arabia، Tel: 011 2256000 - Fax: 011 2256068
Aljazira Capital is a Saudi Investment Company licensed by the Capital Market Authority (CMA), license No. 07076-37
RESE
ARC
H D
IVIS
ION
RESE
ARC
H
DIV
ISIO
NRA
TIN
GTE
RMIN
OLO
GY
BRO
KERA
GE A
ND IN
VEST
MEN
T CE
NTER
S DI
VISI
ON
Disclaimer
AlJazira Capital, the investment arm of Bank AlJazira, is a Shariaa Compliant Saudi Closed Joint Stock company and operating under the regulatory supervision of the Capital Market Authority. AlJazira Capital is licensed to conduct securities business in all securities business as authorized by CMA, including dealing, managing, arranging, advisory, and custody. AlJazira Capital is the continuation of a long success story in the Saudi Tadawul market, having occupied the market leadership position for several years. With an objective to maintain its market leadership position, AlJazira Capital is expanding its brokerage capabilities to offer further value-added services, brokerage across MENA and International markets, as well as offering a full suite of securities business.
1. Overweight: This rating implies that the stock is currently trading at a discount to its 12 months price target. Stocks rated “Overweight” will typically provide an upside potential of over 10% from the current price levels over next twelve months.
2. Underweight: This rating implies that the stock is currently trading at a premium to its 12 months price target. Stocks rated “Underweight” would typically decline by over 10% from the current price levels over next twelve months.
3. Neutral: The rating implies that the stock is trading in the proximate range of its 12 months price target. Stocks rated “Neutral” is expected to stagnate within +/- 10% range from the current price levels over next twelve months.
4. Suspension of rating or rating on hold (SR/RH): This basically implies suspension of a rating pending further analysis of a material change in the fundamentals of the company.
The purpose of producing this report is to present a general view on the company/economic sector/economic subject under research, and not to recommend a buy/sell/hold for any security or any other assets. Based on that, this report does not take into consideration the specific financial position of every investor and/or his/her risk appetite in relation to investing in the security or any other assets, and hence, may not be suitable for all clients depending on their financial position and their ability and willingness to undertake risks. It is advised that every potential investor seek professional advice from several sources concerning investment decision and should study the impact of such decisions on his/her financial/legal/tax position and other concerns before getting into such investments or liquidate them partially or fully. The market of stocks, bonds, macroeconomic or microeconomic variables are of a volatile nature and could witness sudden changes without any prior warning, therefore, the investor in securities or other assets might face some unexpected risks and fluctuations. All the information, views and expectations and fair values or target prices contained in this report have been compiled or arrived at by Aljazira Capital from sources believed to be reliable, but Aljazira Capital has not independently verified the contents obtained from these sources and such information may be condensed or incomplete. Accordingly, no representation or warranty, express or implied, is made as to, and no reliance should be placed on the fairness, accuracy, completeness or correctness of the information and opinions contained in this report. Aljazira Capital shall not be liable for any loss as that may arise from the use of this report or its contents or otherwise arising in connection therewith. The past performance of any investment is not an indicator of future performance. Any financial projections, fair value estimates or price targets and statements regarding future prospects contained in this document may not be realized. The value of the security or any other assets or the return from them might increase or decrease. Any change in currency rates may have a positive or negative impact on the value/return on the stock or securities mentioned in the report. The investor might get an amount less than the amount invested in some cases. Some stocks or securities maybe, by nature, of low volume/trades or may become like that unexpectedly in special circumstances and this might increase the risk on the investor. Some fees might be levied on some investments in securities. This report has been written by professional employees in Aljazira Capital, and they undertake that neither them, nor their wives or children hold positions directly in any listed shares or securities contained in this report during the time of publication of this report, however, The authors and/or their wives/children of this document may own securities in funds open to the public that invest in the securities mentioned in this document as part of a diversified portfolio over which they have no discretion. This report has been produced independently and separately by the Research Division at Aljazira Capital and no party (in-house or outside) who might have interest whether direct or indirect have seen the contents of this report before its publishing, except for those whom corporate positions allow them to do so, and/or third-party persons/institutions who signed a non-disclosure agreement with Aljazira Capital. Funds managed by Aljazira Capital and its subsidiaries for third parties may own the securities that are the subject of this document. Aljazira Capital or its subsidiaries may own securities in one or more of the aforementioned companies, and/or indirectly through funds managed by third parties. The Investment Banking division of Aljazira Capital maybe in the process of soliciting or executing fee earning mandates for companies that is either the subject of this document or is mentioned in this document. One or more of Aljazira Capital board members or executive managers could be also a board member or member of the executive management at the company or companies mentioned in this report, or their associated companies. No part of this report may be reproduced whether inside or outside the Kingdom of Saudi Arabia without the written permission of Aljazira Capital. Persons who receive this report should make themselves aware, of and adhere to, any such restrictions. By accepting this report, the recipient agrees to be bound by the foregoing limitations.
Acting Head of Research
Talha Nazar +966 11 [email protected]
AnalystSultan Al Kadi+966 11 [email protected]
Analyst
Jassim Al-Jubran +966 11 [email protected]
Analyst
Waleed Al-jubayr+966 11 [email protected]
General Manager – Brokerage Services &
sales
Alaa Al-Yousef+966 11 [email protected]
AGM-Head of international and institutional
brokerage
Luay Jawad Al-Motawa +966 11 [email protected]
AGM- Head of Western and Southern Region Investment Centers & ADC
Brokerage
Mansour Hamad Al-shuaibi +966 12 [email protected]
AGM-Head of Sales And Investment Centers
Central Region
Sultan Ibrahim AL-Mutawa +966 11 [email protected]
AGM-Head of Qassim & Eastern Province
Abdullah Al-Rahit +966 16 3617547 [email protected]
Recommended