DESERT
Desert
Online at http://desert.ut.ac.ir
Desert 22-2 (2017) 209-220
Responses of above and below-ground traits of wheat wild
relative (Aegilops tauschii) and bread wheat
(Triticum aestivum L.) to imposed moisture stress
S.S. Moosavia*
, M. Nazaria, M. Maleki
b
a Department of Agronomy and Plant Breeding, Faculty of Agriculture, Bu-Ali Sina University, Hamedan, Iran
b Department of Biotechnology, Institute of Science and High Technology and Environmental Science, Graduate University
of Advanced Technology, Kerman, Iran
Received: 6 May 2017; Received in revised form: 11 July 2017; Accepted: 13 August 2017
Abstract
The narrow genetic variation of bread wheat is one of the limitations to improve it for drought-tolerance. The
research carried out to study the responses of different genotypes and traits to imposed moisture stress. The plant
material comprised of 10 Aegilops tauschii accessions as well as a tolerant (BW2) and a susceptible (BW1) bread
wheat cultivar. To assess the root and shoot-traits, two separate pot experiments were conducted, under normal and
moisture stress conditions during 2013–14 and 2014–15 years. The majority of the traits were significantly affected
by the genotypes (G), water treatments (WT), and G×WT interaction. The results revealed a high inter genus
diversity for the all traits, except tillers number per plants. A19 accession was less affected by the imposed moisture
stress, while A14 and A16 were the most affected ones. In addition, BW2 cultivar was more tolerant, with a greater
yield, than BW1. Water use efficiency and seed weight per main spike were the most effective traits to improve grain
yield. A high amount of water use efficiency, plant harvest index, spikelet number per spike, seed number per main
spike, seed number per plant, biological yield per plant, and RWC, and a low amount of phenological traits (except
grain filling period), excised leaf water retention, and root to shoot dry weight ratio were suggested for improvement
of grain yield. Harvest index and biomass were two main-components of grain yield in the favorite (BW2 and A19)
genotypes. A19 and BW2 may have value for breeding wheat better adapted to moisture stress conditions.
Keywords: Genetic; Diversity; Root; Traits; Moisture; Stress
1. Introduction
The human population will increase to over 8
billion by the year 2020 (Ashraf and Harris,
2005), therefore feeding the growing population
will become a critical challenge in the
worldwide (Sohail et al., 2011). Wheat, as the
most important crop, provides 20 percent of the
calories and protein for the world’s population
food (Braun et al., 2010, Graybosch and
Peterson, 2010). This crop is planted under arid
and semi-arid regions with insufficient water
(Özturk et al., 2014). Indeed, among the abiotic
stress, one of the most widely limiting for crop
Corresponding author. Tel.: +98 918 8526940
Fax: +98 81 34425402 E-mail address: [email protected]
production on a global basis is water stress
(Tomar et al., 2004). Beside, wheat is affected
by moisture stress in around 50 percent of its
planted areas (Rajaram, 2001).
Genetic diversity and selection are basic
prerequisites to breed in crop plant (Falconer
and Mackay, 1996). In spite of the wheat wild
relatives containing a much wider range of
resistance to moisture stress, the narrow genetic
variation of bread wheat cultivars, is one of the
major limitations to improve their drought
tolerance. Therefore, to develop moisture stress-
tolerant crops in any breeding program, it is
necessary to identify the degree of tolerance
among the crop genotypes or it′s wild relatives
(Ashraf, 2010). For bread wheat, the genus
Aegilops is closely related to genus Triticum
(Van Slageren, 1994). Ae. tauschii is one of the
Moosavi et al. / Desert 22-2 (2017) 209-220
210
most valuable species for wheat improvement
among the more than 300 wild species in the
tribe Triticeae (Sohail et al., 2011). Interest has
developed in recent years in exploiting Aegilops
spp. as important genetic resources for wheat
improvement (Farooq et al., 1996, Zaharieva et
al., 2001). It has been proposed that Triticum
tauschii (the diploid D-genome donor of
hexaploid wheat), could be used as a source for
exploiting genetic variation for resistance to
water stress (Halloran, 1990). Ae. tauschii is a
valuable source of resistance to environmental
stresses and could therefore contribute to the
wheat breeding biotic and abiotic programs
(Colmer et al., 2006). Indeed, the D- genome
plays a key role in resistance to disease (Malik
et al., 2003), tolerance to environmental stress
(Schachtman et al., 1992), bread quality (Gupta
and Mac-Ritchie, 1994), and grain yield
increscent (Del Blanco et al., 2000). For
example, Aegilops geniculata Roth. has been
pursued by Farooq (2004) as a potential source
for improvement of salt tolerance in wheat.
Therefore, a better understanding of the
adaptive traits of this species may promote it′s
use for wheat genetic improvement (Mguis et
al., 2013). Because of the extensive distribution
of Ae. tauschii in the Middle Eastern (especially
in Iran) and Central Asian continental areas
possessing very arid habitats, it has been
hypothesized that forms could have evolved in
the species that possess drought tolerance
superior to that of modern wheat (Reddy et al.,
1993). Naghavi and Mardi (2010), indicated that
the genetic diversity within the DD genome of
Ae. tauschii is much higher than DD genome of
Iranian bread wheat. Generally, appropriate
selection of the parents is essential to be used in
crossing nurseries to enhance the genetic
recombination for potential yield increase
(Islam, 2004).
Phenological, morpho-physiological and
root-related traits are valuable indices of
moisture stress tolerance (Entz and Fowler,
1990), and they are extremely related to grain
yield under normal and moisture stress
conditions (Van Ginkel et al., 1998). In other
words, morphological traits can be used as
suitable tools for the indirect analysis of genetic
diversity (Kaur et al., 2016). For example,
different root-related traits are very important
criteria to select for drought tolerances, as a
remarkable and unknown genetic diversity
resource (Sohail et al., 2011).
Breeding wheat drought-tolerance requires a
remarkable level of heritable variation among
wheat genotypes or their wild relatives, which
may serve as a rich source of appropriate
genetic variation (Ashraf, 2010). The present
study was done to assess genetic diversity and
the responses of above and especially below-
ground (as a valuable genetic resource) traits of
10 Ae. tauschii accessions and two bread wheat
cultivars under different moisture conditions.
2. Materials and Methods
2.1. Plant material
Ten accessions of Aegilops tauschii,
originating from different sites altitude and
latitude of Iran, and two commercial bread
wheat (Triticum aestivum) cultivars (Pishgam
and Shahryar, drought-tolerant and susceptible
respectively) were used (Table 1).
Table 1. The studied genotypes under two moisture conditions during 2013–14 and 2014–15
Acce. code Explanations, site of origin (city, province, and country)
A11 Aegilops tauschii; Amol, Mazandaran, Iran
A12 Aegilops tauschii; Ahar, Eastern Azerbaijan, Iran
A13 Aegilops tauschii; Karaj, Alborz, Iran
A14 Aegilops tauschii; Astara, Gilan, Iran A15 Aegilops tauschii; Moghan, Ardabil, Iran
A16 Aegilops tauschii; Chalous, Mazandaran, Iran
A17 Aegilops tauschii; Heyran, Ardabil, Iran A18 Aegilops tauschii; Kooch, Esfahan, Iran
A19 Aegilops tauschii; Gilan, Gilan, Iran
A20 Aegilops tauschii; Doroud, Lorestan, Iran
BW1 Triticum aestivum var. Shahryar; relatively susceptible to drought stress, resistant to cold, brown
rust, and yellow rust stresses; year of release 2002
BW2 Triticum aestivum var. Pishgam; resistant to terminal drought, cold, brown rust, and yellow rust stresses; year of release 2008
2.2. Growing conditions and statistical design
The experiment was conducted in a research-
greenhouse at Bu-Ali Sina University (located
in Hamedan province, west of Iran) during two
successive years (2013–14 and 2014–15). The
plant materials were grown in black plastic pots,
with fifteen plants per each pot and after three
weeks later, the seedlings were thinned to 10
bushes per each pot. In order to easy assessment
Moosavi et al. / Desert 22-2 (2017) 209-220
211
of root- related traits, the black plastic pots of
40 cm of diameter and 80 cm of height were
applied. Each pot was filled by 15 kg soil
comprised of 50% agronomy-field soil (silty-
loam), 25% sand, and 25% manure. Four
notches have been created to the bottom of
every pot to guarantee a good drainage. In each
year, two separate experiments carried out based
on a randomized complete block design with
three replications under normal (95 percent soil
field (pot) capacity: 95% S.F.C) and imposed
moisture stress (45 percent soil field (pot)
capacity: 45% S.F.C) conditions.
During the first-three weeks, the pots
watered daily with tap water while adding the
necessary volume to bring soil to field capacity.
After the first-three weeks, moisture stress
treatment (45% S.F.C.) started when the seedling
had approximately 4-6 leaves.
2.3. Measurement of the traits
In each normal and moisture stress
experiments, 31 traits related to phenology,
morpho-physiology, root-characters, and grain
yield-related were measured (Table 2).
Root area (RA), was calculated with the
following formula:
2RA MRL MRV (Alizade, 2006) (1)
Where in MRL and MRV are “main root length”
and “main root volume” respectively. ELWR and
RWC were calculated according to Mguis et al.
(2013). Table 2. The information of 31 measured traits during 2013–14 and 2014–15 growing seasons
Character Abbreviation Character Abbreviation
Days to heading DTH Main stem weight (g) MSTW
Days to anthesis DTA 1000-grain weight (g) TGW Days to maturity DTM Economical yield per plant (g) EYPP
Grain filling period GFP Biological yield per plant (g) BYPP (SDW)
Chlorophyll content (%) SPAD Plant harvest index (%) PHI Plant height (cm) PH Leaf area index (cm2) LAI
Peduncle length (cm) PEL Relative water content (%) RWC
Leaves number LN Excised leaf water retention (%) ELWR Tillers number per plants TN Water use (l) WU
Fertile spikes number per plants FSNPP Water use efficiency (g/l) WUE
Spikelet number per spike SNPS Main root length (cm) MRL Seed number per main spike SNPMS Main root volume (cm3) MRV
Seed number per plant SNPP Root dry weight (g) RDW
Main spike weight (g) MSW Root area (cm2) RA Seed weight per main spike (g) SWPMS Root to shoot dry weight ratio RDWSDW
Peduncle weight (g) PEW - -
2.4. Statistical analysis
Combined analysis of variance, mean
comparison and correlation analysis were
computed by SAS v. 9.1 packages (SAS
Institute Inc., 2004). Combined Analysis of
variance was performed using GLM procedure
(Mguis et al., 2008) and below model;
( ) ( ) ( , )X Y BLOCK Y WT Y WT BLOCK WT Y G T G WT G Y WT G BLOCK G Y WT (2)
In above model, X= a measured data, Y=
year, WT= water treatment and G= genotype
effect. While the year effect was treated as
random effect, genotype and water treatment
were treated as a fixed effect. Data sets were
transformed before GLM if distribution of
residuals was not normal. The principal
component analysis (PCA) was performed on
the two years combined means using Minitab v.
16 software (Minitab 16 statistical software,
2010).
3. Results and Discussion
Analysis of variance showed no significant
differences between obtained data of the 2 years
of experimentation, except SPAD and water use
(Table 3). Indeed, because of same
environmental factors (humidity, light,
temperature, etc.) and controlled conditions
during the 2 years of experimentation, the effect
of year was not significant for the majority of
the traits. Mguis et al. (2008) revealed no
significant differences between data during the 2
years of glasshouse experimentation.
The results of ANOVA (Table 3) indicated
that genotype effect was significant for all
phenological traits, 21 out of 22 morpho-
physiological traits and all the root-related
characters, except main root volume. The
obtained result indicating a high level of genetic
diversity in the germplasm. Indeed, the studied
Moosavi et al. / Desert 22-2 (2017) 209-220
212
gemplasm could be a remarkable gene pool for
breeding programs in the future. Sohail et al.
(2011) reported a high degree of variation for
most morpho-physiological traits in the Ae.
tauschii and synthetic wheat lines under
different moisture conditions. So that, they
suggested that under normal moisture
conditions, highly significant differences were
observed in all the studied morpho-
physiological traits except for root-shoot ratio,
and partitioning of dry mater to roots. However,
under moisture stress, root-shoot ratio, and
partitioning of dry mater to roots were
significantly differed. Mguis et al. (2008)
suggested that a high degree of variation of
morphological, phenological and yield
characters mainly related to geo-graphical
origin.
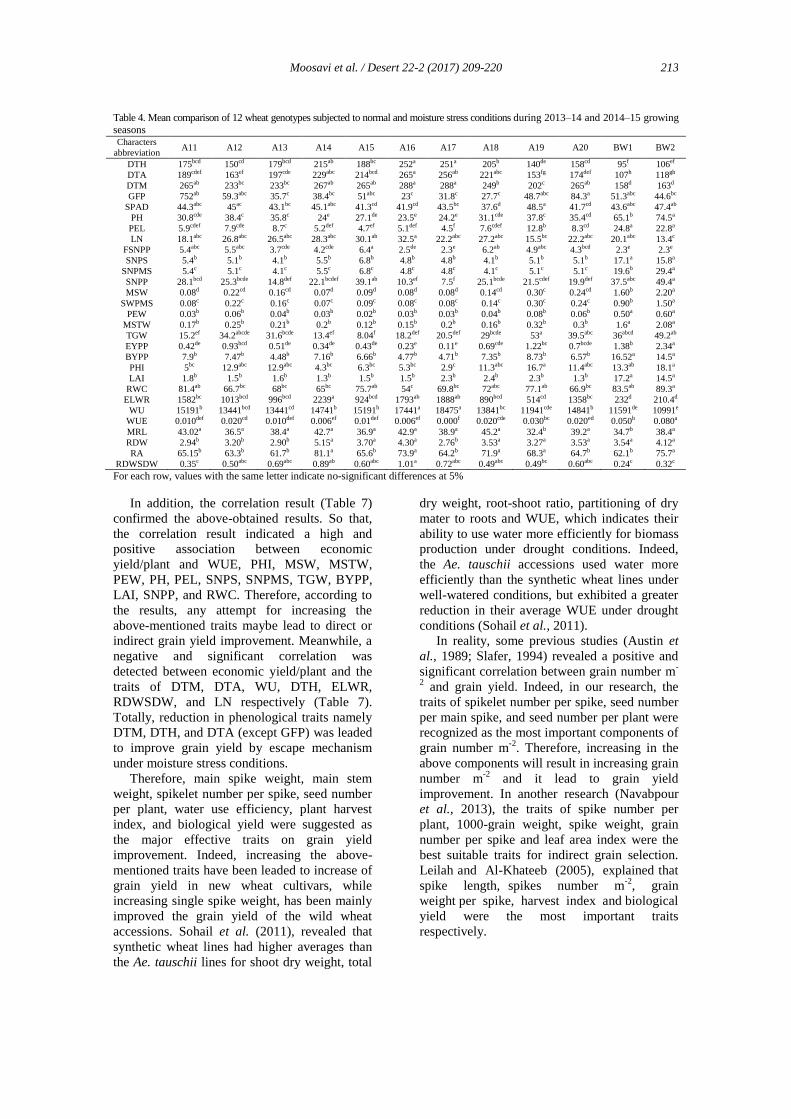
The analysis of variance has been pursued
then by the mean comparison of the traits,
among the genotypes (Table 4) and between
water treatments (Table 5). The means of all
traits, except tillers number per plants and main
root volume, showed significant difference
(P<0.05) between inter and intra-genus (Table
4). Pishgam, the drought-tolerant cultivar, had
the highest economic yield in the germplasm.
Indeed, it׳s productivity was significantly
greater than Shahryar cultivar (2.34a and 1.38
b
g/plant respectively). While A19 had the
maximum economic yield (1.22bc
g/plant)
among Aegilops accessions. A17, A16, and A14
(0.11e, 0.23
e, and 0.34
de g/plant respectively)
showed minimum grain yield altogether in both
normal and moisture stress conditions (Table 4).
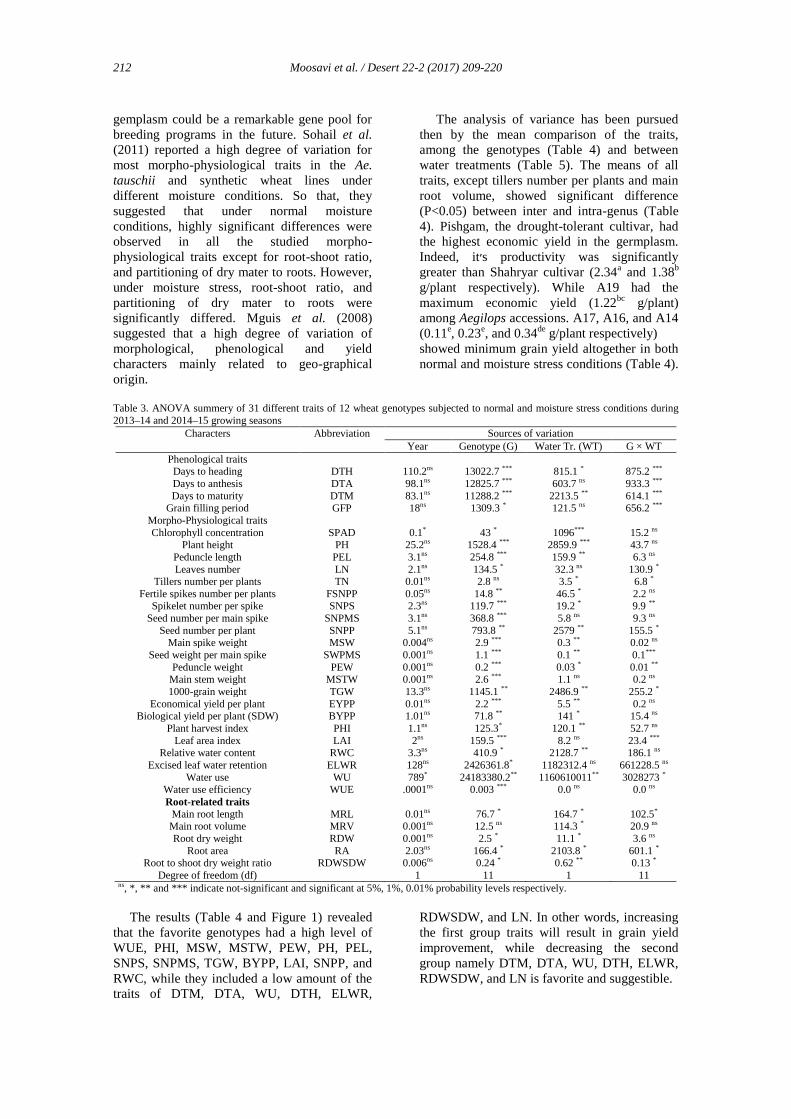
Table 3. ANOVA summery of 31 different traits of 12 wheat genotypes subjected to normal and moisture stress conditions during
2013–14 and 2014–15 growing seasons Characters Abbreviation Sources of variation
Year Genotype (G) Water Tr. (WT) G × WT
Phenological traits Days to heading DTH 110.2ns 13022.7 *** 815.1 * 875.2 ***
Days to anthesis DTA 98.1ns 12825.7 *** 603.7 ns 933.3 ***
Days to maturity DTM 83.1ns 11288.2 *** 2213.5 ** 614.1 *** Grain filling period GFP 18ns 1309.3 * 121.5 ns 656.2 ***
Morpho-Physiological traits
Chlorophyll concentration SPAD 0.1* 43 * 1096*** 15.2 ns Plant height PH 25.2ns 1528.4 *** 2859.9 *** 43.7 ns
Peduncle length PEL 3.1ns 254.8 *** 159.9 ** 6.3 ns
Leaves number LN 2.1ns 134.5 * 32.3 ns 130.9 * Tillers number per plants TN 0.01ns 2.8 ns 3.5 * 6.8 *
Fertile spikes number per plants FSNPP 0.05ns 14.8 ** 46.5 * 2.2 ns Spikelet number per spike SNPS 2.3ns 119.7 *** 19.2 * 9.9 **
Seed number per main spike SNPMS 3.1ns 368.8 *** 5.8 ns 9.3 ns
Seed number per plant SNPP 5.1ns 793.8 ** 2579 ** 155.5 * Main spike weight MSW 0.004ns 2.9 *** 0.3 ** 0.02 ns
Seed weight per main spike SWPMS 0.001ns 1.1 *** 0.1 ** 0.1***
Peduncle weight PEW 0.001ns 0.2 *** 0.03 * 0.01 ** Main stem weight MSTW 0.001ns 2.6 *** 1.1 ns 0.2 ns
1000-grain weight TGW 13.3ns 1145.1 ** 2486.9 ** 255.2 *
Economical yield per plant EYPP 0.01ns 2.2 *** 5.5 ** 0.2 ns Biological yield per plant (SDW) BYPP 1.01ns 71.8 ** 141 * 15.4 ns
Plant harvest index PHI 1.1ns 125.3* 120.1 ** 52.7 ns
Leaf area index LAI 2ns 159.5 *** 8.2 ns 23.4 ***
Relative water content RWC 3.3ns 410.9 * 2128.7 ** 186.1 ns
Excised leaf water retention ELWR 128ns 2426361.8* 1182312.4 ns 661228.5 ns
Water use WU 789* 24183380.2** 1160610011** 3028273 * Water use efficiency WUE .0001ns 0.003 *** 0.0 ns 0.0 ns
Root-related traits
Main root length MRL 0.01ns 76.7 * 164.7 * 102.5* Main root volume MRV 0.001ns 12.5 ns 114.3 * 20.9 ns
Root dry weight RDW 0.001ns 2.5 * 11.1 * 3.6 ns
Root area RA 2.03ns 166.4 * 2103.8 * 601.1 * Root to shoot dry weight ratio RDWSDW 0.006ns 0.24 * 0.62 ** 0.13 *
Degree of freedom (df) 1 11 1 11 ns, *, ** and *** indicate not-significant and significant at 5%, 1%, 0.01% probability levels respectively.
The results (Table 4 and Figure 1) revealed
that the favorite genotypes had a high level of
WUE, PHI, MSW, MSTW, PEW, PH, PEL,
SNPS, SNPMS, TGW, BYPP, LAI, SNPP, and
RWC, while they included a low amount of the
traits of DTM, DTA, WU, DTH, ELWR,
RDWSDW, and LN. In other words, increasing
the first group traits will result in grain yield
improvement, while decreasing the second
group namely DTM, DTA, WU, DTH, ELWR,
RDWSDW, and LN is favorite and suggestible.
Moosavi et al. / Desert 22-2 (2017) 209-220
213
Table 4. Mean comparison of 12 wheat genotypes subjected to normal and moisture stress conditions during 2013–14 and 2014–15 growing seasons Characters
abbreviation A11 A12 A13 A14 A15 A16 A17 A18 A19 A20 BW1 BW2
DTH 175bcd 150cd 179bcd 215ab 188bc 252a 251a 205b 140de 158cd 95f 106ef
DTA 189cdef 163ef 197cde 229abc 214bcd 265a 256ab 221abc 153fg 174def 107h 118gh
DTM 265ab 233bc 233bc 267ab 265ab 288a 288a 249b 202c 265ab 158d 163d
GFP 752ab 59.3abc 35.7c 38.4bc 51abc 23c 31.8c 27.7c 48.7abc 84.3a 51.3abc 44.6bc
SPAD 44.3abc 45ac 43.1bc 45.1abc 41.3cd 41.9cd 43.5bc 37.6d 48.5a 41.7cd 43.6abc 47.4ab
PH 30.8cde 38.4c 35.8c 24e 27.1de 23.5e 24.2e 31.1cde 37.8c 35.4cd 65.1b 74.5a
PEL 5.9cdef 7.9cde 8.7c 5.2def 4.7ef 5.1def 4.5f 7.6cdef 12.8b 8.3cd 24.8a 22.8a
LN 18.1abc 26.8abc 26.5abc 28.3abc 30.1ab 32.5a 22.2abc 27.2abc 15.5bc 22.2abc 20.1abc 13.4c
FSNPP 5.4abc 5.5abc 3.7cde 4.2cde 6.4a 2.5de 2.3e 6.2ab 4.9abc 4.3bcd 2.3e 2.3e
SNPS 5.4b 5.1b 4.1b 5.5b 6.8b 4.8b 4.8b 4.1b 5.1b 5.1b 17.1a 15.8a
SNPMS 5.4c 5.1c 4.1c 5.5c 6.8c 4.8c 4.8c 4.1c 5.1c 5.1c 19.6b 29.4a
SNPP 28.1bcd 25.3bcde 14.8def 22.1bcdef 39.1ab 10.3ef 7.5f 25.1bcde 21.5cdef 19.9def 37.5abc 49.4a
MSW 0.08d 0.22cd 0.16cd 0.07d 0.09d 0.08d 0.08d 0.14cd 0.30c 0.24cd 1.60b 2.20a
SWPMS 0.08c 0.22c 0.16c 0.07c 0.09c 0.08c 0.08c 0.14c 0.30c 0.24c 0.90b 1.50a
PEW 0.03b 0.06b 0.04b 0.03b 0.02b 0.03b 0.03b 0.04b 0.08b 0.06b 0.50a 0.60a
MSTW 0.17b 0.25b 0.21b 0.2b 0.12b 0.15b 0.2b 0.16b 0.32b 0.3b 1.6a 2.08a
TGW 15.2ef 34.2abcde 31.6bcde 13.4ef 8.04f 18.2def 20.5def 29bcde 53a 39.5abc 36abcd 49.2ab
EYPP 0.42de 0.93bcd 0.51de 0.34de 0.43de 0.23e 0.11e 0.69cde 1.22bc 0.7bcde 1.38b 2.34a
BYPP 7.9b 7.47b 4.48b 7.16b 6.66b 4.77b 4.71b 7.35b 8.73b 6.57b 16.52a 14.5a
PHI 5bc 12.9abc 12.9abc 4.3bc 6.3bc 5.3bc 2.9c 11.3abc 16.7a 11.4abc 13.3ab 18.1a
LAI 1.8b 1.5b 1.6b 1.3b 1.5b 1.5b 2.3b 2.4b 2.3b 1.3b 17.2a 14.5a
RWC 81.4ab 66.7bc 68bc 65bc 75.7ab 54c 69.8bc 72abc 77.1ab 66.9bc 83.5ab 89.3a
ELWR 1582bc 1013bcd 996bcd 2239a 924bcd 1793ab 1888ab 890bcd 514cd 1358bc 232d 210.4d
WU 15191b 13441bcd 13441cd 14741b 15191b 17441a 18475a 13841bc 11941cde 14841b 11591de 10991e
WUE 0.010def 0.020cd 0.010def 0.006ef 0.01def 0.006ef 0.000f 0.020cde 0.030bc 0.020ed 0.050b 0.080a
MRL 43.02a 36.5a 38.4a 42.7a 36.9a 42.9a 38.9a 45.2a 32.4b 39.2a 34.7b 38.4a
RDW 2.94b 3.20b 2.90b 5.15a 3.70a 4.30a 2.76b 3.53a 3.27a 3.53a 3.54a 4.12a
RA 65.15b 63.3b 61.7b 81.1a 65.6b 73.9a 64.2b 71.9a 68.3a 64.7b 62.1b 75.7a
RDWSDW 0.35c 0.50abc 0.69abc 0.89ab 0.60abc 1.01a 0.72abc 0.49abc 0.49bc 0.60abc 0.24c 0.32c
For each row, values with the same letter indicate no-significant differences at 5%
In addition, the correlation result (Table 7)
confirmed the above-obtained results. So that,
the correlation result indicated a high and
positive association between economic
yield/plant and WUE, PHI, MSW, MSTW,
PEW, PH, PEL, SNPS, SNPMS, TGW, BYPP,
LAI, SNPP, and RWC. Therefore, according to
the results, any attempt for increasing the
above-mentioned traits maybe lead to direct or
indirect grain yield improvement. Meanwhile, a
negative and significant correlation was
detected between economic yield/plant and the
traits of DTM, DTA, WU, DTH, ELWR,
RDWSDW, and LN respectively (Table 7).
Totally, reduction in phenological traits namely
DTM, DTH, and DTA (except GFP) was leaded
to improve grain yield by escape mechanism
under moisture stress conditions.
Therefore, main spike weight, main stem
weight, spikelet number per spike, seed number
per plant, water use efficiency, plant harvest
index, and biological yield were suggested as
the major effective traits on grain yield
improvement. Indeed, increasing the above-
mentioned traits have been leaded to increase of
grain yield in new wheat cultivars, while
increasing single spike weight, has been mainly
improved the grain yield of the wild wheat
accessions. Sohail et al. (2011), revealed that
synthetic wheat lines had higher averages than
the Ae. tauschii lines for shoot dry weight, total
dry weight, root-shoot ratio, partitioning of dry
mater to roots and WUE, which indicates their
ability to use water more efficiently for biomass
production under drought conditions. Indeed,
the Ae. tauschii accessions used water more
efficiently than the synthetic wheat lines under
well-watered conditions, but exhibited a greater
reduction in their average WUE under drought
conditions (Sohail et al., 2011).
In reality, some previous studies (Austin et
al., 1989; Slafer, 1994) revealed a positive and
significant correlation between grain number m-
2 and grain yield. Indeed, in our research, the
traits of spikelet number per spike, seed number
per main spike, and seed number per plant were
recognized as the most important components of
grain number m-2
. Therefore, increasing in the
above components will result in increasing grain
number m-2
and it lead to grain yield
improvement. In another research (Navabpour
et al., 2013), the traits of spike number per
plant, 1000-grain weight, spike weight, grain
number per spike and leaf area index were the
best suitable traits for indirect grain selection.
Leilah and Al-Khateeb (2005), explained that
spike length, spikes number m-2
, grain
weight per spike, harvest index and biological
yield were the most important traits
respectively.
Moosavi et al. / Desert 22-2 (2017) 209-220
214
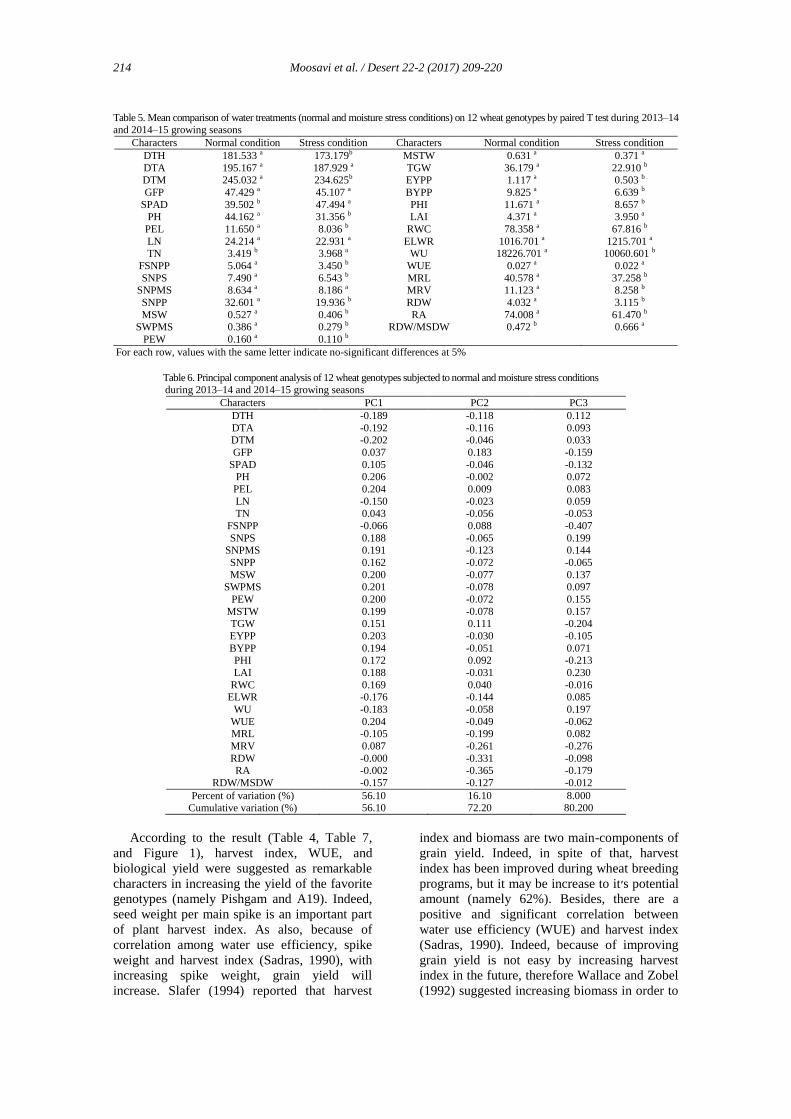
Table 5. Mean comparison of water treatments (normal and moisture stress conditions) on 12 wheat genotypes by paired T test during 2013–14 and 2014–15 growing seasons
Characters Normal condition Stress condition Characters Normal condition Stress condition
DTH 181.533 a 173.179b MSTW 0.631 a 0.371 a
DTA 195.167 a 187.929 a TGW 36.179 a 22.910 b DTM 245.032 a 234.625b EYPP 1.117 a 0.503 b
GFP 47.429 a 45.107 a BYPP 9.825 a 6.639 b
SPAD 39.502 b 47.494 a PHI 11.671 a 8.657 b PH 44.162 a 31.356 b LAI 4.371 a 3.950 a
PEL 11.650 a 8.036 b RWC 78.358 a 67.816 b
LN 24.214 a 22.931 a ELWR 1016.701 a 1215.701 a TN 3.419 b 3.968 a WU 18226.701 a 10060.601 b
FSNPP 5.064 a 3.450 b WUE 0.027 a 0.022 a
SNPS 7.490 a 6.543 b MRL 40.578 a 37.258 b SNPMS 8.634 a 8.186 a MRV 11.123 a 8.258 b
SNPP 32.601 a 19.936 b RDW 4.032 a 3.115 b
MSW 0.527 a 0.406 b RA 74.008 a 61.470 b SWPMS 0.386 a 0.279 b RDW/MSDW 0.472 b 0.666 a
PEW 0.160 a 0.110 b
For each row, values with the same letter indicate no-significant differences at 5%
Table 6. Principal component analysis of 12 wheat genotypes subjected to normal and moisture stress conditions during 2013–14 and 2014–15 growing seasons
Characters PC1 PC2 PC3
DTH -0.189 -0.118 0.112
DTA -0.192 -0.116 0.093 DTM -0.202 -0.046 0.033
GFP 0.037 0.183 -0.159
SPAD 0.105 -0.046 -0.132 PH 0.206 -0.002 0.072
PEL 0.204 0.009 0.083
LN -0.150 -0.023 0.059 TN 0.043 -0.056 -0.053
FSNPP -0.066 0.088 -0.407
SNPS 0.188 -0.065 0.199 SNPMS 0.191 -0.123 0.144
SNPP 0.162 -0.072 -0.065
MSW 0.200 -0.077 0.137 SWPMS 0.201 -0.078 0.097
PEW 0.200 -0.072 0.155
MSTW 0.199 -0.078 0.157 TGW 0.151 0.111 -0.204
EYPP 0.203 -0.030 -0.105
BYPP 0.194 -0.051 0.071 PHI 0.172 0.092 -0.213
LAI 0.188 -0.031 0.230
RWC 0.169 0.040 -0.016 ELWR -0.176 -0.144 0.085
WU -0.183 -0.058 0.197
WUE 0.204 -0.049 -0.062 MRL -0.105 -0.199 0.082
MRV 0.087 -0.261 -0.276
RDW -0.000 -0.331 -0.098 RA -0.002 -0.365 -0.179
RDW/MSDW -0.157 -0.127 -0.012
Percent of variation (%) 56.10 16.10 8.000 Cumulative variation (%) 56.10 72.20 80.200
According to the result (Table 4, Table 7,
and Figure 1), harvest index, WUE, and
biological yield were suggested as remarkable
characters in increasing the yield of the favorite
genotypes (namely Pishgam and A19). Indeed,
seed weight per main spike is an important part
of plant harvest index. As also, because of
correlation among water use efficiency, spike
weight and harvest index (Sadras, 1990), with
increasing spike weight, grain yield will
increase. Slafer (1994) reported that harvest
index and biomass are two main-components of
grain yield. Indeed, in spite of that, harvest
index has been improved during wheat breeding
programs, but it may be increase to it׳s potential
amount (namely 62%). Besides, there are a
positive and significant correlation between
water use efficiency (WUE) and harvest index
(Sadras, 1990). Indeed, because of improving
grain yield is not easy by increasing harvest
index in the future, therefore Wallace and Zobel
(1992) suggested increasing biomass in order to
Moosavi et al. / Desert 22-2 (2017) 209-220
215
improvement of grain yield. Arminian et al.
(2010) suggested that grain yield was
significantly correlated with biomass, harvest
index, 1000-grain weight and grain filling rate,
while Ranjbar et al. (2015) reveled a negative
and significant correlation between 1000-grain
weight and grain yield. Ae. tauschii accessions
from West Asian countries and Iran produced
higher total dry weight than their corresponding
synthetic wheat (SW) lines. Although the Ae.
tauschii accessions from China produced the
highest total dry weight under well-watered
conditions, their corresponding SW lines
produced far less TDW.
There was a positive and significant
correlation between economic and biological
yield per plant (r=0.7*). So that, increscent
biomass has obtained by increasing solar use
and absorption per unit area (Slafer 1994). In
other words, the genotypes with greater
biomass, especially with a high levels of maim
stem weight and peduncle weight, have better
source to sink transition in limited
environmental resources and therefore the plant
grain yield will improve. Munir et al. (2007)
reported that seeds number plant-1
, seeds
weight plant-1
and 1000-grain weight (TGW)
had a positive and significant correlation with
grain yield. In a research (Arminian et al.,
2010), seeds number per spike and TGW were
suggested as the most effective traits for grain
yield improvement. As well as, in another
research (Moosavi et al. 2014), was attributed
an opposed behavior and ontogeny relationships
between seed number and TSW. Moosavi et al.
(2013), reported that harvest index, biomass and
RWC were the most important traits for indirect
grain yield selection.
The results (Table 7) showed a positive and
significant correlation between TGW and grain
yield (r=0.8**). In other words, the majority of
genotypes with a greater TGW, they had a high
grain yield. In reality, the new improved
cultivars with increasing WUE in their terminal
growing period, can improve TGW and grain
yield. Slafer (1990) reported that, new wheat
cultivars have had more assimilate transfer rate
from sink to source about 1 month before
flowering time, so that it leads to increase TGW
in them.
Thousand-grain weight was reported by
many researchers as a character with the most
closely related to grain yield, therefore it has
been often used in selecting high yielding wheat
cultivars (Deyong, 2011; Leilah and Al-
Khateeb, 2005).
The results (Table 7) indicated that plant height
had a positive and significant (p<0.01)
correlation with grain yield. Law and Worland
(1978) reported a direct and significant
correlation between plant height and grain yield.
Indeed, the better solar distribution in the plant
canopy leads to the above relationship.
However, increasing plant height is not always
favorite (Slafer, 1994).
The expression of 22 traits was significantly
(P <0.05) affected by the water treatment (Table
3). This included 2 out of 4 phenological traits
(DTH and DTM), 16 out of 22 morpho-
physiological traits (SPAD, PH, PEL, TN,
FSNPP, SNPS, SNPP, MSW, SWPMS, PEW,
TGW, EYPP, EYPP, PHI, RWC, and WU), and
all of the root-related traits. Indeed, the majority
of the traits were affected by the increasing
levels of moisture stress.
During the vegetative phase, moisture stress
leaded to decreasing plant height, peduncle
length, peduncle weight, main stem weight,
water use, main root length, main root volume,
and root dry weight (Table 5). On the other
hand, during the reproductive phase, water
treatment accelerated emergence of heading and
maturity and it reduced the traits of fertile spike
number per plant, seed number per spike, seed
number per plant, seed weight per main spike,
1000-grain weight, and finally economic yield
per plant was decreased (Table 5). The moisture
stress exercised a depressive effect very marked
on the output in grains that passes from 1.117
g/plant for normal to 0.503 g/plant for moisture
stress, with a reduction of 54.96% (Table 5). So
that, all studied traits decreased progressively
with the acuteness of the moisture stress, except
root to shoot dry weight ratio, tillers number per
plants, and chlorophyll concentration. Indeed,
reduction of root to shoot dry weight ratio is
efficient character in selection for drought-
tolerant genotypes. Mguis et al. (2008) reported
that during the reproductive phase, salinity
treatment accelerated spikes emergence and
flowering time and reduced sizes and spikes
number.
At the normal, the phenological traits occur
later than moisture stress conditions (Table 5).
Indeed, the germplasm matured after 245 days
in normal, but in the stress conditions, they
matured after 234 days. As expected, the
reduction of the growing period was
accompanied by a significant reduction in yield-
components, biomass, and grain production
(Table 4). Malik et al. (2003) provided that
abiotic stress tolerance in wild relative might be
related to constitutive genome (high tolerance
associated with D genome) and with
geographical origin. In fact, at the bread wheat
variety and the 10 Ae. tauschii accessions, the
Moosavi et al. / Desert 22-2 (2017) 209-220
216
drought appears by a depressive effect on the
growth apparent since the first days of
installation of the drought constraint. This was
observed in other research (Colmer et al., 2006).
Growth of wheat cultivar and the 10 Ae. tauschii
accessions decreased with increasing moisture
stress, as indicated by PH, PEL, PEW, FSNPP,
SNPS, SNPP, MSW, SWPMS, TGW, BYPP,
PHI, MRL, MRV, RDW, RA, and finally
EYPP. Colmer et al. (2006) reported that abiotic
stress, for example salt, drought, etc, generally
appears by a weak growth, a reduction of the
surface and the leaves number, an acceleration
of senescence of the mature leaves. In addition,
Cramer and Quarrie (2002) in maize, noted that
salt stress, look like drought stress, reduced the
development of the aboveground parts by
inhibition of the apparition of new leaves. In
reality, the reduction of plants growth with
lowering moisture in this study reflects the
increased metabolic energy cost and reduced
carbon gain, which are associated with abiotic
stress adaptation. Indeed, stress will result in
reduction of photosynthetic rate per unit of leaf
area. These plants lost biomass continuously,
this was a result of tillers survived, flowered and
produced a few small but non-viable grains
(Yasir et al., 2013). The depressing action of the
drought on the growth and on the output was
demonstrated on a large number of species.
Morphological symptoms are inductions of
injurious effects of drought stress. The adverse
effects can be known only by critical
comparison with plants control. Drought may
directly or indirectly inhibit cell division and
enlargement in the plant’s growing point.
Reduced shoot growth caused by drought
originates in growing tissues; not in mature
photosynthetic tissues. As a result, leaves and
stems of the affected plants appear stunted.
Chloride induces elongation of the palisade
cells, which leads to leaves becoming succulent.
Moisture stress accelerates phenological
development induces early flowering in wheat
cultivars and 10 Ae. tauschii accessions, reduce
plant height and peduncle length, reduce
biomass, increase root to shoot ratio. As a
result, grain yield is reduced. This is attributed
to the reduced FSNPP, SNPS, SNPP, SWPMS,
TGW. The results have been mentioned in
wheat (Maas and Grieve, 1990) and in Triticale
(Yakoubi, 2001).
Genotype × water treatment interactions
were also detected for 16 traits (Table 3),
indicating variable performance of different
genotypes in different moisture conditions.
Principal component analysis (PCA) was
performed on data from the combined normal
and moisture stress treatment data sets (Table
6). The first-three principal components
explained 80.2 percent of the observed
variation. The PC1 and PC2 mainly distinguish
the traits in different groups. The PC1
accounted for 56.10 percent of the variation and
showed the largest negative loading values with
all of the phenological traits, except grain filling
period, and the largest positive loading values
with all of the biological yield, economical
yield, and yield-component (Table 6).
Therefore, this factor was known as “yield and
yield-components factor”. Presence of positive
and negative correlation trends between the
components and the variables are interpreted by
positive and negative loading values. The PC2
accounted for 28.68 percent of the observed
variation, and showed the largest negative
loading values with root-related traits (Table 6).
In spite of high amount of first factor, but the
medium or low amount of second factor was
suggested.
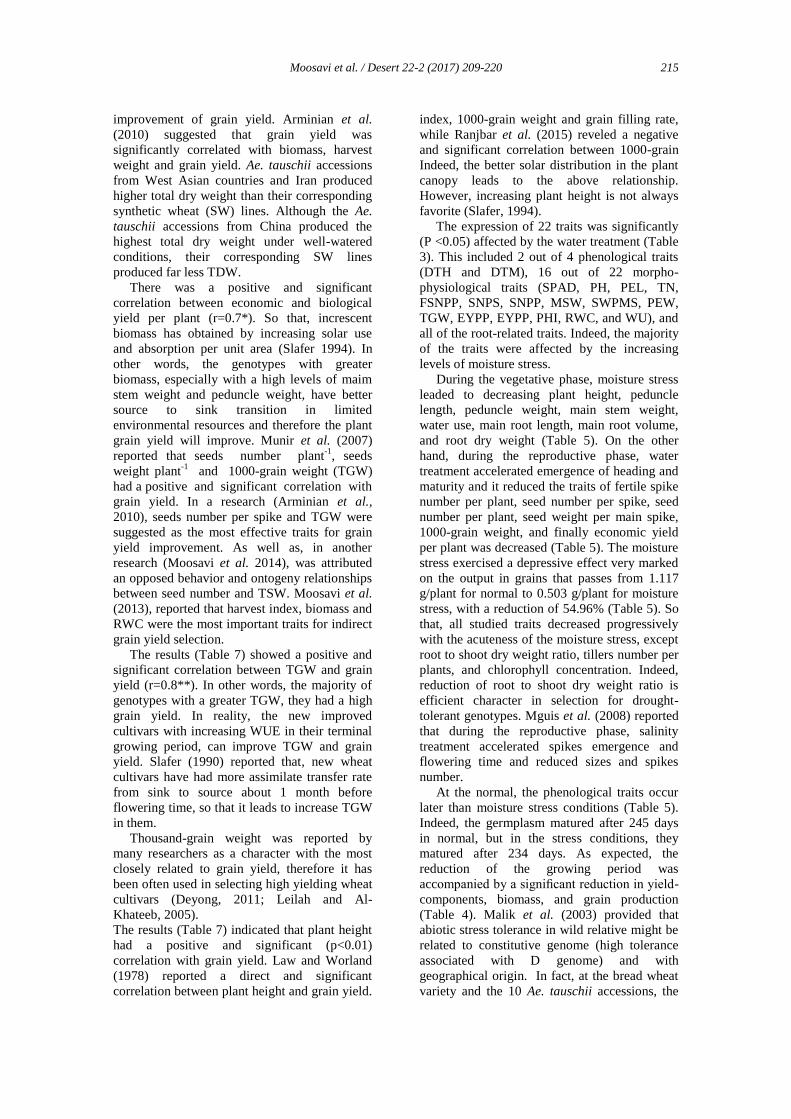
Therefore, the area between first and forth
bigot areas were the best suitable bipolt parts
(Figure 1). Ivandic et al. (2000), showed that the
first-three components explain 88.8% of the
observed variation. They introduced first
component as yield- related traits. In another
study under rain-fed conditions (Janmohammadi
et al., 2014), the first and second PCA explained
28% and 13% of total variation of agro-
morphological traits.
In addition, the PC3 accounted for 8 percent
of the observed variation. The most effective
trait in the third component was fertile spikes
number per plant. The traits with the largest
impact on the components showed the highest
rate of variation and hence can be used for
grouping populations, effectively. So that, the
genotype-by-trait (GT) biplot is a statistical tool
for evaluating cultivars based on multiple traits
and for identifying lines that are superior.
Entries identified for agro-morphological and
physiological traits hence could be candidates
for use as parents in a breeding program (Yan
and Rajcan, 2002). The correlation coefficient
between any two traits is approximated by the
cosine of the angle between their vectors (Yan
and Rajcan, 2002). The plot currently shows the
relationship among the traits that had relatively
large loading on both PC1 and PC2 axes. By
plotting the PCAs that are considered to be
important, plants close to the ideal plant would
be selected (Yan and Rajcan, 2002). Therefore,
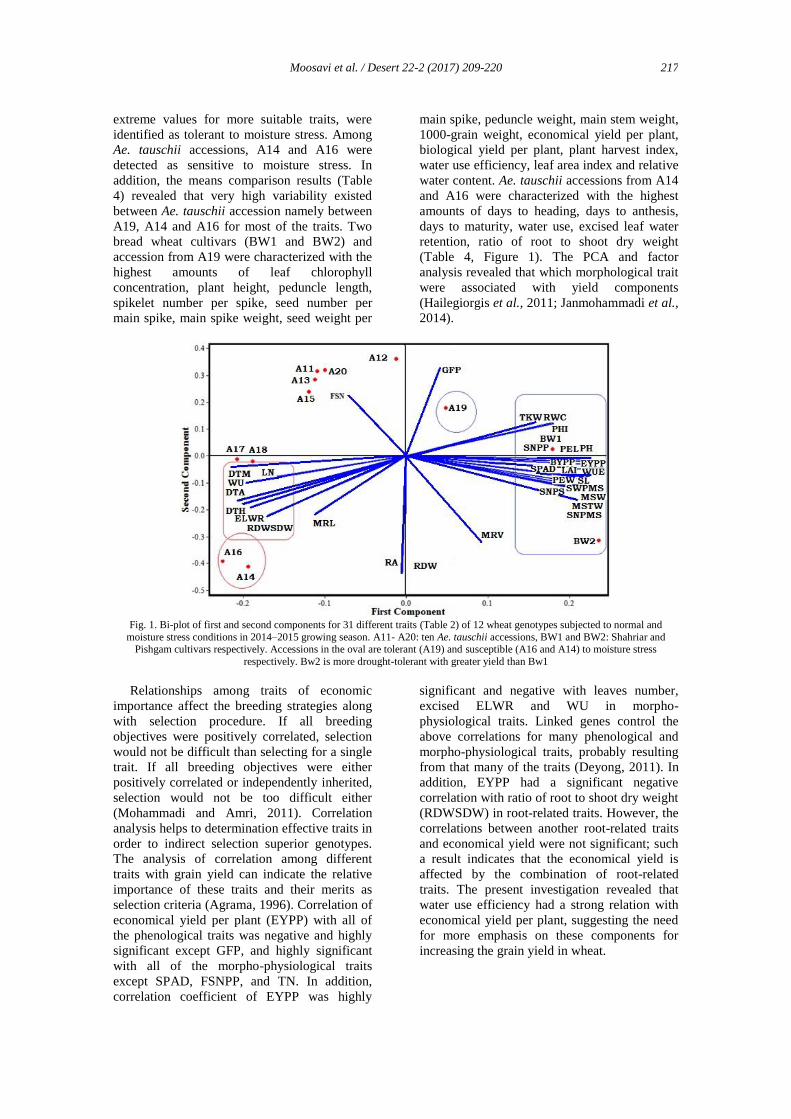
using the biplot diagram (Figure 1) Pishgam
cultivar (BW2), from bread wheat group, and
Gilan (A19), from Ae. tauschii accessions, with
the longest favorite vectors are those that have
Moosavi et al. / Desert 22-2 (2017) 209-220
217
extreme values for more suitable traits, were
identified as tolerant to moisture stress. Among
Ae. tauschii accessions, A14 and A16 were
detected as sensitive to moisture stress. In
addition, the means comparison results (Table
4) revealed that very high variability existed
between Ae. tauschii accession namely between
A19, A14 and A16 for most of the traits. Two
bread wheat cultivars (BW1 and BW2) and
accession from A19 were characterized with the
highest amounts of leaf chlorophyll
concentration, plant height, peduncle length,
spikelet number per spike, seed number per
main spike, main spike weight, seed weight per
main spike, peduncle weight, main stem weight,
1000-grain weight, economical yield per plant,
biological yield per plant, plant harvest index,
water use efficiency, leaf area index and relative
water content. Ae. tauschii accessions from A14
and A16 were characterized with the highest
amounts of days to heading, days to anthesis,
days to maturity, water use, excised leaf water
retention, ratio of root to shoot dry weight
(Table 4, Figure 1). The PCA and factor
analysis revealed that which morphological trait
were associated with yield components
(Hailegiorgis et al., 2011; Janmohammadi et al.,
2014).
Fig. 1. Bi-plot of first and second components for 31 different traits (Table 2) of 12 wheat genotypes subjected to normal and
moisture stress conditions in 2014–2015 growing season. A11- A20: ten Ae. tauschii accessions, BW1 and BW2: Shahriar and Pishgam cultivars respectively. Accessions in the oval are tolerant (A19) and susceptible (A16 and A14) to moisture stress
respectively. Bw2 is more drought-tolerant with greater yield than Bw1
Relationships among traits of economic
importance affect the breeding strategies along
with selection procedure. If all breeding
objectives were positively correlated, selection
would not be difficult than selecting for a single
trait. If all breeding objectives were either
positively correlated or independently inherited,
selection would not be too difficult either
(Mohammadi and Amri, 2011). Correlation
analysis helps to determination effective traits in
order to indirect selection superior genotypes.
The analysis of correlation among different
traits with grain yield can indicate the relative
importance of these traits and their merits as
selection criteria (Agrama, 1996). Correlation of
economical yield per plant (EYPP) with all of
the phenological traits was negative and highly
significant except GFP, and highly significant
with all of the morpho-physiological traits
except SPAD, FSNPP, and TN. In addition,
correlation coefficient of EYPP was highly
significant and negative with leaves number,
excised ELWR and WU in morpho-
physiological traits. Linked genes control the
above correlations for many phenological and
morpho-physiological traits, probably resulting
from that many of the traits (Deyong, 2011). In
addition, EYPP had a significant negative
correlation with ratio of root to shoot dry weight
(RDWSDW) in root-related traits. However, the
correlations between another root-related traits
and economical yield were not significant; such
a result indicates that the economical yield is
affected by the combination of root-related
traits. The present investigation revealed that
water use efficiency had a strong relation with
economical yield per plant, suggesting the need
for more emphasis on these components for
increasing the grain yield in wheat.

Moosavi et al. / Desert 22-2 (2017) 209-220
218
Table 7. Combined correlations between different traits of 12 wheat genotypes subjected to normal and moisture stress conditions during 2013–14 and 2014–15 growing seasons Traits SPAD PH PEL LN TN FSNPP SNPS SNPMS SNPP MSW SWPMS PEW MSTW TGW EYPP
PH 0.4
PEL 0.4 0.9**
LN -0.7* -0.6* -0.6*
TN -0.2 0.1 0.2 0.2
FSNPP -0.3 -0.4 -0.4 0.3 0.1
SNPS 0.3 0.9** 0.9** -0.5 0.3 -0.5
SNPMS 0.4 0.9** 0.9** -0.6* 0.2 -0.5 0.9**
SNPP 0.2 0.7** 0.7* -0.4 0.4 0.1 0.8** 0.8**
MSW 0.4 0.9** 0.9** -.06* 0.2 -0.5 0.9** 0.9** 0.7**
SWPMS 0.4 0.9** 0.9** -0.6* 0.2 -0.5 0.9** 0.9** 0.7** 0.9**
PEW 0.4 0.9** 0.9** -0.6* 0.2 -0.5 0.9** 0.9** 0.7* 0.9** 0.9**
MSTW 0.4 0.9** 0.9** -0.6* 0.2 -0.5 0.9** 0.9** 0.7* 0.9** 0.9** 0.9**
TGW 0.5 0.7* 0.7* -0.6* -0.1 -0.2 0.4 0.5 0.2 0.6 0.6* 0.5 0.5
EYPP 0.5 0.9** 0.9** -0.7* 0.1 -0.2 0.8** 0.8** 0.7* 0.9** 0.9** 0.9** 0.9** 0.8**
BYPP 0.3 0.9** 0.9** -0.7* 0.4 -0.3 0.9** 0.9** 0.8** 0.9** 0.9** 0.9** 0.9** 0.5 0.8**
PHI 0.4 0.8** 0.8** -0.6* 0.04 -0.1 0.5 0.6* 0.5 0.7* 0.7* 0.6* 0.6* 0.9** 0.9**
LAI 0.3 0.9** 0.9** -0.5 0.3 -0.5 0.9** 0.9** 0.7* 0.9** 0.9** 0.9** 0.9** 0.4 0.8**
RWC 0.4 0.7** 0.7* -0.8** 0.1 0.01 0.7* 0.7* 0.8** 0.7** 0.7* 0.7* 0.7* 0.4 0.7*
ELWR -0.2 -0.8** -0.8** 0.5 -0.3 -0.01 -0.6* -0.6* -0.7* -0.7* -0.7* -0.7* -0.7* -0.7* -0.8**
WU -0.4 -0.8** -0.8** 0.6* -0.1 -0.03 -0.6* -0.6* -0.7* -0.7* -0.7* -0.7* -0.7* -0.8** -0.9**
WUE 0.5 0.9** 0.9** -0.7** 0.2 -0.3 0.8** 0.9** 0.7** 0.9** 0.9** 0.9** 0.9** 0.8** 0.9**
DTH -0.5 -0.8** -0.8** 0.6* -0.1 0.02 -0.7* -0.7* -0.7* -0.7* -0.8** -0.7* -0.7* -0.7* -0.8**
DTA -0.5 -0.9** -0.9** 0.7* -0.1 0.1 -0.7* -0.7* -0.7* -0.8** -0.8** -0.8** -0.8** -0.7* -0.9**
DTM -0.5 -0.9** -0.9** 0.6* -0.2 0.2 -0.8** -0.8** -0.7* -0.9** -0.9** -0.9** -0.9** -0.7* -0.9**
GFP 0.2 0.2 0.06 -03 -0.3 0.3 0.05 -0.01 0.3 0.01 0.03 0.01 0.01 0.2 0.2
MRL -0.6* -0.4 -0.5 0.4 -0.2 0.2 -0.4 -0.3 -0.2 -0.3 -0.3 -0.3 -0.3 -0.5 -0.4
MRV 0.6* 0.3 0.4 -0.4 0.3 -0.1 0.3 0.4 0.3 0.4 0.4 0.4 0.4 0.3 0.5
RDW 0.1 -0.01 0.01 0.3 0.3 -0.1 0.2 0.2 0.2 0.1 0.1 0.1 0.1 -0.2 0.05
RA 0.1 -0.03 -0.03 0.02 0.1 -0.05 0.01 0.2 0.1 0.1 0.1 0.1 0.01 -0.1 0.1
RDWSDW -0.1 -0.7* -0.7* 0.6* -0.1 -0.1 -0.6* -0.6* -0.8** -0.6* -0.6* -0.6* -0.6* -0.4 -0.7*
Traits BYPP PHI LAI RWC ELWR WU WUE DTH DTA DTM GFP MRL MRV RDW RA
PHI 0.6*
LAI 0.9** 0.5
RWC 0.7* 0.5 0.7*
ELWR -0.7* -0.9** -0.7* -0.7*
WU -0.7* -0.9** -0.6* -0.7* 0.9**
WUE 0.8** 0.9** 0.8** 0.7* -0.8** -0.8**
DTH -0.8** -0.8** -0.7* -0.8** 0.8** 0.9** -0.8**
DTA -0.8** -0.8** -0.7* -0.8** 0.8** 0.9** -0.8** 0.9**
DTM -0.9** -0.9** -0.8** -0.7* 0.9** 0.9** -0.9** 0.9** 0.9**
GFP 0.1 0.2 -0.1 0.3 -0.1 -0.2 0.1 -0.5 -0.5 -0.1
MRL -0.3 -0.5 -0.3 -0.4 0.6* 0.5 -0.4 0.6* 0.6* 0.6 -0.3
MRV 0.4 0.3 0.3 0.2 -0.1 -0.4 0.5 -0.2 -0.2 -0.4 -0.2 -0.2
RDW 0.2 -0.1 0.1 -0.3 0.3 0.1 0.1 0.2 0.2 0.1 -0.3 0.3 0.7*
RA 0.1 -0.1 -0.04 -0.2 0.3 0.01 0.1 0.3 0.3 0.1 -0.5 0.5 0.8** 0.8**
RDWSDW -0.7* -0.5 -0.7* -0.9** 0.7* 0. 7* -0.7* 0.8** 0.8** 0.7* -0.5 0.2 0.1 0.4 0.4
F-probabilities are indicated by symbols: * significant differences at P < 0.05 and ** significant differences at P < 0.01
Moosavi et al. / Desert 22-2 (2017) 209-220
219
4. Conclusion
The present study revealed a very high inter-
genus diversity among the genotypes with
different response to imposed moisture stress.
For example, Gilan accession was less affected
by the imposed moisture stress than all the
Aegilops accessions. Indeed, Gilan and Pishgam
were proposed as efficient parents in the future
hybrid programs. Therefore, the current genetic
material is a valuable genetic resource for future
breeding programs under moisture stress
conditions. In our study, tolerant and susceptible
genotypes were separated using RWC and
ELWR very well. So that, high and low amount
of RWC and ELWR were respectively
suggested for tolerant genotype. Under these
circumstances, selection should be made for
increased water use efficiency and a high level
of RWC. Simultaneously, a high level of seed
number per spike, seed number per plant and
finally seed number m-2
, will lead to increase
potential harvest index. Finally, the traits of
WUE and seed number per plant and per main
spike were remarkably proposed to develop
desirable progenies in selection programs of
wheat. Meanwhile, grain-filling period, as a
phonological trait, had a big effect on grain
yield improvement in favorite A19 accession.
Acknowledgements
We are grateful to greenhouse management
of Bu-Ali Sina University and Graduate
University of Advanced Technology, Kerman,
Iran. The study was supported by Bu-Ali Sina
University (Hamedan, Iran) Grant No. 941-94
(Grant code: 4096).
References
Agrama, H.A.S., 1996. Sequential path analysis of grain
yield and its components in maize. Plant Breed, 115;
343-346.
Alizadeh, A., 2006. Soil water plant relationship. 2nd ed. The
Astane-Ghodse of Razavi Press.
Arminian, A., S. Houshmand, B. Shiran, 2010.
Evaluation the relationships between grain yield and
some of its related traits in a doubled-haploid bread
wheat population. Electronic Journal of Crop
Production, 3; 21-38.
Ashraf, M., 2010. Inducing drought tolerance in plants:
Recent advances. Biotechnology Advances, 28; 169-
183.
Ashraf, M., P.J.C. Harris, 2005. A-biotic stresses: plant
resistance through breeding and molecular
approaches. 1sd ed. Food Products Press. Oxford,
London.
Braun, H.J., G. Atlin, T. Payne, 2010. Multi-location
testing as a tool to identify plant response to global
climate change. Cereal Research Communications,
24;155-161.
Colmer, T.D., J. Flowers, R. Munns, 2006. Use of wild
relatives to improve salt tolerance in wheat. Journal
of Experimental Botany, 57; 1059-1078.
Del-Blanco, I.A., S. Rajaram, W.S. Kronstad, M.P. Reynolds,
2000. Physiological performance of synthetic hexaploid
wheat derived populations. Crop Science, 40; 1257-1263.
Deyong, Z., 2011. Analysis among main agronomic traits of
spring wheat (Triticum aestivum) in Qinghai Tibet Plateau.
Bulgarian Journal of Agricultural Sciences, 17; 615-622.
Entz, M.H., D.B. Fowler, 1990. Differential agronomic
response of winter wheat cultivars to pre-anthesis
environmental stress. Crop Science, 30; 1119-1123.
Falconer D.S., T.F.C. Mackay, 1996. Introduction to
quantitative genetics. 4th ed. Longman New York.
Farooq, S., T.M. Shah, M. Asghar, 1996. Intergeneric
hybridization for wheat improvement: v. production of and
metaphase 1 chromosome analysis in F1 hybrids of wheat
(Triticum aestivum) with Aegilops ovata L. Cereal
Research Communications, 24; 155-161.
Graybosch, R.A., C.J. Peterson, 2010. Genetic
improvement in winter wheat yields in the Great
Plains of North America, 1959-2008. Crop Science,
50; 1882-1890.
Gupta, R.B., F. Mac-Ritchie, 1994. Allelic variation at
gluteninsununit and gliadin loci, Glu-1, Glu-3 and
Gli-1, of common wheats. II. Biochemical basis of
the allelic effects on drought properties. Journal of
Cereal Sciences, 19; 19-29.
Hailegiorgis, D., M. Mesfin, T. Genet, 2011. Genetic
divergence analysis on some bread wheat genotypes
grown in Ethiopia. Journal of Central European
Agriculture, 12; 344-352.
Hajabbasi, M.A., 2001. Tillage effects on soil
compactness and wheat root morphology. Journal of
Agricultural Sciences and Technology, 3; 67-77.
Islam, M.R., 2004. Genetic diversity in irrigated rice.
Pakistan Journal of Biotechnology Sciences, 2; 226-
29.
Kaur, G., A. Joshi, D. Jain, R. Choudhary, D. Vyas,
2016. Diversity analysis of green gram (Vignara
diata (L.) Wilczek) through morphological and
molecular markers. Turkish Journal of Agriculture
and Forestry, 40; 229-240.
Leilah, A.A., S.A. Al-Khateeb, 2005. Statistical analysis
of wheat yield under drought conditions. Journal of
Arid Environments, 61; 483-496.
Malik, R., C.M. Smith, T.L. Harvey, G.L. Brownguedira,
2003. Genetic mapping of wheat curl mite resistance
genes Cmc3 and Cmc4 in common wheat. Crop Science,
43; 644-650.
Mguis, Kh., A. Albouchi, M. Abassi, A. Khadhri, M.
Ykoubi-Tej, A. Mahjoub, N. Ben Brahim, Z.
Ouerghi, 2013. Responses of leaf growth and gas
exchanges to salt stress during reproductive stage in
wild wheat relative Aegilops geniculata Roth. and
wheat (Triticum durum Desf.). Acta Physiologiae
Plantarum, 35; 1453–1461.
Mguis, Kh., N. Ben Brahim, A. Albouchi, M. Yakkoubi-Tej,
A. Mahjoub, Z. Ouerghi, 2008. Phenotypic responses of
the wild wheat relative Aegilops geniculata Roth and
wheat (Triticum durum Desf.) to experimentally imposed
salt stress. Genetic Resources and Crop Evolution, 55;
665–674.
Mohammadi, R., A. Amri, 2011. Graphic analysis of
trait relations and genotype evaluation in durum
wheat. Journal of Crop Improvement, 25; 680-696.

Moosavi et al. / Desert 22-2 (2017) 209-220
220
Moosavi S.S., F. Kian-Ersi, M.R. Abdollahi, 2013.
Application of multivariate statistical methods in detection
of effective traits on bread wheat yield under moisture
stress conditions. Cereal Research, 3; 119-130.
Moosavi, S.S., M. Zahedi-No, M. Chaichi, M.R. Abdollahi,
2014. Assessment of diversity and identifying of effective
traits on grain yield of barely under non-stress and terminal
moisture stress conditions. Cereal Research, 4; 67-85.
Munir M, M.A. Chowdhry, T.A. Malik, 2007.
Correlation studies among yield and its components
in bread wheat under drought conditions.
International Journal of Agriculture and
Biotechnology, 9; 287-90.
Naghavi, M.R., M. Mardi, 2010. Characterization of
genetic variation among accessions of Aegilops
tauschii. AsPac. Journal of Molecular Microbiology
and Biotechnology, 18; 93-96.
Navabpour, S., G. Kazemi, 2013. Study the relations
between grain yield and related traits in wheat by path
analysis. Electronic Journal of Crop Production, 6; 191-
203.
Özturk, A., S. Bayram, K. Haliloglu, M. Aydin, O.
Caglar, S. Bulut, 2014. Characterization for drought
resistance at early stages of wheat genotypes based
on survival, coleoptile length, and seedling vigor.
Turkish Journal of Agriculture and Forestry, 38; 824-
837.
Rajaram, S., 2001. Prospects and promise of wheat breeding
in the 21st century. Euphytica, 119; 3-15.
Ranjbar, A., A.R. Sepaskhah, S. Emadi, 2015.
Relationships between wheat yield, yield components
and physico-chemical properties of soil under rain-
fed conditions. International Journal of Plant
Production 9; 433-465.
Reddy, N, M..E. Nicolas, G.M. Halloran, 1993. Evaluating
Triticum tauschii as a source of drought tolerance for wheat.
Protocols of Tenth Australian Plant Breeding Conference, 2;
99-100.
Sadras V.O., 1990. Transpiration, transpiration
efficiency and harvest index in sunflower (Helianthus
Annuus L.). Diss. University of Melbourne.
Schachtman, D.P., E.S. Lagudah, R. Munns, 1992. The
expression of salt tolerance from Triticum tauschii in
hexaploid wheat. Theory and Applied Genetics, 84; 714-
719.
Sohail, Q., T. Inoue, H. Tanaka, A.E Eltayeb, Y. Matsuoka, H.
Tsujimoto, 2011. Applicability of drought tolerance traits to
breeding of hexaploid wheat. Breeding Science, 61; 347-357.
Tomar, S.M.S., G.T. Kumar, 2004. Seedling survival as
a selection criterion for drought tolerance in wheat.
Plant Breeding, 123; 392–394.
Van Ginkel, M., D.S. Calhoun, G. Gebeyeho, A.
Mirenda, C. Tainyou, R. Pargas Lara,
R.M. Trethowan, K. Saure, J. Crossa, S. Rajaram,
1998. Plant traits related to yield of wheat in early,
late or continuous drought conditions. Euphytica,
100; 109-121.
Van Slageren, M.W., 1994. Wild wheats: a monograph
of Aegilops L. and Amblyopyrum (Jaub. etSpach) Eig
(Poaceae). Agricultural University, Wageningen –
International Center for Agricultural Research in Dry
Areas, Aleppo, Syria.
Wallace, D.H., R.W. Zobel, 1992. Efficient genetic gain in
yield requires selection and use of parent of genotypes
with the highest rates of biomass accumulation. Abstracts
Supplement of the First International Crop Science
Congress, Ames, IA, pp. 12.
Yan, W., I.R. Rajcan, 2002. Biplot analysis of test sites
and trait relations of soybean in Ontario. Canadian
Journal of Plant Science, 42;11–20.
Yasir, T.A., D. Min, X. Chen, A.G. Condon, Y.G. Hu,
2013. The association of carbon isotope discrimination
with gas exchange parameters and yield traits in Chinese
bread wheat cultivars under two water regimes.
Agricultural Water Management, 119; 111-120.
Zaharieva, M, E. Gaulin, M. Havaux, E. Acevedo, P.
Monneveux, 2001. Drought and heat response in the
wild wheat relative Aegilops geniculata Roth:
potential interest for wheat improvement. Crop
Science, 41;1321-1329.
Recommended