IOSR Journal of Mechanical and Civil Engineering (IOSR-JMCE)
e-ISSN: 2278-1684,p-ISSN: 2320-334X, Volume 11, Issue 3 Ver. VIII (May- Jun. 2014), PP 20-26
www.iosrjournals.org
www.iosrjournals.org 20 | Page
Response Surface Methodology for Optimization of Process
Parameters in Abrasive Jet Drilling of Composites
D. V. Srikanth1, Dr. M. Sreenivasa Rao
2
1Department of Mechanical Engineering, St Martin’s Engineering College, Secunderabad, A.P. India
2Dept. Of Mechanical Engineering, JNTUH, Kukatpally, Hyderabad, A.P. India.
Abstract: Abrasive jet machining is an Emerging machining process in which the metal removal takes place
due to abrasion. A stream of abrasive particles mixed with carrier gas (generally air) is subjected to the work
surface with high velocity (150-300 m/Sec). The abrasive particles used for this machining are Silicon carbide,
Aluminium oxide, boron carbide, etc. This process is effectively adopted for cleaning, polishing, deburring,
drilling and cutting of Hard and Brittle materials. Abrasive jet cutting involves a high velocity jet of air with
entrained Abrasive particles onto the material to be cut. In the present study focused on experimental research
and evaluation of the abrasive jet drilling process in order to evaluate the technological factors affecting the
Metal Removal rate of FRP Composite of various thickness using Optimization modelling called Response
Surface Methodology and The adequacy of the model is evaluated using analysis of variance (ANOVA)
technique.
Keywords: abrasive jet cutting, optimization, CFRP composite, analysis of variance
I. Introduction Composites are the type of materials made from two or more constituent materials with significantly
different physical or chemical properties, that when combined, produce a material with characteristics different
from the individual components. The individual components remain separate and distinct within the finished
structure. The new material may be preferred for many reasons: common examples include materials which are
stronger, lighter or less expensive when compared to traditional materials.
Composite materials are commonly used for bridges and structures such h as boatulls, swimming pool
panels, race car bodies, bath tubs, storage tanks, imitation granite and cultured marble sinks and counter tops.
The most advanced examples perform routinely on spacecraft in demanding environments.
FRP Composite is most widely used fiber in high performance applications which is produced from a
variety of precursors, including polycrylonitrile, rayon and pitch. The precursor fibers are heated and stretched
to create the high strength fibers.
Abrasive jet machining (AJM) removes material through the action of abrasion where a focused stream
of abrasive- gas mixture on to the work area. Micro-abrasive particles are propelled by inert gas (air) at
velocities of up to 300 m/sec. By directing the beam at a work piece, the result in erosion can be used for
cutting, etching, cleaning, deburring, polishing, and drilling. Material removal occurs through a chipping action,
which is especially effective on hard, brittle materials such as glass, composites, silicon, tungsten, and ceramics.
Soft, resilient materials, such as rubber and some plastics resist the chipping action and thus are not effectively
processed by AJM.
No work piece chatter or vibration occurs with this process because the large enables AJM to produce
fine, intricate detail extremely brittle objects. The AJM processed eggshell provides a graphic example of the
delicate nature of the process. In addition because heat carried away by the abrasive propellant gas, work pieces
experience no thermal damage.
A few attempts have been made to model and optimize the process parameters in AJM. The approaches
employed in this direction include design of experiments (DOE), Taguchi, RSM & analysis of variance
(ANOVA) etc.
Response Surface Methodology for Optimization of Process Parameters in Abrasive Jet Drilling of
www.iosrjournals.org 21 | Page
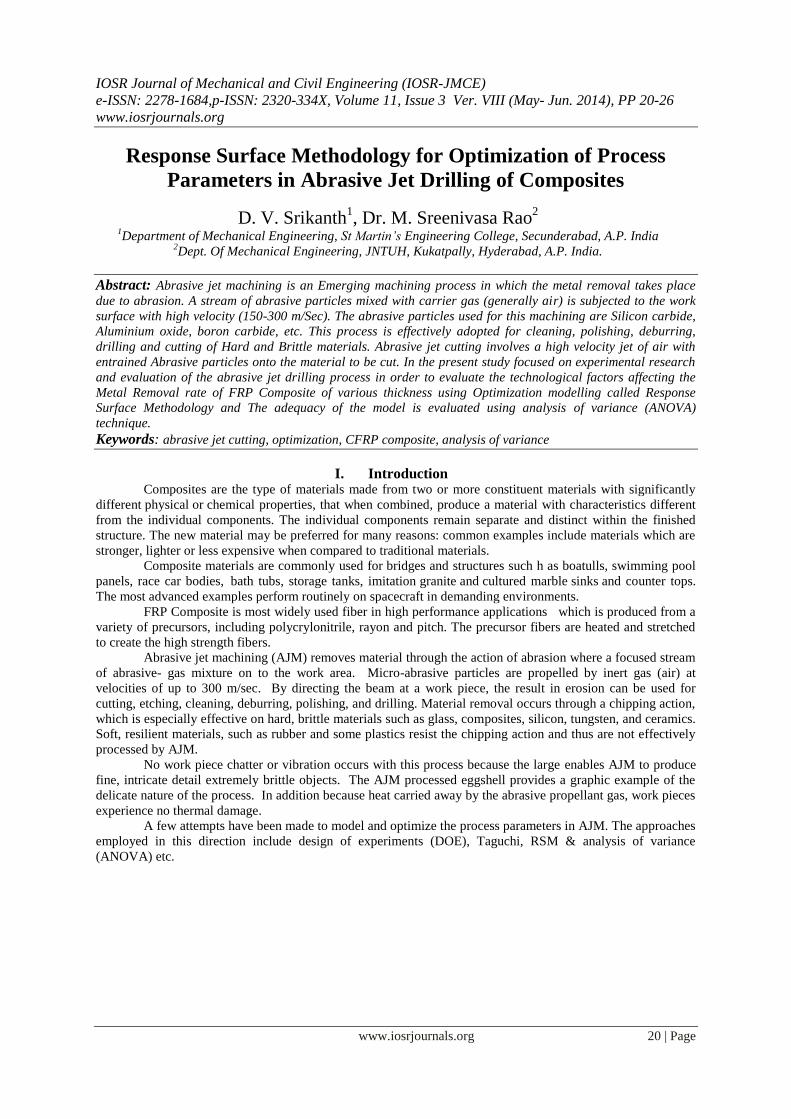
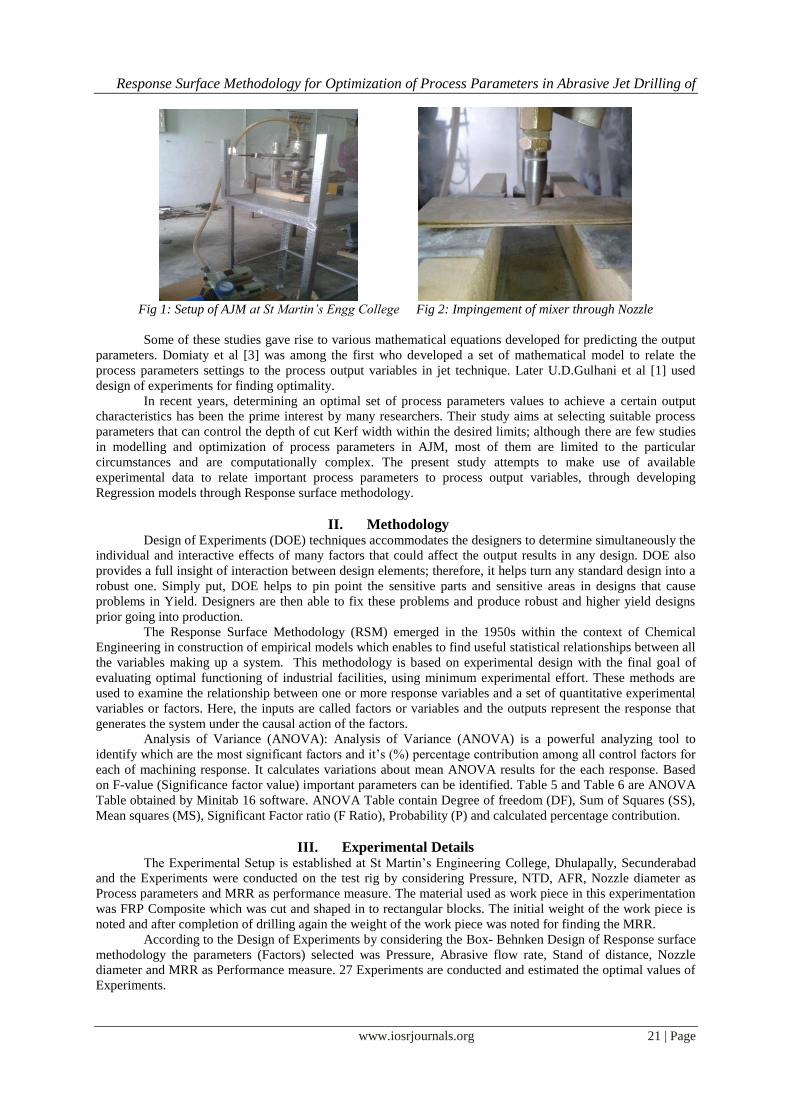
Fig 1: Setup of AJM at St Martin’s Engg College Fig 2: Impingement of mixer through Nozzle
Some of these studies gave rise to various mathematical equations developed for predicting the output
parameters. Domiaty et al [3] was among the first who developed a set of mathematical model to relate the
process parameters settings to the process output variables in jet technique. Later U.D.Gulhani et al [1] used
design of experiments for finding optimality.
In recent years, determining an optimal set of process parameters values to achieve a certain output
characteristics has been the prime interest by many researchers. Their study aims at selecting suitable process
parameters that can control the depth of cut Kerf width within the desired limits; although there are few studies
in modelling and optimization of process parameters in AJM, most of them are limited to the particular
circumstances and are computationally complex. The present study attempts to make use of available
experimental data to relate important process parameters to process output variables, through developing
Regression models through Response surface methodology.
II. Methodology Design of Experiments (DOE) techniques accommodates the designers to determine simultaneously the
individual and interactive effects of many factors that could affect the output results in any design. DOE also
provides a full insight of interaction between design elements; therefore, it helps turn any standard design into a
robust one. Simply put, DOE helps to pin point the sensitive parts and sensitive areas in designs that cause
problems in Yield. Designers are then able to fix these problems and produce robust and higher yield designs
prior going into production.
The Response Surface Methodology (RSM) emerged in the 1950s within the context of Chemical
Engineering in construction of empirical models which enables to find useful statistical relationships between all
the variables making up a system. This methodology is based on experimental design with the final goal of
evaluating optimal functioning of industrial facilities, using minimum experimental effort. These methods are
used to examine the relationship between one or more response variables and a set of quantitative experimental
variables or factors. Here, the inputs are called factors or variables and the outputs represent the response that
generates the system under the causal action of the factors.
Analysis of Variance (ANOVA): Analysis of Variance (ANOVA) is a powerful analyzing tool to
identify which are the most significant factors and it’s (%) percentage contribution among all control factors for
each of machining response. It calculates variations about mean ANOVA results for the each response. Based
on F-value (Significance factor value) important parameters can be identified. Table 5 and Table 6 are ANOVA
Table obtained by Minitab 16 software. ANOVA Table contain Degree of freedom (DF), Sum of Squares (SS),
Mean squares (MS), Significant Factor ratio (F Ratio), Probability (P) and calculated percentage contribution.
III. Experimental Details The Experimental Setup is established at St Martin’s Engineering College, Dhulapally, Secunderabad
and the Experiments were conducted on the test rig by considering Pressure, NTD, AFR, Nozzle diameter as
Process parameters and MRR as performance measure. The material used as work piece in this experimentation
was FRP Composite which was cut and shaped in to rectangular blocks. The initial weight of the work piece is
noted and after completion of drilling again the weight of the work piece was noted for finding the MRR.
According to the Design of Experiments by considering the Box- Behnken Design of Response surface
methodology the parameters (Factors) selected was Pressure, Abrasive flow rate, Stand of distance, Nozzle
diameter and MRR as Performance measure. 27 Experiments are conducted and estimated the optimal values of
Experiments.
Response Surface Methodology for Optimization of Process Parameters in Abrasive Jet Drilling of
www.iosrjournals.org 22 | Page
Table 1: Parameters with levels for Experimentation
Table 2 : Experiments conducted Based on Box-Behnkn Design
S.No. StdOrder Run Order PtType Blocks Pressure AFR SOD ND MRR
1 23 1 2 1 6 3 8 4 0.0331
2 19 2 2 1 4 4 10 3 0.0253
3 21 3 2 1 6 3 8 2 0.0204
4 24 4 2 1 6 5 8 4 0.0365
5 1 5 2 1 4 3 8 3 0.0263
6 7 6 2 1 6 4 6 4 0.0393
7 9 7 2 1 4 4 8 2 0.0261
8 5 8 2 1 6 4 6 2 0.0152
9 27 9 0 1 6 4 8 3 0.0353
10 8 10 2 1 6 4 10 4 0.0467
11 18 11 2 1 8 4 6 3 0.0403
12 26 12 0 1 6 4 8 3 0.0353
13 6 13 2 1 6 4 10 2 0.0287
14 11 14 2 1 4 4 8 4 0.0239
15 15 15 2 1 6 3 10 3 0.0352
16 12 16 2 1 8 4 8 4 0.0657
17 14 17 2 1 6 5 6 3 0.0209
18 22 18 2 1 6 5 8 2 0.0297
19 16 19 2 1 6 5 10 3 0.0301
20 3 20 2 1 4 5 8 3 0.0236
21 25 21 0 1 6 4 8 3 0.0338
22 17 22 2 1 4 4 6 3 0.0182
23 10 23 2 1 8 4 8 2 0.0576
24 20 24 2 1 8 4 10 3 0.0643
25 4 25 2 1 8 5 8 3 0.0614
26 13 26 2 1 6 3 6 3 0.0232
27 2 27 2 1 8 3 8 3 0.0584
3.1 Box- Behnken Design
Factors: 4 Replicates: 1
Base runs: 27 Total runs: 27
Base blocks: 1 Total blocks: 1
Centre points: 3
3.2 Optimal Design: Pressure, AFR, SOD, ND
Response surface design selected using distance-based optimality
Number of candidate design points: 27
Number of design points in optimal design: 3
Number of factors: 4
Row number of selected design points: 24, 22, 2
Smallest distance between optimal points: 4.0000
Largest distance between optimal points: 5.6569
Process Parameters Units Levels
-1 0 1
Pressure Kg/cm2 4 6 8
Abrasive Flow Rate gm/min 3 4 5
Stand of Distance mm 6 8 10
Nozzle diameter mm 2 3 4
Response Surface Methodology for Optimization of Process Parameters in Abrasive Jet Drilling of
www.iosrjournals.org 23 | Page
50.03
4
0.04
0.05
4
0.06
6 38
MRR
AFR
Pressure
10
0.02 8
0.04
0.06
46 6
8
MRR
SOD
Pressure
4
0.02 3
0.04
0.06
46 2
8
MRR
ND
Pressure
10
0.020
0.025
8
0.030
0.035
34 6
5
MRR
SOD
AFR
40.025
3
0.030
0.035
0.040
34 2
5
MRR
ND
AFR
40.02
3
0.03
0.04
68 2
10
MRR
ND
SOD
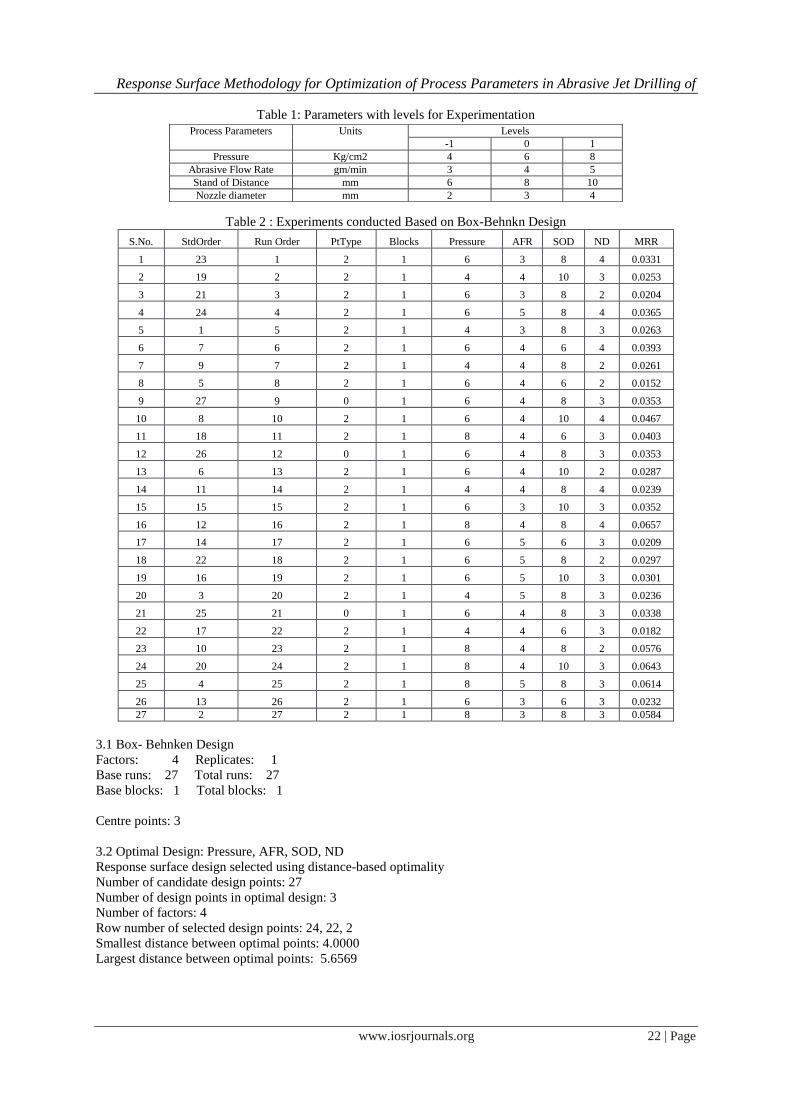
Pressure 6
AFR 4
SOD 8
ND 3
Hold Values
Surface Plots of MRR Vs Pr,SOD,AFR& Nozzle Diameter
Fig 3: Surface plots of MRR Vs Parameters
3.3 Regression Coefficient
Response Surface Regression: MRR versus Pressure, AFR, SOD, ND
The analysis was done using coded units.
Table 3 : Estimated Regression Coefficients for MRR Term Coef SE Coef T P
Constant 0.0348 0.002981 11.674 0
Pressure 0.017027 0.001491 11.424 0
AFR 0.000467 0.001491 0.313 0.76
SOD 0.006102 0.001491 4.094 0.001
ND 0.005625 0.001491 3.774 0.003
Pressure*Pressure 0.008569 0.002236 3.833 0.002
AFR*AFR -0.002972 0.002236 -1.329 0.208
SOD*SOD -0.004393 0.002236 -1.965 0.073
ND*ND 0.00004 0.002236 0.018 0.986
Pressure*AFR 0.001425 0.002582 0.552 0.591
Pressure*SOD 0.004233 0.002582 1.639 0.127
Pressure*ND 0.002575 0.002582 0.997 0.338
AFR*SOD -0.0007 0.002582 -0.271 0.791
AFR*ND -0.001475 0.002582 -0.571 0.578
SOD*ND -0.001525 0.002582 -0.591 0.566 S = 0.00516343 PRESS = 0.00183754
R-Sq = 94.25% R-Sq (pred) = 66.98% R-Sq (adj) = 87.54%
A FR*Pressure
864
5.0
4.5
4.0
3.5
3.0
SO D*Pressure
864
10
9
8
7
6
ND*Pressure
864
4.0
3.5
3.0
2.5
2.0
SO D*A FR
543
10
9
8
7
6
ND*A FR
543
4.0
3.5
3.0
2.5
2.0
ND*SO D
1086
4.0
3.5
3.0
2.5
2.0
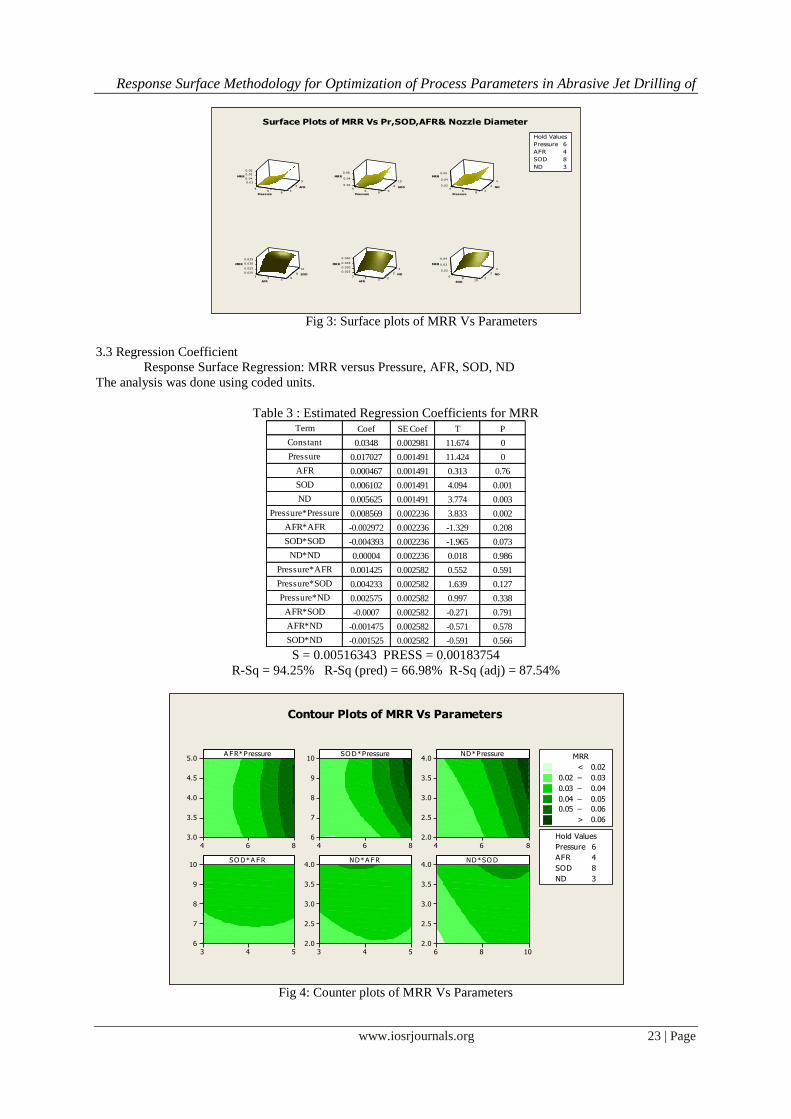
Pressure 6
AFR 4
SOD 8
ND 3
Hold Values
>
–
–
–
–
< 0.02
0.02 0.03
0.03 0.04
0.04 0.05
0.05 0.06
0.06
MRR
Contour Plots of MRR Vs Parameters
Fig 4: Counter plots of MRR Vs Parameters
Response Surface Methodology for Optimization of Process Parameters in Abrasive Jet Drilling of
www.iosrjournals.org 24 | Page
3.4 Analysis of Variance for MRR
The RSM values obtained by Box- Behnken Design are validated by Analysis of variance. It calculates
variations about mean ANOVA results for the each response. Based on F-value (Significance factor value)
important parameters can be identified. Table 5 and Table 6 are ANOVA Table obtained by Minitab 16
software. ANOVA Table contain Degree of freedom (DF), Sum of Squares (SS), Mean squares (MS),
Significant Factor ratio (F Ratio), Probability (P) and calculated percentage contribution
3.5 ANOVA VALIDATION
General Linear Model: MRR versus Pressure, AFR, SOD, ND
Table 4 : Factors and their levels with values Factor Type Levels Values
Pressure fixed 3 4, 6, 8
AFR fixed 3 3, 4, 5
SOD fixed 3 6, 8, 10
ND fixed 3 2, 3, 4
Analysis of Variance for MRR, using Adjusted SS for Tests
Table 5 : Analysis of Variance for MRR, using Adjusted SS for Tests Source DF Seq SS Adj SS Adj MS F P
Pressure 2 0.0041505 0.00 0.0019354 78.08 0
AFR 2 0.0000253 0.00 0.0000249 1 0.386
SOD 2 0.0005634 0.00 0.0002749 11.09 0.001
ND 2 0.0003797 0.00 0.0001898 7.66 0.004
Error 18 0.0004462 0.00 0.0000248
Total 26 0.0055651
S = 0.00497883 R-Sq = 91.98% R-Sq(adj) = 88.42%
3.6 Unusual Observations for MRR
Table 6 :Unusual Observation for MRR with St Residual and Fits
Obs MRR Fit SE Fit Residual St Resid
6 0.0393 0.029970 0.0028750 0.009330 2.30 R
R denotes an observation with a large standardized residual.
Analysis of variance table gives the significance parameter effect on MRR. The significant parameters
can be easily identified. Traverse speed and Stand of distance has p -value almost <0.05. Hence for Surface
roughness these parameters are much significant. Abrasive flow rate does not much affect the MRR. Percentage
Contribution of residual error is 2.30 %. Pressure has maximum percentage contribution (78.08 %) and %
percentage contribution of Stand of distance was 11.09 %, Nozzle diameter has 7.66 %.
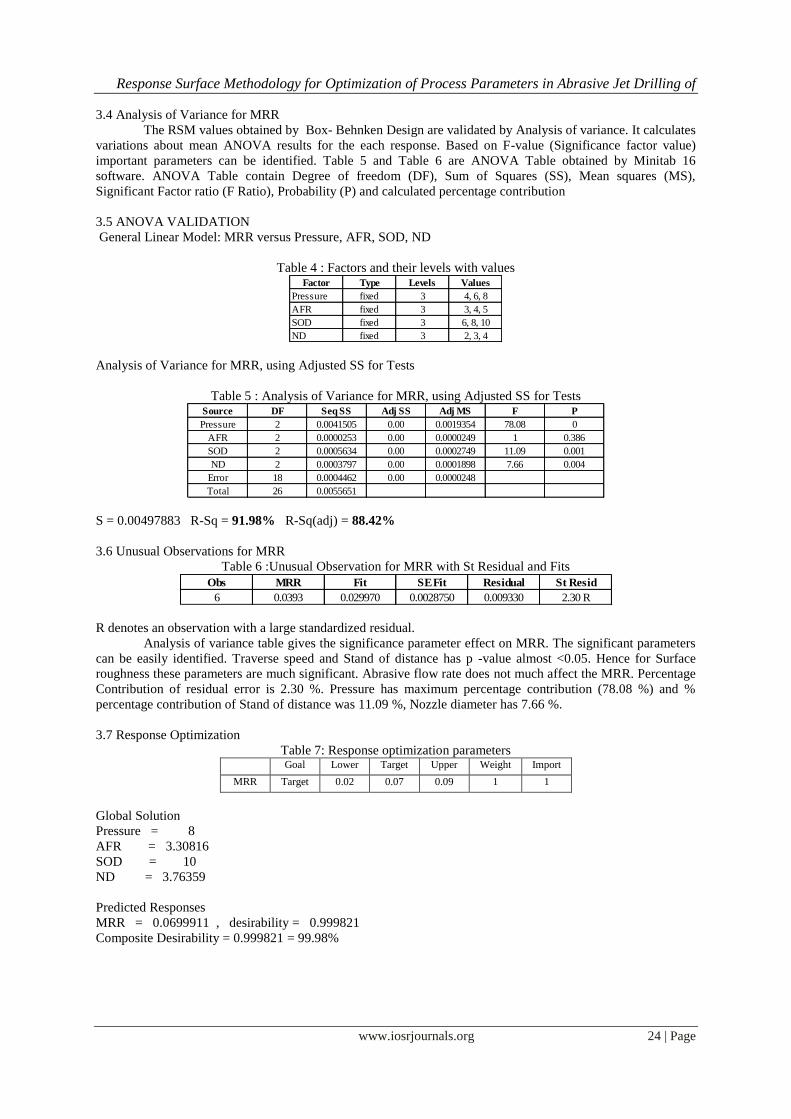
3.7 Response Optimization
Table 7: Response optimization parameters Goal Lower Target Upper Weight Import
MRR Target 0.02 0.07 0.09 1 1
Global Solution
Pressure = 8
AFR = 3.30816
SOD = 10
ND = 3.76359
Predicted Responses
MRR = 0.0699911 , desirability = 0.999821
Composite Desirability = 0.999821 = 99.98%
Response Surface Methodology for Optimization of Process Parameters in Abrasive Jet Drilling of
www.iosrjournals.org 25 | Page
CurHigh
Low0.99982D
Optimal
d = 0.99982
Targ: 0.070
MRR
y = 0.0700
0.99982
Desirability
Composite
2.0
4.0
6.0
10.0
3.0
5.0
4.0
8.0AFR SOD NDPressure
[8.0] [3.3082] [10.0] [3.7636]
Fig 5 : Graph indicates the effect of Parameters on MRR in Response Optimization
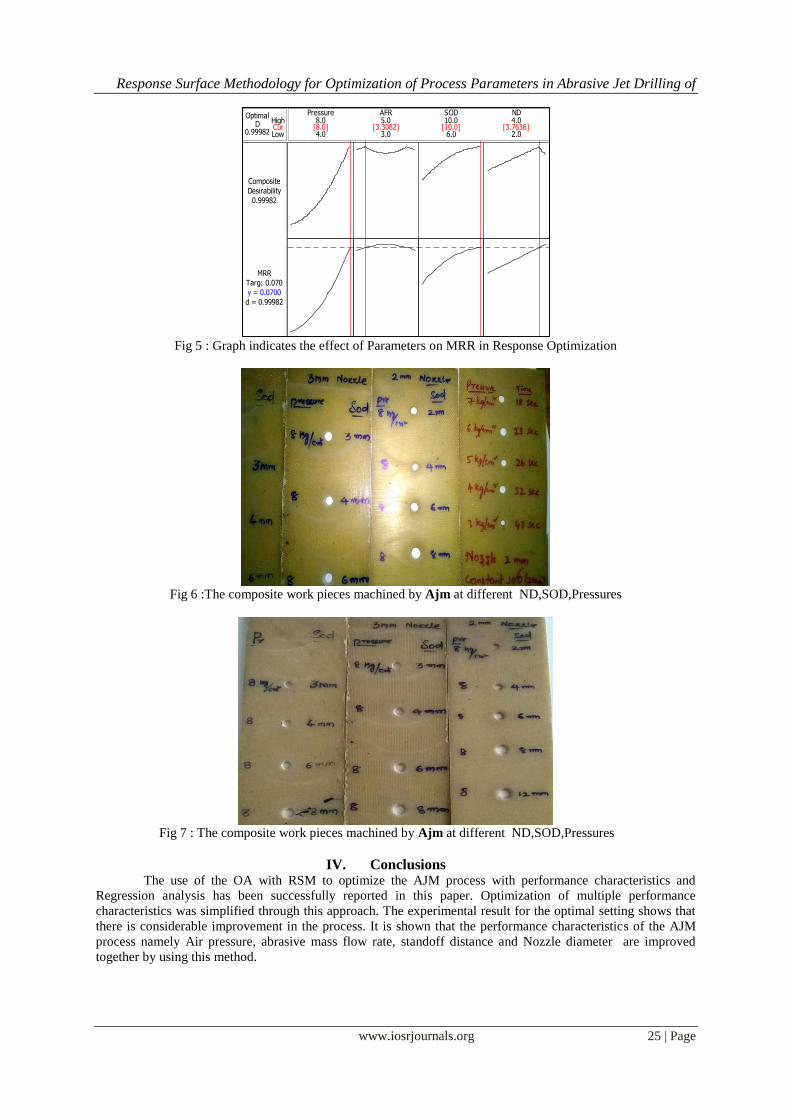
Fig 6 :The composite work pieces machined by Ajm at different ND,SOD,Pressures
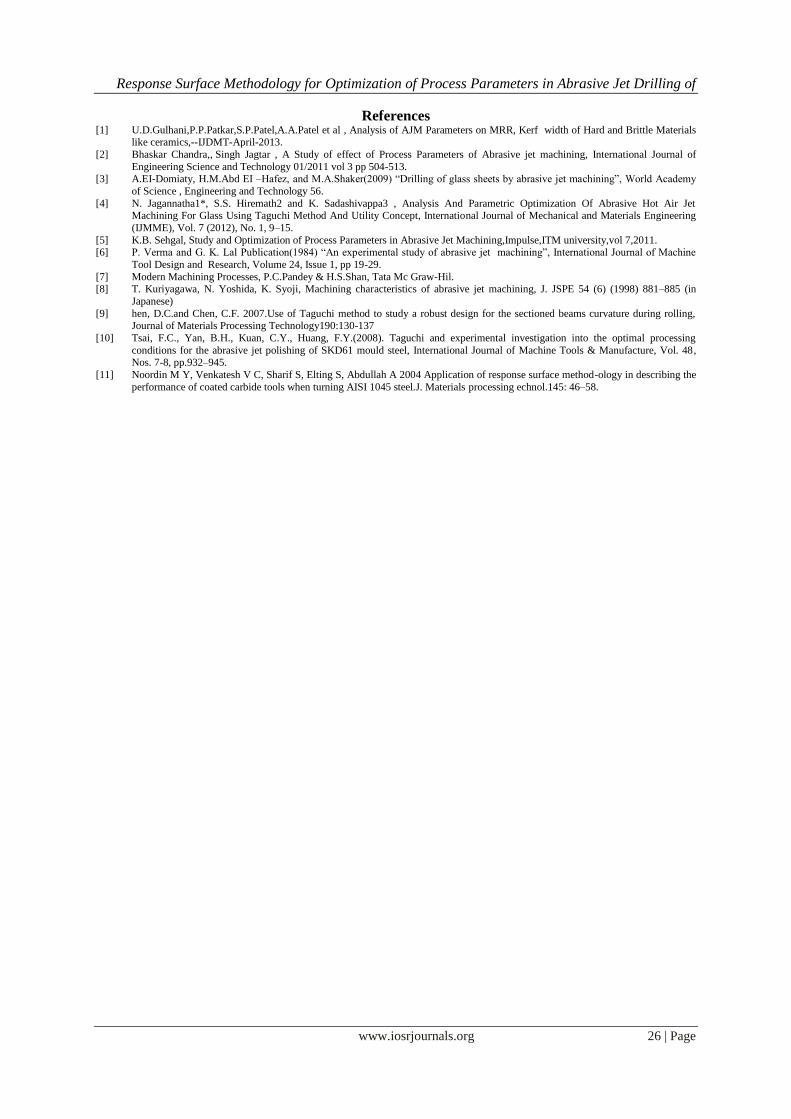
Fig 7 : The composite work pieces machined by Ajm at different ND,SOD,Pressures
IV. Conclusions The use of the OA with RSM to optimize the AJM process with performance characteristics and
Regression analysis has been successfully reported in this paper. Optimization of multiple performance
characteristics was simplified through this approach. The experimental result for the optimal setting shows that
there is considerable improvement in the process. It is shown that the performance characteristics of the AJM
process namely Air pressure, abrasive mass flow rate, standoff distance and Nozzle diameter are improved
together by using this method.
Response Surface Methodology for Optimization of Process Parameters in Abrasive Jet Drilling of
www.iosrjournals.org 26 | Page
References [1] U.D.Gulhani,P.P.Patkar,S.P.Patel,A.A.Patel et al , Analysis of AJM Parameters on MRR, Kerf width of Hard and Brittle Materials
like ceramics,--IJDMT-April-2013.
[2] Bhaskar Chandra,, Singh Jagtar , A Study of effect of Process Parameters of Abrasive jet machining, International Journal of
Engineering Science and Technology 01/2011 vol 3 pp 504-513. [3] A.EI-Domiaty, H.M.Abd EI –Hafez, and M.A.Shaker(2009) “Drilling of glass sheets by abrasive jet machining”, World Academy
of Science , Engineering and Technology 56.
[4] N. Jagannatha1*, S.S. Hiremath2 and K. Sadashivappa3 , Analysis And Parametric Optimization Of Abrasive Hot Air Jet Machining For Glass Using Taguchi Method And Utility Concept, International Journal of Mechanical and Materials Engineering
(IJMME), Vol. 7 (2012), No. 1, 9–15.
[5] K.B. Sehgal, Study and Optimization of Process Parameters in Abrasive Jet Machining,Impulse,ITM university,vol 7,2011. [6] P. Verma and G. K. Lal Publication(1984) “An experimental study of abrasive jet machining”, International Journal of Machine
Tool Design and Research, Volume 24, Issue 1, pp 19-29.
[7] Modern Machining Processes, P.C.Pandey & H.S.Shan, Tata Mc Graw-Hil. [8] T. Kuriyagawa, N. Yoshida, K. Syoji, Machining characteristics of abrasive jet machining, J. JSPE 54 (6) (1998) 881–885 (in
Japanese)
[9] hen, D.C.and Chen, C.F. 2007.Use of Taguchi method to study a robust design for the sectioned beams curvature during rolling, Journal of Materials Processing Technology190:130-137
[10] Tsai, F.C., Yan, B.H., Kuan, C.Y., Huang, F.Y.(2008). Taguchi and experimental investigation into the optimal processing
conditions for the abrasive jet polishing of SKD61 mould steel, International Journal of Machine Tools & Manufacture, Vol. 48, Nos. 7-8, pp.932–945.
[11] Noordin M Y, Venkatesh V C, Sharif S, Elting S, Abdullah A 2004 Application of response surface method-ology in describing the
performance of coated carbide tools when turning AISI 1045 steel.J. Materials processing echnol.145: 46–58.
Recommended