Paper ID #14484
Research Learning Experience while Designing Wind Turbine for Low SpeedWind Applications
Dr. Adeel Khalid, Kennesaw State University
Adeel Khalid, Ph.D. Associate Professor Systems Engineering Office: 678-915-7241
Mr. Christopher Douglas Roper, Kennesaw State University
Enrolled in a dual-degree program with the University of West Georgia and Kennesaw State University(formally Southern Polytechnic State University). Senior engineering student double majoring in physicsand mechanical engineering with minors both in aerospace engineering and mathematics. Expertise bothin the professional industry and with laboratory experience. Performed engineering and scientific appli-cations under engineers and scientists as a materials intern, physics and engineering researcher/teacher’sassistant, and mechanical engineer coop. Placed 2nd in the 2015 FRC Technical Research ExhibitionPoster Presentation and 3rd in the 2015 FRC Technical Research Exhibition Oral Presentation in RegionIII for National Society of Black Engineers.
c©American Society for Engineering Education, 2016
Research Learning Experience while Designing Wind Turbine for
Low Speed Wind Applications
Abstract
Extracting the maximum amount of energy in various slow wind regions using low-speed wind
turbines has provided challenges. The focus of this research project is to explore several factors
to help analyze and distinguish the most efficient wind turbine blade designs. The researchers
test the design the wind turbine blades by implementing two methods; Computational Fluid
Dynamic analysis and 3-D printed prototype testing using Windlab laboratory apparatus. The
data and analysis helps determine how to maximize the power extraction from wind energy. The
value of undergraduate research experience is highlighted.
Keywords
Low speed wind turbine, blade design, Computational Fluid Dynamic analysis.
Introduction and Theory
Wind turbine energy methods and the usage of electrical power have been in practice for more
than a century. Wind energy has been investigated heavily due in part to the detrimental
environmental impacts of the use of fossil fuels and high price of fuel consumption. Scientists
and engineers have developed numerous designs and modifications of many wind turbines.
Typically wind farms are concentrated in the high-speed wind locations, and generally located in
west mid-west of the United States. On the other hand, low speed wind occurrences –
specifically in the eastern U.S. provides these regions an opportunity to complement the
renewable energy for high demand energy consuming areas. Application of wind resources and
its feasibility in Georgia are explored.
In low speed wind occurrences, wind travels at up to 9.1 mph, or 4.07 m/s5. Low wind speeds
can be harnessed to provide maximum extracted power from the Atlanta metropolitan city,
county outskirts, and the coast of Savannah, Georgia. With careful consideration of the physical
design of the wind turbine blade, improvements and modification in extracted power from low
speed winds is possible. In this ongoing study, researchers explore low speed wind turbine
designs, and experimentally test them for low speed environmental conditions using laboratory
apparatus. Analysis from computational fluid dynamics demonstrates that variation of the twist
angle and taper ratio result in a greater lift force coefficient with minimal drag force coefficient.
To validate the computational fluid analysis, 3-D printed prototype of the most promising turbine
blades are experimentally tested. A geometric baseline blade design is chosen to preform trial
experiments. Two promising designs, with variations in taper ratio and blade twist angle, are
carefully analyzed based on their parameter modifications. 3-D printed fabrication and wind
tunnel experimentation is performed to compare the results with those obtained from the CFD
analysis.
Literature Review
Wind turbine energy can be generated by two forms of energy, mechanical and electrical.
Satpathy et al present a control strategy for the operation of a variable speed stand-alone wind
turbine7. As wind travels in the pathway of the wind turbine, which consists of electrical
generator, shaft and rotor blades, the blades will experience forces that cause them to overcome
the inertia and then start extracting power from the free stream. Richardson et al discuss the
development of the wind energy system and highlight the operating and design principles8.
Sahin9 also highlights the importance of wind energy and summarizes how this clean, practical,
economical and environmentally friendly energy source has garnered renewed interest in this
technology in the twenty first century. There are two types of blade designs frequently used,
horizontal axis wind turbines (HAWTs) and vertical axis wind turbines (VAWTs); both systems
have the potential to be aerodynamically optimized2. The blades are essentially based on the lift
principle from aerodynamics, similar to the effects of an aircraft wing. Broe and Howell
highlight the potential use of small wind turbines in horizontal and vertical axis configurations11,
12. Detailed CFD analyses have been performed in various studies conducted by Abdullah,
Alessandro, Francesco et al13-15
. Physics based models describe that an increase of a fluid flow,
such as air, results in a decrease of pressure. With the wind turbine, the pressure below the blade
will be greater than the air pressure above the blade, thus a lift force is generated1. The
mechanical energy of the rotation of the blades generates torque to produce electrical energy
within the system; this allows the electricity to be harnessed8. Wind tunnel testing and other
experimental analyses have been conducted in studies performed by Treuren, Emejeamara and
Dossena16-18
. These studies have shown the efficacy and importance of wind turbines for small
energy utilization environments.
The vertical wind turbines are used to optimize energy utilization. Slow wind speeds are optimal
for a mini power generation systems. Various methods are investigated to achieve maximum
efficiency from the wind turbine. Studies show that the changes in the geometric parameters of a
wind turbine such as the number of blades, radius of blades, blade chord etc. can affect the
amount of power extraction2. These parameters help determine how much of the energy from the
wind can be extracted. Betz, determined theoretically and experimentally that the most energy
that any device can extract is 59% of the total energy contained in the wind source2.
Methodology
The National Renewable Energy Laboratory Phase VI wind turbine blade3 is investigated for
Computational Fluid Dynamic (CFD) validation study. The process consists of maximizing
power production from the aerodynamic design of a winglet for a wind turbine blade. The study
utilizes the computational fluid analysis tool. The NREL VI experiment conducted by Elfarral,
Monier A., Nilay Sezer Uzol, and Sinan Akmandor3 is replicated to help understand,
demonstrate, as well as validate the researchers’ findings. The parametric model consists of 19
sections with the structure of National Renewable Energy Laboratory cylindrical base section of
the S809 airfoil. The validation for the NREL Phase VI CFD simulation is conducted using
Solidworks. This software allows design, and development of windmill blades and
computational fluid dynamic (CFD) analysis. In this case study, 5ms-1
wind speed is used since it
replicates the wind conditions in the local regions of Georgia. In this research, final results show

a comparison of the validation study and the experimental analyses at 5ms-1
. Figure 1 shows the
final computer aided 3-D model of the designed NREL VI geometric blade for test comparison.
(a) (b)
Figure 1: NREL Phase VI 3D geometric blade design;
(a) Reverse isometric view of NREL CAD design. (b) Isometric view of NREL CAD design.
The validation comparison is made between Normal Force Coefficient CN and the Non-
dimensional Span at 5ms-1
. Figure 2 shows the validator’s experimental results that measure at
30%, 47%, 63%, 80%, and 95% span of the blade where the normal force coefficient can be
displayed at each geometric section.
Figure 2: Normal Force Coefficient CN versus the Non-dimensional Span at 5ms-1
from NREL
VI Experiment3
The computational fluid analysis is conducted at the same experimental parameters and
conditions as those used in the study performed by Elfarral, Monier A., Nilay Sezer Uzol, and
Sinan Akmandor3. Non-dimensional normal force on the blades is calculated as a function of the

blade span and plotted for the CFD and experimental analyses and compared with the results
obtained by Elfarra et al3. It can be observed that the results obtained from the validation study
match closely with those of the published results. The process helps calibrate the CFD tool for
further analyses as described in this paper.
Figure 3: Normal Force Coefficient CN versus the Non-dimensional Span at 5ms-1
validation
study.
Design Specifications
The wind turbine blade selection that is enhanced and developed in this study is the Turbine
Technologies blade model. The turbine blade model is instrumented and conducted in the
Windlab apparatus shown in Figure 4.
(a) Windlab wind tunnel (b) Close up view on wind turbine rotor mechanism
Figure 4: Turbine Technologies Windlab Apparatus. Courtesy of Turbine Technologies
A baseline blade model is chosen. Incremental changes are made to the baseline by making
modifications to each of the variables. The variables such as maximum chord, twist angle, taper
ratio etc. are increased or decreased by 10%, 15%, 20% with respect to the initial baseline. The
objective of varying the design parameters, shown in Table 1, is to explore and identify the most
0
0.1
0.2
0.3
0.4
0.5
0.6
0.3 0.47 0.63 0.8 0.95
Validation Resultant Chart: Variation on Lift Force
Coefficent at 5ms-1
CFD(Published)
Experimental
CFD Results
Nondimensional Span Length r/R
Norm
alF
orc
eC
oef
fici
ent
CN

efficient combination of design modifications for maximum power extraction at low speed wind
conditions. A total of thirty models are created in order to explore the incremental changes of the
wind turbine blades. One variable is changed at a time from the baseline parameters. For an
example, starting with max chord, there are six modifications. These range between -20 and
+20% of the baseline value with 5% increments and replace the original baseline value of the
max chord. The rest of the parameters in the baseline column remain constant. This results in six
different max chord modifications to the baseline. When this process is repeated for each row in
the variables section, it results of 30 unique blade designs. Table 1 represents the variables that
change due its modified parameters from the baseline design.
Table 1: Variable and parameter design specifications for Windlab Turbine Technologies Blade.
From the parameter and variable table, the designs are carefully studied and analyzed based on
various factors. It is critical to test all designs in CFD analysis even if the theoretical predictions
on some CAD models are not reasonable. For example, the +10, +15, +20 Span increase
variations exceed the physical boundary of the Windlab wind tunnel apparatus during
installation. With the baseline model complete, several modifications are made to the CAD
model with respect to the variables and parameters chart shown in
Computational Analysis
The designed models are carefully studied and analyzed based on the data gathered from
computational fluid analysis. The computer aided windmill blades are exposed to a wind velocity
of 5 ms-1
in the horizontal x-directional plane. The lift and drag force equations are used to
calculate the lift and drag coefficients. Lift force and drag forces are represented by Eq. (1) and
Eq. (2) respectively:
� =�
����ρ
� (1)
=�
����ρ�
� (2)
Variables Parameters
20% 15% 10% Baseline -10% -15% -20%
Max.
Chord (m) 0.115824 0.110998 0.106172 0.09652 0.086868 0.082042 0.077216
Twist
Angle
(degrees)
48.72 46.69 44.66 40.6 36.54 34.51 32.48
Taper
Ratio 0.789468 0.7565735 0.723679 0.65789 0.592101 0.559206 0.526312
Angle of
Incidences
(degrees)
72.84 69.805 66.77 60.7 54.63 51.595 48.56
Number
of Blades 3 3 3 3 3 2.55 3
Span (m) 0.50292 0.481965 0.46101 0.4191 0.37719 0.356235 0.33528
CL is representing coefficient of lift force, CD defining the coefficient of drag force, ρ depicting
density of air, V representing the freestream velocity, A displaying the area for the body section.
The lift and drag equations are programed into the Solidworks software to compute the
aerodynamic parameter. The baseline of the fundamental design is the first to be experimentally
tested using the computerized simulated wind tunnel. Final results are collected and plotted with
respect to specific span sections of the turbine blade. Proceeding with all CAD models, each one
is tested with the same parameters and constraints as the baseline model for consistency. With
careful and detailed analysis, best designed characteristics are selected for further exploration
and study.
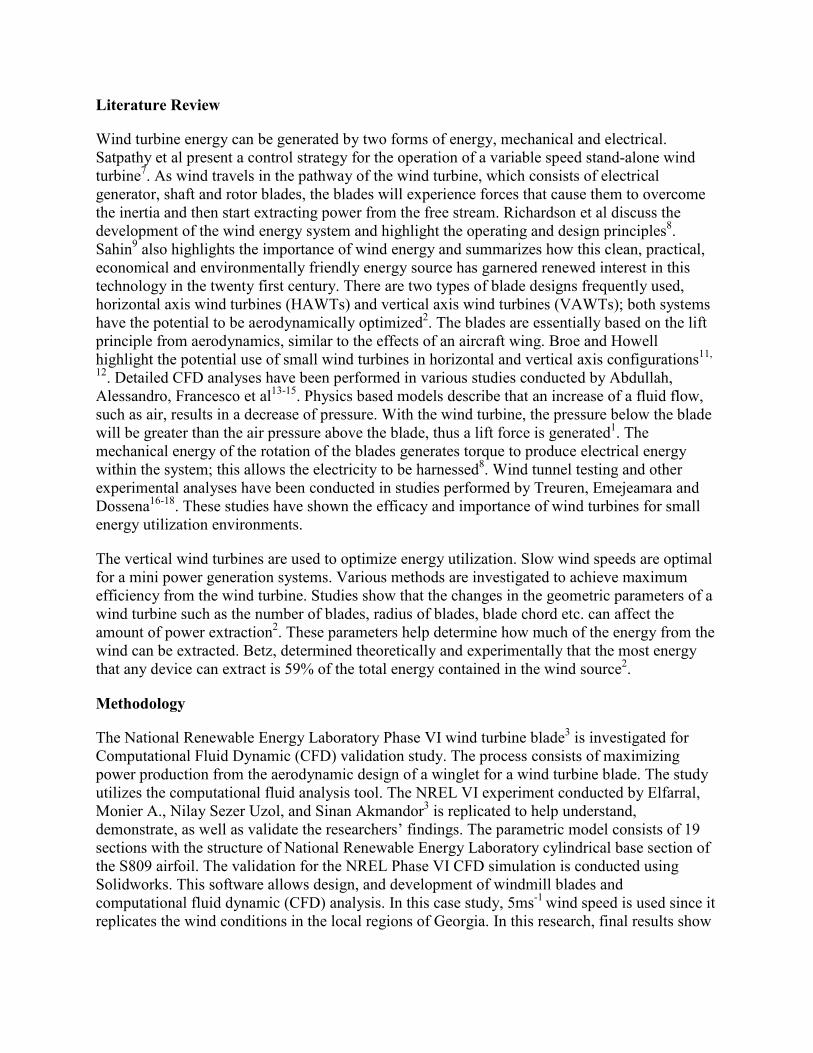
As the span increases, the impact results in the coefficient of lift and drag decreasing linearly.
The increase in span will cause the blade to gain more mass, resulting a greater force to
overcome the inertial threshold rotation velocity. This will also cause the turbine blade to mimic
a drag plate, thus increasing the coefficient of drag significantly. From the variations of span
modifications, the +10% increase in span displays the most desirable lift and drag coefficient. As
the taper ratio increases, the coefficient of lift increases. On the other hand, as the taper ratio
decreases the coefficient of drag increases proportionally. The+10% and +20% increase in taper
ratio theoretically provide the most promising results, yet the -20% taper ratio displays an
average consistency from both drag and lift force coefficient overall.
Figure 5: (a) Baseline wind analysis in geometric view. (b) Baseline wind CFD frontal analysis
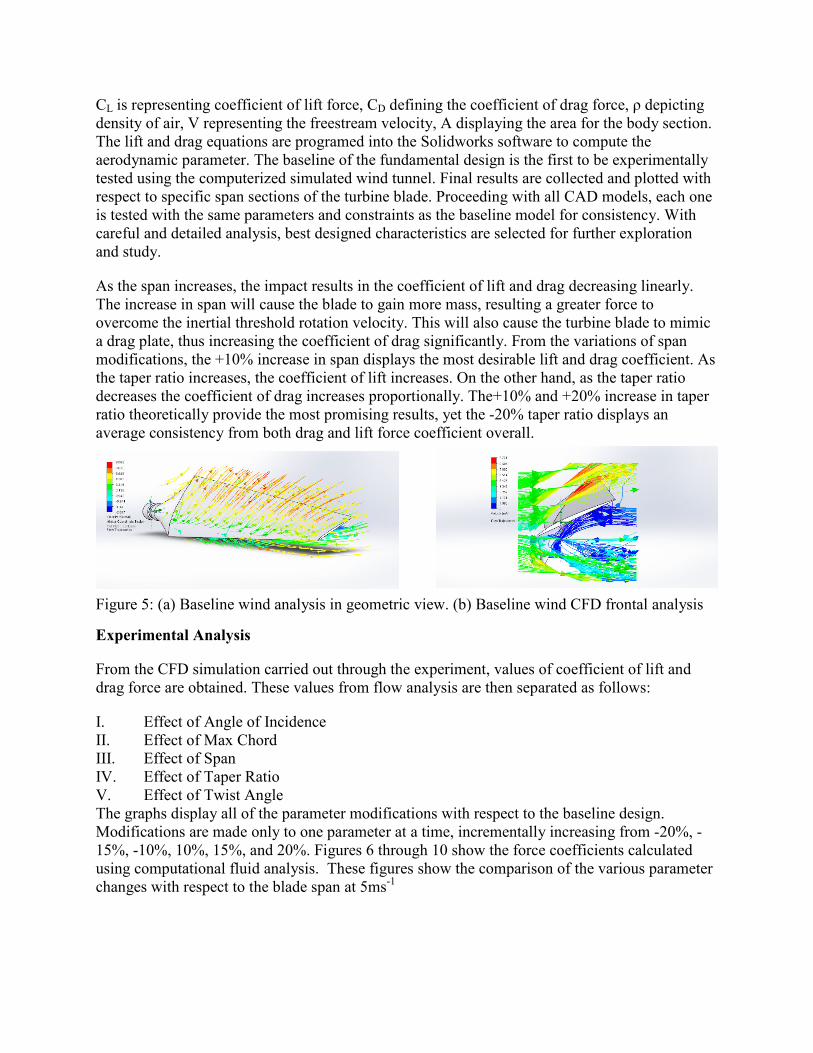
Experimental Analysis
From the CFD simulation carried out through the experiment, values of coefficient of lift and
drag force are obtained. These values from flow analysis are then separated as follows:
I. Effect of Angle of Incidence
II. Effect of Max Chord
III. Effect of Span
IV. Effect of Taper Ratio
V. Effect of Twist Angle
The graphs display all of the parameter modifications with respect to the baseline design.
Modifications are made only to one parameter at a time, incrementally increasing from -20%, -
15%, -10%, 10%, 15%, and 20%. Figures 6 through 10 show the force coefficients calculated
using computational fluid analysis. These figures show the comparison of the various parameter
changes with respect to the blade span at 5ms-1
Figure 6: Normal force coefficient specification for Angle of Incidence at 5ms-1
Figure 7: Normal and Tangential force coefficient specification for Max Chord at 5ms-1
Figure 8: Normal and Tangential force coefficient specification for Span at 5ms-1
0
1
2
3
4
0.3 0.47 0.63 0.8 0.95
Effect of Angle of Incidence variation
on Drag force from baseline at 5m/s
10 15% 20%-10% -15% -20%Baseline
Tan
gen
tial
F
orc
e C
oef
fici
ent
CD
Non-dimensional Span r/R-3
-2.5
-2
-1.5
-1
-0.5
0
0.3 0.47 0.63 0.8 0.95
Effect of Angle of Incidence variation on
Lift force from baseline at 5m/s
10 15% 20% -10%
-15% -20% Baseline
No
rmal
Fo
rce
Co
effi
cien
t C
N
Non-dimensional Span r/R
-3
-2
-1
0
0.3 0.47 0.63 0.8 0.95
Effect of Max Chord variation on Lift
force from baseline at 5m/s
10 15% 20%
-10% -15% -20%
Baseline
Non-dimensional Span r/R
Norm
alF
orc
eC
oef
fici
ent
CN
0
2
4
6
0.3 0.47 0.63 0.8 0.95
Effect of Max Chord variation on
Drag force from baseline at 5m/s
10 15% 20%-10% -15% -20%Baseline
Nondimensional Span Length r/R
Tan
gen
tial
F
orc
e C
oef
fici
ent
CD
-6
-4
-2
0
0.3 0.47 0.63 0.8 0.95
Effect of Span variation on Lift force
from baseline at 5m/s
10 15% 20%-10% -15% -20%Baseline
No
rmal
Fo
rce
Co
effi
cien
t C
N
Non-dimensional Span r/R
0
5
10
0.3 0.47 0.63 0.8 0.95
Effect of Span variation on Drag force
from baseline at 5m/s
10 15% 20%-10% -15% -20%Baseline
Non-dimensional Span r/R
Tan
gen
tial
F
orc
e C
oef
fici
ent
CD
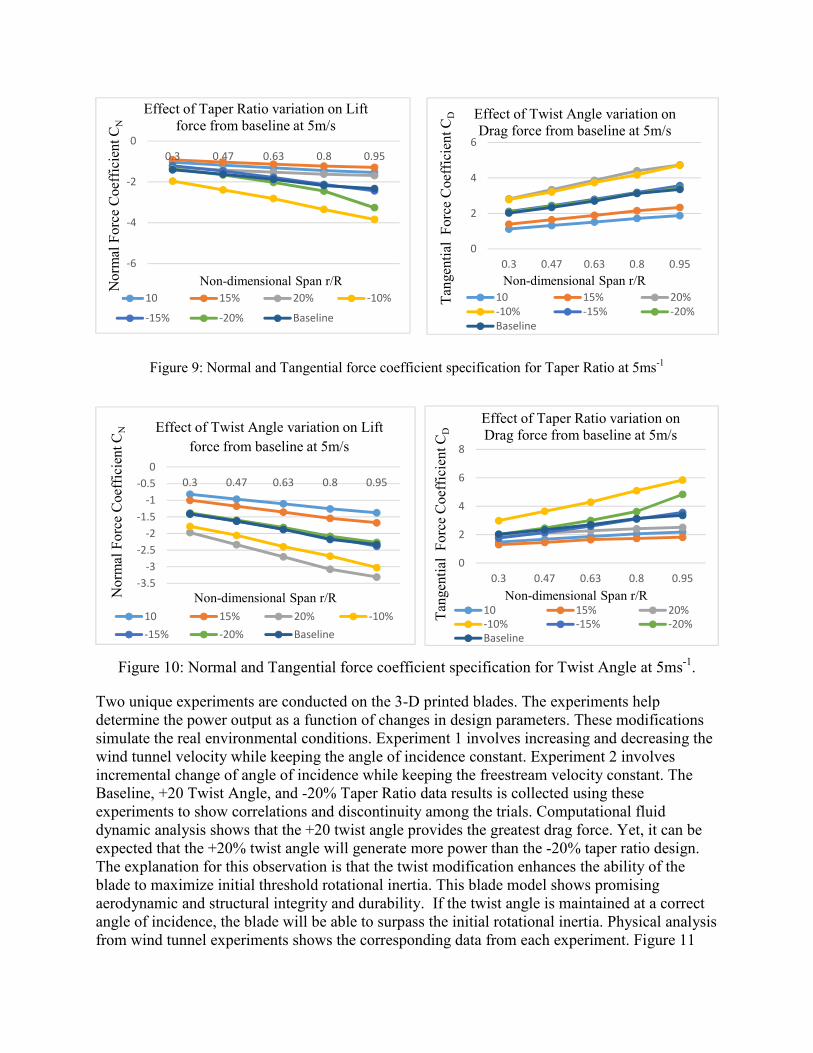
Figure 9: Normal and Tangential force coefficient specification for Taper Ratio at 5ms-1
Figure 10: Normal and Tangential force coefficient specification for Twist Angle at 5ms-1
.
Two unique experiments are conducted on the 3-D printed blades. The experiments help
determine the power output as a function of changes in design parameters. These modifications
simulate the real environmental conditions. Experiment 1 involves increasing and decreasing the
wind tunnel velocity while keeping the angle of incidence constant. Experiment 2 involves
incremental change of angle of incidence while keeping the freestream velocity constant. The
Baseline, +20 Twist Angle, and -20% Taper Ratio data results is collected using these
experiments to show correlations and discontinuity among the trials. Computational fluid
dynamic analysis shows that the +20 twist angle provides the greatest drag force. Yet, it can be
expected that the +20% twist angle will generate more power than the -20% taper ratio design.
The explanation for this observation is that the twist modification enhances the ability of the
blade to maximize initial threshold rotational inertia. This blade model shows promising
aerodynamic and structural integrity and durability. If the twist angle is maintained at a correct
angle of incidence, the blade will be able to surpass the initial rotational inertia. Physical analysis
from wind tunnel experiments shows the corresponding data from each experiment. Figure 11
-6
-4
-2
0
0.3 0.47 0.63 0.8 0.95
Effect of Taper Ratio variation on Lift
force from baseline at 5m/s
10 15% 20% -10%
-15% -20% Baseline
Non-dimensional Span r/RNo
rmal
Fo
rce
Co
effi
cien
t C
N
0
2
4
6
0.3 0.47 0.63 0.8 0.95
Effect of Twist Angle variation on
Drag force from baseline at 5m/s
10 15% 20%
-10% -15% -20%
Baseline
Non-dimensional Span r/R
Tan
gen
tial
F
orc
e C
oef
fici
ent
CD
-3.5
-3
-2.5
-2
-1.5
-1
-0.5
0
0.3 0.47 0.63 0.8 0.95
10 15% 20% -10%
-15% -20% Baseline
Non-dimensional Span r/RNorm
alF
orc
eC
oef
fici
ent
CN Effect of Twist Angle variation on Lift
force from baseline at 5m/s
0
2
4
6
8
0.3 0.47 0.63 0.8 0.95
Effect of Taper Ratio variation on
Drag force from baseline at 5m/s
10 15% 20%
-10% -15% -20%
Baseline
Non-dimensional Span r/R
Tan
gen
tial
F
orc
e C
oef
fici
ent
CD

displays Experiment 1 results. Results show that the -20% taper ratio has the greatest power
output slope over the range of wind speeds. The +20 Twist model has a slightly stronger power
output than the baseline model.
Figure 11: Experiment 1- Twist Angle and Taper Ratio constant angle of incidence with speed
increase/decrease.
The shallowest slope comes from the baseline model that demonstrates that the modified
parameters hold stronger power output than the baseline design. Results of Experiment 2 are
shown in Figure 12. The data shows a skewed collection for the Twist Angle variation. The
baseline model remains at a constant negative slope as the angle of incidence changes. The
maximum power the baseline model delivers is at 48.58 degrees angle of incidence. The reason
is that as the pitch angle is increased over a fixed hub, the wind turbine blade essentially reaches
a steep angle. The angle will cause the wind blade to act as a drag plate, therefore increasing the
drag force, minimizing power output. Possible reasons for variations in power extraction are the
limitations of the plastic fabricated blade, gear friction among the rotational turbine gears, skin
friction, induced drag etc. The fabrication is a critical variable since the assembly is dependent
on the design. The design might have some flaws where air pocket can cause air to seep and
form stagnation points within the segmented joints of the turbine blade. This will cause a
stagnant pressure to develop in the center of the body not allowing airflow to occur along the z-
axis of the blade.
y = 2.97x - 6.8958
R² = 0.752-3
-2
-1
0
1
2
1.5 2 2.5 3
Power (W
atts)
Speed Variation (m/s)
Taper Ratio -20% - Experiment 1: Constant
Angle of Incidence Increase/Decrease Wind
Speeds
Power
Linear
(Power)y = 1.9411x - 4.6843
R² = 0.5119-3
-2
-1
0
1
1.5 2 2.5 3
Power (W
atts)
Speed Variation (m/s)
Twist Angle +20% - Experiment 1: Constant
Angle of Incidence- Increase/Decrease Wind
Speeds
Power
Linear
(Power)
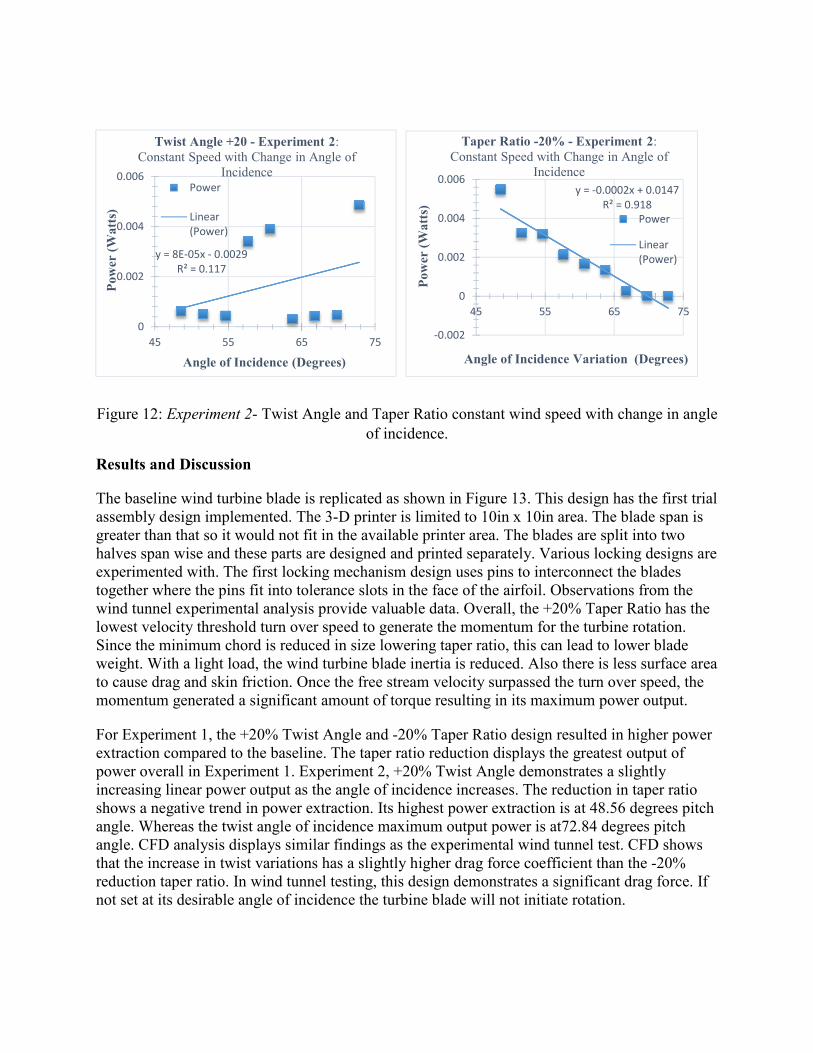
Figure 12: Experiment 2- Twist Angle and Taper Ratio constant wind speed with change in angle
of incidence.
Results and Discussion
The baseline wind turbine blade is replicated as shown in Figure 13. This design has the first trial
assembly design implemented. The 3-D printer is limited to 10in x 10in area. The blade span is
greater than that so it would not fit in the available printer area. The blades are split into two
halves span wise and these parts are designed and printed separately. Various locking designs are
experimented with. The first locking mechanism design uses pins to interconnect the blades
together where the pins fit into tolerance slots in the face of the airfoil. Observations from the
wind tunnel experimental analysis provide valuable data. Overall, the +20% Taper Ratio has the
lowest velocity threshold turn over speed to generate the momentum for the turbine rotation.
Since the minimum chord is reduced in size lowering taper ratio, this can lead to lower blade
weight. With a light load, the wind turbine blade inertia is reduced. Also there is less surface area
to cause drag and skin friction. Once the free stream velocity surpassed the turn over speed, the
momentum generated a significant amount of torque resulting in its maximum power output.
For Experiment 1, the +20% Twist Angle and -20% Taper Ratio design resulted in higher power
extraction compared to the baseline. The taper ratio reduction displays the greatest output of
power overall in Experiment 1. Experiment 2, +20% Twist Angle demonstrates a slightly
increasing linear power output as the angle of incidence increases. The reduction in taper ratio
shows a negative trend in power extraction. Its highest power extraction is at 48.56 degrees pitch
angle. Whereas the twist angle of incidence maximum output power is at72.84 degrees pitch
angle. CFD analysis displays similar findings as the experimental wind tunnel test. CFD shows
that the increase in twist variations has a slightly higher drag force coefficient than the -20%
reduction taper ratio. In wind tunnel testing, this design demonstrates a significant drag force. If
not set at its desirable angle of incidence the turbine blade will not initiate rotation.
y = 8E-05x - 0.0029
R² = 0.117
0
0.002
0.004
0.006
45 55 65 75
Power (W
atts)
Angle of Incidence (Degrees)
Twist Angle +20 - Experiment 2:
Constant Speed with Change in Angle of
IncidencePower
Linear
(Power)
y = -0.0002x + 0.0147
R² = 0.918
-0.002
0
0.002
0.004
0.006
45 55 65 75
Power (W
atts)
Angle of Incidence Variation (Degrees)
Taper Ratio -20% - Experiment 2:
Constant Speed with Change in Angle of
Incidence
Power
Linear
(Power)

Figure 13: Baseline pin locking mechanism replica of Wind Turbine Technologies turbine blade
The baseline model is exposed to various experiments to physically test its structural integrity
and flexibility. During one of the tests, the baseline turbine blade is destroyed and severed at its
joints. Figure 14 shows the aftermath during one of the structural integrity tests. This occurred
due to the failure of the adhesive glue and pin joints. The glue that is experimentally in use is a
fast plastic glue bond, able to mend the bond among the two joints and inside the slots within
several short minutes. After observational analysis, it is concluded that fast glue adhesive is
weaker in strength. The bondage does not have enough time to fully mature the and therefore
weakens the durability of the ABS Plastic material. The overall pin design is not able to handle
the centrifugal forces at its joints. In this design, the pin is the only member holding the wind
turbine blades together while rotating at increasing velocities.
Figure 14: Baseline blade failure of Wind Turbine Technologies model.
A slow bond adhesive is used to join the two parts of the blades together after the failure.
Because the bonding takes longer time to set, the joint is more durable. After reconstructing and
applying the new slow bond, the baseline blade displays promising durability during wind tunnel
testing. The failure of the pin design helps design a new locking mechanism and component.
Three particular designs are generated for analysis; key lock, single t-shape lock, and double t-
shape lock. The key lock is ruled out because it has too many failure fault points, a similar
characteristic to the pin design. The single t-shape lock appeared to have potential, but has a
higher possibility of wanting to rotate at its joints. This design will create a moment at its axis
due to no other lever arm preventing it from rotating. Figure 15 displays the design locking
mechanisms.
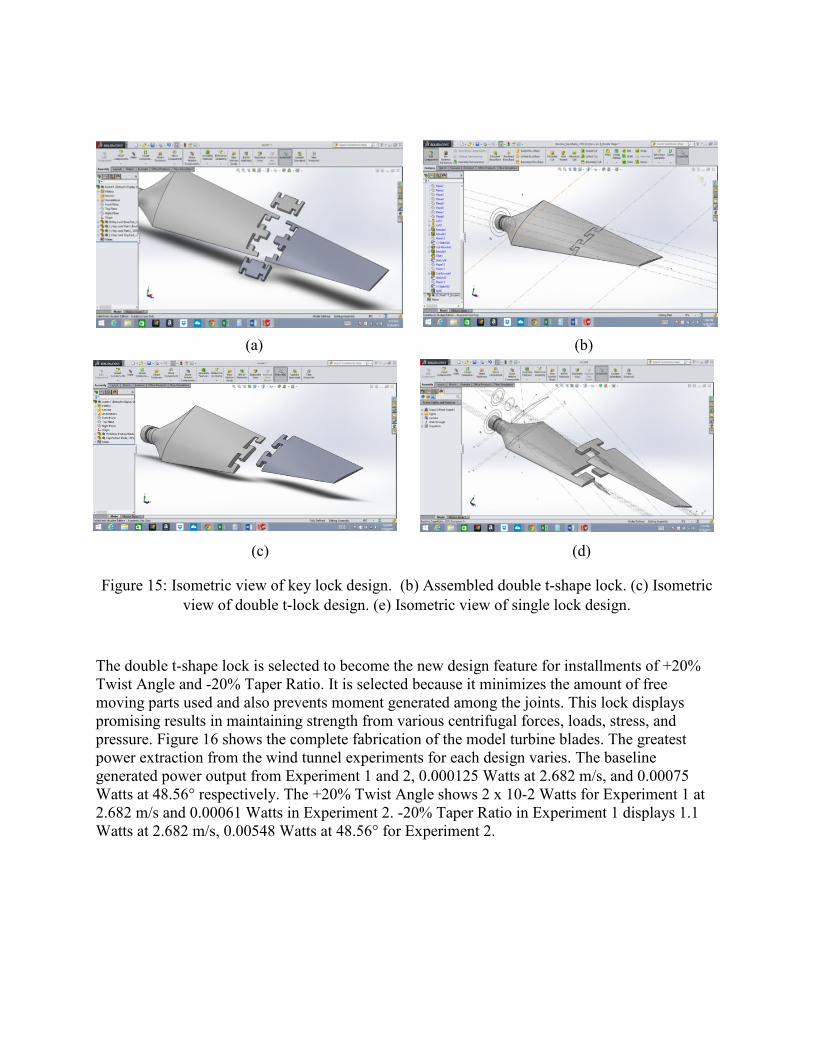
(a) (b)
(c) (d)
Figure 15: Isometric view of key lock design. (b) Assembled double t-shape lock. (c) Isometric
view of double t-lock design. (e) Isometric view of single lock design.
The double t-shape lock is selected to become the new design feature for installments of +20%
Twist Angle and -20% Taper Ratio. It is selected because it minimizes the amount of free
moving parts used and also prevents moment generated among the joints. This lock displays
promising results in maintaining strength from various centrifugal forces, loads, stress, and
pressure. Figure 16 shows the complete fabrication of the model turbine blades. The greatest
power extraction from the wind tunnel experiments for each design varies. The baseline
generated power output from Experiment 1 and 2, 0.000125 Watts at 2.682 m/s, and 0.00075
Watts at 48.56° respectively. The +20% Twist Angle shows 2 x 10⁻² Watts for Experiment 1 at
2.682 m/s and 0.00061 Watts in Experiment 2. -20% Taper Ratio in Experiment 1 displays 1.1
Watts at 2.682 m/s, 0.00548 Watts at 48.56° for Experiment 2.
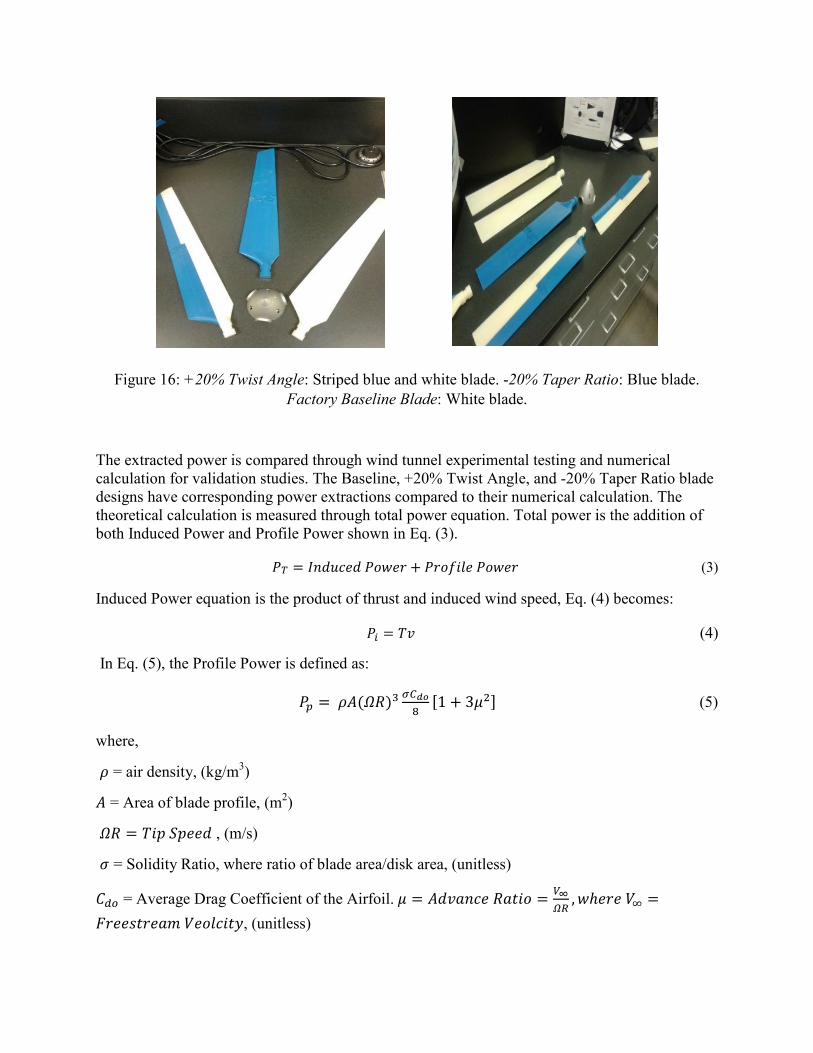
Figure 16: +20% Twist Angle: Striped blue and white blade. -20% Taper Ratio: Blue blade.
Factory Baseline Blade: White blade.
The extracted power is compared through wind tunnel experimental testing and numerical
calculation for validation studies. The Baseline, +20% Twist Angle, and -20% Taper Ratio blade
designs have corresponding power extractions compared to their numerical calculation. The
theoretical calculation is measured through total power equation. Total power is the addition of
both Induced Power and Profile Power shown in Eq. (3).
� = ������� ���� + ������ ���� (3)
Induced Power equation is the product of thrust and induced wind speed, Eq. (4) becomes:
� = �� (4)
In Eq. (5), the Profile Power is defined as:
� = �("#)%&'()
*+1 + 3.�/ (5)
where,
= air density, (kg/m3)
� = Area of blade profile, (m2)
"# = ��010��� , (m/s)
2 = Solidity Ratio, where ratio of blade area/disk area, (unitless)
�34 = Average Drag Coefficient of the Airfoil.. = ���5���#56�� =78
9:, �ℎ���= =
>���?6��5@�����6A, (unitless)

The discrepancy between the power extracted at baseline design and +20 twist angle can be
explained by the drag force that causes a large inertia. The -20% taper ratio displays similar trend
at initial wind speeds. As the wind speed is increased, the drag force and inertia are overcome,
the turbine blades speed up and the power extracted matches the theoretical values more closely.
The rotational kinetic energy generates a rapid increase in rotation per minute cycle. It is
observed that the minimum speed to cause the turbine blades to start rotating for all three designs
are between 2.252 and 2.45872 ms-1
. This is also known as turnover speed, the minimum speed
for initial rotation. Figures 17 through 19 depict the power extraction analysis comparison for the
three blade designs. The figures presents a side by side comparison for precise and accurate
representation. Since the experimental value power slope on all three graphs are not increasing as
quickly exponentially, each comparison will have an experimental versus theoretical. CFD
analysis provides extracted power data at 5ms-1
. This speed is an expected average wind speed
on Georgia coastlines, therefore is critical to this study. It can also be noted that performing CFD
analysis for each iterative wind tunnel speed and with their corresponding designs can be time
consuming. Figure 20 represents the CFD data collection for power results. The CFD analysis
leads to the conclusion that the design that extracts the maximum power at 5ms-1
is the baseline
design, followed by +20% twist angle, and -20% taper ratio.
Figure 17: Baseline Power Extraction Comparison.
0
0.5
1
1.5
2
2.5
3
Po
we
r (W
att
s)
Wind Speed Veolcity (m/s)
Theoretical Baseline Power Extraction
Theorectical Baseline Power
0
0.005
0.01
0.015
0.02
0.025
Po
we
r (W
att
s)
Wind Speed Veolcity (m/s)
Experimental Baseline Power Extraction
Experimental Baseline Power
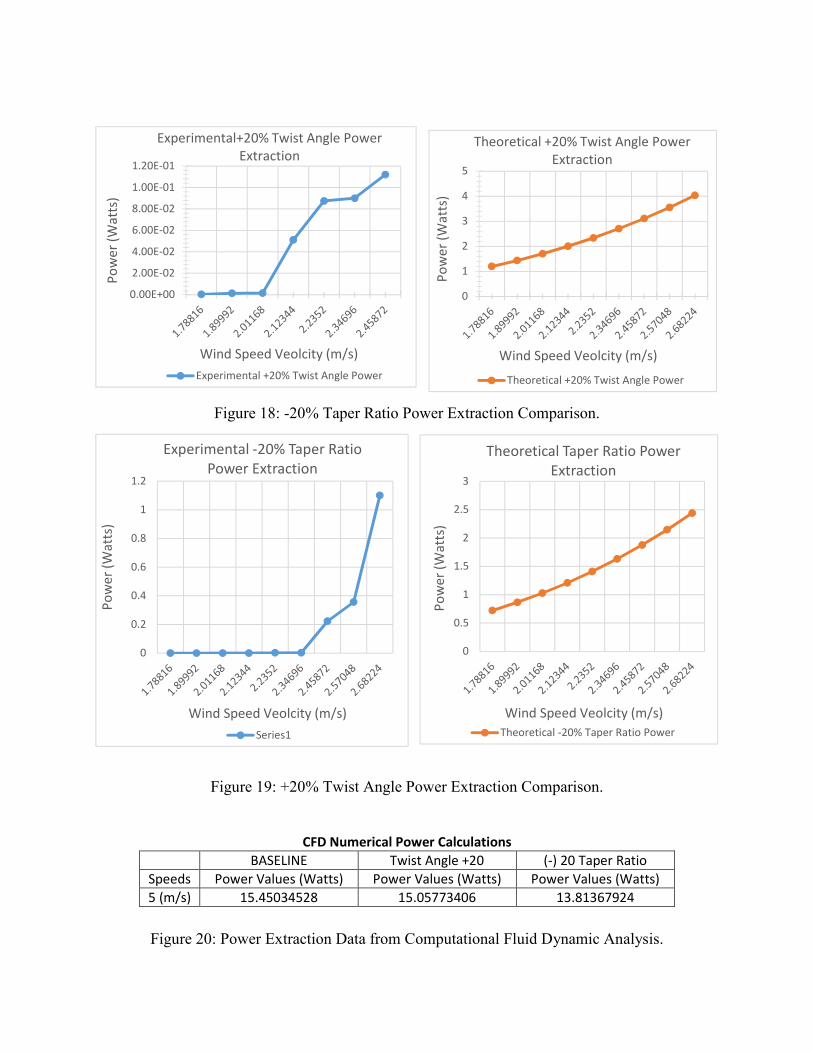
Figure 18: -20% Taper Ratio Power Extraction Comparison.
Figure 19: +20% Twist Angle Power Extraction Comparison.
Figure 20: Power Extraction Data from Computational Fluid Dynamic Analysis.
CFD Numerical Power Calculations
BASELINE Twist Angle +20 (-) 20 Taper Ratio
Speeds Power Values (Watts) Power Values (Watts) Power Values (Watts)
5 (m/s) 15.45034528 15.05773406 13.81367924
0
1
2
3
4
5
Po
we
r (W
att
s)
Wind Speed Veolcity (m/s)
Theoretical +20% Twist Angle Power
Extraction
Theoretical +20% Twist Angle Power
0
0.2
0.4
0.6
0.8
1
1.2
Po
we
r (W
att
s)
Wind Speed Veolcity (m/s)
Experimental -20% Taper Ratio
Power Extraction
Series1
0
0.5
1
1.5
2
2.5
3
Po
we
r (W
att
s)
Wind Speed Veolcity (m/s)
Theoretical Taper Ratio Power
Extraction
Theoretical -20% Taper Ratio Power
0.00E+00
2.00E-02
4.00E-02
6.00E-02
8.00E-02
1.00E-01
1.20E-01
Po
we
r (W
att
s)
Wind Speed Veolcity (m/s)
Experimental+20% Twist Angle Power
Extraction
Experimental +20% Twist Angle Power

Summary
In summary, the Windlab turbine technologies blade is carefully analyzed, designed, and
fabricated to maximize the power extraction from low speed wind occurrences. The application
for this experimentation is suitable for small households or low power consumption
environments. The approach of theoretical and experimental trials can prove a progression in
efficiently maximizing extracted power from wind speeds. Modifications are made to the
original turbine technologies blade ranging from increasing or decreasing its physical parameters
e.g. maximum chord, span, twist angle, taper ratio, and angle of incidence. Several computer
aided design models are created by changing one variable at a time from the baseline blade
design. From these model designs, computational fluid analysis is performed in order to
determine the best results in terms of maximum lift coefficient, and minimum drag coefficient
with respect to it span section. Three computer aided design models are selected for 3D printing
physical turbine blades. From the data collection, the best CFD results are obtained for the 20%
increase in twist and -20% reduction in taper ratio. The -20% taper ratio displays the highest lift
coefficient, versus the +20% in twist, that results in slightly higher drag coefficient. With a
theoretical prediction based of CFD analysis, the most promising blade model turns out to be the
+20% Taper Ratio. In wind tunnel analysis, the taper ratio design provides the maximum
extraction of power over any other 3-D printed designs at 48.56° with 2.682 m/s wind speed.
Through extensive experimentation, the physical 3D printed models are then compared to their
counterparts from CFD analysis in terms of most power extracted per revolutions per minute.
This provides promising results for researching and exploring designs to extract maximum power
for low speed winds. Two laboratory experiments are implemented to test the printed and
fabricated blade models. Experiment 1 consists of maintaining constant angle of incidence with
decreasing and gradually increasing wind speed. Experiment 2 involves constant wind velocity
with change in angle of incidence from 48.56 ° to 72.84° respectively. The results from CFD
analysis correlate with the wind tunnel testing of the +20 increase taper ratio; it displays the
highest extracted power slope. CFD analysis results display that the +20 Twist Angle has a
higher drag coefficient. The laboratory tests show that the +20% twist results in more drag
during pitch changes. Observation shows that it took more wind speed to generate initial
rotation; this is due to the significant drag force from the twist opposing the rotation. The slope is
slightly steeper than the maximum taper ratio design. Therefore both designs in Experiment 2
show similar characteristics in power output. These values show a small slope with little output
due to the lack of turn over speed. Each wind turbine has a unique property and characteristics to
overcome the inertia for rotation.
Theoretically, if the wind speed for Experiment 2 is increased; the power output values will show
promising results. This experimentation is a foundation to explore future work with many
additional aerodynamic design parameters to be explored. These include changing the type of
airfoil used, modifying blade span, maximum chord, etc. In further analysis, this experiment will
obtain power output values displayed from each turbine blade design and equate them within a
power equation to provide accurate results. Possible cross over points in design for future
modifications may be studied to model best results.
The power extraction analysis shows a comparison of theoretical versus numerical experiment.
The correlation of all the plot slopes shows an incremental increase in power as speed is
increases. Each three blade designs show their respective characteristics when exposed to
external wind speeds. From the power extraction comparison analysis, the -20% Taper Ratio plot
displays are higher power observation. CFD analysis provides data that the baseline design
surpasses its processors and contradicts the power extraction comparisons.
Conclusion
The present study allows an undergraduate student to go through a complete engineering design
cycle. They start with a baseline wind turbine and calculate the lift and drag using analytical
methods. The values are then compared with a corresponding wind turbine blades designed using
CAD. Validation is performed to ensure that the CFD software is calibrated. Various wind
turbine parameters are changed and power extracted values are calculated. This activity allows
the undergraduate student to experience a complete engineering research process. The
undergraduate student has indicated that as a result of this work, their confidence in pursuing
engineering studies and research has increased; they are now interested in pursuing graduate
work and hope to continue to do more of the same or similar work into the future. It is expected
that as part of this study the student will continue to work on the project and look at the effects of
varying the blade aspect ratio, chord, type of airfoil and taper on the turbine efficiency. Possibly
future explorations include conducting the Computational Fluid Dynamic analysis testing at the
same low wind tunnel speeds for stronger data analysis.
References
1 Chiang, E. P., Zainal, Z. A., Narayana, P. A., and Seetharamu, K. N. (2000). Potential Of renewable wave
and offshore wind energy sources in Malaysia.
2 Din, Abdul Talib, Shamsul Bahari Azraai, and Kesavan Thenamirtham. Design and Development of a
Vertical Wind Turbine Using Slow Wind Speed for Mini Power Generation. Tech. N.p.: Elsevier, 2008.
Future Energy Journal for Our Planet.
3 Elfarral, Monier A., Nilay Sezer Uzol, and Sinan Akmandor NREL VI Rotor Blade: Numerical
Investiagion and Winglet Design and Optimization Using CFD. Tech Journal of Fluids Engineering 2002;
124: 393-399.
4 "Wind Turbine Power System." Turbine Technologies, n.d. Web. 31 July 2015.
5 “Georgia Wind Resource Map and Potential Wind Capacity. “ WIND Exchange; U.S. Department of
Energy, n.d Web. 26 July 26, 2015
6 “Wind Map | NOAA Climate.gov.” Wind Map | NOAA Climate.gov. National Centers for Environmental
Information, n.d, Web. 25 July 2015.
7 "Renewable & alternative fuels." Electric Power Annual, 23 Mar. 2015. Web
8 Smith, J., A. Huskey, D. Jager, and J. Hur. "Wind Turbine Generator System Safety and Function Test
Report for the Entegrity EW50 Wind Turbine." Wind Turbine Generator System Safety and Function Test
Report for the Entegrity EW50 Wind Turbine (2012): n. pag. National Renewable Energy Laboratory.
Web. 2015.
9 Satpathy, A.S.; Kishore, N.K.; Kastha, D.; Sahoo, N.C. "Control Scheme for a Stand-Alone Wind Energy
Conversion System", Energy Conversion, IEEE Transactions on, On page(s): 418 - 425 Volume: 29, Issue:
2, June 2014
10 R. D. Richardson and G. M. Mcnerney "Wind energy systems", Proc. IEEE, vol. 81, no. 3, pp.378 -389
1993
11 A. D. Sahin "Progress and recent trends in wind energy", Progress in Energy Combustion Sci., vol. 30,
no. 5, pp.501 -543 2004
12 A. Chakraborty "Advancements in power electronics and drives in interface with growing renewable
energy resources", Renewable Sustainable Energy Rev., vol. 15, no. 4, pp.1816 -1827 2011
13 A. M. D. Broe, S. Drouilhet and V. Gevorgian “A peak power tracker for small wind turbines in battery
charging applications", IEEE Trans. Energy Convers., vol. 14, no. 4, pp.1630 -1635 1999
14 Robert Howell, Ning Qin, Jonathan Edwards, Naveed Durrani, ‘Wind tunnel and numerical study of a
small vertical axis wind turbine,’ Renewable Energy, Volume 35, Issue 2, February 2010, Pages 412–422
15 Abdullah Mobin Chowdhurya, Hiromichi Akimotoa, Yutaka Harab, ‘Comparative CFD analysis of
Vertical Axis Wind Turbine in upright and tilted configuration,’ Renewable Energy, Volume 85, January
2016, Pages 327–337
16 Alessandro Bianchini, Francesco Balduzzi, John M. Rainbird, Joaquim Peiro, J. Michael R. Graham,
Giovanni Ferrara and Lorenzo Ferrari, ‘An Experimental and Numerical Assessment of Airfoil Polars for
Use in Darrieus Wind Turbines—Part I: Flow Curvature Effects,’ J. Eng. Gas Turbines Power 138(3),
032602, Sep 22, 2015
17 Francesco Balduzzia, Alessandro Bianchinia, Riccardo Malecia, Giovanni Ferraraa, Lorenzo Ferrarib,
‘Critical issues in the CFD simulation of Darrieus wind turbines,’ Renewable Energy, Volume 85, January
2016, Pages 419–435
18 Van Treuren, K.W., ‘Small-scale wind turbine testing in wind tunnels under low Reynolds number
conditions,’ 2015 Journal of Energy Resources Technology, Transactions of the ASME
19 Emejeamara, F.C., Tomlin, A.S., Millward-Hopkins, J.T., ‘Urban wind: Characterization of useful gust and
energy capture,’ 2015 Renewable Energy
20 Dossena, V., Persico, G., Paradiso, B., Brighenti, A., Benini, E., ‘An experimental study of the
aerodynamics and performance of a vertical axis wind turbine in a confined and unconfined environment,’
2015 Journal of Energy Resources Technology, Transactions of the ASME

Recommended