RReesseeaarrcchh
Prepared by University of Vermont Rubenstein School of Environment & Natural Resources for the New Hampshire Department of Transportation, in cooperation with the
U.S. Department of Transportation, Federal Highway Administration
TThhee IInntteeggrraattiioonn ooff UUnnmmaannnneedd AAiirrccrraafftt SSyysstteemmss ttoo
IInnccrreeaassee SSaaffeettyy aanndd DDeeccrreeaassee CCoossttss ooff TTrraannssppoorrttaattiioonn PPrroojjeeccttss aanndd RReellaatteedd TTaasskkss
Final Report


Technical Report Documentation Page
1. Report No.
FHWA-NH-RD-26962J 2. Gov. Accession No.
3. Recipient's Catalog No.
4. Title and Subtitle
The Integration of Unmanned Aircraft Systems to Increase Safety and Decrease Costs of Transportation Projects and Related Tasks
5. Report Date
June 2019
6. Performing Organization Code
7. Author(s)
Jarlath P.M. O’Neil-Dunne, Emma Estabrook
8. Performing Organization Report No.
9. Performing Organization Name and Address
University of Vermont 81 Carrigan Drive Burlington, VT 05405
10. Work Unit No. (TRAIS)
11. Contract or Grant No.
26962J, A004(529)
12. Sponsoring Agency Name and Address
New Hampshire Department of Transportation Bureau of Materials & Research Box 483, 5 Hazen Drive Concord, New Hampshire 03302-0483
13. Type of Report and Period Covered
FINAL REPORT
14. Sponsoring Agency Code
15. Supplementary Notes
Conducted in cooperation with the U.S. DEPARTMENT OF TRANSPORTATION, FEDERAL HIGHWAY ADMINISTRATION
16. Abstract
The use of Unmanned Aircraft Systems (UAS) has the potential to reduce costs and increase safety fortransportation operations ranging from bridge inspections to construction monitoring. The overall objective of thisproject focused on evaluating UAS technology for a broad range of case studies relating to the specific needs ofthe New Hampshire Department of Transportation (NHDOT). Specifically, this project’s objectives are to:1. Determine the types of transportation projects for which UAS are best suited for.2. Evaluate the capabilities and limitations, along with the costs and benefits, of using UAS technology for avariety of transportation projects.3. Outline the policies, procedures, staffing, and information technology infrastructure required for NHDOT to fullyimplement UAS technology.4. Develop NHDOT’s UAS capabilities.Eight case studies were generated to address accident reconstruction, airport runway and airport inspection,bridge inspection, construction monitoring, dam/emergency management, traffic monitoring, rail mapping andbridge inspection, and rock slope inspection. These case studies served the purpose of evaluating theapplicability of UAS for NHDOT, comparing UAS to existing methods, and analyzing barriers to UASimplementation.17. Key Words
Unmanned aircraft systems, inspection, condition surveys, structuralhealth monitoring, inspection equipment, crash reconstruction,emergency management, traffic congestion, mapping, rock slopes.
18. Distribution Statement
No Restrictions. This document is available to the public through the National Technical Information Service (NTIS), Springfield, Virginia, 22161.
19. Security Classif. (of this report)
UNCLASSIFIED
20. Security Classif. (of this page)
UNCLASSIFIED
21. No. of Pages
59
22. Price

The Integration of Unmanned Aircraft Systems to
Increase Safety and Decrease Costs of
Transportation Projects and Related Tasks
Prepared by: University of New Vermont
Rubenstein School of Environment & Natural Resources Burlington, Vermont
Prepared for: New Hampshire Department of Transportation
Bureau of Materials & Research Concord, New Hampshire
DISCLAIMER
This document is disseminated under the sponsorship of the New Hampshire Department of Transportation (NHDOT) and the Federal Highway Administration (FHWA) in the interest of information exchange. It does not constitute a standard, specification, or regulation. The NHDOT and FHWA assume no liability for the use of information contained in this document.
The State of New Hampshire and the Federal Highway Administration do not endorse products, manufacturers, engineering firms, or software. Products, manufacturers, engineering firms, software, and/or proprietary trade names appearing in this report are included only because they are considered essential to the objectives of the document.
The Integration of Unmanned Aircraft Systems to
Increase Safety and Decrease Costs of
Transportation Projects and Related Tasks
FINAL REPORT
Prepared by:
Jarlath P.M. O’Neil-Dunne
Emma Estabrook
Rubenstein School of Environment & Natural Resources University of Vermont
June 2019
Published by:
New Hampshire Department of Transportation Bureau of Materials and Research Box 483, 5 Hazen Drive Concord, NH 03302-0483
TABLE OF CONTENTS
1.0 OVERVIEW..……………………….………………………………………………………….…………..…........……....1
2.0 UAS AND TRANSPORTATION..…………………………………………………………….………….……...........1
3.0 UNMANNED AIRCRAFT SYSTEMS WORKFLOW AND PROCEDURES………………….…......……..3
3.1 PROCEDURES………….…………………………………………………….…………………………………….….3
3.2 CHECKLISTS……….…………………………………………………………………………………………..……….3
3.3 UAS OPERATIONS.…………………………………………………………………………….…………..……....4
4.0 CASE STUDIES….………………………………………………………………………....……………………...........…10
4.1 OVERVIEW…………..…………………………………………………………………………………….…………..10
4.2 CASE STUDY: ACCIDENT……….……………………………………………………………………..….……..11
4.3 CASE STUDY: AIRPORT RUNWAY AND AIRSPACE INSPECTION……………………........…..16
4.4 CASE STUDY: BRIDGE INSPECTION..….…………………………………………………..…....……...…20
4.5 CASE STUDY: CONSTRUCTION MONITORING………………………….……………………........…23
4.6 CASE STUDY: DAM / EMERGENCY MANAGEMENT………..……………………………….......…26
4.7 CASE STUDY: TRAFFIC MONITORING..….…….……………………………………………….……...…31
4.8 CASE STUDY: RAIL & BRIDGE INSPECTION..….………………………………………...……........…34
4.9 CASE STUDY: ROCK SLOPE..….…………………….………………………………………..……….…...…38
5.0 CONCLUSIONS ……………………….……………………………………………………………………………..….…..….41
5.1 OPPORTUNITIES……..…………………………………………………………………………….……………….41
5.2 IMPLEMENTATION CONSIDERATIONS…………………………………………………………..……….41
5.3 RECOMMENDATIONS…………………………………………………………………………………...…..….48
REFERENCE CITED…………………………….……………………………………………..………………….…...........… 52
DEFINITIONS…………..……………………….……………………………………………………..…….…….........…..….53

Page | 1
THE INTEGRATION OF UNMANNED AIRCRAFT
SYSTEMS TO INCREASE SAFETY AND DECREASE
COSTS OF TRANSPORTATION PROJECTS AND
RELATED TASKS
CHAPTER 1: OVERVIEW
Unmanned Aircraft Systems (UAS) are a new capability that has the potential to reduce costs dramatically and
increase safety for transportation operations ranging from bridge inspections to construction monitoring (Gheisari
et al., 2015). Despite the considerable amount of existing research and case studies surrounding UAS, there appear
to be few, if any, that have focused on analyzing the costs, benefits, and barriers associated with integrating UAS
into a state department of transportation’s operations. The overall objective of this project focused on evaluating
UAS technology for a broad range of case studies relating to the specific needs of the New Hampshire Department
of Transportation (NH DOT). Specifically, this project’s objectives are to:
1. Determine the types of transportation projects for which UAS are best suited for.
2. Evaluate the capabilities and limitations, along with the costs and benefits, of using UAS technology for a
variety of transportation projects.
3. Outline the policies, procedures, staffing, and information technology infrastructure required for NH DOT
to fully implement UAS technology.
4. Develop NH DOT’s UAS capabilities.
This project was a partnership between NH DOT and the University of Vermont’s (UVM) UAS Team. UVM’s UAS
Team conducted flight operations and generated products for eight case studies including accident reconstruction,
airport runway and airport inspection, bridge inspection, construction monitoring, dam/emergency management,
traffic monitoring, rail mapping and bridge inspection, and rock slope inspection. These case studies served the
purpose of evaluating the applicability of UAS for NH DOT, comparing UAS to existing methods, and analyzing
barriers to UAS implementation.
CHAPTER 2: UAS AND TRANSPORTATION
Commercial remotely sensed datasets have tremendous value for a wide range of transportation-related activities,
such as construction monitoring, cost decision support, and traffic monitoring, but their full potential can be
constrained by inadequate temporal resolution, poor spatial resolution, and high acquisition costs. Unmanned
Aerial Systems (UAS), also known as drones, are aircraft that do not carry a human pilot and are capable of flying
either autonomously or with a remote control (Saranya, 2016). UAS have the potential to overcome the limitations
inherent with traditional forms of remotely sensed data and in turn change the way this data are used in
transportation planning, operations, maintenance, and development. Off the shelf UAS are relatively inexpensive
to purchase, easy to operate with training, rapidly deployable, and provide high resolution data that cannot be
matched by traditional platforms. The case studies carried out as part of this research project serve as a starting

Page | 2
point to improve the abilities of NH DOT to integrate UAS data and products into their decision making and
operations.
One of the most common and straightforward ways in which UAS are being used in transportation activities is for
traffic monitoring. In these cases, UAS can be used as an eye in the sky to provide transportation agencies with
aerial footage of traffic. Some agencies have gone further and use UAS with the ability to identify, track, and
monitor specific vehicles. From aerial footage of traffic, information can be extracted from the data such as
densities, travel times, and vehicle quantity (Barmpounakis, 2017). Although UAS can provide much valuable
information, privacy issues are a concern and limitation.
UAS can also provide valuable survey or inspection information faster than traditional methods. An area that
would have taken days to survey through manual methods, can be surveyed with UAS in a matter of hours. Not
only does that save time, but money as well which can then in turn allow for more frequent inspections if needed.
UAS can be flown in areas that may be impossible to reach or dangerous for humans to inspect. UAS provides a
safer alternative to certain manual inspections. Not only can UAS capture aerial photos and videos, but the data
can also be processed to create geospatial and 3-dimensional data that can then be used for analysis.
Although UAS has many benefits related to transportation activities, UAS also have limitations that need to be
considered. The primary limitations of UAS are weather and battery life. Typical UAS platforms and sensors cannot
be flown in precipitation as the platform and sensors are not water resistant. UAS also cannot be flown in high
wind or gusty conditions. Wind speed maximums are specific to the UAS platforms as some platforms are better in
wind than others. Battery life is the second major limiting factor in UAS as batteries limit flight times to typically
less than an hour, limiting the amount of data that can be captured in a single flight. Other limitations in UAS are
potential equipment malfunctions, privacy concerns, along with federal and local regulations.
UAS have historically been used for military, aerial photography, search and rescue efforts, mapping, and law
enforcement applications. Technological advancements over the past decade have brought many improvements
and features to UAS to the point at which the consumer-grade UAS can be obtained for a relatively low price.
Some of these advances include autonomous flight, safety features such as a return home feature, and obstacle
avoidance. UAS are likely going to evolve quickly given how much technology has already changed in the past
several years. The most significant hardware evolution will likely be batteries as the limited flight time is one of the
chief limitations of UAS. Although the commercial drone industry is still in its early stages, the trend is towards
cheaper and more customizable commercial drones for specialized UAS platforms and sensors (Joshi, 2017).
UAS have been around for decades, but in the past few years, UAS have made leaps and bounds in improvement.
UAS technology can be broken down into seven generations (AirDroneCraze, 2017):
Generation 1: Remote control aircraft
Generation 2: Manual piloting control, static design, fixed camera mount, video and photos
Generation 3: Assisted piloting, static design, two-axis gimbals, HD video, basic safety features
Generation 4: Autopilot modes, transformative design, three-axis gimbal (used for stabilization), 1080 HD
video or higher, improved safety features
Generation 5: Intelligent piloting, transformative design, 360-degree gimbals, 4K video or higher
Generation 6: Intelligent piloting and full autonomy modes, commercial, safety and regulatory standards-
based design, platform adaptability, automated safety modes such as anti-collision, airspace awareness

Page | 3
Generation 7: Complete commercial suitability, fully compliant safety and regulatory standards based
design, platform interchangeability, automated safety modes, enhanced intelligent piloting modes and full
autonomy, full airspace awareness, collision avoidance, and auto actions.
CHAPTER 3: UNMANNED AIRCRAFT SYSTEMS WORKFLOW AND PROCEDURES
Below, we describe the workflow and procedures used for the application studies in this research project.
3.1 PROCEDURES
UAS Operations consisted of flying both fixed-wing and multi-rotor UAS to acquire data. These were followed by
data processing steps to support the application areas, and the development of decision support tools. Below is
the general workflow to generate the different UAS products (Figure 1). Fixed-wing and multi-rotor system
operations are inherently different. There do, however, exist commonalities when it comes to the planning and
preparation of UAS missions. The UVM UAS Team developed a set of procedures, checklists, and workflows,
ensuring safe and effective UAS operations. For the 43 UAS flights that took place, there was only one major
incident in which a fixed wing battery was knocked out of the UAS causing the UAS and the battery to fall from the
sky. This was due to high winds and no person or equipment was damaged.
3.2 CHECKLISTS
Three sets of checklists were generated for each case study: 1) mission planning, 2) flight operations, and 3) post-
flight. These checklists and the associated applications provide a means by which to ensure accountability
throughout the organization. The checklists were built using the Fulcrum platform (https://web.fulcrumapp.com)
and Drone Logbook (https://www.dronelogbook.com). The benefit of the Fulcrum platform is that it provides an
easy way to design, develop, and deploy cross-platform spatially-enabled applications (Figure 2). The applications
Figure 1. General workflow to generate the different UAS products.

Page | 4
were built using the Fulcrum online interface then used on a variety of smartphones and tablets. Drone Logbook is
used to log flight information and management of UAS.
Figure 2. Example mission checklist.
3.3 UAS OPERATIONS
FIXED WING UAS OPERATIONS
The senseFly eBee, eBee RTK, and eBee Plus models were used for all fixed-wing UAS operations (Figure 3). Fixed-
wing UAS operations consisted of three main phases: 1) flight planning, 2) launch, flight, and recovery, and 3) data
processing.

Page | 5
Figure 3. The UVM UAS Team preparing for a flight with the senseFly eBee Plus.
Flight planning was performed using the eMotion software package (Figure 4). Constructing a flight plan is a user-
driven process in which the operator establishes a polygon defining the flight area then defining key parameters
such as percent overlap between flight lines, target resolution, maximum altitude, maximum operating radius, and
launch/landing sectors.
Figure 4. Sample flight plan generated for the eBee using the eMotion software package.
The flight itself is largely autonomous, with the UAS following the pre-programed flight. An operator would only
intervene in extenuating circumstances (e.g. abort a landing). A video showcasing UVM’s fixed-wing flight
operations is available on YouTube (https://youtu.be/_6hA831P4To).

Page | 6
Once the imagery has been collected and downloaded from the system, they are fed into Pix4D, a
photogrammetric processing software package (Figure 5). Pix4D uses structure from motion combined with GPS
and flight log information from the UAS to orthorectify the imagery, thereby removing distortions associated with
the sensor and terrain. Pix4D yields a number of products including orthorectified raster imagery (Figure 6), 3D
point clouds (Figure 7), and raster surface models. These products use standard, open file formats, enabling them
to be viewed and analyzed in virtually any geospatial software package.
Figure 5. Photogrammetric processing using Pix4D.
Figure 6. UAS Orthorectified image mosaic generated using Pix4D displayed in ArcGIS.

Page | 7
Figure 7. UAS 3D point cloud generated using Pix4D displayed in Quick Terrain Modeler.
MULTI-ROTOR UAS OPERATIONS
The multi-rotor system used for inspections in this project, the senseFly Albris, can be operated in both manual
mode and a preplanned automated flight mode. Manual mode is most commonly used when conducting close-
range inspections (Figure 8). In such cases, the data collection focus is on still images, videos, and thermal imaging.
The operator will often work closely with the bridge inspector to capture data of points of interest. One of the
unique capabilities of the Albris is that the camera can point up or down, enabling it to capture images of the tops
or undersides of bridges (Figure 9).
Figure 8. The senseFly Albris in manual operation mode while carrying out a close-range inspection of a historic covered bridge.

Page | 8
Figure 9. Inspection photo of the underside of a railroad bridge captured by the senseFly Albris.
The purpose of the automated flight mode is to gather images with the appropriate properties to create a detailed
3D model. This process is virtually identical to flying the eBee in that flight planning is carried out in eMotion,
followed by autonomous flight operations, and finally photogrammetric processing in Pix4D (Figure 10). While a
UAS such as the senseFly Albris can acquire imagery from side look angle, thereby improving the quality of a 3D
model for an individual structure, its can cover far less of an area in a single flight but in much more detail
compared to a system like the eBee (Figure 11). A video showcasing UVM’s multi-rotor flight operations is available
on YouTube (https://youtu.be/D-HyftUaQKc).

Page | 9
Figure 10. Pix4D layout showing the images collected of a bridge by the senseFly Albris UAS.
Figure 11. Detailed 3D model of a railroad bridge generated by the senseFly Albris during an autonomous flight operation.
The multi-rotor system used for the traffic monitoring, rock slope, and accident case studies in this project was the
DJI Phantom 4 and can be used to capture aerial photos and videos. The DJI Phantom 4 is a quadcopter UAS
platform with a high performance camera that can shoot video in 4K at 30 frames per second. The benefits of using
this platform is that it takes under five minutes to set up the UAS for each flight.

Page | 10
CHAPTER 4: CASE STUDIES
4.1 OVERVIEW
Working with the stakeholder advisory committee and NH DOT, a list of case studies were established to serve the
purpose of evaluating the applicability of UAS for NH DOT, comparing UAS to existing methods, and analyzing
barriers to UAS implementation. Eight case studies were selected based on where UAS could play a key role in
transportation-related tasks that could benefit NH DOT. The case studies were accident, airport and runway
inspection, bridge inspection, construction monitoring, dam/emergency management, traffic monitoring, rail
mapping & bridge inspection, and rock slope inspections.
Each case study consisted of UAS mission planning, UAS operations, UAS products, and data product transfer to NH
DOT. The UAS mission planning identified the appropriate personnel, UAS platform(s), UAS sensors(s), supporting
equipment, operating procedures, safety procedures, and regulatory requirements to operate the UAS
successfully. Specifications on the desired end products and their formats were also developed at this stage. UAS
operations were conducted for each one of the case studies. Flight operations consist of launch, data capture,
recovery, along with any gathering of other ancillary information that was required. During UAS operations, NH
DOT personnel were invited to participate in order to familiarize themselves with UAS flight operations, processes,
and procedures. The UAS data collected during UAS operations was processed and products were generated.
Processing of the UAS data generated primary products such as orthophoto mosaics, 3D models, videos, or still
pictures. UAS processing ranged from compiling, editing, and posting video data to the photogrammetric
processing of hundreds of individual geotagged photos. Other UAS products that involve additional processing or
manipulation of the UAS data includes web-based maps, feature extraction, CAD/GIS integration, or aerial
measurements. Data product transfer focused on providing UAS products to NH DOT stakeholders for evaluation,
integration, and implementation.
In order to complete these studies, the UVM UAS Team had a large inventory of UAS equipment, software, and
trained personnel. This included having multiple UAS platforms and sensors. The UAS Team had two quadcopter
platforms with one being a specialized inspection UAS, four fixed-wing mapping UAS, and multiple true color
sensors. In addition to multiple platforms, the UAS Team also had enough batteries for the UAS and additional
equipment for a full day of flight operations. The UAS Team had specialized software to process and view the
geospatial data. The Team also has 150 TB of dedicated high-performance network storage that is backed up daily
to store the UAS data. During the case studies, the UVM UAS Team had five personnel with a remote pilot license
and the necessary training to process and analyze the UAS data. Below is a graphic describing all of the equipment
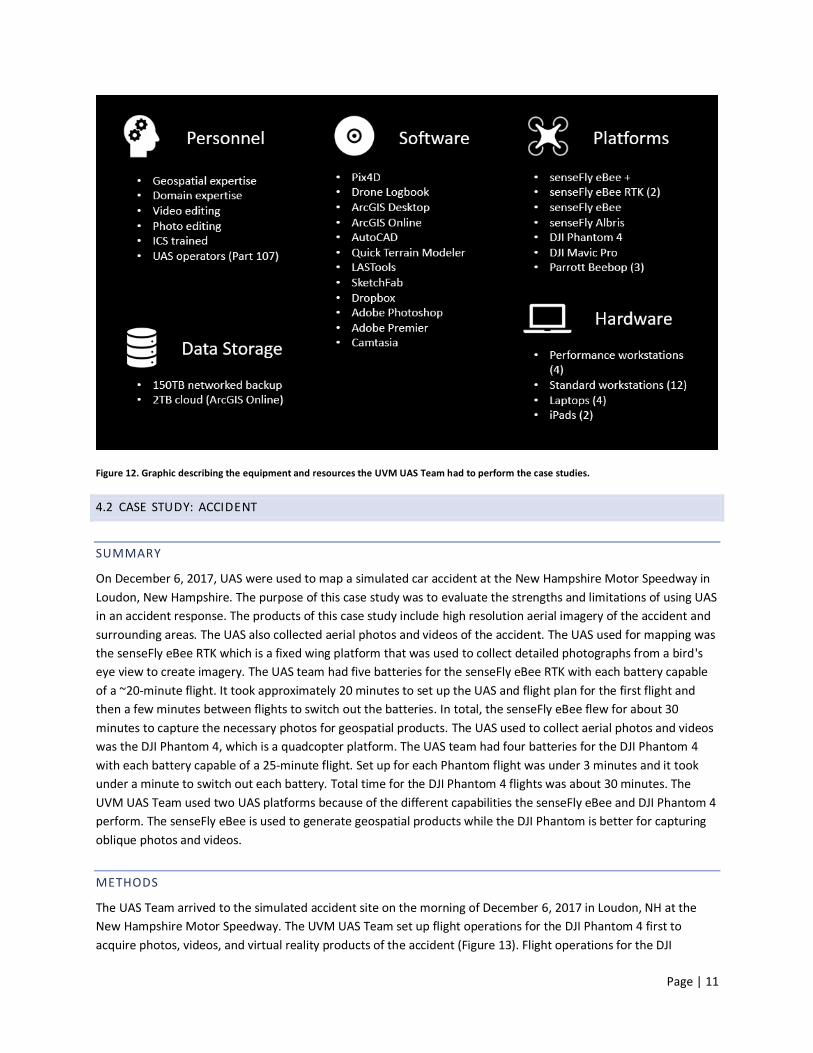
and resources the UVM UAS Team had to complete the case studies.
Page | 11
Figure 12. Graphic describing the equipment and resources the UVM UAS Team had to perform the case studies.
4.2 CASE STUDY: ACCIDENT
SUMMARY
On December 6, 2017, UAS were used to map a simulated car accident at the New Hampshire Motor Speedway in
Loudon, New Hampshire. The purpose of this case study was to evaluate the strengths and limitations of using UAS
in an accident response. The products of this case study include high resolution aerial imagery of the accident and
surrounding areas. The UAS also collected aerial photos and videos of the accident. The UAS used for mapping was
the senseFly eBee RTK which is a fixed wing platform that was used to collect detailed photographs from a bird's
eye view to create imagery. The UAS team had five batteries for the senseFly eBee RTK with each battery capable
of a ~20-minute flight. It took approximately 20 minutes to set up the UAS and flight plan for the first flight and
then a few minutes between flights to switch out the batteries. In total, the senseFly eBee flew for about 30
minutes to capture the necessary photos for geospatial products. The UAS used to collect aerial photos and videos
was the DJI Phantom 4, which is a quadcopter platform. The UAS team had four batteries for the DJI Phantom 4
with each battery capable of a 25-minute flight. Set up for each Phantom flight was under 3 minutes and it took
under a minute to switch out each battery. Total time for the DJI Phantom 4 flights was about 30 minutes. The
UVM UAS Team used two UAS platforms because of the different capabilities the senseFly eBee and DJI Phantom 4
perform. The senseFly eBee is used to generate geospatial products while the DJI Phantom is better for capturing
oblique photos and videos.
METHODS
The UAS Team arrived to the simulated accident site on the morning of December 6, 2017 in Loudon, NH at the
New Hampshire Motor Speedway. The UVM UAS Team set up flight operations for the DJI Phantom 4 first to
acquire photos, videos, and virtual reality products of the accident (Figure 13). Flight operations for the DJI

Page | 12
Phantom were completed after 16 minutes. Weather conditions of the day were overcast, about 35 degrees, and
low winds.
Figure 13. The UVM UAS Team preparing for a flight with the DJI Phantom 4.
After concluding the flight operations for the DJI Phantom 4, the team set up flight operations for the eBee RTK
from a field located near the accident (Figure 14). In a single flight, the senseFly eBee RTK captured 105 photos
with a total flight time of 15 minutes. Due a loss of RTK connectivity during the flight due to technical issues, a
second flight was required to ensure the team was collecting accurate data. The second flight was only 11 minutes
and was focused on those areas where the previous flight had less accurate data. After flight operations with the
senseFly eBee RTK were complete, the team opened up the photos from the drone to look at the accident aerial
photos. With under an hour of work, the UAS team acquired aerial data of the accident for responders.

Page | 13
Figure 14. The UVM UAS Team preparing for flight operations of the senseFly eBee RTK.
Data processing involved taking the 183 images captured by the eBee RTK UAS to generate 2D and 3D geospatial
products using digital photogrammetric techniques. The initial processing, which was carried out immediately after
flight operations using the eMotion software, synchronizes the images with the flight log on the UAS. Generating
the actual geospatial products was carried out using Pix4D, a state-of-the art digital photogrammetric software
package. Pix4D first generated3D model of the area using the imagery, then used that 3D model to generate a
seamless orthorectified image mosaic. A report was also created that provided information on the calibration,
geolocation, and point cloud densification details.
The processing for this case study took approximately two and a half hours to complete. Once completed the total
file size of the output products was 4.4 GB.
PRODUCTS
Geospatial products included orthomosaic imagery and 3D point cloud (Figure 15). Other products include aerial
photos, videos, and virtual reality of the accident (Figure 16). The 3D point cloud was uploaded to an online
platform for accessibility. The UVM UAS Team also created support products such as a fact sheet, slide show
presentation, and ESRI Story Map (Figure 17).

Page | 14
Figure 15. Geospatial products of the accident case study. The orthomosaic imagery is on the left and the 3D point cloud is on the right.
Figure 16. Products of the accident case study. The top left is an aerial photo captured, top right is one of the videos captured, and the
bottom is the virtual reality product.

Page | 15
Figure 17. Screen capture of the accident case study ESRI Story Map.
STRENGTHS
UAS can be used to quickly document the accident which allows for responders to open the road sooner as
opposed to documenting the accident from the ground. Using a UAS for documentation cut the time spent on the
accident site by one fifth (Pix4D, 2017). Virtual reality products created during this case study provide aerial views
of the accident in about a five minute turn around. This may be valuable for responders to see the extent of the
accident while on site. Not only do the UAS images help describe the accident, but data derived from UAS like the
imagery and point cloud provide measurable products that can be utilized in court (Pix4D).
LIMITATIONS
Fixed-wing flight operations, while posing less of a risk if an equipment failure were to occur took longer to set up
than multi-rotor flight operations. In addition, a suitable staging area is required for fixed-wing launch and recover.
This case study may require investments in UAS platforms and sensors that can be fully operational in precipitation
and windy conditions as accidents don’t always happen on sunny, low wind days.

Page | 16
4.3 CASE STUDY: AIRPORT RUNWAY AND AIRSPACE INSPECTION
SUMMARY
On June 2 and October 4, 2017, UAS were used to conduct an airport inspection that encompassed the areas and
data normally obtained during an Annual Airport Safety Inspection including the runway and approach surface
airspace. UVM’s UAS team worked closely with NH DOT, the FAA, and Jaffrey Airport management to acquire data
of the airport. As UAS flight operations would occur on an active airfield safety was a top priority. Protocols were
developed so that UAS operations would not interfere with planned airport and aircraft operations. UAS were
deployed from several areas at the airport to keep line of sight of the UAS at all times. The UAS platform used for
this case study was a fixed wing UAS called the senseFly eBee Plus to collect detailed photographs from a bird's eye
view. Thousands of photographs from a few flights are stitched together in an orthographically correct image
mosaic that is fully georeferenced. The UAS team had seven batteries for the eBee Plus with each battery capable
of a ~40-minute flight. Flight operations were conducted after a 10-minute safety briefing with the airport
manager and NH DOT staff. It took about 20 minutes to set up the drone and flight plan for the first flight and then
a few minutes between flights to switch out the batteries. Weather conditions for June 2nd, 2017 were little cloud
cover, around 65 degrees, and high winds. Weather conditions for October 4th, 2017 were no cloud cover, 70
degrees, and moderate wind levels.
METHODS
The UAS Team arrived to Jaffrey Airport on the morning of June 2, 2017. The UVM UAS Team set up flight
operations for the eBee Plus to the side of the runway. In two flights, the eBee Plus captured 1068 photos over a
210-acre area with a total flight time of 53 minutes. This included the entire runway area, but high winds caused
an equipment malfunction and made subsequent flight operations unsafe (Figure 18). It was decided to complete
this case study on a less windy day.
Page | 17
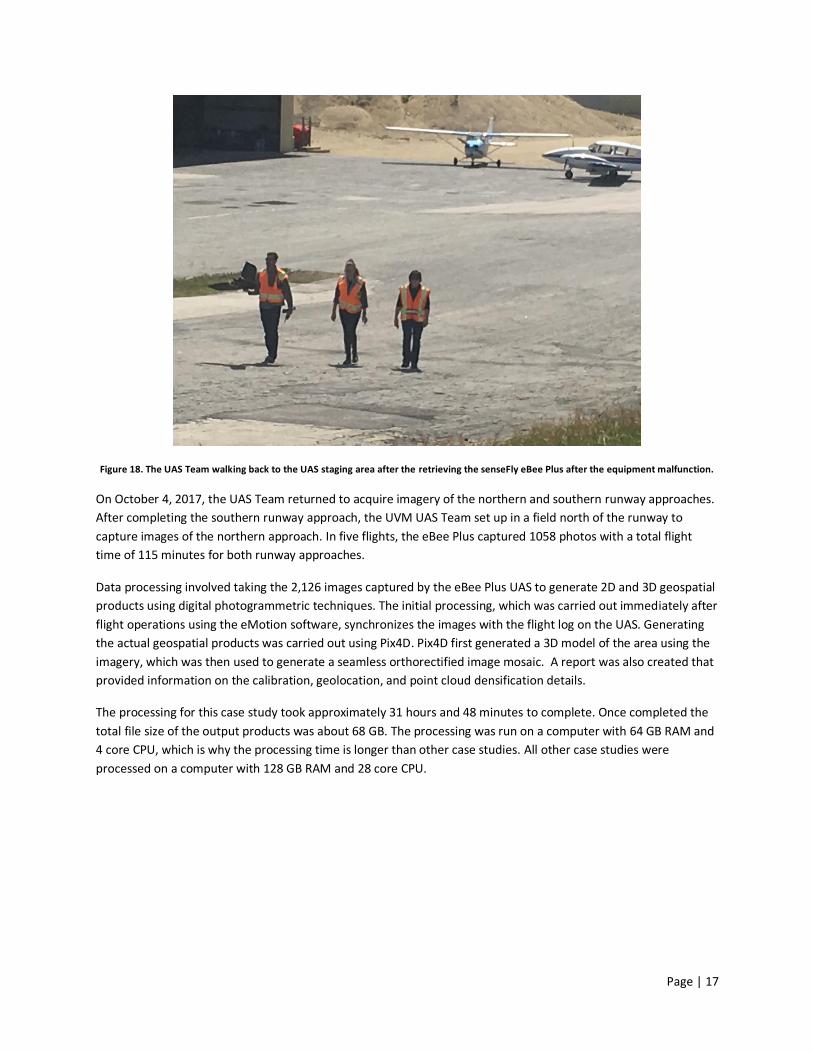
Figure 18. The UAS Team walking back to the UAS staging area after the retrieving the senseFly eBee Plus after the equipment malfunction.
On October 4, 2017, the UAS Team returned to acquire imagery of the northern and southern runway approaches.
After completing the southern runway approach, the UVM UAS Team set up in a field north of the runway to
capture images of the northern approach. In five flights, the eBee Plus captured 1058 photos with a total flight
time of 115 minutes for both runway approaches.
Data processing involved taking the 2,126 images captured by the eBee Plus UAS to generate 2D and 3D geospatial
products using digital photogrammetric techniques. The initial processing, which was carried out immediately after
flight operations using the eMotion software, synchronizes the images with the flight log on the UAS. Generating
the actual geospatial products was carried out using Pix4D. Pix4D first generated a 3D model of the area using the
imagery, which was then used to generate a seamless orthorectified image mosaic. A report was also created that
provided information on the calibration, geolocation, and point cloud densification details.
The processing for this case study took approximately 31 hours and 48 minutes to complete. Once completed the
total file size of the output products was about 68 GB. The processing was run on a computer with 64 GB RAM and
4 core CPU, which is why the processing time is longer than other case studies. All other case studies were
processed on a computer with 128 GB RAM and 28 core CPU.

Page | 18
PRODUCTS
Geospatial products included orthomosaic imagery, digital surface model, digital elevation model, and 3D point
cloud (Figure 19). Features can also be extracted from the geospatial products such as damaged areas and
pavement markings (Figure 20). The UVM UAS Team also created support products such as a fact sheet, slide show
presentation, and ESRI Story Map (Figure 21).
Figure 19. Geospatial products of the aeronautics case study. Upper left is the orthomosaic, upper right is the 3D
point cloud, lower left is the digital surface model, and the lower right is the digital elevation model.

Page | 19
Figure 20. Unpaved and patched areas of the airport runway have been mapped based on the orthomosaic imagery.
Figure 21. Screen capture of the airport runway and airspace inspection case study ESRI Story Map.
Airport Runway Condition
Unpaved Areas
Patched Areas
Page | 20
STRENGTHS
Performing surveys with UAS is safer than having personnel carry out manual inspections. UAS pilots can stay off of
the active runways while performing the inspection of runway conditions. Traditional inspections require putting
personnel in the middle of active runways during the survey (McFall, 2017). Data derived from UAS can be used for
runway pavement inspections that typically takes hours to do with traditional methods. The resolution of the UAS
imagery was 1.8 cm, in comparison to the ESRI base map of 30 cm, so fine cracks in the runway could easily be
detected using the UAS imagery. UAS data can be viewed in 3D setting back in the office where precise
measurements on the horizontal and vertical scale can be made.
LIMITATIONS
UAS missions occurring on active airports require additional safety steps and expertise to ensure UAS flights do not
interfere with manned aircraft. For safety reasons, UAS operations may be limited to only tethered operations.
Tethered operations are when the UAS is attached to a leash on the ground to ensure the UAS does not get in the
way of manned aircrafts. Although this limitation is often not required, it is something to be aware of that may be
required at certain airports (Airsite, 2016). Obtaining an airspace authorization through the FAA will be necessary
in many airports, but notification and coordination with airport management many be all that’s needed at other
airports.
4.4 CASE STUDY: BRIDGE INSPECTION
SUMMARY
On August 8, 2017, UAS were used to inspect a bridge in Lebanon, New Hampshire. The purpose of this case study
was to provide high resolution inspection photos and provide aerial perspective photos and videos of the bridge.
The UAS used for this study was the senseFly Albris, a quadcopter UAS inspecting platform. The DJI Phantom 4 was
also used to acquire additional aerial photos and videos. 2 different UAS platforms were used in this case study as
the senseFly Albris and DJI Phantom 4 have slightly different capabilities. The Albris has a 360 gimbal which is
better suited for capturing inspection photos because the drone can fly underneath the bridge and can capture
data on the underside of the bridge. Weather conditions on the day were warm and low winds with little clouds in
the sky.
METHODS
This case study occurred on August 8, 2017 at a bridge in Lebanon, NH on I-89. The UVM UAS Team first conducted
flight operations using the senseFly Albris to capture UAS inspection photos of the bridge and surrounding area.
The UVM UAS Team conducted three flights using the senseFly Albris. Then, the UAS Team conducted one flight
using the DJI Phantom 4 to acquire aerial photos and videos of the bridge.
The data processing for this case study involved creating a compiled video of the videos captured by the DJI
Phantom 4. No processing was necessary for the inspection photos as geospatial products were not created.

Page | 21
PRODUCTS
Products included high resolution inspection photos, aerial photos, and aerial videos (Figure 22 and Figure 23). A
compiled video of inspection photos and aerial photos was uploaded to YouTube for accessibility. The UVM UAS
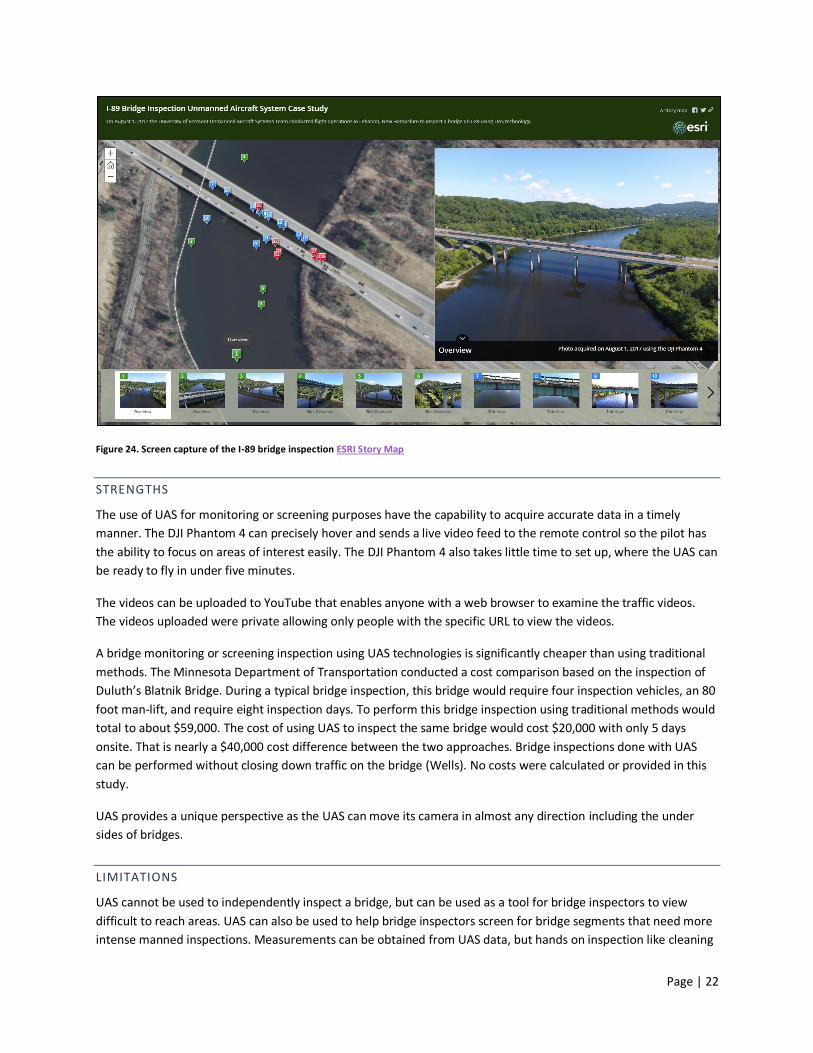
Team also created support products such as a fact sheet, slide show presentation, and ESRI Story Map (Figure 24).
Figure 20. Screen capture of the video created for the bridge inspection case study.
Figure 22. High resolution inspection photos acquired during the bridge inspection case study
Page | 22
Figure 24. Screen capture of the I-89 bridge inspection ESRI Story Map
STRENGTHS
The use of UAS for monitoring or screening purposes have the capability to acquire accurate data in a timely
manner. The DJI Phantom 4 can precisely hover and sends a live video feed to the remote control so the pilot has
the ability to focus on areas of interest easily. The DJI Phantom 4 also takes little time to set up, where the UAS can
be ready to fly in under five minutes.
The videos can be uploaded to YouTube that enables anyone with a web browser to examine the traffic videos.
The videos uploaded were private allowing only people with the specific URL to view the videos.
A bridge monitoring or screening inspection using UAS technologies is significantly cheaper than using traditional
methods. The Minnesota Department of Transportation conducted a cost comparison based on the inspection of
Duluth’s Blatnik Bridge. During a typical bridge inspection, this bridge would require four inspection vehicles, an 80
foot man-lift, and require eight inspection days. To perform this bridge inspection using traditional methods would
total to about $59,000. The cost of using UAS to inspect the same bridge would cost $20,000 with only 5 days
onsite. That is nearly a $40,000 cost difference between the two approaches. Bridge inspections done with UAS
can be performed without closing down traffic on the bridge (Wells). No costs were calculated or provided in this
study.
UAS provides a unique perspective as the UAS can move its camera in almost any direction including the under
sides of bridges.
LIMITATIONS
UAS cannot be used to independently inspect a bridge, but can be used as a tool for bridge inspectors to view
difficult to reach areas. UAS can also be used to help bridge inspectors screen for bridge segments that need more
intense manned inspections. Measurements can be obtained from UAS data, but hands on inspection like cleaning
Page | 23
and testing cannot be replaced by UAS (Wells). For bridges within controlled airspace, additional coordination and
planning is needed to ensure proper authorization is in place.
4.5 CASE STUDY: CONSTRUCTION MONITORING
SUMMARY
On July 6, 2017, UAS were used to map an active construction area in Derry and Windham, New Hampshire. The
purpose of this case study was to provide high-resolution aerial imagery of the construction project #14633B and
surrounding areas. The UAS used for this case study was the senseFly eBee Plus, a fixed-wing UAS platform. The
UVM UAS Team had seven batteries for the eBee Plus with each battery capable of a ~40 minute flight. It took
about 20 minutes to set up the UAS and plan for the first flight, then a few minutes between flights to switch out
the batteries. Weather conditions that day were in the low 80’s, winds were around 8 miles per hour, and
scattered clouds.
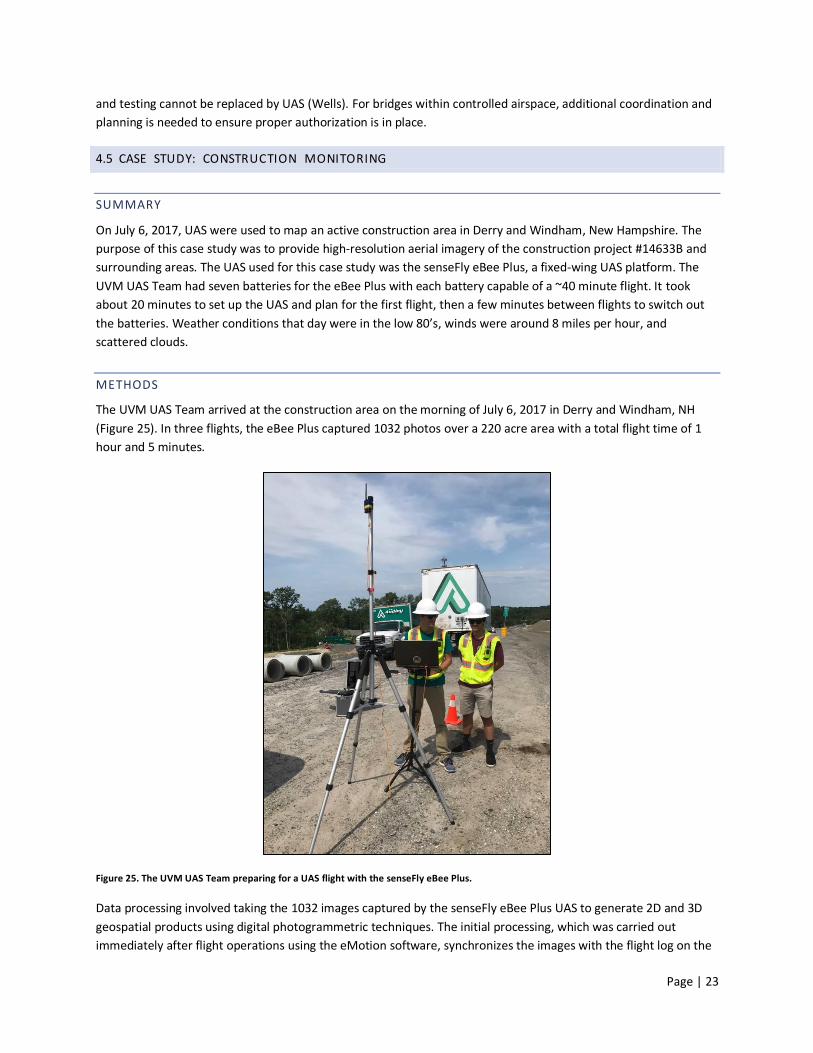
METHODS
The UVM UAS Team arrived at the construction area on the morning of July 6, 2017 in Derry and Windham, NH
(Figure 25). In three flights, the eBee Plus captured 1032 photos over a 220 acre area with a total flight time of 1
hour and 5 minutes.
Figure 25. The UVM UAS Team preparing for a UAS flight with the senseFly eBee Plus.
Data processing involved taking the 1032 images captured by the senseFly eBee Plus UAS to generate 2D and 3D
geospatial products using digital photogrammetric techniques. The initial processing, which was carried out
immediately after flight operations using the eMotion software, synchronizes the images with the flight log on the
Page | 24
UAS. Generating the geospatial products was carried out using Pix4D. Pix4D first computed a 3D model of the area
using the imagery, then used that 3D model to generate a seamless orthorectified image mosaic. A report was also
created that provided information on the calibration, geolocation, and point cloud densification details.
The processing for this case study took approximately two and a half hours to complete. Once completed the total
file size of the output products was 50GB. The processing was run on a computer with a 28-core CPU and 128GB of
RAM, which greatly reduced the time it took to complete processing compared to the aeronautics case study.
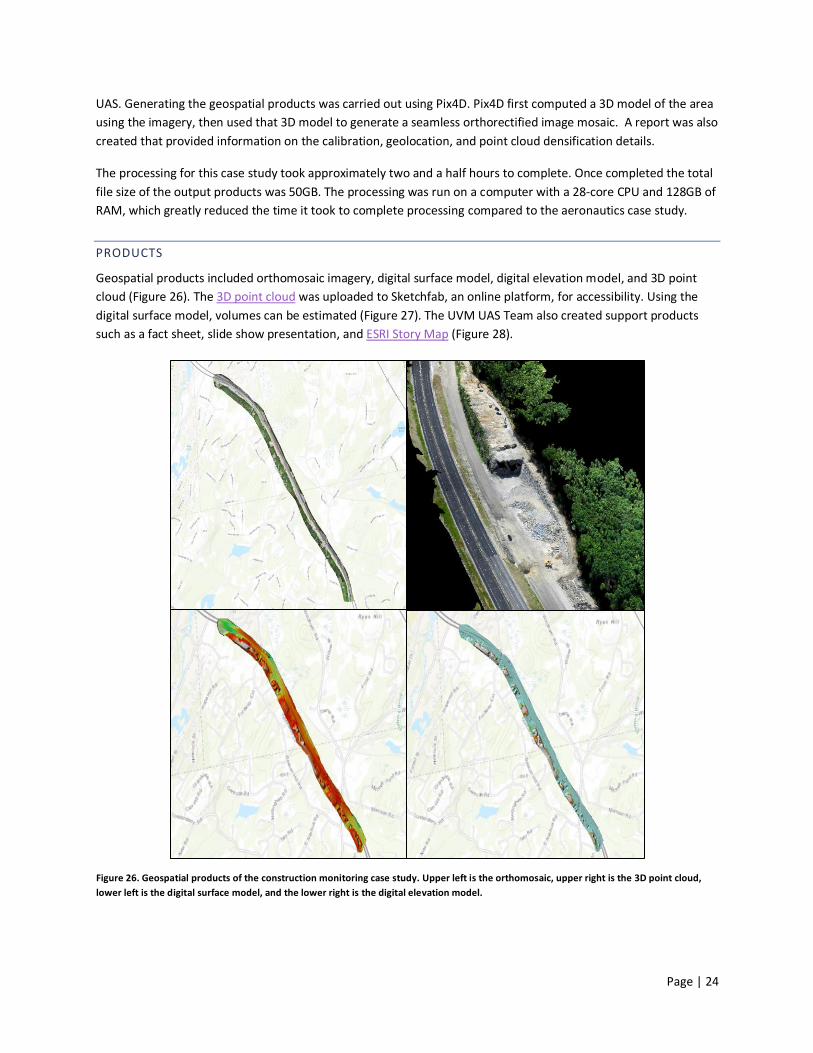
PRODUCTS
Geospatial products included orthomosaic imagery, digital surface model, digital elevation model, and 3D point
cloud (Figure 26). The 3D point cloud was uploaded to Sketchfab, an online platform, for accessibility. Using the
digital surface model, volumes can be estimated (Figure 27). The UVM UAS Team also created support products
such as a fact sheet, slide show presentation, and ESRI Story Map (Figure 28).
Figure 26. Geospatial products of the construction monitoring case study. Upper left is the orthomosaic, upper right is the 3D point cloud,
lower left is the digital surface model, and the lower right is the digital elevation model.

Page | 25
Figure 218. Screen capture of the construction monitoring case study ESRI Story Map.
STRENGTHS
The use of UAS on construction sites allows for the visibility and monitoring of construction progress. Imagery
collected every week or two helps visualize and track the progress but can also improve compliance activities and
invoicing through more accurately monitoring work progress. Regular flights over construction sites allow
everyone involved in the project that may not be on site every day to view the status on construction progress
(Higgins). UAS can also increase safety on construction sites by inspecting potentially hazardous areas before
putting people and contracting equipment in that area.
Figure 27. Volumes of quantities can be estimated based on the digital surface model. The image on the left shows the 3D point cloud of a
stock pile, the middle image shows the area of interest to calculate the volume, and the right is the flattened area of inter est. The volume can
then be calculated based on the flattened area and original model.
Page | 26
The digital surface model derived from UAS can be used to accurately estimate the volume of stockpiles on
construction sites. With centimeter grade accuracy, design plans can be overlaid with the drone imagery to ensure
the construction is being done correctly (Higgins, 2017).
LIMITATIONS
May need to apply for a waiver to fly over people as construction operations would need to be paused during flight
operations under current FAA regulations. Construction sites that are located within controlled airspace, the UAS
pilot may also need to apply for a waiver to fly in controlled airspace.
4.6 CASE STUDY: DAM / EMERGENCY MANAGEMENT
SUMMARY
On July 19, 2017, UAS were used to map a dam and inspect priority areas of the dam in Pittsburg, New Hampshire.
The purpose of this case study was to perform aerial reconnaissance of Murphy Dam on the Connecticut River in
Pittsburg, New Hampshire, and the potential areas at the dam that could be damaged due to a natural or man-
made disaster. Two UAS were used for this study: the senseFly Albris and the senseFly eBee Plus. The UAS used for
collecting imagery of the overall area was the senseFly eBee Plus, a fixed-wing platform. The senseFly Albris was
used to perform the close-range inspection of priority areas. The senseFly Albris is a multi-rotor UAS can acquire
perspective views and can fly in hard to reach areas to allow for easy, remote inspection of structures with difficult
access. It is particularly valuable for capturing information on the underside of structures as the camera can look
up and down. The UAS team had seven batteries for the senseFly eBee Plus with each battery capable of a ~40-
minute flight. It took about 20-minutes to set up the UAS and flight plan for the first flight and then a few minutes
between flights to switch out the batteries. The UVM UAS Team had four batteries for the senseFly Albris with
each battery capable of about a 20-minute flight. Wind conditions were about 8 miles per hour, temperature was
in the high 70 degrees, and little to no cloud cover.
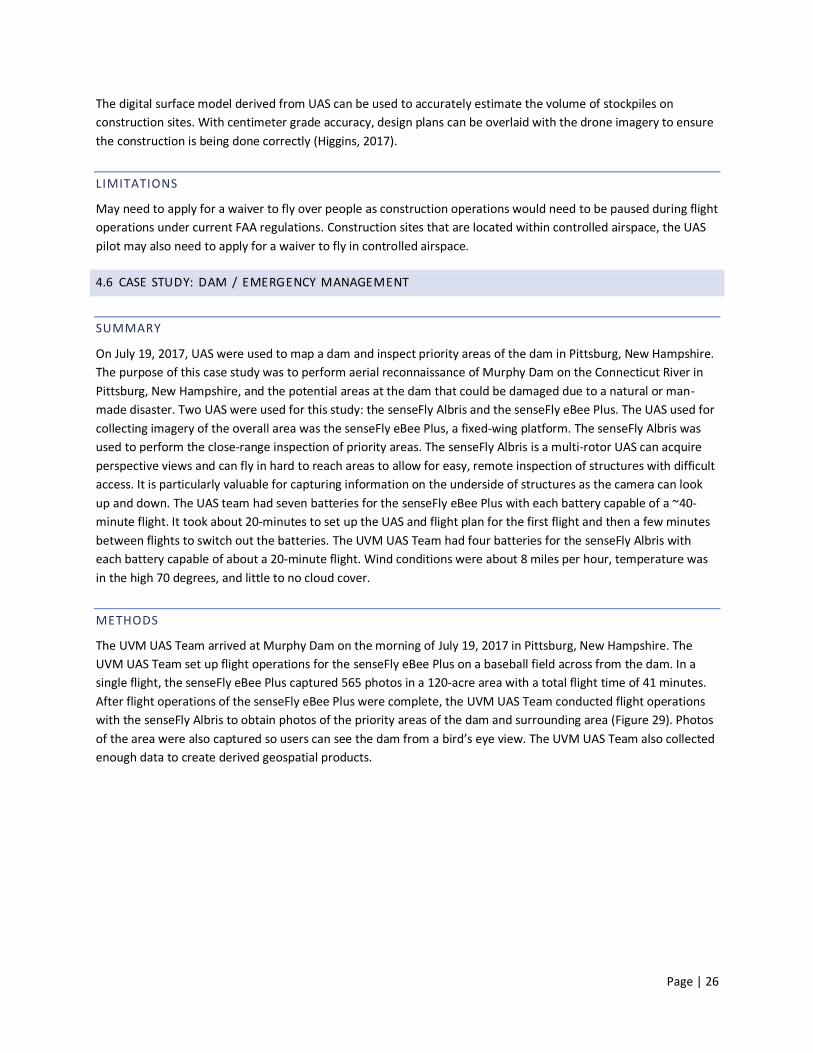
METHODS
The UVM UAS Team arrived at Murphy Dam on the morning of July 19, 2017 in Pittsburg, New Hampshire. The
UVM UAS Team set up flight operations for the senseFly eBee Plus on a baseball field across from the dam. In a
single flight, the senseFly eBee Plus captured 565 photos in a 120-acre area with a total flight time of 41 minutes.
After flight operations of the senseFly eBee Plus were complete, the UVM UAS Team conducted flight operations
with the senseFly Albris to obtain photos of the priority areas of the dam and surrounding area (Figure 29). Photos
of the area were also captured so users can see the dam from a bird’s eye view. The UVM UAS Team also collected
enough data to create derived geospatial products.
Page | 27
Figure 229. The UVM UAS Team performing flight operations with the senseFly Albris.
Data processing involved taking the 565 images captured by the senseFly eBee Plus to generate 2D and 3D
geospatial products using digital photogrammetric techniques. The initial processing, which was carried out
immediately after flight operations using the eMotion software, synchronizes the images with the flight log on the
UAS. The geospatial products were generated using Pix4D. Pix4D first computed a 3D model of the area using the
imagery, then used that 3D model to generate a seamless orthorectified image mosaic. A report was also created
that provided information on the calibration, geolocation, and point cloud densification details.
The processing for this case study took approximately two and a half hours to complete. Once completed the total
file size of the output products was 50GB. The processing was run on a computer with 28-core CPU and 128GB of
RAM.

Page | 28
PRODUCTS
Geospatial products included orthomosaic imagery, digital surface model, digital elevation model, and 3D point
cloud (Figure 30). Using the digital elevation model, contour lines can be generated (Figure 31). High resolution
inspection photos of priority areas are also a product for this case study (Figure 32). The 3D point cloud was
uploaded to an online platform for accessibility. UVM UAS Team also created support products such as a fact
sheet, slide show presentation, and ESRI Story Map (Figure 33).
Figure 30. Geospatial products of the dam case study. Upper left is the orthomosaic, upper right is the 3D point cloud, lower left is the
digital surface model, and the lower right is the digital elevation model.

Page | 29
Figure 231. Contours can be calculated through the digital elevation model.
Figure 242. High resolution inspection photos captured during the dam case study. The senseFly Albris UAS is able to collect true color
photos and videos in addition to thermal images.

Page | 30
STRENGTHS
The resolution of the UAS imagery was exactly 2.5 cm, in comparison to the ESRI base map of 30 cm, so fine details
could easily be detected using the UAS imagery. UAS data can be viewed in a 3D setting where precise
measurements on the horizontal and vertical scale can be made. Contour lines were easily created using the UAS
elevation products, saving time and money than using traditional methods
UAS used to acquire inspection photos can access locations that cannot be done manually. These UAS have the
ability to hover over an area of interest for measurements. Regular monitoring of a dam’s infrastructure is critical.
By acquiring imagery and inspection photos regularly, the data can be compared to historical records to monitor
and track signs of degradation. UAS can be used to determine the limits and extent of damage to public works
after a disaster occurs. Documenting damage can help facilitate situational awareness and cost estimates. UAS
offer a safe, cost-effective way to inspect dams compared to traditional methods like rope-access inspections.
Rope-access inspections are expensive with many inspections costing upwards of $10,000 for one site. UAS can do
similar work for a fraction of that (Tennessee Valley Authority, 2016).
LIMITATIONS
UAS cannot independently perform a dam inspection, but it can provide valuable information that an inspector
may not acquire through traditional methods due to safety or the inability to inspect a hard to reach area by hand
(Tennessee Valley Authority, 2016).
Figure 33. Screen capture of the dam case study ESRI Story Map.
Page | 31
The UAS also acquired thermal inspection photos for this case study. Although thermal can be a valuable product
when capturing data, in this case the thermal data spatial resolution was too coarse to analyze any details.
4.7 CASE STUDY: TRAFFIC MONITORING
I-95 TRAFFIC MONITORING
SUMMARY
On April 28 and April 30, 2017, UAS were used to monitor traffic on I-95 by the Piscataqua Bridge from 1430 to
1630 in Portsmouth, New Hampshire. UVM’s UAS team worked with local agencies to acquire footage of the
vehicle traffic of I-95 that day. UAS were deployed from several areas of interest north and south of the Piscataqua
Bridge and recorded continuous aerial videos of traffic for five to ten minutes. The UAS used for this study was the
DJI Phantom 4 which is a quadcopter platform with a high-performance camera that can shoot video in 4K at 30
frames per second. The UAS team had four batteries for the DJI Phantom with each battery capable of a ~25-
minute flight. It took under five minutes to set up the UAS for each flight. The use of UAS for traffic monitoring
allows for acquisition of localized spatial information in a timely manner. Weather conditions on April 28th were 7
mile per hour winds, scattered clouds, and temperature was in the mid-70s. On April 30th, weather conditions were
8 mile per hour winds, cloudy, and temperature was in the mid-40s. On April 30th, flight operations were concluded
due to precipitation starting.
METHODS
This case study occurred on two high-traffic days where lanes were closed for construction, Friday April 28th, 2017
and Sunday April 30th, 2017. On April 28th, the UVM UAS Team arrived at 42 Ranger Way Portsmouth, New
Hampshire to discuss plan of action at 1430. At 1500, UAS operations hovered over a point at 43.074646, -
70.780981. The UAS took three videos focused on both north-bound and south-bound traffic totaling ~7 minutes.
At 1530, UAS video was recorded while it hovered over a point at 43.083269, -70.773330 for ~5 minutes. Video
was focused on north-bound traffic. At 1540, UAS operations hovered over a point at 43.085053, -70.772788 for ~6
minutes. Video focused on north bound traffic and vehicles entering I-95 north at exit 7. At 1620, UAS video was
recorded while it hovered over a point at 43.068892, -70.787232 for ~11 minutes. Video focused on both north-
bound and south-bound traffic. At 1635, UAS operations were complete.
On April 30th, the UVM UAS Team arrived at 174 State Road Kittery, ME at 1430 to discuss plan of action. UAS
operations began hovered over a point at 43.104564, -70.747761 focused on south-bound traffic for ~4 minutes at
1440. At 1500, UAS video focused on beginning of traffic buildup on I-95 south for ~5 minutes. At 1545, the UAS
video focused on south-bound traffic hovered over a point at 43.107156, -70.744867 for ~4 minutes. At 1620, UAS
operations hovered over a point at 43.100238, -70.753921 focused primarily on south-bound traffic for ~5
minutes. At 1630, UAS operations were complete.
The data processing for this case study involved uploading all of the UAS videos to YouTube.
PRODUCTS
Products for this case study are 10 MP4 video files totaling over 8 GB of data. These videos were uploaded to a
YouTube video for accessibility (Figure 34). The UVM UAS team also created support products such as a fact sheet
and slide show presentation.

Page | 32
Figure 34. Screen capture of the YouTube video taken during the I-95 traffic monitoring case study.
FRANCONIA NOTCH TRAFFIC MONITORING
SUMMARY
On October 14, 2017, UAS were used to monitor overflow parking area from 1030 to 1430 within Franconia State
Park. UVM’s UAS team worked with local agencies to acquire footage and photos of the overflow parking situation.
UAS were deployed from several areas of interest near popular trailheads during peak foliage season in Franconia
State Park. The UAS used for this study was the DJI Phantom 4 which is a quadcopter platform with a high-
performance camera that can shoot video in 4K at 30 frames per second. The UAS team had four batteries for the
DJI Phantom 4 with each battery capable of a ~25-minute flight. It takes under five minutes to set up the UAS for
each flight. The use of UAS for traffic monitoring allows for acquisition of localized spatial information in a timely
manner.
METHODS
On October 14th, 2017, the UVM UAS Team arrived at Lafayette Campground Road at 1020and set up UAS flight
signs and traffic cones for safety. At 1030, UAS operations began at Lafayette Campground Road. The UAS took
three videos focused on vehicle parking along both north- and south-bound I-93 parking. The UAS also took 15
photos focused on vehicle parking along both north- and south-bound I-93. At 1045, UAS operations at Lafayette
Campground Road were completed. At 1215, UAS operations began at the Kancamagus Highway by the Lincoln
Woods Trailhead. The UAS took two videos focused on the vehicle parking in that area. The UAS also took nine
photos of the overflow parking near this trailhead. At 1245, UAS operations were completed.
The data processing for this case study involved uploading all of the UAS videos to YouTube. This video is restricted
on YouTube so only those with the specific URL can view the compiled videos.

Page | 33
PRODUCTS
Products for this case study are 8 MP4 video files totaling over 4 GB of data and 38 JPG photos totaling 188 MB.
These photos and videos were uploaded to an ESRI Story Map for accessibility (Figure 35). Team also created
support products such as a fact sheet and slide show presentation.
Figure 35. ESRI Story Map of the Franconia Notch traffic monitoring case study. Each photo and video captured is geotagged and uploaded to
an online platform so anyone with internet access can view the data.
TRAFFIC MONITORING STRENGTHS
The use of UAS for traffic monitoring have the capability to acquire accurate data in a timely manner. The DJI
Phantom 4 can precisely hover and send live video feeds to the remote control so the pilot has the ability to focus
on areas of interest easily. The DJI Phantom 4 also takes little time to set up, where the UAS can be ready to fly in
under five minutes. These abilities such quick set up time, acquiring data quickly, hovering that make it easier and
safer to fly. The ability to drive onto medians and near highway on ramps allowed the UAS to hover very close to
areas without flying directly over cars or people. The UAS team and local agencies worked together to ensure the
UAS was acquiring video of the correct area of interest.
The videos were uploaded to YouTube that enables anyone with a web browser to examine the traffic videos. Each
photo/video is geotagged so one can acquire location data to evaluate traffic patterns.
TRAFFIC MONITORING LIMITATIONS
In order to acquire video for a larger area, a waiver would be acquired to fly over people, vehicles, and into the
natural area. There may be potential public concerns with the use of UAS for this purpose. There are also concerns
with UAS causing potential accidents due to distraction.

Page | 34
4.8 CASE STUDY: RAIL & BRIDGE INSPECTION
SUMMARY
On June 1, 2017, Unmanned Aerial Systems (UAS) were used to map a rail line and inspect a railroad bridge. The
rail line was mapped to assess the conditions of a two-mile stretch of the New Hampshire central railroad in
Lancaster, New Hampshire. Within the rail corridor, a bridge in regular service was also inspected using UAS
technologies. UVM’s UAS team worked with the NH DOT Bureau of Rail and Transit to acquire data of the rail
corridor and bridge. UAS flight operations were carried out by two teams concurrently. Team 1 collected imagery
of the entire rail corridor while Team 2 focused on inspecting the bridge that falls within the rail corridor. Two UAS
were used for this study: the senseFly Albris and the senseFly eBee Plus. The UAS used for collecting imagery of the
rail corridor was the senseFly eBee Plus, a fixed wing platform. The senseFly Albris, a multi-rotor inspection UAS, to
capture high-resolution inspection photos of the bridge. The senseFly Albris can acquire perspective views and can
fly in hard to reach areas to allow for easy, remote inspection of structures with difficult access, but not near trees
or overhanding wires. Weather conditions that day were in the low 70s and low winds.
METHODS
Flight operations were carried out by two teams. Team 1 was responsible for collecting imagery of the entire rail
corridor using the senseFly eBee Plus. Operations were carried out from two locations in order for the remote
pilots to maintain line of sight of the UAS. The first location was a privately-owned field and the second was an
electric substation, both locations were used after proper permission was granted (Figure 36). The senseFly eBee
Plus was able to cover the entire area of interest in four flights over the course of 102 minutes of flight time.
Figure 36. The UAS Team performing flight operations for the senseFly eBee Plus
Team 2 focused on inspecting the bridge that falls within the rail corridor. To accomplish this task, the senseFly
Albris quadcopter system was used, which has the ability to hover above and below the bridge in manual flight
mode. While using its rotating camera that captures high-resolution images, inspectors had the ability to see a live

Page | 35
video feed as well as save photos for further inspection later on. The senseFly Albris was deployed six times to
acquire the necessary data. This data was collected over the course of 67 minutes of flight time.
Data processing involved taking the 1,089 images captured by the senseFly eBee Plus and 224 images from the
senseFly Albris to generate 2D and 3D geospatial products using digital photogrammetric techniques. The initial
processing, which was carried out immediately after flight operations using the eMotion software, synchronizes
the images with the flight log on the UAS. The geospatial products were generated using Pix4D. Pix4D first
computed a 3D model of the area using the imagery, then used that 3D model to generate a seamless
orthorectified image mosaic. A report was also created that provided information on the calibration, geolocation,
and point cloud densification details.
The processing for this case study took approximately six hours to complete. Once completed the total file size of
the output products was 50GB. The processing was run on a computer with 28-core CPU and 128GB of RAM.
PRODUCTS
Geospatial products included orthomosaic imagery, digital surface model, digital elevation model, and 3D point
cloud (Figure 37). High-resolution inspection photos of priority areas are also a product for this case study (Figure
38). The UVM UAS Team also created support products such as a fact sheet, slide show presentation, and ESRI
Story Map (Figure 39).
Page | 36
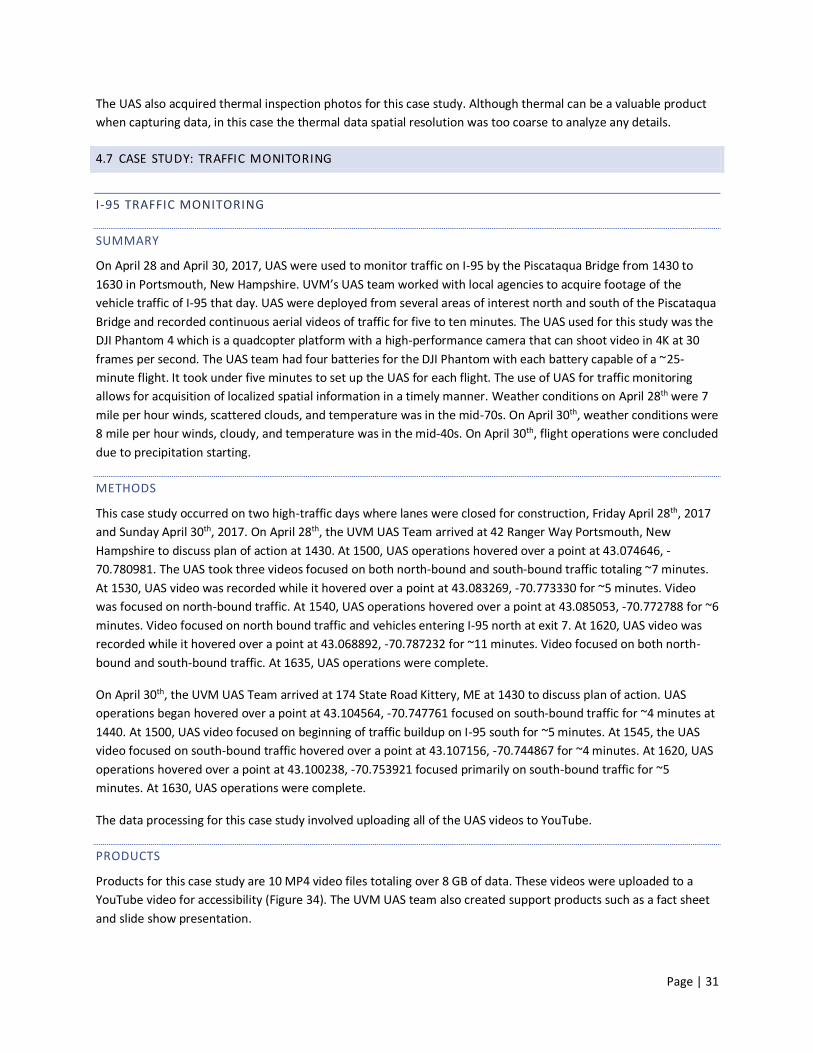
Figure 37. Geospatial products of the rail mapping and bridge inspection case study. Upper left is the orthomosaic, upper right is the 3D
point cloud, lower left is the digital surface model, and the lower right is the digital elevation model.
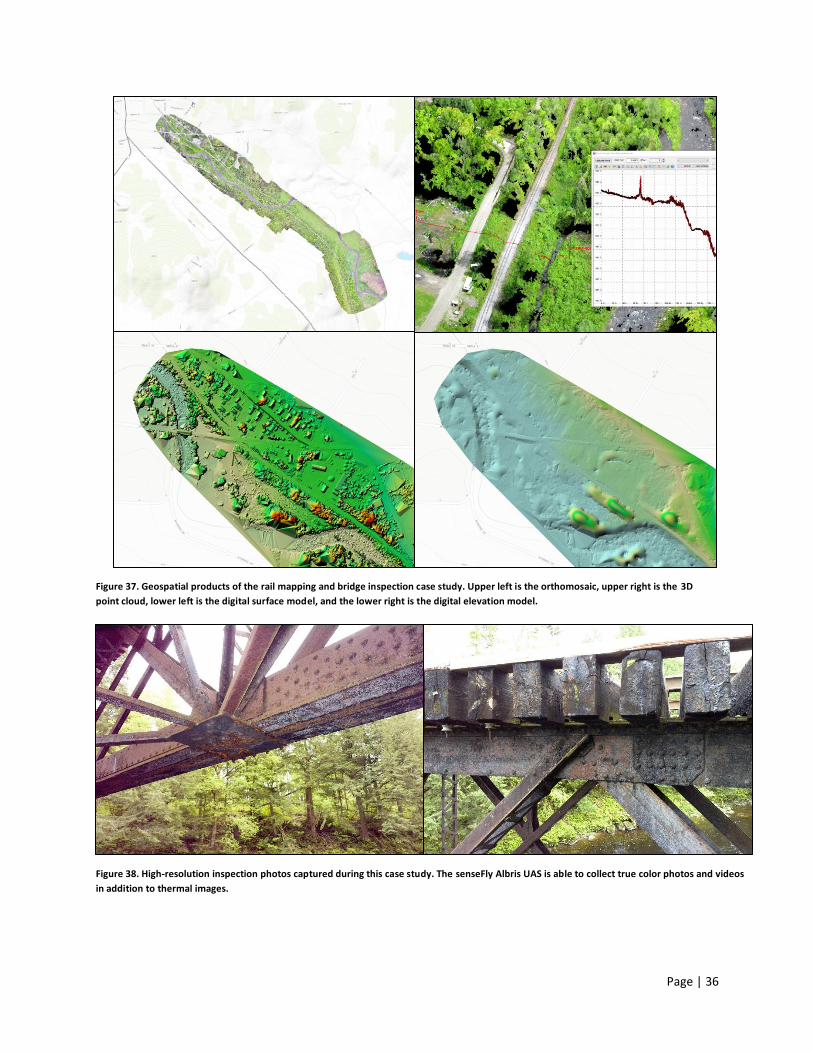
Figure 38. High-resolution inspection photos captured during this case study. The senseFly Albris UAS is able to collect true color photos and videos
in addition to thermal images.

Page | 37
STRENGTHS
The Minnesota Department of Transportation conducted a cost comparison based on the inspection of Duluth’s
Blatnik Bridge. During a typical bridge inspection, this bridge would require four inspection vehicles, an 80 foot
man-lift, and require eight inspection days. To perform this bridge inspection using traditional methods would total
to about $59,000. The cost of using UAS to inspect the same bridge would cost $20,000 with only 5 days onsite.
That is nearly a $40,000 cost difference between the two approaches. Bridge inspections done with UAS can be
performed without closing down traffic on the bridge (Wells). Unfortunately, this case study determined that UAS
does not provide cost savings in the inspection.
UAS provides the general overview of the line or bridge to look at damage, accidents, encroachments, flooding
when it is difficult to get personnel close to the area of interest.
UAS provides a unique perspective as the UAS can move its camera in almost any direction needed, including the
under sides of bridges. The use of platforms with thermal sensors provide an efficient way to detect concrete
failure (Wells). Using photogrammetry software like Pix4D, 3D models can be created to determine measurements
and large-scale planning.
Figure 39. Screen capture of the rail mapping and bridge inspection case study ESRI Story Map.

Page | 38
LIMITATIONS
UAS cannot be used to independently inspect a bridge, but can be used as a tool for bridge inspectors to view
difficult to reach areas in certain situations. Measurements can be obtained from UAS data, but hands on
inspection like cleaning and testing cannot be replaced by UAS (Wells). UAS is unable to go into the confines of the
truss-open deck style bridges.
Inspections in the Hy-Rail vehicle generally cover 10-15 miles per hour, but the UAS covered only 1 mile in
approximately 2.5 hours. Bridge inspectors can climb on the bridge and inspect all the connections and bridge
members. UAS inspections end up costing more in field work, analysis, and reporting writing as their current
operations are more automated. UAS operations also use a significant amount of computer storage without
providing the detailed information bridge inspectors need. In NH DOTs experience on state-owned bridges, UAS
limitations outweigh the benefits.
4.9 CASE STUDY: ROCK SLOPE
SUMMARY
On July 26, 2017, UAS were used to map and inspect the rock slope and surrounding area. UVM’s UAS team
worked with local agencies to acquire photos and the data necessary to create a georeferenced point cloud of the
rock slope. There were two major objectives for this case study. The first was to create a high-resolution
georeferenced point cloud of a rock slope suitable for 3D modeling and visualization to analyze the rock structure.
The second objective was to capture high-resolution inspection photos of the rock slope to provide ample
viewpoints of the rock face. UAS were deployed from several areas of interest near the rock slope to acquire the
necessary data. The UAS used for this study was the DJI Phantom 4 which is a quadcopter platform with a high-
performance camera that can shoot video in 4K at 30 frames per second. The UAS team had four batteries for the
DJI Phantom with each battery capable of a ~25-minute flight. It takes under five minutes to set up the UAS for
each flight. Weather conditions were in the mid-70s on the day of flight operations.
METHODS
The UVM UAS Team arrived to the rock slope by Crawford Notch State Park on the morning of July 26, 2017. The
UVM UAS Team set up flight operations at various locations over the rock face. In three flights with the DJI
Phantom 4, 310 photos were captured with a total flight time of 30 minutes and 25 seconds.
Data processing involved taking the 310 images captured by the DJI Phantom 4 UAS to generate 3D geospatial
products using digital photogrammetric techniques. The initial processing, which was carried out immediately after
flight operations using the eMotion software, synchronizes the images with the flight log on the UAS. The
geospatial products were generated using Pix4D. Pix4D first computed a 3D model of the area using the imagery,
then used that 3D model to generate a seamless orthorectified image mosaic. A report was also created that
provided information on the calibration, geolocation, and point cloud densification details.
The processing for this case study took approximately one hour and nine minutes to complete. Once completed
the total file size of the output products was 3.3 GB. The processing was run on a computer with a 28-core CPU
and 128GB of RAM.

Page | 39
PRODUCTS
Products included 3D point cloud and high-resolution inspection photos (Figure 40 and Figure 41). The 3D point
cloud was uploaded to Sketchfab, an online platform, for accessibility. The UVM UAS Team also created support
products such as a fact sheet, slide show presentation, and ESRI Story Map (Figure 42).
Figure 40. The 3D point cloud produced during this case study. This data was also uploaded to Sketchfab.
Figure 41. High-resolution inspection photos captured during this case study.

Page | 40
Figure 42. Screen capture of the rock slope case study ESRI Story Map.
STRENGTHS
UAS provide a unique view of the rock slope that an inspector would otherwise be unable to view from the ground.
Manual measurements of rock slopes are potentially dangerous work when using the rope-access method.
Without the use of rope-access method, personnel on the ground are limited to only seeing what they can from
the ground. Working on the ground by rock slopes exposes the individual to potential rock fall and often high-
speed traffic on the adjacent road way. While manned aircraft cannot get close enough to collect the necessary
details about the site, UAS are able to get close to the rock face. Using UAS to acquire this data keeps personnel
away from the potentially dangerous rock slopes. The highly detailed 3D model created of the rock slope can be
used to make measurements in locations that are unreachable by hand measurements.
LIMITATIONS
With most rock slopes being by road ways, it is necessary to close down part of the road to ensure cars are not
driving under drone operations. A waiver would need to be acquired to fly over cars and people, but only if the
road could not be shut down. Although using UAS is safer in some ways, in this case study the UVM UAS Team was
exposed to moving vehicles on then open traffic lane.
Although data obtained during this case study can be uploaded to online platforms, to make measurements on the
data one would need access to software programs like Quick Terrain Modeler.

Page | 41
CHAPTER 5: CONCLUSIONS
5.1 OPPORTUNITIES
UAS technology will provide NH DOT the opportunity to revolutionize the way in which they collect data for many
different types of activities. Acquiring information using UAS proves to be faster than some traditional methods.
UAS can even acquire survey grade data faster than if it were done manually. This saves time and in turn saves
money. For most UAS applications, they offer an excellent screening tool while other applications are a good
inspection tool. UAS can hover to access difficult to reach areas by traditional methods. Using UAS is also safer
than manual inspections since personnel are not putting themselves in dangerous areas except in cases where the
UAS operator is next to traffic. Data captured by UAS can create geospatial products that can then in turn be used
for analysis and readily integrated with other spatial data. It must be noted that UAS were unable to access inside
of bridges for these studies, but may be able to do so in the future.
OTHER STATES & UAS
New Hampshire is not the only state exploring UAS according to Asphalt Magazine, 17 state DOTs have studied or
used UAS and 16 state DOTs are exploring UAS usage. DOTs that have used UAS technology include Alabama,
Connecticut, Delaware, Idaho, Indiana, Kentucky, Maryland, Massachusetts, Minnesota, Michigan, New York, Ohio,
Oregon, South Carolina, Tennessee, Vermont, Pennsylvania, Utah, and Washington. DOTs that are exploring UAS
include Alaska, Colorado, California, Florida, Georgia, Hawaii, Iowa, Illinois, Kansas, Mississippi, New Hampshire,
New Mexico, Nevada, North Dakota, Pennsylvania and West Virginia (Asphalt) (Wojtowicz 2017) (Wood 2017)
(Utah DOT).
5.2 IMPLEMENTATION CONSIDERATIONS
IN HOUSE CONSIDERATIONS
HUMAN RESOURCES
The most important part of any UAS program is the people. A variety of skillsets are needed to make a UAS
program within NH DOT successful ranging from UAS flight operations to geospatial data processing and
visualization. Investments in technology alone cannot overcome shortchanging training.
To conduct flight operations, NH DOT must have UAS pilots that have obtained their Part 107 Remote Pilot license.
Part 107 is the FAA regulation that governs the commercial operation of UAS. Acquiring the license consists of
passing an aeronautical knowledge test and undergoing a security screening
(https://www.faa.gov/uas/getting_started/part_107/). Since earning a remote pilot license is only a knowledge
test, NH DOT recommended that to implement platform-specific training. The remote pilot will need this training
to successfully fly the UAS platforms that NH DOT decides to employ.
It is worth noting that different UAS platforms require different levels of expertise. For example, the DJI Phantom 4
that was used for a handful of case studies is fairly easy to fly and this UAS platform would require minimal
training. On the other hand, the senseFly eBee Plus flies autonomously, but it requires more technical skills since
the pilot has to be familiar with the flight planning program the senseFly eBee Plus uses and enter specific
parameters to capture high-quality results. If NH DOT decides to employ UAS in house for the purpose of an eye in

Page | 42
the sky or some inspections to acquire photos and videos than the DJI Phantom 4 would be a great UAS for NH
DOT to purchase at minimal cost and would require the minimal new skillsets.
If NH DOT were to employ UAS for survey work or geospatial data then additional skillsets are requires outside of
piloting the UAS. The senseFly eBee Plus and others are made specifically to map areas so some background in GIS
is required to create high-quality results. In addition to entering the specific parameters into the flight planning
software, expertise is necessary to process the raw data from the UAS to create geospatial products. After
geospatial products are created, then the data can be brought into GIS software to analyze, modify, or extract
features.
NH DOT could also hire consultants to assist with UAS projects or training.
UAS PLATFORMS & SENSORS
UAS platforms ease of use and integration vary between systems where some platforms are fairly easy to use, and
others require specialized technical skills. UAS platforms that will be easier for NH DOT to integrate will be
quadcopters with a camera and gimbal included. These UAS require minimal training to pilot and do not require
NH DOT to invest in specialized software and hardware to process and view the data. These UAS can capture
photos and videos so they are useful for tasks where aerial media is necessary. Although this platform is best for
aerial photos and videos, geospatial products can be produced (accuracy and resolution will be lower). For tasks
that do not require survey grade data than this platform can be used to create geospatial products like the rock
slope survey.
UAS platforms that may be more difficult for NH DOT to integrate include senseFly fixed wing UAS like the eBee,
eBee RTK, and eBee Plus due to the technical skills involved when flying the UAS and processing the data to create
geospatial products. Although the fixed wing senseFly UAS platforms are easier to fly in the field because they fly
autonomously, they require technical skills to understand how to create high quality maps. Not only does one
need the expertise to fly the UAS, but also to process and analyze the UAS geospatial data when using this
platform. Another limitation of this is the size of the data products that is produced from processing the data to
create geospatial products. The UAS missions that benefit by using this platform are missions where accurate,
survey grade data is necessary.
LIABILITIES/INSURANCE
NH DOT will need to consult with the state attorney general’s office on specifics regarding liability and insurance.
All contractors should be properly insured for any work they do. At the time of this report’s publications there is no
UAS insurance standard. Some insurance companies do cover UAS operations as part of their general liability
coverage while others require a separate policy, sometimes with an external entity.
PRIVACY ISSUES
As privacy issues are one of the most cited concerns in UAS operations, particular attention was paid to public
perception during UAS operations of the case studies. At times, it may be necessary to conduct launch and landing
of the UAS during flight operations on private land due to UAS platform limitations, terrain, or other factors. When
this is the case, landowner approval is required. Being proactive by discussing the UAS operations with landowners
in the area to be an effective approach. People are inherently curious and when they have a chance to view the
operations up close many of their preconceived notions of UAS may change.

Page | 43
For privacy and harassment laws for New Hampshire, refer to applicable New Hampshire Revised Statutes
Annotated 600 laws, including but not limited to:
RSA 644:2 Disorderly Conduct;
RSA 644:4 Harassment;
RSA 644:6 Loitering or Prowling; and
RSA 644:9 Violation of Privacy
PROJECT COMPLEXITY
UAS missions that will be easier for NH DOT to implement include areas of projects that only capture photos,
videos, or virtual reality products as these products do not require specialized software or hardware to process.
The case studies that only capture photo or video products were flown using the DJI Phantom 4 quadcopter that is
a fairly easy to learn to fly. Projects that will be more difficult to implement are the studies that involved
processing the geo-located images to create geospatial products. Such projects require specialized software to
process the data and to view and analyze the resulting geospatial products. The specialized hardware and software
contribute to both cost and complexity. Although a majority of case studies involved generating geospatial
products, there are areas in every case study that may benefit from only acquiring aerial photos/videos if NH DOT
decides not to invest in the resources to produce geospatial products in house. Using UAS as a means to acquire
aerial perspective may still beneficial.
The traffic monitoring projects may be the easiest UAS mission to implement into the existing structures of NH
DOT due to the type of data produced and the level of expertise required to perform the tasks in this project. The
information collected during this study is accessable to most people as videos and images that can be opened up
on almost any computer. The data can also be put up on to an online platform like ESRI Story Maps to view the
traffic monitoring data with its GPS location to further analyze the traffic as shown below (Figure 43).
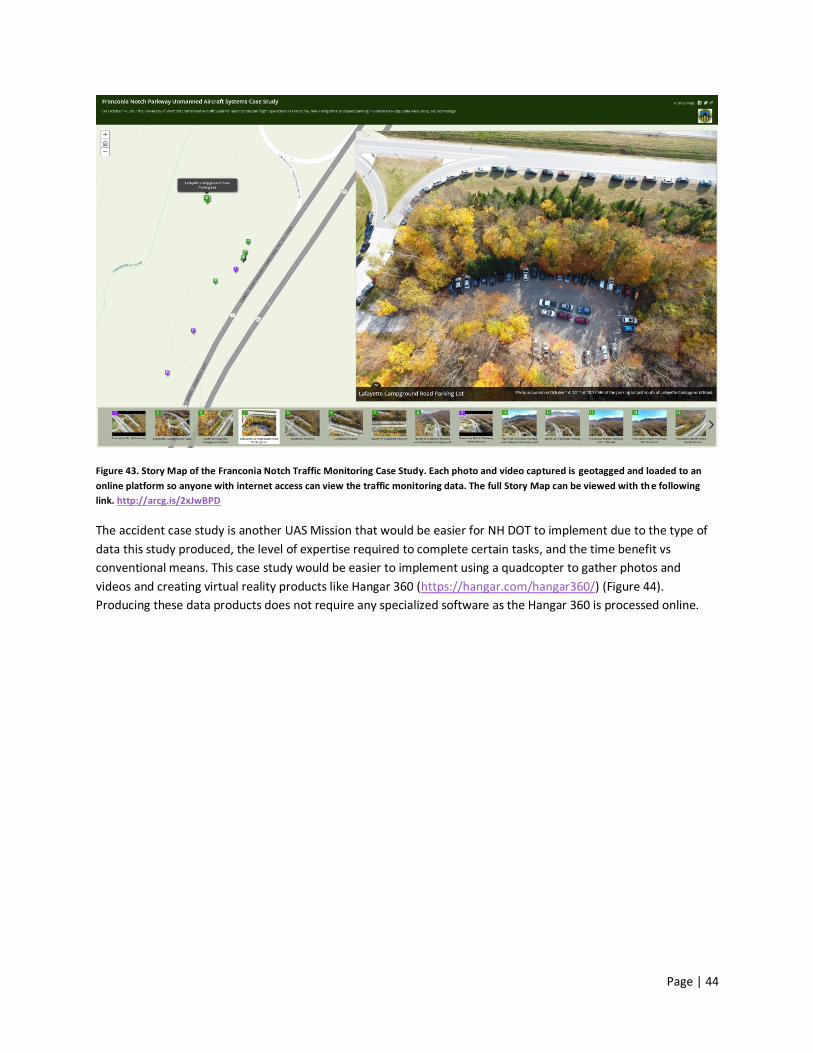
Page | 44
Figure 43. Story Map of the Franconia Notch Traffic Monitoring Case Study. Each photo and video captured is geotagged and loaded to an
online platform so anyone with internet access can view the traffic monitoring data. The full Story Map can be viewed with th e following
link. http://arcg.is/2xJwBPD
The accident case study is another UAS Mission that would be easier for NH DOT to implement due to the type of
data this study produced, the level of expertise required to complete certain tasks, and the time benefit vs
conventional means. This case study would be easier to implement using a quadcopter to gather photos and
videos and creating virtual reality products like Hangar 360 (https://hangar.com/hangar360/) (Figure 44).
Producing these data products does not require any specialized software as the Hangar 360 is processed online.

Page | 45
Figure 44. Virtual reality of the Accident Case Study. The virtual reality can be viewed with the following link.
https://viewer.hangar.com/360?assetId=/vjxbZVP0
Using UAS as an assessing tool for bridge inspections may also be an easier project to implement, particularly if the
end product was only photos. It should be noted that inspections that involve capturing imagery of the underside
of structures require more advanced UAS platforms with gimbled camera along with an operator that has
experience in carrying out this type of work.
The aeronautics, construction, dam, and rail mapping would be the most challenging case studies for NH DOT to
implement due to the software and hardware necessary to capture, process, and analyze the data. Not only would
NH DOT need to invest in the necessary software to process and analyze the geospatial data, but NH DOT may
need to invest in specialized UAS platforms. The long-term benefits in safety, cost, and quality are clear, but having
the capabilities to carry out such projects would require significant short-term investments.
IT/GIS CONSIDERATIONS
HARDWARE & SOFTWARE
The hardware and software requirements needed to view, process, and analyze UAS datasets differ for UAS data
collected for geospatial products and UAS data collected for inspection photos or aerial media. UAS data collected
for geospatial products require specialized software programs to process the UAS data that also necessitate
specific hardware requirements. For UAS data that is not being processed for geospatial products, they do not
have specific requirements for hardware and software so long that the computer can open photo and video files.
Generating the geospatial products can be carried out using Pix4D, a state-of-the-art digital photogrammetric
software package. Pix4D first generates a 3D model of the area of interest, then uses that 3D model to generate a
seamless orthorectified image mosaic. A report is also created that provides information on the calibration,
geolocation, and point loud densification details. In order for Pix4D to work efficiently, the program has minimum
and recommended software and hardware requirements that can be found on Pix4D’s website

Page | 46
(https://pix4d.com/). The minimum requirements as of 2018 to process UAS data for geospatial products includes
Windows 7, 8, or 10, Server 2008 or 2012, 64 bits, any CPU, and any GPU that is compatible with OpenGL 3.2.
After the geospatial products are processed, the data products can be viewed and analyzed on GIS platforms. The
orthomosaic and digital surface model can be opened in ArcGIS, MapInfo, ENVI, ERDAS Imagine, and other GIS
platforms. 3D Point Clouds can be viewed on platforms like Quick Terrain Modeler (https://appliedimagery.com/).
Below is a graphic describing the many general IT considerations NH DOT will need to consider before
implementing geospatial UAS work in house (Figure 45).
Figure 45. Graphic describing the IT considerations NH DOT must make before implementing geospatial UAS work.
DATA STORAGE/FORMAT
When processing the UAS data in Pix4D, the user can choose the file formats they want the output data to be
saved to. The typical file formats used in Pix4D outputs are TIFF for the imagery, digital surface models, and digital
terrain models and LAZ for the 3D point cloud model. The Pix4D website describes the different file formats the
data can be saved to with the software it can be opened with, and intended use (https://support.pix4d.com/hc/en-
us/articles/202558499). Below are tables describing the typical file formats created during the Pix4D process along
with the software that can open the data, use, and if the data can be uploaded to an online platform. The UVM
UAS Team does not endorse any of the software described below. The Pix4D software updates frequently so the
data types for UAS products may change as well.

Page | 47
Table 1. Below describes the typical file format, software, use, and ability to upload to an online platform for densified point clouds.
File Format Software Use Upload Online
.las & .laz Quick Terrain Modeler
Visualization No
Global Mapper ArcGIS
Visualization
VRMesh Visualization
Point cloud classification
LAStools Point Cloud Processing
Table 2. Below describes the typical file format, software, use, and ability to upload to an online platform for raster digital surface models.
File Format Software Use Upload Online
.tif (GeoTIFF) Global Mapper
ArcGIS
Quick Terrain Modeler
Quantom GIS
Contour lines generation
Distance, area and volumemeasurements
Comparing volumes betweentwo DSMs
3D digitization
ArcGIS Online
ESRI Story Maps
Table 3. Below describes the typical file format, software, use, and ability to upload to an online platform for raster terrain models.
File Format Software Use Upload Online
.tif (GeoTIFF) Global Mapper
ArcGIS
Quick Terrain Modeler
Quantom GIS
Distance and areameasurements
2D digitization
ArcGIS Online
ESRI Story Maps
Table 4. Below describes the typical file format, software, use, and ability to upload to an online platform orthomosaic.
File Format Software Use Upload Online
.tif (GeoTIFF) Global Mapper
ArcGIS
Quantom GIS
AutoCAD
Distance and areameasurements
2D digitization
ArcGIS Online
ESRI Story Maps

Page | 48
Table 5. Below describes the typical file format, software, use, and ability to upload to an online platform for 3D textured mesh.
File Format Software Use Upload Online
.obj MeshLab Visualization SketchFab
Global Mapper ArcGIS
Rhino
3DBuilder
Autodesk Maya
.ply MeshLab Visualization No
SketchFab Web viewing and sharing SketchFab
Blender, Meshmixer
3D Printing No
UAS geospatial datasets are often very large so it is important that NH DOT has the storage capabilities in place to
store UAS datasets. As an example, the University of Vermont Spatial Analysis Lab has 150 TB of dedicated high-
performance network storage that is backed up daily.
DATA INTEGRATION/ACCESSIBILITY
Geospatial data products can be opened in GIS software platforms to view and analyze the data, but most data
products produced from UAS can also be uploaded to an online platform like ArcGIS Online. By putting UAS data
onto an online platforms it makes the information more accessible to users. Orthomosaics, Digital Surface Models,
and Digital Terrain Models can be put on ArcGIS Online. An example of UAS imagery uploaded to ArcGIS Online can
be viewed with the following link (http://go.uvm.edu/acjut). 3D Point Clouds can be put onto online platforms like
SketchFab to visualize 3D data. An example of 3D models uploaded to SketchFab that can be viewed with the
following link (https://skfb.ly/6vqqy). Virtual reality products like Hangars360 can be easily created and shared.
These products provide a 360 degree aerial view of an area and can provide an overview visualization of an area
when geospatial UAS products are not necessary. An example of a Hangar360 can be viewed with the following link
(http://go.uvm.edu/vehfo).
ESRI Story Maps are another way to make UAS datasets accessible to the public and to showcase the data to tell a
story. An example of an ESRI Story Map can be viewed with the following link (http://bit.ly/2yxvAO9).
5.3 RECOMMENDATIONS
IMPLEMENTATION RECOMMENDATIONS
It is worth noting that the investment of using UAS in house is a huge monetary investment that NH DOT must be
prepared to make to use UAS successfully. Not only does NH DOT need to invest in multiple UAS platforms and
sensors, but NH DOT must ensure they have the IT/GIS back bone to support UAS implementation. This includes
training personnel to fly, process, and analyze the data and also the necessary storage space to store the data
products. This investment in UAS implementation is close to $500,000 to start a successful in-house UAS program.

Page | 49
NH DOT may need to implement different areas of UAS over time as some aspects of UAS are easier to adopt than
others. NH DOT has the capabilities now to implement UAS technologies for aerial perspective through photos and
videos, but to implement UAS for geospatial data and analysis it will require investments not only in hardware and
software, but also trained personnel. UVM UAS Team recommends that NH DOT approach the implementation of
UAS in two phases. The initial phase would be to implement simple UAS platforms that require minimal or no
additional processing or software to process and view the data. This would allow NH DOT to begin using UAS in-
house without investing in the resources necessary to perform advanced UAS processing and analysis. This phase
would be to use UAS for aerial perspective through photos, videos, and even virtual reality. Although geospatial
products are not produced at this stage, most of the case studies can still benefit from just having an aerial
perspective. The UAS missions that may benefit the most at this stage include traffic monitoring, inspection
photos, accident reconstruction, construction monitoring, and rock slope study. This stage can also be an
opportunity for NH DOT to begin training on the basic processing and viewing of UAS geospatial data. NH DOT can
begin basic processing through Pix4D Cloud (https://cloud.pix4d.com/login) which will process the individual UAS
photos in an online platform and automatically create a web map to view the data. Another option to create basic
geospatial products is using Live Map through Drone Deploy (https://blog.dronedeploy.com/introducing-live-map-
make-real-time-drone-maps-with-your-iphone-or-ipad-27752b3963a4). Live Map is a new tool that will process the
data on the fly while the UAS is still in flight which allows for immediate viewing of the imagery results. The
benefits to processing the data on the cloud allows NH DOT to practice the skills necessary to capture and process
high quality data without the investment of expensive equipment. These beginner yet useful tools for processing
data will allow NH DOT to learn the necessary skills to create high quality and meaningful results.
While NH DOT is in Phase 1 of UAS implementation, it is recommended that NH DOT also contracts with UAS
professionals for more advanced UAS projects that may require additional processing or analyzing of the data. This
will not only provide NH DOT with the information they need, but it will also allow NH DOT to learn more about the
advanced UAS work flow required to process and analyze the data. In the following section, details on what NH
DOT should ask for in an RFP for advanced UAS products and analysis is described.
Phase 2 of UAS implementation will involve an organizational shift within NH DOT to adopt the use of geospatial
UAS data. Not only will this involve investing in specialized mapping UAS and processing software, but it will also
include the necessary investments in geospatial software, data storage, and trained GIS professionals. The biggest
challenges that NH DOT will face when implementing geospatial UAS data are the size of the data products and
training personnel to process and analyze the UAS data within NH DOT. NH DOT must be adequately prepared for
these major challenges before implementing Phase 2 into the NH DOT workflow. Although the hardware and
software are important in implementing UAS operations, trained personnel may be the most important factor
when implementing UAS programs so the data can be used to create meaningful results for NH DOT and the
public.
Another, less intensive option may be to hire UAS consultants. This would mean NH DOT does not need to train
personnel for UAS field work, but NH DOT must still be prepared to use and store geospatial datasets.
DECISION MAKING
Before contracting UAS work for geospatial products, it is important that NH DOT understands when the use of
UAS is advantageous versus manual methods or if a hybrid approach is appropriate. This decision will be based on
the specific goals, products, intended use, and support needed for a project. For the most part, UAS will be the
most cost effective way to acquire data, but if NH DOT doesn’t know what to do with the data then this will result
in additional costs and time. NH DOT must examine the limitations and capabilities within the NH DOT IT/GIS frame
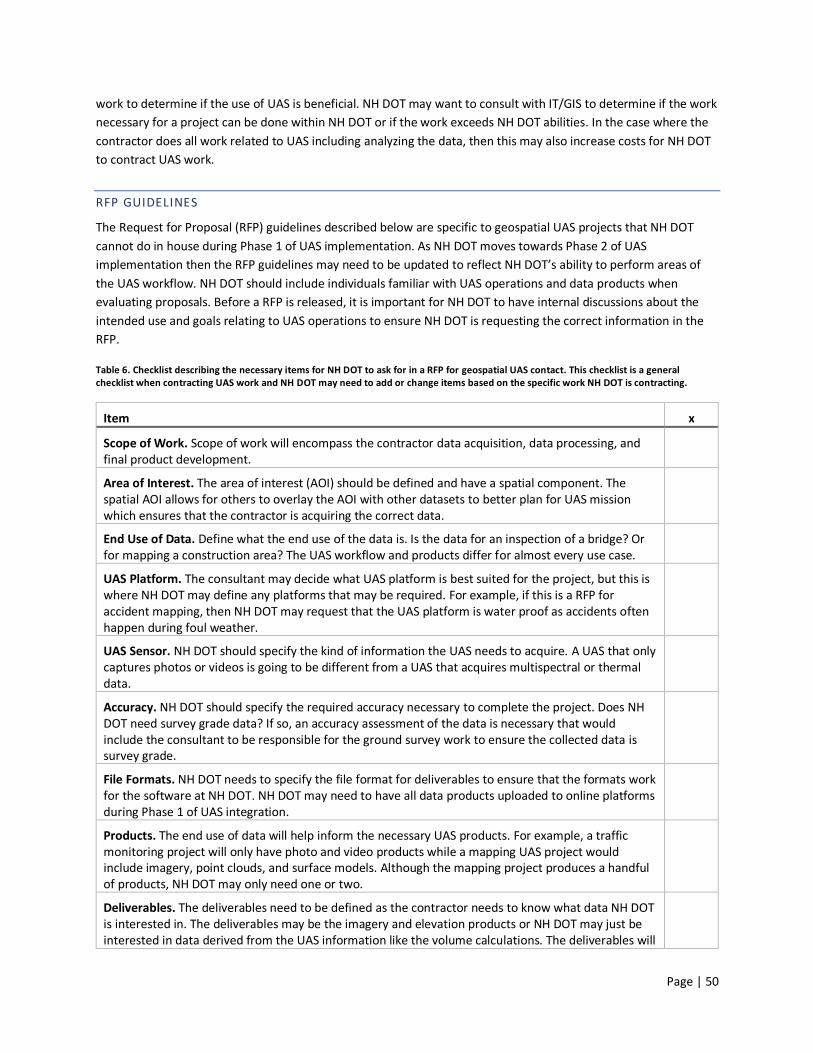
Page | 50
work to determine if the use of UAS is beneficial. NH DOT may want to consult with IT/GIS to determine if the work
necessary for a project can be done within NH DOT or if the work exceeds NH DOT abilities. In the case where the
contractor does all work related to UAS including analyzing the data, then this may also increase costs for NH DOT
to contract UAS work.
RFP GUIDELINES
The Request for Proposal (RFP) guidelines described below are specific to geospatial UAS projects that NH DOT
cannot do in house during Phase 1 of UAS implementation. As NH DOT moves towards Phase 2 of UAS
implementation then the RFP guidelines may need to be updated to reflect NH DOT’s ability to perform areas of
the UAS workflow. NH DOT should include individuals familiar with UAS operations and data products when
evaluating proposals. Before a RFP is released, it is important for NH DOT to have internal discussions about the
intended use and goals relating to UAS operations to ensure NH DOT is requesting the correct information in the
RFP.
Table 6. Checklist describing the necessary items for NH DOT to ask for in a RFP for geospatial UAS contact. This checklist is a general checklist when contracting UAS work and NH DOT may need to add or change items based on the specific work NH DOT is contracting.
Item x
Scope of Work. Scope of work will encompass the contractor data acquisition, data processing, and final product development.
Area of Interest. The area of interest (AOI) should be defined and have a spatial component. The spatial AOI allows for others to overlay the AOI with other datasets to better plan for UAS mission which ensures that the contractor is acquiring the correct data.
End Use of Data. Define what the end use of the data is. Is the data for an inspection of a bridge? Or for mapping a construction area? The UAS workflow and products differ for almost every use case.
UAS Platform. The consultant may decide what UAS platform is best suited for the project, but this is where NH DOT may define any platforms that may be required. For example, if this is a RFP for accident mapping, then NH DOT may request that the UAS platform is water proof as accidents often happen during foul weather.
UAS Sensor. NH DOT should specify the kind of information the UAS needs to acquire. A UAS that only captures photos or videos is going to be different from a UAS that acquires multispectral or thermal data.
Accuracy. NH DOT should specify the required accuracy necessary to complete the project. Does NH DOT need survey grade data? If so, an accuracy assessment of the data is necessary that would include the consultant to be responsible for the ground survey work to ensure the collected data is survey grade.
File Formats. NH DOT needs to specify the file format for deliverables to ensure that the formats work for the software at NH DOT. NH DOT may need to have all data products uploaded to online platforms during Phase 1 of UAS integration.
Products. The end use of data will help inform the necessary UAS products. For example, a traffic monitoring project will only have photo and video products while a mapping UAS project would include imagery, point clouds, and surface models. Although the mapping project produces a handful of products, NH DOT may only need one or two.
Deliverables. The deliverables need to be defined as the contractor needs to know what data NH DOT is interested in. The deliverables may be the imagery and elevation products or NH DOT may just be interested in data derived from the UAS information like the volume calculations. The deliverables will

Page | 51
depend on the end use of data and NH DOT IT/GIS capabilities. Deliverables may also include uploading the data to an online web map. NH DOT may also want to request all the raw data.
Task Schedule. Schedule is developed for each individual project.
Support. Does NH DOT expect any support with the data after data acquisition and processing?
References. NH DOT should request applicants provide references of projects that have used UAS for geospatial mapping products and analysis. This will provide information on consultants experience using UAS for mapping.

Page | 52
REFERENCE CITED
Gheisari, M., Karan, E. P., Christmann, H. C., Irizarry, J., & Johnson, E. N. (2015). Investigating Unmanned Aerial
System (UAS) Application Requirements within a Department of Transportation. In Transportation Research Board
94th Annual Meeting (No. 15-1430).
Saranya, C, et al. “Recent Trends of Drones in the Field of Defense.” International Journal of Electrical
Transformation and Restructuring, vol. 1, no. 1, Mar. 2016, pp. 47–55.,
www.fieldgroup.in/IJETR/MARCH2016/IJETR008.pdf.
Barmpounakis, Emmanouil, et al. “Unmanned Aerial Aircraft Systems for Transportation Engineering: Current
Practice and Future Challenges.” International Journal of Transportation Science and Technology, Elsevier, 10 Feb.
2017, www.sciencedirect.com/science/article/pii/S2046043016300533.
Joshi, Divya. “Exploring the Latest Drone Technology for Commercial, Industrial and Military Drone Uses.” Business
Insider, Business Insider, 13 July 2017, www.businessinsider.com/drone-technology-uses-2017-7.
Pix4D. “4 Reasons Drones Will Revolutionize Accident Scene Response.” Medium, The Science of Drone Mapping,
26 May 2016, medium.com/the-science-of-drone-mapping/4-reasons-drones-will-revolutionize-accident-scene-
response-a1db234eeccf.
McFall, Hugh. “How Kimley-Horn Surveyed an Airport 5X Faster With Drones.” 3dr.Com, 3DR, 9 Oct. 2017,
3dr.com/blog/kimley-horn-surveyed-airport-5x-faster-drones/#.
Airsite. “Paris Charles De Gaulle Airport – Runway Pavement Inspections Using Airsight Drone.” Runway Pavement
Inspections Using Airsight Drone, 2016, www.airsight.de/projects/item/runway-pavement-inspections-using-
airsight-drone/.
Higgins, Adam. “Beginner's Guide to Using Drones for Construction Management.” Connect & Construct, 5 May
2017, connect.bim360.autodesk.com/drones-for-construction-management.
Tennessee Valley Authority. “Drones Help Inspect Dams.” Tennessee Valley Authority,
www.tva.com/Newsroom/Drones-Help-Inspect-Dams. Last accessed: January, 2018.
Wells, Jennifer, and Barritt Lovelace. Unmanned Aircraft System Bridge Inspection Demonstration Project Phase II.
Minnesota Department of Transportation, 2017, Unmanned Aircraft System Bridge Inspection Demonstration
Project Phase II, dot.state.mn.us/research/reports/2017/201718.pdf.
Asphalt. “33 State DOTs Exploring Drone Use.” Asphalt Magazine, asphaltmagazine.com/drone-use/.
Wojtowicz, Kathleen, et al. 2017, UNMANNED AIRCRAFT SYSTEMS IN PENNSYLVANIA,
jsg.legis.state.pa.us/resources/documents/ftp/publications/2017-01-
27%20WEBSITE%20PDF%20UAS%20(DRONES)%201.27.17%20at%20250%20WB.pdf.
Wood, Colin, and Ryan Johnston. “Washington's Department of Natural Resources Is Showing What Drones Can Do
for Government.” StateScoop, 1 Dec. 2017, statescoop.com/washingtons-department-of-natural-resources-is-
showing-what-drones-can-do-for-government.
Utah Department of Transportation. “Unmanned Aircraft Systems (UAS / Drones).” Utah Department of
Transportation, www.udot.utah.gov/main/f?p=100%3Apg%3A0%3A%3A%3A1%3AT%2CV%3A4923.

Page | 53
DEFINITIONS
Term Definition
UAS Unmanned Aircraft System
UAS Platform Object that is physically flying
Geospatial Data Data associated with a location.
Photogrammetry Use of photography in surveying and mapping to measure distance.
Orthorectified Imagery
Aerial imagery that has been geometrically corrected.
Ortho Mosaic Imagery
Also known as Orthorectified Imagery.
3 Dimensional Point Cloud
A set of data points that have x, y, and z coordinates.
Digital Surface Model
3D representation of the terrains surface that includes objects like trees and buildings.
Digital Elevation Model
3D representation of the terrains surface without any objects like trees and buildings.
Part 107 Remote Pilot License
To fly any UAS for commercial use the pilot needs to have their Part 107 Remote Pilot License that can be obtained through a knowledge test and background check.
Pix4D Pix4D is a photogrammetry software that uses images to create orthomosaics, point clouds, and models.
ArcGIS ArcGIS is a software for the visualization and analysis of geospatial data.
ENVI ENVI is an image analysis software.
ERDAS Imagine ERDAS Imagine is a software specifically for raster data sets.
MapInfo MapInfo is a software for the visualization and analysis of geospatial data.
Quick Terrain Modeler
Quick Terrain Modeler is a 3D point cloud and terrain visualization software package.
ArcGIS Online ArcGIS Online is an online platform for visualization and some basic analysis of geospatial data.
SketchFab SketchFab is an online platform to publish and share 3D models.
Hangar 360 Hangar360 is a free app for DJI drones to easily create and share 360 degree photos.
ESRI Story Map An online platform that combines maps, narrative text, images, and multimedia content
Recommended