B A R C N E W S L E T T E R
II I ISSUE NO. 329 I NOV. - DEC. 2012

B A R C N E W S L E T T E R
ISSUE NO. 329 I NOV. - DEC. 2012 I I
CONTENTS
Editorial Note ii
Brief Communications
• Liquid Handling Robot iii
• Integrated Environmental Radiation Monitor and Automatic Weather Station (ERM-AWS) iv
Research Articles
• Role of Cellular Redox Homeostatis in Modulation of Immune Responses 1
R. Checker et al.
• Studies on Self-diffusion of Radiotracer Tagged Counterions and Water in 7
Ion-exchange Membranes
A.K. Pandey and A.Goswami
• Microwave Drilling of Materials 15
Shantanu Das and A.K. Sharma
Technology Development Articles
• Development of Inductively Coupled Plasma Mass-Spectrometer 22
K. Rajendra Babu et al.
• Indigenous Development of High-resolution Atomic Beam Fluorescence Spectroscopy 28
Facility for Precision Measurements of Isotope Shifts and Hyperfine Structure
G.V.S.G. Acharyulu et al.
Feature Articles
• Data Acquisition and Control Electronics of Neutron Scattering Instruments under 34
NFNBR at BARC: An Overview
R. M. Chandak et al.
• BARC Medical Cyclotron Facility: Performance and Achievements in the First 41
Decade after Commissioning
M.G.R. Rajan et al.
News & Events
• Electrochemical Techniques for Nanoscale Surface Engineering (ECTNSE-2012) 48
• BRNS Theme Meeting: a Decade of Operation of the BARC Medical Cyclotron 49
• Report on Training in Personnel Monitoring Procedures (TPMP-2012) 50
• Report on BRNS-Young Scientist Research Awardees’ Meet (YSRAM) 51
Annual Index: 2012 52
BARC Scientists Honoured

B A R C N E W S L E T T E R
II I ISSUE NO. 329 I NOV. - DEC. 2012
From the Editor’s DeskFrom the Editor’s DeskFrom the Editor’s DeskFrom the Editor’s DeskFrom the Editor’s Desk
Dr. K. BhanumurthyOn behalf of the Editorial Committee
Welcome to the last issue of 2012. This year was quite
eventful for the BARC Newsletter. For the first time, we
introduced a new feature: “Brief Communications’.
The response from our BARC fraternity was positive and
encouraging. We also printed the BARC logo on the front
cover of the July/August 2012 issue and later on all the
subsequent issues.
As we take stock of the work of the Editorial Committee
for the BARC Newsletter for the year 2012, we find that
we have made good progress. We published a total
number of 38 articles in many diverse areas of Nuclear
Science and Technology and 26 Brief Communications.
A list of all the published titles has been given at the end
of this issue.
This issue carries seven articles. One on Materials drilling
is an interesting peek into low-cost microwave drilling
technique, used for various materials such as wood, glass,
aluminium, copper, mild-steel (MS), animal bones
specimens. The first Medical Cyclotron Facility (MCF) in
the country is located at the Radiation Medicine Centre,
Parel. This facility has recently completed ten years of
successful operation. A glimpse into its operations has
been covered in another article.
We hope to continue the good work and we solicit the
continued cooperation and involvement of all BARC
Scientists and Engineers. We also thank all our reviewers
who have spared their valuable time in improving the
quality of the published articles.
In the next year, we plan to create a web link on the SIRD
Home Page for uploading articles, Brief Communications
and also News and Events for all the regular issues of the
BARC Newsletter. This will save a lot of time and effort.
Wishing you all a very productive and happy new year!
Editorial Committee
Chairman
Dr. Tulsi Mukherjee,
Director, Chemistry Group
Vice Chairman
Dr. N. Ramamoorthy
Senior Advisor to Director, BARC
Edited by
Dr. K. Bhanumurthy
Head, SIRD
Associate Editors for this issue
Mr. G. Venugopala Rao
Dr. Anand Ballal
Members
Dr. Tulsi Mukherjee
Dr. N. Ramamoorthy
Mr. C.S.R. Prasad, ChTD
Dr. D.N. Badodkar, DRHR
Dr. A.P. Tiwari, RCnD
Dr. Madangopal Krishnan, MSD
Dr. A.K. Tyagi, CD
Dr. P.V. Varde, RRSD
Dr. S.M. Yusuf, SSPD
Mr. Avaneesh Sharma, RED
Dr. C. Srinivas, PSDD
Dr. G. Rami Reddy, RSD
Dr. S.K. Mukherjee, FCD
Mr. G. Venugopala Rao, APPD
Dr. A. Vinod Kumar, EAD
Dr. Anand Ballal, MBD
Dr. K. Bhanumurthy, SIRD
Dr. S.C. Deokattey, SIRD

B A R C N E W S L E T T E R BRIEF COMMUNICATION
ISSUE NO. 329 I NOV. - DEC. 2012 I III
Liquid Handling Robot
(Design, Manufacturing and Automation Group)
The Liquid Handling Robot is an indigenously
developed, state of the art robotic system for
performing liquid handling reactions on a large scale.
The robotic system serves to automate the liquid
handling job in different fields of research, like
medical, biology, pharmacology, chemistry, etc. A
liquid dispensing head carries out the job of
collecting and dispensing the liquids in the desired
volumes. The dispensing head along with a robotic
positioning system driven by customized software
interface helps in providing high throughput. They
provide a modern approach to handle increasing
numbers of samples with limited personnel resources
and to minimize the possibility of errors during
manual sample handling and preparation. They are
also very helpful for handling potentially harmful
solutions.
DRHR has developed the Liquid Handling Robot for
extracting DNA from different types of cells by
magnetic bead separation method. Magnetic beads
are micron sized magnetic particles, to which only
a particular type of molecules (in this case DNA
molecules) gets attached. A specially designed
magnet module is incorporated on the robot’s
platform to collect and re-suspend the magnetic
beads within the solution, which is required at
different stages of DNA extraction protocols such
as lysing, elution etc. The magnetic bead separation
method makes automated high yield DNA extraction
possible without the need for any manual
intervention.
Liquid handling robotic system consists of a
motorized air-displaced 12 channel pipetting head,
a magnet module, a precise two-axes robotic
positioning system and a tray containing standard
solution tubes array, fresh tip array & disposal station
for used tips. The system is capable of handling
liquids in the range of 30 to 300μl with repeatability
less than 5%. A customized software interface has
been developed for the user to define the reaction
sequences using simple predefined steps like
Aspiration, Dispensing, Tip Loading, Tip disposal,
Mixing, Magnet, incubate, etc. The user also defines
the solution tray configuration. The software keeps
a check on liquid volume transactions and alerts
the user for any volume disparity before executing
it over the robot. It allows operator independent
execution of the defined reaction. It also implements
algorithms to minimize liquid splashing/sputtering
while transportation, thus minimizing the chances
of sample cross-contamination.
Fig. 1 shows the liquid handling robot system and
Fig. 2 shows Graphical User Interface & Control
Software.
Fig. 1: Liquid Handling Robot System Fig. 2: Graphical User Interface & Control Software

B A R C N E W S L E T T E RBRIEF COMMUNICATION
IV I ISSUE NO. 329 I NOV. - DEC. 2012
Integrated Environmental Radiation Monitor and
Automatic Weather Station (ERM-AWS)
(Health Safety & Environment Group)
Online monitoring of atmospheric radiation and
meteorological parameters are an integral input for
handling any radiation emergency. HS&E group has
been developing radiation detectors, with
continuous improvements based on the
advancement in technology and based on the
requirements. BARC and ISRO under a collaborative
program developed an integrated Environmental
Radiation Monitor (ERM, developed under IERMON
program) with Automatic Weather Station (AWS,
developed by ISRO), as a single stand-alone system
with solar powered battery backup and online data
communication using ISRO satellite.
The indigenous cost effective system developed gives
online hourly data on Wind Speed, Wind Direction,
Air Temperature, Humidity, Rainfall, Earth’s Net
Radiation, Atmospheric Pressure and Environmental
Gamma Radiation. In case of gamma radiation level
exceeding a pre-set threshold level (accidental
conditions), the system transmits data at a frequency
of 5 minutes. The system has a central pole of 7 m
height with sensors at various heights. The pole is
supported by guy wires. A dedicated stand-alone
satellite Earth Station has also been established at
CTCRS, Anushaktinagar, Mumbai, to receive the data
transmitted from ERM-AWS system.
The integrated online data transmitting ERM-
AWS system is a useful tool for handling local site
emergency and will provide valuable inputs
for handling offsite nuclear emergency using decision
support systems like IRODOS (Indian Realtime Online
Decision Support System) at Nuclear Power Plants
and at other locations.
Fig. showing installed Integrated ERM-AWS system (A = Wind Vane and Cup
Anemometer; B = Transmitting Antenna; C = Solar Panel; D = Temperature,
Humidity and Earth’s Net Radiation Sensors; E = Data Logger, Gamma Radiation
Monitor and Battery; F = Rain Gauge)

B A R C N E W S L E T T E R RESEARCH ARTICLE
ISSUE NO. 329 I NOV. - DEC. 2012 I 1
Role of Cellular Redox Homeostasis in
Modulation of Immune Responses
Rahul Checker, Deepak Sharma, Santosh K. Sandur and K. B. Sainis
Radiation Biology and Health Sciences Division, Bio-Medical Group
Cellular Redox Homeostasis
Molecular oxygen (O2) is essential for the survival of
all aerobic organisms. Reactive oxygen species (ROS),
such as superoxide anion (O2
.”), hydrogen peroxide
(H2O2), and hydroxyl radical (HO•), consist of radical
and non-radical oxygen species formed by the partial
reduction of oxygen. The radicals derived from
oxygen represent the most abundant class of radical
species generated in living system. There are
exogenous and endogenous sources of cellular ROS.
Exogenous sources include irradiation (UV, X- and
γ-rays) and chemicals, such as redox-active metals
(such as Fe and Cu) that enhance the Fenton/Haber–
Weiss reaction (Trachootham et al. 2008). ROS are
also generated through multiple sources inside the
cells, such as the electron transport chain in
mitochondria and through enzymes producing
superoxide anion such as phagocytic and non-
phagocytic NADPH oxidase, lipoxygenases and
cycloxygenases. Two other oxidant species that are
physiologically relevant are HOCl produced by the
myeloperoxidase from neutrophils, and singlet
oxygen (1O2) generated upon photosensitization and
UVA irradiation (Roos et al. 2003). ROS can inflict
damage to nucleic acids, proteins, and lipids and
have been implicated in carcinogenesis,
neurodegeneration, atherosclerosis, diabetes and
aging (Ray et al. 2012). When ROS overwhelm the
cellular antioxidant defense system, the cellular redox
status is perturbed resulting in oxidative stress.
There are many redox couples in a cell that work
together to maintain the redox environment; the
GSSG/2GSH couple is the most abundant redox
couple in a cell. The ratio of reduced to oxidized
forms of glutathione reduced (GSH) / oxidized
glutathione (GSSG), cysteine (reduced)/cystine
(oxidized), thioredoxin reduced/ oxidized determines
the cellular redox status. Under normal physiological
conditions, cells maintain a reducing environment
with a net redox potential ~ -220mV. A highly
reduced environment with redox potential of about
-240mV favors cellular growth and proliferation.
However, under extreme oxidative stress conditions,
this potential can increase upto -170mV leading to
senescence or cell death. Further, cells have also
developed a series of enzymatic and nonenzymatic
Abstract
Cellular redox status is described as the ratio of the inter-convertible oxidized and reduced form of specific redox
couples of bio-molecules which exist in a dynamic equilibrium. Glutathione, cysteine and thioredoxin are three
key regulators of cellular redox homeostasis. Any change in this equilibrium can alter cellular functions via
modulation of signaling molecules like phosphatases or kinases and transcription factors. Further, immune
responses are highly sensitive to changes in redox status inside as well as outside the cells. We have used
phytochemicals to alter the redox homeostasis for desired modulation of immune responses. Our findings
demonstrated that an antioxidant chlorophyllin augmented immune responses. On the contrary, a pro-oxidant
plumbagin suppressed immune responses and exhibited potent anti-inflammatory activity in vitro and in vivo.
The new targets identified in our studies may be useful for development of immuno-stimulatory or anti-
inflammatory pharmaceuticals.

B A R C N E W S L E T T E RRESEARCH ARTICLE
2 I ISSUE NO. 329 I NOV. - DEC. 2012
antioxidants. Enzymatic antioxidants comprise
superoxide dismutase (SOD), which catalyze the
dismutation of O2
.- to H2O
2, catalase that degrades
H2O
2 to H
2O and glutathione peroxidase (GPX) that
converts peroxides to alcohols using reduced
glutathione (GSH). Glutathione is the major thiol-
disulfide redox buffer of the cell and its concentration
in the cytosol ranges between 1–10 mM. It can
directly scavenge •OH and singlet oxygen by reaction
with its thiol group. The thioredoxin system,
composed of thioredoxin (TRX) and thioredoxin
reductase, is another important antioxidant that act
by reducing oxidized proteins (Trachootham et al.
2008).
Redox imbalance and immune system
The immune system maintains the integrity of the
self and protects the host from infectious agents
like bacteria, viruses, fungi, parasites and harmful
insults. The immune system comprises of a diversity
of serum proteins like complements, antibodies, and
cytokines and effector cells like macrophages,
polymorphonuclear cells and lymphocytes. Any
change in the intracellular or extracellular redox state
can perturb the normal course of immune response.
In a normal course of immune response, the
phagocytes engulf pathogenic microbes and rapidly
generate a variety of ROS species by a process called
oxidative burst. These ROS species inactivate the
engulfed bacteria or virus and also help in activation
of lytic enzymes ensuring rapid killing of the
pathogens. Antigen presenting cells like dendritic
cells can influence the extracellular redox status by
secreting out their GSH thus maintaining a reduced
environment which is conducive for activation of
antigen specific lymphocytes. An imbalance in
intracellular generation of ROS species in phagocytes
(neutrophils) increases the susceptibility of the host
to a variety of otherwise non-pathogenic commensal
bacteria and fungi leading to severe disorders like
chronic granulomatous disease.
Excess ROS can alter protein structure and function
by modifying critical amino acid residues, inducing
protein dimerization, and interacting with Fe-S
moieties or other metal complexes. The sulfhydryl
group (-SH) of a single cysteine residue may be
oxidized to form sulfenic (-SOH), sulnic (-SO2H),
sulfonic (-SO3H), or S-glutathionylated (-SSG)
derivatives. Such alterations may decrease the
activity of an enzyme if the critical cysteine is located
within its catalytic domain or inhibit the DNA
binding ability of a transcription factor if it is located
within its DNA-binding motif. Further, depending
on the level of ROS, different redox-sensitive
transcription factors are activated and coordinate
distinct biological responses. A low oxidative stress
induces Nrf2, a transcription factor implicated in
the transactivation of gene coding for antioxidant
enzymes. An intermediate amount of ROS triggers
an inammatory response through the activation of
NF-κB and AP-1, and a high level of oxidative stress
induces disruption of mitochondrial membrane
potential resulting in cell death.
These signaling pathways induced during
modulation of cellular redox status have been
intensely studied in immune responses primarily
because lymphocytes are often subjected to changes
in ROS levels during inammatory response, which
can, in turn, inuence a number of signaling pathways.
For example, at a site of inammation, H2O
2 is
produced by activated macrophages and neutrophils
at an estimated rate of 2–6 x 10⁻⁴ μM/h per cell and
T cells may be exposed to 10–100 μM H2O
2 in a
physiological environment (Lander 1997). Secondly,
it is now clear that the activation of T cells through
their antigen receptors increases the level of
intracellular ROS that, instead of being toxic, can
actually play a positive role in controlling signaling
pathways that lead to T cell proliferation.
The last two decades have seen a surge in the field
of research associated with the immunomodulatory
activities of dietary antioxidants and their role in
preventing many human diseases. Several
contrasting reports about the immnuo-stimulatory
as well as immunosuppressive activities of
phytochemicals have appeared recently. Based on

B A R C N E W S L E T T E R RESEARCH ARTICLE
ISSUE NO. 329 I NOV. - DEC. 2012 I 3
these observations, we have extensively studied the
modulation of immune responses in response to
redox alterations by phytochemicals. Plant derived
molecules which act as either anti-oxidants or pro-
oxidants in cellular systems were employed to study
their ability to modulate immune responses both in
vitro and in vivo and their mechanism of action has
been elucidated.
A) Anti-oxidants as immunomodulators
An antioxidant is a molecule capable of slowing
down or preventing the oxidation of other
molecules. Even though several studies have
reported the effects of redox modulation on immune
responses the relationship between oxidative stress
and the pathobiology of these diseases is not clear,
largely due to a lack of understanding of the
mechanisms by which ROS function in both normal
physiological and diseased states. Chlorophyllin
(CHL) is a water-soluble mixture of sodium-copper
salts of green plant pigment chlorophyll, the
ubiquitous photosynthetic green pigment present
in food materials of plant origin as well as in
nutritional supplements such as extracts from
Spirulina and Chlorella vulgaris. Chlorophyll has been
credited with several beneficial properties and CHL
has proved to be better than the parent compound
as evident from studies employing different model
systems. It has chemopreventive, antimuatgenic and
anticarcinogenic properties. The anti-oxidant and
immunomodulatory properties of chlorophyllin
elucidated in our laboratory are summarized in
Table 1.
B) Modulation of immune responses by pro-
oxidants
Cellular redox status plays an important role in the
biological effector functions of lymphocytes and
leukocytes. Exposure of T cells to oxidizing agents
like H2O2, xanthine/xanthine oxidase has been shown
to suppress T cell activation, proliferation, and
cytokine production via suppression of NF-κB
(Pahlavani and Harris 1998). Thus, we hypothesized
that altering the redox balance of cells leads to
modication of critical signaling molecules required
for activation of lymphocytes. Plumbagin (5-hydroxy-
2-methyl-1,4-naphthoquinone) is found in the plants
of Plumbaginaceae, Droseraceae, Ancestrocladaceae,
and Dioncophyllaceae families. The root of Plumbago
zeylanica (also called Chitrak), a major source of
plumbagin, has been used in traditional Indian
medicine since 750 BC as an antiatherogenic,
cardiotonic, hepatoprotective, and neuroprotective
agent. Plumbagin has been shown to exert
several therapeutic biological effects including
anticancer, antiproliferative, chemopreventive,
chemotherapeutic, and radiosensitizing properties
in experimental animals as well as in tumor cells in
vitro (Padhye et al. 2010). Lately, plumbagin was
shown to inhibit constitutive as well as inducible
NF-kB activation and NF-kB regulated genes in tumor
cells. It also inhibited DNA binding ability of NF-
8κB (Sandur et al. 2006). Based on these
observations, we speculated that plumbagin may
show immunomodulatory effects and might have
significant clinical application in prevention of
inflammatory disorders. The immunomodulatory
properties of plumbagin were elucidated and are
summarized below in Table 2. Its mechanism of
action and in vivo efficacy was also evaluated and
included in Table 2.
CONCLUSION: It is well established that any
perturbation in the immune regulatory mechanisms
may result in several undesired outcomes including
self-tissue destruction, autoimmunity, allergy,
chronic inflammation and cancer. One major thrust
area of current clinical research is to devise novel
strategies for immunosuppression which may be
achieved by depleting lymphocytes, diverting
lymphocyte traffic or blocking lymphocyte response
pathways. Immunosuppressive drugs have three
effects: the therapeutic effect (suppressing rejection),
undesired consequences of immunodeficiency
(infection or cancer) and toxicity to other tissues.
The immunosuppressive regimens currently
employed involves the use of multiple drugs
such as inhibitos of transcription (Cyclosporin A,

B A R C N E W S L E T T E RRESEARCH ARTICLE
4 I ISSUE NO. 329 I NOV. - DEC. 2012
tacrolimus), inhibitors of nucleotide synthesis
(azathioprine, mycophenolate mofetil, mizoribine,
leflunomide) and inhibitors of growth factor signal
transduction (sirolimus, leflunomide).
Thus, development of novel strategies of immune
intervention would be key to therapeutic
management of inflammation. Our studies provide
evidence use of redox modifiers (anti-oxidants and
pro-oxidants) for modulation of immune responses
in vivo. These studies underscore the crucial role of
ROS and redox balance in lymphocyte activation
and the mechanism(s) involved therein. Further, we
also recognize the importance of plant derived
phytochemicals as modulators of cellular redox
balance which can have significant application
towards management of immune responses for
therapeutic benefits.
References
1. Boloor, K. K., J. P. Kamat, and T. P.
Devasagayam. 2000. Chlorophyllin as a
protector of mitochondrial membranes against
gamma-radiation and photosensitization.
Toxicology 155: 63-71.
2. Checker, R., D. Sharma, S. K. Sandur, S.
Khanam, and T. B. Poduval. 2009. Anti-
inflammatory effects of plumbagin are mediated
by inhibition of NF-kappaB activation in
lymphocytes. Int Immunopharmacol 9: 949-58.
3. Checker, R., D. Sharma, S. K. Sandur, G.
Subrahmanyam, S. Krishnan, T. B. Poduval, and
K. B. Sainis. 2010. Plumbagin inhibits
proliferative and inflammatory responses of T
cells independent of ROS generation but by
modulating intracellular thiols. J Cell Biochem
110: 1082-93.
4. Jia, Y., J. Jing, Y. Bai, Z. Li, L. Liu, J. Luo, M.
Liu, and H. Chen. 2011. Amelioration of
experimental autoimmune encephalomyelitis by
plumbagin through down-regulation of JAK-
STAT and NF-kappaB signaling pathways. PLoS
One 6: e27006.
5. Kohli, V., D. Sharma, S. K. Sandur, S.
Suryavanshi, and K. B. Sainis. 2010. Immune
responses to novel allergens and modulation of
inflammation by vitamin K3 analogue: a ROS
dependent mechanism. Int Immunopharmacol
11: 233-43.
6. Kumar, S. S., R. C. Chaubey, T. P. Devasagayam,
K. I. Priyadarsini, and P. S. Chauhan. 1999.
Inhibition of radiation-induced DNA damage in
plasmid pBR322 by chlorophyllin and possible
mechanism(s) of action. Mutat Res 425: 71-9.
7. Kumar, S. S., B. Shankar, and K. B. Sainis. 2004.
Effect of chlorophyllin against oxidative stress
in splenic lymphocytes in vitro and in vivo.
Biochim Biophys Acta 1672: 100-11.
8. Lander, H. M. 1997. An essential role for free
radicals and derived species in signal
transduction. Faseb J 11: 118-24.
9. Padhye, S., P. Dandawate, M. Yusufi, A. Ahmad,
and F. H. Sarkar. 2010. Perspectives on medicinal
properties of plumbagin and its analogs. Med
Res Rev.
10. Pahlavani, M. A., and M. D. Harris. 1998. Effect
of in vitro generation of oxygen free radicals on
T cell function in young and old rats. Free Radic
Biol Med 25: 903-13.
11. Poosarla, A., N. R. D, R. R. Athota, and V. G.
Sunkara. 2011. Modulation of T cell proliferation
and cytokine response by Plumbagin, extracted
from Plumbago zeylanica in collagen induced
arthritis. BMC Complement Altern Med 11: 114.
12. Ray, P. D., B. W. Huang, and Y. Tsuji. 2012.
Reactive oxygen species (ROS) homeostasis and
redox regulation in cellular signaling. Cell Signal
24: 981-90.
13. Roos, D., R. van Bruggen, and C. Meischl.
2003. Oxidative killing of microbes by
neutrophils. Microbes Infect 5: 1307-15.
14. Sandur, S. K., H. Ichikawa, G. Sethi, K. S. Ahn,
and B. B. Aggarwal. 2006. Plumbagin (5-
hydroxy-2-methyl-1,4-naphthoquinone)
suppresses NF-kappaB activation and NF-
kappaB-regulated gene products through

B A R C N E W S L E T T E R RESEARCH ARTICLE
ISSUE NO. 329 I NOV. - DEC. 2012 I 5
modulation of p65 and IkappaBalpha kinase
activation, leading to potentiation of apoptosis
induced by cytokine and chemotherapeutic
agents. J Biol Chem 281: 17023-33.
15. Sharma, D., S. S. Kumar, R. Raghu, S. Khanam,
and K. B. Sainis. 2007a. Differential modulation
of mitogen driven proliferation and homeostasis
driven proliferation of T cells by rapamycin,
Ly294002 and chlorophyllin. Mol Immunol 44:
2831-40. Sharma, D., S. S. Kumar, and K. B.
Sainis. 2007b. Antiapoptotic and
immunomodulatory effects of chlorophyllin.
Mol Immunol 44: 347-59.
16. Trachootham, D., W. Lu, M. A. Ogasawara, R.
D. Nilsa, and P. Huang. 2008. Redox regulation
of cell survival. Antioxid Redox Signal 10: 1343-
74.
Table 1: Antioxidant and immunomodulatory properties of chlorophyllin

B A R C N E W S L E T T E R RESEARCH ARTICLE
ISSUE NO. 329 I NOV. - DEC. 2012 I 7
Studies on Self-diffusion of Radiotracer Tagged
Counterions and Water in
Ion-exchange Membranes
A.K. Pandey and A. Goswami
Radiochemistry Division
Introduction
Membranes are defined as discrete, thin interface
that separates two phases and moderate the
permeation of various ions/chemical species in a
selective manner. Ion-exchange membranes have
fixed-charge sites and equivalent mobile counterions
to maintain electro-neutrality. The mobile
counterions are exchangeable. The ion-exchange
membranes are semipermeable as they allow
counterions to pass through while co-ions are
restricted by Donnan exclusion process.1-3 The self-
diffusion coefficient (SDC) is a true measure of
mobility of ions in the ion-exchange membranes,
and governs the transport properties of the
membrane. Techniques such as radiotracer
permeation, ion-exchange, conductivity/impedance
measurements and pulsed field gradient nuclear
magnetic resonance spectroscopy [PFG-NMR] have
been used to determine self-diffusion coefficients
of ions and water in the ion-exchange membranes.4,5
Radiotracer and PFG-NMR methods directly yield
the well-defined self-diffusion coefficients.
In our lab, work has been carried out overseveral
years to determine SDCs of counterions and water
in different ion-exchange membranes using
radiotracers. The major objective of the studies has
been to understand the parameters that govern SDC
of diffusing spices in the membrane.
Isotopic-exchange Method
To understand diffusional transport of ions in Nafion,
Yeager et al. measured SDC of Na+ and Cs+
counterions in Nafion-117 membrane using
radiotracer permeation method.6 The disadvantage
of radiotracer permeation method is that it requires
several permeation experiments to deduce single
value of self-diffusion coefficient and requires the
use of carrier-free radiotracer. To overcome this
limitation, we have developed the non-stationary
radiotracer method.5
The non-stationary radiotracer method is essentially
based on the analysis of kinetics of isotopic-exchange
between membrane and equilibrating solution
using an analytical solution of Fick’s second law.
For a plane sheet of membrane with appropriate
initial and boundary conditions, the solution is given
as:5,7
Summary
Self-diffusion coefficients (SDC) of counterions and water in different ion-exchange membranes have been
measured to study the effects of matrix parameters on diffusion process. Radiotracers are ideal tool for studying
SDCs in the Ion-exchange membrane. We have developed a “non-stationary radiotracer method” to measure
SDC. The measured SDC provides valuable information about the physical parameters that govern the transport
process In this article, a glimpse of the work that is being carried out in Radiochemistry Division is given.
(1)

B A R C N E W S L E T T E RRESEARCH ARTICLE
8 I ISSUE NO. 329 I NOV. - DEC. 2012
where n* is the total amount of the radiotracer ions
in the membrane at equilibrium (t=∞). In the case
of desorption experiment, that is, radiotracer
diffusing out of the membrane, n* represents the
total radiotracer ions in the salt solution at
equilibrium (t=∞). Dm and L are self-diffusion
coefficient (SDC) of counterion and thickness of
membrane, respectively.
Experimental Method
The measurements of radiotracer-exchange
rates of (Mn+)mem
(*Mn+)aq
(sorption) or
(Mn+)mem
(*Mn+)aq
(desorption) (*tagged with
radiotracer) have been carried out using
2x2 cm2 pieces of the membrane samples.
The equilibrating salt solution containing membrane
sample is stirred vigorously (≈500 rpm) to avoid the
aqueous film diffusion. The amount of radiotracer
counterions sorbed/desorbed from the membrane
sample has been monitored by taking out aqueous/
membrane sample from the equilibrating solution
at regular time intervals, and counting its
radioactivity. The γ-activity in membrane/aqueous
sample has been counted in a well-type NaI(Tl) γ-ray detector coupled to multichannel analyzer. The
α/β-activity in aqueous sample has been counted
with a liquid scintillation counter employing a
Dioxane-based cocktail scintillator. The radiotracers
like 24Na, 42K, 65Zn etc. have been obtained by
irradiating known amounts of their stoichiometric
compounds for appropriate times in the APSARA
reactor at BARC, Mumbai, India. The other
radiotracers like 45Ca, 137Cs, 133Ba, 85,89Sr, 110mAg etc.
have been procured from the Board of Radiation
and Isotope Technology, Mumbai, India.
The variation of n(tk) as a function of equilibration
time tk has been analyzed by a non-linear least-
squared fit of eq. 1 with both n* and Dmi as free
parameters. Thus, single experiment yields a value
of SDC. The representative fitted profiles of
experimental isotopic-exchange rates are shown in
Fig.1.
Fig.1: Variation of fractions of the radiotracer
monovalent ions in the Nafion-117 membrane as a
function of time t. (Ref.5).
Fig.2: Self-diffusion coefficients of different ions vs.
time required for 99% attainment of equilibrium in
the Nafion-117 membrane (Ref.5).
The variation of SCD in Nafion-117 for different
radiotracer tagged counterions as a function of time
for attaining of 99% equilibrium is shown in Fig. 2.
This gives an estimate of time required for completion
of experiment for a given value of SDC. Except for

B A R C N E W S L E T T E R RESEARCH ARTICLE
ISSUE NO. 329 I NOV. - DEC. 2012 I 9
Cs+, M+ counterions requires less equilibration time
compared to M2+ counterions, showing higher
electrostatic interactions with fixed charge sites for
the bivalent ions.
Results
Correlation of Selectivity with Self-diffusion
Coefficients
The selectivity coefficients (KMH) of the ions in the
membrane are plotted against the measured SDCs
(Dmi) in Fig. 3. It is evident from Fig. 3 that KM
H
decreases systematically with increase in Dmi for
both monovalent and divalent ions. The selectivity
of the ions having the same charge follows the
sequence of decreasing radii of the hydrated ions.
In general, it appears that a membrane having higher
selectivity for a counterion would have lower SDC
for the same counterion leading to slower transport
rate.
factor is a function of polymer volume fraction.
According to free volume theory of Yasuda et al.8
(2)
where Dmi and Do
i are SDC of counterions in
membrane and water, respectively, Zi is the charge
on counterion, b is a slope parameter and Vp/(1-
Vp) is the polymer volume fraction. ‘g(φ)’ is a
preexpoential factor introduced to take into account
the electrostatic interaction of an ion with the fixed
charge sites of the ion-exchange membrane. The
value of g (φ )/Zi is unity in eq. 2 for neutral species
like water. The ratio of SDC of water molecules
in membrane (Dm ) to SDC of water molecules in
water (Do ) thus provides a measure of tortuosity
factor in the membrane. Therefore, Dm in different
ionic forms of Nafion-117 have been measured using
tritiated water (HTO) to study the tortuosity factor
for different ionic forms of the membrane.9 For
measuring Dm , the desorption of tritiated water
from membrane sample in required ionic form has
been monitored by taking out samples from
equilibrating water for liquid scintillation counting,
and analyzing ((HTO)mem
(H2O)
aq) exchange in
terms of eq. 1.9 The polymer volume fraction (Vp)
of the membrane samples in different ionic forms
was calculated from the volume of the water in the
membrane and the volume of the wet membrane
sample as described elsewhere.9
The plots of ln (Dmi / Do
i) and ln (Dm
) with polymer
volume fraction Vp/(1-V
p) are shown in Fig. 4a
and Fig. 4b, respectively. Dmi and Dm
were
experimentally measured using isotopic-exchange
method as described above, and values of Doi and
Do were taken from literature as given in our
publication.5,9 Dm is not normalized with Do
as it
is a fixed quantity (2.5x10⁻⁵ cm2/s). It is seen from
Fig. 4 that ln (Dmi / Do
i) and ln (Dm
) vary linearly
as a function of Vp/(1-V
p), which is in accordance
with free volume theory (eq. 2).The variation of ln
(Dm ) with V
p/(1-V
p) signifies systematic change in
tortuosity with polymer volume fraction. However,
the variation ln (Dmi / Do
i) with V
p/(1-V
p) indicates
Fig. 3: Plot of selectivity coefficient (KMH) vs. SDC in
the Nafion-117 membrane (Ref.5).
Effects of Free-volume on Self-diffusion
Diffusion of ions is obstructed by polymer chains
and occurs through the region containing water in
a membrane. Thus, the ions have to take tortuous
path through the membrane, and the tortuosity
H2O
H2O
H2O
H2O
H2O
H2O
H2O
H2O
H2O
H2O
H2O

B A R C N E W S L E T T E RRESEARCH ARTICLE
10 I ISSUE NO. 329 I NOV. - DEC. 2012
Effects of Electrostatic Interaction between
Counterions and Fixed-charge Sites
It is possible from eq. 2 to evaluate electrostatic
interaction parameter g(φ) using parameter “b”
obtained from slope in variation of ln (Dm / Do
)
with Vp/(1-V
p).9 This is based on the fact the
morphology is same in both the cases. The variation
of g(φ) for different counterions as a function
Vp/(1-V
p) is shown in Fig. 5.
Fig.4: (a) Plots of ln ( Dmi / Do
i ) of the counterions
(Ag+,Na+, K+, Cs+, Zn2+, Ca2+, Sr2+, Ba2+) (Ref. 5),
and (b) ln ( Dm ) (Ref. 9) in different ionic form of
the membrane against the polymer volume fraction
function [Vp/(1- V
p)].
Fig.5: Variation of electrostatic interaction parameter
g(φ) obtained from eq. 2 for self-diffusion of ions in
membrane as a function of Vp/(1-V
p) (Ref.9).
It is evident from this plot that g(φ) is also a
exponential function of Vp/(1-V
p). It is expected that
the g(φ) would depend on spacing of fixed charge
in the diffusion channels in membrane and effective
interaction distance between fixed charge sites and
mobile counterions. The effective interaction distance
between mobile counterions and the fixed charge
site are dependent on the hydration radius of
counterions in the membrane. Since Vp in Nafion-
117 membrane depends on the hydration
characteristics of counterions, both these factors
correlate Vp/(1-V
p) to g(φ). It is important to note
that lower value of g(φ) indicates higher strength of
electrostatic interaction. Thus, Cs+ ions having lower
variation of both electrostatic interactions and
tortuosity factor with polymer volume fraction.
Separate lines clearly suggest that morphologies
of Nafion samples in monovalent and multivalent
counterionic forms are different. Variation
of Dm in different cationic forms of the membrane
is much less (3.87x10⁻⁶ cm2/s in H+-form to
1.50x10⁻⁶ cm2/s in Cs+-form) compared to Dmi,
indicating water channels in Nafion-117 are very
well connected even with lowest water content in
Cs+-form.
H2O
H2O
H2O H
2O

B A R C N E W S L E T T E R RESEARCH ARTICLE
ISSUE NO. 329 I NOV. - DEC. 2012 I 11
SDC has lower value of g(φ) indicating its strong
electrostatic interactions with fixed ion-exchange
sites in the membrane.
Counterions-exchange Studies in Nafion-117
Counterions-exchange method can be used to
determine SDC when appropriate radiotracer of
counterions is not available or acidic condition is
required to prevent hydrolysis of counterions in
equilibrating solution. For brief description of this
method, consider the process of ion-exchange
between an ion “A” initially present in the plane
sheet of the membrane and an ion “B” initially
present in the solution as:
where ZA and Z
B are the charges on the ions A and
B, ‘m’ and ‘aq’ represent the membrane phase and
solution phase, respectively. Based on Nernst-Planck
(N-P) theory, the diffusion equation describing the
time and space dependence of the ion concentration
ci in the membrane can be written as:10-12
(3)
where the inter-diffusion coefficient DAB
is given by:
(4)
where DA and D
B are self-diffusion coefficients of
interchanging counterions A and B whose
concentrations in membrane phase are represented
by CA and C
B , respectively. During the course of
ion-exchange, CA, C
B and D
AB change with time and
thus eq. 3 becomes non-linear. A numerical solution
of eq. 3 has been obtained by finite difference
method, and used for calculation of fractional
attainment of exchange equilibrium (F(t)) vs. t1/2 for
fixed ZA, Z
B and (D
A/D
B). The quantity F(t) is also
experimentally measured and fitted with solution of
eq. 3 to obtain the ratio DA/D
B. If SDC of one inter-
exchanging counterion is known, the value of SDC
of other counterion can be deduced from this ratio.
The details are given in Ref. 11 & 12. The
experimental method is same as that used for non-
stationary radiotracer method except that exchanging
counterions between equilibrating solution and
membrane are different.
Forward and Reverse Counterions-exchange
A consequence of Nernst-Planck is that forward
and reverse counterions-exchange profiles are not
same. It can be seen from Fig. 6 that the counterion
exchange rate is altered by the mobility of the
ion entering into the membrane. Thus, the rate of
exchange of an ion present in the membrane, which
is having higher diffusivity, is retarded by a slow
diffusing ion entering the membrane. Similarly, the
rate of exchange of a slow diffusing ion present in
the membrane is accelerated by a faster diffusing
ion entering the membrane. For example, Na+ self-
diffusion coefficient is higher (1.03x10⁻⁶ cm2/s) than
that for Eu3+ ions (0.045x10⁻⁶ cm2/s) in Nafion-117.
Therefore, the kinetics of counterions-exchanges
follow the trend Na+(mem)
Na+(aq)
, > Na+(mem)
Eu3+(aq)
> Eu3+ (mem)
Na+(aq)
> Eu3+ (mem)
«Eu3+ (aq)
.12
The counterions-exchange rate predicted by
Nernst-Planck theory does not always match
with experiment as seen from the studies of
counterions-exchanges involving H+ ions.11 The N-P
theory has been found to be reasonably accurate
for predicting the the kinetics of the reverse ion
exchange Mn+(mem)
H+(aq)
, but fails for the forward
ion exchange H+(mem)
Mn+(aq)
. Contrary to the
prediction of the N-P theory, the kinetics of forward
exchanges of Cs+, Cu2+, and Eu3+ with H+ ions in
the Nafion-117 membrane have been found to be
independent of the metal ions.11 This shows that
the self-diffusion coefficients of the counterions
in Nafion-117 can be obtained only from the
analysis of reverse exchange kinetics based on the
N-P equation.

B A R C N E W S L E T T E RRESEARCH ARTICLE
12 I ISSUE NO. 329 I NOV. - DEC. 2012
The SDC value of Li+ ion (for which no suitable
radiotracer exists) in Nafion-117 membrane has been
obtained by analyzing its exchange kinetics with
radiotracer tagged Na+ or Cs+ counterions.12 Unlike
other counterions, drastic difference in diffusion
mobility of Li+ ions during forward and reverse
exchanges has been obtained, wich is attributed to
the weak electrostatic interactions of Li+ ions with
the fixed exchange sites in Nafion membrane.
Effects of Self-diffusion Coefficients on
Competitive Diffusion of Counterions
Multi-component diffusion studies have been carried
out to understand how the kinetic selectivity and
thermodynamic selectivity affect the membrane
transport process.13 Studies have been carried out
in Nafion-117, using two cations, namely Na+ and
Cs+, having widely different self-diffusivity and
selectivity.14 At all compositions of Na++Cs+ ions
in the equilibrating solutions, the Na+ ion
concentration has been found to pass through a
maximum in the membrane, while the Cs+ ion
concentration continuously increased till equilibrium
is reached. This has been explained as being due to
higher diffusivity but lower selectivity of Na+ ions
than Cs+ ions. An attempt has been made to
reproduce the time profile of the competitive
diffusion for both the ions using the modified form
of Maxwell–Stefan formalism. Fig. 7 shows the time
evaluation of the spatial distributions of Na+ and
Cs+ ions in Nafion-117 membrane as obtained from
the numerical solution of Maxwell–Stefan equation.
Fig. 6: Fractional attainments of counterions-
exchanges equilibriums in Nafion-117. The symbols
represent the experimental data on Na+(mem)
Eu3+(aq)
(O) and Eu3+ (mem)
Na+ (aq)
(D) exchanges. Lines 1, 2,
3 and 4 represent the calculated profiles of Na+(mem)
Na+(aq)
, Na+(mem)
Eu3+(aq)
, Eu3+ (mem)
Na+ (aq)
, and Eu3+
(mem) Eu3+
(aq) exchanges, respectively (Ref.12).
Fig. 7: The spatial distribution of competing ions in
the membrane as a function of transient uptake time
during diffusion from a solution containing Na+/Cs+
in 1:1 ratio. (a) Na+ and (b) Cs+ (Ref.14) calculated
using Maxwell–Stefan equations.
Effect of Ionic-composition of Membrane on
Self-diffusion Coefficients
In order to understand the effect of ionic
composition on SDC, the SDC of Na+, Cs+, and
Ba2+ in Nafion-117 has been determined using two
radiotracers and by varying ionic compositions of
Na++Cs+, Na++Ba2+, Cs++Ba2+ and Ag++Ba2+
ions in the membrane.15 The values of SDC have
been obtained by analyses of isotopic-exchange
profiles using eq.1. It has been observed that the

B A R C N E W S L E T T E R RESEARCH ARTICLE
ISSUE NO. 329 I NOV. - DEC. 2012 I 13
SDCs do not change in mixed binary counterionic
forms except those involving Na+ Ba2+ and
Ag+ Ba2+ exchanges. This has been attributed to
different transport pathways of cations in Nafion-
117 membrane.
Effect of Speciation in Aqueous Samples on
Self-diffusion Coefficients
Self-diffusion coefficient also provides a new
approach for speciation studies as it is highly
sensitive to chemical form of the diffusing species.
Isotopic and ion-exchange kinetics of mercury ions
in Nafion-117 membrane in the presence of Cl- and
NO3- in solution have been studied to see the effect
of anions on SDC of metal ions.16 The speciation
diagrams, calculated as a function of pH, show wide
divergence of species present in HgCl2 and Hg(NO
3)2
solution. SDCs corresponding to different chemical
form of mercury cations entering in the Nafion-117
membrane from equilibrating HgCl2 and Hg(NO
3)2
Self-diffusion in Polymer Inclusion Membrane
Tailor-made polymer inclusion membranes (PIMs)
for different applications have been developed in
our lab. In order to understand role of matrix forming
polymer, plasticizer and concentration of carrier
(extractant) in transport process, SDCs of ions and
water have been studied in PIMs prepared by physical
immobilization of the trioctylmethylammonium
chloride (Aliquat-336) in the plasticized matrix of
cellulose triacetate (CTA). The plasticizers having
different dielectric constant and viscosity are used
to vary the local environment of the membrane
matrix. AFM image of a PIM shown in Fig. 9
indicates that it is homogeneous non-porous
membrane. Thus, transport of ions through this class
of membrane is mediated by the carriers immobilized
in plasticized matrix.
Fig.8: Variation of fractions of the radiotracer of
monovalent (HgCl+) and divalent (Hg2+) mercury ions
in the Nafion-117 membrane (Ref.16).
solutions have been obtained. The isotopic-exchange
profiles are given in Fig.8.
The results indicate that mercury ions diffuse into
the membrane as monovalent cation (HgCl+) from
HgCl2 solution while as divalent ion (Hg2+) from
Hg(NO3)2 solution. This gives rise to an interesting
possibility of developing a method for speciation
studies based on diffusion mobility of the ions in
the ion-exchange membrane.
Fig. 9: AFM image of PIM (Ref.17).
SDCs of I- ions and water in these membranes have
been obtained by analyzing the experimentally
measured exchange rate profiles of tritiated water
(HTO) with H2O and 131I- with natI- between the
membrane and equilibrating solution using eq. 1.17
The value of SDC(I-) varies with nature and proportion
of the plasticizer as well as its viscosity. The variation
of D(I-) as a function of Aliquat-336 shows a Aliquat-
336 concentration threshold barrier in I- ions
diffusion that suggests minimum distance is required
for hopping of a ion between adjacent exchange
sites. The values SDC of water D(H2O) in PIM
samples has been found to be one order of
magnitude higher than the value of D(I-), indicating
that water molecules diffuse independently across
hydrophobic PIM, without being attached to
diffusing counterions.

B A R C N E W S L E T T E RRESEARCH ARTICLE
14 I ISSUE NO. 329 I NOV. - DEC. 2012
Conclusions
Radiotracers have been found to be ideal tool for
studying the self-diffusion of counterions and water
in the ion-exchange membranes. The interpretations
of self-diffusion coefficients data reveal valuable
information on different parameters influencing the
diffusional-transport process. This has helped us in
tuning properties of tailor-made polymer inclusion
membranes and pore-filled membranes for a specific
application.
Acknowledgements
Authors thank Dr. S. Sodaye, Dr. G. Suresh, Dr. Y.M.
Scindia, Dr. Chhavi Aagarwal, Rakesh Kumar and
Sanhita Chaudhury for their valuable contributions
in the work described in this article.
References
1. Strathmann, H. “Ion-exchange membrane
separation processes”, Membrane Science and
Technology Series 9, Elsevier, 2004, 1-20.
2. Sata, T. “Ion exchange membranes: Preparation,
Characterization, Modification and Application”,
The Royal Society of Chemistry, Cambridge,
2004, 215-280.
3. Helfferich, F. “Ion Exchange “, McGraw-Hill, New
York, 1962, Chapter 8.
4. Mauritz, K.A.; Moore, R. B. “State of
understanding of Nafion”, Chem. Rev. 104
(2004) 4535-4585.
5. Goswami, A.; Acharya, A.; Pandey, A.K. “Study
of self-diffusion of monovalent and divalent
cations in Nafion-117 ion-exchange membrane”.
J. Phys. Chem. B 105 (2001): 9196-9201; and
references therein.
6. Yeager, H.L.; “Transport properties of
perfluorosulfonate polymer membranes”, in
Eisenberg A. and Yeager H.L. (Eds.),
Perfluorinated Ionomer Membranes, ACS Symp.
Ser. No. 180, American Chemical Society,
Washington DC, 1982, page no. 41-63.
7. Cranck, J. The Mathematics of Diffusion, 2nd
ed.; Clarendon Press: Oxford, 1975.
8. Yasuda, H.; Lamaze, C. E.; Ikenberry, L. D.
“Permeability of solute through hydrated polymer
membranes, Part I, Diffusion of sodium chloride”.
Macromol. Chem. 118 (1968): 19-35.
9. Suresh, G.; Sodaye, S.; Scindia, Y.M.; Pandey,
A.K.; Goswami, A. “Study on physical and
electrostatic interactions of counterions in
poly(perfluorosulfonic) acid matrix:
Characterization of diffusion properties of
membrane using radiotracers”. Electrochimica
Acta 52 (2007): 5968-5974; and references
therein.
10. Plesset, M. S.; Helfferich, F.; Franklin, J. N. J.
Chem. Phys. 29 (1958):1064–1069.
11. Suresh, G.; Scindia, Y.M.; Pandey, A.K.;
Goswami, A. “Isotopic and ion-exchange kinetics
in the Nafion-117 membrane”. J. Phys. Chem.
B 108 (2004): 4104-4110.
12. Sodaye, S.; Suresh, G.; Pandey, A.K.; Goswami,
A. “Inter-diffusion of exchanging counterions in
poly(perfluorosulfonic) acid membrane”. J. Phys.
Chem. B 113 (2009): 12482–12488.
13. Krishna, R.; Paschek, D. “Separation of
hydrocarbon mixtures using zeolite membranes:
a modeling approach combining molecular
simulations with the Maxwell–Stefan theory”.
Sep. Purif. Technol. 21 (2000): 111–136.
14. Sodaye, S.; Agarwal, C.; Goswami, A. “Study
on multicomponent diffusion of ions in
poly(perfluorosulfonated) ion-exchange
membrane using radiotracers”. J. Membr. Sci.
314 (2008): 221–225.
15. Chaudhury, S.; Agarwal, C.; Pandey, A.K.;
Goswami, A. “Self-diffusion of ions in Nafion-
117 membrane having mixed ionic
composition”, J. Phys. Chem. B 116 (2012):
1605"1611.
16. Agarwal, C.; Chaudhury, S.; Mhatre, A.;
Goswami, A. “Anion Dependence of Transport
of Mercury Ion through Nafion-117 Membrane”.
J. Phys. Chem. B 114 (2010): 4471–4476.
17. Kumar, R.; Pandey, A.K.; Sharma, M.K.; Panicker,
L.V.; Sodaye, S.; Suresh, G.; Ramagiri, S.V.;
Bellare, J.R.; Goswami, A. “Diffusional transport
of ions in plasticized anion-exchange
membranes”. J. Phys. Chem. B 115 (2011):
5856–5867; and references therein.

B A R C N E W S L E T T E R RESEARCH ARTICLE
ISSUE NO. 329 I NOV. - DEC. 2012 I 15
Microwave Drilling of Materials
Shantanu Das
Reactor Control Division
and
Apurba Kumar Sharma
Department of Mechanical and Industrial Engineering,
Indian Institute of Technology, Roorkee, Uttarakhand.
Introduction
Microwaves are used to heat the materials like
concrete, glass and ceramics and drill holes in them
silently without creating dust. Microwave drilling
would provide low cost solutions for these
applications. In this article we report experimental
results of ‘microwave drilling of materials’ a newly
developed technique. This is the ‘proof of principle’
of application of ‘near-field’ microwave radiation,
for material drilling.
Brief Theory of Microwave-drilling
The interaction of microwaves with materials can
be classified into three categories. First the absorbing
materials, with properties ranging from conductors
to insulators which are having high dielectric loss
and which absorb electromagnetic energy readily
and convert it to heat. Second are the transparent
materials, having low dielectric loss, such as glass,
ceramics and air which allow microwaves to pass
through easily with little attenuation. The third one
is the opaque materials which are typically
conducting materials with free electrons, such
as metals, that reflect microwaves at room
temperature, [1]-[4], [12]. For experimental works
two different methods of microwave heating are
generally used: direct microwave heating (DMH),
and microwave hybrid heating (MHH) [1]-[4], [12]-
[15]. For drilling we use DMH.
Material drilling by microwave is by process we call,
‘locally induced thermal runaway’, which is caused
by an open ended co-axial applicator, (a monopole
antenna Fig. 1). The microwave energy absorption,
increases with increase of temperature; is the cause
of local thermal runaway and formation of hot-spot
resulting in local melting of material, evaporation,
or forming liquid, gas or plasma respectively. This
thermal runaway hot-spot formation and process
of phase change is depicted in Fig. 4 as ‘plasma’
formation during the process of drilling with
microwaves [13].
The dielectric loss factor ; the imaginary
part of complex dielectric function of the
material , is a function of
temperature T . This factor tends to rise as
temperature rises, hence greater amount of EM
energy is dissipated (locally) as temperature rises,
Abstract
This is proof of principle of application of ‘near-field microwave radiation’, for material drilling. We report result
of experiments conducted, for microwave-drilling of materials, using two types of setups, one-inside a domestic
microwave oven and second -via co-axial cable applicator. Drilling with these techniques were carried out for
wood, glass, aluminium, copper, mild-steel (MS), animal bones specimens.
Keywords: Microwaves, Drilling, Co-Axial applicator, Near Field, Monopole Antenna

B A R C N E W S L E T T E RRESEARCH ARTICLE
16 I ISSUE NO. 329 I NOV. - DEC. 2012
giving further rise in local temperature. There is EM
energy ‘hogging’ and further increase in
temperature, giving rise to hot spot and induces
thermal runaway.
Refer Fig. 1, (left) the M the magnetron 2.45 GHz
900W is the microwave source, the microwaves
are launched to wave-launcher (WL) connected to a
power co-axial cable of low loss, make BELDEN
RG-213 (CO), via wave-guide (WR-340 type) to co-
axial connector (RC). The other parts of the set-up
are, control circuits, power circuits and cooling
circuits. The figure-1 (right) gives the actual picture
of the open ended co-axial cable (CO); and its
extended ‘tip’ of 3.25 cm that is (about) quarter
wavelength of 2.45 GHz microwave-source; which
behaves as monopole antenna. Fig. 3 gives the
photograph of actual set up, and the co-axial
monopole which is kept inside an EM shield.
Assume perfect impedance matching then the entire
watts of power delivered by the magnetron passes
through the monopole to the antenna tip to the
work-piece. The Electromagnetic (EM) radiation has
a ‘near field region’ which is resonating in nature,
followed by ‘far field region’ a travelling EM field
in nature. The approximate distance to which we
have resonating field is about a sixth of wave-length
(that is about 2 cm from the antenna). The work
piece is in the near field, and in resonating EM
zone. Unlike the remote laser-based drill, the heat
affected zone of near-field monopole drill bit is
smaller, and for 2.45 GHz microwave, the molten
region is typically less than 1 cm.
The same near field is also formed by a metal antenna
which is kept at the centre of microwave oven, first
acting as receiver, and then simultaneously
transmitting its (absorbed) Electric field to the work-
piece. The centre of oven has closed field that
induces field at a conductor placed there. This
scheme is shown in figure-2, a spring loaded drill
bit (monopole antenna) held by concrete structure,
and is kept inside microwave oven. In both the cases
the work piece which is at the near field zone will
be heated by field (radiated by monopole). The
monopole in both the cases acts as drill bit gets
inserted to the work-piece.
We write standard EM-equation in frequency
domain (1) and heat equation (2) in time domain;
and these two are coupled-equations having two
distinct time scales. The distinction between the time
scales for EM wave propagation (1) and thermal
diffusion (2) is ~Ins vs ~>ms respectively.
(1)
(2)
Where the electric field vector of the EM-field in
the frequency domain, ω and k0 are the angular-
frequency (ω=2πf; f=2.45GHz) and the free space
wave number ( k0 = 2π / λ0 with λ ∼13cm). The work-
piece is represented as μr , which is relative magnetic
permeability, the complex electric
permittivity, and the electric conductivity σ. In (2),
ρ is the local density of the work piece, Cp and k
th
are the specific heat and thermal conductivity
respectively; with T as slowly varying temperature.
These material parameters of the work-piece
ρ ,Cp
,kth
,εr are considered as having known
temperature (T) dependencies. The magnetic
permeability of material in this X-Band of microwave
radiation (2.45GHz) does not change much with
temperature. The equation (1) and (2) are coupled
by local EM heat source, and by the consequent
variation of with temperature.
(3)
The two time-scales of (1) and (2) as described
earlier is also a cause of thermal runaway. The EM
heat gets dissipated too quickly for thermal inertia
system (2) to take it and conduct is away from the

B A R C N E W S L E T T E R RESEARCH ARTICLE
ISSUE NO. 329 I NOV. - DEC. 2012 I 17
local spot. Let δhs
be the dimension of hot-spot,
then we have, ρCpδ 2
hs / k
th τ where τ = 2π / ω is
period of the EM wave. This also quantifies time
scale separation.
Microwave Drilling Experimental Setup
A method for drilling/cutting using microwave
discharge was suggested in [1]-[4] but further studies
were not reported. A novel method for drilling hard
non-conductive materials by localized application
of microwave energy was introduced in [5]-[7] [10].
We describe our two methods for experiments in
microwave drilling experiment. The principle is same
as of hot-spot formation with thermal runaway,
described in section-2, [8] [9], [11]-[15] for non-
metals as well as metals.
Setup for Drilling Inside Microwave Oven
(Method-1)
The schematic diagram of the setup developed
to perform microwave drilling inside a microwave
oven is shown in Fig. 2. A spring of required stiffness
was fixed to the bolt at the top of setup. The
structure was made of concrete cement mix. The
drill bit was fixed at the bottom end of the spring as
shown in the schematic diagram (Fig. 2). The bit is
working as microwave (monopole) antenna,
receiving and transmitting. This entire set up is kept
inside microwave oven. The work-piece is of metal
sheets, or of insulator sheets. The metal sheets
required susceptor material, (in our case charcoal
powder) to initially couple the microwave onto
metal, and increase its temperature locally; and
thus initiate the thermal runaway process. The
insulator work-pieces do not require the susceptor
material. The procedure for non metals is same as
that followed for metals. Here specimens were not
covered to prevent reflection as non metals will not
reflect microwaves. In this case susceptor was not
needed.
Drill bit & monopole antenna
Susceptor (only for metal work-piece)
Work-piece
Fig. 1: Left the wave circuit of microwave drilling setup with co-axial applicator. Right is full view of open ended
co-axial (CO) cable drill bit tip as monopole antenna
Fig. 2: Schematic diagram of microwave drilling setup for drilling inside oven
>>

B A R C N E W S L E T T E RRESEARCH ARTICLE
18 I ISSUE NO. 329 I NOV. - DEC. 2012
Setup for Drilling with Co-Axial Applicator
(Method-2)
The Fig. 3 describes the experimental set up. The
coaxial cable of length 1m was fixed into the metallic
box used as EM shield. The antenna 3.25 cm for
co-axial applicator is in Fig. 1. We used different
tips in our experiment (Table-1). Figure-4 gives the
Table 2: Non metal work-pieces
Material Drilled Thickness (mm) Power (W) Time (s)
Borosilicate glass 1.5 360 8
Glass 8 500 4
Bone 6 500 12
Bone (wet) 6 500 15
Wood 2 500 5
Wood (wet) 2 500 5
Wood (wet) 5 700 10
Aluminum 1 700 5
photograph of plasma formation while drilling
process. This is observed in both the methods.
Observations
Aluminium specimen-1 was drilled with 2 mm
Tungsten tool, which got melted and was burnt
partially due to overexposure (120s); however a hole
was formed. Similarly we drilled mild steel specimen
Fig. 3: Left photograph of the assembled setup to perform microwave drilling by microwave energy applied via
co-axial applicator. Right photograph of the monopole antenna attached to the coaxial cable and put inside a
chamber of EM shield tip is on the work-piece
Table 1: Metal work-pieces
Material Thickness Output Time of Drill bit
Drilled of work- power of exposure featurepiece(mm) microwave (s) (diameter
source in mm)
Aluminum 1 1 900 W 120 Tungsten bit (2mm)
Copper 0.5 900 W 150 Tungsten bit (2mm)
Mild steel 0.5 900 W 240 Tungsten bit (2mm)
Aluminum 2 1 900 W 60 SS bit (0.8mm)

B A R C N E W S L E T T E R RESEARCH ARTICLE
ISSUE NO. 329 I NOV. - DEC. 2012 I 19
successfully .The photograph of the drilled copper
strip 2mm hole is given in Fig. 5 (b). Aluminium
specimen-2 was drilled with a stainless steel bit of
0.8 mm diameter and with 60 seconds exposure,
which is shown in Fig. 5 (a). SEM image of the 0.8
mm hole drilled in Aluminium specimen-2 is given
in; Fig. 6.
The Scanning electron microscope (SEM)
photographs are taken in order to see if at all there
is any kind of material transformation, due to
application of microwave. Before drilling we have
taken the SEM images of microstructure of the base
metal. Later, after performing drilling operation, we
have cut the specimen along the cross-sectional area,
polished these specimen with emery paper and then
etched the specimen (etching reagent varies for
different material). After this standard process we
again see the microstructure in SEM for details to
view the specimen after drilling. For copper and MS;
SEM show coarse graining near the drill hole that is
due to slow cooling rate.
Fig. 4: Plasma formation while drilling glass inside
oven
Fig. 5: (a) Aluminium with 0.8mm hole (b) Copper strip with 2 mm diameter hole
Fig. 6: SEM micrograph showing surface structure of Aluminium specimen
(a) before microwave drilling (b) after microwave drilling

B A R C N E W S L E T T E RRESEARCH ARTICLE
20 I ISSUE NO. 329 I NOV. - DEC. 2012
The drilling was done on glass wood bones; one
such photograph of dry and wet bone drilled is
shown in figure-7. Here we are not showing SEM
photographs of all the drilled materials, a limited
number are illustrated; wet specimens have lower
carbonization.
Conclusions
Drilling for metals and non metals have been
demonstrated via use of microwave radiation by
prototype experimental set ups inside domestic oven
and via co-axial applicator as proof of principle.
SAMEER Govt. of India has shown keen interested
in refining this prototype experiment for drilling with
microwave, for professional usage for industry and
medical applications. For future advancements, we
plan to make solid state microwave drill system (for
low power applications 10-100W) and set-up for
high power up to 1200W; with co-axial ‘wave-guide’
applicator, tuning facility (3 Stub Tuner), circulator
ports, metering for power transmitted and reflected,
metering for temperature of hot-spot.
Fig. 7: Photograph of the hole drilled in bone without and with wetting
References
1. E.T. Thostenson, T.W. Chou, Composites: Part
A 30 (1999)1055–1071.
2. David E. Clark, Diane C. Folz, Jon K. West,
Materials Science and Engineering A287 (2000)
153–158.
3. H. S. Ku, E. Siores, A. Taube, Computers &
Industrial engineering 42(2002) 281-290. Jiping
Cheng, Rustum Roy, Dinesh Agrawal, Mat Res
Innovations (2002) 5:170–177
4. S.P. Kozyrev, V.A. Nevrovsky, L.L. Sukhikh, V.A.
Vasin, Yu. M. Yashnov, XVII International
Symposium on Discharges and Electrical
Insulation in Vacuum-Berkeley-1996
5. E. Jerby, V. Dikhtyar, 8th Ampere Proc.,
Bayreuth, Sept. 2001.
6. E. Jerby, V. Dikhtyar, O. Aktushev, Published in
Ceramic Bulletin 82(2003) 35.
7. E. Jerby, V. Dikhtyar, O. Aktushev, U. Grosglick,
www.sciencemag.org, Science Vol 298
18 October 2002
DRY BONE WET BONE
B A R C N E W S L E T T E R RESEARCH ARTICLE
ISSUE NO. 329 I NOV. - DEC. 2012 I 21
8. Titto John George, Apurbba Kumar Sharma,
Pradeep Kumar et al, Journal on Mechanical
Engineering, Vol. 2 No. 2 February - April
2012, pages 1-6.
9. Titto John George, Amit Bansal, Apurba Kumar
Sharma, Pradeep Kumar et al, Proceedings of
International Conference on Mechanical
Engineering Technology, Kerala (ICOMET 2012),
January 2012, pages 205-211
10. Eli Jerby, J. Am. Ceram. Soc., 87 [2] 308–10
(2004).
11. Titto John George, Apurba Kumar Sharma,
Pradeep Kumar, Rajesh Kumar, Shantanu Das,
“Microwave Drilling: Future Possibilities and
Challenges Based on Experimental Studies”,
International Conference on Emerging Trends
in Manufacturing Technology Toc H Institute of
Science & Technology Kerela, Sept, 5-6 , (2012).
12. Shantanu Das, Amit Bansal, Apurba Kumar
Sharma, “Theory of Welding of Metallic Parts
in Microwave Cavity Applicator”, Fundamental
Journal of Modern Physics-in press, 2012.
13. Shantanu Das, Rajesh Kumar, Prof. Apurba
Kumar Sharma, Titto John George, Amit Bansal,
“Phenomena of Electrostatic Resonance in
Negative Permittivity Plasmoid in the
Experimental Set Up for Microwave Near Field
Applicator “, Asian Journal of Physics Special
Issue-in press.
14. Apurba Kumar Sharma, Pradeep Kumar,
R.S.Anand, Rajesh Kumar, Shantanu Das,
“Material Processing with Microwave”, BRNS-
Project Sanction No.2010/36/60-BRNS/2048
dated 9-12-2010, (2009).
15. Shantanu Das, “RF Drilling of ceramics and
rocks”, High Precision Engineering VISION
2020, BARC, (2004)
Team for the project
Titto John George , Department of Mechanical
Engineering, Viswajyothi College of Engineering and
Technology Muvattupuzha, Kerala (Former IIT
Roorkee ME student), Pradeep Kumar, Professor at
Department of Mechanical and Industrial
Engineering, I.I.T. Roorkee Amit Bansal, Research
Scholar, Department of Mechanical and Industrial
Engineering, I.I.T. Roorkee and Rajesh Kumar, Ion
Accelerator Development Division IADD, BARC,
Mumbai.

B A R C N E W S L E T T E RRESEARCH ARTICLE
6 I ISSUE NO. 329 I NOV. - DEC. 2012
Table 2: Anti-inflammatory properties of plumbagin
22 I ISSUE NO. 329 I NOV. - DEC. 2012
B A R C N E W S L E T T E RRESEARCH ARTICLE
B A R C N E W S L E T T E RTECHNOLOGY DEVELOPMENT ARTICLE
Development of an Inductively Coupled Plasma
Mass-Spectrometer (ICPMS)
Rajendra Babu K., #Mishra J.K, Sandeep Choudary, Shinde K.R, Milind M.G, Joshi K.D, Kasbekar
A.M, #Ramarao B.V., Nivedita Ved, Abichandani P.A., Ravisankar E., Gopalakrishna M., #Manjiri M.
Pande, Saha T.K. and Nataraju V.
Technical Physics Division, #Ion Accelerator Development Division
Introduction
ICPMS is one of the most powerful techniques
allowing multi-elemental detection over a wide linear
dynamic range with very low detection limits, with
isotopic ratio measurement capability [1-3]. It has
been used for the determination of trace amounts
of metals in a variety of samples. These include
environmental samples, geological materials and
biological samples. Laser ablation ICPMS became a
powerful technique for both surface and bulk analysis
of solids [4] and even for bio-imaging of tissues of
nuclear workers and the ICPMS coupled to
hyphenated techniques (e.g., Liquid
Chromatography, gas Chromatography or Capillary
Electrophoresis etc.) has immense applications in
speciation analysis, proteomics, nano science and
nuclear field [ 5-6] etc.
In this article, we describe, in detail, the ICPMS
developed at Technical Physics Division, BARC. Its
analytical capabilities and applications in various
fields are also demonstrated, by analyzing samples
from user Divisions.
Abstract
A Quadrupole based Inductively Coupled Plasma Mass Spectrometer (ICPMS) has been developed at Technical
Physics Division, for the elemental determination at trace and ultra-trace levels and their isotope ratio
measurements in various materials. The performance of the indigenously developed ICPMS has been tested for
sensitivity, detection limits and linearity for different elements. The Sensitivity of the ICPMS was found to be 10-
30 x106 cps/ppm, resulting in detection limits ranging from 10-50ppt, depending on the element of interest.
Nuclear, Pharmaceutical and Biological samples were analyzed (to describe the operating characteristics and
performance of the system).
Instrumentation
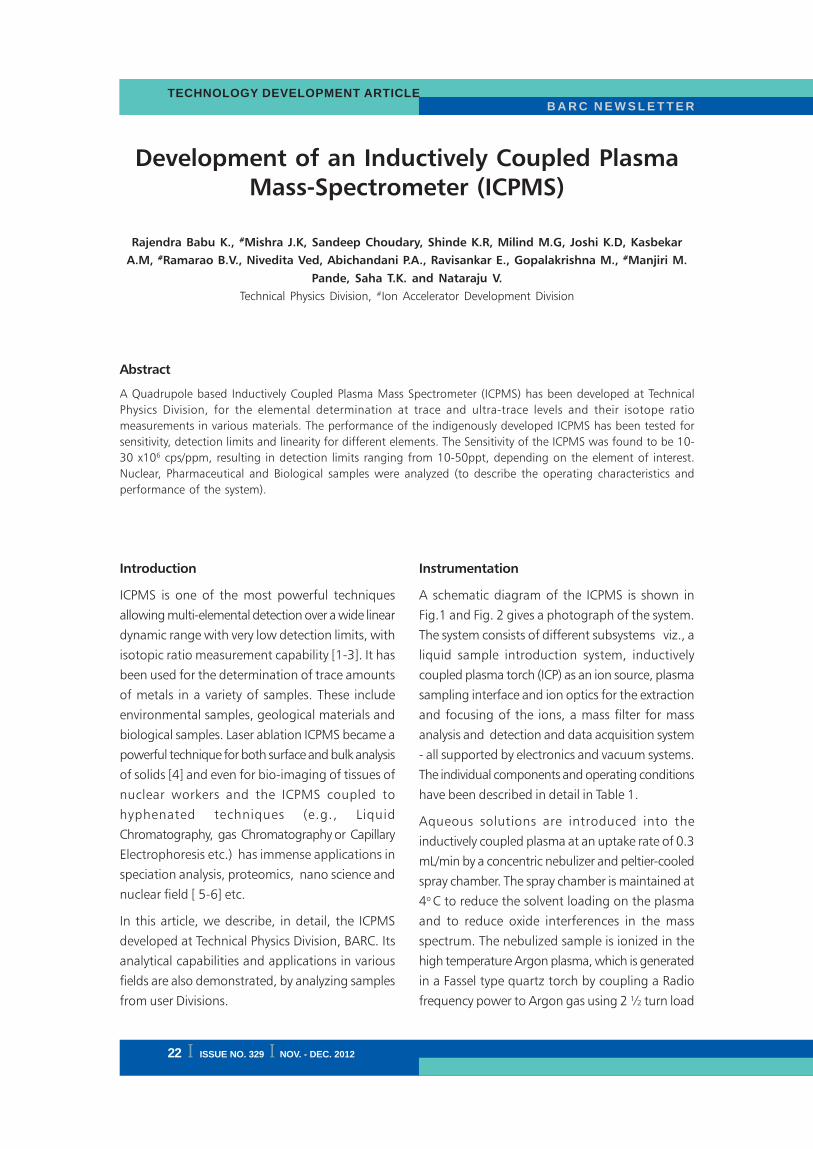
A schematic diagram of the ICPMS is shown in
Fig.1 and Fig. 2 gives a photograph of the system.
The system consists of different subsystems viz., a
liquid sample introduction system, inductively
coupled plasma torch (ICP) as an ion source, plasma
sampling interface and ion optics for the extraction
and focusing of the ions, a mass filter for mass
analysis and detection and data acquisition system
- all supported by electronics and vacuum systems.
The individual components and operating conditions
have been described in detail in Table 1.
Aqueous solutions are introduced into the
inductively coupled plasma at an uptake rate of 0.3
mL/min by a concentric nebulizer and peltier-cooled
spray chamber. The spray chamber is maintained at
4o C to reduce the solvent loading on the plasma
and to reduce oxide interferences in the mass
spectrum. The nebulized sample is ionized in the
high temperature Argon plasma, which is generated
in a Fassel type quartz torch by coupling a Radio
frequency power to Argon gas using 2 ½ turn load

B A R C N E W S L E T T E RB A R C N E W S L E T T E RTECHNOLOGY DEVELOPMENT ARTICLE
ISSUE NO. 329 I NOV. - DEC. 2012 I 23
coil and 1700 W at 27.12 MHz from an RF Generator.
The ions in the atmospheric plasma are extracted to
ultra high vacuum for mass analysis using three stage
differential pumping system; interface chamber (1st
stage), Ion optics chamber (2nd stage) and mass
analyzer- detector chamber (3rd stage).
The interface chamber consists of water cooled Nickel
Sampler (1mm dia. aperture) and Nickel Skimmer
(0.7mm dia. aperture). This interface region
maintains 2 mbar pressure using a rotary pump (560
Lmin-1). The ions from the skimmed plasma are
extracted and focused in to the quadrupole mass
spectrometer using double deflection ion optics
system. The simulation of the ion optics is shown
in Fig. 3. This ion optics prevents the neutrals and
photons from reaching the detector and hence
reduces the background noise. This region maintains
pressure of 8x10⁻⁴ mbar and is pumped by 665 Ls-1
Turbo molecular pump.
Fig.1. Schematic of ICPMS
Fig.2. Photograph of ICPMS

24 I ISSUE NO. 329 I NOV. - DEC. 2012
B A R C N E W S L E T T E RRESEARCH ARTICLE
B A R C N E W S L E T T E RTECHNOLOGY DEVELOPMENT ARTICLE
Table 1: Instrumental components

B A R C N E W S L E T T E RB A R C N E W S L E T T E RTECHNOLOGY DEVELOPMENT ARTICLE
ISSUE NO. 329 I NOV. - DEC. 2012 I 25
Fig.3. Simulation of Ion Optics
Quadrupole mass analyzer with pre-filters is used to
separate the ions according to their mass. It consists
of four stainless steel rods of 16 mm diameter and
225 mm length. The mass range of system is 6-260
amu at quadrupole RF frequency of 1.2 MHz. Unit
mass resolution can be achieved throughout the
mass range. The mass analyzed ions are detected
by a secondary electron multiplier (SEM), which
can be operated in both analog and pulse counting
modes. This region maintains a pressure of 2x10⁻⁶
mbar and is pumped by 255 Ls-1 Turbo molecular
pump. The signals from the SEM are processed and
displayed by a FPGA based multi-function card and
a Labview-based software.
Analytical Performance:
A typical mass spectrum of a mixture of rare earth
elements is shown in Figure 4.
Individual solutions of boron, cobalt, silver,
cadmium, cerium and uranium in the concentration
range of 10 ppb to 100 ppb are prepared from NIST
standards. The instrument is tuned for optimum
sensitivity for each element before measurement.
The linearity of the instrument is shown in Fig. 5.
The figure shows the linear performance of the
instrument with a regression value > 0.999 for
different elements. The sensitivity of the ICPMS was
found to be 10-30x106 counts per second (cps) per
ppm, resulting in the detection limits ranging from
10-50 ppt depending on the element, which is
shown in table 2. The sensitivity of the instrument
for different elements is shown Fig.6.
Fig.5. Linearity for B, Co, Ag, Cd, Ce and U
Fig.6. Mass Response of the system
Fig.4. Typical Mass Spectrum

26 I ISSUE NO. 329 I NOV. - DEC. 2012
B A R C N E W S L E T T E RRESEARCH ARTICLE
B A R C N E W S L E T T E RTECHNOLOGY DEVELOPMENT ARTICLE
Table 2 : Detection Limits of the system
Applications:
i) Determination of impurities in
Trichlorosilane:
The most common method of producing high-purity
polycrystalline silicon uses trichlorosilane as a raw
material. Polycrystalline silicon, also called
polysilicon, is a material consisting of small silicon
crystals. It is used in making electronic components
and solar cells. After distilling trichlorosilane, the
Table 3: Impurities in Trichlorosilane
residue left was analysed
for various elements.
Typical results are given in
Table 3.
ii) Determination
of Pd and Rh in
Pharmaceutical sample:
Pd and Rh are used as
catalysts during the
manufacture of drugs.
Hence, as a part of quality
checks the drug was
analyzed for Pd and Rh at m/e values of 108 and
103 respectively. Concentration values of Pd were
found to be less than 100 ng g-1 and the values for
Rh were found to be less than 70 ng g-1.
iii) Determination of Thorium-232 in Human
Liver Cells (HepG2):
The study of qualitative and quantitative interaction
of 232Th with human liver cells (HepG2) was carried
out by using ICPMS. Results showed that the total
cell bound thorium was ~100 fold higher than in
culture medium (Fig. 7a & 7b). However, when the
thorium treated cells were harvested with trypsin-
EDTA, cell bound thorium was found ~25 folds
lower than in cells harvested without using trypsin-
EDTA.
Fig.7a.: Observed 232Th signal in human liver cells
harvested without trypsin-EDTA

B A R C N E W S L E T T E RB A R C N E W S L E T T E RTECHNOLOGY DEVELOPMENT ARTICLE
ISSUE NO. 329 I NOV. - DEC. 2012 I 27
Fig.7b.: Observed 232Th signal in cell culture medium
iv) Boron Isotope Ratio analysis:
Boron samples of different 10B enrichments were
analyzed for the 10B/ 11B isotope ratios to access the
instrument mass bias and contribution of 12C signal
on 11B signal. The accuracy of the 10B/ 11B isotope
ratios is within ± 3% of true value, which was
confirmed by Thermal ionization mass
spectrometers. The results are shown in Table 4.
Conclusions:
A Quadrupole based ICPMS has been fabricated and
tested for trace elemental and isotope ratio
determination in various materials. The performance
of the spectrometer has been tested extensively by
recording the mass spectra for the determination of
sensitivity, detection limits and linearity of the
response and also isotope ratio measurements for
some elements. Further, the spectrometer has
been used for different applications to determine
elemental concentrations in nuclear biological
and pharmaceutical samples.
Acknowledgements:
The authors gratefully acknowledge the contributions
and motivation by Shri V.K. Handu, Ex. Head, TPD
and staff members of Mechanical design and
Assembly Section, Advanced Electronics &
Instrumentation, Digital Controls Sections of TPD
and others who greatly assisted in the development
of the project. They are greatly indebted to Dr.S.K.
Gupta, Head, TPD, for his constant encouragement.
They also express sincere thanks to all user
departments for their constructive feedback, which
encouraged the team to improve the designs for
better performance and reliability.
References:
1. R.S. Houk, Acc. Chem. Res., 27 (1994): 333-
339
2. A. Montaser, Inductively Coupled Plasma Mass
Spectrometry, VCH, New York, 1996
3. G.M. Hieftje, L.A.Norman, Int. J. Mass
Spectrom. Ion Processes, 519 (1992): 118-119
4. Joachim Koch, D.Gunther, Applied
Spectroscopy, 65 (2011): 155A-162A
5. R. Henry, D. Koller, D.W. Koppenaal, J. Wacker,
J. Radioanal. Nucl. Chem. 249 (2001): 103–
108.
6. I. Guenther-Leopold, J.K. Waldis, B. Wernli, Z.
Kopajtic, Int. J. Mass Spectrom. 242
(2005):197–202.
Table 4 : Inter-comparison study

28 I ISSUE NO. 329 I NOV. - DEC. 2012
B A R C N E W S L E T T E RRESEARCH ARTICLE
B A R C N E W S L E T T E RTECHNOLOGY DEVELOPMENT ARTICLE
Indigenous Development of High-resolution
Atomic Beam Fluorescence Spectroscopy Facility
for Precision Measurements
of Isotope Shifts and Hyperfine Structure
G.V.S.G. Acharyulu, M.Sankari, P.V. Kiran Kumar, M.V. Suryanarayana and T. Mukherjee
National Centre for Compositional Characterisation of Materials, Chemistry Group
Introduction
High-resolution optical spectroscopy has been used
to determine isotope shifts and hyperfine structure
for large number of isotopes, both stable and
unstable, and this has led to valuable information
about nuclear properties such as spin, magnetic
moments, nuclear charge radii and nuclear shape.
Measurement of isotope shifts and hyperfine
structures of an isotopic chain is of interest for
departmental applications. For example,
measurement of isotope shift between 235U - 238U,232U - 233U along with oscillator strength information
of various transitions allow one to arrive at
appropriate photoionization schemes for AVLIS [1-
2]. Considering its importance, continuous efforts
are being made to record emission spectrum of 232U
–238U for deriving isotope shifts [3].
Measurement of isotope shifts of stable isotopes;
unstable / radioactive nuclides of an isotope chain
provide information on nuclear size, shape and spin.
Such laboratories already exist worldwide in countries
like Russia (FLNR), Korea (KAERI), Germany (GSI),
TRIUMF (Canada), Finland (University of Jyvaskyla)
to name a few.
In the Indian scenario, and more particularly in DAE
context, the requirement of the nuclear data of
various target materials (209Bi, 208Pb, 207Pb, 206Pb, 204Pb,186W, 184W, 183W, 182W, 181Ta, Zr, Sn, Hg, U, Pu, F, Cl,
Na, Fe, Al), minor actinides (237Np, 238Np, 241Am,242mAm, 242Am, 243Am, 242Cm, 243Cm, 244Cm, 245Cm,
Abstract
A compact and versatile ultra-high vacuum chamber in combination with a resistively heated graphite tube
atomic beam apparatus for sub-Doppler fluorescence experiments has been designed and developed. The
spectral resolution achieved in the developed system is more than adequate to clearly observe all the sub-
Doppler hyperfine features in the D2 spectrum of rubidium. The compact interaction geometry, flexibility in
changing the atomic beam source and simplicity of the entire set up makes it useful for the measurement of
isotope shifts and hyperfine structure with a precision of <100 kHz.
The developed system is versatile enough and can be adopted to carry out high resolution atomic fluorescence
experiments on radio-active isotopes after making minor modifications to ensure radiation safety. The spectral
resolution and small sample size requirement would enable accurate measurements of nuclear parameters such
as nuclear size, deformation, magnetic moments, quadrupole moments, spins etc. This finds applications in
AVLIS and ADSS programmes.
Keywords: Atomic beam fluorescence, laser spectroscopy, isotope shift, hyperfine structure, sub-Doppler
spectroscopy, laser isotope separation, radioactivity, AVLIS, ADSS, nuclear structure

ISSUE NO. 329 I NOV. - DEC. 2012 I 29
B A R C N E W S L E T T E RB A R C N E W S L E T T E RTECHNOLOGY DEVELOPMENT ARTICLE
246Cm, 248Cm), long lived fission products, fuel
materials, structural and shielding materials used
for ADSS is very essential and is also well realized
[4].Measurement of isotope shifts using high
precision laser spectroscopy is an excellent technique
for the determination of few nuclear properties.
In fact, recently, the radius of the proton was re-
measured using Lamb shift measurement of muonic
hydrogen and it has been reported that the proton
radius is 0.84184(67)fm (which is 4% smaller than
the CODATA value of 0.8768(69)fm. This is the most
accurate proton size measurement ever done [5].
High precision 2s 2S1/2
– 3s 2S1/2
Doppler-free two
photon spectroscopy of natural (6Li and 7Li) and
radioactive (8Li, 9Li and 11Li) has shown that the
nuclear charge radii decreases continuously from6Li to 9Li, while a sudden increase in the nuclear
size is observed in case of 11Li resulting in the
formation of “11Li halo nuclei” [6]. The above
examples illustrate the ability of precision laser
spectroscopy methods for deducing certain nuclear
parameters.
Resonance fluorescence of atoms in an atomic beam
allows one to precisely measure hyperfine splitting
and isotope shift with high accuracy. The resolution
and sensitivity of the atomic spectra depends on
the laser parameters (frequency jitter, drift, power),
atomic beam parameters (atomic beam diameter,
mean free path, degree of collimation, Doppler shift,
background radiation from source) and detection
parameters (fluorescence spot size, signal collection
efficiency, signal to noise ratio) etc [7,8].
The salient features of the atomic beam fluorescence
setup developed at CCCM, Hyderabad, have been
described briefly in the current article, addressing
all the issues mentioned above.
System description
CCCM has procured cw ring dye laser and
cwTi:Sapphire laser systems under the Xth plan
project as part of RIMS programme. The lasers have
a frequency jitter of < 50kHz when they are actively
locked to the temperature stabilized reference cavity.
The high resolution lasers can be tuned over a wide
spectral range for carrying out isotope shift and
hyperfine structure measurements of isotopes of
several elements.
Usually the dominant contribution to the atomic
spectral width is from Doppler broadening, which
often limits the resolution. However, in order to
measure isotopes shifts and hyperfine structures of
constituent isotopes for a given transition of an
element, it necessary to employ sub-Doppler or
Doppler-free high resolution laser spectroscopy
techniques. To overcome the limitation set by
Doppler broadening, primarily three techniques are
used: a) the crossed-beam method; b) saturation
absorption spectroscopy; and c) the two-photon
spectroscopy. However, crossed-beam method is
more versatile and allows one to record sub-Doppler
spectrum with very small laser powers (in mW
levels). In this technique, the laser beam intersects
the atomic beam at right angles. A narrow vertical
slit collimates the atomic beam to give a small
angular spread. Collimation reduces the Doppler
broadening by a factor determined by the angular
spread. This technique allows one to unambiguously
resolve and identify all hyperfine components of
odd isotopes which enables precise measurements
of isotope shifts and the hyperfine structure
constants.
Development of sub-Doppler high resolution laser
atomic beam fluorescence spectroscopy technique
requires development and integration of a suitable
atomic beam source, interaction chamber and
fluorescence detection. A high-resolution atomic
beam fluorescence spectroscopy facility has been
designed and developed (Fig. 1). A resistively heated
graphite tube atomic beam source with a collimation
ratio of ~20 was designed, tested and integrated
into a compact interaction chamber for atomic beam
fluorescence experiments (Fig. 2). The laser-atom
interaction chamber and the source have been
designed so as to achieve sub-Doppler resolution.
The source chamber and the interaction chamber
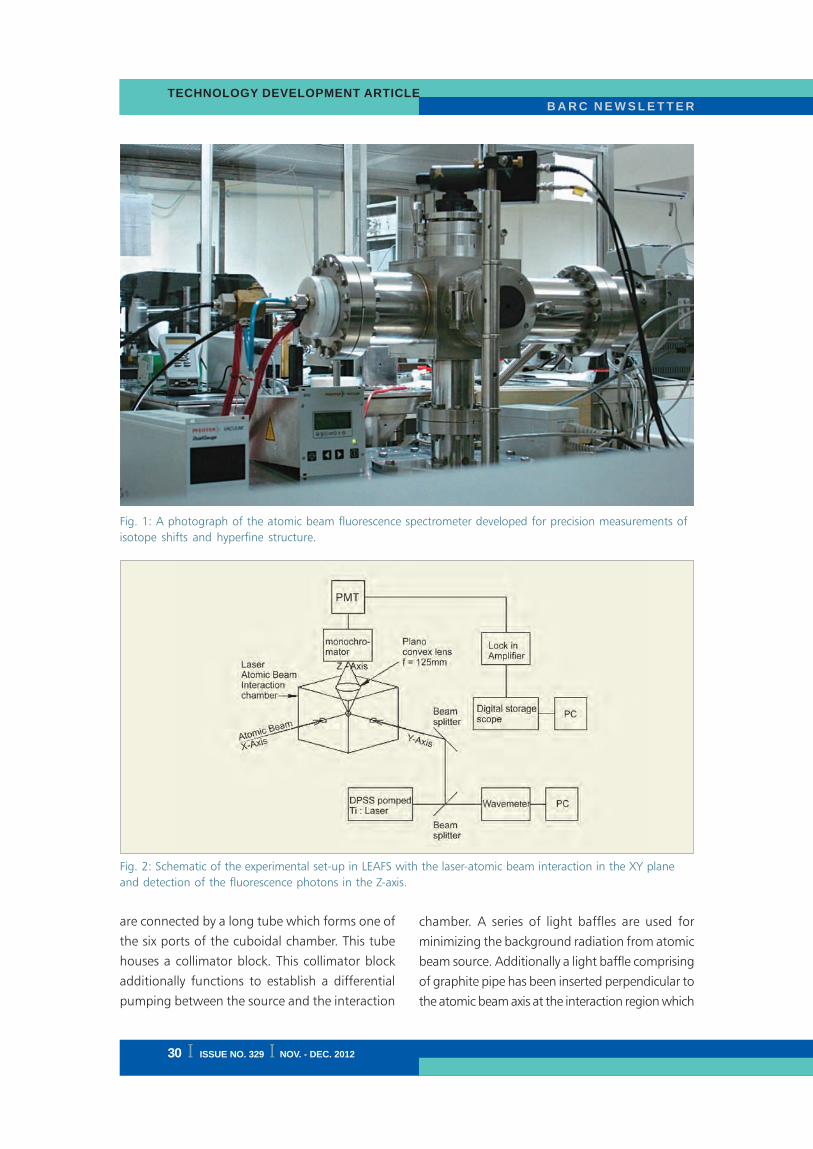
30 I ISSUE NO. 329 I NOV. - DEC. 2012
B A R C N E W S L E T T E RRESEARCH ARTICLE
B A R C N E W S L E T T E RTECHNOLOGY DEVELOPMENT ARTICLE
are connected by a long tube which forms one of
the six ports of the cuboidal chamber. This tube
houses a collimator block. This collimator block
additionally functions to establish a differential
pumping between the source and the interaction
Fig. 2: Schematic of the experimental set-up in LEAFS with the laser-atomic beam interaction in the XY plane
and detection of the fluorescence photons in the Z-axis.
Fig. 1: A photograph of the atomic beam fluorescence spectrometer developed for precision measurements of
isotope shifts and hyperfine structure.
chamber. A series of light baffles are used for
minimizing the background radiation from atomic
beam source. Additionally a light baffle comprising
of graphite pipe has been inserted perpendicular to
the atomic beam axis at the interaction region which

ISSUE NO. 329 I NOV. - DEC. 2012 I 31
B A R C N E W S L E T T E RB A R C N E W S L E T T E RTECHNOLOGY DEVELOPMENT ARTICLE
imaged through the view port and is found to be~
3mm x 6mm.
High resolution sub-Doppler spectroscopy of
Rubidium and Potassium isotopes:
a) Rubidium
To evaluate the spectral resolution and sensitivity of
the developed system, experiments have been carried
out on Rubidium and potassium atomic beam. The
atomic beam of rubidium and potassium is produced
by thermal evaporation of a mixture of rubidium
chloride and potassium nitrate placed in a graphite
crucible. Due to the resistive heating, the oven heats
up to temperatures of about 1000 K. At this
temperature a sufficiently dense atomic beam of Rb
is produced. The atomic density is estimated to be
~1010 atoms/cm3 while diameter of the atomic beem
is ~10mm. The atoms leave the oven through a
small hole of 2.0 mm diameter. The laser light from
a DPSS pumped Ti:Sa laser intersected the atomic
beam orthogonally at about 20 cm downstream
further minimizes the back ground radiation from
the source. Atomic beam interacts with the laser
orthogonally to reduce the Doppler broadening. The
incident laser beam is retro-reflected into the laser
axis to eliminate the Doppler shifts due to residual
angle (due to misalignment) between atomic beam
and the laser. This ensures that the fluorescence peak
lies within 100 kHz of the resonance center. Due to
the elimination of systematic shifts, hyperfine
splittings and isotope shifts could be measured with
high accuracy.
The advantage of the source is that it requires very
small amounts of sample (few mg) for achieving
high signal to noise ratio (>1000).The compact size
of the source makes the turn-on and the turn – off
times relatively less in comparison to the number of
hours of operation of the atomic beam. The
turnaround time is typically about 2 hours.
Experimental
Light resonant with the atomic transition was
generated by a DPSS pumped
cw-ring Ti: Sapphire laser having
a frequency jitter of <50 kHz. A
small fraction of the laser light is
fed to a wavemeter with a
resolution of 30 MHz to monitor
the laser wavelength. The
wavemeter is calibrated using a
stabilized reference laser
(frequency-stabilized He-Ne
laser). The resonance fluorescence
was collected using a Czerny
Turner monochromator. This
monochromator minimizes the
amount of stray light reaching the
photomultiplier tube and thus the
S/N ratio of the fluorescence signal
is significantly improved. The
atomic hyperfine spectrum was
recorded using a digital storage
oscilloscope. The dimension of the
fluorescence spot has been
Fig. 3: Experimental (A) as well as the theoretical (B) laser induced
fluorescence spectrum for the 52S1/2
– 52P3/2
D2 transition of rubidium
spanning the entire range covering the hyperfine spectrum of 87Rb
and the 85Rb isotopes. The sub-Doppler peaks of both the isotopes
are seen whose FWHM is ~ 26 MHz.

32 I ISSUE NO. 329 I NOV. - DEC. 2012
B A R C N E W S L E T T E RRESEARCH ARTICLE
B A R C N E W S L E T T E RTECHNOLOGY DEVELOPMENT ARTICLE
from the oven. The background pressure in the
vacuum system was about 5 × 10⁻⁷ mbar.
Thefluorescence light is imaged on to a low
resolution monochromator and is detected using a
photomultiplier tube (PMT) which is placed above
the intersection region of atomic beam and laser
beam. The detected laser induced fluorescence for
52S1/2
– 52P3/2
D2 transition of Rubidium is shown in
Fig. 3A. Atomic beam fluorescence spectrum for
the entire range of the 87Rb and the 85Rb isotopes
has been recorded. The theoretical spectrum has
also been simulated for comparison with the
recorded spectrum (Fig.3B). The best spectral
resolution that could be achieved after optimizing
the frequency separation between the hyperfine
components of D2 transition of Rb, the hyperfine
separation between the components of K isotopes
is much smaller (30 – 55 MHz).The entire
fluorescence spectrum of 42S1/2
– 42P1/2
D1 transition
of the 39K and 41K isotope has been recorded in two
different frequency ranges.
Adjacent hyperfine components of the 41K isotope
could not be resolved (Fig.5) due to very small
separation between the hyperfine components (~
30 MHz). To completely resolve the components,
the spectral resolution needs to be further improved;
however, it can be done only at the cost of sensitivity.
The hyperfine components of the 39K isotope could
Fig. 4: The hyperfine spectrum of the 87Rb isotope for
the 52S1/2
– 52P3/2
D2 transition. The FWHM of the
transition is observed to be ~ 16 MHz.
the power was ~16 MHz (Fig. 4) and is limited by
the angular spread of the collimator.
The experimental design and conditions for the
production of collision free atomic beam have been
optimized and the spectral resolution achieved
clearly establishes the observation of all the hyperfine
components of both the Rb isotopes.
b) Potassium
Laser induced fluorescence from atomic beam of
potassium has also been recorded. The laser was
operated at a power of 23 μW and the temperature
of the atomizer was maintained at ~950 K for
obtaining sufficient density of atomic beam. Unlike
Fig. 5: The hyperfine spectrum of potassium isotopes
for the 42S1/2
- 52P1/2
D1 transition recorded for a laser
power of 23 μW.
be partially resolved (Fig.5) due to relatively larger
separation (~ 55 MHz).
The hyperfine components of the major 39K isotope
originating from the lower F=2 hyperfine level have
been shown in Fig.6. As it can be seen in the Fig.6,
the hyperfine components, having similar intensities
and frequency separation of ~ 55.5 MHz could be
resolved partially. This clearly shows the limit of the
resolution of the system in the present configuration.
It is possible to improve the resolution further by
the control of angular spread of the atomic beam.
Minor design modifications can be made on the
system such as type of atomizer required, degree of

ISSUE NO. 329 I NOV. - DEC. 2012 I 33
B A R C N E W S L E T T E RB A R C N E W S L E T T E RTECHNOLOGY DEVELOPMENT ARTICLE
3. G.K. Bhowmick, R. Verma, M.K. Verma, V.A.
Raman, A.R. Joshi, M.N. Deo, L.M. Gantayet,
A.K. Tiwari, K.L. Ramakumar, Navin Kumar,
“Preparation of electrodeless discharge lamps
for emission studies of uranium isotopes at trace
level” Spectrochimica Acta 65B, 1047-1051,
2010
4. S. Ganesan “Nuclear data requirements for
accelerator driven sub-critical systems -A
roadmap in the Indian context”, Pramana-
Journal of Physics, 68, 257-268 (2007).
5. Randolf Pohl, Aldo Antognini, François Nez,
Fernando D. Amaro, François Biraben, João M.
R. Cardoso, Daniel S. Covita, Andreas Dax,
SatishDhawan, Luis M. P. Fernandes, Adolf
Giesen, Thomas Graf, Theodor W. Hänsch, Paul
Indelicato, Lucile Julien, Cheng-Yang Kao, Paul
Knowles, Eric-Olivier Le Bigot, Yi-Wei Liu, José
A. M. Lopes, LiviaLudhova, Cristina M. B.
Monteiro, Françoise Mulhauser, Tobias Nebel,
Paul Rabinowitz, Joaquim M. F. dos Santos,
Lukas A. Schaller, KarstenSchuhmann, Catherine
Schwob, David Taqqu, João F. C. A. Veloso and
Franz Kottmann, “The size of the proton”Nature
466, 213–216 (2010).
6. R. Sánchez, W. Nörtershäuser, G. Ewald, D.
Albers, J. Behr, P. Bricault, B. A. Bushaw, A.
Dax, J. Dilling, M. Dombsky, G. W. F. Drake, S.
Götte, R. Kirchner, H.-J. Kluge, Th. Kühl, J.
Lassen, C. D. P. Levy, M. R. Pearson, E. J. Prime,
V. Ryjkov, A. Wojtaszek, Z.-C. Yan, and C.
Zimmermann, “Nuclear Charge Radii of 9,11Li:
The Influence of Halo Neutrons” Physical Review
Letters 96, 033002 (2006).
7. Timothy M. Roach and Dwayne Henclewoode,
“Novel rubidium atomic beam with an alkali
dispenser source”,J. Vac. Sci. Technol. A 22(6),
2384 (2004).
8. Yoshihiro Iwata, Yoshizumi Inoue, Makoto
Minowa, “Trace element analysis of
potassium by resonance ionization mass
spectrometry”,Jpn. J. Appl. Phys. 48 (2009)
076505.
Fig. 6: The sub-Doppler peaks for the 39K isotope for
the 4 2S1/2
- 5 2P1/2
D1 transition which has been
recorded for a laser power of 23 μW.
resolution desired etc on case by case basis and this
would enable one to carry out precision isotope
shift and hyperfine structure measurements on most
of the isotopes relevant to the department.
Conclusions
We have developed a high-resolution atomic beam
fluorescence spectroscopy facility for precision
measurement of isotope shifts and hyperfine
structure. We have achieved a spectral resolution of
~16 MHz for the 5 2S1/2
– 5 2P3/2
Rubidium D2
transition. We have also recorded the sub-Doppler
spectrum of the 42S1/2
– 52P1/2
D1 transition of
potassium for the 39K and 41K isotopes and measured
the hyperfine splittings.
The setup can be readily adopted for measurements
on radioisotopes with adequate radiation safety
measures, which can find applications in AVLIS and
experiments to derive nuclear data of short lived
isotopes relevant to ADSS program.
References
1. P. RamakoteswaraRao, “Laser isotope separation
of uranium”, Current Science, 85, 615 – 633
(2003).
2. Yu.P. Gangrsky, B.K. Kul’djanov, K.P. Marinova,
B.N. Markov, S.G. Zemlyanoi, “Hyperfine
anomaly in the f3ds25L0
6, f3dsp 7M
7 and f3dsp 7L
6
levels in UI”, Z. Phys. D 42, 1(1997).
B A R C N E W S L E T T E RFEATURE ARTICLE
34 I ISSUE NO. 329 I NOV. - DEC. 2012
Data Acquisition and Control Electronics of
Neutron Scattering Instruments under NFNBR at
BARC: An Overview
R. M. Chandak, S. K. Poudel, S. S. Naik, Santosh Kumar, V. B. Kulkarni,
Ismat J.A. Shaikh and R. Mukhopadhyay
Solid State Physics Division
Introduction
The short-range strong interaction of neutron with
matter and its inherent magnetic moment make
neutron scattering a unique probe in condensed
matter research. Due to the matching of wavelength
and energy of thermal neutron to the lattice spacing
and excitations in condensed matter, it is an
indispensible tool both for the study of structure
and dynamics. Over and above, the magnetic
moment of neutron makes it suitable for the study
of magnetic structures and the fluctuations and
excitations of spin systems. The other important
advantage of neutrons over other forms of radiation
in the study of structure and dynamics on a
microscopic level is that they are uncharged, which
allows them to penetrate the bulk of materials. They
interact via strong nuclear force with the nuclei of
the material and the scattering cross-section varies
randomly between various elements and even
between isotopes. This allows one to observe light
atoms such as hydrogen in the presence of heavier
ones and distinguish neighboring elements in the
periodic table easily. One can exploit isotopic
substitution and contrast variation methods, to
gather information without ambiguity.
The National Facility for Neutron Beam Research
(NFNBR) is operated by Solid State Physics Division
(SSPD), Bhabha Atomic Research Centre (BARC),
Mumbai. NFNBR has been built around research
reactor Dhruva. The peak thermal neutron flux of
Dhruva reactor is about 1.8´1014 neutrons/cm2/s,
when it is operated at its maximum thermal power
of 100 MW.
The neutron scattering facilities are extensively used
by scientists from SSPD as well as by a large number
of other users. To enhance the university
participation, the UGC-DAE CSR(Consortium for
Scientific Research) has recently installed a neutron
beam line instrument at Dhruva. At present there
are about 35 active research projects from
universities or national institutions using NFNBR
under the UGC-DAE CSR program.
Abstract
National Facility for Neutron Beam Research (NFNBR) has been created as a part of the Solid State Physics Division(SSPD) during early nineties to cater to the needs of the Indian scientific community in the field of neutron beamresearch. Scientists from BARC, other DAE units, universities and national laboratories use this facility throughcollaborative research projects with SSPD scientists. Many of these collaborations are being supported by UGC-DAE Consortium for Scientific Research, Board of Research in Nuclear Sciences (BRNS) and other agencies. Atpresent the facility is mainly concentrated at DHRUVA research reactor at BARC. NFNBR has various neutronscattering experimental set-ups for basic and applied research in condensed matter. A brief description of DataAcquisition and Control Electronics associated with these instruments, developed and maintained in-house isprovided.

B A R C N E W S L E T T E R FEATURE ARTICLE
ISSUE NO. 329 I NOV. - DEC. 2012 I 35
Plan of the layout of the beam lines at the Dhruva
reactor and the neutron scattering instruments in
the reactor hall and guide laboratory are shown in
Fig. 1 and the photograph of the panaromic view
of the neutron scattering facility at Dhruva is shown
in Fig. 2.
There are twelve neutron scattering instruments
under NFNBR at Dhruva reactor. Eight of them are
in the reactor hall and four in the guide tube
laboratory. As far as the instrumentation is concerned
they fall broadly under two categories: (1) Motorized
scan type and (2) Position Sensitive Detector (PSD)
based. This paper gives an overview of the
control and data acquisition involved in both
types of instruments. The neutron scattering
experiments are carried out with the sample
Fig. 1: Plan of the layout of the neutron scattering facility at Dhruva, BARC, Trombay.
Fig. 2: Panoramic view of the neutron instruments at Dhruva.

B A R C N E W S L E T T E RFEATURE ARTICLE
36 I ISSUE NO. 329 I NOV. - DEC. 2012
placed in various physical conditions by the use of
sample environment systems. A brief description of
these systems and their integration with the
experiment control software is also given.
Motorized Scan Type Instruments
In a typical motorized scan type neutron scattering
experiment, monochromatic beam of neutrons is
incident on the sample being studied. Intensity of the
neutrons scattered by the sample is then measured as
a function of scattering angle by moving the detector
in steps. Depending on the kind of instrument there
could be various arms or axes to be moved to facilitate
data acquisition. The schematic of one such instrument,
known as Triple Axis Spectrometer (TAS) is shown in
Fig. 3.
instruments. The angular movement of various arms
of the spectrometer is accomplished by worm &
worm-gear assembly driven by geared DC motors.
The angular position feedback of the motor shaft is
derived from rotary optical encoder. The principle
of position control is two-speed on-off type. The
motor moves in two different speeds: it begins to
move fast and slows down for the last one degree.
To correct backlash error while moving in reverse
direction, the motor is moved one degree beyond
the target position and brought back to the target
in forward motion. With this scheme, in present
configuration the system can control up to six motors
at a time with a typical positioning accuracy of 0.01
degree.
Fig. 3: Schematic of Triple Axis Spectrometer
The data acquisition consists of counting the number
of neutrons scattered over an angular range,
normalized either by total number of neutrons
incident on the sample (monitor mode) or total time
taken for the experiment (time mode). A neutron
instrument has various arms/axes, like
monochromator, sample, detector, analyzer, etc.
The control system for these set-ups requires the
precise positioning of various axes to a specified
angle and acquires data from neutron detection
system as a function of these angles.
The control system is designed to suit the existing
mechanical and electrical assembly of the
Fig. 4: Photograph of the DC motor controller card
The front end electronics for the neutron detection
system typically consists of gas filled neutron
detector, standard low voltage power supplies, pre-
amplifier, main amplifier, discriminator-scalar and
high voltage power supply. Discriminator is used to
eliminate low level pulses coming from the shaping
amplifier to greatly reduce contribution from pulses
generated by gamma rays, in the data being
recorded. Each logic pulse coming from the
discriminator signifies a single neutron event detected
in the detector.
The DC motor position control electronics developed
at SSPD, comprises of (1) A Microcontroller and

B A R C N E W S L E T T E R FEATURE ARTICLE
ISSUE NO. 329 I NOV. - DEC. 2012 I 37
CPLD based DC motor controller with USB interface,
and (2) DC Motor Power Driver card. The internal
view of the controller card and power driver card
housed in the enclosure is shown in Fig. 4.
This system can control six DC motors and has two
neutron-counting channels. The controller card has
a CPLD for implementing control logic (with Digital
outputs, encoder pulse counters, etc) of six motors.
Microcontroller on the controller card exchanges
data with registers in CPLD in response to command
received from PC via USB-UART Bridge IC. In the
motor power driver card a variable regulator is used
to power an H-bridge circuit to operate the motor
in a desired direction at slow/fast speed. The various
control inputs to the motor power driver card and
the architecture of the entire system is as shown in
Fig. 5.
For the PC application programs suitable motor
control and data acquisition routines are also
developed. The software has five operating modes:
(1) Manual Mode, (2) Rocking Mode, (3) Energy
Scan Mode, (4) Look-Up File Mode and (5)
Continuous Time Scanning Mode.
Position Sensitive Detector (PSD) based
neutron scattering instruments
The Position Sensitive Detector (PSD) is widely used
to measure the position co-ordinates of neutrons. A
typical, linear 1D neutron PSD is a cylindrical He-3
gas filled detector of one inch diameter and length
of one meter. It has a high resistive anode wire of
25μm diameter of specific resistivity 10k&!/m. The
gas is usually kept at a pressure of 8 to 10 bar. The
detector works in the proportional counter region.
In a PSD type neutron scattering experimental set-
up, intensity of the neutrons scattered by the sample
is measured by using PSD(s), without having to move
the detector. The basic electronics set-up for position
encoding electronics is shown in Fig. 6.
Fig. 5: Block diagram for motor control & data acquisition electronics for motorized scan type instruments.

B A R C N E W S L E T T E RFEATURE ARTICLE
38 I ISSUE NO. 329 I NOV. - DEC. 2012
The nuclear electronics system for each PSD
essentially comprises of two pre-amplifiers, two
Fig. 6: Position encoding electronics of a PSD.
shaping amplifiers, and a Ratio ADC (RDC). These
modules are designed by Electronics Division, BARC
and now manufactured by ECIL. During the course
of experiment, RDCs provide the event code, which
signify the position where neutron was detected.
These nuclear electronic modules give the position
of neutron event by the principle of Charge Division
Method. In a typical system at Dhruva reactor, up
to five one-meter long PSD are used to cover the
angular range of interest as shown in Fig. 7.
The total ionisation charge Q produced in the
avalanche at a distance X from one end of the
detector divides itself and flows to the two ends of
the detector. Depending on the position of detection
of neutron the amplitude of the two signals differ
from each other. Based on charge division principle
it can be shown that for small Z where Z
is the input impedance of the charge sensitive pre-
amplifier. The charge sensitive pre-amplifier
integrates the charge that is collected at both the
ends of the detector and produces a voltage pulse
at the output. The pre-amplifier should have low
input impedance so that the position of the neutron
event and the amplitude of the detector pulses vary
linearly. The shaping amplifier takes the exponential
tail pulses from the pre-amplifier and shapes it into
quasi-Gaussian pulses. The output of the pre-
amplifier have sharp peaks, so shaping of the pulses
has to be done in order to get sufficiently flat peaks
Fig. 7: PSD type neutron scattering experimental Fig. 8: The Data logger card
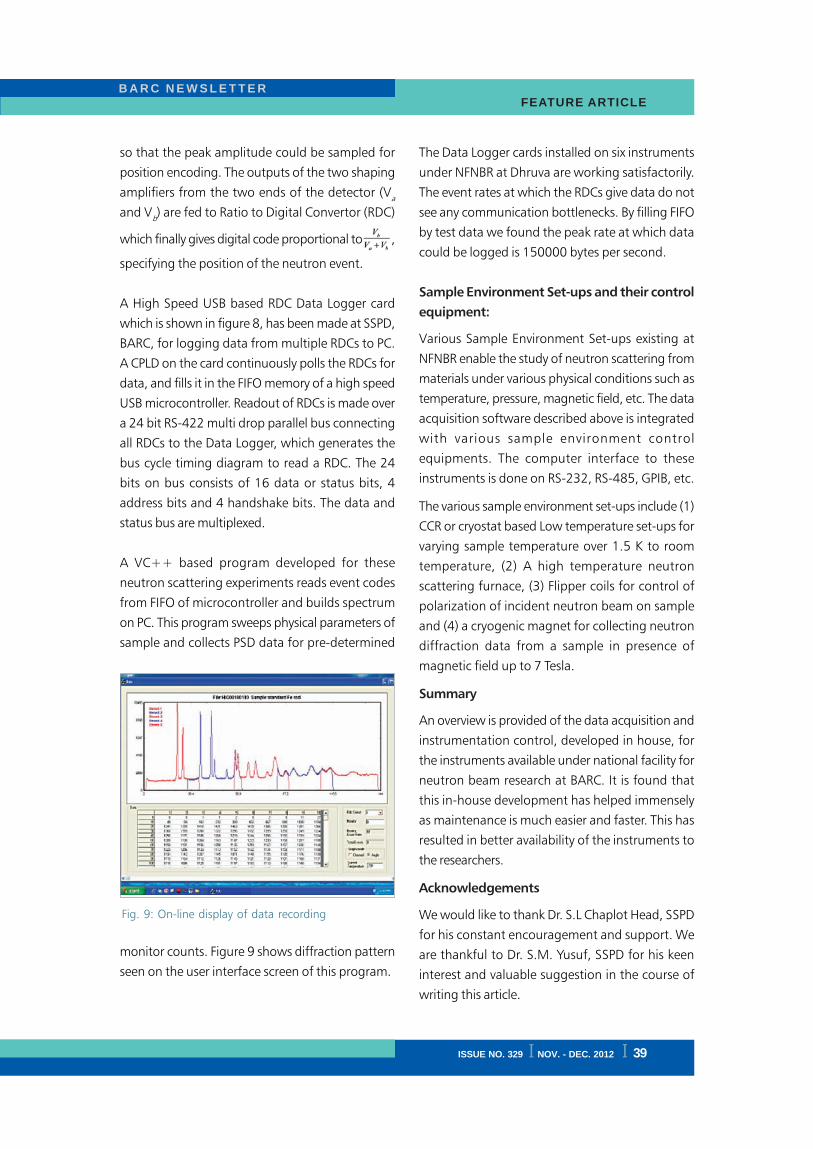
B A R C N E W S L E T T E R FEATURE ARTICLE
ISSUE NO. 329 I NOV. - DEC. 2012 I 39
so that the peak amplitude could be sampled for
position encoding. The outputs of the two shaping
amplifiers from the two ends of the detector (Va
and Vb) are fed to Ratio to Digital Convertor (RDC)
which finally gives digital code proportional to ,
specifying the position of the neutron event.
A High Speed USB based RDC Data Logger card
which is shown in figure 8, has been made at SSPD,
BARC, for logging data from multiple RDCs to PC.
A CPLD on the card continuously polls the RDCs for
data, and fills it in the FIFO memory of a high speed
USB microcontroller. Readout of RDCs is made over
a 24 bit RS-422 multi drop parallel bus connecting
all RDCs to the Data Logger, which generates the
bus cycle timing diagram to read a RDC. The 24
bits on bus consists of 16 data or status bits, 4
address bits and 4 handshake bits. The data and
status bus are multiplexed.
A VC++ based program developed for these
neutron scattering experiments reads event codes
from FIFO of microcontroller and builds spectrum
on PC. This program sweeps physical parameters of
sample and collects PSD data for pre-determined
monitor counts. Figure 9 shows diffraction pattern
seen on the user interface screen of this program.
Fig. 9: On-line display of data recording
The Data Logger cards installed on six instruments
under NFNBR at Dhruva are working satisfactorily.
The event rates at which the RDCs give data do not
see any communication bottlenecks. By filling FIFO
by test data we found the peak rate at which data
could be logged is 150000 bytes per second.
Sample Environment Set-ups and their control
equipment:
Various Sample Environment Set-ups existing at
NFNBR enable the study of neutron scattering from
materials under various physical conditions such as
temperature, pressure, magnetic field, etc. The data
acquisition software described above is integrated
with various sample environment control
equipments. The computer interface to these
instruments is done on RS-232, RS-485, GPIB, etc.
The various sample environment set-ups include (1)
CCR or cryostat based Low temperature set-ups for
varying sample temperature over 1.5 K to room
temperature, (2) A high temperature neutron
scattering furnace, (3) Flipper coils for control of
polarization of incident neutron beam on sample
and (4) a cryogenic magnet for collecting neutron
diffraction data from a sample in presence of
magnetic field up to 7 Tesla.
Summary
An overview is provided of the data acquisition and
instrumentation control, developed in house, for
the instruments available under national facility for
neutron beam research at BARC. It is found that
this in-house development has helped immensely
as maintenance is much easier and faster. This has
resulted in better availability of the instruments to
the researchers.
Acknowledgements
We would like to thank Dr. S.L Chaplot Head, SSPD
for his constant encouragement and support. We
are thankful to Dr. S.M. Yusuf, SSPD for his keen
interest and valuable suggestion in the course of
writing this article.

B A R C N E W S L E T T E RFEATURE ARTICLE
40 I ISSUE NO. 329 I NOV. - DEC. 2012
References
1. S. K. Poudel, V. B. Kulkarni, Santosh Kumar, R.
M. Chandak, P.S.R. Krishna, R Mukhopadhyay,
High Speed USB Data Logger for Position
Sensitive Detector Data Acquisition, National
Symposium on Nuclear Instrumentation,
Mumbai. February-2010.
2. R. M. Chandak, V. B. Kulkarni, Santosh Kumar,
S. S. Naik, I. A. Shaikh, R Mukhopadhyay, S. K.
Poudel, Stepper Motor Control System for
Neutron Focusing Devices, at Conference on
Neutron Scattering and Mesoscopic Systems,
Goa. October 12-14, 2009. pp 135.
3. S. S. Naik, Ismat Kotwal, R. M. Chandak,
V.G.Gaonkar, Data Acquisition & Instrument
control system for neutron spectrometers,
Pramana-Journal of Physics, Vol. 63, No.2,
August 2004, pp. 455-458.
4. D Sen, V. K. Aswal, R. Mukhopadhyay and S.
L. Chaplot, National Facility for Neutron Beam
Research, Published by SIRD, BARC.
5. Utilization of Research Reactor, (Eds. S. M.
Yusuf and A. V. R. Reddy) IANCAS Bulletin I(3)
2002.

B A R C N E W S L E T T E R FEATURE ARTICLE
ISSUE NO. 329 I NOV. - DEC. 2012 I 41
BARC Medical Cyclotron Facility: Performance and
Achievements in the First Decade after
Commissioning
M.G.R. Rajan, Saikat Nandy, N. Lakshminarayanan, B.K. Sharma, Arpit Mitra, Amit Kumar,
Shrinibas Nayak, Kanchan Kushwaha, Arjun G, R. Chinagandham, Yuvraj N.
The installation and commissioning of the BARC
Medical Cyclotron Facility (MCF), in October 2002,
was a landmark event for very important reasons. It
was the first cyclotron in the country for producing
short-lived positron emitting isotopes for positron
emission tomography (PET) - a nuclear medicine
investigation procedure - with proven use in
oncology, cardiology and neurology. The nuclear
medicine fraternity in the country was eagerly
awaiting to use this modality for the benefit of cancer
patients in the country; and within a short time it
removed the apprehensions of the nuclear medicine
centres about the economic viability of investing in
such high cost equipment. The decision by the
Department of Atomic Energy and the BARC, to set
up the facility at RMC, was taken after much
deliberation and fact finding. Details of this and of
the installation of the MCF in the Tata Memorial
Annexe Building, Parel, where RMC is situated, which
involved the will and determination of a team of
DAE scientists and engineers is beyond the scope
of this article and is detailed elsewhere (see
footnote1).
The MCF and the PET scanner were installed at the
same time and were dedicated to the nation on
October 31, 2002 by the then Prime Minister of
India. The MCF is in an area of less than 135 M2
and has an unshielded PETtrace cyclotron from
General Electric (through Wipro-GE,India), two FDG
mini modules, one carbon-11 methylation module,
a dispenser to aseptically distribute the 18F-FDG into
vials for distribution to hospitals, a module to make
15O-water installed in the PET-scanner room in the
first floor, where the 15O2 is directly sent from the
cyclotron due to its T1/2
of 2 min. All the hot cells
and the synthesis modules were from M/s Nuclear
Interface, Germany, who is a pioneer in this field
(now taken over by GE-Healthcare).
With some training from the application specialists
from GE for the medical cyclotron and the PET-
radiochemistry synthesis modules, several trial
batches of 18F-FDG were successfully made.
Following this, ten production batches and their
QC (quality control) testing was carried out as per
the US-Pharmacopoeia specifications including
animal bio-distribution, and the data compiled and
submitted to the Radiopharmaceuticals Committee
(RPC) for clearance. The RPC is an oversight
committee appointed by the Department of Atomic
Energy to oversee and approve the production and
QC processes of radiopharmaceuticals (RPs) in DAE
units, for their use in humans. The RPC approved18F-FDG as a radiopharmaceutical product on October
28, 2002, and the next day a lot of 18F-FDG was
made and administered to the first human volunteer,
Dr. Ramamoorthy, and the first FDG-scan was
performed in India.
Regular production soon commenced, but there were
initial teething troubles, and regular, uninterrupted
routine production and supply to hospitals started
from March 2003. To begin with, RMC was
the only consumer of the MCF. The Hinduja Hospital
started procuring 18F-FDG soon after and the
consumer base of MCF expanded gradually
1 Booklet brought out on the occasion of the BRNS – Theme meeting, ‘A Decade of Operation of the BARCMedical Cyclotron Facility’ held on October 18, 2012.

B A R C N E W S L E T T E RFEATURE ARTICLE
42 I ISSUE NO. 329 I NOV. - DEC. 2012
Fig. 1A: BARC Medical Cyclotron Facility in the basement of
TMH Annexe Building
Fig. 1B: PETtrace 16.5Mev cyclotron in vault in
the MCF
Fig. 1C: Liquid and gas targets in the cyclotron
Fig. 1D: PET-Radiochemistry synthesis and dispensing
modules
Fig. 1E. PET-Radiochemistry room – ready for the
day’s activities.

B A R C N E W S L E T T E R FEATURE ARTICLE
ISSUE NO. 329 I NOV. - DEC. 2012 I 43
as other nuclear medicine centres procured PET-CT
scanners. Table 1 shows the expanding consumer
base for 18F-FDG over the years. Most of them are
regular customers of the MCF but a few are now
procuring 18F-FDG from another medical cyclotron
Table 1: Expanding customer base for 18F-FDG
produced at the MCF
Year Nuclear Medicine Centres using
[F-18]FDG from the MCF
2002 Radiation Medicine Centre
2003 P.D. Hinduja Hospital,
Mahim, Mumbai
2004 Jaslok Hospital & Research Centre,
Peddar Road, Mumbai
Bombay Hospital,
Marine Lines, Mumbai
Tata Memorial Hospital, Parel
2007 Mandakini Nuclear Imaging &
Research Centre, Chembur
2008 SPECT-Lab, PuneSRL-Diagnostic, Worli,
MumbaiShreeji Imaging & Diagnostic
Centre, Borivalli, Mumbai
RUBY Hall Clinic, Pune
2009 KEM Hospital, Parel, Mumbai
2010 Nanavati Hospital, Vile Parle, Mumbai
ACTREC, Kharghar, Navi Mumbai
2011 Seven Hills Hospital, Andheri, Mumbai
#Sales in 2011-12 did not meet the target of Rs. 6 Crdue to several days of shutdown due to equipmentfailures.This does not include the sales of [F-18]NaF, [F-18]FLTand [F-18]FMISO. The total sales of these three aresmall and was Rs. 5.92 lakhs in 2011-12.
Table 2: 18F-FDG Sales over the years since 2003.
Table 3: Production Data (as of Sept 2012)
Financial Year Rupees (in Crores)
2004-05 2.02
2005-06 4.27
2006-07 4.68
2007-08 5.43
2008-09 4.67
2009-10 4.89
2010-11 5.8
2011-12# 5.6
Radiopharmaceuticals No. of
Batches
[F-18]FDG 3715
[F-18]NaF (commenced form 2007) 535
[F-18]FLT (commenced from 2010) 95
[F-18]FMISO (commenced from 2010) 61
facility in the private sector. By this, we have ably
proven that the central MCF with several satellite
PET-CT scanners is possible and commercially viable
in India too. Table 2 shows the 18F-FDG sales over
the years since 2003.
The sale of 18F-FDG (and other 18F-RPs) from the
BARC MCF is permitted following a policy decision
that the Medical Cyclotron Facility will be operated
jointly by staff from RMC, BARC, and BRIT. The
revenue generated from the sale of PET
Radiopharmaceuticals is credited to BRIT. The overall
the facility is supervised by the Committee for the
Management of Medical Cyclotron (CMMC),
constituted by Director, BARC and Chaired by Chief
Executive, BRIT.
There is a perception amongst nuclear medicine
physicians, largely due to the information from sales
persons from cyclotron vendors, that the production
B A R C N E W S L E T T E RFEATURE ARTICLE
44 I ISSUE NO. 329 I NOV. - DEC. 2012
The pricing 18F-FDG was based on a costing-model
and customers were charged for the activity supplied
at the time of delivery, rather than per patient dose.
Customers were requested to come to the MCF and
take delivery and transport it to their site on their
responsibility. This pricing model has been
appreciated by the customers who, on the whole,
find the prices from the MCF to be the lowest, since
we do two production runs in a day and, hence,
costs due to radioactive decay are kept to a
minimum.
From March 2003 to 2006 there were no problems
with the cyclotron and auxiliary equipment, except
for occasional synthesis failures due to operator errors
or failure in the solenoid valves or tubings. The latter
was identified as due to radiation damage and this
was sorted out by introducing a flush program after
synthesis, where clean water was made to pass
through the tubing and valves to wash away any
residual radioactivity, and this made a big difference
to the reliability of the valves, tubings and reduced
replacement costs. We could reduce the costs of
spares very significantly, by sourcing them directly
from the manufacturers rather than from GE.
The uptime from March 2003 to March 2006 was
99% except for the planned shutdown for preventive
maintenance, lasting 2 weeks every six months. This
long period disrupted the FDG diagnostic studies at
all nuclear medicine centres dependent on us. Shut
down maintenance was a necessity and after much
planning and discussion with Wipro-GE, this was
brought down to one week every six months and
the last Monday of every month. When necessary,
our staff along with the health physicists worked
on weekends and late nights to ensure there was
minimum disruption in supply of 18F-FDG.
As nuclear medicine centres, other than RMC, started
installing PET-scanners, the need for making more
FDG became necessary and we started making two
batches a day and we could cope with this as there
were two FDG synthesis modules available. The high
yield fluorine-18 liquid target (mentioned above)
installed at this time (in the X-Plan) also helped.
Our health physicists did a detailed survey of the air
activity during production and the air activity released
from the stack before giving us this clearance. A
major limitation due to the compact area of the
facility, in producing more than 130 GBq (3.5 Ci)
of fluorine-18 in the cyclotron, was that the
radiation in the area outside the cyclotron vault door
would exceed the threshold of 0.1 mR/h and the
area gamma monitor would sound an alarm and
trip the cyclotron, although the chemistry modules
are designed to handle 185GBq (5Ci).
Timely production also required staff to reach the
MCF unfailingly and the sense of unstinted
responsibility of the physicists and chemists made
this possible. Everyone at the MCF felt the need to
make every synthesis work. Disruption in 18F-FDG
supply meant i) making the fasting patients’ wait
(ii) make the nuclear medicine physician unhappy
(iii) loss of revenue to BRIT and importantly (iv) a
loss of reputation for an institute of BARC’s strature.
In addition, a failed synthesis also meant a loss of
expensive 18O-water, FDG-precursor and other
chemicals and man-rem expenditure. Timely
availability of FDG was put to test when a demand
was made by a customer in early 2009 to supply
the 18F-FDG at 8 AM. This required that the staff
come in at 6 AM and start their work. The MCF
staff and heath physicists unanimously agreed to
do so and it is a source of great pride to the MCF
team that it has remained competitive in the market.
The first major problem in the cyclotron suddenly
occurred one day in early 2006, when the copper
helium heat exchanger developed a leak inside it
and the cyclotron tripped. It was a specially designed
heat exchanger and not available locally. We had to
wait for a full week before it was located at one of
the GE’s many PETtrace units worldwide and shipped
to Mumbai. This was instrumental in introducing a
shut-down maintenance on the Monday of every
month to identify potential vulnerabilities and rectify
them.

B A R C N E W S L E T T E R FEATURE ARTICLE
ISSUE NO. 329 I NOV. - DEC. 2012 I 45
Wipro-GE was also on the learning curve with us in
terms of cyclotron operations and maintenance. In
fact, our MCF was a showcase for them to sell more
of their machines in India. This somewhat improved
the availability of spares as there were more
installations. It is noteworthy that all engineers
appointed by Wipro-GE for cyclotron and PET
chemistry have had a stint at the MCF before they
were posted elsewhere.
By 2006, we had achieved a fair level of competence
in the production and supply of 18F-FDG and an
urge to make other 18F-radiopharmaceuticals (RPs),
and not just be a run-of-the-mill 18F-FDG supplier,
was felt. This was the PET era and there were
publications that were appearing regularly on the
production and use of other 18F-RPs. We required a
shielded synthesis module for doing this as well as
for doing a third FDG run if necessary. The C-11
methylation module was hardly used due to two
reasons; first, the synthesis module was designed
to trap the 11CO2 from the cyclotron and convert it
to 11CH3I and use it for labeling. Several batches of
11C-methionine were made but with low yields, even
at the hands of the application specialist who visited
here for this purpose - a known limitation of 11C-
RPs made by this route. Secondly, there were little
commercial prospects for 11C-RPs due to its 20 min
T1/2
since the entire cyclotron run and synthesis was
adequate for only one patient study, making it
prohibitively expensive, in comparison the same
effort and cost in making 18F-FDG would benefit
several cancer patients. We modified the C-11
module by rerouting the tubing and changing the
human-machine-interface (HMI) and rewriting the
program in the built-in NINA® software for
nucleophilic fluorination and it was a day of great
satisfaction that we could make 18F-FDG with it.
Hence, a standby synthesis module was made
available for doing the third 18F-FDG synthesis, if
required, and also for doing R&D to synthesize other18F-RPs.
The first 18F-RP we made was 18F-NaF, a simple
molecule produced in the cyclotron target when
18O-water is irradiated. To make it suitable for
patients’ use, it was necessary to make it free from
radioactivity that came from the target and Havar
foils. We did this by trapping the 18F- in an anion
exchange column and eluting it. Several trials and
testing were done and the data submitted to the
RPC for approval, which came in 2006. We started
regular production and regular deliveries to our
customers soon after that.
Next, we took up the challenge of making 18F-FLT
and 18F-FMISO that are important for analysis of
tumour proliferation and hypoxia, respectively. We
also chose to use solid-phase extraction methods
for purification as this would simplify the production
and avoid the additional time required for the semi-
preparative HPLC purification, which is quite a
cumbersome process. This involved a fair degree of
R&D activity and simple solutions were obtained
for both. After much trials and product evaluation,
we could get the RPC approvals for the production
and QC monographs in 2010. Regular production
and supply is presently being made on a weekly
basis.
We have also standardized the methods to make18F-FAZA and 18F-FES and are in the process of
obtaining RPC’s approval for them. There are efforts
to make 18F-FET, for imaging brain tumours, 18F-
Choline and 18F-fluoroethylacetate for prostate
imaging.
What we sorely require is an electrophilic synthesis
module and an 18O2 gas target for making 18F
2 to
produce 18F-FDOPA, with reasonably high specific
activities, to meet the requirements from many
nuclear medicine centres. We also need a full-fledged
nucleophilic fluorination module with a semi-
preparative HPLC and a tongs-manipulator.
However, these appear to be wishful thinking as
presently there is space for just one module that
too with a load restriction of 5 tonnes (instead of a
9 tonne actual requirement).
Severe constraints were experienced on two
occasions due to the non-availability of 18O-water

B A R C N E W S L E T T E RFEATURE ARTICLE
46 I ISSUE NO. 329 I NOV. - DEC. 2012
18O-water is produced only by a few manufacturers
worldwide. Fortunately, the lead author’s training
at Dr. Nebeling’s lab at Hamburg helped. The
technology learnt there was employed to distill the
recovered 18O-water (to remove the solvent
impurities and the long-lived activity leaching from
the target and Havar foils) and the recovered 18O-
water made reusable. Although the target had to
be irradiated for a longer period due to a decreased18O-content in the recovered water, the production
and supply of 18F-FDG continued uninterrupted.
Fig. 2A and B: The cyclotron run is on and radio-
activity will be delivered to hot cell(s) at ~6:15 AM &
~11:00 AM
(A)
(B)
Fig. 2C,D &E: ~7:45 AM & ~12:30 PM The chemists
overseeing the production, aseptic dispensing and
QC of [F-18]FDG
(C)
(D)
(E)

B A R C N E W S L E T T E R FEATURE ARTICLE
ISSUE NO. 329 I NOV. - DEC. 2012 I 47
Two additions that helped the overall GMP are the
installation of an air-shower at the entrance to the
Radiochemistry area and a 20 minute kinetic LAL
test so that the 18F-FDG product is released with this
assurance.
In the cyclotron front, we have upgraded the
radioactive waste-gas compression system, installed
a large capacity oil-free dry air compressor, a
radioactivity monitor at the stack for a real time
assessment of activity released. This showed that the
radioactivity released from the MCF is much below
permissible levels.
Niobium metal, because of its chemical inertness
compared to silver and other metals, is now the
preferred metal for making target cavities. The
advantage is that there are fewer requirements for
target maintenance. However, it is costly and we
have indigenously fabricated and tested a low volume
niobium target cavity for use in the Target No. 2
position. The results are very encouraging and we
will do this for Target No. 4.
We are in process of developing our own PLC-based
synthesis module for 18F-FDG. To begin with, we
have developed a simple PLC-based and a manual
module for making 18F-NaF, which is required daily
by TMH and others. This will make the fluorination
module available for more R&D work.
Fig. 2F: Health Physicist monitoring the [F-18]FDG
consignments ~8:00 AM & ~ 12:00 noon
With the MCF running successfully over the years,
with an uptime close 95%, and the importance of18F-FDG in cancer diagnosis and management well
established, there is confidence in the hospital
management in India that medical cyclotron facilities
are financially viable in India. As a result, over 15
cyclotrons have been installed in the private and public
sectors in the country. However, their requirement
for qualified staff has led to some attrition of physicists
and chemists from our MCF.
Cyclotrons are sturdy machines and are expected to
last for decades. Ours has served us well for a decade.
While the basic design of the magnet, RF system,
ion source, vacuum, and beam extraction has not
changed, what have changed are the electronics,
fluidics and software, which were designed two
decades back (in 1992). What we now have is
reaching obsolescence and spares are not readily
available with the service providers. We need a major
upgrade of these to keep producing 18F-FDG routinely
and meet the growing demands. Space for new
synthesis modules will be required for R&D and to
make other 18F-RPs as per requests.
Our need to find space to put up more synthesis
modules led us to approach Dr. R. Badwe, Director,
TMC to give us space adjoining the MCF. We were
pleasantly surprised by his suggestion that we put
up a full-fledged medical cyclotron facility at ACTREC
in the building planned as a joint Radiation Research
Unit for BARC and ACTREC. This proposal will be a
part of the XII-Plan and the facility will be built around
an 18–20 MeV cyclotron with electrophilic and
nucleophilic fluorination modules, C-11 methylation
modules and modules to make I-124 and Cu-64
labeled radiopharmaceuticals. This will be an
important initiative for sustaining the momentum on
PET-based diagnosis.
(The R&D work done at the MCF has resulted in 7
publications, 9 conference abstracts and chapters in
three IAEA publications.)
(F)
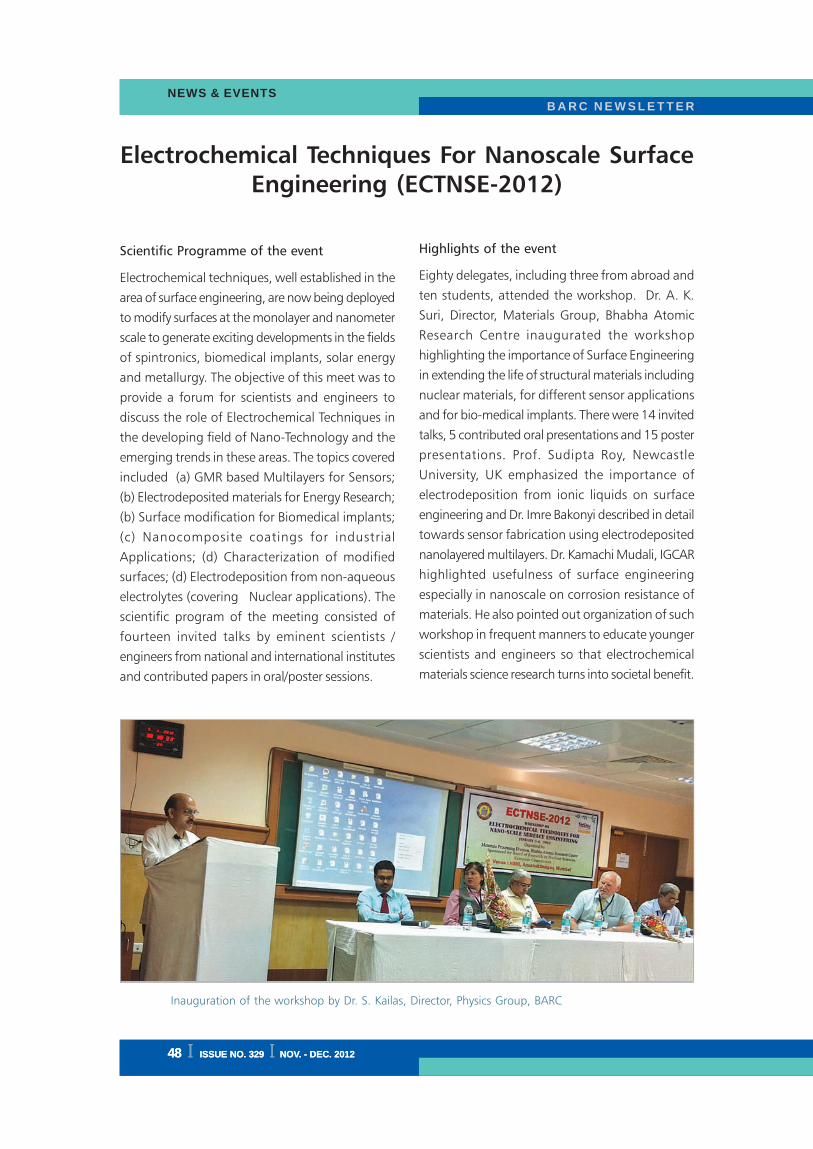
B A R C N E W S L E T T E RRESEARCH ARTICLE
B A R C N E W S L E T T E RNEWS & EVENTS
48 I ISSUE NO. 327 I JULY - AUGUST 201248 I ISSUE NO. 329 I NOV. - DEC. 201248 I ISSUE NO. 329 I NOV. - DEC. 2012
Electrochemical Techniques For Nanoscale Surface
Engineering (ECTNSE-2012)
Scientific Programme of the event
Electrochemical techniques, well established in the
area of surface engineering, are now being deployed
to modify surfaces at the monolayer and nanometer
scale to generate exciting developments in the fields
of spintronics, biomedical implants, solar energy
and metallurgy. The objective of this meet was to
provide a forum for scientists and engineers to
discuss the role of Electrochemical Techniques in
the developing field of Nano-Technology and the
emerging trends in these areas. The topics covered
included (a) GMR based Multilayers for Sensors;
(b) Electrodeposited materials for Energy Research;
(b) Surface modification for Biomedical implants;
(c) Nanocomposite coatings for industrial
Applications; (d) Characterization of modified
surfaces; (d) Electrodeposition from non-aqueous
electrolytes (covering Nuclear applications). The
scientific program of the meeting consisted of
fourteen invited talks by eminent scientists /
engineers from national and international institutes
and contributed papers in oral/poster sessions.
Highlights of the event
Eighty delegates, including three from abroad and
ten students, attended the workshop. Dr. A. K.
Suri, Director, Materials Group, Bhabha Atomic
Research Centre inaugurated the workshop
highlighting the importance of Surface Engineering
in extending the life of structural materials including
nuclear materials, for different sensor applications
and for bio-medical implants. There were 14 invited
talks, 5 contributed oral presentations and 15 poster
presentations. Prof. Sudipta Roy, Newcastle
University, UK emphasized the importance of
electrodeposition from ionic liquids on surface
engineering and Dr. Imre Bakonyi described in detail
towards sensor fabrication using electrodeposited
nanolayered multilayers. Dr. Kamachi Mudali, IGCAR
highlighted usefulness of surface engineering
especially in nanoscale on corrosion resistance of
materials. He also pointed out organization of such
workshop in frequent manners to educate younger
scientists and engineers so that electrochemical
materials science research turns into societal benefit.
Inauguration of the workshop by Dr. s. Kailas, Director, Physics Group, BARCInauguration of the workshop by Dr. S. Kailas, Director, Physics Group, BARC

ISSUE NO. 327 I JULY - AUGUST 2012 I 49ISSUE NO. 329 I NOV. - DEC. 2012 I 49ISSUE NO. 329 I NOV. - DEC. 2012 I 49
B A R C N E W S L E T T E RB A R C N E W S L E T T E R NEWS & EVENTS
BRNS Theme Meeting: A Decade of Operation of
the BARC Medical Cyclotron
A one- day BRNS Theme Meeting was held on 18th
October 2012 to commemorate the 10 years of
successful operation of the first Medical Cyclotron
Facility (MCF) in the country located at the Radiation
Medicine Centre (RMC), Parel. Dr. Ratan Kumar
Sinha, Chairman, Atomic Energy Commission and
Secretary, Department of Atomic Energy delivered
the inaugural address. A booklet highlighting the
history of the MCF, its performance and articles from
its users was released by Dr. Sinha. Dr. Sinha
complimented the men behind the MCF operations
for the excellent performance and services rendered.
The staff members of the MCF drawn from BARC
and BRIT had also been rewarded earlier with the
DAE Group Award for their achievements.
Dr. K.B. Sainis, Director, Bio-Medical Group, in his
opening remarks complimented the MCF Team for
running the facility with a high uptime and supplying
[F-18] FDG to several hospitals in Mumbai and Pune.
Dr. A.K. Kohli, Chief Executive, BRIT, said that the
systematic efforts and commitment of all the MCF
staff, including those who have superannuated, or
left for better prospects, has made the MCF work
reliably and keep the customers satisfied.
The Theme Meeting received reminiscent account
from former colleagues, who played a key role in
executing the IX-Plan Project of setting up the MCF,
apart from learning from the users about patient
services rendered possible with FDG and other F-18
radiopharmaceuticals supplied from the MCF. The
impact PET imaging has had in managing patients
(oncology and non-oncology) was highly
emphasized. There were three Sessions of invited
talks, covering (i) the project phase experience and
the overall progress in the field, (ii) clinical services
and valuable support in management of patients of
cancer and other diseases/disorders and (iii) progress
made in PET-CT imaging systems and detectors and
importance of PET-tracers beyond FDG. M/s GE-
Healthcare India, the supplier of MC to BARC, shared
their valuable learning experience in working with
the MCF team in maintaining the equipment and
the future upgrades that are possible to keep the
cyclotron and its accessories running satisfactorily.
Dr. R.K. Sinha, (second from left) Chairman, AEC, releasing the booklet on the occasion
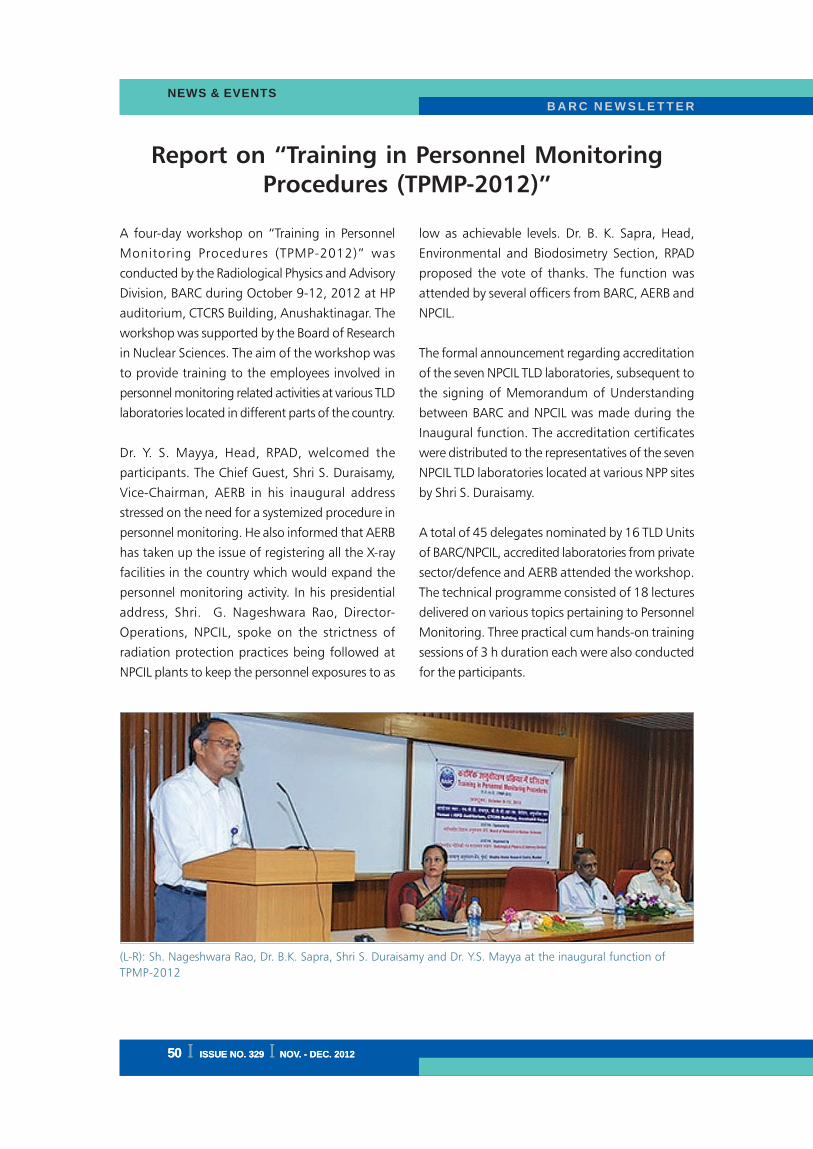
B A R C N E W S L E T T E RRESEARCH ARTICLE
B A R C N E W S L E T T E RNEWS & EVENTS
50 I ISSUE NO. 327 I JULY - AUGUST 201250 I ISSUE NO. 329 I NOV. - DEC. 201250 I ISSUE NO. 329 I NOV. - DEC. 2012
Report on “Training in Personnel Monitoring
Procedures (TPMP-2012)”
A four-day workshop on “Training in Personnel
Monitoring Procedures (TPMP-2012)” was
conducted by the Radiological Physics and Advisory
Division, BARC during October 9-12, 2012 at HP
auditorium, CTCRS Building, Anushaktinagar. The
workshop was supported by the Board of Research
in Nuclear Sciences. The aim of the workshop was
to provide training to the employees involved in
personnel monitoring related activities at various TLD
laboratories located in different parts of the country.
Dr. Y. S. Mayya, Head, RPAD, welcomed the
participants. The Chief Guest, Shri S. Duraisamy,
Vice-Chairman, AERB in his inaugural address
stressed on the need for a systemized procedure in
personnel monitoring. He also informed that AERB
has taken up the issue of registering all the X-ray
facilities in the country which would expand the
personnel monitoring activity. In his presidential
address, Shri. G. Nageshwara Rao, Director-
Operations, NPCIL, spoke on the strictness of
radiation protection practices being followed at
NPCIL plants to keep the personnel exposures to as
low as achievable levels. Dr. B. K. Sapra, Head,
Environmental and Biodosimetry Section, RPAD
proposed the vote of thanks. The function was
attended by several officers from BARC, AERB and
NPCIL.
The formal announcement regarding accreditation
of the seven NPCIL TLD laboratories, subsequent to
the signing of Memorandum of Understanding
between BARC and NPCIL was made during the
Inaugural function. The accreditation certificates
were distributed to the representatives of the seven
NPCIL TLD laboratories located at various NPP sites
by Shri S. Duraisamy.
A total of 45 delegates nominated by 16 TLD Units
of BARC/NPCIL, accredited laboratories from private
sector/defence and AERB attended the workshop.
The technical programme consisted of 18 lectures
delivered on various topics pertaining to Personnel
Monitoring. Three practical cum hands-on training
sessions of 3 h duration each were also conducted
for the participants.
(L-R): Sh. Nageshwara Rao, Dr. B.K. Sapra, Shri S. Duraisamy and Dr. Y.S. Mayya at the inaugural function of
TPMP-2012

ISSUE NO. 327 I JULY - AUGUST 2012 I 51ISSUE NO. 329 I NOV. - DEC. 2012 I 51ISSUE NO. 329 I NOV. - DEC. 2012 I 51
B A R C N E W S L E T T E RB A R C N E W S L E T T E R NEWS & EVENTS
Report on BRNS-Young Scientist Research
Awardees’ Meet (YSRAM)
The Basic Sciences Committee (BSC), BRNS organized
a Young Scientist Research Awardees’ Meet (YSRAM)
in a symposium mode, during November 26-28,
2012 at the Multipurpose Hall, BARC Guest House
and Training School Hostel, Anushaktinagar,
Mumbai. In this Meet, 42 active Principle
Investigators (PI) of the ongoing YSRA projects and
2 PIs who had recently completed their projects,
presented the progress made in their projects.
Besides these PIs, 40 young scientists from BARC,
23 new project proposers and 40 young academics
from various parts of India were delegates to
YSRAM. The technical content of the two day YSRAM
consisted of presentations by PIs of the ongoing
projects and special lectures by experts. The new
YSRA applicants presented their proposals before
experts on 28th November, 2012.
The inaugural function was presided over by Dr. S.
Kailas, Director Physics Group, BARC and Chairman,
BSC, BRNS. Dr. A.V.R. Reddy, Member Secretary,
BSC welcomed all the participants, experts, members
of BRNS and invitees to YSRAM. Dr. Kailas in his
presidential address spoke about BRNS activities
pertaining to basic sciences and collaborative projects
for collective growth. Dr. S.G. Markandeya,
Controller, BARC and Scientific Secretary, BRNS in
his keynote address spoke on Atomic Energy
programme in India and the opportunities in the
Department of Atomic Energy. He also gave an
overview on the Past, Present and future collaborative
R&D activities initiated by BRNS. Dr. Sangeeta,
Programme Officer, BRNS, Dr. N.K. Sahoo, Secretary,
Physics, BRNS and Dr. J.R. Bandekar, Secretary,
Biology, BRNS shared their views and impressions
about BRNS-YSRA scheme. Dr. Kailas released the
pre-proceeding volume and Dr. Markandeya released
the CDs containing the pre-proceeding volume and
PDF files of all the publications of the ongoing YSRA
projects.
Shri Sekhar Basu, Director, BARC, addressing the gathering during
the valedictory function of YSRAM
“….YSRAM is a forum
that provided an
opportunity to young
delegates in the same
age group, with similar
aspirations, to interact
with each other….”

B A R C N E W S L E T T E RRESEARCH ARTICLE
B A R C N E W S L E T T E RANNUAL INDEX
52 I ISSUE NO. 327 I JULY - AUGUST 201252 I ISSUE NO. 329 I NOV. - DEC. 201252 I ISSUE NO. 329 I NOV. - DEC. 2012
Index
January-February 2012
Articles
••••• ANUPAM-Adhya Supercomputer
K. Rajesh, K. Bhatt, D.D. Sonvane, K. Vaibhav, V. Duggal, U. Karnani, N. Chandorkar,
K.R. Koli, R.S. Mundada and A.G. Apte
Computer Division
••••• Biosensors for Environmental and Clinical Monitoring
Jitendra Kumar and S. F. D’Souza
Nuclear Agriculture and Biotechnology Division
••••• Estimation of Shutdown Reactivity in Power Reactor: Comparative Study of Inverse Point
Kinetics and Kalman Filtering
T.U. Bhatt, S.R. Shimjith and A.P. Tiwari
Reactor Control Division
••••• Fuel Handling System Training Simulator for 540 MWe PHWR
Vinaya Kumar
Fuel Handling Control Section, Electronics & Instrumentation Group
••••• Groundwater Contamination Problems in Rural India: Detection and Remediation at the
Household Level
S.C. Chaurasia, A.C. Sahayam, G. Venkateswarlu, S.M. Dhavile, S. Thangavel, L. Rastogi,
T. Mukherjee
Chemistry Group
••••• Ultrasonic Phased Array Examination for BWR Pressure Vessel
N. Jothilakshmi, P.P. Nanekar and B.K. Shah
Quality Assurance Division
••••• Understanding of Ternary Fission in Heavy-Ion Induced Reactions.
Y.K. Gupta, R.K. Choudhury and A. Chatterjee
Nuclear Physics Division
Brief Communications
••••• Four-Piece Servo Manipulator
Design, Manufacturing & Automation Group
••••• Periscope for In-Service Inspection of PFBR
Design, Manufacturing & Automation Group
••••• Single Photon Emission Computed Tomography for Nuclear Applications
Physics Group
••••• TPLC – 32: Trombay 32 bit Programmable Logic Controller Platform
Electronics & Instrumentation Group

ISSUE NO. 327 I JULY - AUGUST 2012 I 53ISSUE NO. 329 I NOV. - DEC. 2012 I 53ISSUE NO. 329 I NOV. - DEC. 2012 I 53
B A R C N E W S L E T T E RB A R C N E W S L E T T E RANNUAL INDEX
March-April 2012
Articles
••••• Design and Application of a Formal Verification Tool for VHDL Designs
Ajith K. John, A.K. Bhattacharjee, Mukesh Sharma, G. Ganesh, S.D. Dhodapkar, B.B. Biswas
Reactor Control Division
••••• Development and Fabrication of LEU Plate Fuel for Modified Core of APSARA Reactor
G. J. Prasad, V. P. Sinha, P.V. Hegde
Metallic Fuels Division
••••• Development of Carbon / Carbon Composites for Nuclear Reactor Applications
Ramani Venugopala, D. Sathiyamoorthy, A K. Tyagi
Powder Metallurgy Division & Chemistry Division
••••• Frontiers in Science of Cutting Edge Technologies: Physics Group in BARC
S. Kailas
Physics Group
••••• Photocatalytic Hydrogen Generation from Water using Solar Radiation
R. Sasikala and S. R. Bharadwaj
Chemistry Division
••••• Searching for the Proverbial Needle in a Haystack: the Information Dilemma
Sangeeta Deokattey and K. Bhanumurthy
Scientific Information Resource Division
••••• Zinc Oxide Nanowires for Gas Sensing Application
Niranjan Ramgir, Niyanta Datta, Manmeet Kaur, S. Kailasaganapathi, A.K. Debnath,
D K. Aswal and S.K. Gupta
Technical Physics Division
Brief Communications
••••• Controlled Uptake and Release of Phototherapeutic Porphyrin Dye using Surface
Functionalized Silver Nanoparticle Conjugates
Chemistry Group
••••• Designing Novel Nanomaterials for Application in Nuclear Waste Management
Chemistry Group
••••• Development of Peptide Mimic Shell Cross-linked Magnetic Nanocarriers for Theragnostic
Applications
Chemistry Group
••••• Hot Vacuum Extraction- Quadrupole Mass Spectrometry (HVE-QMS) for Ageing
Management of Zr-Nb Coolant Channels
Radiochemistry and Isotope Group
••••• Photochemotherapy by Coralyne and UVA (CUVA): A Novel Strategy for
Cancer Management
Chemistry Group

B A R C N E W S L E T T E RRESEARCH ARTICLE
B A R C N E W S L E T T E RANNUAL INDEX
54 I ISSUE NO. 327 I JULY - AUGUST 201254 I ISSUE NO. 329 I NOV. - DEC. 201254 I ISSUE NO. 329 I NOV. - DEC. 2012
••••• Preparation and Characterization of (U0.47
,Pu0.53
)O2 Microspheres for Test Pin Irradiation
in FBTR
Radiochemistry and Isotope Group
May-June 2012
Articles
••••• Characterization of Deformation Microstructure using Transmission Electron Microscopy:
Observation of Cube Slip in γγγγγ-TiAl Alloys at Elevated Temperatures
Jung B. Singh
Mechanical Metallurgy Division
••••• Development of Fluidized Bed Thermal Denitration
Neetu A. Baveja, C.P. Shringi, Gaurav Varshney, Deepa Thomas, Sandip Bhowmick, N.K.
Dandekar, M.Y. Walke and Hanmanth Rao
Chemical Engineering Division
••••• Early Detection of Coronary Heart Disease Using Peripheral Pulse Analyzer
G.D. Jindal, R.K. Jain, Vineet Sinha, Sadhana A. Mandalik, Bhagyashree S. Sarade, Pooja
Tanawade and C.K. Pithawa
Electronics Division
••••• MetProSoft-10: Image Analysis Software for Metallographic Measurements
Lizy Pious, S. Kar and V.M. Joshi
Electronics & Instrumentation Services Division
••••• Passive Gamma Scanning : a Powerful Tool for QC of MOX Fuels
K.V. Vrinda Devi and J.P. Panakkal
Advanced Fuel Fabrication Facility, Nuclear Fuels Group
••••• Studies on Improvements in Thoria Dissolution Process for Reprocessing Application
C. Srinivas, Vrunda Yalmali, A.S. Pente, P.K. Wattal and S.D. Misra
Nuclear Recycle Group
Brief Communications
••••• Development of Metal – Ceramic Seals for Neutron Detectors
Materials Group
••••• Development of Plate Thermometer (PT) or Heat Flux Measurement
Reactor Design & Development Group
••••• Force Reflecting Telerobot
Design Manufacturing & Automation Group
••••• H2-F
2 Flame Reactor Technology for Nuclear Material Processing
Chemical Technology Group

ISSUE NO. 327 I JULY - AUGUST 2012 I 55ISSUE NO. 329 I NOV. - DEC. 2012 I 55ISSUE NO. 329 I NOV. - DEC. 2012 I 55
B A R C N E W S L E T T E RB A R C N E W S L E T T E RANNUAL INDEX
July-August 2012
Articles
••••• Bioremediation: Discovery of a Novel Alkaline Phosphatase through X-Ray
Crystallography
Subhash C. Bihani, Shree Kumar Apte, Jean-Luc Ferrer and Madhusoodan V. Hosur
Solid State Physics Division and Molecular Biology Division
••••• Discovery of Higgs Boson: the God particle
A.K. Mohanty
Nuclear Physics Division
••••• DNA Repair and Recombination Proteins (Dmc1 and Rad51) from Rice (Oryza sativa)
Rajani Kant Chittela and Jayashree K. Sainis
Molecular Biology Division
••••• Improved Location of Earthquakes in Sumatra Region using Gauribidanur Seismic
Array Data
Manoj Kumar and Falguni Roy
Seismology Division
••••• Marx Generator and Reflex Triode based High Power Pulsed Microwave Source
Archana Sharma, Amitava Roy, Sabyasachi Mitra, Vishnu Sharma, S. Singh, Senthil Kumar,
Ankur Patel, Rakhee Menon, Ritu Agrawal, A.K. Ray and D.P. Chakravarthy
Accelerator and Pulse Power Division
••••• Performance Study of Indigenously Developed CsI-Photodiode Linear Array Detectors for
X-Ray Baggage Scanning Application
Anita Topkar, Arvind Singh, P.K. Mukhopadhyay and C.K. Pithawa and Umesh Kumar and
Y. Lakshminarayana
Electronics Division & Isotope Application Division
••••• Recovery of Cesium from High Level Liquid Nuclear Waste by an Advanced Polymer
Composite
Lalit Varshney, V.Venugopal, Amar Kumar, Tessy V. and S.D. Misra
Radiochemistry and Isotope Group and Nuclear Recycle Group
Brief Communications
••••• Design and Development of Metallic Face Seal for AHWR fueling Machine
Reactor Design & Development Group
••••• Development of Continuous Rotary Dissolver (CRD)
Nuclear Recycle Group
••••• Evaluation of Tripodal / Calixarene Based Diglycolamides for Actinide Extraction
Radiochemistry and Isotope Group
••••• Integrated ΔΔΔΔΔ-E Silicon Detector Telescope
Electronics & Instrumentation Group

B A R C N E W S L E T T E RRESEARCH ARTICLE
B A R C N E W S L E T T E RANNUAL INDEX
56 I ISSUE NO. 327 I JULY - AUGUST 201256 I ISSUE NO. 329 I NOV. - DEC. 201256 I ISSUE NO. 329 I NOV. - DEC. 2012
• Decontamination of Alpha Contaminated Metallic Waste by Cerium IV Redox Process
J. G. Shah, P. S. Dhami, P. M. Gandhi and P. K. Wattal
Nuclear Recycle Group
• Design, Development and Deployment of Special Sealing Plug for 540 MWe PHWRs
G. Sharma, S. Roy, R.J. Patel
Refuelling Technology Division
• Genetic Analysis of Type 2 Diabetes.
Suresh KG Shettigar, C. Shailaja and Ratnakar K. Kulkarni
Pathology Unit, Medical Division
• Non-Invasive Blood Pressure Monitor: Beat to Beat
Vineet Sinha, R.K. Jain, G.D. Jindal and C.K. Pithawa
Electronics Division
• Self Assembled Systems: Design and Drug Delivery Perspectives.
Gunjan Verma, Jayita Bhattacharjee and P. A. Hassan
Chemistry Division
Brief Communications
• Development of a 400 keV Radio Frequency Quadrupole
Physics Group
• Tetrofosmin Kits for Myocardial Perfusion Imaging
Radiochemistry and Isotope Group
• Ultrafast Dynamics Investigations: Development of Femtosecond Time-Resolved Infrared
Spectrometer
Chemistry Group
• Unveiling the Mechanism of Extreme Radiation Resistance in Deinococcus radiodurans by
Comparative Proteomics
Bio-Medical Group.
••••• Meso-and B-Substituted Pyrromethene Fluorophores as New Photo-stable Laser Dyes
Chemistry Group
••••• Ultra High Precision Wave Length Scanning Mechanism
Design, Manufacturing and Automation Group
September-October 2012
Articles
••••• Advanced Research on Master Curve for Safety Assessment of Reactor Pressure Vessel
J. Chattopadhyay, B.K. Dutta and K.K.Vaze & S.Acharyya
Reactor Design & Development Group

B A R C N E W S L E T T E R
ISSUE NO. 329 I NOV. - DEC. 2012 I III
BARC Scientists Honoured
Name of Scientist : Dr. Srikumar Banerjee
Homi Bhabha Chair Professor, BARC
Former Chairman, Atomic Energy Commission
Award : 2012 IIM Platinum Medal in recognition of his outstanding life time
contribution to metallurgy profession
Presented by : Indian Institute of Metals, during the 66th Annual Technical Meeting of
IIM
Name of Scientists : Celin Acharya and Shree Kumar Apte
Molecular Biology Division
Title of the paper : Marine cyanobacteria as suitable candidates for uranium recovery
from aquatic environment
Award : Best Oral Presentation Award presented to Dr. Celin Acharya
Presented at : Indo-US workshop on cyanobacteria: Molecular networks to
Biofuels, held at Lonavala, India, during December, 16-20, 2012.
Name of Scientists : Anurag Kirti, Hema Rajaram and Shree Kumar Apte
Molecular Biology Division
Title of the paper : Charcterisation of three single stranded DNA binding (SSB)-like Proteins
from the nitrogen-fixing cyanobacterium Anabaena PCC7120
Award : Best Poster Award presented to Anurag Kirti
Presented at : Indo-US workshop on cyanobacteria: Molecular networks to
Biofuels, held at Lonavala, India, during December 16-20, 2012.
Name of Scientist : Arbind Kumar
Quality Assurance Division
Award : National NDT Award in Recognition of his contribution in Research &
Development in the field of NDE
Presented by : Indian Society for Non-Destructive Testing (ISNT), New Delhi,
10th December 2012.
Name of Scientist : Neena Vilas Jadhav
Radiation Biology and Health Sciences Division
Award : Best Idea Award for presentation on ‘Magnetic nanoparticles for
combinatorial hyperthermia and radiation therapy of cancer.’
Presented at : International Conference on Radiation Biology (ICRB-2012) and 11th
Biennial Meeting of the Indian Society for Radiation Biology held at
Advanced Centre for Treatment, Research and Education in Cancer,
Kharghar, Navi Mumbai, November 22-24, 2012.

Recommended