International Journal of Applied Mathematics, Electronics and Computers 8(4): 163-172, 2020
e-ISSN: 2147-8228
INTERNATIONAL JOURNAL OF APPLIED MATHEMATICS
ELECTRONICS AND COMPUTERS
www.dergipark.org.tr/ijamec
International
Open Access
Volume 08
Issue 04
December, 2020
* Corresponding author. E-mail address: [email protected]
DOI: 10.18100/ijamec.804049
Research Article
Submersible Pump Vortex Detection Using Image Processing Technique and
Neuro-Fuzzy
Akif Durdu a , Nuri Orhan b , Seyit Alperen Çeltek c , Muhammet Fatih Aslan d , Kadir
Sabanci d,*
aRobotics Automation Control Laboratory (RAC-LAB), Electrical and Electronics Engineering, Konya Technical University, 42075, Konya, Turkey bDepartment of Agricultural Machinery and Technologies Engineering, Selcuk University, 42075, Konya, Turkey cDepartment of Energy Systems Engineering, Karamanoglu Mehmetbey University, 70100, Karaman, Turkey dDepartment of Electrical and Electronics Engineering, Karamanoglu Mehmetbey University, 70100, Karaman, Turkey.
ARTICLE INFO ABSTRACT
Article history:
Received 1 October 2020
Accepted 5 November 2020
The vortex means the mass of air or water that spins around very fast that often faced in the
agriculture irrigation systems used the pump. The undesired effects like loss of hydraulic
performance, erosion, vibration and noise may occur because of the vortex in pump systems. It is
important to detect and prevent vortex for the economic life and efficiency of the agriculture pump.
The image processing and neuro-fuzzy based novel model is proposed for the detection of a vortex
in the deep well pump used in the agriculture system with this paper. The used images and data -
submergence, flow rate, the diameter of the pipe, power consumption, pressure values and noise
values- is acquired from an experimental pump. The proposed approach consists of three steps;
Neuro-Fuzzy Learning, Image Processing and Neuro-Fuzzy Testing. In the first step, the eighty-
two data have employed for the training process of the Neuro-Fuzzy. Then, the images derived
from a camera placed near the experimental pump are used to detect vortex in the image processing
step. Finally, the relevant data to vortex cases have employed for the testing process of the Neuro-
Fuzzy. The result of this study demonstrates that image processing and neuro-fuzzy based design
can be successfully used to detect vortex formation. This paper has provided novel contributions
in the vortex detection issue such as find out vortex cases by using image processing and Neuro-
Fuzzy. The image processing method has shed light on the studies to be done in the classification
of vortexes and the measurement of their strength.
This is an open access article under the CC BY-SA 4.0 license.
(https://creativecommons.org/licenses/by-sa/4.0/)
Keywords: Image Processing Technique
Adaptive Neural Fuzzy
Network Vortex Detection
Submergence
1. Introduction
The submersible deep well pumps are one of the most used
irrigation systems in the agriculture field. So, the pump's
efficient operation is a significant factor for modern
agriculture. The vortex is one of the factors that adversely
affect the efficiency of the pump can occur due to pumps are
placed at low submergence. The vortex causes that the air
inlet interferes with the pump wing. Then, it affects
negatively the efficiency and economic life of the pump [1].
The vortex formed by the effect of the diameter and height
of the water inlet pipe in the pumps causes the pressure of
the pump to decrease and to work more loudly [2, 3]. Also,
the vortex of deep well pumps causes the cavitation that is a
physical effect that adversely affects performance in pump
applications, causes abrasions in pump elements and causes
severe reductions in pump life [4]. To prevent vortex
formation, the submersible deep well pumps must be
operated at the safe boundary[5].
The vortex cavitation directly depends on the
submergence. Also, vortex causes the pump to operate
loudly and vibration [6]. The noise and vibration caused by
the pressure changes cause the pump to move away from the
optimum efficiency point [7, 8]. In the case of the vortex of
pumps the noise levels that occur are different values
according to the cavitation-free state. The noise frequency

Durdu et al., International Journal of Applied Mathematics Electronics and Computers 08(04): 163-172, 2020
- 164 -
and levels in the case of vortex cavitation are specified as
147 Hz to 70-80 dBA [9]. It is also indicated that noise level
is differentiated in the case of vortex cavitation-free
operation and vortex cavitation estimation can be done from
noise level measurements [9]. So, immersion depth, noise
and pressure are important parameters to observe various
types of the vortex and determine the beginning of vortex.
An artificial intelligence (AI) and image processing-based
approach to determine the vortex problem in deep well
pumps is proposed with this paper. The AI-based methods
are being developed as an alternative approach for problem
detection in many engineering applications. An example of
this is to analyze the signal obtained from the vibration by
means of fuzzy logic [10, 11]. It is proposed a model for the
fault detection of a pumping system using a feed forward
network with back propagation algorithm and binary
adaptive resonance network [12]. The Support Vector
Machines (SVMs) based model for detecting and classifying
pump faults is presented [13]. The hybrid approach that
consists of the decision tree and fuzzy classifier is proposed
for creating rules from statistical parameters extracted from
vibration signals under both conditions (good and
faulty)[14]. It has been used as an artificial immune
recognition system for the fault classification of the
centrifugal pump [15]. The fuzzy neural network has used
for classification to determine errors and differentiate
between error type[16]. The other study illustrated an
artificial neural network (ANN)-based approach for fault
detection and identification in gearboxes[17]. It is discussed
an ANFIS based error diagnosis model for induction motor
[18].
In this study, an approach to detect vortex cavitation in
submersible pumps using adaptive neural fuzzy networks is
presented. The presented study is outlined as follows Section
2 describes the data collection system that enables the
acquisition of the experimental environment and the data
used in this study. In section 3, adaptive neural fuzzy
networks are defined and their layers are given in detail. The
networks, network structures and parameters used to
determine cavitation in the pumps are described in Section 4.
Section 5 concludes the manuscript.
2. Material and Method
2.1. Model of Experimental Pump
This study was carried out in the Department of
Agricultural Machinery and Technology Engineering of the
Faculty of Agriculture of Selcuk University in the Deep Well
Pump Test Tower (Figure 1), which was established under
the project number TUBITAK 213O140. As seen in Figure
1, an experimental setup was developed to study the behavior
of water in deep wells during pumping in deep wells. In the
different submergence, the speed of the water at different
points of the well and the pump, the output pressure of the
pump, the level of fall in the well, the power the pump draws
from the network, and the noise level generated is
instantaneously measured. In addition, water movements
detected by video cameras (K1-K2) located at two different
points of the well were recorded. Pump submergence (S),
flow rate (Q), pump diameter (D), power consumption (N),
pressure values (P) and noise (G) values obtained from the
experimental environment were used in network training.
Figure 1. Deep well pump test tower and installations
A typical submersible deep well pump placed in the well
is given in Figure 2 as the basic elevation terms appropriate
to the terminology.
Figure 2. Deep well characteristic curve and basic height terms
Technical specifications for the submersible deep well
pumps used in present experiments are provided in Table 1.
For pump actuation, 4 kW motor was used for D1 pump and
5.5 kW motors were used for D2 and D3 pumps. Technical
specifications for measurement devices used in present
experiments are provided in Table 2.
Durdu et al., International Journal of Applied Mathematics Electronics and Computers 08(04): 163-172, 2020
- 165 -
Table 1. Technical specifications for submersible pumps
Technical specifications D1 D2 D3
Pump outside diameter (mm) 152.4 177.8 203.2
Pump material (TSE EN
1591)
Cast
iron
Cast
iron
Cast
iron
Pump shaft material Stainless
steel
Stainless
steel
Stainless
steel
Pump shaft diameter (mm) 25 25 30
Pump number of stages 2 1 1
Number of blades 5 7 6
Blade thickness (mm) 5 5 5
Impeller outlet diameter
(mm) 94.5 140 150
Impeller outlet width (mm) 15 16 20
Table 2. Technical specifications for measurement devices
Device Technical specifications
Flow meter
S MAG 100 TİP, DN 80-100-125 flange
connection electromagnetic flow meter, 220 V
supplied digital indicator, instant flow, percent
flow, total flow indicators. Adjustable 4-20
m/A plus and frequency output. Measurement
error: 0.5%.
Manometer WİKA, 0-10 bar, Bottom installed, 4-20 m/A
output.
Water level
meter
Hydrotechnik brand, 010 type/1,5 V, 150 m
scaled cable, voice and light indicator type.
Velocimeter
FLS brand, F3.00 winged-type, measurement
range 0.1-8 m s-1, accuracy ± %0.75, output
type: pulse.
Noise Sensor
CT-2012 model, input 4 mA, DC 24V power
supply output indicator. Sound level
Transmitter model : TR-SLT1A4,
Measurement range:30-80 dB, 50-100 dB, 80-
130 dB, output 4-20 mA, 90-260 ACV
50Hz/60Hz, Operation temperature 0-50 0C.
Temperature
sensors
Turck brand, 10-24 VDC, -50...100 0C, 4-
20mA output.
Computer Asus intel core i7
Test assembly with deep wells equipment is high 10 m.
Test assembly is kept constant during trials 4 m plexiglass
pipe and 2 m well screen pipe from the bottom, 4 m steel
casing pipe. Besides around the well screen pipe of 10 cm
in width has filled with gravel which bulk density 1,54 kg m-
3 geometrical diameter between 7-15 mm. Thus, it has
formed environmental working of a deep well. The
submersible pump has mounted form may seem at plexiglass
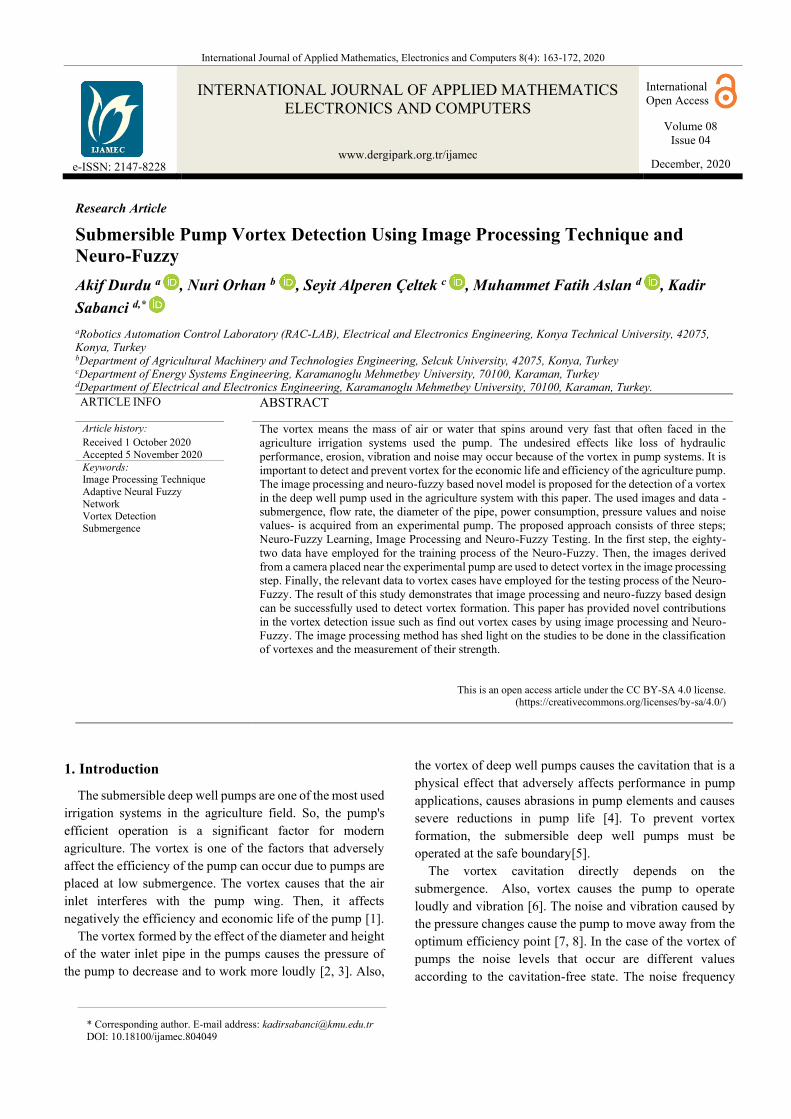
pipe 2 m column pipe by connecting (Figure 3).
Figure 3. Submersible pump and connection of the camera
The standard of EN ISO 9906 is used for measurements
and calculations of the pump operating characteristics and
the standard of EN ISO 3740 is a measurement of the noise
level. The noise meter which is next to the drain header has
remained stationary throughout the whole measurement.
Two cameras for side-view and top-view are used to view
the vortex cavitation. The place of the camera for top-view
is changed according to the water level and the camera angle.
The side camera is connected to the outside of the transparent
pipe in order to track the pump-inlet and the of vortex
cavitation (See Figure 3).
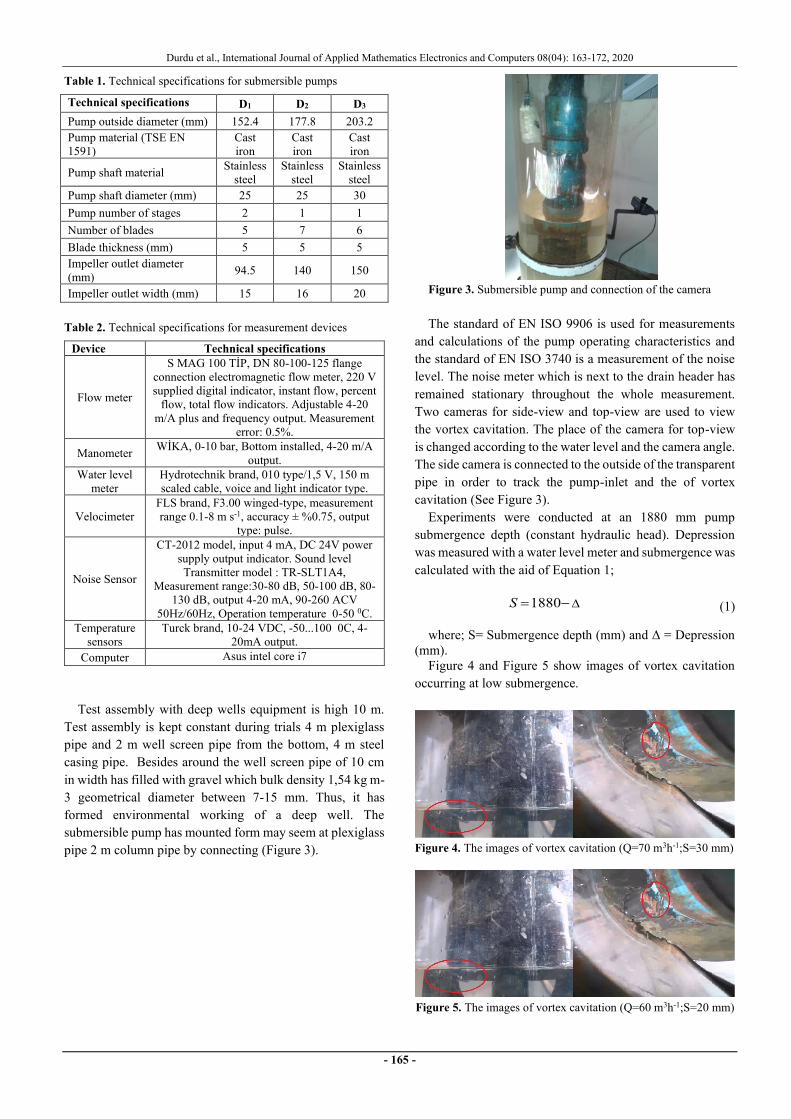
Experiments were conducted at an 1880 mm pump
submergence depth (constant hydraulic head). Depression
was measured with a water level meter and submergence was
calculated with the aid of Equation 1;
−=1880S (1)
where; S= Submergence depth (mm) and Δ = Depression
(mm).
Figure 4 and Figure 5 show images of vortex cavitation
occurring at low submergence.
Figure 4. The images of vortex cavitation (Q=70 m3h-1;S=30 mm)
Figure 5. The images of vortex cavitation (Q=60 m3h-1;S=20 mm)
Durdu et al., International Journal of Applied Mathematics Electronics and Computers 08(04): 163-172, 2020
- 166 -
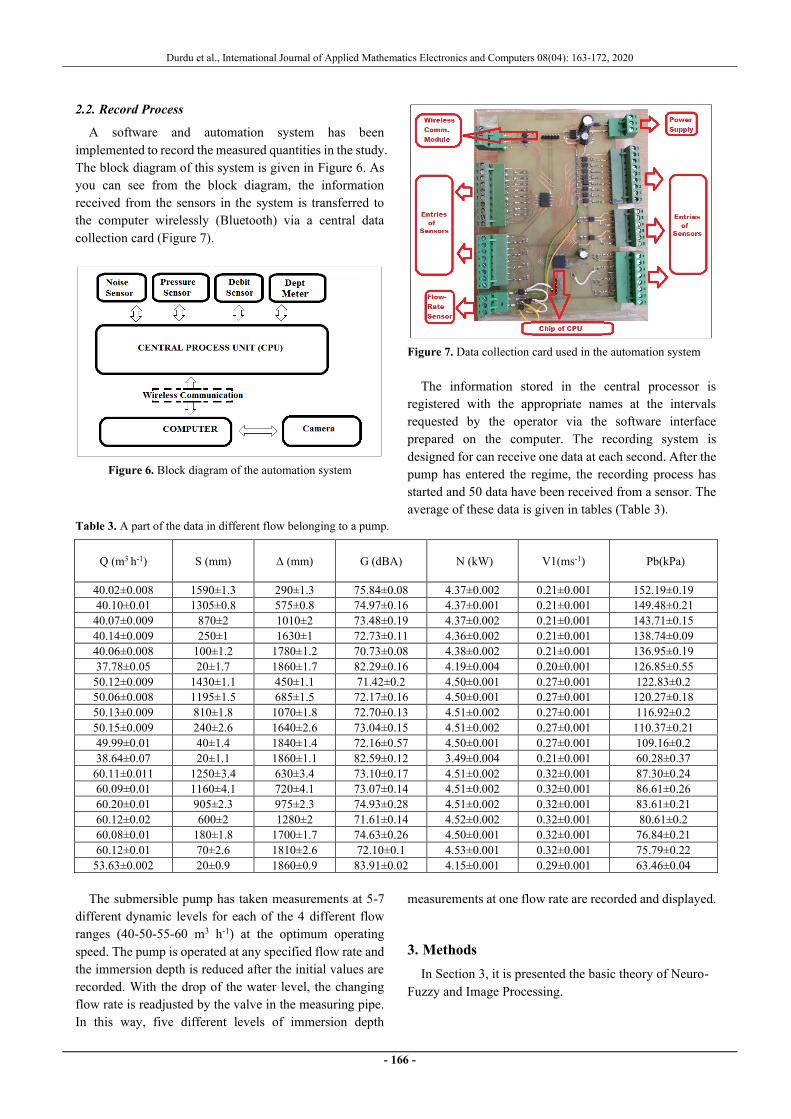
2.2. Record Process
A software and automation system has been
implemented to record the measured quantities in the study.
The block diagram of this system is given in Figure 6. As
you can see from the block diagram, the information
received from the sensors in the system is transferred to
the computer wirelessly (Bluetooth) via a central data
collection card (Figure 7).
Figure 6. Block diagram of the automation system
Figure 7. Data collection card used in the automation system
The information stored in the central processor is
registered with the appropriate names at the intervals
requested by the operator via the software interface
prepared on the computer. The recording system is
designed for can receive one data at each second. After the
pump has entered the regime, the recording process has
started and 50 data have been received from a sensor. The
average of these data is given in tables (Table 3).
Table 3. A part of the data in different flow belonging to a pump.
Q (m3 h-1) S (mm) Δ (mm) G (dBA) N (kW) V1(ms-1) Pb(kPa)
40.02±0.008 1590±1.3 290±1.3 75.84±0.08 4.37±0.002 0.21±0.001 152.19±0.19
40.10±0.01 1305±0.8 575±0.8 74.97±0.16 4.37±0.001 0.21±0.001 149.48±0.21
40.07±0.009 870±2 1010±2 73.48±0.19 4.37±0.002 0.21±0.001 143.71±0.15
40.14±0.009 250±1 1630±1 72.73±0.11 4.36±0.002 0.21±0.001 138.74±0.09
40.06±0.008 100±1.2 1780±1.2 70.73±0.08 4.38±0.002 0.21±0.001 136.95±0.19
37.78±0.05 20±1.7 1860±1.7 82.29±0.16 4.19±0.004 0.20±0.001 126.85±0.55
50.12±0.009 1430±1.1 450±1.1 71.42±0.2 4.50±0.001 0.27±0.001 122.83±0.2
50.06±0.008 1195±1.5 685±1.5 72.17±0.16 4.50±0.001 0.27±0.001 120.27±0.18
50.13±0.009 810±1.8 1070±1.8 72.70±0.13 4.51±0.002 0.27±0.001 116.92±0.2
50.15±0.009 240±2.6 1640±2.6 73.04±0.15 4.51±0.002 0.27±0.001 110.37±0.21
49.99±0.01 40±1.4 1840±1.4 72.16±0.57 4.50±0.001 0.27±0.001 109.16±0.2
38.64±0.07 20±1.1 1860±1.1 82.59±0.12 3.49±0.004 0.21±0.001 60.28±0.37
60.11±0.011 1250±3.4 630±3.4 73.10±0.17 4.51±0.002 0.32±0.001 87.30±0.24
60.09±0.01 1160±4.1 720±4.1 73.07±0.14 4.51±0.002 0.32±0.001 86.61±0.26
60.20±0.01 905±2.3 975±2.3 74.93±0.28 4.51±0.002 0.32±0.001 83.61±0.21
60.12±0.02 600±2 1280±2 71.61±0.14 4.52±0.002 0.32±0.001 80.61±0.2
60.08±0.01 180±1.8 1700±1.7 74.63±0.26 4.50±0.001 0.32±0.001 76.84±0.21
60.12±0.01 70±2.6 1810±2.6 72.10±0.1 4.53±0.001 0.32±0.001 75.79±0.22
53.63±0.002 20±0.9 1860±0.9 83.91±0.02 4.15±0.001 0.29±0.001 63.46±0.04
The submersible pump has taken measurements at 5-7
different dynamic levels for each of the 4 different flow
ranges (40-50-55-60 m3 h-1) at the optimum operating
speed. The pump is operated at any specified flow rate and
the immersion depth is reduced after the initial values are
recorded. With the drop of the water level, the changing
flow rate is readjusted by the valve in the measuring pipe.
In this way, five different levels of immersion depth
measurements at one flow rate are recorded and displayed.
3. Methods
In Section 3, it is presented the basic theory of Neuro-
Fuzzy and Image Processing.

Durdu et al., International Journal of Applied Mathematics Electronics and Computers 08(04): 163-172, 2020
- 167 -
3.1. Neuro-Fuzzy
Detailed coverage of Neuro-Fuzzy -also known as
ANFIS- can be found in [19, 20]. An adaptive neuro-fuzzy
inference system (ANFIS) developed by Jang is a hybrid
artificial intelligence method that uses parallel computing
and learning the ability of artificial neural networks and
fuzzy logic extraction [20, 21]. ANFIS consists of if-then
rules and couples of input-output which as a part of fuzzy
logic. The learning algorithms of the neural network are
used for the training process in the ANFIS model [22-25].
Adaptive networks consist of directly connected nodes
[26]. Each node represents a processing unit. The links
between the nodes indicate an irrelevant (weight) value
between them that is not quite obvious. Adaptation is
established by determining the outputs of these nodes with
variable parameters. The learning rules determine how the
variable parameters change the difference between the
output of the entire network and the target value (the
minimized error value).
ANFIS is one of the very powerful approaches to
establishing a complex, nonlinear relationship between a
set of input and output data sets [27]. ANFIS consists of a
set of rules and input/output information pairs in the fuzzy
inference system [28]. ANFIS can make rules for the
problem or make use of expert opinions to create rules
possible.
Figure 8. ANFIS architecture
The ANFIS’ architecture with two inputs and one output
is as shown in Figure 8. ANFIS architecture consists of 5
different layers [20, 24, 29]. These layers are as follows;
Layer 1: It is also called the fuzzification layer. The
fuzzification layer fuzzyfies the input signals. The output
of each node consists of membership values that depend
on the input values and the membership function used.
The node output is the result of a predetermined
membership function.
Layer 2: Rule layer. Each node in this layer represents
the rules and number of rules generated by the fuzzy logic
inference system.
Layer 3: Normalization layer. Each node in this layer
accepts all nodes coming from the rule layer as input
values and calculates the normalized value of each rule.
Layer 4: Defuzzification layer. The weighted result
values of a given rule are calculated at each node in the
defuzzification layer. The parameters in this layer are
called result parameters.
Layer 5: This layer has only one node and is labeled
with Σ. Here, the output value of each node in the fourth
layer is summed up, resulting in the real value of the
ANFIS system.
The most important parameters of an ANFIS structure
are the initial and result parameters. The data to be used in
education are introduced to the artificial neural network
and the input-output functional relation of the training data
is best learned with a random training algorithm. This is an
optimization process. It is aimed to determine the
minimum conditions (difference function) between the
model output and the output of the training data, that is, to
determine the appropriate values of the parameters [29].
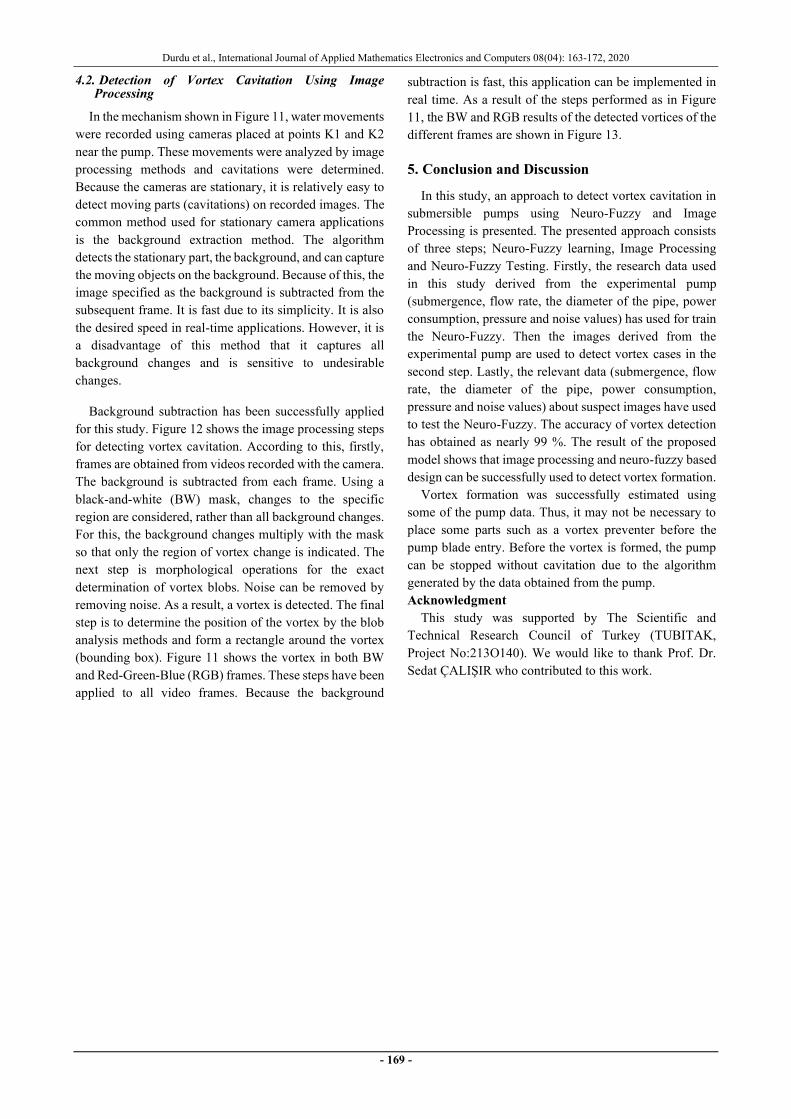
3.2. Image Processing
In today's technology, it is easy to create images and
videos or to access images and videos. The interpretation
of human being by seeing their surroundings revealed the
idea that images and videos can be used for decision-
making, detection, recognition, etc. purposes. The
resulting image processing area includes all kinds of
mathematical operations on the image or video frame.
Using image processing, the image is processed to obtain
the desired results, resulting in either a new image or
numerical values (e.g. features). Obtaining numerical
values is called computer vision. Denoising, image
enhancement, image restoration, image segmentation,
feature extraction, object recognition etc. tasks are
performed using image processing [30, 31]. These tasks
are used for different purposes in many different areas
such as security [32], medical [33, 34], military [35],
agricultural [36, 37], robotics [38].
Durdu et al., International Journal of Applied Mathematics Electronics and Computers 08(04): 163-172, 2020
- 168 -
Camera
(Raw image)Segmentation
Object
Detection
Image
Enhancement
Filtering
Morphological
Proprocessing
Preprocessing
Object
Recognition
Figure 9. Block diagram of image processing
From a computer's point of view, the image consists of
a foreground of objects of interest and background
representing everything except the foreground. If both of
these can be strongly parsed, object detection and object
recognition tasks are completed successfully. While object
detection determines the existence and location of an
object, object recognition identifies the class to which the
object belongs [39]. Both are a fundamental requirement
that most computer and robot vision systems need.
However, successful object recognition depends on object
detection. The general image processing steps for object
recognition are shown in Figure 9. As a result of recent
studies, there has been rapid and successful progress for
both tasks. The strongest reason for this is the development
of computer performance and therefore the successful
implementation of machine learning methods [40]. Using
machine learning methods, the presence or classification
of an object or event can be easily accomplished.
4. Submersible Pump Vortex Detection Using
Image Processing Technique and Neuro-
Fuzzy
The proposed submersible pump vortex detection using
Image Processing and Neuro-Fuzzy approach consists of
three steps; Neuro-Fuzzy Learning, Image Processing and
Neuro-Fuzzy Testing.
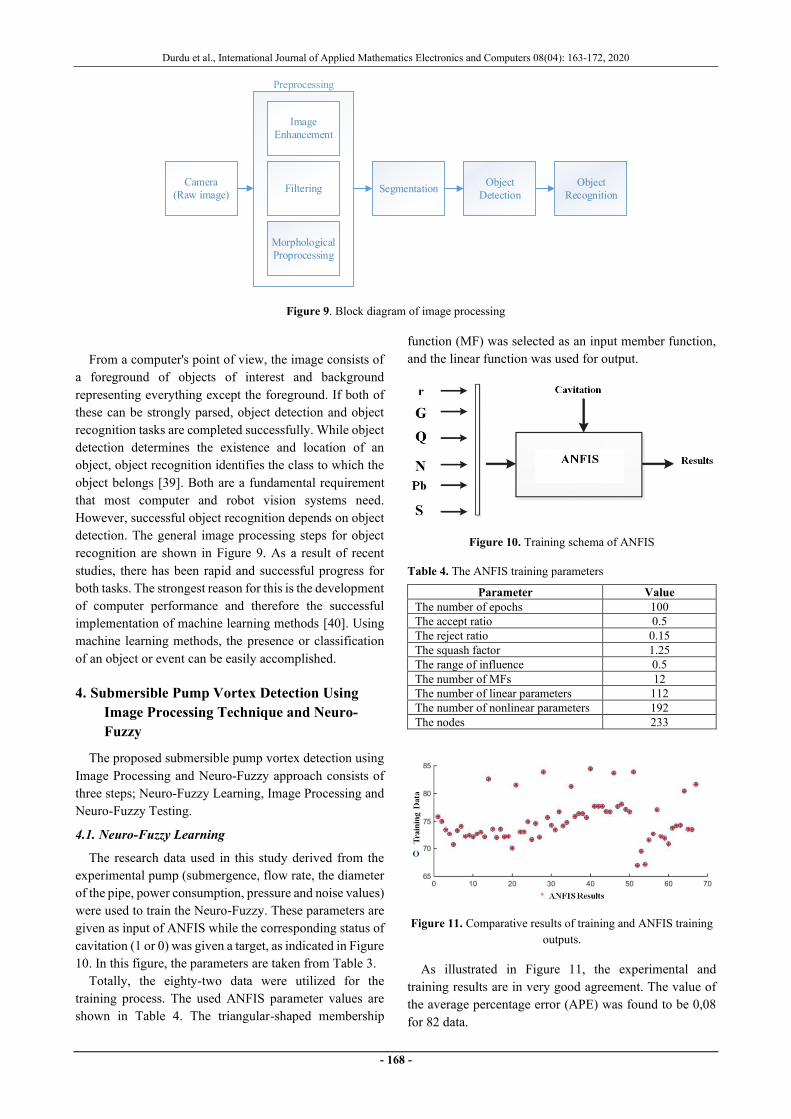
4.1. Neuro-Fuzzy Learning
The research data used in this study derived from the
experimental pump (submergence, flow rate, the diameter
of the pipe, power consumption, pressure and noise values)
were used to train the Neuro-Fuzzy. These parameters are
given as input of ANFIS while the corresponding status of
cavitation (1 or 0) was given a target, as indicated in Figure
10. In this figure, the parameters are taken from Table 3.
Totally, the eighty-two data were utilized for the
training process. The used ANFIS parameter values are
shown in Table 4. The triangular-shaped membership
function (MF) was selected as an input member function,
and the linear function was used for output.
Figure 10. Training schema of ANFIS
Table 4. The ANFIS training parameters
Parameter Value
The number of epochs 100
The accept ratio 0.5
The reject ratio 0.15
The squash factor 1.25
The range of influence 0.5
The number of MFs 12
The number of linear parameters 112
The number of nonlinear parameters 192
The nodes 233
Figure 11. Comparative results of training and ANFIS training
outputs.
As illustrated in Figure 11, the experimental and
training results are in very good agreement. The value of
the average percentage error (APE) was found to be 0,08
for 82 data.
Durdu et al., International Journal of Applied Mathematics Electronics and Computers 08(04): 163-172, 2020
- 169 -
4.2. Detection of Vortex Cavitation Using Image Processing
In the mechanism shown in Figure 11, water movements
were recorded using cameras placed at points K1 and K2
near the pump. These movements were analyzed by image
processing methods and cavitations were determined.
Because the cameras are stationary, it is relatively easy to
detect moving parts (cavitations) on recorded images. The
common method used for stationary camera applications
is the background extraction method. The algorithm
detects the stationary part, the background, and can capture
the moving objects on the background. Because of this, the
image specified as the background is subtracted from the
subsequent frame. It is fast due to its simplicity. It is also
the desired speed in real-time applications. However, it is
a disadvantage of this method that it captures all
background changes and is sensitive to undesirable
changes.
Background subtraction has been successfully applied
for this study. Figure 12 shows the image processing steps
for detecting vortex cavitation. According to this, firstly,
frames are obtained from videos recorded with the camera.
The background is subtracted from each frame. Using a
black-and-white (BW) mask, changes to the specific
region are considered, rather than all background changes.
For this, the background changes multiply with the mask
so that only the region of vortex change is indicated. The
next step is morphological operations for the exact
determination of vortex blobs. Noise can be removed by
removing noise. As a result, a vortex is detected. The final
step is to determine the position of the vortex by the blob
analysis methods and form a rectangle around the vortex
(bounding box). Figure 11 shows the vortex in both BW
and Red-Green-Blue (RGB) frames. These steps have been
applied to all video frames. Because the background
subtraction is fast, this application can be implemented in
real time. As a result of the steps performed as in Figure
11, the BW and RGB results of the detected vortices of the
different frames are shown in Figure 13.
5. Conclusion and Discussion
In this study, an approach to detect vortex cavitation in
submersible pumps using Neuro-Fuzzy and Image
Processing is presented. The presented approach consists
of three steps; Neuro-Fuzzy learning, Image Processing
and Neuro-Fuzzy Testing. Firstly, the research data used
in this study derived from the experimental pump
(submergence, flow rate, the diameter of the pipe, power
consumption, pressure and noise values) has used for train
the Neuro-Fuzzy. Then the images derived from the
experimental pump are used to detect vortex cases in the
second step. Lastly, the relevant data (submergence, flow
rate, the diameter of the pipe, power consumption,
pressure and noise values) about suspect images have used
to test the Neuro-Fuzzy. The accuracy of vortex detection
has obtained as nearly 99 %. The result of the proposed
model shows that image processing and neuro-fuzzy based
design can be successfully used to detect vortex formation.
Vortex formation was successfully estimated using
some of the pump data. Thus, it may not be necessary to
place some parts such as a vortex preventer before the
pump blade entry. Before the vortex is formed, the pump
can be stopped without cavitation due to the algorithm
generated by the data obtained from the pump.
Acknowledgment
This study was supported by The Scientific and
Technical Research Council of Turkey (TUBITAK,
Project No:213O140). We would like to thank Prof. Dr.
Sedat ÇALIŞIR who contributed to this work.

Durdu et al., International Journal of Applied Mathematics Electronics and Computers 08(04): 163-172, 2020
- 170 -
Video Frame
Background
Subtraction
MaskingMultiplication
Morphological
Operations
Noise
Removal
Detection of
Vortex
(BW)
Detection of
Vortex
(RGB)
Figure 12. Image processing steps
Figure 13. Some frames of the detected vortex
Durdu et al., International Journal of Applied Mathematics Electronics and Computers 08(04): 163-172, 2020
- 171 -
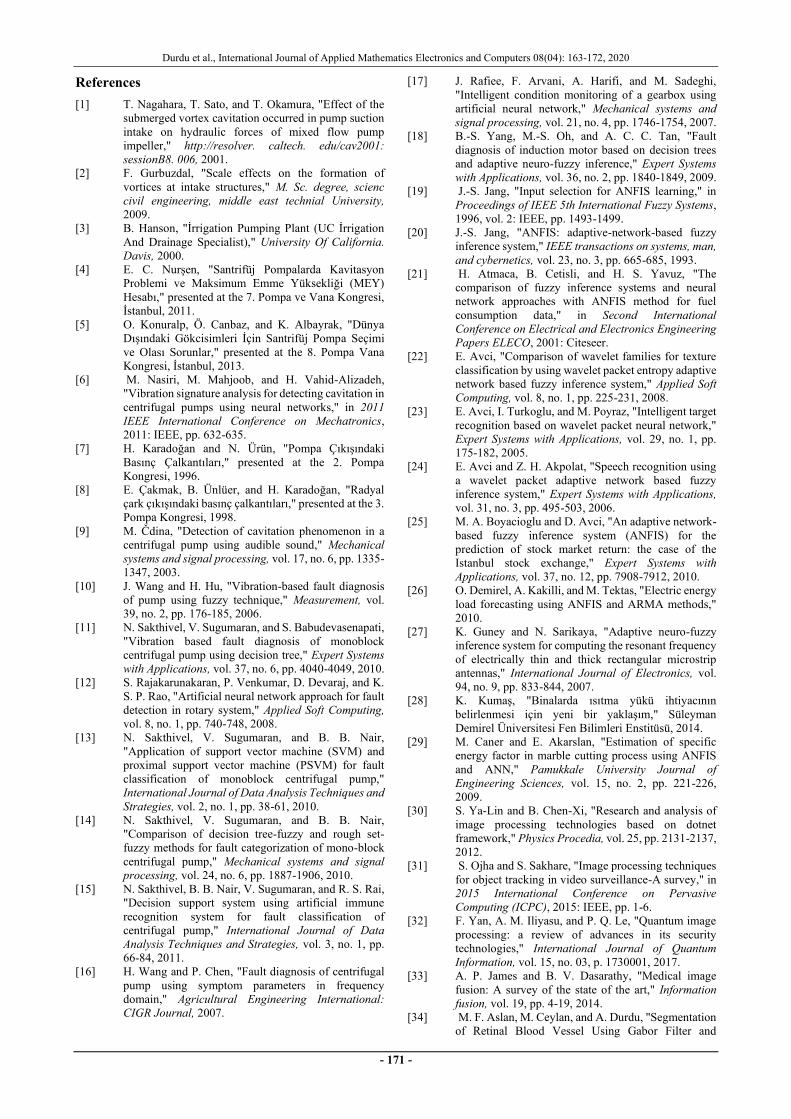
References
[1] T. Nagahara, T. Sato, and T. Okamura, "Effect of the
submerged vortex cavitation occurred in pump suction
intake on hydraulic forces of mixed flow pump
impeller," http://resolver. caltech. edu/cav2001:
sessionB8. 006, 2001.
[2] F. Gurbuzdal, "Scale effects on the formation of
vortices at intake structures," M. Sc. degree, scienc
civil engineering, middle east technial University,
2009.
[3] B. Hanson, "İrrigation Pumping Plant (UC İrrigation
And Drainage Specialist)," University Of California.
Davis, 2000.
[4] E. C. Nurşen, "Santrifüj Pompalarda Kavitasyon
Problemi ve Maksimum Emme Yüksekliği (MEY)
Hesabı," presented at the 7. Pompa ve Vana Kongresi,
İstanbul, 2011.
[5] O. Konuralp, Ö. Canbaz, and K. Albayrak, "Dünya
Dışındaki Gökcisimleri İçin Santrifüj Pompa Seçimi
ve Olası Sorunlar," presented at the 8. Pompa Vana
Kongresi, İstanbul, 2013.
[6] M. Nasiri, M. Mahjoob, and H. Vahid-Alizadeh,
"Vibration signature analysis for detecting cavitation in
centrifugal pumps using neural networks," in 2011
IEEE International Conference on Mechatronics,
2011: IEEE, pp. 632-635.
[7] H. Karadoğan and N. Ürün, "Pompa Çıkışındaki
Basınç Çalkantıları," presented at the 2. Pompa
Kongresi, 1996.
[8] E. Çakmak, B. Ünlüer, and H. Karadoğan, "Radyal
çark çıkışındaki basınç çalkantıları," presented at the 3.
Pompa Kongresi, 1998.
[9] M. Čdina, "Detection of cavitation phenomenon in a
centrifugal pump using audible sound," Mechanical
systems and signal processing, vol. 17, no. 6, pp. 1335-
1347, 2003.
[10] J. Wang and H. Hu, "Vibration-based fault diagnosis
of pump using fuzzy technique," Measurement, vol.
39, no. 2, pp. 176-185, 2006.
[11] N. Sakthivel, V. Sugumaran, and S. Babudevasenapati,
"Vibration based fault diagnosis of monoblock
centrifugal pump using decision tree," Expert Systems
with Applications, vol. 37, no. 6, pp. 4040-4049, 2010.
[12] S. Rajakarunakaran, P. Venkumar, D. Devaraj, and K.
S. P. Rao, "Artificial neural network approach for fault
detection in rotary system," Applied Soft Computing,
vol. 8, no. 1, pp. 740-748, 2008.
[13] N. Sakthivel, V. Sugumaran, and B. B. Nair,
"Application of support vector machine (SVM) and
proximal support vector machine (PSVM) for fault
classification of monoblock centrifugal pump,"
International Journal of Data Analysis Techniques and
Strategies, vol. 2, no. 1, pp. 38-61, 2010.
[14] N. Sakthivel, V. Sugumaran, and B. B. Nair,
"Comparison of decision tree-fuzzy and rough set-
fuzzy methods for fault categorization of mono-block
centrifugal pump," Mechanical systems and signal
processing, vol. 24, no. 6, pp. 1887-1906, 2010.
[15] N. Sakthivel, B. B. Nair, V. Sugumaran, and R. S. Rai,
"Decision support system using artificial immune
recognition system for fault classification of
centrifugal pump," International Journal of Data
Analysis Techniques and Strategies, vol. 3, no. 1, pp.
66-84, 2011.
[16] H. Wang and P. Chen, "Fault diagnosis of centrifugal
pump using symptom parameters in frequency
domain," Agricultural Engineering International:
CIGR Journal, 2007.
[17] J. Rafiee, F. Arvani, A. Harifi, and M. Sadeghi,
"Intelligent condition monitoring of a gearbox using
artificial neural network," Mechanical systems and
signal processing, vol. 21, no. 4, pp. 1746-1754, 2007.
[18] B.-S. Yang, M.-S. Oh, and A. C. C. Tan, "Fault
diagnosis of induction motor based on decision trees
and adaptive neuro-fuzzy inference," Expert Systems
with Applications, vol. 36, no. 2, pp. 1840-1849, 2009.
[19] J.-S. Jang, "Input selection for ANFIS learning," in
Proceedings of IEEE 5th International Fuzzy Systems,
1996, vol. 2: IEEE, pp. 1493-1499.
[20] J.-S. Jang, "ANFIS: adaptive-network-based fuzzy
inference system," IEEE transactions on systems, man,
and cybernetics, vol. 23, no. 3, pp. 665-685, 1993.
[21] H. Atmaca, B. Cetisli, and H. S. Yavuz, "The
comparison of fuzzy inference systems and neural
network approaches with ANFIS method for fuel
consumption data," in Second International
Conference on Electrical and Electronics Engineering
Papers ELECO, 2001: Citeseer.
[22] E. Avci, "Comparison of wavelet families for texture
classification by using wavelet packet entropy adaptive
network based fuzzy inference system," Applied Soft
Computing, vol. 8, no. 1, pp. 225-231, 2008.
[23] E. Avci, I. Turkoglu, and M. Poyraz, "Intelligent target
recognition based on wavelet packet neural network,"
Expert Systems with Applications, vol. 29, no. 1, pp.
175-182, 2005.
[24] E. Avci and Z. H. Akpolat, "Speech recognition using
a wavelet packet adaptive network based fuzzy
inference system," Expert Systems with Applications,
vol. 31, no. 3, pp. 495-503, 2006.
[25] M. A. Boyacioglu and D. Avci, "An adaptive network-
based fuzzy inference system (ANFIS) for the
prediction of stock market return: the case of the
Istanbul stock exchange," Expert Systems with
Applications, vol. 37, no. 12, pp. 7908-7912, 2010.
[26] O. Demirel, A. Kakilli, and M. Tektas, "Electric energy
load forecasting using ANFIS and ARMA methods,"
2010.
[27] K. Guney and N. Sarikaya, "Adaptive neuro-fuzzy
inference system for computing the resonant frequency
of electrically thin and thick rectangular microstrip
antennas," International Journal of Electronics, vol.
94, no. 9, pp. 833-844, 2007.
[28] K. Kumaş, "Binalarda ısıtma yükü ihtiyacının
belirlenmesi için yeni bir yaklaşım," Süleyman
Demirel Üniversitesi Fen Bilimleri Enstitüsü, 2014.
[29] M. Caner and E. Akarslan, "Estimation of specific
energy factor in marble cutting process using ANFIS
and ANN," Pamukkale University Journal of
Engineering Sciences, vol. 15, no. 2, pp. 221-226,
2009.
[30] S. Ya-Lin and B. Chen-Xi, "Research and analysis of
image processing technologies based on dotnet
framework," Physics Procedia, vol. 25, pp. 2131-2137,
2012.
[31] S. Ojha and S. Sakhare, "Image processing techniques
for object tracking in video surveillance-A survey," in
2015 International Conference on Pervasive
Computing (ICPC), 2015: IEEE, pp. 1-6.
[32] F. Yan, A. M. Iliyasu, and P. Q. Le, "Quantum image
processing: a review of advances in its security
technologies," International Journal of Quantum
Information, vol. 15, no. 03, p. 1730001, 2017.
[33] A. P. James and B. V. Dasarathy, "Medical image
fusion: A survey of the state of the art," Information
fusion, vol. 19, pp. 4-19, 2014.
[34] M. F. Aslan, M. Ceylan, and A. Durdu, "Segmentation
of Retinal Blood Vessel Using Gabor Filter and

Durdu et al., International Journal of Applied Mathematics Electronics and Computers 08(04): 163-172, 2020
- 172 -
Extreme Learning Machines," in 2018 International
Conference on Artificial Intelligence and Data
Processing (IDAP), 2018: IEEE, pp. 1-5.
[35] I. Makki, R. Younes, C. Francis, T. Bianchi, and M.
Zucchetti, "A survey of landmine detection using
hyperspectral imaging," ISPRS Journal of
Photogrammetry and Remote Sensing, vol. 124, pp. 40-
53, 2017.
[36] K. Sabanci, A. Toktas, and A. Kayabasi, "Grain
classifier with computer vision using adaptive neuro‐
fuzzy inference system," Journal of the Science of
Food and Agriculture, vol. 97, no. 12, pp. 3994-4000,
2017.
[37] K. Sabanci and C. Aydin, "Smart robotic weed control
system for sugar beet," 2018.
[38] M. F. Aslan, A. Durdu, and K. Sabanci, "Shopping
Robot That Make Real Time Color Tracking Using
Image Processing Techniques," International Journal
of Applied Mathematics Electronics and Computers,
vol. 5, no. 3, pp. 62-66, 2017.
[39] F. Jalled and I. Voronkov, "Object detection using
image processing," arXiv preprint arXiv:1611.07791,
2016.
[40] R. Verschae and J. Ruiz-del-Solar, "Object detection:
current and future directions," Frontiers in Robotics
and AI, vol. 2, p. 29, 2015.
Recommended