Research ArticleCorrection of Channel Imbalance for MIMO SAR UsingStepped-Frequency Chirps
Xiulian Luo12 Yunkai Deng1 Robert Wang1 Lei Guo12 and Mingjiang Wang12
1 Institute of Electronics Chinese Academy of Sciences Beijing 100190 China2Graduate University of the Chinese Academy of Sciences Beijing 100080 China
Correspondence should be addressed to Xiulian Luo xiaoluo6070126com
Received 20 December 2013 Accepted 19 February 2014 Published 3 April 2014
Academic Editor Wei Xu
Copyright copy 2014 Xiulian Luo et al This is an open access article distributed under the Creative Commons Attribution Licensewhich permits unrestricted use distribution and reproduction in any medium provided the original work is properly cited
To simultaneously achieve two-dimensional high resolution and wide swath in synthetic aperture radar (SAR) azimuth MIMOstructure combined with stepped-frequency chirp signals was developed via splitting the antenna into 119873 subapertures Duringtransmitting each subaperture transmits a chirp pulse at a different carrier frequency while during receiving every subaperturereceives the119873 scattered pulses at the same time Separating the119873 scattered pulses received by each subaperture and downlinkingthem to the ground yield 1198732 different signal paths Due to the dedicated network in the SAR system the channel imbalance isinevitable To correct the channel imbalance this paper presents an external calibration method where the channel characteristicsare estimated from the peak value of a strong point target for each channel Simulation and real raw data experiments are performedto validate the proposed method
1 Introduction
Resolution and swath width are two key specifications forthe spaceborne stripmap SAR However high azimuth res-olution and wide range swath imaging pose contradictingrequirement on conventional SAR system design In orderto overcome this inherent contradiction the displaced phasecenter antenna (DPCA) techniques [1ndash3] and the multiple-input and multiple-output (MIMO) antenna techniques [4ndash7] are introduced to acquire additional spatial sampled infor-mation On the other hand the range resolution determinedby the pulse bandwidth has to be increased to match theazimuth resolution However transmitting and receivingwideband signals burden the active electronically steeredarray (AESA) antenna and the echo sampled equipment[8 9] thus confining the range resolution Fortunatelya wideband chirp signal can be synthesized by a groupof narrowband subchirps centered at stepped frequencieswhich requires the synthetic bandwidth technique [8ndash10]
As the synthetic bandwidth technique will reduce thenumber of equivalent phase centers (EPCs) the additionalsampled information in DPCA SAR is actually used to
increase the range bandwidth other than the equivalent PRF[11] Therefore this paper focuses on the MIMO SAR usingstepped-frequency chirps (STFC) [4 5] where both theequivalent PRF and the range bandwidth can be 119873 timesincreased However as this MIMO system yields1198732 differentsignal paths the channel imbalance is inevitable For eachsubband the collected data is from a DPCA system wherethe channel imbalance can be regarded as the inner-bandimbalance which results in azimuth ambiguities [12] Theimbalance among different subbands can be regarded as theinterband imbalance which leads to degradation of the rangeperformance after synthetic bandwidth [13]
Therefore in order to acquire high quality images effec-tive correction of the channel imbalance is indispensableThe available correction methods can be classified as twocategories methods on internal calibration [14] and methodson raw data [15 16] However all these correction methodsonly either handled the inner-band imbalance in the DPCAsystemwith single subband [15 16] or concerned themultiplesubbands system with single subaperture [14] In [14] Denget al gave the internal calibration approach where the imbal-ance information is obtained from the internal calibration
Hindawi Publishing CorporationInternational Journal of Antennas and PropagationVolume 2014 Article ID 161294 8 pageshttpdxdoiorg1011552014161294
2 International Journal of Antennas and Propagation
data acquired from the calibration subsystem This methodcan be extended to theMIMO system using STFC Neverthe-less 1198732 internal calibration subsystems are required whichdramatically increases the complexity of the SAR systemsIn addition it cannot correct imbalance introduced by theantennas The subspace projection method proposed in [16]and the azimuth cross-correlation method presented in [15]do not require additional subsystem However they cannotcorrect the interband imbalance as the phase differencecaused by different carrier frequencies is range dependentand hard to compensate
Usually the channel imbalance information (phase andamplitude) does not change within a certain illuminationtime [15] Moreover many artificial corner reflectors havebeen distributed here and there for radiometric calibration[17] Therefore this paper proposes an external calibrationmethod where the channel imbalance information is esti-mated from the peak value of a corner reflector or a strongpoint target in 119873
2 small complex images Afterwards theestimated channel errors are used to correct the channelimbalance when imaging for much larger data
Succeeding sections are organized as follows In Section 2the MIMO SAR using STFC is conceptually designed andthe corresponding image formation processing is brieflysummarized In Section 3 the external correction methodis presented followed by the simulation and real raw dataexperiments in Section 4 to validate the proposed methodFinally the conclusion is drawn in Section 5
2 MIMO SAR UsingStepped-Frequency Chirps
21 Conceptual Design The MIMO SAR simultaneouslytransmits a set of stepped-frequency chirps regarded assubbands via multiple subapertures During receiving everysubaperture receives all the 119873 subbands in one PRI Theschematic diagram and the corresponding timeline of trans-mitted pulses and received echoes are illustrated in Figure 1where the circles represent the location of the equivalentphase centers (EPCs) of the subbands and the number insidethe circles represents the sequence number of the subbands
In order to separate two frequency-adjacent subbandsand absent gaps from the connection of subbands at the sametime the subband bandwidth 119861
119904is required to be equal to
the frequency stepΔ119891The relationship of the time frequencyfor the transmitted pulses is illustrated in Figure 2 where119891
119898
(119898 = 1 2 119873) is the carrier frequency of the119898 th subbandThe baseband echo of the119898 th subband for each subaper-
ture is acquired as follows Demodulate the radio frequency(RF) pulses with the carrier frequency 119891
119898 Then filter the
demodulated signal with an analog low pass filter (LPF)whose bandwidth is greater than 119861
119904 Afterwards convert
the analog signal to a digital signal via an AD convertorwith a sampling rate greater than the cutoff frequency ofthe LPF As illustrated in Figure 3 due to the imperfectfiltering and the Gibbs phenomenon of the signal spectrumsome spectral component of one subband is leaked into theadjacent subband thus resulting in subband interference In
1
s
H
1 11 1 1
2 2 22 2 2
NN N
NN
N
middot middot middot
1 1
2 2
N N
TX1RX1
TX2RX2
TXNRXN
Figure 1 Schematic diagram of the MIMO SAR using STFC
middot middot middot
f
fN
f2
f1
ta(n) ta(n + 1)
Ts
PRT PRT
Bs
Bw
sub1
sub2
subN
sub1
sub2
subN
t
Figure 2 Relationship of time frequency of transmitted pulses
order to reduce the interference a digital rectangular windowcan be applied to the sampled data before imaging Thenthe interference only results from the spectral componentoutside the spectrum bandwidth as illustrated by the blue-shaded region in Figure 3 As stated in [13] the influence ofthe subband interference under this situation can be ignoredbecause it results inminus47 dB ambiguities in range In fact whenthe subband bandwidth is larger the ambiguities in range willbe reduced further This is because the relative amplitude ofthe ambiguities is determined by relating the leakage energy
International Journal of Antennas and Propagation 3
LPF
0f2 minus f1
minusfs2
Rectangular window
f
Figure 3 Separation of two frequency-adjacent subbands
to the whole energy [13] Moreover the leakage energy isinversely proportional to the bandwidth-time product
Therefore in this paper for each subaperture adjacentsubbands are assumed to be completely separated that is thesubband interference is not considered
22 Image Formation Processing When the uniform sam-pling condition
1
PRF=119897119886119911
2V119904
sdot 119873 (1)
with PRF the system pulse repetition frequency 119897119886119911the length
of the subaperture and V119904the velocity of the sensor is not
satisfied multichannel reconstruction [1] is required Thereference position during the multichannel reconstructionshould be the center of the whole antenna to make theEPCs to be synthesized coincide spatially Afterwards thefrequency domain bandwidth synthesis method [9 10] isapplied to acquire a large bandwidth pulse followed by theconventional imaging It should be noted that the synthesizedsignal should be firstly converted to the original echo domainif the CS imaging algorithm is adopted The block diagramof the image formation processing for this MIMO SARsystem is presented in Figure 4 Assume that 119873 = 2 andthen the variation of the distribution of EPCs introducedby multichannel reconstruction and bandwidth synthesis isshown in Figure 5 (ignore the first row and the dashed circleswhich will be used in Section 4)
3 Correction of the Channel Imbalance
In this section the correction of both amplitude and phaseimbalance among channels will be presented As this correc-tion method is based on a focused strong point target in 1198732small complex images separating imaging for each subbandand each subaperture is required
The base-band echo for the119898th subband (transmitted bythe119898th subaperture) received by the 119899th subaperture is
119878119898119899
(120591 120578) = 119873119898119899
(120591 120578) + 119860119898119899
sdot exp (119895120593119898119899) sdot rect(
120591 minus 119877119898119899
(120578) 119888
119879119903
)
times expminus1198952120587119891119898sdot (
119877119898119899
(120578)
119888)
sdot exp119895120587119896119903(120591 minus
119877119898119899
(120578)
119888)
2
(2)
with 120591 the range time 120578 the azimuth time 119896119903the chirp rate 119888
the light velocity 119879119903the pulse duration 119860
119898119899the amplitude
characteristic 120593119898119899
the phase characteristic 119873119898119899(120591 120578) the
system noise and the echo of other targets and 119877119898119899(120578)
the instantaneous distance in propagation between thetransmitter and the receiver for the corner reflector (pointtarget) Applying the Taylor series expansion and ignoringthe quadratic phase termquadratic term error during theequivalence of the two-way slant ranges 119877
119898119899(120578) can be
approximated as
119877119898119899
(120578) = 119877 (120578 minus Δ120578119898119899) (3)
where
Δ120578119898119899
=(119898 + 119899 minus 119873 minus 1) 119897
119886119911
2V119904
(4)
is the azimuth time interval between the corresponding EPCand the center of the whole antenna and
119877 (120578) = 2radic1198772
0+ (V119904120578 minus 1199090)2
(5)
represents the two-way slant range from the center of thewhole antenna to the point target In (5) 119877
0and 119909
0indicate
the slant range and azimuth coordinates of the point targetrespectively
First the imaging for the 1198732 echoes is independentlyperformed Due to lower PRF than Nyquist sampling ratestrong azimuth ambiguities of the point target appear in the1198732 images However the ambiguities are far away from the
real point target thus scarcely impacting the estimation Theimaging result can be approximated as [18]
119878119898119899
(120591 120578) = 1198731015840
119898119899(120591 120578) + 119873
1015840
119898119899amb (120591 120578)
+ 119860119896sdot exp (119895120593
119896) sdot 119866 sdot 119901
119903(120591 minus
21198770
119888)
sdot exp minus1198952120587119891119898sdot (21198770
119888) sdot 119901
119886119898119899(120578 minus
1199090
V119904
)
+ 119860119896sdot exp (119895120593
119896) sdot 119901119903(120591 minus
21198770
119888)
4 International Journal of Antennas and Propagation
Bandwidth synthesis
Multichannel reconstruction
Multichannel reconstruction
Conventionalimaging
SAR image with high resolution
middot middot middot
middot middot middot
middot middot middot
Subband 1Subaperture 1
Subband 1
Subaperture 1Subband N
Subband N
Subaperture N
Subaperture N
Figure 4 Block diagram of the image formation processing
1PRF1 2 1 2 1 2 1 2
1 1
1 1
2 2
2 2
11 11
2 2 2 2
1
Reference position
MIM
O ec
ho
cons
truc
ted
Mul
ticha
nnel
reco
nstr
uctio
nBa
ndw
idth
synt
hesis
t2 2
t2 1
t1 2 =laz2s
Figure 5 Distribution of the EPCs
sdot exp minus1198952120587119891119898sdot (21198770
119888)
times
119873minus1
sum
119894=minus119873+1 119894 = 0
119866amb119894
sdot 119901119886119898119899
(120578 minus1199090
V119904
+ 119894 sdotPRF119896119886
)
(6)
where 119896119886is the azimuth chirp rate 119866 and 119866amb119894 are the
gain resulting from the imaging of the ldquorealrdquo part and theambiguous part of the point target respectively 1198731015840
119898119899(120591 120578)
and 1198731015840119898119899amb(120591 120578) are the ldquorealrdquo and ambiguous response of
other targets and noise and 119901119886119898119899
and 119901119903are the amplitude
of the azimuth and range impulse responses two sinc-likefunctions [18] According to (3) 119901
119886119898119899(120578) can be rewritten as
119901119886119898119899
(120578) = 119901119886(120578 minus Δ120578
119898119899) (7)
where 119901119886is also a sinc-like function
Considering that the peak of the corner reflector isgenerally much greater than other terms at position (119877
0 1199090)
only the ldquorealrdquo response of the corner reflector is taken intoaccount when deriving the correction method which is
119878119898119899
(120591 120578) = 119860119898119899
sdot exp (119895120593119898119899) sdot 119866 sdot 119901
119903(120591 minus
21198770
119888)
times exp minus1198952120587119891119898sdot (21198770
119888)
sdot 119901119886(120578 minus
1199090
V119904
minus Δ120578119898119899)
(8)
Second the peak position and value of the corner reflectorare estimated from these1198732 small complex images In orderto make the estimation more accurate the 2D-interpolationover the peak point and its surrounding points is performedConsequently the peak position of the corner reflector isacquired to be 120591
119898119899asymp 21198770119888 The amplitude of the peak is
119860119898119899
asymp 119860119898119899
and the phase of the peak is
120601119887119898119899
asymp 120593119898119899
minus 2120587119891119898sdot 120591119898119899 (9)
In fact in order to reduce the influence of the noise 119860119896
and 120601119887119896
are obtained by averaging the values of the pointswithin the two-dimensional 1 dB main lobeThe first channel
International Journal of Antennas and Propagation 5
(subband 1 and subaperture 1) is set as the reference channelThen the estimated amplitude error matrix is
AE = diag11986011 11986012 119860
1119873 119860
1198731 1198601198732 119860119873119873
11986011
(10)
Third compensate the inherent phase caused by the offsetof the carrier frequencies119891
119898from the center frequency of the
synthesized wideband signal 119891119888 After this the phase of the
peak value is changed as
120601119898119899
= 120601119887119898119899
+ 2120587Δ119891119898sdot 120591119898119899
asymp 120593119898119899
minus 2120587119891119888sdot (21198770
119888) (11)
where
Δ119891119898= (119898 minus
1 + 119873
2)Δ119891 119898 = 1 119873 (12)
Therefore the estimated phase error matrix can be expressedas
ΦE = (diag exp (11989512060111) exp (1198951206011119873)
exp (1198951206011198731) exp (119895120601
119873119873))
times (exp (11989512060111))minus1
(13)
Finally correct the channel imbalance according to (10)and (13) The correction matrix is
C = (AEΦE)minus1
(14)
Therefore the correction is implemented as
S119888= C sdot [119878
11(120591 120578) 119878
1119873(120591 120578)
1198781198731
(120591 120578) 119878119873119873
(120591 120578)]119879
(15)
It should be noted that the data size of 119878119898119899(120591 120578) in
(2) can be much smaller than that in (15) to improve theprocessing efficiency After correction the balanced data S
119888is
used to form the final image with high resolution The wholeprocessing is shown in Figure 6 where the image formationprocessing strategy is presented in Figure 4
4 Experimental Results
41 Simulation Experiment In the simulation the 2D imag-ing of a plane scene containing a letter ldquoArdquo and a 4-time (6 dB)brighter point target is performed and this point target isinside the letter ldquoArdquo The simulation parameters are specifiedin Table 1
Table 1 System parameters
Parameter Symbol ValueCenter frequency (GHz) 119891
1198889685
Slant range of scene center (km) 1198770
30Sensor velocity (ms) V
119904215
Subaperture length (m) 119897az 25System PRF (Hz) PRF 140Transmit pulse length (us) 119879
11990110
Number of subbandssubapertures 119873 2Transmitted pulse bandwidth (MHz) 119861
11990460
Sampling rate in range (MHz) 119865119903
72SNR (dB) SNR 6
The accurate amplitude and phase errors are given in the2nd and 3rd columns of Table 2 respectivelyThefirst channelis set as the reference channel According to the estimationmethod proposed in the last section the amplitude andphase errors are estimated and then presented in the 4thand 5th columns of Table 2 respectively The imaging resultswithout and with correction of the channel imbalance areshown in Figures 7(a) and 7(b) respectively The rangecomparison of the point target and its surroundings is shownin Figure 7(c) From Figure 7 one can observe that theambiguities in azimuth (caused by the inner-band imbalance)and the raising of the side-lobes in range (stemming fromthe interband imbalance) are removed by the correction ofchannel imbalance
From the simulation experiment it is concluded thatthe proposed correction (compensation) method can correctboth the inner-band and the interband imbalance for thesimulated MIMO SAR data
42 Real Raw Data Experiment For the real raw data theimaging scene is much more complicated than the simulateddata thus possibly affecting the estimation accuracy As thereal raw data collected by a MIMO SAR using STFC isnot available in this subsection the proposed correctionmethod is assessed with an X-band airborne SAR using asingle aperture and two STFCs which are transmitted in twoconsecutive PRIs In this SAR both the subband bandwidthand the frequency step are 30MHz the original PRF is1600Hz and the sensor velocity is 215ms The distributionof the original EPCs is illustrated by the first row in Figure 5
To validate the proposed correction method on the realraw data the echo data for the MIMO system have to befirstly constructed As discussed before in theMIMO systemusing STFCs the echo for each subband can be regardedfrom a DPCA system [1] Further in the DPCA system thedata of each channel is equivalent to the counterpart singlechannel data processed by an azimuth time delay functionand then 119873 times subsampling [2] Herein the counterpartsingle channel data is the original subband data and the delayfunction in Doppler domain for the119898th subband received bythe 119899th subaperture is set to
119867119898119899
(119891120578) = exp minus1198952120587119891
120578sdot 119905119898119899 (16)
6 International Journal of Antennas and Propagation
Imaging
Imaging
Imaging
Imaging
Correction
Imageformation processing
Extract a small size
datacontaining a strong point
target
Calculatethe position
and peak value of the point target
Compensate the phase caused by different carrier
frequencies
Constructthe
correctionmatrix
Echo11
Echo1N
EchoN1
EchoNN
middot middot middot
middot middot middot
middot middot middot
Figure 6 Block diagram of the channel imbalance correction
minus200
minus100
0
100
200
Azi
mut
h (m
)
297 298 299 30 301 302
Range (km)
0
minus20
minus40
minus60
minus80
(a)
minus200
minus100
0
100
200
Azi
mut
h (m
)
297 298 299 30 301 302
Range (km)
0
minus20
minus40
minus60
minus80
(b)
0 5 10 15
0
Am
plitu
de (d
B) minus10
minus20
minus30
minus40
minus50minus10 minus5
Range (m)
WithWithout
(c)
Figure 7 Simulation results for OFDM-MIMO SAR (a) Imaging result without correction of channel imbalance (b) Imaging result withcorrection of channel imbalance (c) Range comparison of the amplification of the point target in (a) and (b)
Table 2 Channel errors (CE)
Channel (119898 119899) Exact CE Estimated CE for simulated data Estimated CE for constructed raw data119860119896
120593119896(∘) 119860
119896120593119896(∘) 119860
119896120593119896(∘)
1 1 1 0 1 0 1 01 2 13 25 1296 24308 1253 282012 1 15 30 1500 29649 1468 333252 2 14 45 1401 44426 1352 42720
International Journal of Antennas and Propagation 7
(a) (b)
minus10 minus5 0 5 10 15 20Range (m)
0
Am
plitu
de (d
B)
minus10
minus20
minus30
minus40
minus50minus20 minus15
WithWithout
(c)
Figure 8 Real raw data results for OFDM-MIMO SAR (a) Without correction (b) With correction (c) Range comparison of theamplification of the corner reflector
with119891120578theDoppler frequency 119905
11= 0 11990512= 1198971198861199112V119904= (34)sdot
(12PRF) 11990521
= 11990512minus (14PRF) and 119905
22= 11990512+ 11990521 Then
the distribution of the EPCs for the four channels can beillustrated by the 2nd 3rd 4th and 5th rows in Figure 5wherethe dashed circles represent the discarded pulses to realizea two-time subsampling With consideration of the channelerrors specified in the 2nd and 3rd columns of Table 2 thefour echo data of the MIMO system using STFCs are wellconstructed
According to the error estimation process presented inFigure 6 the measured channel errors are listed in the 6thand 7th columns of Table 2The final imaging results withoutand with correction of the channel imbalance are shown inFigures 8(a) and 8(b) respectively The corner reflector usedfor external calibration ismarked by ellipse in the two figuresAfter interpolation and amplification the range comparisonof the corner reflector in Figures 8(a) and 8(b) is shown inFigure 8(c) where one can see that the raising of the sidelobes is eliminated by the compensation Additionally in
Figure 8(a) the peak amplitude of the ambiguity marked bydashed circle is minus1589 dB while in Figure 8(b) the ambiguityis not distinguishable from the background
Therefore for the constructed MIMO raw data thepresented correctionmethod is also effective in removing thechannel imbalance
5 Conclusion
MIMO SAR using stepped frequency chirps is of greatpotential for future high-resolution wide-swath SAR mis-sions Channel imbalance is a key problem for this novelSAR mode as it relates to the imaging performance Thispaper proposed a simple and effective method to correctthis channel imbalance which was validated by simulationand real raw data experiments Other problems such as thesystem design and the orbit model are not discussed in thispaper Nevertheless they are also indispensable especiallywhen this novel mode is applied to spaceborne missions
8 International Journal of Antennas and Propagation
Conflict of Interests
The authors declare that there is no conflict of interestsregarding the publication of this paper
References
[1] NGebert GKrieger andMAMoreira ldquoDigital beamformingon receive techniques and optimization strategies for high-resolution wide-swath SAR imagingrdquo IEEE Transactions onAerospace and Electronic Systems vol 45 no 2 pp 564ndash5922009
[2] W Jing M Xing C-W Qiu Z Bao and T-S Yeo ldquoUnambigu-ous reconstruction and high-resolution imaging for multiple-channel SAR and Airborne experiment resultsrdquo IEEE Geo-science and Remote Sensing Letters vol 6 no 1 pp 102ndash1062009
[3] A Currie and M A Brown ldquoWide-swath SARrdquo IEE Proceed-ings Part F Radar and Signal Processing vol 139 no 2 pp 122ndash135 1992
[4] W-QWang ldquoSpace-time codingMIMO-OFDM SAR for high-resolution imagingrdquo IEEE Transactions on Geoscience andRemote Sensing vol 49 no 8 pp 3094ndash3104 2011
[5] Y Song and R Yang ldquoHigh resolution wide swath SAR usingsub-aperture sub-band techniquerdquo in Proceedings of the CIEInternational Conference on Radar (ICR rsquo06) Shanghai ChinaOctober 2006
[6] G Krieger ldquoMIMO-SAR opportunities and pitfallsrdquo IEEETransactions on Geoscience and Remote Sensing no 99 pp 1ndash18 2013
[7] J HG Ender and J Klare ldquoSystem architectures and algorithmsfor radar imaging by MIMO-SARrdquo in Proceedings of the IEEERadar Conference (RADAR rsquo09) Pasadena Calif USA May2009
[8] A W Doerry SAR Processing with Stepped Chirps and PhasedArray Antennas Sandia Nat Lab Albuquerque NM USA2006
[9] P Berens ldquoSARwith ultra-high range resolution using syntheticbandwidthrdquo in Proceedings of the IEEE International Geoscienceand Remote Sensing Symposium (IGARSS rsquo99) pp 1752ndash1754Hamburg Germany July 1999
[10] W Nel J Tait R Lord and A Wilkinson ldquoThe use ofa frequency domain stepped frequency technique to obtainhigh range resolution on the CSIR X-Band SAR systemrdquo inProceedings of the 6th IEEE AFRICON Conference in Africa pp327ndash332 October 2002
[11] J H G Ender and A R Brenner ldquoPAMIRmdasha wideband phasedarray SARMTI systemrdquo IEE Proceedings Radar Sonar andNavigation vol 150 no 3 pp 165ndash172 2003
[12] C-G Gao Y-K Deng and J Feng ldquoTheoretical analysis on themismatch influence of displaced phase center multiple-beamSAR systemsrdquo Journal of Electronics amp Information Technologyvol 33 no 8 pp 1828ndash1832 2011
[13] X Luo R Wang Y Deng and W Xu ldquoInfluences of channelerrors and interference on the OFDM-MIMOSARrdquo in Proceed-ings of the IEEE Radar Conference pp 1ndash5 Ottawa Canada2013
[14] Y Deng H Zheng R Wang J Feng and Y Liu ldquoInternalcalibration for stepped-frequency chirp SAR imagingrdquo IEEEGeoscience and Remote Sensing Letters vol 8 no 6 pp 1105ndash1109 2011
[15] J Feng C Gao Y Zhang and R Wang ldquoPhase mismatchcalibration of the multichannel SAR based on azimuth cross-correlationrdquo IEEE Geoscience and Remote Sensing Letters vol10 no 4 pp 903ndash907 2013
[16] L Zhang M-D Xing C-W Qiu and Z Bao ldquoAdaptivetwo-step calibration for high-resolution and wide-swath SARimagingrdquo IET Radar Sonar and Navigation vol 4 no 4 pp548ndash559 2010
[17] J C Curlander and R N Mcdonough Synthetic ApertureRadar Systems and Signal Processing John Wiley amp Sons NewYork NY USA 1991
[18] I G Cumming and F H Wong Digital Processing of SyntheticAperture Radar Data Algorithms and Implementation ArtechHouse Norwood Mass USA 2005
International Journal of
AerospaceEngineeringHindawi Publishing Corporationhttpwwwhindawicom Volume 2014
RoboticsJournal of
Hindawi Publishing Corporationhttpwwwhindawicom Volume 2014
Hindawi Publishing Corporationhttpwwwhindawicom Volume 2014
Active and Passive Electronic Components
Control Scienceand Engineering
Journal of
Hindawi Publishing Corporationhttpwwwhindawicom Volume 2014
International Journal of
RotatingMachinery
Hindawi Publishing Corporationhttpwwwhindawicom Volume 2014
Hindawi Publishing Corporation httpwwwhindawicom
Journal ofEngineeringVolume 2014
Submit your manuscripts athttpwwwhindawicom
VLSI Design
Hindawi Publishing Corporationhttpwwwhindawicom Volume 2014
Hindawi Publishing Corporationhttpwwwhindawicom Volume 2014
Shock and Vibration
Hindawi Publishing Corporationhttpwwwhindawicom Volume 2014
Civil EngineeringAdvances in
Acoustics and VibrationAdvances in
Hindawi Publishing Corporationhttpwwwhindawicom Volume 2014
Hindawi Publishing Corporationhttpwwwhindawicom Volume 2014
Electrical and Computer Engineering
Journal of
Advances inOptoElectronics
Hindawi Publishing Corporation httpwwwhindawicom
Volume 2014
The Scientific World JournalHindawi Publishing Corporation httpwwwhindawicom Volume 2014
SensorsJournal of
Hindawi Publishing Corporationhttpwwwhindawicom Volume 2014
Modelling amp Simulation in EngineeringHindawi Publishing Corporation httpwwwhindawicom Volume 2014
Hindawi Publishing Corporationhttpwwwhindawicom Volume 2014
Chemical EngineeringInternational Journal of Antennas and
Propagation
International Journal of
Hindawi Publishing Corporationhttpwwwhindawicom Volume 2014
Hindawi Publishing Corporationhttpwwwhindawicom Volume 2014
Navigation and Observation
International Journal of
Hindawi Publishing Corporationhttpwwwhindawicom Volume 2014
DistributedSensor Networks
International Journal of
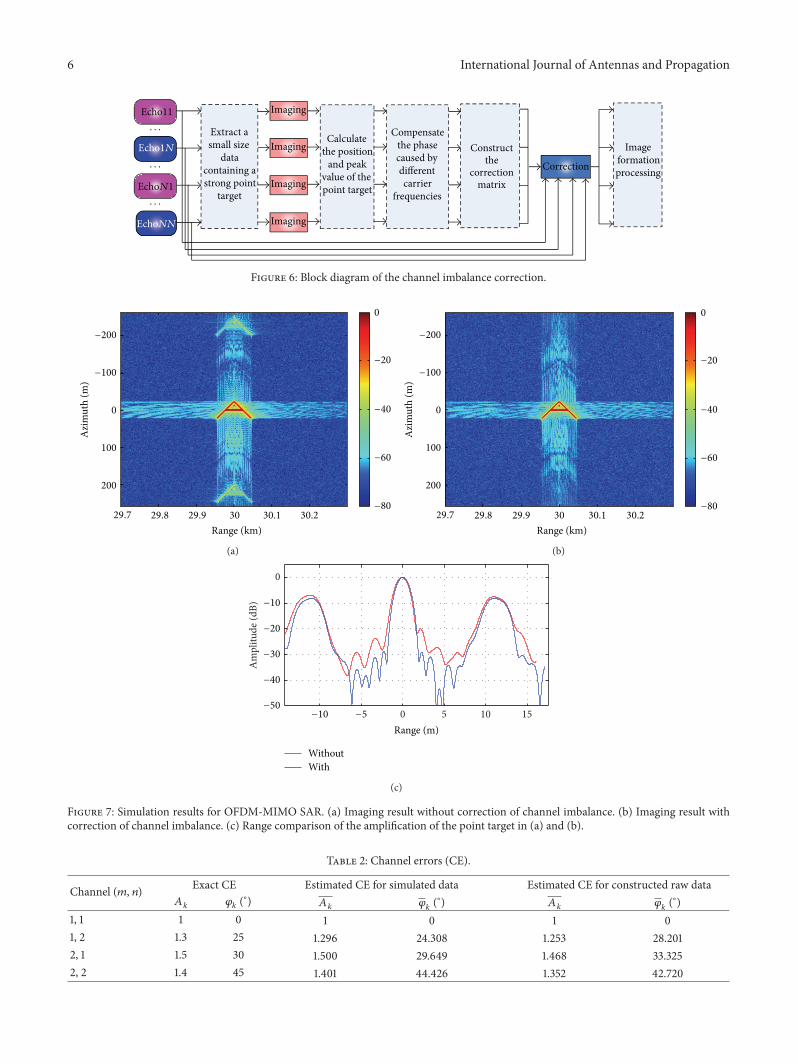

International Journal of
AerospaceEngineeringHindawi Publishing Corporationhttpwwwhindawicom Volume 2014
RoboticsJournal of
Hindawi Publishing Corporationhttpwwwhindawicom Volume 2014
Hindawi Publishing Corporationhttpwwwhindawicom Volume 2014
Active and Passive Electronic Components
Control Scienceand Engineering
Journal of
Hindawi Publishing Corporationhttpwwwhindawicom Volume 2014
International Journal of
RotatingMachinery
Hindawi Publishing Corporationhttpwwwhindawicom Volume 2014
Hindawi Publishing Corporation httpwwwhindawicom
Journal ofEngineeringVolume 2014
Submit your manuscripts athttpwwwhindawicom
VLSI Design
Hindawi Publishing Corporationhttpwwwhindawicom Volume 2014
Hindawi Publishing Corporationhttpwwwhindawicom Volume 2014
Shock and Vibration
Hindawi Publishing Corporationhttpwwwhindawicom Volume 2014
Civil EngineeringAdvances in
Acoustics and VibrationAdvances in
Hindawi Publishing Corporationhttpwwwhindawicom Volume 2014
Hindawi Publishing Corporationhttpwwwhindawicom Volume 2014
Electrical and Computer Engineering
Journal of
Advances inOptoElectronics
Hindawi Publishing Corporation httpwwwhindawicom
Volume 2014
The Scientific World JournalHindawi Publishing Corporation httpwwwhindawicom Volume 2014
SensorsJournal of
Hindawi Publishing Corporationhttpwwwhindawicom Volume 2014
Modelling amp Simulation in EngineeringHindawi Publishing Corporation httpwwwhindawicom Volume 2014
Hindawi Publishing Corporationhttpwwwhindawicom Volume 2014
Chemical EngineeringInternational Journal of Antennas and
Propagation
International Journal of
Hindawi Publishing Corporationhttpwwwhindawicom Volume 2014
Hindawi Publishing Corporationhttpwwwhindawicom Volume 2014
Navigation and Observation
International Journal of
Hindawi Publishing Corporationhttpwwwhindawicom Volume 2014
DistributedSensor Networks
International Journal of
Recommended