1
REPUBLIC OF RWANDA
MINISTRY OF HEALTH
June 2013
KIBUNGO DISTRICT HOSPITAL
HOSPITAL STRATEGIC PLAN JULY 2012- JUNE 2018

2

3
TABLE OF CONTENTS
LIST OF FIGURES ...................................................................................................................... 5 LIST OF TABLES ........................................................................................................................ 5 FOREWORD................................................................................................................................. 7 GLOSSARY................................................................................................................................... 8
I. PRELIMINARIES .................................................................................................................. 9 EXECUTIVE SUMMARY .......................................................................................................... 9 1. Hospital Vision, Mission, goals and objectives ................................................................... 11
II. HOSPITAL SITUATION ANALYSIS ............................................................................... 14 2. EXTERNAL AND INTERNAL ANALYSIS ..................................................................... 14
2.1. KIBUNGO DISTRICT HOSPITAL PROFILE ................................................................................ 14 2.1.1. Institutional history .............................................................................................................................. 14 2.1.2. Hospital ground plan ............................................................................................................................ 15
2.2. EXTERNAL ANALYSIS ...................................................................................................................... 16 2.2.1. District description ............................................................................................................................... 16 2.2.2. Catchment area population................................................................................................................ 16 2.2.3. District health map ................................................................................................................................ 18 2.2.4. Demography (5-years projections) ................................................................................................ 18 2.2.5. District health problem priorities ................................................................................................... 19
2.3. INTERNAL ANALYSIS ...................................................................................................................... 19 2.3.1. Structures of active services at Kibungo district hospital ..................................................... 19 2.3.2. Working conditions ............................................................................................................................... 20 2.3.3. District hospitals package and gap of health services ............................................................ 20 2.3.4. Hospital personnel and human resource gap ............................................................................ 24 2.3.5. Equipment gap assessment ............................................................................................................... 25 2.3.6. Infrastructure and gaps assessment .............................................................................................. 27
2.4. HOSPITAL PERFORMANCE ANALYSIS ....................................................................................... 29 2.4.1. Clinical efficacy ....................................................................................................................................... 29 2.4.2. Hygiene and patient safety ................................................................................................................. 29 2.4.3. Attention given to the patient ........................................................................................................... 29 2.4.4. Human Resource Management ........................................................................................................ 29 2.4.5. Patient flow analysis ............................................................................................................................. 29 2.4.6. Management and Governance .......................................................................................................... 30
2.5. ANALYSIS OF MAJOR ISSUES ........................................................................................................ 30 2.5.1. Causes of mortality and morbidity in the district hospital ................................................... 30 2.5.2. Hospital SWOT analysis ...................................................................................................................... 32 2.5.3. Analysis of Leadership and Governance Status ......................................................................... 34 2.5.4. Analysis of Maternal child health .................................................................................................... 34 2.5.5. Analysis of Health promotion and environmental health ..................................................... 35 2.5.6. Analysis of disease prevention and control service ................................................................ 35 2.5.7. Analysis of pharmacy services.......................................................................................................... 37 2.5.8. Analysis of Human Resources Services......................................................................................... 37 2.5.9. Analysis of Financial Management Services ............................................................................... 37 2.5.10. Analysis of Logistic and Administrative support services .................................................... 38 2.5.11. Analysis of ICT Services ....................................................................................................................... 39 2.5.12. Analysis of Quality and Safety Services ........................................................................................ 40

4
III. STRATEGIC PLAN ............................................................................................................. 41 3. KIBUNGO DISTRICT HOSPITAL KEY PRIORITIES ................................................. 41
3.1. MEDICAL PRIORITIES ..................................................................................................................... 41 3.1.1. Maternal and child health ................................................................................................................... 42 3.1.2. Clinical service ........................................................................................................................................ 42 3.1.3. Disease prevention and control ....................................................................................................... 42 3.1.4. Health promotion and environmental health ............................................................................ 42
3.2. SUPPORTING SYSTEM PRIORITIES ............................................................................................ 42 3.2.1. Leadership and governance .............................................................................................................. 42 3.2.2. Human resources ................................................................................................................................... 42 3.2.3. Financial management ......................................................................................................................... 43 3.2.4. Drugs and consumables ...................................................................................................................... 43 3.2.5. Administrative support services ..................................................................................................... 43 3.2.6. Data management and ICT ................................................................................................................. 43 3.2.7. Quality and safety management ...................................................................................................... 43
4. LOGICAL FRAMEWORK OF KIBUNGO DISTRICT HOSPITAL ............................ 44 4.1. HEALTH PROGRAM ......................................................................................................................... 44
4.1.1. Maternal and child health ................................................................................................................... 44 4.1.2. Nutrition service .................................................................................................................................... 47 4.1.3. Family planning ...................................................................................................................................... 48 4.1.4. Environmental health .......................................................................................................................... 49 4.1.5. Integrated disease Surveillance and Response ......................................................................... 50 4.1.6. HIV ................................................................................................................................................................ 51 4.1.7. Tuberculosis (TB) .................................................................................................................................. 53 4.1.8. Integrated Management of Childhood Hilliness ........................................................................ 54 4.1.9. Malaria ........................................................................................................................................................ 55 4.1.10. Non-communicable disease ............................................................................................................... 56 4.1.11. Neglected tropical disease.................................................................................................................. 56 4.1.12. Immunization .......................................................................................................................................... 57 4.1.13. Adolescent sexual health and reproductive health .................................................................. 57 4.1.14. Gender Based Violence ........................................................................................................................ 59 4.1.15. Mental Health .......................................................................................................................................... 59 4.1.16. Traditional Medicine ............................................................................................................................ 60
4.2. SUPPORT SYSTEM STRENGTHENING ........................................................................................ 61 4.2.1. Leadership and Governance Status ................................................................................................ 61 4.2.2. Clinical service ........................................................................................................................................ 62 4.2.3. Pharmacy service ................................................................................................................................... 64 4.2.4. Human resource management ......................................................................................................... 66 4.2.5. Financial management ......................................................................................................................... 67 4.2.6. Logistic and Administrative support service ............................................................................. 69 4.2.7. Information and communication technology ............................................................................. 70 4.2.8. Quality care and safety ........................................................................................................................ 72
5. COSTING AND BUDGETING OF THE STRATEGIC PLAN ...................................... 74 5.1. COSTING APPROACH ...................................................................................................................... 74 5.2. STRATEGIC PLAN RESOURCE MOBILIZATION ....................................................................... 77
6. MONITORING AND EVALUATION FRAMEWORK .................................................. 78

5
LIST OF FIGURES
Figure 1: Kibungo district hospital ground plan ........................................................................... 15
Figure 2: District health map ........................................................................................................ 18 Figure 3: Causes of disease in the hospital ................................................................................... 30 Figure 4: Top 10 Causes of under-five morbidity in district hospital ........................................... 31 Figure 5: Top 10 causes of morbidity in district (5 years and plus) ............................................. 31 Figure 6: Top ten leading causes of death in Ngoma district hospital .......................................... 32
LIST OF TABLES
Table 1: Description of the population distribution of Ngoma District by sector ........................ 16
Table 2: Description of population distribution by health center ................................................ 17 Table 3: Disaggregation by age group and projection .................................................................. 18
Table 4: Description of District hospitals package and utilization of health services .................. 20 Table 5: Table Gaps in internal medicine Services ...................................................................... 21 Table 6: Gaps in hospital clinical services .................................................................................... 23
Table 7: Kibungo District Hospital Personnel .............................................................................. 24
Table 8: Gaps in non medical equipments .................................................................................... 25 Table 9: Gaps in medical equipments ........................................................................................... 26 Table 10: Gaps in infrastructure ................................................................................................... 27
Table 11: SWOT analysis ............................................................................................................. 32 Table 12: Analysis of leadership and governance ........................................................................ 34
Table 13: Analysis of Maternal Child Health ............................................................................... 34 Table 14: Analysis of environmental health ................................................................................. 35 Table 15: Analysis of disease prevention ..................................................................................... 36
Table 16: Analysis of hospital pharmacy service ......................................................................... 37 Table 17: Analysis of human resource service ............................................................................. 37
Table 18: Analysis of financial management services .................................................................. 37
Table 19: Analysis of logistics and administrative support services ............................................ 38 Table 20: Analysis of ITC service ................................................................................................ 39 Table 21: Analysis of quality and safety service .......................................................................... 40
Table 22: Logical framework MCH ............................................................................................. 44 Table 23: Logical framework nutrition ......................................................................................... 47 Table 24: Logical framework family planning ............................................................................. 48 Table 25: Logical framework environmental health ..................................................................... 49 Table 26: Logical framework integrated disease Surveillance and Response .............................. 50
Table 27: Logical framework HIV ............................................................................................... 51 Table 28: Logical framework TB ................................................................................................. 53 Table 29: Logical framework Integrated Management of Childhood Hillness ............................ 54
Table 30: Logical framework malaria ........................................................................................... 55 Table 31: Logical framework NCD .............................................................................................. 56 Table 32: Logical framework NTD .............................................................................................. 56
6
Table 33: Logical framework vaccination .................................................................................... 57 Table 34: Logical framework Adolescent sexual health and reproductive health ........................ 57 Table 35: Logical framework GBV .............................................................................................. 59 Table 36: Logical framework Mental health ................................................................................ 59
Table 37: Logical framework traditional medicine ...................................................................... 60 Table 38: Logical framework leadership and governance ............................................................ 61 Table 39: Logical framework clinical service .............................................................................. 62 Table 40: Logical framework pharmacy ....................................................................................... 64 Table 41: Logical framework human resources management ...................................................... 66
Table 42: Logical framework financial management ................................................................... 67 Table 43: Logical framework logistic and administrative support service ................................... 69
Table 44: Logical framework information and communication technology ................................ 70 Table 45: Logical framework quality care and safety .................................................................. 72 Table 46: Costing summarized table per year ............................................................................... 75

7

8
GLOSSARY
Term Definition
ANC Antenatal care
DHIS District Health Information System
EICV Integrated Household Living Conditions Survey -EICV3 (Enquête
Intégrale sur les Conditions de Vie des Ménages)
FP Family planning
GBV Gender-based violence
HMIS Health Management Information System
HSSP III Health Sector Strategic Plan, version III
IMCI Integrated Management Childhood Illness
LLIN Long-lasting impregnated net
MCH Maternal Child Health
MoH Ministry of health
MDR Multi-Drug resistance
Mutuelle Community Health Insurance
M&E Monitoring and evaluation
NCD Non-communicable diseases
OPD Outpatient department
TB Tuberculosis
TracNet Internet based ART monitoring system

9
I. PRELIMINARIES
EXECUTIVE SUMMARY
Kibungo district hospital strategic plan will provide strategic guidance to the health system in the
six years starting July 2012 to June 2018.
Kibungo district hospital strategic plan was elaborated after completion and evaluation of
Kibungo hospital strategic plan 2009-2012. It has been inspired and guided by VISION 2020 that
will make Rwanda a lower Middle income county by 2020; Economic Development and Poverty
Reduction Strategy (EDPRS 2008 -2012); Demographic Health Survey ( DHS, 2010); and
Millennium Development Goals. It is also in alignment with Health Sector Strategic Plan III
(HSSP III) and Ngoma District Development Plan
The objective of Kibungo district health strategic plan is to set strategy that will enhance health
systems, promoting continuous quality improvement, informing decision-making and ensuring
accountability to national health policies.
The strategic plan process started in May 2012, thereafter different meeting and workshop with
staff and hospital stakeholders were conducted. Qualitative and quantitative approach was used
in order to develop the hospital strategic plan. Data from different hospital department were
collected, analyzed and interpreted then based on findings strategies, indicators and targets have
been set. The baseline was set using data from HMIS (2012), DHS (2010), EICV3 report
(Integrated Household Living Conditions Survey). The targets were set as per HSSP III targets,
EDPRS priorities and MDGs, Ngoma District Development plan and Ngoma district health
strategic plan .
The development of the strategic plan was involved by all stakeholders and a consensus was
reached on 11 key strategic areas to examine. Goal, strategic, indicator, baseline and targets have
been developed to address the following areas: Leadership and governance, Curative care,
Maternal and child health , Disease prevention and control , Health promotion and environmental
health, Community case management, Human resources, Financial management, Drugs and
10
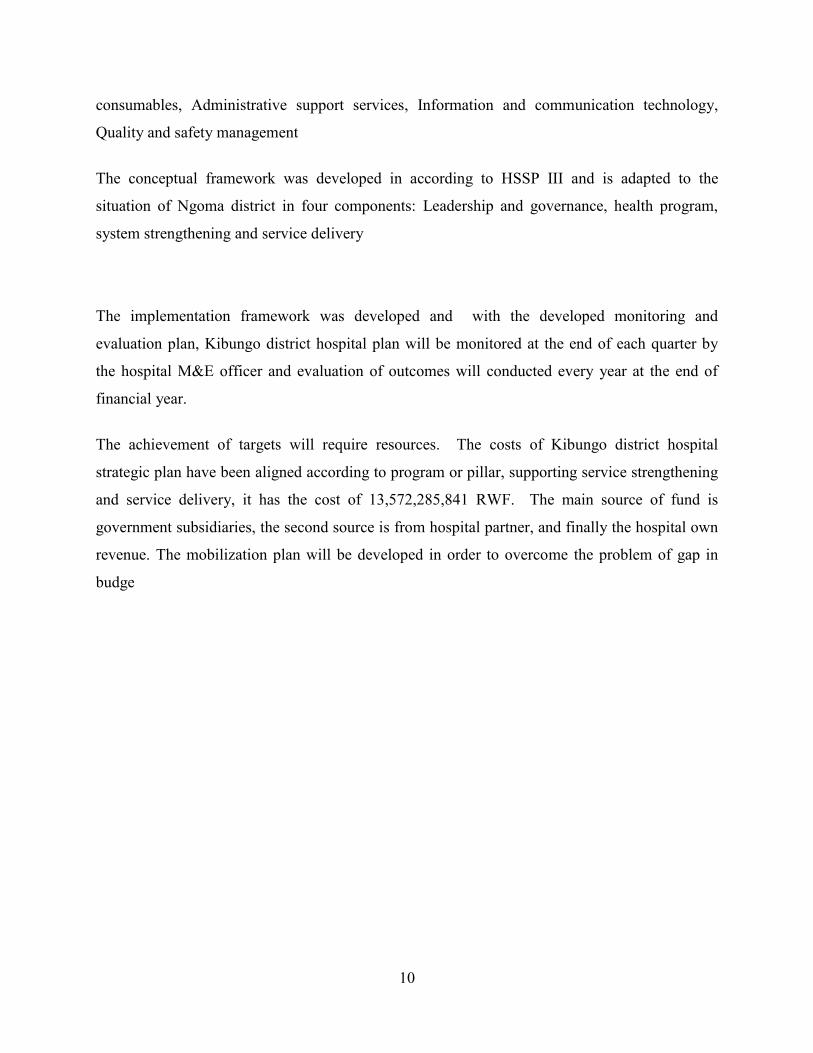
consumables, Administrative support services, Information and communication technology,
Quality and safety management
The conceptual framework was developed in according to HSSP III and is adapted to the
situation of Ngoma district in four components: Leadership and governance, health program,
system strengthening and service delivery
The implementation framework was developed and with the developed monitoring and
evaluation plan, Kibungo district hospital plan will be monitored at the end of each quarter by
the hospital M&E officer and evaluation of outcomes will conducted every year at the end of
financial year.
The achievement of targets will require resources. The costs of Kibungo district hospital
strategic plan have been aligned according to program or pillar, supporting service strengthening
and service delivery, it has the cost of 13,572,285,841 RWF. The main source of fund is
government subsidiaries, the second source is from hospital partner, and finally the hospital own
revenue. The mobilization plan will be developed in order to overcome the problem of gap in
budge

11
1. HOSPITAL VISION, MISSION, GOALS AND OBJECTIVES
Hospital vision
The vision for Kibungo District Hospital is to provide “leadership in quality health care.” And
“to be self reliant in all activities that we perform”
Hospital mission
Kibungo District Hospital is committed to providing the highest quality of healthcare and
collaborates with others in our community to improve the health status of population in Ngoma
district thereby enhancing the general well-being of the population
Hospital goals
To employ competent, caring, and well-trained individuals who are responsive to the needs of
our clients, their families, and the communities we serve.
Hospital objectives
The general objective of the hospital is to enhance health systems, promoting continuous quality
improvement, informing decision-makers and ensuring accountability to national health policies.
The specific objectives of the hospital are:
Enhanced health systems by integrating and involving hospitals as an active component
of the health care network.
Continuous quality improvement in using the accreditation process to bring about
changes in practice that will improve the quality of care for patients.
Informed decision-makers in providing data on the quality of health care that various
stakeholders, policy-makers, managers, clinicians and the public can use to guide
their decisions.
Improved accountability and regulation in making healthcare organizations accountable
to statutory or other agencies, such as professional bodies, government, patient groups

12
and society at large, and regulating their behaviors to protect the interests of patients
and other stakeholders.
Improved monitoring and evaluation of health centers and the hospital
Improved technical support and supervision of health centers
Value
Kibungo District Hospital strives to offer excellent and affordable health care and community-
based social services to individuals, families, and the communities.
Business philosophy
As a district hospital, we at Kibungo District Hospital provide professional quality of services.
Key to success
Our key to success are:
Reliability by adequate staffing, availability of drugs, supplies and equipment
Effective collaboration with the community and other health-related agencies (NGOs,
government institutions, private sector, health insurance companies, and other health
facilities)
Cost recovery to ensure that money spent on services offered is recovered
Key Success Factors
Effective leadership
Prevention activities
Availability of adequate and sustainable resources
Shared vision and values
Commitment and support of stakeholders
Effective communication
High level security for all patients, including VIPs
Sustainable partnerships and institutional collaboration

13
Quality systems that promote best practices in everything it does Optimal utilization of
available resources. Harmonization

14
II. HOSPITAL SITUATION ANALYSIS
2. EXTERNAL AND INTERNAL ANALYSIS
2.1. KIBUNGO DISTRICT HOSPITAL PROFILE
2.1.1. Institutional history
Kibungo District Hospital is approximately 100 km from Kigali in the Eastern Province, Ngoma
District, Kibungo sector, Karenge cell. It is a district hospital with a catchment area of 310,955
inhabitants. Ngoma district has 737.92 square kilometer. The density is approximately 421
people per square kilometer. Kibungo district hospital supervises 12 health centers and five
health posts and receives referral cases from Kirehe and Kayonza districts due to additional
expertise of the Chinese specialists and even some patients from neighboring countries like
Uganda, Tanzania and Burundi. We also receive patients with MDR TB from other Districts and
the countries mentioned above.
KIBUNGO district hospital established as a dispensary in 1932, Kibungo Hospital became a
rural hospital in 1935. Its first extension came in 1984 and it’s second in 1992. Its inauguration
occurred in 1997. It offers all complementary packets of activities.
15
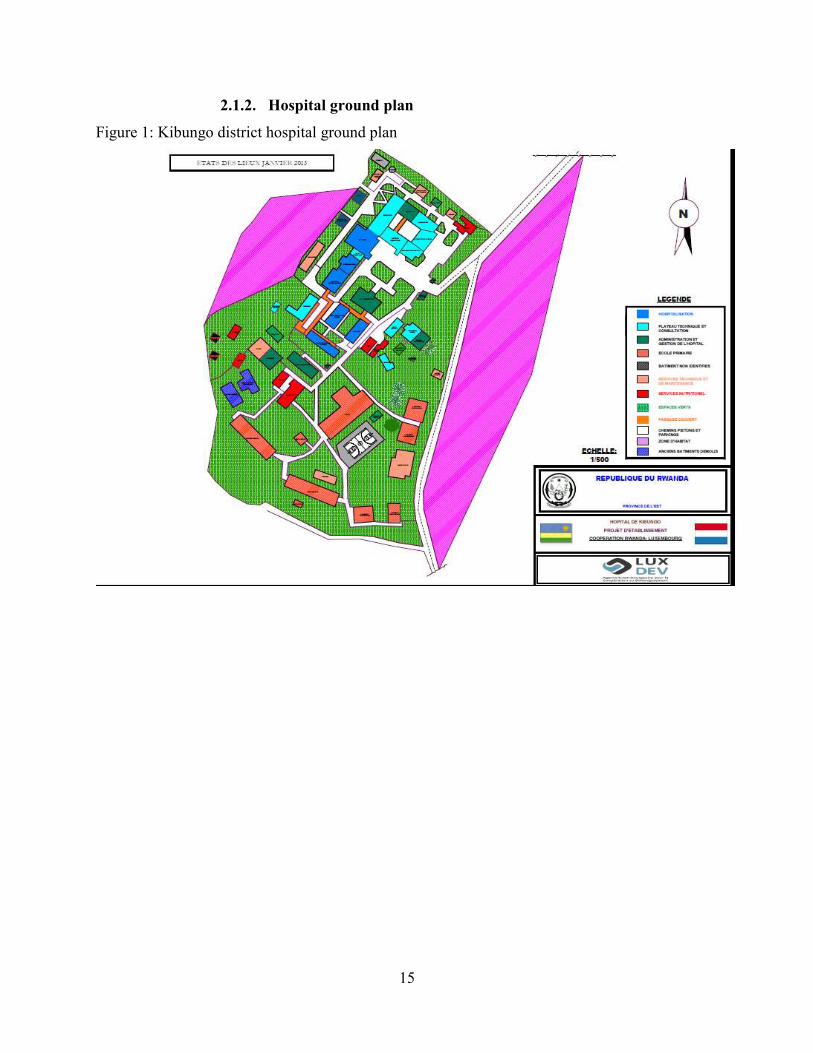
2.1.2. Hospital ground plan
Figure 1: Kibungo district hospital ground plan
16
2.2. EXTERNAL ANALYSIS
2.2.1. District description
Ngoma District is one of seven districts located in the Eastern Province. The District is divided
into 14 sectors made of 64 cells and 473 villages. It is bordered by Rwamagana District to the
northwest, Kayonza District to the northeast, Kirehe District to the southeast, Bugesera District
to the west, and Burundi to the south. In year 2012, the population of Ngoma district is 310,955
inhabitants (Source: ubudehe, 2012), of which 52% are women. The most populated sectors are
Mugesera and Kazo, which have 25,110 and 25,115 inhabitants, respectively. The least
populated sectors are Karembo and Gashanda, with 14,653 and 15,815 inhabitants, respectively.
The economy of the district is mainly based on agriculture and livestock. The most cultivated
crops are bananas, beans, maize, rice, pineapple, and coffee. The district is planning to increase
fish production by introducing improved species of fish in the lakes.
The 18 health facilities in the catchment area of Ngoma district are experiencing a shortage of
health personnel, both in quality and quantity. The hospital has 12 doctors and 234 nurses, which
means only 1 doctor for every 25916 inhabitants and 1 nurse for every 1329 inhabitants. In
addition, there is a problem of insufficient and incomplete health infrastructure and insufficient
medical equipment
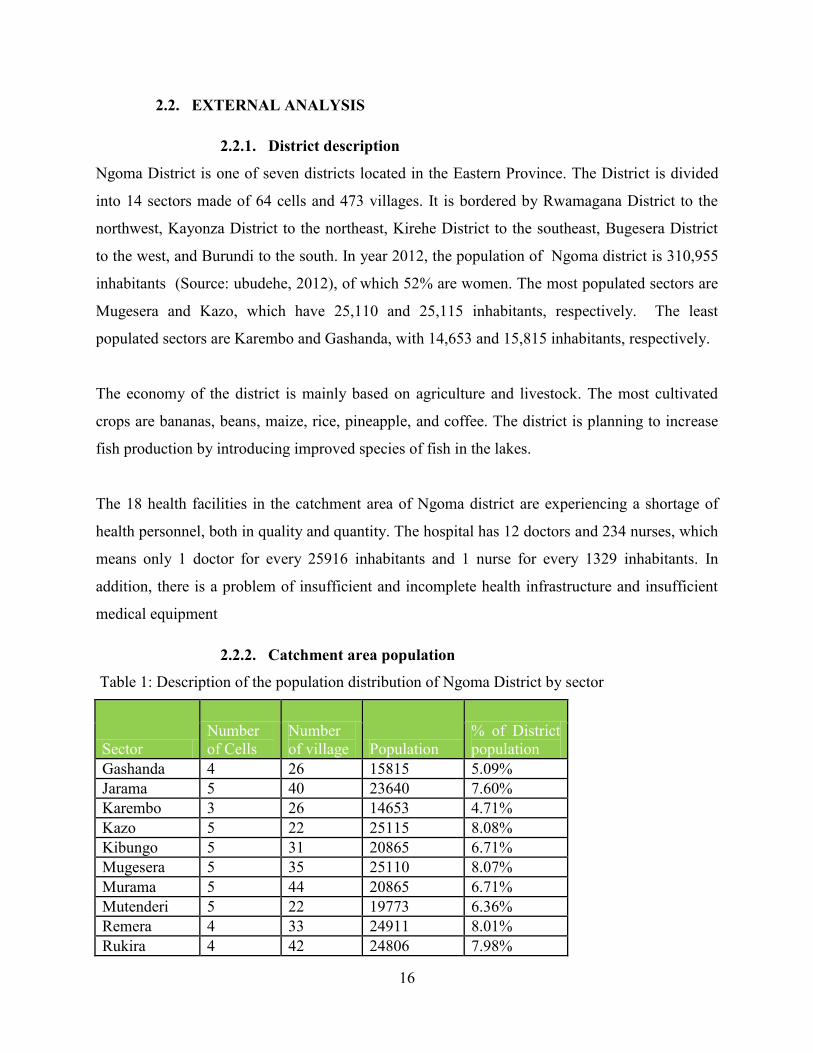
2.2.2. Catchment area population
Table 1: Description of the population distribution of Ngoma District by sector
Sector
Number
of Cells
Number
of village Population
% of District
population
Gashanda 4 26 15815 5.09%
Jarama 5 40 23640 7.60%
Karembo 3 26 14653 4.71%
Kazo 5 22 25115 8.08%
Kibungo 5 31 20865 6.71%
Mugesera 5 35 25110 8.07%
Murama 5 44 20865 6.71%
Mutenderi 5 22 19773 6.36%
Remera 4 33 24911 8.01%
Rukira 4 42 24806 7.98%
17
Sector Number
of Cells
Number
of village Population % of District
population Rukumberi 5 26 24969 8.03%
Rurenge 6 37 25536 8.21%
Sake 4 34 22724 7.31%
Zaza 4 55 22213 7.14%
Total district 64 473 310995 100.00%
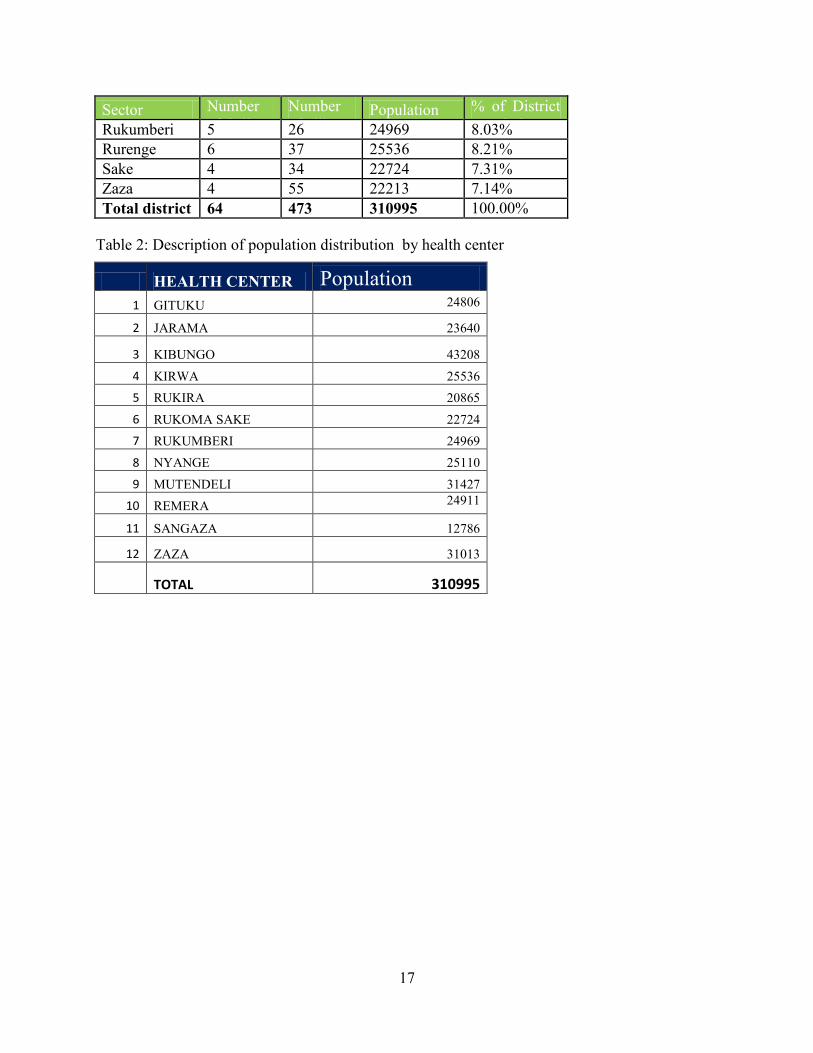
Table 2: Description of population distribution by health center
HEALTH CENTER Population
1 GITUKU 24806
2 JARAMA 23640
3 KIBUNGO 43208
4 KIRWA 25536
5 RUKIRA 20865
6 RUKOMA SAKE 22724
7 RUKUMBERI 24969
8 NYANGE 25110
9 MUTENDELI 31427
10 REMERA 24911
11 SANGAZA 12786
12 ZAZA 31013
TOTAL 310995
18
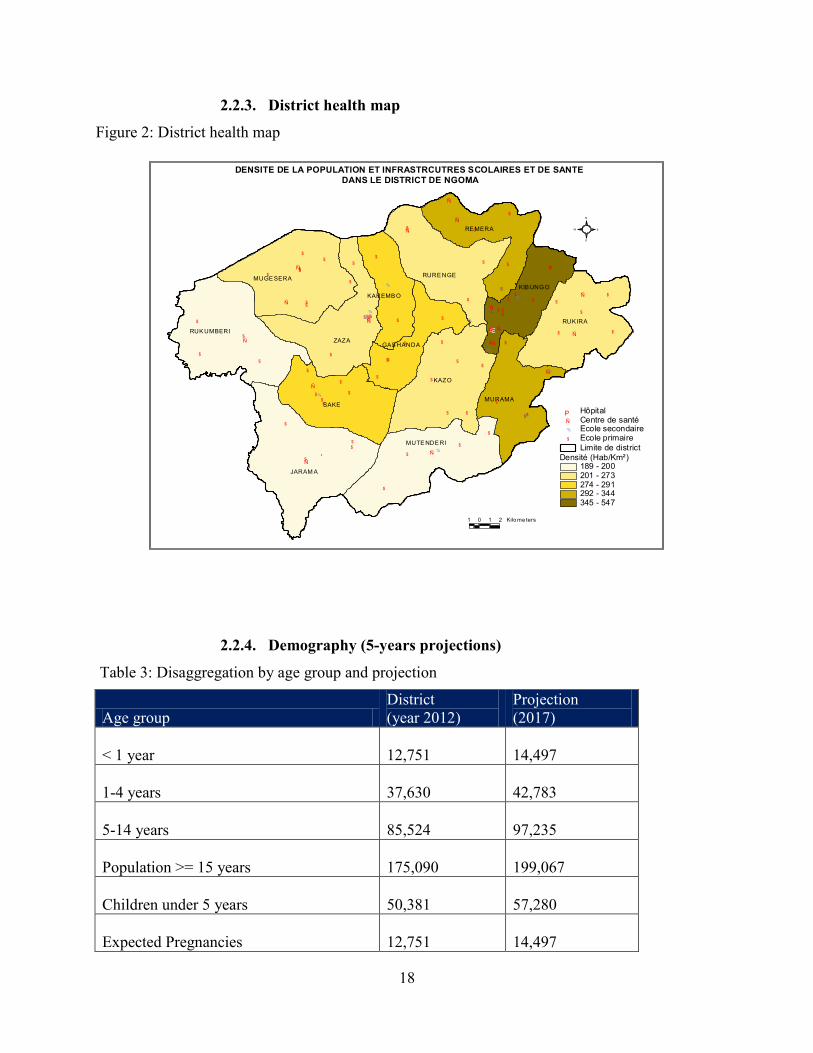
2.2.3. District health map
Figure 2: District health map
$
$
$
$$
$
$
$
$
$
$
$
$
$
$$
$$
$
$
$
$
$
$
$
$
$
$$
$$$
$$
$$$
$
$
$
$$ $$
$
$
$
$
$
$
$
$
$
$
$
$
$$
$
$
$
$
$
$$
$
$$
$$
$
%
%
%%%
%
%
%
%
%
%
%
%
%
%
Ñ
Ñ
Ñ
Ñ
Ñ
Ñ
Ñ
Ñ
Ñ
Ñ
Ñ
Ñ
Ñ
Ñ
Ñ
Ñ
ÆP
KAZO
ZAZA
JARAM A
SAKE
RUK IRA
RUK UMBERI
RURE NGEMUGE SERA
MUTE NDE RI
RE MERA
MURAMA
KIB UNGO
KAREMB O
GAS HANDA
Densité (Hab/Km²)189 - 200201 - 273274 - 291292 - 344345 - 547
Limite de district
$ Ecole primaire% Ecole secondaireÑ Centre de santéÆP Hôpital
DENSITE DE LA POPULATION ET INFRASTRCUTRES SCOLAIRES ET DE SANTE
DANS LE DISTRICT DE NGOMA
S
N
EW
1 0 1 2 Kilo me ters
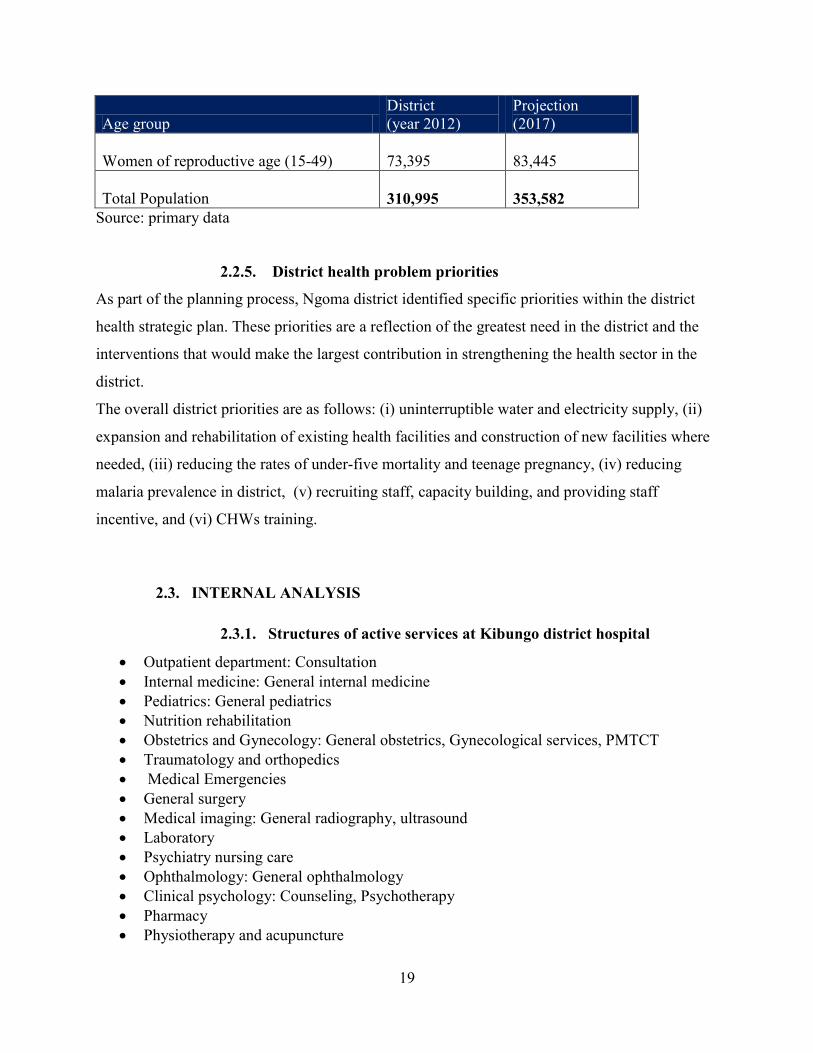
2.2.4. Demography (5-years projections)
Table 3: Disaggregation by age group and projection
Age group
District
(year 2012)
Projection
(2017)
< 1 year
12,751
14,497
1-4 years
37,630
42,783
5-14 years
85,524
97,235
Population >= 15 years
175,090
199,067
Children under 5 years
50,381
57,280
Expected Pregnancies
12,751
14,497
19
Age group
District
(year 2012)
Projection
(2017)
Women of reproductive age (15-49)
73,395
83,445
Total Population
310,995
353,582
Source: primary data
2.2.5. District health problem priorities
As part of the planning process, Ngoma district identified specific priorities within the district
health strategic plan. These priorities are a reflection of the greatest need in the district and the
interventions that would make the largest contribution in strengthening the health sector in the
district.
The overall district priorities are as follows: (i) uninterruptible water and electricity supply, (ii)
expansion and rehabilitation of existing health facilities and construction of new facilities where
needed, (iii) reducing the rates of under-five mortality and teenage pregnancy, (iv) reducing
malaria prevalence in district, (v) recruiting staff, capacity building, and providing staff
incentive, and (vi) CHWs training.
2.3. INTERNAL ANALYSIS
2.3.1. Structures of active services at Kibungo district hospital
Outpatient department: Consultation
Internal medicine: General internal medicine
Pediatrics: General pediatrics
Nutrition rehabilitation
Obstetrics and Gynecology: General obstetrics, Gynecological services, PMTCT
Traumatology and orthopedics
Medical Emergencies
General surgery
Medical imaging: General radiography, ultrasound
Laboratory
Psychiatry nursing care
Ophthalmology: General ophthalmology
Clinical psychology: Counseling, Psychotherapy
Pharmacy
Physiotherapy and acupuncture
20
Dental services
Anaesthesia and resuscitation
Social services: Internal social services
Reproductive Health: Family planning
2.3.2. Working conditions
In general Kibungo District Hospital is offering PMA and CPA (acupuncture, MDR TB). Its
laboratory become satellite laboratory. The working environmental is very favorable for staff
because the pay regularly salaries and FBP. It collaborates with its partners and stakeholders
through the CA and quarterly review meeting.
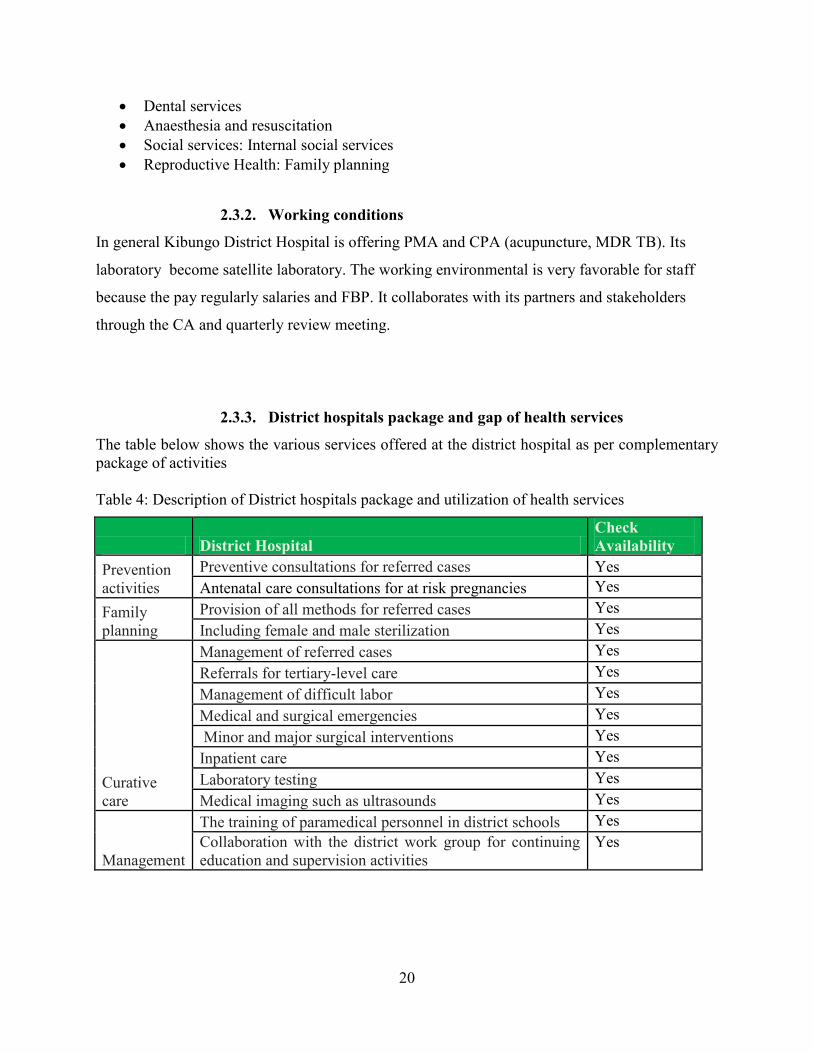
2.3.3. District hospitals package and gap of health services
The table below shows the various services offered at the district hospital as per complementary
package of activities
Table 4: Description of District hospitals package and utilization of health services
District Hospital
Check
Availability
Prevention
activities
Preventive consultations for referred cases Yes
Antenatal care consultations for at risk pregnancies Yes
Family
planning
Provision of all methods for referred cases Yes
Including female and male sterilization Yes
Curative
care
Management of referred cases Yes
Referrals for tertiary-level care Yes
Management of difficult labor Yes
Medical and surgical emergencies Yes
Minor and major surgical interventions Yes
Inpatient care Yes
Laboratory testing Yes
Medical imaging such as ultrasounds Yes
Management
The training of paramedical personnel in district schools Yes
Collaboration with the district work group for continuing
education and supervision activities
Yes
21
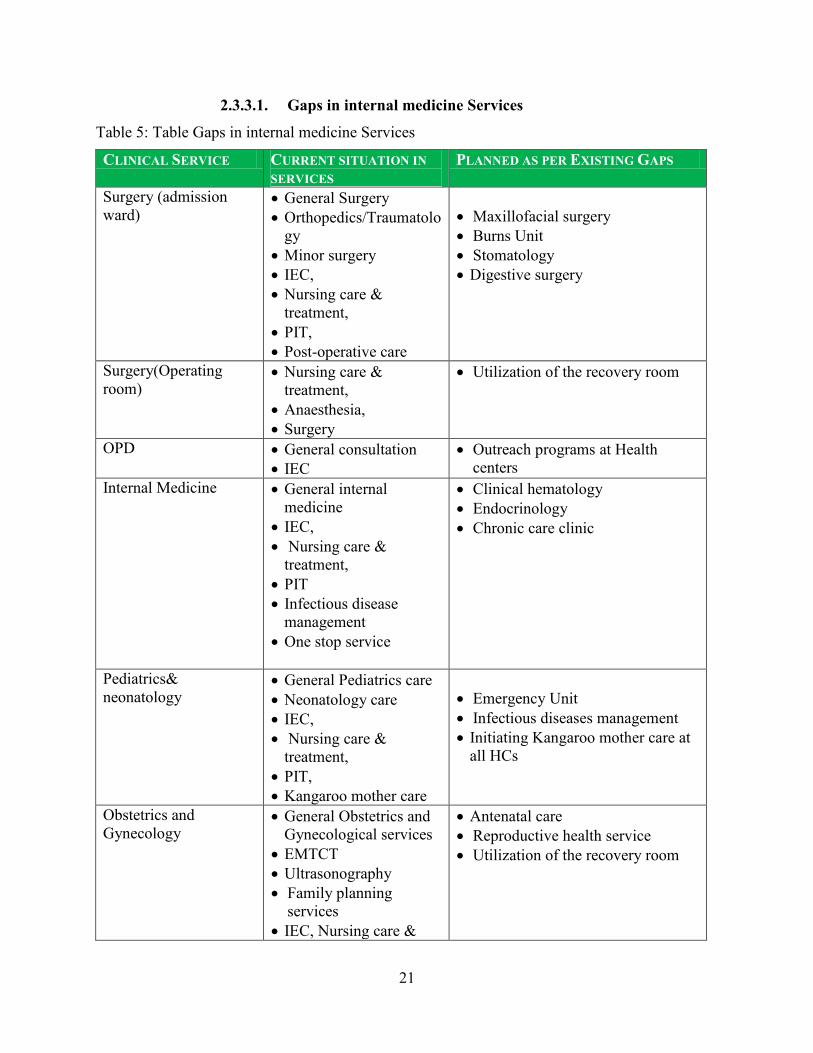
2.3.3.1. Gaps in internal medicine Services
Table 5: Table Gaps in internal medicine Services
CLINICAL SERVICE CURRENT SITUATION IN
SERVICES
PLANNED AS PER EXISTING GAPS
Surgery (admission
ward) General Surgery
Orthopedics/Traumatolo
gy
Minor surgery
IEC,
Nursing care &
treatment,
PIT,
Post-operative care
Maxillofacial surgery
Burns Unit
Stomatology
Digestive surgery
Surgery(Operating
room)
Nursing care &
treatment,
Anaesthesia,
Surgery
Utilization of the recovery room
OPD
General consultation
IEC
Outreach programs at Health
centers
Internal Medicine General internal
medicine
IEC,
Nursing care &
treatment,
PIT
Infectious disease
management
One stop service
Clinical hematology
Endocrinology
Chronic care clinic
Pediatrics&
neonatology General Pediatrics care
Neonatology care
IEC,
Nursing care &
treatment,
PIT,
Kangaroo mother care
Emergency Unit
Infectious diseases management
Initiating Kangaroo mother care at
all HCs
Obstetrics and
Gynecology General Obstetrics and
Gynecological services
EMTCT
Ultrasonography
Family planning
services
IEC, Nursing care &
Antenatal care
Reproductive health service
Utilization of the recovery room

22
CLINICAL SERVICE CURRENT SITUATION IN
SERVICES
PLANNED AS PER EXISTING GAPS
treatment,
PIT,
Post Operative care,
EMTCT,
Delivery services,
Cesarean section
Gynecological surgery
Traumatology and
Emergency Consultation,
Nursing care and
treatment
Minor surgery
Resuscitation
Care of burned patients
Medical emergency
Medical imaging General radiography
Ultrasonography
Thoraco-abdominal
radiology
Osteo-arthroradiology
Fluoroscopy
Interventional radiology
Dental panoramic X-ray
Laboratory General laboratory tests
Hematology
Parasitology
Immunoserology
Bacteriology
Biochemistry
Mycobacteriology
(microscopy)
Molecular biology
Immunohematology
virology
Endocrinology
Mycology
Ophthalmology General ophthalmology
Treatment,
Optometry
Admission
Minor surgery
Outreach service
ENT (ORL) None Otology
Audiology unit
Mental Health
Consultation,
Treatment,
Psychotherapy,
Health center
supervision
Outreach sessions
Intensive Care Unit None Set up ICU (intensive care unit)
23
CLINICAL SERVICE CURRENT SITUATION IN
SERVICES
PLANNED AS PER EXISTING GAPS
GBV Counseling and care
Health center
.supervision
One stop centre
Clinical Psychology Counseling
Palliative care
HIV/AIDS and terminal
care illnesses
PTSD management
Childhood disorders
Disaster and crisis intervention
Addiction (Alcohol and drug
abuse) management
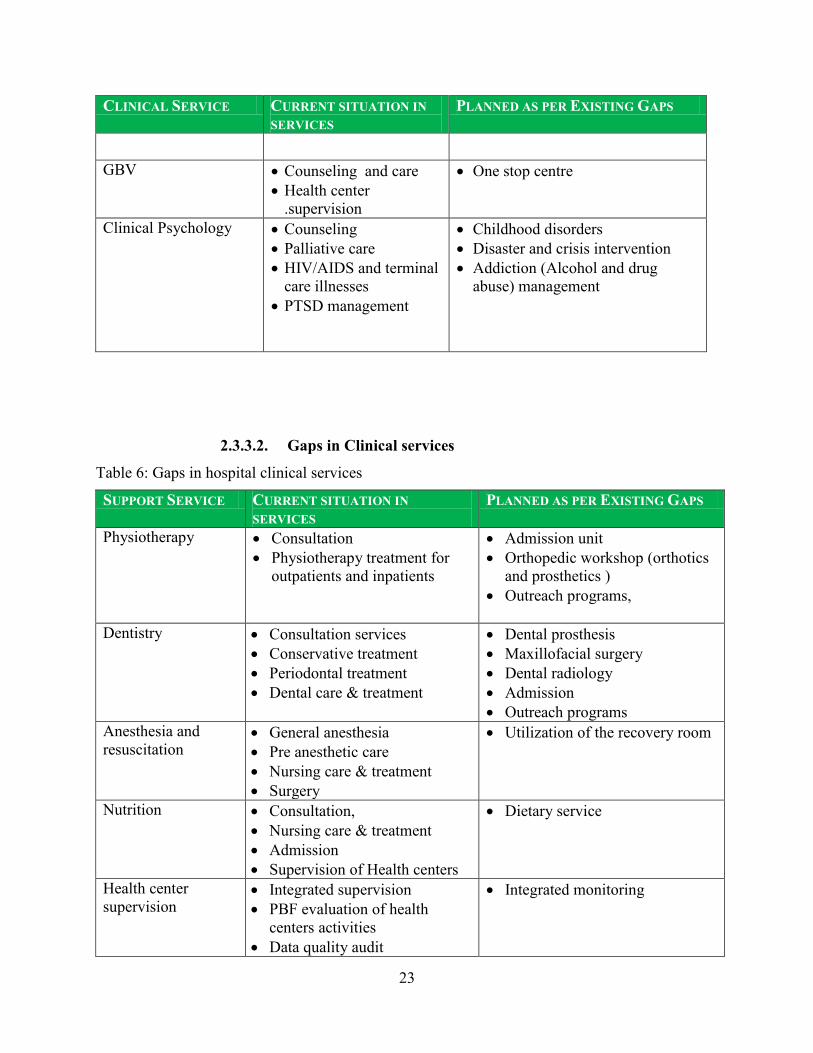
2.3.3.2. Gaps in Clinical services
Table 6: Gaps in hospital clinical services
SUPPORT SERVICE CURRENT SITUATION IN
SERVICES
PLANNED AS PER EXISTING GAPS
Physiotherapy Consultation
Physiotherapy treatment for
outpatients and inpatients
Admission unit
Orthopedic workshop (orthotics
and prosthetics )
Outreach programs,
Dentistry Consultation services
Conservative treatment
Periodontal treatment
Dental care & treatment
Dental prosthesis
Maxillofacial surgery
Dental radiology
Admission
Outreach programs
Anesthesia and
resuscitation General anesthesia
Pre anesthetic care
Nursing care & treatment
Surgery
Utilization of the recovery room
Nutrition Consultation,
Nursing care & treatment
Admission
Supervision of Health centers
Dietary service
Health center
supervision Integrated supervision
PBF evaluation of health
centers activities
Data quality audit
Integrated monitoring

24
SUPPORT SERVICE CURRENT SITUATION IN
SERVICES
PLANNED AS PER EXISTING GAPS
Social services Internal social services External social services
Sterilization Sterilization services Enhance sterilization services
2.3.4. Hospital personnel and human resource gap
The following table summarizes the staffing at Kibungo District Hospital.
Table 7: Kibungo District Hospital Personnel
Title Quality Current
staff
Needed
Staff
General Practitioner A0 11 24
A0 Pharmacist A0 2 3
Nurses A1 11 48
Midwives A1 6 30
Nurses A2 59 35
Nurses A3 A3 3 0
Paramedical staff Radiology A1 2 4
Ophthalmology A1 1 3
Dentists A1 2 4
Physiotherapists A1 0 3
Laboratory technicians A1 4 4
Laboratory technicians A2
Laboratory technicians A0
6
2
4
10
Anesthetists 3 5
Support Personnel A0 9 14
A1 2 2
A2 11 11
A3 5 5
Auxiliaries de santé 2 0
Sans qualification 5 0
Chauffeur 6 7
Supervisor Supervisor A0 3 10
Supervisor A1 2 3
Supervisor A2 1 0
25
Title Quality Current
staff
Needed
Staff
Total 158 229
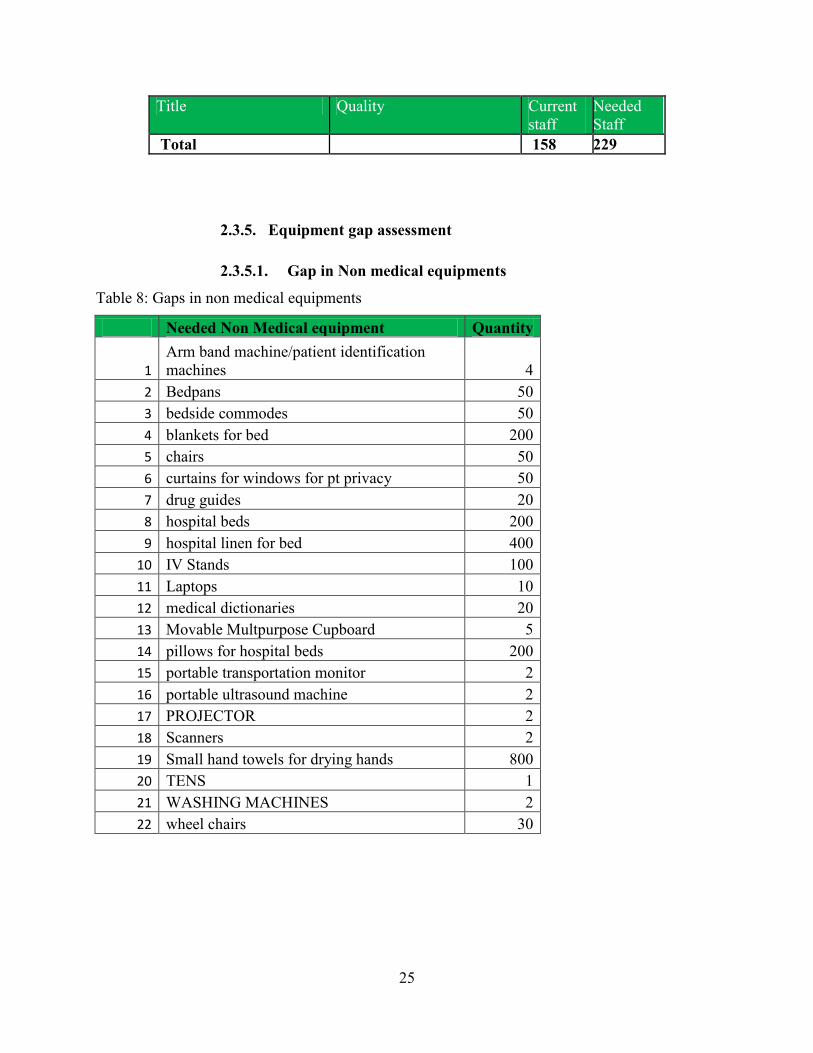
2.3.5. Equipment gap assessment
2.3.5.1. Gap in Non medical equipments
Table 8: Gaps in non medical equipments
Needed Non Medical equipment Quantity
1
Arm band machine/patient identification
machines 4
2 Bedpans 50
3 bedside commodes 50
4 blankets for bed 200
5 chairs 50
6 curtains for windows for pt privacy 50
7 drug guides 20
8 hospital beds 200
9 hospital linen for bed 400
10 IV Stands 100
11 Laptops 10
12 medical dictionaries 20
13 Movable Multpurpose Cupboard 5
14 pillows for hospital beds 200
15 portable transportation monitor 2
16 portable ultrasound machine 2
17 PROJECTOR 2
18 Scanners 2
19 Small hand towels for drying hands 800
20 TENS 1
21 WASHING MACHINES 2
22 wheel chairs 30
26
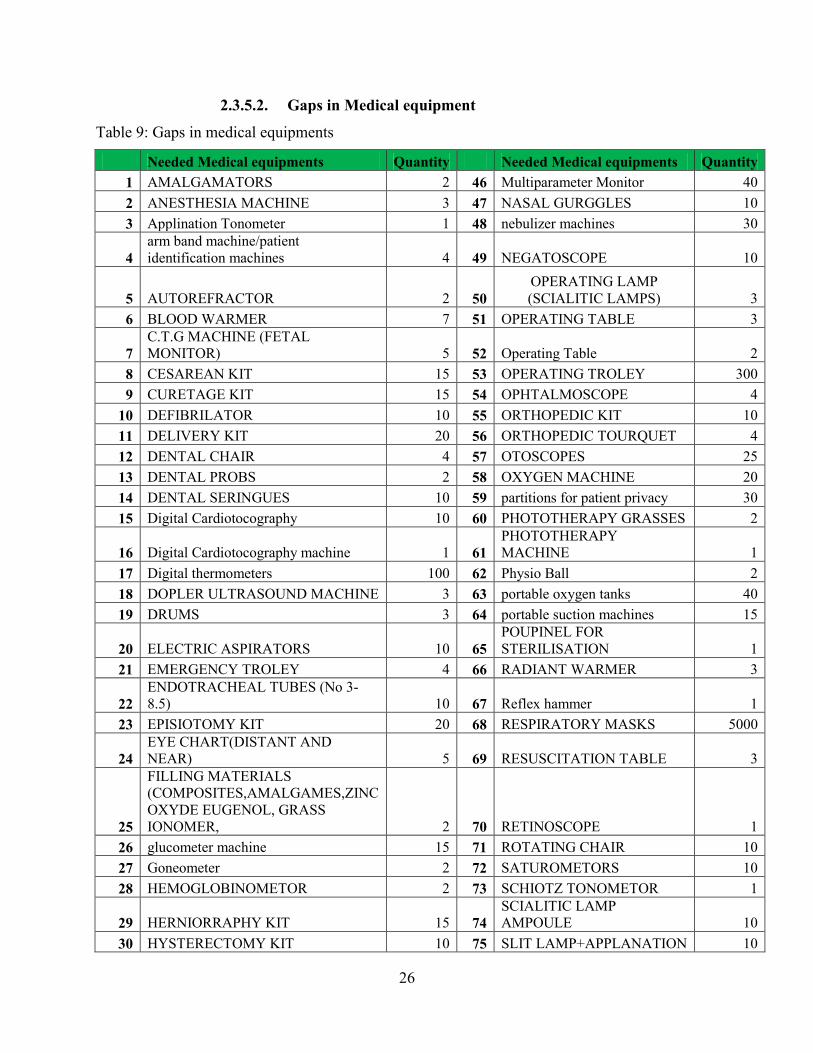
2.3.5.2. Gaps in Medical equipment
Table 9: Gaps in medical equipments
Needed Medical equipments Quantity Needed Medical equipments Quantity
1 AMALGAMATORS 2 46 Multiparameter Monitor 40
2 ANESTHESIA MACHINE 3 47 NASAL GURGGLES 10
3 Applination Tonometer 1 48 nebulizer machines 30
4
arm band machine/patient
identification machines 4 49 NEGATOSCOPE 10
5 AUTOREFRACTOR 2 50
OPERATING LAMP
(SCIALITIC LAMPS) 3
6 BLOOD WARMER 7 51 OPERATING TABLE 3
7
C.T.G MACHINE (FETAL
MONITOR) 5 52 Operating Table 2
8 CESAREAN KIT 15 53 OPERATING TROLEY 300
9 CURETAGE KIT 15 54 OPHTALMOSCOPE 4
10 DEFIBRILATOR 10 55 ORTHOPEDIC KIT 10
11 DELIVERY KIT 20 56 ORTHOPEDIC TOURQUET 4
12 DENTAL CHAIR 4 57 OTOSCOPES 25
13 DENTAL PROBS 2 58 OXYGEN MACHINE 20
14 DENTAL SERINGUES 10 59 partitions for patient privacy 30
15 Digital Cardiotocography 10 60 PHOTOTHERAPY GRASSES 2
16 Digital Cardiotocography machine 1 61
PHOTOTHERAPY
MACHINE 1
17 Digital thermometers 100 62 Physio Ball 2
18 DOPLER ULTRASOUND MACHINE 3 63 portable oxygen tanks 40
19 DRUMS 3 64 portable suction machines 15
20 ELECTRIC ASPIRATORS 10 65
POUPINEL FOR
STERILISATION 1
21 EMERGENCY TROLEY 4 66 RADIANT WARMER 3
22
ENDOTRACHEAL TUBES (No 3-
8.5) 10 67 Reflex hammer 1
23 EPISIOTOMY KIT 20 68 RESPIRATORY MASKS 5000
24
EYE CHART(DISTANT AND
NEAR) 5 69 RESUSCITATION TABLE 3
25
FILLING MATERIALS
(COMPOSITES,AMALGAMES,ZINC
OXYDE EUGENOL, GRASS
IONOMER, 2 70 RETINOSCOPE 1
26 glucometer machine 15 71 ROTATING CHAIR 10
27 Goneometer 2 72 SATUROMETORS 10
28 HEMOGLOBINOMETOR 2 73 SCHIOTZ TONOMETOR 1
29 HERNIORRAPHY KIT 15 74
SCIALITIC LAMP
AMPOULE 10
30 HYSTERECTOMY KIT 10 75 SLIT LAMP+APPLANATION 10

27
Needed Medical equipments Quantity Needed Medical equipments Quantity
TONOMETOR
31 INCUBATORS 4 76 Standing clutches 2
32 INFANT SCALES 10 77 Standing scale for adults 10
33 INFRA RED 2 78 standing scale for children 10
34 INFUSION WAMER 20 79 sthethoscopes(Littmans type) 50
35 IRRIGATOR 5 80 Stretchers 40
36 LAPAROTOMY KIT 10 81 STRETCHER (BRANCARD) 4
37 LARYNGEAL MASK 25 82 SUPPORT DRUMS 4
38 LARYNGOSCOPES 25 83 TENS 1
39 LENS METER 1 84 Traction bed 1
40 MAGNIFYING LAMP 3 85 Traction cable 3
41 MAYOR’S TABLE IN THEATRE 5 86 TRANSPORT INCUBATOR 3
42 METALIC DENTAL MIRRORS 20 87
TRIAL LENSSETAND
FLAME 1
43
MINOR SURGERY SET IN
OPHTALMOLOGY 1 88
VIBROMASSOR OF
PHYSIOTHERAPY 2
44 modern trolley carts for unit 30 89
WARD SCREEN
(PARAVENT) 20
45 MONOR SURGERY KIT 20
2.3.6. Infrastructure and gaps assessment
Table 10: Gaps in infrastructure
SERVICE CURRENT SITUATION IN
SERVICES
PLANNED AS PER EXISTING GAPS
Infrastructure
(Housing)
Inadequate Pharmacy stock
Insufficient Patients’ toilettes
Extension of pharmacy stock
Construction of new patients’
toilettes
Construction of patients’ waiting
room
Construction of new laboratory
Construction of the fence
Construction of public latrines at
the Hospital
Well organized hospital rooms to
ensure optimal use
Well functioning air-conditioning
in hospital server rooms and
admission rooms
Appropriate maintenance plan for
hospital buildings

28
SERVICE CURRENT SITUATION IN
SERVICES
PLANNED AS PER EXISTING GAPS
Electricity Availability of electricity
connection in all rooms
Presence of generator but it is
old
Presence of some fire
extinguishers.
Installation of automatic generator
Purchasing of power backup
Reviewing all electrical
connections in the hospital and
mapping according to new master
plan
Make electrical connection master
plan
Water Presence of water in hospital
Presence of Storage water
system
Maintenance of water
Increase of water storage system
Lavatory and
Sanitation Presence of lavatory
Extension of lavatory to meet
required standards.
Incinerator Presence of usual incinerator Construction of modern
incinerator unit.
Laundry unit Presence of usual laundry
Construction of a modern laundry
unit
Purchasing a drying machine.
Kitchen Presence kitchen services Construction of modern Kitchen
Canteen Presence canteen services Construction of modern canteen
Mortuary Presence of mortuary Construction of new modern
mortuary
Wastes Waste management system in
place.
Establish a waste disposal
management plan
Putting in place a standard waste
disposal system
General
Administration Presence of Security office
Presence of administration
bloc
Installation of EMR (electronic
Medical records)
Rehabilitation of administration
bloc
29
2.4. HOSPITAL PERFORMANCE ANALYSIS
2.4.1. Clinical efficacy
Kibungo clinical efficacy is based on providing the highest quality of healthcare based on MOH
norms and protocols. Their health providers are gaining skills through ongoing training and
Continuous Professional Development (CPD). Every department planed the activities and
submitted to the hospital director for approbation. The clinical departments are equipped with
minimum material and equipments.
2.4.2. Hygiene and patient safety
Hygiene and patient safety at KH are well controlled in different departments. The
Environmental Health Officer assumes the hospital hygiene supervision and gives the advice to
the company in charge of hygiene at hospital for improvement or change. The Kibungo District
Hospital goal is to promote the hospital hygiene and safety standards and ensure compliance with
regulatory requirements. Kibungo District Hospital conducts the training in the use, control and
disposal of hazardous chemicals.
2.4.3. Attention given to the patient
In Kibungo District Hospital, patient has the right to medical attention given by adequately
trained staff according to his or her state of health and circumstance that requires attention as
well as be informed when refer to other physician or other health unity. Attention given to the
medical emergency (patient arrival and triage) and to the non-contaminated patients are admitted
the usual treatment area. Contaminated patients are admitted to a specially prepared area.
2.4.4. Human Resource Management
The HR department provides expert advice and support to management and staff on all aspects
of HR management and plays a key role in strategic planning in Kibungo District Hospital.
Human Resource department is currently being reorganized and strengthened to meet the needs
of a dynamic and constantly changing Human Resource and health care environment.
2.4.5. Patient flow analysis
Patient flow used to identify problem in flow, identify personnel needs, space needs and track
personnel costs. Hospital use patient flow for deep analysis to better understanding of roles and
needs of different departments.
30
2.4.6. Management and Governance
2.4.6.1. Administrative management
Kibungo District Hospital is governed by the board of Directors. The board has power to govern,
control, manage and regulate the affairs of the hospital. Funding from the central level to support
hospital is funneled through the health management services fund. Hospital management
committee was set up as an oversight mechanism to unsure sound management of this funding
by the hospital management team. The committee consists of civil society and community
members as well as medical personnel and district government officials. The hospital has other
subcommittees such as quality assurance committee, hygiene committee, pharmacovigilance
committee, etc
2.4.6.2. Financial management
Kibungo District Hospital has a financial management system and it is well organized. It uses
financial software such as “QuickBooks” to manage all hospital fund inclusive fund from Global
fund but it also uses “Tompro” software for managing only money from Global fund. They have
an effective of hospital reimbursement systems on the financial in department. The department is
headed by hospital administrator.
2.5. ANALYSIS OF MAJOR ISSUES
2.5.1. Causes of mortality and morbidity in the district hospital
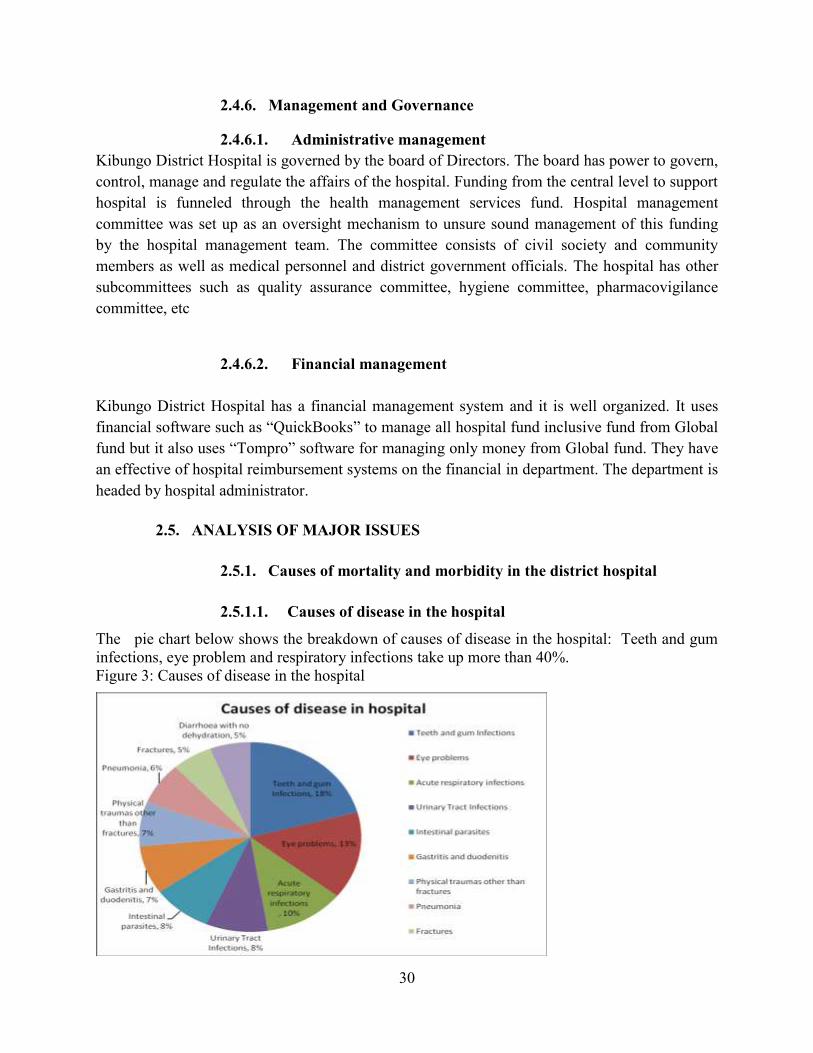
2.5.1.1. Causes of disease in the hospital
The pie chart below shows the breakdown of causes of disease in the hospital: Teeth and gum
infections, eye problem and respiratory infections take up more than 40%.
Figure 3: Causes of disease in the hospital
31
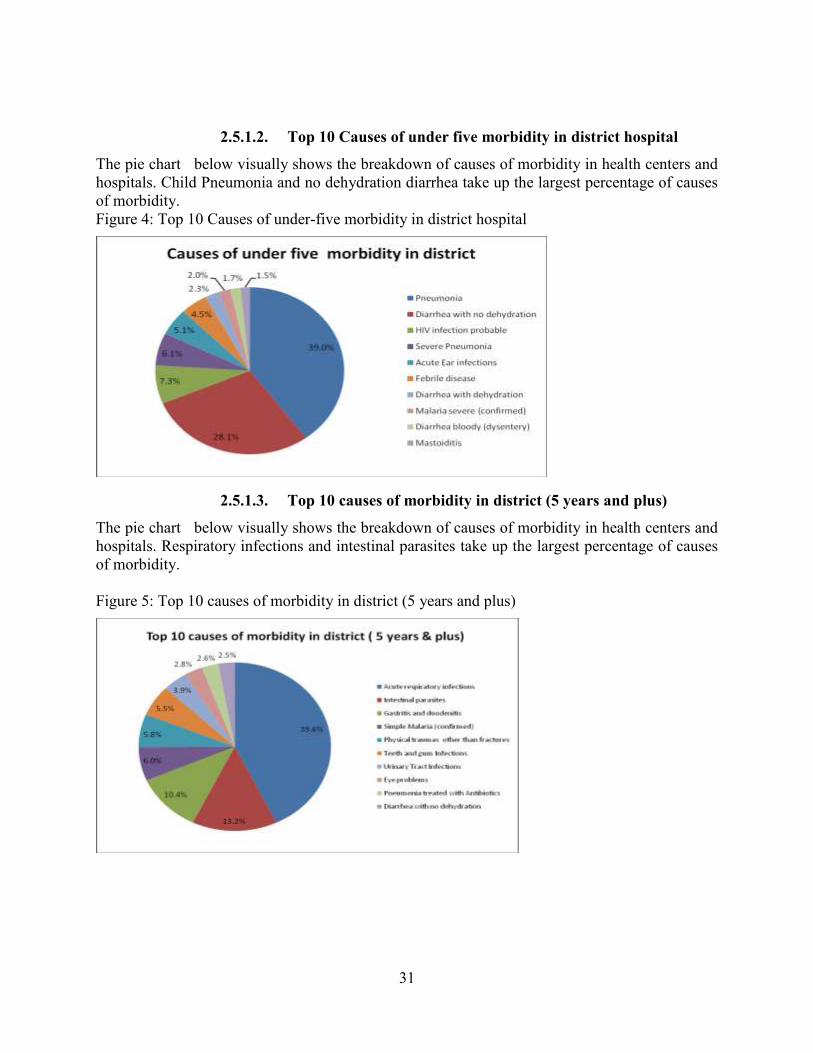
2.5.1.2. Top 10 Causes of under five morbidity in district hospital
The pie chart below visually shows the breakdown of causes of morbidity in health centers and
hospitals. Child Pneumonia and no dehydration diarrhea take up the largest percentage of causes
of morbidity.
Figure 4: Top 10 Causes of under-five morbidity in district hospital
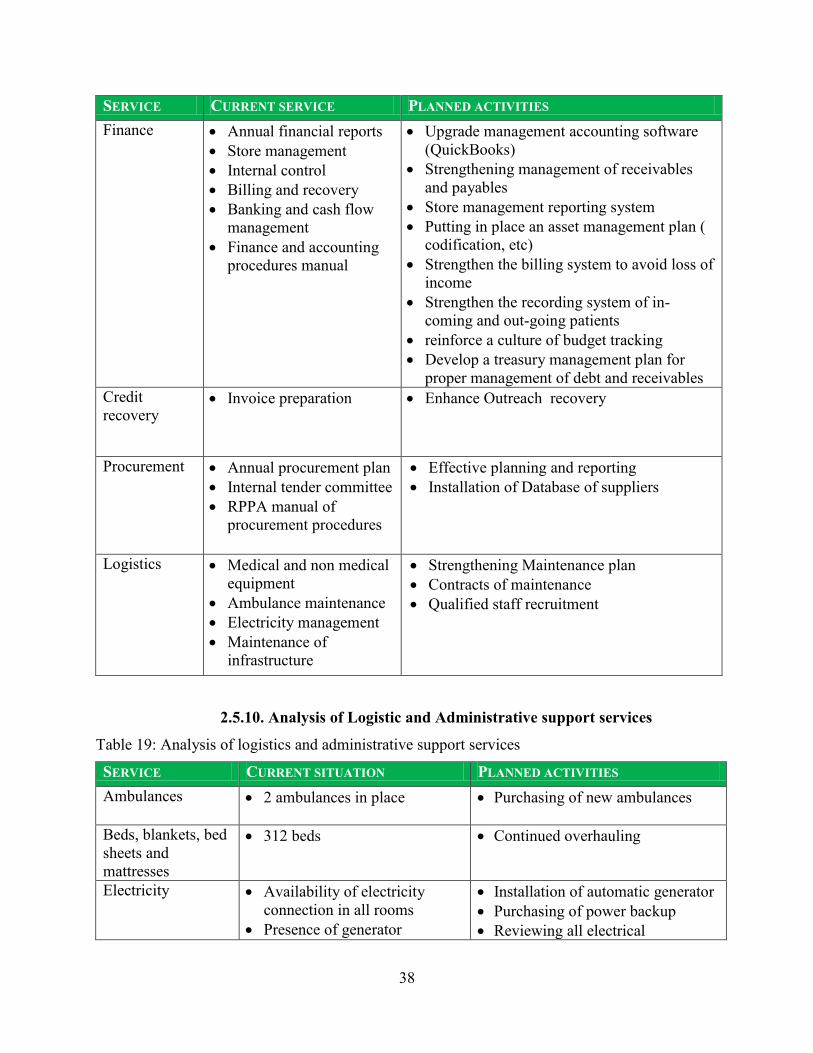
2.5.1.3. Top 10 causes of morbidity in district (5 years and plus)
The pie chart below visually shows the breakdown of causes of morbidity in health centers and
hospitals. Respiratory infections and intestinal parasites take up the largest percentage of causes
of morbidity.
Figure 5: Top 10 causes of morbidity in district (5 years and plus)

32
2.5.1.4. Top ten leading causes of death in Ngoma district
The pie chart below describes the breakdown of leading top ten causes of death in Ngoma health
facilities, HIV opportunistic infections, severe confirmed malaria and cardiomyopathy cause
more than 50% of all causes of death.
Figure 6: Top ten leading causes of death in Ngoma district hospital
2.5.2. Hospital SWOT analysis
This is the analysis of major issues (specifics, gap assessment, strengths and weaknesses,
problems and solutions, measured to the extent possible through delivery Units (Services) and
Management Units) .
Table 11: SWOT analysis
STRENGTHS
Strongly committed leadership
Clear vision, mission and values for the
hospital and other health facilities in our
catchment area
Ambulance are in 10 out of 13 public health
facilities
Existence of community outreach programs
Existence of Community health workers in all
villages
Chinese specialists
Existence of partner organizations
Hygiene committees in all health facilities and
the community
WEAKNESSES
Inadequate infrastructure
53% of patients are travelling more than 1 hour
to reach heath facility
Low level of sensitization in health promotion
activities
Population is not insured at 100%
Insufficient public toilette and public dust bins
in the community
Lack of proper waste management
Inadequate environmental health awareness
Lack of effective planning
Insufficient funds to support all health activities
Insufficient medical and non medical staff

33
Timely and standard of payments of PBF across
health sector
TB screening in all health facilities
Households have at least 1 Bed net
Existence of policy of protecting the lives of
women and children
Close follow up of women and children by
CHWs
Usage of computers and internet in health
facilities
Drugs distributed by district pharmacy van
Disciplined employees
Availability of land for extension
Insufficient specialized and trained staff
Unsatisfactory customer care
Inadequate remuneration
Insufficient LLN and even no place to buy
them
Insufficient equipment and some of the used
equipment are in poor condition
Lack of spare parts and accessories of medical
equipment.
Unskilled medical equipment users.
Inadequate outreach program in community
Insufficient information system tools
None integrated mental health in community
Stock out of drugs and consumables
Lack of pharmacist(A1) and midwives in health
centers
Ineffective management of suggestion boxes
Inadequate nutrition education outreach
program
None validated organizational structure
No proper safety procedures, emergency
protocols and preparedness
High over due by Mutuelle de santé
Inability to pay by clients
Inadequate management systems (financial,
biomedical & maintenance). Need for
electronic systems
OPPORTUNITIES
Kibungo district hospital to become a
provincial hospital.
Availability of ambulances in health centers
lacking them.
Training on environmental health
Capacity building programs
Follow up programs of teenage girls and
women between 15-19 years old.
Promote income generating activities
Adequate procedure for external procurement
of drugs
Strong development partners commitment to
improve Kibungo District Hospital’s quality of
service delivery
Better public image in terms of service delivery
Strong will for public and private partnership
for collaboration.
Solvency of the hospital clients due to
enrolment in insurance schemes (MMI, RAMA
& Mutuelles, etc…)
THREATS
Financial crisis
Dependence on government financial support
and NGO’s
Ignorance in the community
Malnutrition
High under five mortality rate
Talking about sex and reproductive health in
community is a taboo.
Staff overtime
High rate of teenager (15-19)pregnancies
Insufficient health institutions/schools
Drugs distributed by traditional healers
Language barrier

34
SWOT analysis have been conducted and possible solution has been done in order to improve
clinical efficacy, patient safety, attention to be given to patient , human resources , leadership
and governance patient flow analysis , services (quality and quantity), logistics, administration
and management .
These issues were evaluated at the organization and departmental levels and comprehensive
tables that identify the current and planned status of each area as follow:
2.5.3. Analysis of Leadership and Governance Status
Table 12: Analysis of leadership and governance
SERVICE CURRENT STATUS PLANNED
Leadership and
Governance Functions as a DH
Meetings on good
governance and
leadership
Existence of COGE and
Board of Directors
Regular meetings of existing committees in
the hospital
Joint partnership forum of hospital
stakeholders
Strengthening the hospital monitoring
system
Hospital open day
2.5.4. Analysis of Maternal child health
Maternal Child health has challenges such as insufficient of trained health providers; lack of
standardized supervision tools, insufficient health staff deployed in MCH program, stock out
(delay) of MCH product for example RPR reagents, partograph (for maternal and neonatal to
monitor, document, manager and assess labor) , ANC files. According to DHS, 2010 the under
five mortality rate still high (156/1000 live birth),the teenage women between 15-19 years old
who have had a live birth still high(8.3%) . Malnutrition is still a problem in the district as there
is malnourished children with weigh for age <-3SD is at 4.8.
The MCH performance indicators will be assessing through the monthly supervision and HMIS
report. The training report will be used to assess the trained staff on MCH performance.
Table 13: Analysis of Maternal Child Health
SERVICE CURRENT ACTIVITIES PLANNED
Maternity Emergency
Obstetric and
Antenatal care
Utilization of the recovery room

35
SERVICE CURRENT ACTIVITIES PLANNED
neonatal care
(EMONC)
Reproductive
health
Family Planning:
provision of FP
methods
Outreach programs in all Health
facilities (Supervision)
Advocacy for training of health care
providers
IMCI/ PCIME Training of
healthcare
providers
Supervision of
IMCI activities at
the HCs
Advocacy for training of trainers
Advocacy for provision of IMCI
logistics
Nutrition Consultation,
Nursing care &
treatment,
Admission
Supervision
Dietary service
2.5.5. Analysis of Health promotion and environmental health
Table 14: Analysis of environmental health
SERVICE CURRENT SITUATION PLANNED ACTIVITIES
Environmental
Health office
Hygiene and Sanitation
Waste management
Waste water management in health
facilities
Training on Hospital waste management
2.5.6. Analysis of disease prevention and control service
The vaccination performance indicators are assessed through the monthly supervision and HMIS
report. The challenges in vaccination programs are the low rate of children with all immunization
(86%) which is under the national average (90%). The training report will be used to assess the
trained staff on vaccination performance.
The HIV full package is available in all HFs. The HIV performance indicators will be assessing
through the monthly supervision and trac net plus HMIS report. The challenges are the lack of

36
standardized supervision tools, delay of HIV data collection tools especially registers, patients’
files and guidelines. The inappropriate infrastructure is big issue to offer HIV services in good
condition. Insufficient health providers trained in HIV management services. The training report
will be used to assess the trained staff on HIV performance.
The TB protocol, guidelines and policies are available. The TB performance indicators will be
assessing through the monthly supervision and quarterly HMIS report. The challenges are low
rate of TB screening and infection control. The training report will be used to assess the trained
staff on TB performance
The malaria protocol, guidelines and policies are available .The malaria performance indicators
will be assessing through the monthly supervision and SIS com plus HMIS report. The
challenges are delay of some medicine at community level, HC and district level .Unavailability
of posters and flyers. The training report will be used to assess the trained staff on Malaria
performance
The NCDs performance indicators will be assessing through the monthly supervision and HMIS
report. The challenges are the lack of standardized supervision tools; an unavailable data
collection tool especially registers patients’ files and guidelines, unavailable of posters and
flyers. The training report will be used to assess the trained staff on NCDs performance
Table 15: Analysis of disease prevention
SERVICE CURRENT SERVICE PLANNED ACTIVITIES
Vaccination Trained staff
Availability of vaccines
Supervision in health centers
Strengthening outreach programs
Quarterly monitoring
Vaccination of staff against disease
TB Trained staff
TB screening, testing and
treatment
MDR –TB unit
Supervision in health centers
Increase TB detection rate
HIV
HIV testing
PMTCT
PIT
VCT
HIV follow-up programs
Training of health providers
EMTCT
PMTCT in health post
Reproductive program of PLWHIV

37
2.5.7. Analysis of pharmacy services
Table 16: Analysis of hospital pharmacy service
SERVICE CURRENT SERVICE PLANNED SERVICES
Pharmacy General pharmacy
Dispensing service
Drugs information
service
Pharmacovigilance
services
Pharmacy Management Information
system
Magistral preparation plant
Outreach sessions
Enhancing clinical pharmacy
2.5.8. Analysis of Human Resources Services
Table 17: Analysis of human resource service
SERVICE CURRENT SERVICE PLANNED ACTIVITIES
Human
Resources Recruitment
Payroll Management
Performance
Management
Staff Planning
Training and
Development Leave
Management
Contract and filing
Management
Integrated Human Resource Management plan
Develop a human resources capacity building
plan
Review of Internal rules and regulations
Develop a staff retention strategy
Recruit qualified medical and none medical
personnel as per hospital structure
Public relations
Re-enforce all hospital departments
2.5.9. Analysis of Financial Management Services
Table 18: Analysis of financial management services
SERVICE CURRENT SERVICE PLANNED ACTIVITIES
NTD Diagnosis Availability of laboratory diagnosis tools
NTD unit
NCD Diagnosis Sensitization
NCD unit
Malaria Testing
Distribution of LLTN
Malaria treatment
Outreach programs
Trainings of health providers and CHWs
Enhance distribution of LLTN
38
SERVICE CURRENT SERVICE PLANNED ACTIVITIES
Finance Annual financial reports
Store management
Internal control
Billing and recovery
Banking and cash flow
management
Finance and accounting
procedures manual
Upgrade management accounting software
(QuickBooks)
Strengthening management of receivables
and payables
Store management reporting system
Putting in place an asset management plan (
codification, etc)
Strengthen the billing system to avoid loss of
income
Strengthen the recording system of in-
coming and out-going patients
reinforce a culture of budget tracking
Develop a treasury management plan for
proper management of debt and receivables
Credit
recovery Invoice preparation Enhance Outreach recovery
Procurement
Annual procurement plan
Internal tender committee
RPPA manual of
procurement procedures
Effective planning and reporting
Installation of Database of suppliers
Logistics
Medical and non medical
equipment
Ambulance maintenance
Electricity management
Maintenance of
infrastructure
Strengthening Maintenance plan
Contracts of maintenance
Qualified staff recruitment
2.5.10. Analysis of Logistic and Administrative support services
Table 19: Analysis of logistics and administrative support services
SERVICE CURRENT SITUATION PLANNED ACTIVITIES
Ambulances 2 ambulances in place Purchasing of new ambulances
Beds, blankets, bed
sheets and
mattresses
312 beds Continued overhauling
Electricity Availability of electricity
connection in all rooms
Presence of generator
Installation of automatic generator
Purchasing of power backup
Reviewing all electrical

39
SERVICE CURRENT SITUATION PLANNED ACTIVITIES
Presence of some fire
extinguishers.
connections in the hospital and
mapping according to new master
plan
Make electrical connection master
plan
Water Presence of water in hospital
Presence of Storage water
system
Maintenance of water
Increase of water storage system
Lavatory and
Sanitation Presence of lavatory
Extension of lavatory to meet
required standards.
Wastes Waste management system in
place.
Establish a waste disposal
management plan
Putting in place a standard waste
disposal system
Inspection of district and health
centers on waste management
Medical
equipments
Only a few biomedical
equipment are available in
different departments
Purchasing missing biomedical
equipment
Installation and supply of oxygen
cylinder in services
Rules and
regulations Validated internal rules and
regulations
Reviewing internal rules and
regulation.
A validated maintenance policy
and plan for infrastructure and
equipment
General
Administration Presence of Security office
Presence of Filing system
Presence of Central secretariat
Reception
Presence of Medical legal
service
Installation of EMR (electronic
Medical records)
Strengthening Public relations
services
To introduce some referral
services at the hospital.
2.5.11. Analysis of ICT Services
Table 20: Analysis of ITC service
SERVICE CURRENT SERVICE PLANNED ACTIVITIES
Equipment/software Internet/optic Fiber Digitalize all the information
40
Small LAN and wireless,
maintenance of computers and
its accessories in DH and HCs
systems; ranging from biomedical
to administrative
Develop a maintenance policy
and plan for hard and software
under the hospital administration
Improvement of local area
network
Equip the server room and
maintenance workshop
Advocacy for installation of
telemedicine conference room
Purchase of new IT equipment
Upgrading existing software
Establish the information security
management system(ISMS)
To create Hospital website
Cabling and provide wireless
connectivity in the entire hospital
2.5.12. Analysis of Quality and Safety Services
Table 21: Analysis of quality and safety service
SERVICE CURRENT SITUATION PLANNED ACTIVITIES
Quality
Assurance Presence of quality assurance
committee
Data quality analysis
Presence of few Policies and
procedures manual
Presence of PBF
Clinical review of medical
records
Training for quality assurance
Quality assurance committees in all
departments
Strengthening analysis of quality data
Elaborate standard clinical procedures
Monitoring and evaluating of district
hospital and health centers quality
indicators
Strengthening Internal quality awards
and motivation system
Reinforce Clinical review of medical
records
Patient and
Employee
Safety
Presence of some validated
safety policy and procedures
Establish risk management policy and
plan that covers patient safety;
occupational health; emergency plan;
continuous training on employee and
patient safety
Put up a functional safety committee
Put up a validated plan for Clinical
audits

41
Establish a plan for Clinical
effectiveness including pharmaco-
vigilance
Infection
Control Validated infection control
policy in Internal Medicine
Introduce this validated infection
control policy across all departments
with a corresponding monitoring and
evaluation plan
Clients’
Rights Presence of validated policy
and a plan of these rights
Strengthen implementation of these
rights
Customer
care Presence of customer care Reinforce a proper and well functioning
customer care service
III. STRATEGIC PLAN
3. KIBUNGO DISTRICT HOSPITAL KEY PRIORITIES
A consensus was reached on 11 key strategic priorities to examine goal, strategic, indicator,
baseline and targets have been developed to address the following areas:
1. Leadership and governance
2. Clinical service
3. Maternal child health
4. Disease prevention and control
5. Health promotion and environmental health
6. Human resources
7. Financial management
8. Drugs and consumables
9. Administrative support services
10. Information and communication technology
11. Quality and safety management
3.1. MEDICAL PRIORITIES
The top medical priorities are as follows:
42
3.1.1. Maternal and child health
To reduce maternal and child mortality rate
To promote reproductive health
To eliminate malnutrition
3.1.2. Clinical service
To avail needed biomedical and non-medical equipment
To reinforce outreach programs
Capacity-building plan
Develop disease norms and protocols
Put in place an archive system
3.1.3. Disease prevention and control
Malaria prevalence and control
Disease screening and surveillance ( TB, Malnutrition)
Management of Community case
Strengthening IDSR in hospital
3.1.4. Health promotion and environmental health
Construction of public latrines at the Hospital
Waste and water treatment/management in the hospital
Training of Hospital staff on waste management
3.2. SUPPORTING SYSTEM PRIORITIES
The top priorities in the supporting system are as follows:
3.2.1. Leadership and governance
Establish an operational framework (implementation, M&E, etc)
Regular meetings of existing committees in the hospital
To strengthen the hospital monitoring system
3.2.2. Human resources
Increase number of clinical and support staff
Develop a human resource capacity-building plan
Strengthen performance management system (Continuous Program Development)
43
3.2.3. Financial management
Upgrade management accounting software (QuickBooks)
Strengthen the billing system to avoid loss of income
Budget and procurement plan tracking and effective reporting
Strengthen the recording system of incoming and outgoing patients
3.2.4. Drugs and consumables
Annual procurement plan
Usage of Pharmacy Management Information System
DTC training and well functioning
3.2.5. Administrative support services
Well organized hospital rooms to ensure optimal use
Appropriate maintenance plan of hospital buildings
Construction of mortuary, laboratory, and waiting room
Extension of pharmacy stock
3.2.6. Data management and ICT
Purchasing of ICT equipment
Construction of server room and maintenance workshop
Hospital website
Cabling and providing wireless connectivity in the entire hospital
Harmonize data collection tools and provide electronic data management system
Assure data quality system (training, monitoring and evaluation)
3.2.7. Quality and safety management
Provide quality services and customer care
Put in place mechanisms to implement the customer care norms and standards guidelines
in health facilities
Establish strategies for managing complaints
Conduct customer care satisfaction surveys
44
4. LOGICAL FRAMEWORK OF KIBUNGO DISTRICT HOSPITAL
4.1. HEALTH PROGRAM
4.1.1. Maternal and child health
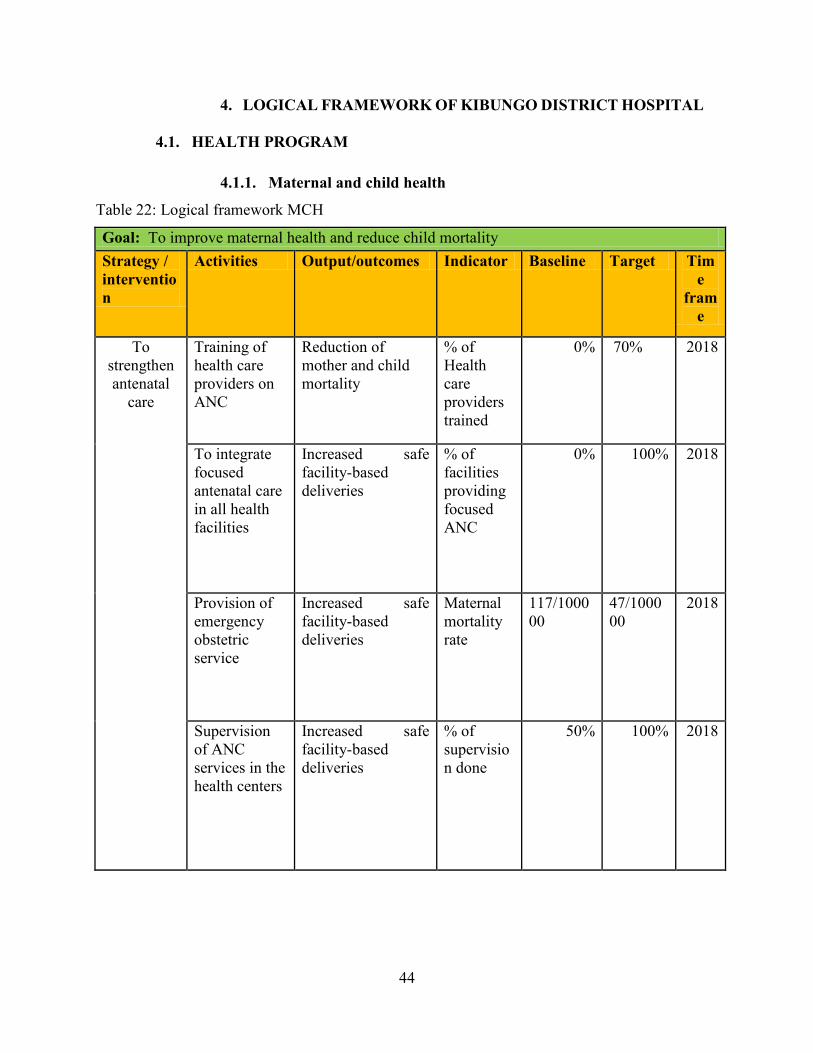
Table 22: Logical framework MCH
Goal: To improve maternal health and reduce child mortality
Strategy /
interventio
n
Activities Output/outcomes Indicator Baseline Target Tim
e
fram
e
To
strengthen
antenatal
care
Training of
health care
providers on
ANC
Reduction of
mother and child
mortality
% of
Health
care
providers
trained
0% 70% 2018
To integrate
focused
antenatal care
in all health
facilities
Increased safe
facility-based
deliveries
% of
facilities
providing
focused
ANC
0% 100% 2018
Provision of
emergency
obstetric
service
Increased safe
facility-based
deliveries
Maternal
mortality
rate
117/1000
00
47/1000
00
2018
Supervision
of ANC
services in the
health centers
Increased safe
facility-based
deliveries
% of
supervisio
n done
50% 100% 2018
45
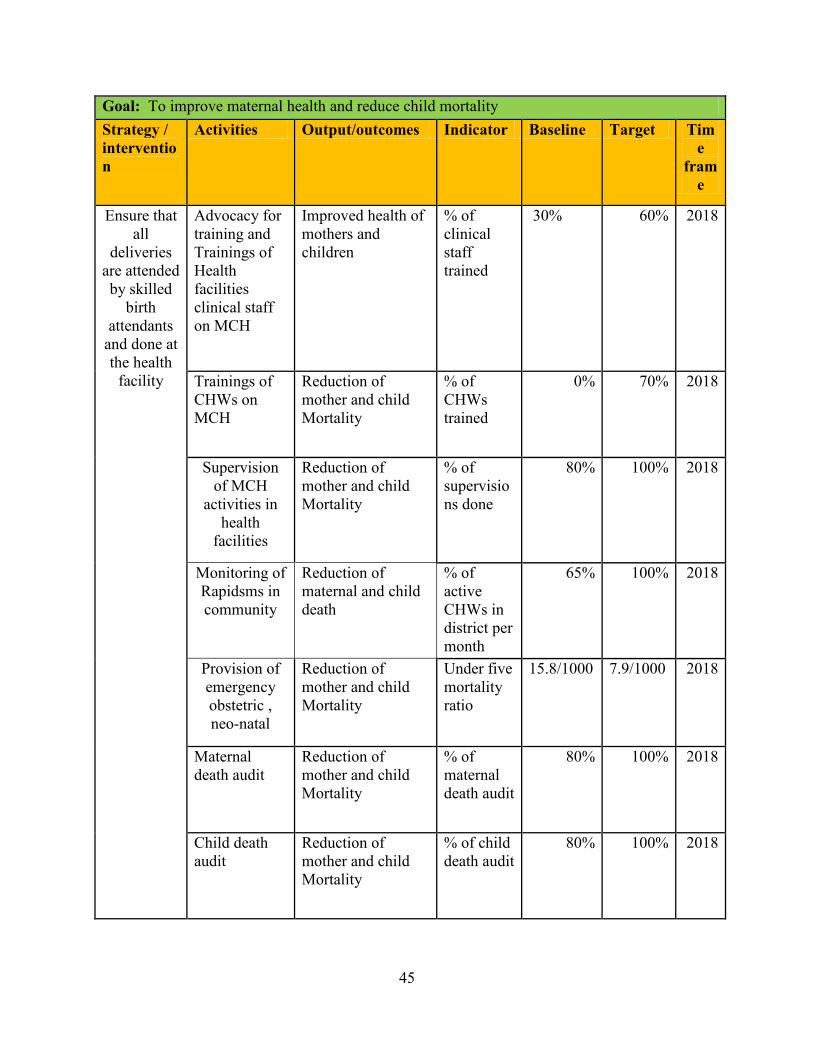
Goal: To improve maternal health and reduce child mortality
Strategy /
interventio
n
Activities Output/outcomes Indicator Baseline Target Tim
e
fram
e
Ensure that
all
deliveries
are attended
by skilled
birth
attendants
and done at
the health
facility
Advocacy for
training and
Trainings of
Health
facilities
clinical staff
on MCH
Improved health of
mothers and
children
% of
clinical
staff
trained
30% 60% 2018
Trainings of
CHWs on
MCH
Reduction of
mother and child
Mortality
% of
CHWs
trained
0% 70% 2018
Supervision
of MCH
activities in
health
facilities
Reduction of
mother and child
Mortality
% of
supervisio
ns done
80% 100% 2018
Monitoring of
Rapidsms in
community
Reduction of
maternal and child
death
% of
active
CHWs in
district per
month
65% 100% 2018
Provision of
emergency
obstetric ,
neo-natal
Reduction of
mother and child
Mortality
Under five
mortality
ratio
15.8/1000 7.9/1000 2018
Maternal
death audit
Reduction of
mother and child
Mortality
% of
maternal
death audit
80% 100% 2018
Child death
audit
Reduction of
mother and child
Mortality
% of child
death audit
80% 100% 2018

46
Goal: To improve maternal health and reduce child mortality
Strategy /
interventio
n
Activities Output/outcomes Indicator Baseline Target Tim
e
fram
e
Strengtheni
ng
surveillance
system of
measles,
neonatal
tetanus,
flask
paralysis
-Availing
reporting
tools to all
health
facilities. To
ensure
effective and
proper
communicatio
n
system/reporti
ng system
Strong surveillance
system and timely
reporting
% of
reports
submitted
on time
N/A 100% 201
3
Strengthen
Integrated
managemen
t of
neonatal
and
childhood
illnesses in
all health
facilities
Strengthenin
g supervision
at the HCs
Reduction of child
morbidity and
mortality
% of
supervisio
ns done
80% 100% 2018
Training
CHWs and
Clinical staff
at HCs on
neonatal and
child illness
Reduction of child
morbidity and
mortality
% of
CHWs and
clinical
staff
trained
33% 100% 2014
47
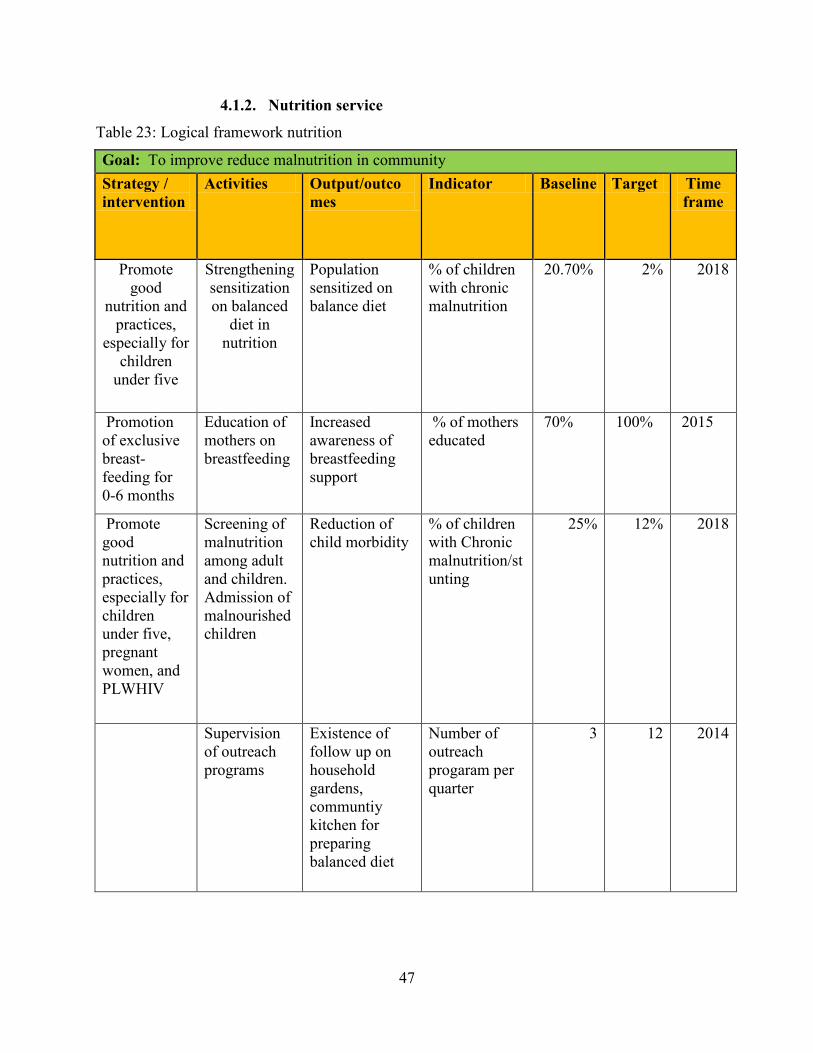
4.1.2. Nutrition service
Table 23: Logical framework nutrition
Goal: To improve reduce malnutrition in community
Strategy /
intervention
Activities Output/outco
mes
Indicator Baseline Target Time
frame
Promote
good
nutrition and
practices,
especially for
children
under five
Strengthening
sensitization
on balanced
diet in
nutrition
Population
sensitized on
balance diet
% of children
with chronic
malnutrition
20.70% 2% 2018
Promotion
of exclusive
breast-
feeding for
0-6 months
Education of
mothers on
breastfeeding
Increased
awareness of
breastfeeding
support
% of mothers
educated
70% 100% 2015
Promote
good
nutrition and
practices,
especially for
children
under five,
pregnant
women, and
PLWHIV
Screening of
malnutrition
among adult
and children.
Admission of
malnourished
children
Reduction of
child morbidity
% of children
with Chronic
malnutrition/st
unting
25% 12% 2018
Supervision
of outreach
programs
Existence of
follow up on
household
gardens,
communtiy
kitchen for
preparing
balanced diet
Number of
outreach
progaram per
quarter
3 12 2014
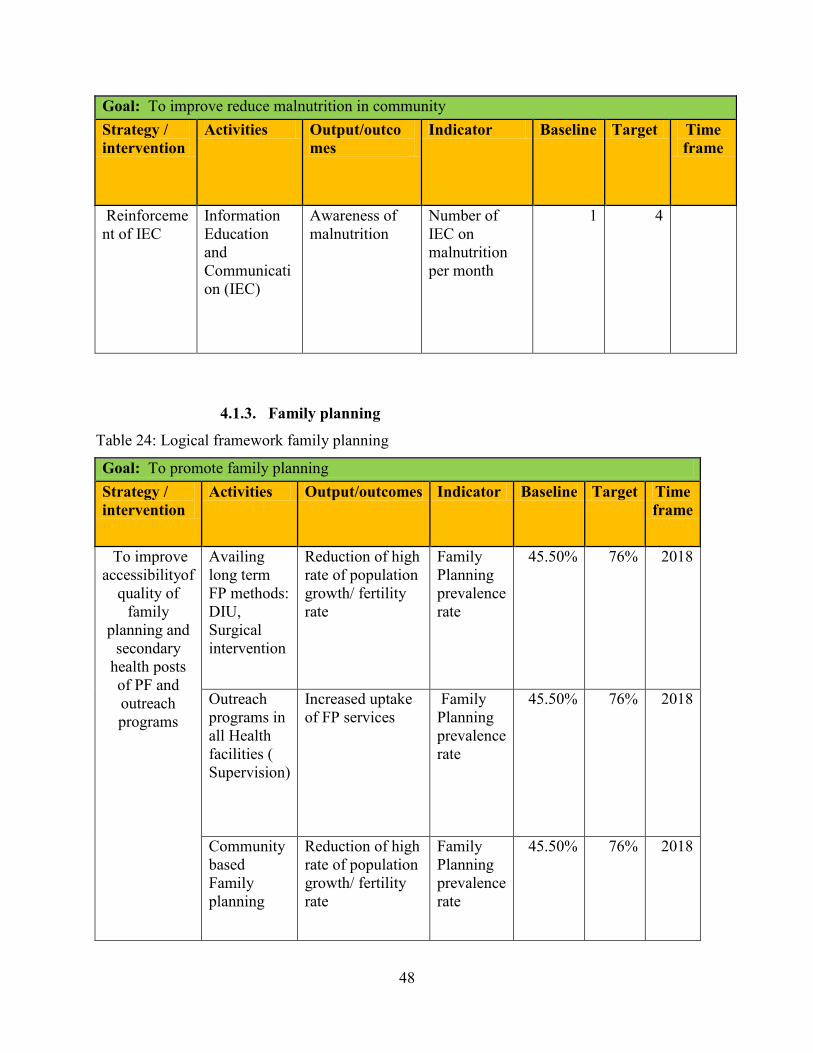
48
Goal: To improve reduce malnutrition in community
Strategy /
intervention
Activities Output/outco
mes
Indicator Baseline Target Time
frame
Reinforceme
nt of IEC
Information
Education
and
Communicati
on (IEC)
Awareness of
malnutrition
Number of
IEC on
malnutrition
per month
1 4
4.1.3. Family planning
Table 24: Logical framework family planning
Goal: To promote family planning
Strategy /
intervention
Activities Output/outcomes Indicator Baseline Target Time
frame
To improve
accessibilityof
quality of
family
planning and
secondary
health posts
of PF and
outreach
programs
Availing
long term
FP methods:
DIU,
Surgical
intervention
Reduction of high
rate of population
growth/ fertility
rate
Family
Planning
prevalence
rate
45.50% 76% 2018
Outreach
programs in
all Health
facilities (
Supervision)
Increased uptake
of FP services
Family
Planning
prevalence
rate
45.50% 76% 2018
Community
based
Family
planning
Reduction of high
rate of population
growth/ fertility
rate
Family
Planning
prevalence
rate
45.50% 76% 2018
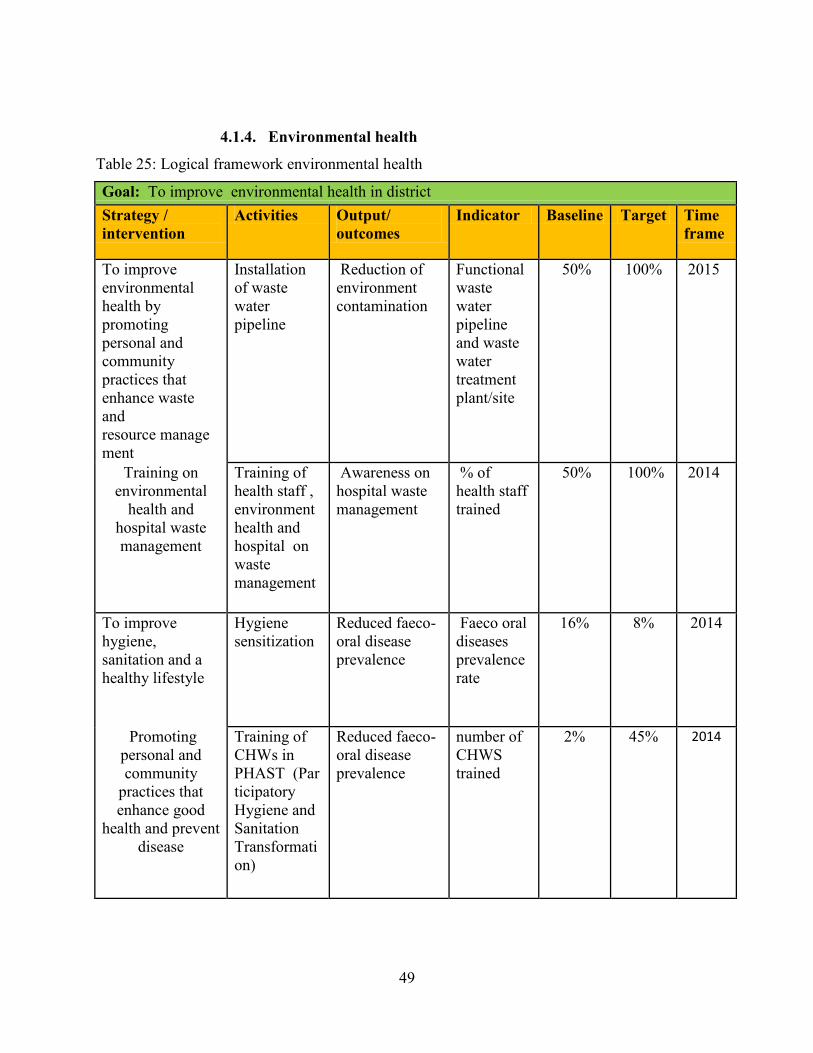
49
4.1.4. Environmental health
Table 25: Logical framework environmental health
Goal: To improve environmental health in district
Strategy /
intervention
Activities Output/
outcomes
Indicator Baseline Target Time
frame
To improve
environmental
health by
promoting
personal and
community
practices that
enhance waste
and
resource manage
ment
Installation
of waste
water
pipeline
Reduction of
environment
contamination
Functional
waste
water
pipeline
and waste
water
treatment
plant/site
50% 100% 2015
Training on
environmental
health and
hospital waste
management
Training of
health staff ,
environment
health and
hospital on
waste
management
Awareness on
hospital waste
management
% of
health staff
trained
50% 100% 2014
To improve
hygiene,
sanitation and a
healthy lifestyle
Hygiene
sensitization
Reduced faeco-
oral disease
prevalence
Faeco oral
diseases
prevalence
rate
16% 8% 2014
Promoting
personal and
community
practices that
enhance good
health and prevent
disease
Training of
CHWs in
PHAST (Par
ticipatory
Hygiene and
Sanitation
Transformati
on)
Reduced faeco-
oral disease
prevalence
number of
CHWS
trained
2% 45% 2014

50
Goal: To improve environmental health in district
Strategy /
intervention
Activities Output/
outcomes
Indicator Baseline Target Time
frame
Sensitization
on waste
management
Awareness of
waste
management
Number of
sensitizatio
n report per
quarter
0 1 2018
Water testing Safe drinking
water
% of water
source
tested
64% 90% 2018
4.1.5. Integrated disease Surveillance and Response
Table 26: Logical framework integrated disease Surveillance and Response
Goal: To improve the integrated disease Surveillance and Response
Strategy /
intervention
Activities Output/outcomes Indicator Baseline Target Time
frame
Promote the
Integrated
disease
Surveillance
and
response
Training on
outbreak
investigation
and IDSR
reporting
Timely reporting % of IDSR
team
trained
20% 100% 2014
To elect
IDSR
committee in
sectors,
hospital and
district level
Timely
investigation and
response
Number of
IDRS
committee
0 16 2014

51
Goal: To improve the integrated disease Surveillance and Response
Strategy /
intervention
Activities Output/outcomes Indicator Baseline Target Time
frame
Strengthen
the link
between
CHWs and
health
facilities
Strengthening
the
collaboration
between the
health
facilities and
CHWs
Population is
knowledgeable
about disease
prevention and
control
% of
patients
which
received
drugs
under
direct
observation
of CHWs
50% 100% 2018
Radio spot
programs on
diseases
prevalence
Population is
knowledgeable
about disease
prevention and
control
Number of
Radio sport
program
per year
0 1 2018
4.1.6. HIV
Table 27: Logical framework HIV
Goal: To prevent the spread of infection and reduce disease incidence
Strategy /
intervention
Activities Output/outcomes Indicator Baseline Target Time
frame
Prevention
of HIV
incidence in
community
To
strengthen
VCT and
PIT services
Reduced by 50%
HIV incidence.
% HIV
incidence
among men
and women
0.6% 0.3% 2018
Radio spot
programs on
HIV
prevalence
The general
population is
knowledgeable
about HIV and
PMTCT programs
Number of
Radio sport
per year
0 2 2018
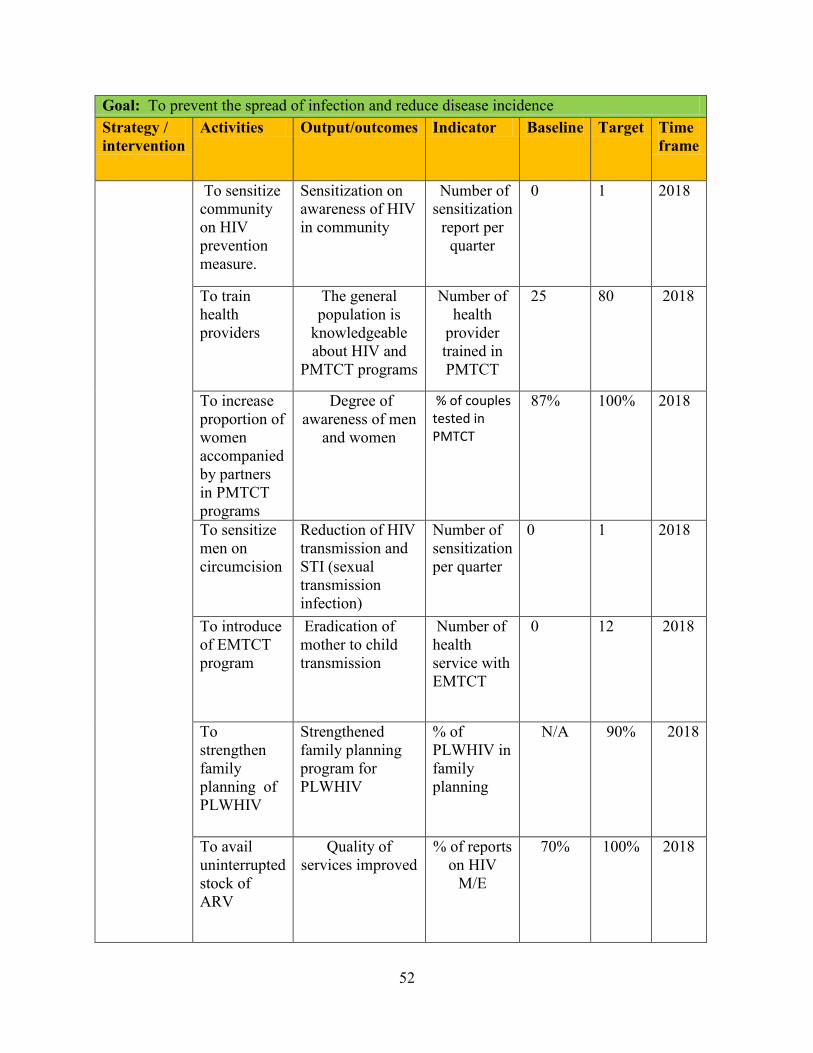
52
Goal: To prevent the spread of infection and reduce disease incidence
Strategy /
intervention
Activities Output/outcomes Indicator Baseline Target Time
frame
To sensitize
community
on HIV
prevention
measure.
Sensitization on
awareness of HIV
in community
Number of
sensitization
report per
quarter
0 1 2018
To train
health
providers
The general
population is
knowledgeable
about HIV and
PMTCT programs
Number of
health
provider
trained in
PMTCT
25 80 2018
To increase
proportion of
women
accompanied
by partners
in PMTCT
programs
Degree of
awareness of men
and women
% of couples tested in PMTCT
87% 100% 2018
To sensitize
men on
circumcision
Reduction of HIV
transmission and
STI (sexual
transmission
infection)
Number of
sensitization
per quarter
0 1 2018
To introduce
of EMTCT
program
Eradication of
mother to child
transmission
Number of
health
service with
EMTCT
0 12 2018
To
strengthen
family
planning of
PLWHIV
Strengthened
family planning
program for
PLWHIV
% of
PLWHIV in
family
planning
N/A 90% 2018
To avail
uninterrupted
stock of
ARV
Quality of
services improved
% of reports
on HIV
M/E
70% 100% 2018
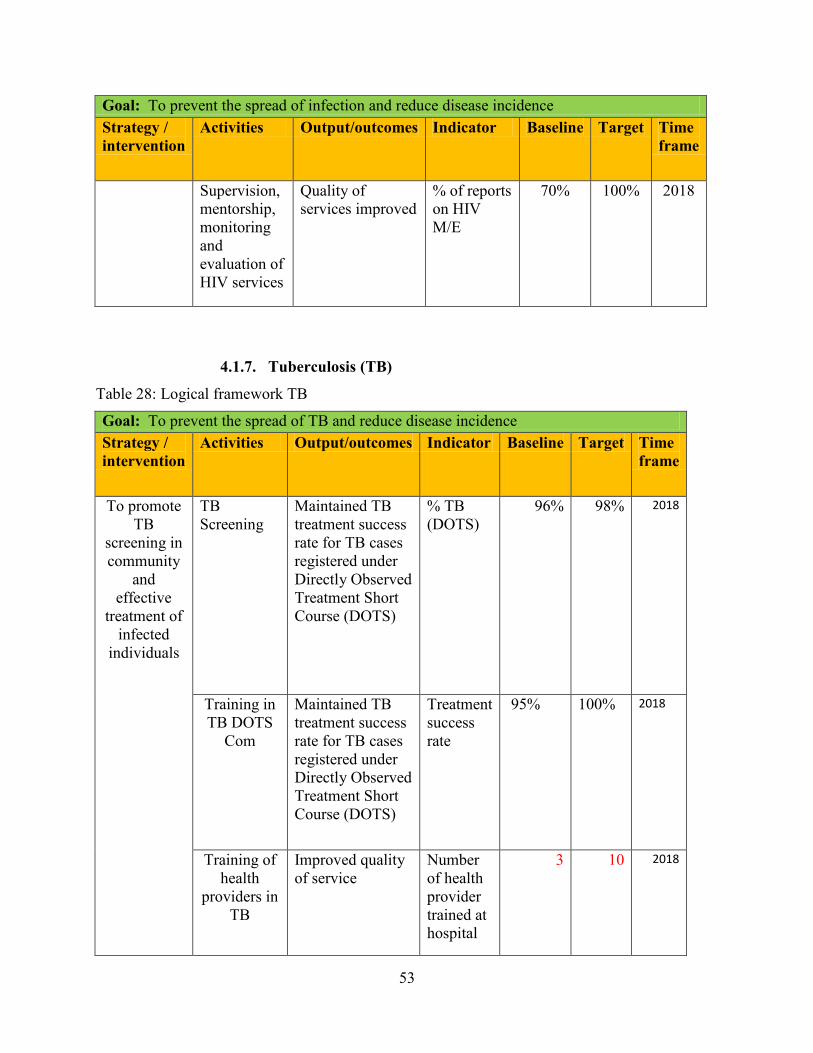
53
Goal: To prevent the spread of infection and reduce disease incidence
Strategy /
intervention
Activities Output/outcomes Indicator Baseline Target Time
frame
Supervision,
mentorship,
monitoring
and
evaluation of
HIV services
Quality of
services improved
% of reports
on HIV
M/E
70% 100% 2018
4.1.7. Tuberculosis (TB)
Table 28: Logical framework TB
Goal: To prevent the spread of TB and reduce disease incidence
Strategy /
intervention
Activities Output/outcomes Indicator Baseline Target Time
frame
To promote
TB
screening in
community
and
effective
treatment of
infected
individuals
TB
Screening
Maintained TB
treatment success
rate for TB cases
registered under
Directly Observed
Treatment Short
Course (DOTS)
% TB
(DOTS)
96% 98% 2018
Training in
TB DOTS
Com
Maintained TB
treatment success
rate for TB cases
registered under
Directly Observed
Treatment Short
Course (DOTS)
Treatment
success
rate
95% 100% 2018
Training of
health
providers in
TB
Improved quality
of service
Number
of health
provider
trained at
hospital
3 10 2018

54
Goal: To prevent the spread of TB and reduce disease incidence
Strategy /
intervention
Activities Output/outcomes Indicator Baseline Target Time
frame
Increase the
number of
CDT
Improved quality
of service
Number
on new
CDT
5 7 2018
Supervision,
monitoring
and
evaluation
of health
centers
Improved quality
of service
Detection
rate
41% 85% 2018
4.1.8. Integrated Management of Childhood Hilliness
Table 29: Logical framework Integrated Management of Childhood Hillness
Goal: To improve the Integrated Management of Childhood Hillness
Strategy /
intervention
Activities Output/outcomes Indicator Baseline Target Time
frame
To
strengthen
IMCH
service in
health
facilities and
in
community
Provision
IMCH
service
Reduction of
mother and child
Mortality
Under five
mortality
ratio
15.8/1000 7.9/1000 2018
Training on
IMCH
clinic
Reduction of
mother and child
Mortality
% of health
provider
trained
10% 50% 2018
Training on
IMCH to
CHWs
Reduction of
mother and child
Mortality
% of
CHWs
trained
0 100% 2018
Supervision
of IMCI
activities in
health
facilities
Reduction of
mother and child
Mortality
Number of
supervision
per month
1 2 2018

55
4.1.9. Malaria
Table 30: Logical framework malaria
Goal: To improve management of malaria
Strategy /
intervention
Activities Output/outcomes Indicator Baseline Target Time
frame
Malaria
diagnosis
and curative
Interventions
reinforced
To
strengthen
outreach
programs
Decreased
malaria
prevalence
% of malaria
case
5.30% 1% 2018
Trainings of
health
providers in
malaria case
management
Improved the
quality of service
% of health
provider
trained in
Malaria
(hospital and
health center)
27% 100% 2018
Trainings
and
refresher
training of
CHWs on
RDT
Improved the
quality of service
% of CHWs
trained in
malaria
97% 100% 2018
Distribution
of LLTN
Usage of LLTN
in the community
for malaria
prevention
Number of
household with
2 LLTN
20% 100% 2018
Follow up
health center
activities in
malaria
prevention
Supervision,
monitoring
and
evaluation
of health
centers
Increased
proportion of
malaria case
treatment
(pediatric and
adult)
% of children
under five with
malaria that
receive
appropriate and
affordable
treatment
within 24 hours
95% 100% 2018

56
4.1.10. Non-communicable disease
Table 31: Logical framework NCD
Goal: To improve the prevention of Non-communicable disease
Strategy /
intervention
Activities Output/outcomes Indicator Baseline Target Time
frame
Non-
communicable
disease
prevention,
diagnosis and
treatment
Training
of health
providers
Integration of care
and treatment for
chronic diseases
into the packages
for all levels of
the health system
% of Public
facilities
providing
integrated
management
of chronic
disease
10% 100% 2018
4.1.11. Neglected tropical disease
Table 32: Logical framework NTD
Goal: To improve control NTDs
Strategy /
intervention
Activities Output/outcomes Indicator Baseline Target Time
frame
Adequate
management
of cases of
NTDs
including
parasitic
diseases
Training
of health
providers
Diagnosis of
NTDs and
reduced
prevalence of soil
transmitted
helminthes in
school aged
children and
under five
children
Percentage
of health
providers
trained on
management
of NTDs at
district level
5% 50% 2018
Purchasing
of
laboratory
tools
Availability of
laboratory
diagnostic tools
% of
diagnostic
tools
purchased
60% 100% 2012
Promote
outreach
programs
Improved quality
of service
Number of
outreach
done
monthly
0 12 2015
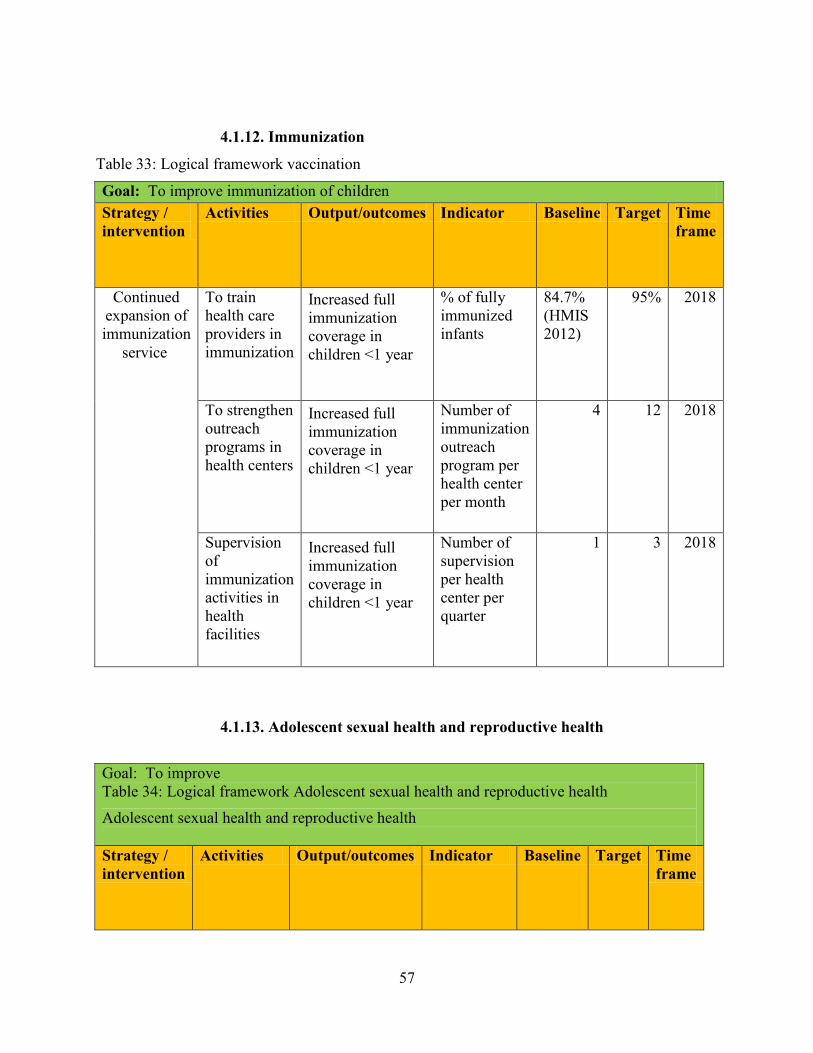
57
4.1.12. Immunization
Table 33: Logical framework vaccination
Goal: To improve immunization of children
Strategy /
intervention
Activities Output/outcomes Indicator Baseline Target Time
frame
Continued
expansion of
immunization
service
To train
health care
providers in
immunization
Increased full
immunization
coverage in
children <1 year
% of fully
immunized
infants
84.7%
(HMIS
2012)
95% 2018
To strengthen
outreach
programs in
health centers
Increased full
immunization
coverage in
children <1 year
Number of
immunization
outreach
program per
health center
per month
4 12 2018
Supervision
of
immunization
activities in
health
facilities
Increased full
immunization
coverage in
children <1 year
Number of
supervision
per health
center per
quarter
1 3 2018
4.1.13. Adolescent sexual health and reproductive health
Goal: To improve
Table 34: Logical framework Adolescent sexual health and reproductive health
Adolescent sexual health and reproductive health
Strategy /
intervention
Activities Output/outcomes Indicator Baseline Target Time
frame

58
Goal: To improve
Table 34: Logical framework Adolescent sexual health and reproductive health
Adolescent sexual health and reproductive health
Strategy /
intervention
Activities Output/outcomes Indicator Baseline Target Time
frame
Continued
expansion of
adolescent
SRH
service
To train
health care
providers in
adolescent
SRH
Increased full
package of
adolescent SRH
coverage in all
HCs
Number of
health care
providers
trained
0 76 2018
To train
adolescent
in RH and
adolescent
sexual
health
Increased full
package of
adolescent SRH
coverage in all
HCs
Number of
adolescent
trained per
quarter per
HC
0 200
000
2018
Sensitization
and
mobilization
on RH
Increased full
package of
adolescent SRH
coverage in all
HCs
Number of
sensitization
and
mobilization
done per
quarter per
HC
0 12 2018
To organize
the training
on school
health
program
Increased full
package of
adolescent SRH
coverage in all
HCs
Number of
school
trained
0 120 2018
Supervision
of
adolescent
SRH
activities in
health
facilities
Increased full
package of
adolescent SRH
coverage in all
HCs
Number of
supervision
per health
center per
quarter
0 12 2018
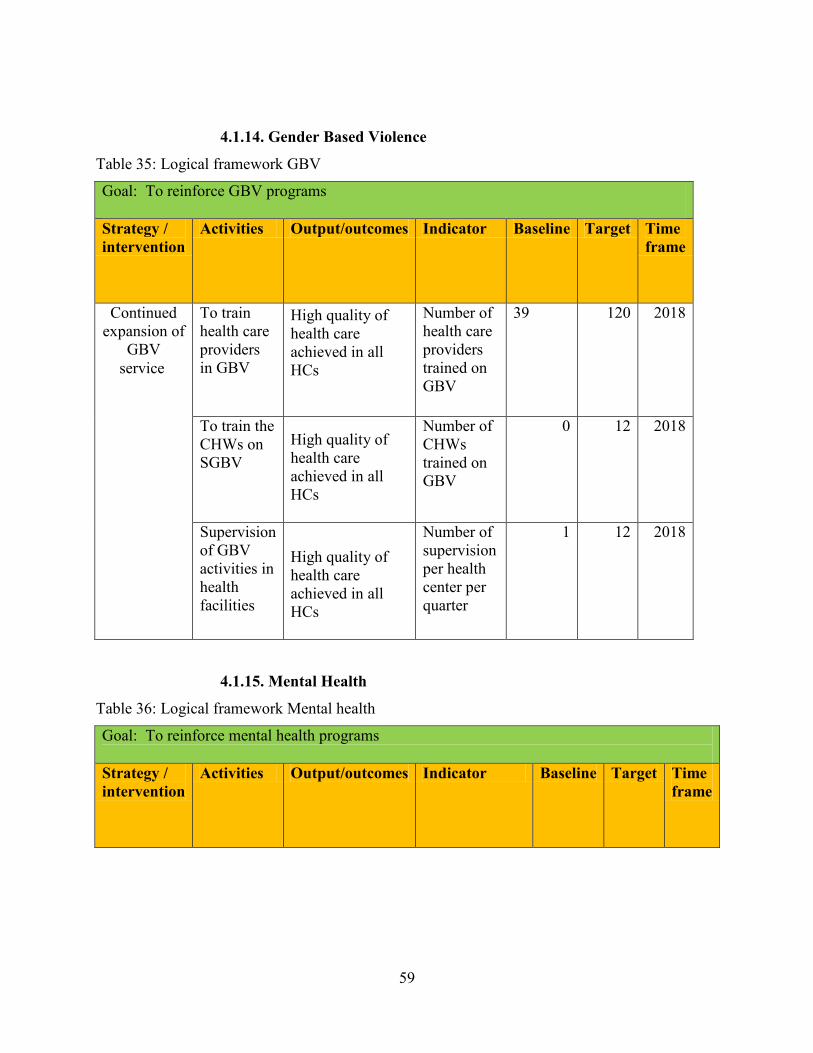
59
4.1.14. Gender Based Violence
Table 35: Logical framework GBV
Goal: To reinforce GBV programs
Strategy /
intervention
Activities Output/outcomes Indicator Baseline Target Time
frame
Continued
expansion of
GBV
service
To train
health care
providers
in GBV
High quality of
health care
achieved in all
HCs
Number of
health care
providers
trained on
GBV
39 120 2018
To train the
CHWs on
SGBV
High quality of
health care
achieved in all
HCs
Number of
CHWs
trained on
GBV
0 12 2018
Supervision
of GBV
activities in
health
facilities
High quality of
health care
achieved in all
HCs
Number of
supervision
per health
center per
quarter
1 12 2018
4.1.15. Mental Health
Table 36: Logical framework Mental health
Goal: To reinforce mental health programs
Strategy /
intervention
Activities Output/outcomes Indicator Baseline Target Time
frame

60
Goal: To reinforce mental health programs
Strategy /
intervention
Activities Output/outcomes Indicator Baseline Target Time
frame
Continued
expansion of
mental
health
service
To train
health care
providers
in mental
health
High quality of
health care
achieved in all
HCs
Number of
health care
providers
trained on
mental health
24 72 2018
To
strengthen
outreach
programs
in health
centers
High quality of
health care
achieved in all
HCs
Number of
mental health
outreach
program per
health center
per month
0 12 2018
Supervision
of mental
health
activities in
health
facilities
High quality of
health care
achieved in all
HCs
Number of
supervision per
health center
per quarter
1 12 2018
4.1.16. Traditional Medicine
Table 37: Logical framework traditional medicine
Goal: To improve traditional medicine programs
Strategy /
intervention
Activities Output/outcomes Indicator Baseline Target Time
frame
Continued
expansion of
traditional
medicine
service
To train the
traditional
healers
cooperative
High quality of
health care
achieved in all
HCs
Number of
traditional
healers
cooperative
trained
0 12 2018
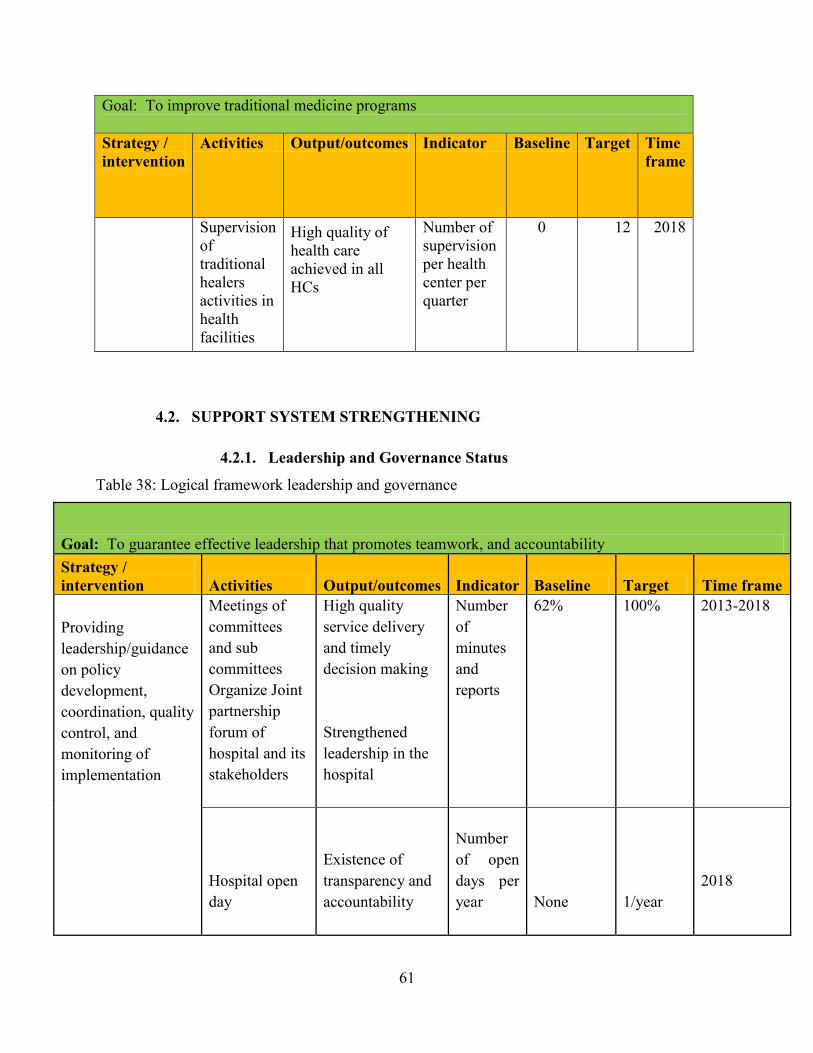
61
Goal: To improve traditional medicine programs
Strategy /
intervention
Activities Output/outcomes Indicator Baseline Target Time
frame
Supervision
of
traditional
healers
activities in
health
facilities
High quality of
health care
achieved in all
HCs
Number of
supervision
per health
center per
quarter
0 12 2018
4.2. SUPPORT SYSTEM STRENGTHENING
4.2.1. Leadership and Governance Status
Table 38: Logical framework leadership and governance
Goal: To guarantee effective leadership that promotes teamwork, and accountability
Strategy /
intervention Activities Output/outcomes Indicator Baseline Target Time frame
Providing
leadership/guidance
on policy
development,
coordination, quality
control, and
monitoring of
implementation
Meetings of
committees
and sub
committees
Organize Joint
partnership
forum of
hospital and its
stakeholders
High quality
service delivery
and timely
decision making
Strengthened
leadership in the
hospital
Number
of
minutes
and
reports
62%
100%
2013-2018
Hospital open
day
Existence of
transparency and
accountability
Number
of open
days per
year
None
1/year
2018
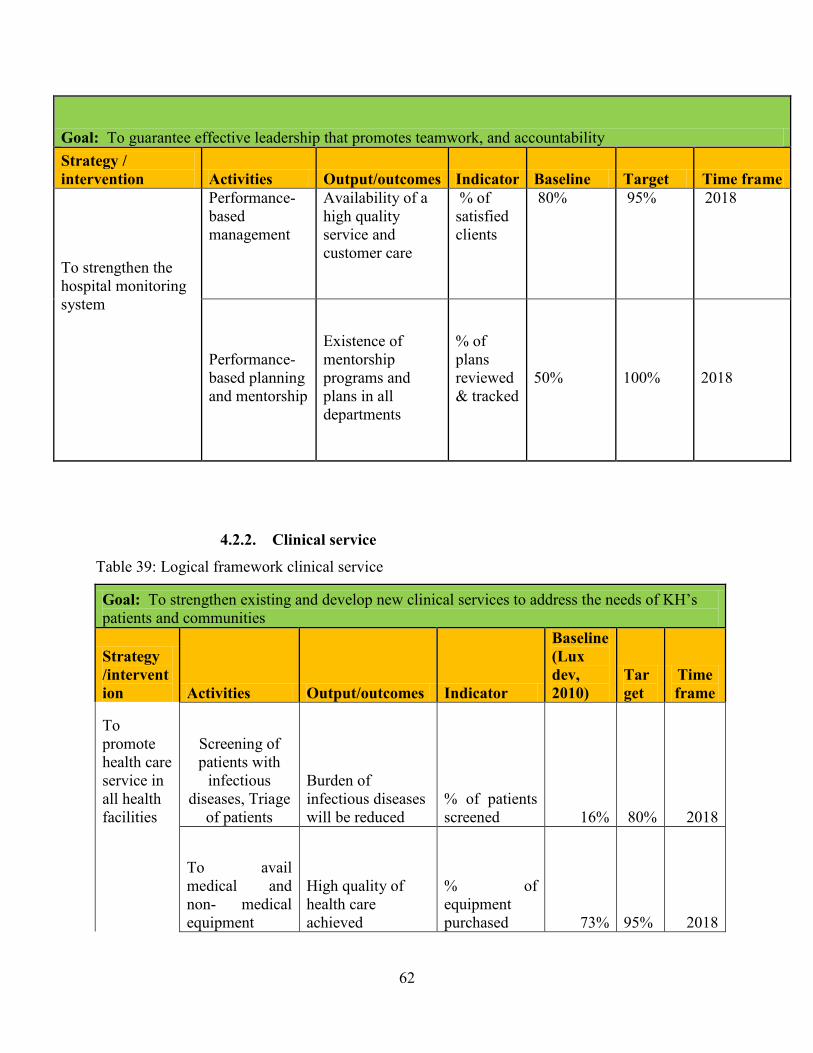
62
Goal: To guarantee effective leadership that promotes teamwork, and accountability
Strategy /
intervention Activities Output/outcomes Indicator Baseline Target Time frame
To strengthen the
hospital monitoring
system
Performance-
based
management
Availability of a
high quality
service and
customer care
% of
satisfied
clients
80%
95%
2018
Performance-
based planning
and mentorship
Existence of
mentorship
programs and
plans in all
departments
% of
plans
reviewed
& tracked
50%
100%
2018
4.2.2. Clinical service
Table 39: Logical framework clinical service
Goal: To strengthen existing and develop new clinical services to address the needs of KH’s
patients and communities
Strategy
/intervent
ion Activities Output/outcomes Indicator
Baseline
(Lux
dev,
2010)
Tar
get
Time
frame
To
promote
health care
service in
all health
facilities
Screening of
patients with
infectious
diseases, Triage
of patients
Burden of
infectious diseases
will be reduced
% of patients
screened 16% 80% 2018
To avail
medical and
non- medical
equipment
High quality of
health care
achieved
% of
equipment
purchased 73% 95% 2018
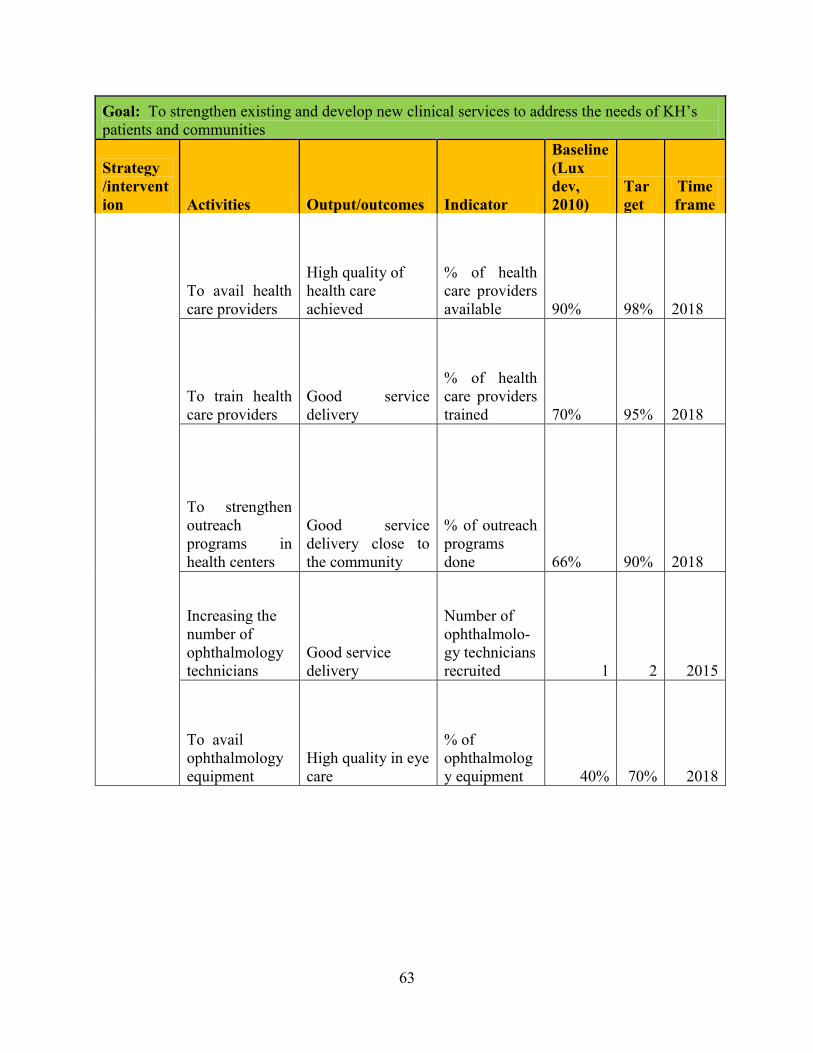
63
Goal: To strengthen existing and develop new clinical services to address the needs of KH’s
patients and communities
Strategy
/intervent
ion Activities Output/outcomes Indicator
Baseline
(Lux
dev,
2010)
Tar
get
Time
frame
To avail health
care providers
High quality of
health care
achieved
% of health
care providers
available 90% 98% 2018
To train health
care providers
Good service
delivery
% of health
care providers
trained 70% 95% 2018
To strengthen
outreach
programs in
health centers
Good service
delivery close to
the community
% of outreach
programs
done 66% 90% 2018
Increasing the
number of
ophthalmology
technicians
Good service
delivery
Number of
ophthalmolo-
gy technicians
recruited 1 2 2015
To avail
ophthalmology
equipment
High quality in eye
care
% of
ophthalmolog
y equipment 40% 70% 2018

64
Goal: To strengthen existing and develop new clinical services to address the needs of KH’s
patients and communities
Strategy
/intervent
ion Activities Output/outcomes Indicator
Baseline
(Lux
dev,
2010)
Tar
get
Time
frame To
integrate
new
clinical
services
(specialized
)and
subservices
to address
the needs
of
community
To avail the
needed
equipment and
specialized staff
High quality
service delivery
will be achieved
Number of
additional
new services
N/A
20
2018
4.2.3. Pharmacy service
Table 40: Logical framework pharmacy
Goal: To ensure efficient and effective management of the pharmacy
Strategy /
intervention Activities
Output/outc
omes Indicator Baseline Target
Time
frame
To improve
supply chain
management
To prepare
annual
procurement
plan
Avoidance of
expired drugs
and stock
outs (drugs,
consumables
and
laboratory
reagents)
% of stock
out of
essential
drugs 6% 0% 2018
To make a
weekly, monthly,
quarterly and
annually reports
as per required
Completion
of all
required
reports
% of
required
reports 85% 100% 2018

65
Goal: To ensure efficient and effective management of the pharmacy
Strategy /
intervention Activities
Output/outc
omes Indicator Baseline Target
Time
frame
To Strengthen
Pharmacovigil
ance services
Training of
DTC members
on
pharmacovigilan
ce
Effective
rational use
of drugs
% of DTC
members
trained 25% 100% 2013
Distribution of
reporting form
on adverse drug
reactions
Effective
drugs
reaction
management
Number of
reports
distributed
per month
1 per
Quarter
1 per
month 2013
Promote monthly
meetings of DTC
Knowledge
on side
effects of
current used
drugs
% of
monthly
reports 60% 100% 2014
To improve
the storage of
drugs and
consumables
according to
norms and
standards
Extension and
rehabilitation of
pharmacy stock
Existence of
standardized
pharmacy
stock
Pharmacy
stock
rehabilitated N/A 1 2018
Construction of
cold storage
room
Existence of
standardized
cold storage
room
Constructed
cold storage
room
available N/A 1 2018
Purchasing of
equipment for
storage purposes
Effective
storage of
drugs and
consumables
% of drugs
&
consumable
s in
standardized
stock 60% 90% 2018
To implement
pharmacy
management
information
system
Training of
personnel on the
use of PMIS
Effective
and efficient
management
of drugs and
consumables
% of
pharmacy
staff trained
in PMIS 0% 100% 2013

66
Goal: To ensure efficient and effective management of the pharmacy
Strategy /
intervention Activities
Output/outc
omes Indicator Baseline Target
Time
frame
Make use of the
software in both
distribution and
stock (PMIS)
Effective
and efficient
management
of drugs and
consumables
% of report
generated in
PMIS 0% 100% 2013
4.2.4. Human resource management
Table 41: Logical framework human resources management
Goal: improvement of human resources management and capacity building
Strategy /
intervention Activities Output/outcomes Indicator Baseline Target
Time
frame
Strengthening
and follow up
of policies,
relationship
between
managers/non-
managers,
customer and
capacity
building
Establish
Human
Resource
Management
plan
Quantity/quality
of human
resource for
health respond to
needs
Doctor/
population
ratio
Nurse /
population
ratio
Midwife/
population
ratio
1/38869
1/1303
1/51675
1/15,000
1/1,100
1/40,000
2018
Establish
capacity
building
plan
Existence of
capacity building
plan
Number of
capacity
building
plan per
department 1 21 2013
Review of
Internal
rules and
regulations
Hospital internal
rules and
regulation
reviewed
Number of
rules and
regulation
reviewed 0 1 2015
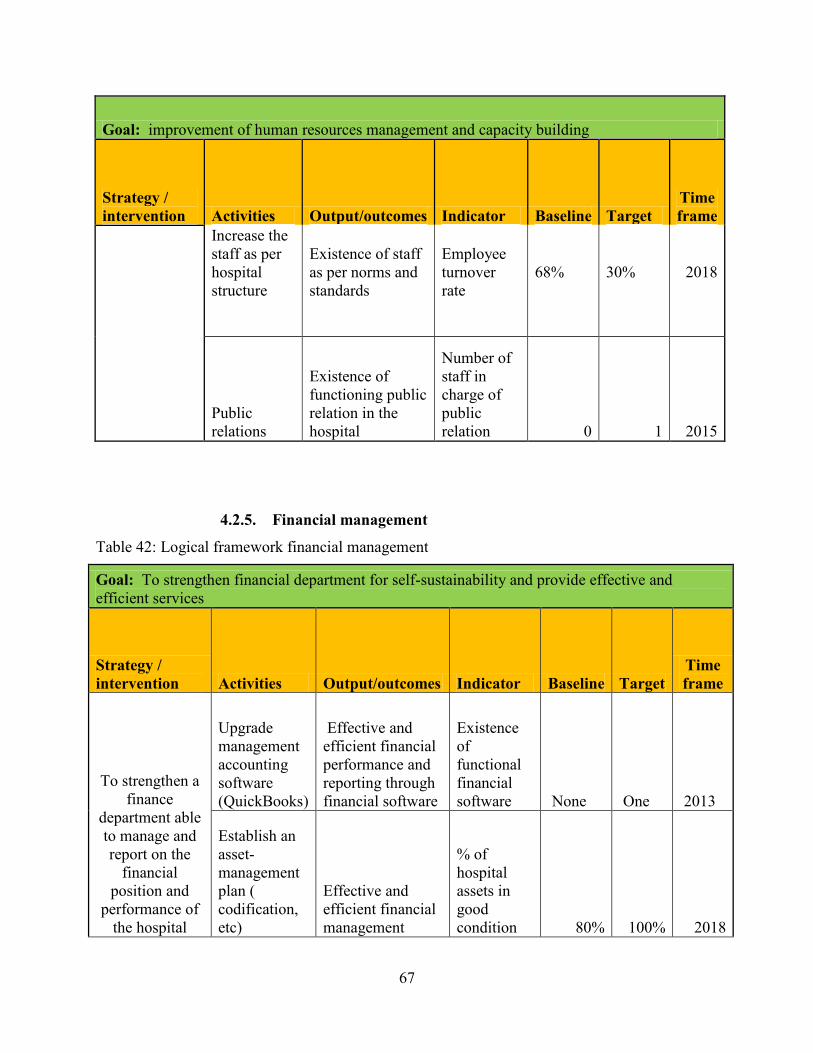
67
Goal: improvement of human resources management and capacity building
Strategy /
intervention Activities Output/outcomes Indicator Baseline Target
Time
frame
Increase the
staff as per
hospital
structure
Existence of staff
as per norms and
standards
Employee
turnover
rate
68%
30%
2018
Public
relations
Existence of
functioning public
relation in the
hospital
Number of
staff in
charge of
public
relation 0 1 2015
4.2.5. Financial management
Table 42: Logical framework financial management
Goal: To strengthen financial department for self-sustainability and provide effective and
efficient services
Strategy /
intervention Activities Output/outcomes Indicator Baseline Target
Time
frame
To strengthen a
finance
department able
to manage and
report on the
financial
position and
performance of
the hospital
Upgrade
management
accounting
software
(QuickBooks)
Effective and
efficient financial
performance and
reporting through
financial software
Existence
of
functional
financial
software None One 2013
Establish an
asset-
management
plan (
codification,
etc)
Effective and
efficient financial
management
% of
hospital
assets in
good
condition 80% 100% 2018
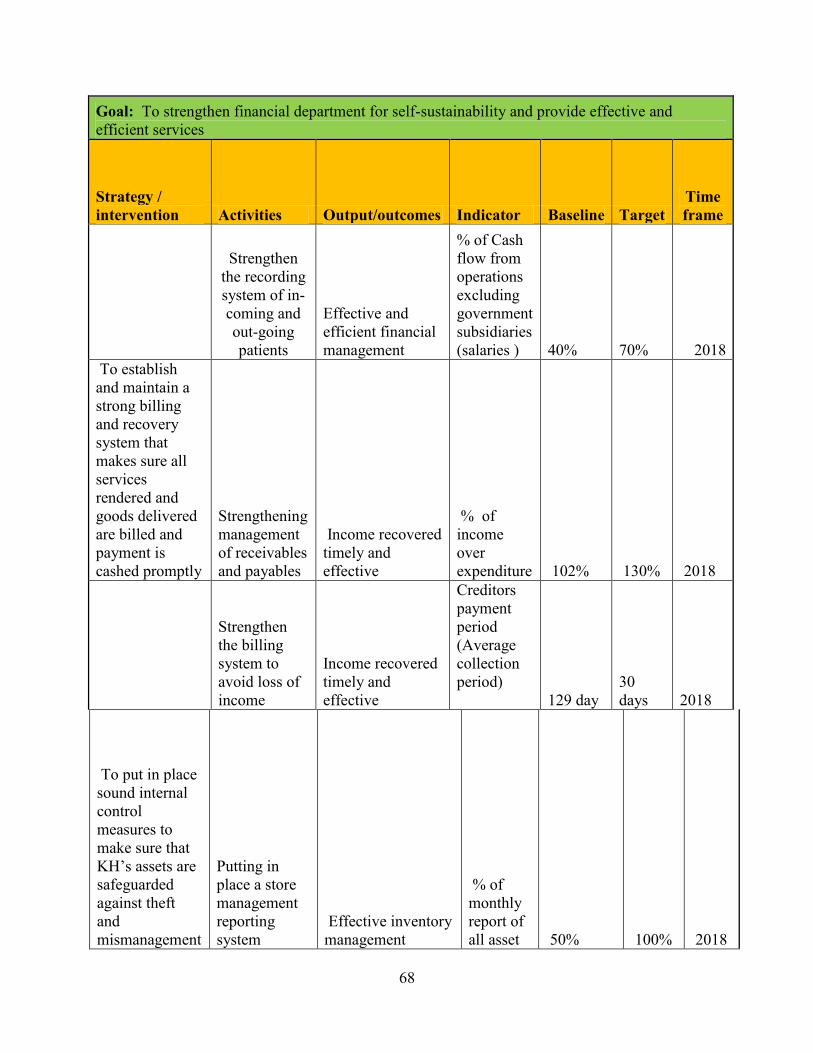
68
Goal: To strengthen financial department for self-sustainability and provide effective and
efficient services
Strategy /
intervention Activities Output/outcomes Indicator Baseline Target
Time
frame
Strengthen
the recording
system of in-
coming and
out-going
patients
Effective and
efficient financial
management
% of Cash
flow from
operations
excluding
government
subsidiaries
(salaries ) 40% 70% 2018
To establish
and maintain a
strong billing
and recovery
system that
makes sure all
services
rendered and
goods delivered
are billed and
payment is
cashed promptly
Strengthening
management
of receivables
and payables
Income recovered
timely and
effective
% of
income
over
expenditure 102% 130% 2018
Strengthen
the billing
system to
avoid loss of
income
Income recovered
timely and
effective
Creditors
payment
period
(Average
collection
period)
129 day
30
days 2018
To put in place
sound internal
control
measures to
make sure that
KH’s assets are
safeguarded
against theft
and
mismanagement
Putting in
place a store
management
reporting
system
Effective inventory
management
% of
monthly
report of
all asset 50% 100% 2018

69
Goal: To strengthen financial department for self-sustainability and provide effective and
efficient services
Strategy /
intervention Activities Output/outcomes Indicator Baseline Target
Time
frame
To strengthen
the inventory
system
Monthly stock
taking
Effective inventory
management
%
Monthly
inventory
value 50% 100% 2018
To put in place
a budget
preparation and
monitoring
system to make
sure the budget
is closely
monitored
Reinforce a
culture of
monthly
budget
tracking
Integrated financial
accounting
solution; and
monitoring progress
of
budgeted(planned)
outcome measures
against actual
results via reporting
and dash boards
% of
monthly
Budget
execution
(burn
rate) 30% 100% 2018
To reduce
government
dependency by
increasing KH
revenue every
year
Develop a
treasury
management
plan for
proper
management
of debt and
receivables
Reduced
dependency and
increased internal
revenue
Rate of
external
funding
60%
40%
2018
4.2.6. Logistic and Administrative support service
Table 43: Logical framework logistic and administrative support service
Goal: To achieve optimal administrative support services
Strategy /
intervention Activities Output/outcomes Indicator Baseline Target Time frame

70
4.2.7. Information and communication technology
Table 44: Logical framework information and communication technology
Goal: To implement integrated information and communication technology systems to support
quality service delivery and training
Strategy /
intervention Activities Output/outcome Indicator Baseline Target
Time
frame
To improve
the
electronic
collection,
analysis and
reporting of
data and use
of evidence
based to aid
in decision
making
Cabling and
connecting the
entire hospital
Decisions
system reports
% of hospital
services with
internet
connection 50% 100% 2015
Conducting
data quality
audit each
month in
hospital (all
departments )
and health
centers
Existence of data
quality
validation team
in hospital
Number of
data quality
audit reports
per month 1 reports
13
reports 2018
Data back up
Existence of
strong data
backup.
% of
computers
backed on the
server or 50% 100% 2018
To strengthen the
effective and
efficiency condition
of administrative
support system
Construction
and
rehabilitation
of needed
buildings
Availability of
appropriate
working
environment
Number of
new
buildings
constructed/
renovated
N/A
5
constructed
and 1
renovated
2018
Purchasing of
biomedical
equipment and
installation of
needed systems
Availability of
appropriate
working
environment
% of
biomedical
equipment
50%
90%
2018
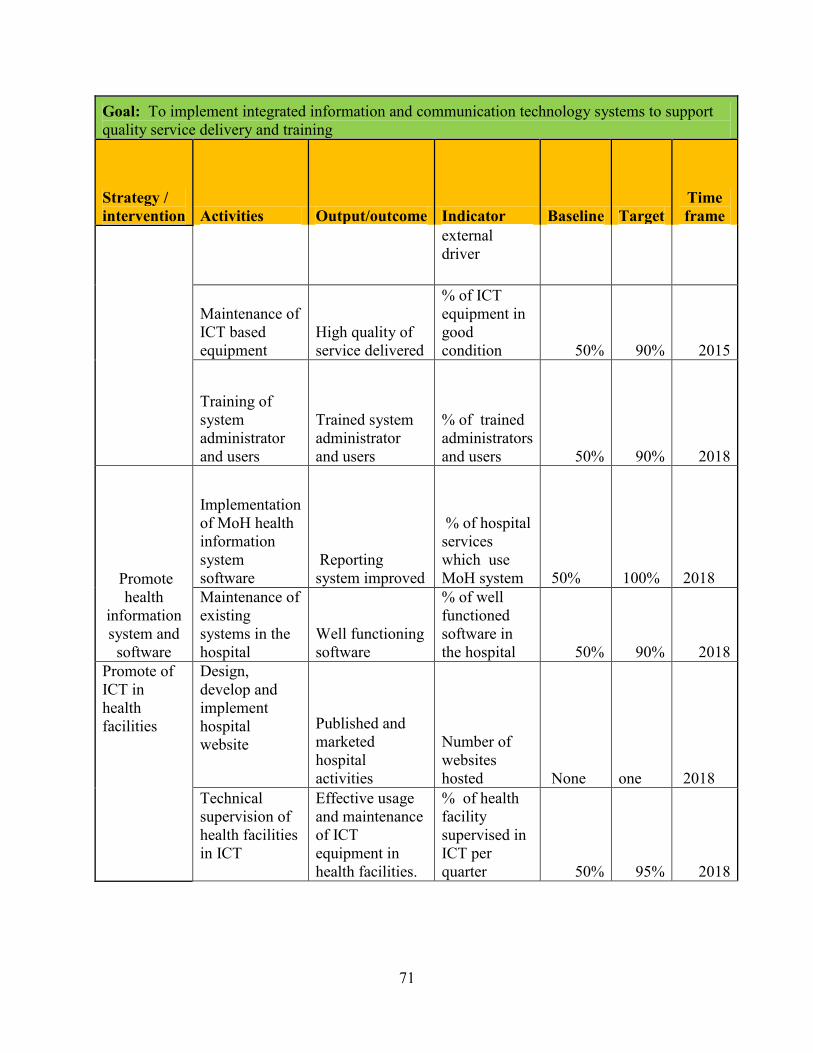
71
Goal: To implement integrated information and communication technology systems to support
quality service delivery and training
Strategy /
intervention Activities Output/outcome Indicator Baseline Target
Time
frame
external
driver
Maintenance of
ICT based
equipment
High quality of
service delivered
% of ICT
equipment in
good
condition 50% 90% 2015
Training of
system
administrator
and users
Trained system
administrator
and users
% of trained
administrators
and users 50% 90% 2018
Promote
health
information
system and
software
Implementation
of MoH health
information
system
software
Reporting
system improved
% of hospital
services
which use
MoH system 50% 100% 2018
Maintenance of
existing
systems in the
hospital
Well functioning
software
% of well
functioned
software in
the hospital 50% 90% 2018
Promote of
ICT in
health
facilities
Design,
develop and
implement
hospital
website
Published and
marketed
hospital
activities
Number of
websites
hosted None one 2018
Technical
supervision of
health facilities
in ICT
Effective usage
and maintenance
of ICT
equipment in
health facilities.
% of health
facility
supervised in
ICT per
quarter 50% 95% 2018

72
Goal: To implement integrated information and communication technology systems to support
quality service delivery and training
Strategy /
intervention Activities Output/outcome Indicator Baseline Target
Time
frame
Training on
data collection,
analysis and
interpretation Trained data
managers and
health providers
% of data
managers and
health
providers
trained 30% 90% 2018
Purchasing of
ICT equipment Availability of
ICT equipment
and usage of
internet in health
facilities
% ICT
equipment in
health
facilities 20% 90% 2018
4.2.8. Quality care and safety
Table 45: Logical framework quality care and safety
Goal: To provide a high standard of quality care in a safe environment that ensures patient-centered
service delivery and achieves accreditation status as a district hospital.
Strategy /
intervention Activities Output/outcomes Indicator Baseline Target
Time
frame
To improve the
patients’ care
experience by
providing
methods giving
feedback and
quality audit
recommendations.
Establishing
a system of
First come
first served
client
Existence of
equity in service
delivery
% of clients
satisfied
80%
100%
2018
Distribution
of token in
concerned
service
Waiting time
reduction
% of token
given
34%
100% of
concerned
services
2013

73
Goal: To provide a high standard of quality care in a safe environment that ensures patient-centered
service delivery and achieves accreditation status as a district hospital.
Strategy /
intervention Activities Output/outcomes Indicator Baseline Target
Time
frame
0rganization
of trainings
for quality
assurance
Quality service
delivery
% of trained
personnel 1% 50% 2018
Establishing
standards
and
operating
procedures
Uniformity of
service delivery
% hospital
services with
SOPs 12% 100% 2018
Monitoring
and
evaluation
of SOPs
utilization.
Existence of M&
E, SOPs
Number of M&
E reports N A 12 reports 2018
Establishing
a modern
record
tracking
system
(archive).
Timely access of
hospital data and
information
Existence of
modern record
tracking system
NA
100% of
hospital
services
using the
system 2018
Improving
usage and
analysis of
suggestion
boxes
Promoted time
saving and
anonymous input.
Number of
reports from
suggestion
boxes
50%
100% of
reports
per month
2018
74
5. COSTING AND BUDGETING OF THE STRATEGIC PLAN
The Kibungo District Hospital strategic plan has been carried out in line with the MoH
guidelines, in respect to the format and approach. Program Based Budgeting is the preferred
method of costing the district Hospital strategic plan. Since the Hospital is not able to generate
the necessary funding from its internal revenues, financing will be based on the commitments
made by the Government and its cooperating partners, as well as projected inflows from the
Global Fund and various other donors, health insurance, Ngoma district, and income-generating
activities.
5.1. COSTING APPROACH
A marginal and activity-based costing approach was employed. The costs have been aligned
according to program or pillar, supporting service strengthening and service delivery as follows:
The costing and financing plan covers a period of 6 years starting with 2012 to 2018, which is in
line with the HSSP III.
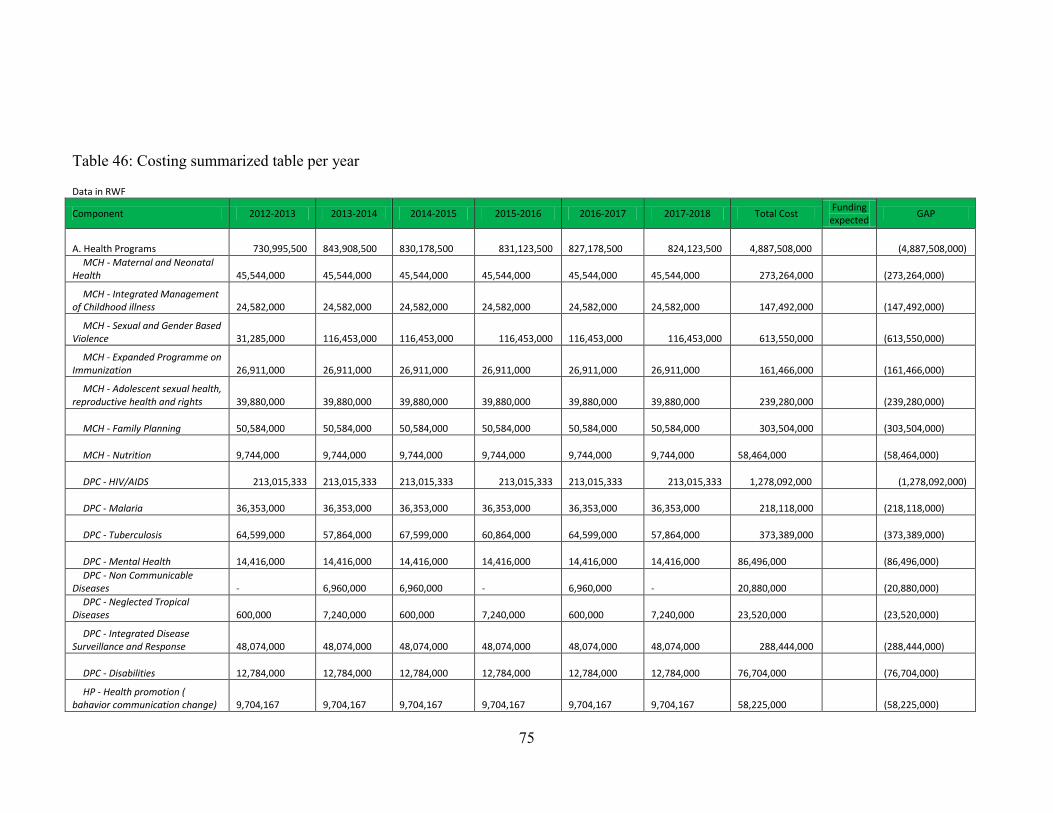
75
Table 46: Costing summarized table per year
Data in RWF
Component 2012-2013 2013-2014 2014-2015 2015-2016 2016-2017 2017-2018 Total Cost
Funding expected
GAP
A. Health Programs 730,995,500 843,908,500
830,178,500 831,123,500
827,178,500 824,123,500 4,887,508,000 (4,887,508,000)
MCH - Maternal and Neonatal Health
45,544,000
45,544,000
45,544,000
45,544,000
45,544,000
45,544,000 273,264,000
(273,264,000)
MCH - Integrated Management of Childhood illness
24,582,000
24,582,000
24,582,000
24,582,000
24,582,000
24,582,000 147,492,000
(147,492,000)
MCH - Sexual and Gender Based Violence
31,285,000
116,453,000
116,453,000 116,453,000
116,453,000 116,453,000 613,550,000
(613,550,000)
MCH - Expanded Programme on Immunization
26,911,000
26,911,000
26,911,000
26,911,000
26,911,000
26,911,000 161,466,000
(161,466,000)
MCH - Adolescent sexual health, reproductive health and rights
39,880,000
39,880,000
39,880,000
39,880,000
39,880,000
39,880,000 239,280,000
(239,280,000)
MCH - Family Planning 50,584,000
50,584,000
50,584,000
50,584,000
50,584,000
50,584,000 303,504,000
(303,504,000)
MCH - Nutrition 9,744,000
9,744,000
9,744,000
9,744,000
9,744,000
9,744,000
58,464,000
(58,464,000)
DPC - HIV/AIDS 213,015,333 213,015,333
213,015,333 213,015,333
213,015,333 213,015,333 1,278,092,000 (1,278,092,000)
DPC - Malaria 36,353,000
36,353,000
36,353,000
36,353,000
36,353,000
36,353,000 218,118,000
(218,118,000)
DPC - Tuberculosis 64,599,000
57,864,000
67,599,000
60,864,000
64,599,000
57,864,000 373,389,000
(373,389,000)
DPC - Mental Health 14,416,000
14,416,000
14,416,000
14,416,000
14,416,000
14,416,000
86,496,000
(86,496,000)
DPC - Non Communicable Diseases
-
6,960,000
6,960,000
-
6,960,000
-
20,880,000
(20,880,000)
DPC - Neglected Tropical Diseases
600,000
7,240,000
600,000
7,240,000
600,000
7,240,000
23,520,000
(23,520,000)
DPC - Integrated Disease Surveillance and Response
48,074,000
48,074,000
48,074,000
48,074,000
48,074,000
48,074,000 288,444,000
(288,444,000)
DPC - Disabilities 12,784,000
12,784,000
12,784,000
12,784,000
12,784,000
12,784,000
76,704,000
(76,704,000)
HP - Health promotion ( bahavior communication change)
9,704,167
9,704,167
9,704,167
9,704,167
9,704,167
9,704,167
58,225,000
(58,225,000)
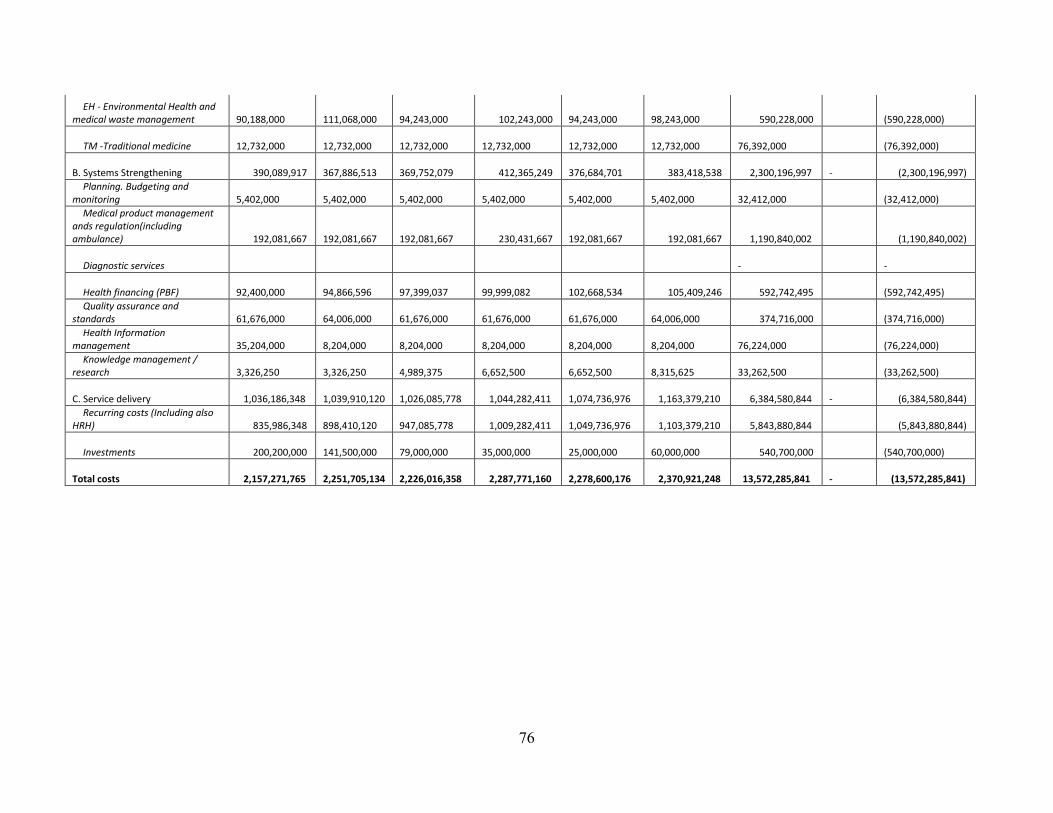
76
EH - Environmental Health and medical waste management
90,188,000
111,068,000
94,243,000 102,243,000
94,243,000
98,243,000 590,228,000
(590,228,000)
TM -Traditional medicine 12,732,000
12,732,000
12,732,000
12,732,000
12,732,000
12,732,000
76,392,000
(76,392,000)
B. Systems Strengthening 390,089,917 367,886,513
369,752,079 412,365,249
376,684,701 383,418,538 2,300,196,997
- (2,300,196,997)
Planning. Budgeting and monitoring
5,402,000
5,402,000
5,402,000
5,402,000
5,402,000
5,402,000
32,412,000
(32,412,000)
Medical product management ands regulation(including ambulance) 192,081,667
192,081,667
192,081,667 230,431,667
192,081,667 192,081,667 1,190,840,002 (1,190,840,002)
Diagnostic services -
-
Health financing (PBF) 92,400,000
94,866,596
97,399,037
99,999,082
102,668,534 105,409,246 592,742,495
(592,742,495)
Quality assurance and standards
61,676,000
64,006,000
61,676,000
61,676,000
61,676,000
64,006,000 374,716,000
(374,716,000)
Health Information management
35,204,000
8,204,000
8,204,000
8,204,000
8,204,000
8,204,000
76,224,000
(76,224,000)
Knowledge management / research
3,326,250
3,326,250
4,989,375
6,652,500
6,652,500
8,315,625
33,262,500
(33,262,500)
C. Service delivery 1,036,186,348 1,039,910,120
1,026,085,778 1,044,282,411
1,074,736,976 1,163,379,210 6,384,580,844
- (6,384,580,844)
Recurring costs (Including also HRH) 835,986,348
898,410,120
947,085,778 1,009,282,411
1,049,736,976 1,103,379,210 5,843,880,844 (5,843,880,844)
Investments 200,200,000 141,500,000
79,000,000
35,000,000
25,000,000
60,000,000 540,700,000
(540,700,000)
Total costs 2,157,271,765 2,251,705,134
2,226,016,358 2,287,771,160
2,278,600,176 2,370,921,248 13,572,285,841
- (13,572,285,841)
77
5.2. STRATEGIC PLAN RESOURCE MOBILIZATION
The Kibungo district hospital doesn’t have means of financing all activities in strategic plan but
it will use the own revenue and other revenues from MoH and its partners.
The first source of implementing the strategic plan are own revenue generated by hospital though
different services offered by the hospital and other income generating activity such as staff
canteen, etc The second source of funding the strategic plan is government subsidiaries through
Ministry of Health and Ngoma district. The third source of fund is money from different partners
who support the district hospital
As there is a gap between the expected revenue and required revenue to achieve target set in
strategic plan, Kibungo district hospital is recognizing a need to mobilize fund. In order to
mobilize fund, budget proposal will be submitted to different stakeholders. Kibungo district
hospital is planning to avail business plan, action plan and budget every year.

78
6. MONITORING AND EVALUATION FRAMEWORK
The district hospital strategic plan will be monitored at the end of each quarter by the hospital
M&E officer and evaluation of outcomes will conducted every year at the end of financial year.
The following are main data elements and data sources:
1) Main data sources
a. Community
Data Elements
a. Community
Data elements:
- New cases in OPD, New cases in HIV/AIDS/STI/TB and NCD; New cases of childhood
illness; New cases of gender-based violence; Deliveries; Nutrition screening; LLIN
distributed
Data source
- Patient cards; Registers; Rapid SMS; Community Health Report
b. Health Post
Data Elements
- New cases in OPD; New cases in HIV/AIDS/STI/TB and NCD; New cases of childhood
illness; New cases of gender-based violence; Deliveries; Nutrition screening; LLIN
distributed; Stock of tracer drugs
Data Source
- Patient cards; Registers; HMIS Monthly Report
c. Health Center

79
Data Elements
- New cases in OPD; New cases in HIV/AIDS/STI/TB and NCD; New cases of childhood
illness; New cases of gender-based violence; Antenatal consultations; Postnatal care;
Deliveries; Nutrition screening; LLIN distributed; Family planning; Vaccinations; Male
circumcision ; Laboratory; Stock of tracer drugs; Finances; Mutuelle enrollment
Data Source
- Patient cards; Registers; HMIS Monthly Report; TracNet; DHIS 2; OpenMRS;
QuickBooks
d. Hospital
Data elements
- New cases in OPD; New cases in HIV/AIDS/STI/TB and NCD; New cases of childhood
illness; New cases of gender-based violence; Antenatal consultations; Postnatal care;
Deliveries; Nutrition screening; LLIN distributed; Family planning; Vaccinations; Male
circumcision ; Laboratory; Stock of tracer drugs; Finances; Mutuelle enrollment
Data source
- Patient cards; Registers; HMIS Monthly Report; TracNet; DHIS 2; OpenMRS; PMIS;
QuickBooks; Tompro; HRMS
-
2) Information flow from the community to District level
a. Information is collected through a bottom-up approach via manual and electronic
methods.
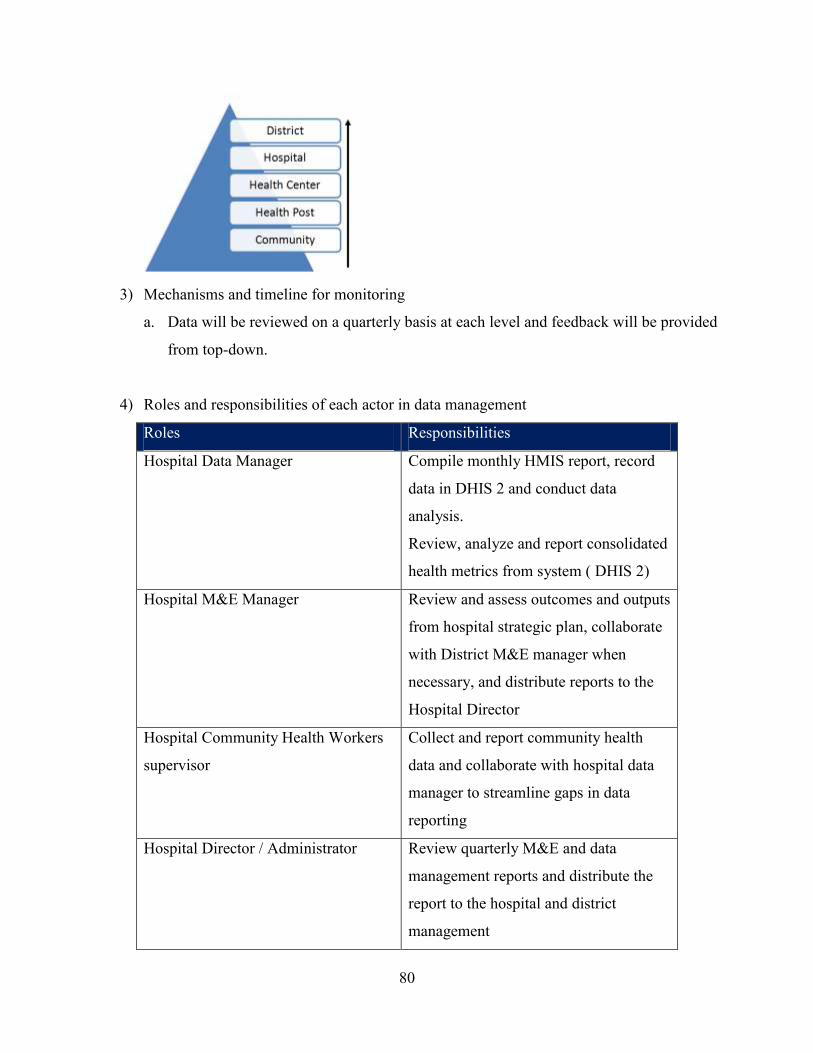
80
3) Mechanisms and timeline for monitoring
a. Data will be reviewed on a quarterly basis at each level and feedback will be provided
from top-down.
4) Roles and responsibilities of each actor in data management
Roles Responsibilities
Hospital Data Manager Compile monthly HMIS report, record
data in DHIS 2 and conduct data
analysis.
Review, analyze and report consolidated
health metrics from system ( DHIS 2)
Hospital M&E Manager Review and assess outcomes and outputs
from hospital strategic plan, collaborate
with District M&E manager when
necessary, and distribute reports to the
Hospital Director
Hospital Community Health Workers
supervisor
Collect and report community health
data and collaborate with hospital data
manager to streamline gaps in data
reporting
Hospital Director / Administrator Review quarterly M&E and data
management reports and distribute the
report to the hospital and district
management

81
Management committee and Board of
Directors
Review quarterly hospital reports and
make decisions
5) Expected evaluations during the life of the plan
a. Outputs and outcomes will be reviewed quarterly and annually against expected
results at the District level, hospital level and then health center level.
Recommended