REPUBLIC OF KENYA
PUBLIC ADMINISTRATION AND INTERNATIONAL RELATIONS
SECTOR
REPORT
FOR
MEDIUM TERM EXPENDITURE FRAMEWORK (MTEF) PERIOD
2017/18-2019/20
SEPTEMBER, 2016

ii
TABLE OF CONTENTS
LIST OF TABLES ....................................................................................................................................... iv
ABBREVIATIONS AND ACRONYMS ..................................................................................................... v
EXECUTIVE SUMMARY ..........................................................................................................................1
CHAPTER ONE ........................................................................................................................................... 3
1.0 Introduction....................................................................................................................................... 3
1.1 Background ................................................................................................................................... 3
1.2 Sector Vision and Missions........................................................................................................... 3
1.3 Strategic goals and objectives ....................................................................................................... 4
1.4 Subsectors and their Mandates...................................................................................................... 4
1.5 Autonomous and Semi- Autonomous Government Agencies ......................................................6
1.6 Role of Sector Stakeholders .......................................................................................................... 7
CHAPTER TWO ........................................................................................................................................10
2.0 PROGRAMME PERFORMANCE REVIEW 2013/14-2015/16 ...................................................10
2.1 Review of Sector Programmes/Sub-programmes Performance- Delivery ofOutputs/KPIS/Targets .............................................................................................................................10
2.2 Expenditure Analysis ..................................................................................................................27
2.2.1 Analysis of Programme Expenditure ..................................................................................27
2.2.2 Analysis of Programme Expenditure by Economic Classification .....................................34
2.2.3 Analysis of Capital Projects ................................................................................................46
2.3 Review of Pending Bills .............................................................................................................66
2.3.1 Recurrent Pending Bills ......................................................................................................66
2.3.2 Development Pending Bills ................................................................................................67
CHAPTER THREE ....................................................................................................................................68
3.0 MEDIUM TERM PRIORITIES AND FINANCIAL PLAN FOR THE MTEF PERIOD 2017/18 -2019/20 .......................................................................................................................................................68
3.1 Prioritization of Programmes and Sub-Programmes...................................................................68

iii
3.1.1 Programmes and their Objectives .......................................................................................68
3.1.2 Programmes, Sub-Programmes, Expected Outcomes, Outputs, and Key PerformanceIndicators for the Sub Sector...............................................................................................................71
3.1.3 Programmes by Order of Ranking (Criteria) ....................................................................141
3.2 Analysis of the Resource Requirement versus Allocation by Sector ........................................144
3.2.1 Resource requirement by sector -Recurrent ......................................................................144
3.2.2 Programmes and Sub-Programmes (Current and Capital) ................................................151
3.2.3 Programmes and Sub-programmes by economic classification........................................172
3.4 Analysis of Resources Requirements VS Allocation for 2017/18-2019/20..............................229
3.5 Key Priorities for the Sector......................................................................................................242
CHAPTER FOUR.....................................................................................................................................244
4.0 CROSS SECTOR LINKAGES, EMERGING ISSUES AND CHALLENGES..........................244
4.1 Cross Sector Linkages...............................................................................................................244
4.2 Emerging Issues ........................................................................................................................244
4.3 Challenges.................................................................................................................................246
CHAPTER FIVE ......................................................................................................................................249
5.0 CONCLUSION.............................................................................................................................249
CHAPTER SIX .........................................................................................................................................251
6.0 RECOMMENDATIONS .............................................................................................................251
iv
LIST OF TABLES
Table 1- 1: Autonomous and Semi-Autonomous Government Agencies..................................................... 6
Table 1- 2: Role of Sector Stakeholders ....................................................................................................... 8
Table 2- 1: Sector Programme Performance Review..................................................................................11
Table 2- 2: Programme/Sub-Programme Expenditure Analysis.................................................................28
Table 2- 3: Programme Expenditure Analysis by Economic Classification ...............................................34
Table 2- 4: Analysis of Performance of Capital Projects............................................................................47
Table 2- 5: Analysis of Recurrent and Development Pending Bills ...........................................................67
Table 3. 1: Programmes/ Sub-Programme, Outcomes, Outputs and Key Performance Indicators 71
Table 3. 2: Recurrent Requirements/Allocations ...................................................................................... 144
Table 3. 3: Development Resource Requirements/Allocation .................................................................. 148
Table 3. 4: Programme/Sub-Programme Resource Requirement ............................................................. 151
Table 3. 5: Programme/Sub-programme Resource Allocation ................................................................. 162
Table 3. 6: Programmes and Sub Programmes by Economic Classification ............................................ 172
Table 3. 7: Semi-Autonomous Government Agencies ............................................................................. 229
v
ABBREVIATIONS AND ACRONYMS
ACP-EU Africa Caribbean Pacific - European UnionACU AIDS Control UnitADA Consortium Adaptation ConsortiumAGA Autonomous Government AgencyAGD Accountant General’s DepartmentAGOA Africa Growth And Opportunity ActAGPO Access to Government Procurement OpportunitiesAPR Annual Progress ReportASAL Arid and Semi-Arid LandsCARA County Allocation of Revenue ActCARPS Capacity Assessment and Rationalization of the Public ServiceCDDCs Community Driven Development CommitteesCDF Constituencies Development FundCIDPs County Integrated Development PlansCOG Council of GovernorsCOMESA Common Market for Eastern and Southern AfricaCPPMU Central Planning and Project Monitoring UnitCRA Commission on Revenue AllocationEAC East Africa CommunityECD Enablers Coordination DepartmentECOSOC Economic and Social CouncilEDCD Economic Development Coordination DepartmentEDE Ending Drought EmergenciesEMU Efficiency Monitoring UnitEPA Economic Partnership Agreemente-ProMIS Electronic Project Management Information SystemERP Enterprise Resource PlanningEU European UnionFDI Foreign Direct InvestmentFGM Female Genital MutilationGDP Gross Domestic ProductGES Global Entrepreneurship SummitGHRIS Government Human Resource Information SystemGOSS Government of South SudanGPA Group Personal AccidentHHs HouseholdsHRM Human Resource ManagementHRM&D Human Resource Management and DevelopmentIAD Internal Audit DepartmentIBEC Intergovernmental Budget and Economic CouncilICT Information and Communication TechnologyIDEA Interactive Data Extraction And AnalysisIDPs Internally Displaced Persons
vi
IEC Information, Education and CommunicationIFMIS Integrated Financial Management Information SystemIGRTC Intergovernmental Relations Technical CommitteeISO International Organization for StandardizationKENAO Kenya National Audit OfficeKISM Kenya Institute of Supplies ManagementKLRC Kenya Law Reforms CommissionKMC Knowledge Management CentreKNBS Kenya National Bureau of StatisticsKNHDR Kenya National Human Development ReportKRA Kenya Revenue AuthorityLAPSSET Lamu Port South-Sudan Ethiopia TransportM&E Monitoring and EvaluationMCDAs Ministries, Counties, Departments and AgenciesMCS Management Consultancy ServicesMDAs Ministries, Departments and AgenciesMDGs Millennium Development GoalsMOU Memorandum of UnderstandingMTEF Medium Term Expenditure FrameworkMTP II Medium Term Plan IIMTPI Medium Term Plan INCBF National Capacity Building FrameworkNCCC National Consultative Coordination Committee (on Internal
Displacement)NCPD National Council for Population and DevelopmentNDMA National Drought Management AuthorityNEPAD New Partnership for Africa’s DevelopmentNGOs Non-Governmental OrganizationsNIFC Nairobi International Financial CentreNOKET Northern Kenya Education TrustNSDS National Strategy for Development of StatisticsNYC National Youth CouncilNYS National Youth ServiceODA Official Development AssistancePAIR Public Administration and International Relations SectorPALWECO Programme for Agriculture & Livelihoods in Western CommunitiesPAS Performance Appraisal SystemsPC Performance ContractPDMO Public Debt Management OfficePER Performance Expenditure ReviewPFM Public Financial ManagementPFMR Public Financial Management ReformsPICD Participatory Integrated Community DevelopmentPPA Participatory Poverty AssessmentPPOA Public Procurement Oversight AuthorityPPP Public Private Partnership
vii
PSC Public Service CommissionPSCU Presidential Strategic Communications UnitPURES Pupils Reward SchemePWDs People With DisabilitiesQMS Quality Management SystemsSACCOs Savings and Credit Co-operativesSAGA Semi Autonomous Government AgencySCs State CorporationsSDGs Sustainable Development GoalsSFRTF Street Family Rehabilitation Trust FundT21 Threshold 21TICAD Tokyo International Conference on Africa’s DevelopmentTRF Training Revolving FundUK United KingdomUNDP United Nations Development ProgrammeUSA United States of AmericaUSD United States DollarVFM Value for MoneyWEF Women Enterprise FundWTO World Trade OrganizationYEC Youth Empowerment Centres
1
EXECUTIVE SUMMARY
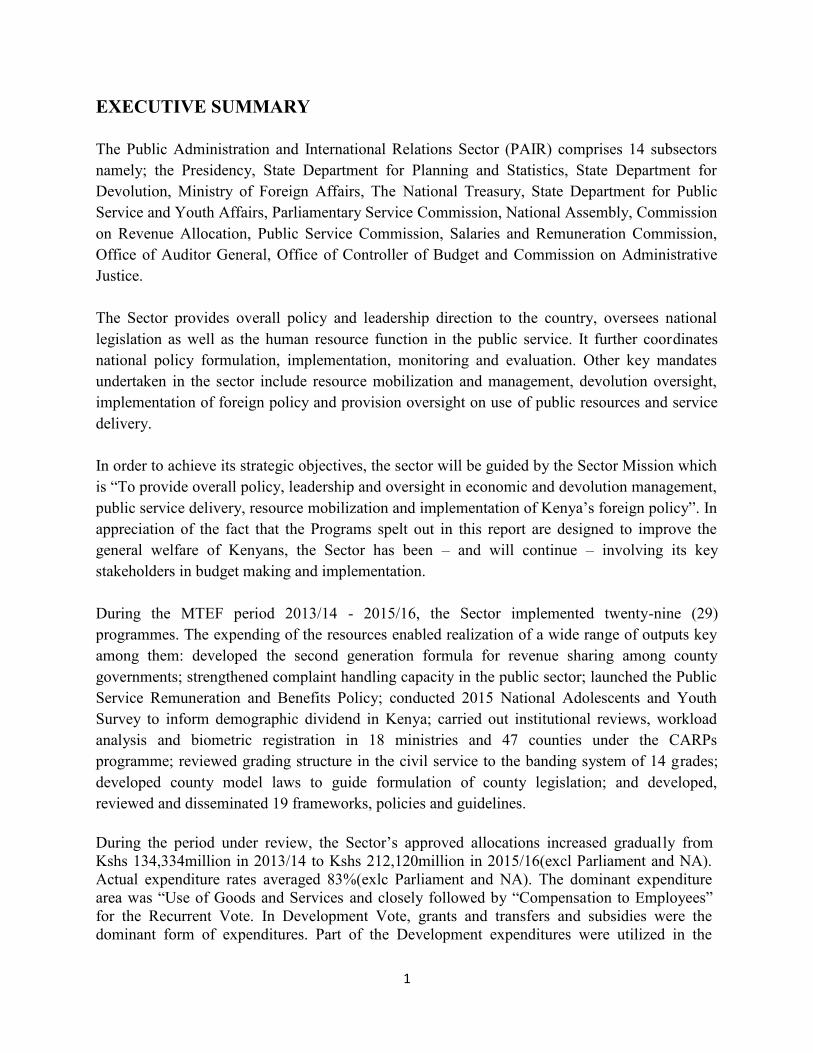
The Public Administration and International Relations Sector (PAIR) comprises 14 subsectorsnamely; the Presidency, State Department for Planning and Statistics, State Department forDevolution, Ministry of Foreign Affairs, The National Treasury, State Department for PublicService and Youth Affairs, Parliamentary Service Commission, National Assembly, Commissionon Revenue Allocation, Public Service Commission, Salaries and Remuneration Commission,Office of Auditor General, Office of Controller of Budget and Commission on AdministrativeJustice.
The Sector provides overall policy and leadership direction to the country, oversees nationallegislation as well as the human resource function in the public service. It further coordinatesnational policy formulation, implementation, monitoring and evaluation. Other key mandatesundertaken in the sector include resource mobilization and management, devolution oversight,implementation of foreign policy and provision oversight on use of public resources and servicedelivery.
In order to achieve its strategic objectives, the sector will be guided by the Sector Mission whichis “To provide overall policy, leadership and oversight in economic and devolution management,public service delivery, resource mobilization and implementation of Kenya’s foreign policy”. Inappreciation of the fact that the Programs spelt out in this report are designed to improve thegeneral welfare of Kenyans, the Sector has been – and will continue – involving its keystakeholders in budget making and implementation.
During the MTEF period 2013/14 - 2015/16, the Sector implemented twenty-nine (29)programmes. The expending of the resources enabled realization of a wide range of outputs keyamong them: developed the second generation formula for revenue sharing among countygovernments; strengthened complaint handling capacity in the public sector; launched the PublicService Remuneration and Benefits Policy; conducted 2015 National Adolescents and YouthSurvey to inform demographic dividend in Kenya; carried out institutional reviews, workloadanalysis and biometric registration in 18 ministries and 47 counties under the CARPsprogramme; reviewed grading structure in the civil service to the banding system of 14 grades;developed county model laws to guide formulation of county legislation; and developed,reviewed and disseminated 19 frameworks, policies and guidelines.
During the period under review, the Sector’s approved allocations increased gradually fromKshs 134,334million in 2013/14 to Kshs 212,120million in 2015/16(excl Parliament and NA).Actual expenditure rates averaged 83%(exlc Parliament and NA). The dominant expenditurearea was “Use of Goods and Services and closely followed by “Compensation to Employees”for the Recurrent Vote. In Development Vote, grants and transfers and subsidies were thedominant form of expenditures. Part of the Development expenditures were utilized in the

2
implementation 100 capital projects (exlc Parliament and NA) which are at different stages ofcompletion. The combined pending bills under the Recurrent and Development expenditures asat end of 2015/2016 stood at Kshs. 21,964.53million. (excl Parliament and NA) Going forward,the Sector will strive to reduce the occurrence of pending bills.
In the 2017/18 – 2019/20 MTEF period, the Sector will implement thirty-two (32) programmes(excluding those under Parliamentary Service Commission and National Assembly). The sectorceiling provided for the MTEF period 2017/18 – 2019/20 like has been the case in the previousyears, was inadequate to accommodate the requirements from the various subsectors. Theprogrammes require Kshs 323,040 million, Kshs 359,286 million and Kshs 410,303 millionin 2017/18, 2018/19 and 2019/20, respectively. The sector was however, allocated Kshs204,526 million, Kshs. 207,804 million and Kshs. 216,140 million for the same period,respectively. This represents a resource shortfall of Kshs. 118,514 million, Kshs. 151,482million and Kshs. 194,163 million in 2017/18, 2018/19, and 2019/20, respectively.
The allocation of resources to the subsectors was guided by the criteria as provided in theBudget guidelines. These included; mandatory/obligatory payments, ongoing projects, corepoverty interventions, strategic interventions, linkage to objectives of MTP II, core mandate ofMDAs, among others.
Emerging issues noted include; the expanded mandate of the Sector without correspondingresource increment, occurrence of pending bills, increased litigations, increase in misuse andmisappropriation of public funds, inadequate norms and standards in Management of HumanResource at the County Level– all of which negatively impact on the Sector.
The Sector also faced challenges in the management of its budget including; inadequatefunding, weak monitoring and evaluation systems, increasing wage and pensions bills, delays inexchequer releases, human resource capacity gaps, austerity measures and budget cuts, inabilityfor the economy to generate the required resources, weak financial management both at theNational and county government and an upsurge in litigation by public servants among others.
To mitigate the challenges faced and address emerging issues, the Sector recommendsimproving exchequer releases, strengthening monitoring and evaluation, strengthening HumanResource Management at the National and County Levels, enhancing fiscal responsibility andaccountability and improving procurement planning and implementation of Programs andprojects.

3
CHAPTER ONE1.0 Introduction
1.1 Background
The Public Administration and International Relations (PAIR) Sector is one of the 10 MTEFSector Working Groups. The Sector has 14 subsectors namely; the Presidency, State Departmentfor Planning and Statistics, State Department for Devolution, Ministry of Foreign Affairs, TheNational Treasury, State Department for Public Service and Youth Affairs, ParliamentaryService Commission, National Assembly, Commission on Revenue Allocation, Public ServiceCommission, Salaries and Remuneration Commission, Office of Auditor General, Office ofController of Budget and Commission on Administrative Justice.
Owing to its composition and placement in the Government structure, the Sector’s mandate cutsacross all public agencies. It provides overall policy and leadership direction in the managementof public affairs, and coordinates policy formulation, implementation, monitoring and evaluation.The Sector facilitates enactment of national legislation, budget execution, resource mobilizationand management in the entire public service. The Sector administers prudent financialmanagement and promotes transparency and accountability in use of public resources. Inaddition, it oversees the implementation of Kenya’s foreign policy and links all other sectors tothe rest of the world. The Sector also spearheads the implementation of devolution in Kenya byproviding policy and leadership direction.
In the 2013/14-2015/16 MTEF period, the Sector coordinated the implementation of theConstitution of Kenya 2010, the Kenya Vision 2030 through MTP II and its Flagship Projects,the Economic Transformation Agenda, the Millennium Development Goals and the successorSustainable Development Goals, among others. The Sector seeks resources to implementtargeted national policies, projects and programmes over MTEF period 2017/18-2019/20.
1.2 Sector Vision and Missions
Vision
Excellence in leadership, public sector policy management and International relations
Mission
To provide leadership and oversight in economic and devolution management, resourcemobilisation and management; and International Relations for a responsive public service

4
1.3 Strategic goals and objectivesThe Sector’s programs will be guided by the following 14 Strategic Objectives:
a) To provide overall policy and leadership direction for national prosperity
b) To promote public policy formulation, planning, coordination, implementation,monitoring and evaluation of public projects and programmes for nationaldevelopment;
c) To strengthen national and county governments capacity for implementation ofdevolution and enhance Intergovernmental Relations;
d) To protect Kenya’s sovereignty, enhance territorial integrity and promote itsforeign policy
e) To promote prudent, financial and fiscal management for economic growth andstability
f) To transform the quality of public service and enhance empowerment andparticipation of youth and other vulnerable groups in aspects of nationaldevelopment
g) To promote and strengthen national legislation, provide oversight over publicagencies and good governance
h) To advice on equitable sharing of revenue between National and CountyGovernments
i) To attract, retain and develop competent human resource, and promote goodgovernance towards an ethical Public Service;
j) To promote harmony, equity and fairness in public service remuneration forattraction and retention of requisite skills
k) To promote and support good governance and accountability in the public sector forthe achievement of Vision 2030 goals.
l) To ensure timely approval of withdrawals from the Consolidated Fund, CountyRevenue Fund and the Equalization Fund and other public funds.
m) To enhance responsiveness, demand for quality services and promoteadministrative justice in the public sector.
1.4 Subsectors and their Mandates
(a) The Presidency Provide overall leadership for the implementation of national policy
(b) State Department for Planning and Statistics National economic policy and planning, management of national statistics and the
population policy, monitoring and evaluation of economic trends, integrated regionaldevelopment and coordination of implementation of the Sustainable DevelopmentGoals.
5
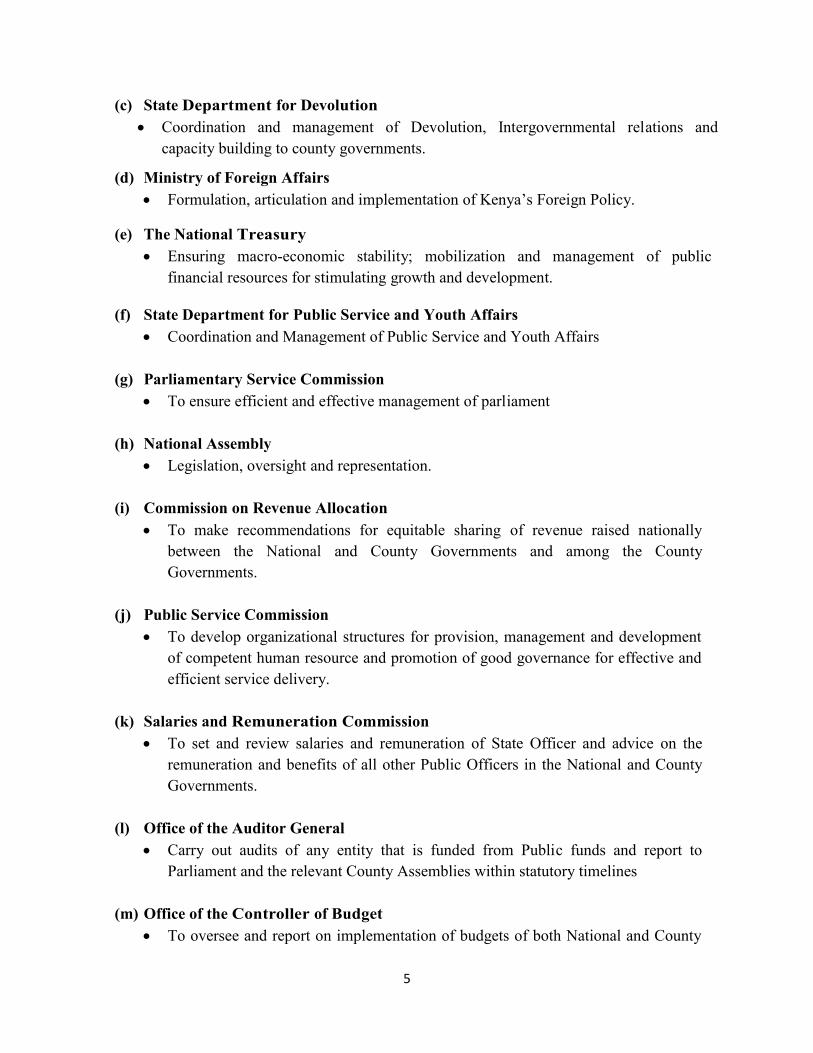
(c) State Department for Devolution Coordination and management of Devolution, Intergovernmental relations and
capacity building to county governments.
(d) Ministry of Foreign Affairs Formulation, articulation and implementation of Kenya’s Foreign Policy.
(e) The National Treasury Ensuring macro-economic stability; mobilization and management of public
financial resources for stimulating growth and development.
(f) State Department for Public Service and Youth Affairs Coordination and Management of Public Service and Youth Affairs
(g) Parliamentary Service Commission To ensure efficient and effective management of parliament
(h) National Assembly Legislation, oversight and representation.
(i) Commission on Revenue Allocation To make recommendations for equitable sharing of revenue raised nationally
between the National and County Governments and among the CountyGovernments.
(j) Public Service Commission To develop organizational structures for provision, management and development
of competent human resource and promotion of good governance for effective andefficient service delivery.
(k) Salaries and Remuneration Commission To set and review salaries and remuneration of State Officer and advice on the
remuneration and benefits of all other Public Officers in the National and CountyGovernments.
(l) Office of the Auditor General Carry out audits of any entity that is funded from Public funds and report to
Parliament and the relevant County Assemblies within statutory timelines
(m) Office of the Controller of Budget To oversee and report on implementation of budgets of both National and County

6
governments to Parliament.
(n) Commission on Administrative Justice To promote and enforce administrative justice in the public sector and safeguard
public interest.
1.5 Autonomous and Semi- Autonomous Government Agencies
The matrix in Table 1-1 shows the Autonomous and Semi-Autonomous Government Agenciesthat fall under the PAIR sector.
Table 1- 1: Autonomous and Semi-Autonomous Government Agencies
S/No. Subsector AGAs SAGAS1 Presidency - Vision 2030 Board
2. Devolution Intergovernmental Relations Technical CommitteeIntergovernmental Steering CommitteeNational and County Government Co-ordinationSummit
3. Planning and Statistics - a) Kenya Institute of Public Policy Research andAnalysis (KIPPRA)
b) Kenya National Bureau of Statistics (KNBS)c) New Partnership for Africa’s Development
(NEPAD)/African Pair Review Mechanism(APRM)
d) National Council for Population andDevelopment (NCPD)
e) National Government ConstituenciesDevelopment Fund Board
f) NGO Coordination Boardg) Community Development Trust Fund (ACP/EU
Protocol)h) Regional Development Authorities:
Tana and Athi River DevelopmentAuthority (TARDA)
Lake Basin Development Authority(LBDA)
Kerio Valley Development Authority(KVDA)
Ewaso Nyiro North DevelopmentAuthority (ENNDA)
Ewaso Nyiro South DevelopmentAuthority (ENSDA)
Coast Development Authority (CDA)

7
S/No. Subsector AGAs SAGAS4 Public Service and
Youth Affairs- a) Kenya School of Government (KSG)
b) National Youth Enterprise Development Fund(NYEDF)
c) National Youth Council (NYC)d) Huduma Kenya Programmee) Kenya Association of Youth Centers (KAYC)f) National Youth Service (NYS)
5 The National Treasury Central Bank ofKenya
a) Capital Markets Authority (CMA)b) Insurance Regulatory Authority (IRA)c) Retirement Benefits Authorityd) Public Procurement Oversight Authority
(PPOA)e) Competition Authority of Kenya (CAK)f) Kenya Revenue
Authority (KRA)g) Privatization
Commissionh) Kenya Trade Network
Agencyi) Unclaimed Financial Assets
Authorityj) Kenya Institute of Supplies
Managementk) Public Sector Accounting
Standards Boardl) Financial Reporting Centrem) Public Procurement Review Boardn) Africa Institute of Remittanceso) Nairobi International Financial Centrep) ICPAK/ICPSKq) KASNEBr) Public Private Partnership Petition Committee
The autonomous/constitutional commissions/independent offices falling under the Sector are:Parliamentary Service Commission; Commission on Revenue Allocation; Public ServiceCommission; Salaries and Remuneration Commission; Office of the Auditor General; Office ofthe Controller of Budget; and Commission on Administrative Justice.
1.6 Role of Sector Stakeholders
Table 1-2 maps out the Sector’s stakeholders and the interests they have on the Sector as wellthe expected outcome.

8
Table 1- 2: Role of Sector Stakeholders
S/No Stakeholder Interest in MTEF Sector Expected Outcome1 Ministries/Departments/Agencies Provision of overall leadership and policy
directionEfficient and effective Publicservice delivery
Financial and human resource mobilizationfor implementation of planned projects andProgrammes
Economic growth anddevelopment
Positive projection of the national imageandsafeguarding of national interests in the world
International goodwill
Efficient policy and legal legislation Good governance
Good governance National development
2 Development partners Public service delivery
Prudent use of resources
Execution of the planned projects andProgrammes
Sustainable development
Economic growth
Improved living standards
3 Civil Society/NGOs Prudent use of resources
Economic growth anddevelopment
Improved service delivery
Policy guidance
Increased participation in the formulation andexecution of the budget transparency andaccountability in execution of budget
4 County Governments Strengthening of county institutions andcapacity for service delivery
Speedy and timely release of resources
Equitable development
Harmonized transition todevolved government system
Economic growth anddevelopment
5 Private sector Provision of conducive businessenvironment/Ease of Doing Business
Increased investmentopportunities
Increased collaboration with Governmentunder Public Private Partnership (PPP)
Increased growth andDevelopment
Fiscal discipline and macroeconomic stability Economic growth andsustainable development
6 Citizens Policy and Leadership direction Socio-economic growth anddevelopment

9
S/No Stakeholder Interest in MTEF Sector Expected OutcomeGood governance Improved service delivery
Equitable resource distribution Transparencyand accountability
Macro –economic stability, growth anddevelopment
Equitable economicdevelopment
7 Public Servants Provision of adequate resources forperforming assigned functions
Improved staff welfare
Improved service delivery
Economic growth anddevelopment
8 Trade Unions Improved terms of service
Involvement in policy decisions affectingpublic servants
Improved service delivery
Cordial working relationships
9 Media Transparency in budget execution
Increased access to information
Increased public awareness

10
CHAPTER TWO
2.0 PROGRAMME PERFORMANCE REVIEW 2013/14-2015/16
This chapter reviews the performance of the Sector for the past three fiscal years. Analysis of theSector’s recurrent and development pending bills in the same period is also provided.
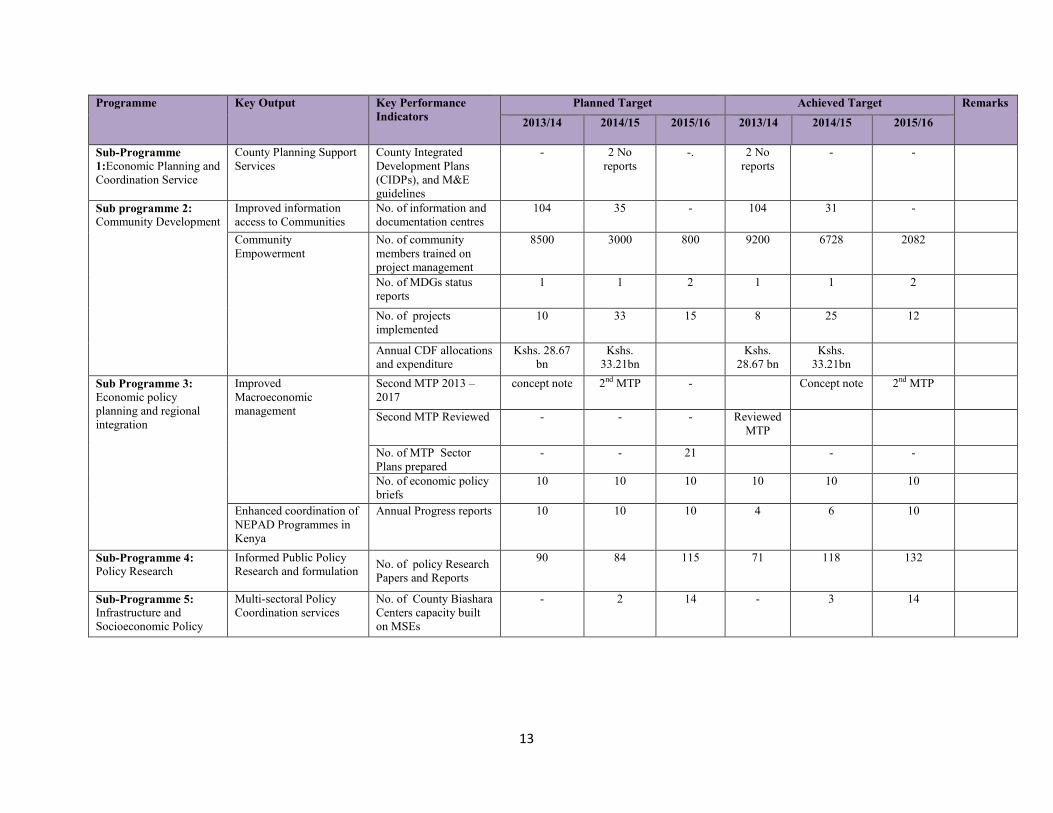
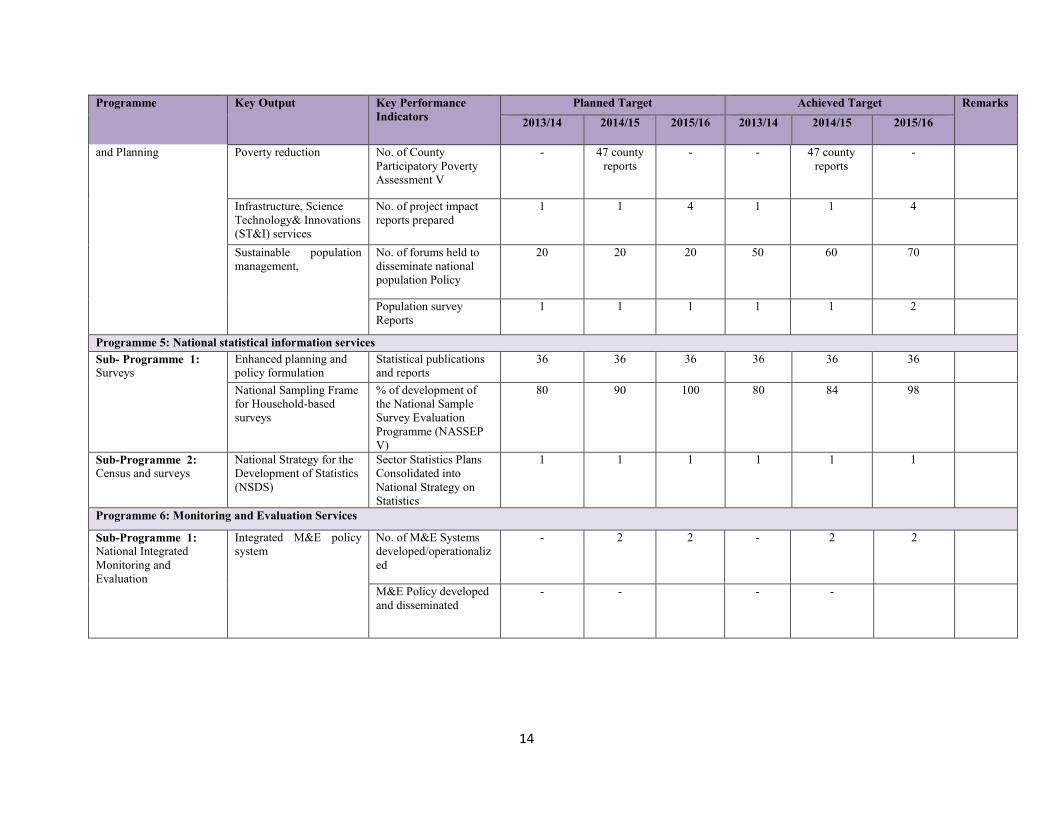
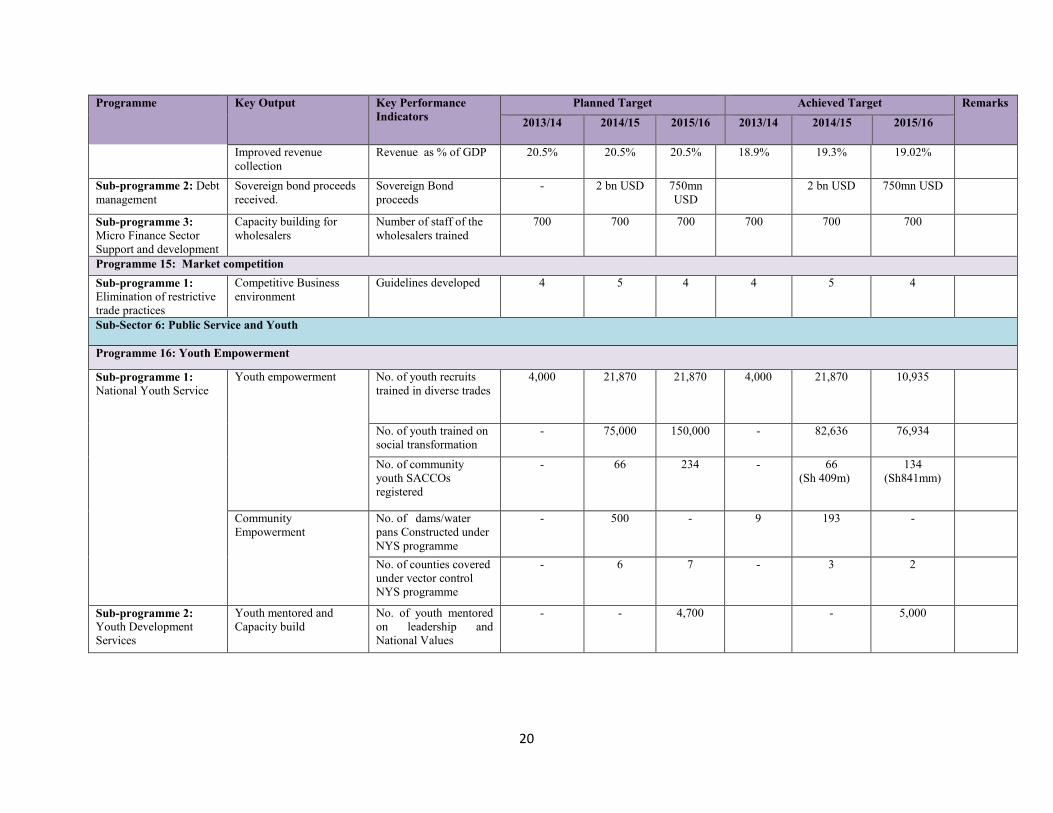
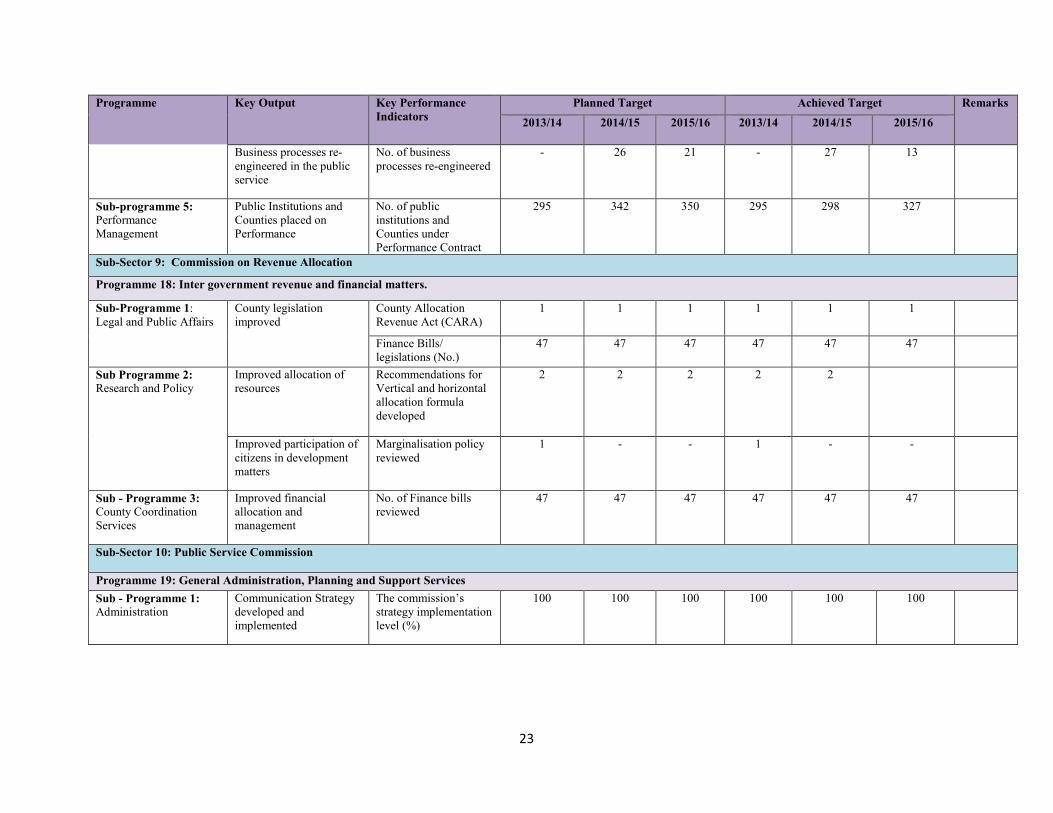
2.1 Review of Sector Programmes/Sub-programmes Performance- Delivery ofOutputs/KPIS/Targets
Table 2.1 presents the key outputs that the Sector sought to achieve in the period, the indicatorsthat were used to measure the outputs, the planned targets for the respective financial years, theachievements made in the same period and the relevant remarks. The Sector implemented itsprojects to different degrees of completion under 28 programmes. Non-completion of projectsarose mainly from inadequate funding and late disbursement of funds.

11
Table 2- 1: Sector Programme Performance Review
Programme Key Output Key PerformanceIndicators
Planned Target Achieved Target Remarks2013/14 2014/15 2015/16 2013/14 2014/15 2015/16
Subsector 1:The Presidency
Programme 1: State House Affairs
Sub-Programme 1:Coordination of StateHouse Functions
Harmonized andsuccessful State Housefunctions
No and type ofsuccessful State Housefunctions
9 9 9 9 9 9
A modernizedPresidential StrategicCommunication Unit(PSCU)
No and type ofmachinery procured andinstalled.
Phase 2 Phase 3 Digitalarchivingsystem inplace
Phase 2completed
Phase 3completed
Operationaldigitalachievingsystem
No, type and gender ofofficers recruited
16 16 1 16 16 1
A motivated andvisionary youth
No. of Primary andSecondary SchoolStudents Mentored andrewarded from the 47Counties
900 900 1050 814 848 958
Sub-Programme 2:Administration ofStatutory Benefits to theRetired Presidents
Retired President’s Officerefurbished
Level of completion(%)
Phase 1(100)
Phase 2(100)
Phase 3(100)
100 100 0
Programme 2: Deputy President Services
Sub-Programme 1:General Administration,Planning and SupportServices
Operational LAPSSETCorridor DevelopmentAuthority (LCDA)
Level ofoperationalization (%)
100 100 100 100 100 100
Refurbished DeputyPresident’s OfficialResidences
% Completion ofRefurbishment
40 90 100 40 90 98
Sub-Programme 2:Coordination andSupervision
A System for Trackingthe Development ofNational and County Bills
Bill Tracking SystemDeveloped (%)
- 100 100 - 60 100

12
Programme Key Output Key PerformanceIndicators
Planned Target Achieved Target Remarks2013/14 2014/15 2015/16 2013/14 2014/15 2015/16
Well-Coordinated IBECand reporting
No. of IBEC meetingsand reports
6 10 12 6 12 12
Improved resourcemobilization and Womenempowerment
No. of Women Trainedon Table-Banking, andbusiness
6,500 6,500 6,500 6,850 7,400 7,433
Kenyan StudentsAccessing Scholarshipsand InternshipOpportunities
No. of StudentsBenefitting FromScholarships andInternshipOpportunities
200 200 200 212 240 267
Sub-Programme 3:Efficiency Monitoringand Inspectorate Services
Management Audits ofState Corporations (SCs)
No. and type of Reports 12 12 9 12 15 5
Improved management ofState Corporations
No. of Surcharge CasesSubmitted to the SCSC
12 12 10 5 15 10
Value For Money AuditsConducted in IdentifiedInstitutions
No. of InstitutionsAudited
5 5 6 4 5 5
Programme 3: Cabinet ServicesSub-Programme 1:Management of CabinetAffairs
Successful Transition andentrenchment ofPresidential system ofgovernment
Level of operation ofGovernment (%)
100 100 100 100 100 100
Sub-Programme 2:State CorporationsAdvisory Services
Code of Governance ForState Corporations(Mwongozo)
Code of Governance forState Corporations
- 1 - - 1 -
Sub-Programme 3:Kenya South SudanAdvisory Services
Capacity Enhancement toGovernment of SouthSudan (GOSS) Officials
No. of Government ofSouth Sudan OfficialsTrained
400 400 919 619 919 500
Sub-Programme 4:Power of MercyAdvisory Services
Improved awareness onthe exercise of Power ofMercy
No. of CorrectionalFacilities Sensitized
- 6 27 - 27 36
Sub-Sector 2: State Department for Planning and Statistics
Programme 4: Economic Policy and National Planning
13
Programme Key Output Key PerformanceIndicators
Planned Target Achieved Target Remarks2013/14 2014/15 2015/16 2013/14 2014/15 2015/16
Sub-Programme1:Economic Planning andCoordination Service
County Planning SupportServices
County IntegratedDevelopment Plans(CIDPs), and M&Eguidelines
- 2 Noreports
-. 2 Noreports
- -
Sub programme 2:Community Development
Improved informationaccess to Communities
No. of information anddocumentation centres
104 35 - 104 31 -
CommunityEmpowerment
No. of communitymembers trained onproject management
8500 3000 800 9200 6728 2082
No. of MDGs statusreports
1 1 2 1 1 2
No. of projectsimplemented
10 33 15 8 25 12
Annual CDF allocationsand expenditure
Kshs. 28.67bn
Kshs.33.21bn
Kshs.28.67 bn
Kshs.33.21bn
Sub Programme 3:Economic policyplanning and regionalintegration
ImprovedMacroeconomicmanagement
Second MTP 2013 –2017
concept note 2nd MTP - Concept note 2nd MTP
Second MTP Reviewed - - - ReviewedMTP
No. of MTP SectorPlans prepared
- - 21 - -
No. of economic policybriefs
10 10 10 10 10 10
Enhanced coordination ofNEPAD Programmes inKenya
Annual Progress reports 10 10 10 4 6 10
Sub-Programme 4:Policy Research
Informed Public PolicyResearch and formulation No. of policy Research
Papers and Reports
90 84 115 71 118 132
Sub-Programme 5:Infrastructure andSocioeconomic Policy
Multi-sectoral PolicyCoordination services
No. of County BiasharaCenters capacity builton MSEs
- 2 14 - 3 14
14
Programme Key Output Key PerformanceIndicators
Planned Target Achieved Target Remarks2013/14 2014/15 2015/16 2013/14 2014/15 2015/16
and Planning Poverty reduction No. of CountyParticipatory PovertyAssessment V
- 47 countyreports
- - 47 countyreports
-
Infrastructure, ScienceTechnology& Innovations(ST&I) services
No. of project impactreports prepared
1 1 4 1 1 4
Sustainable populationmanagement,
No. of forums held todisseminate nationalpopulation Policy
20 20 20 50 60 70
Population surveyReports
1 1 1 1 1 2
Programme 5: National statistical information servicesSub- Programme 1:Surveys
Enhanced planning andpolicy formulation
Statistical publicationsand reports
36 36 36 36 36 36
National Sampling Framefor Household-basedsurveys
% of development ofthe National SampleSurvey EvaluationProgramme (NASSEPV)
80 90 100 80 84 98
Sub-Programme 2:Census and surveys
National Strategy for theDevelopment of Statistics(NSDS)
Sector Statistics PlansConsolidated intoNational Strategy onStatistics
1 1 1 1 1 1
Programme 6: Monitoring and Evaluation Services
Sub-Programme 1:National IntegratedMonitoring andEvaluation
Integrated M&E policysystem
No. of M&E Systemsdeveloped/operationalized
- 2 2 - 2 2
M&E Policy developedand disseminated
- - - -

15
Programme Key Output Key PerformanceIndicators
Planned Target Achieved Target Remarks2013/14 2014/15 2015/16 2013/14 2014/15 2015/16
No. of MDAs andcounties staff trained onM& E basic skill
- 100 100 - 100 60
No. of MTP indicatorshandbook
- 1 - - 1 -
Monitoring andEvaluation reports
No. of M&E Reportsprepared anddisseminated
2 3 2 2 3 2
Programme 7: Integrated Regional Development
Sub-Programme 1:Integrated Basin BasedDevelopment
Balanced regionaldevelopment
Integrated DevelopmentMaster Plans andannual reports(TARDA, CDA,ENNDA, ENSDA,LBDA, and KVDA)
12 12 12 12 12 12
Sub-sector 3: State Department for Devolution
Programme 8: Devolution Support Services
Sub-Programme 1::Management ofDevolution Affairs
County Governmentestablished
No.of CountyGovernments
47 - - 47 - -
County Model lawsdeveloped and Reviewed
No. of Laws - 51 51 - 51 51
Devolution PolicyDeveloped
The Policy (%) - 50 100 - 50 95
Devolution resourcecenter established
COG Maarifa Centre - - 1 - - 1
All devolved functionstransferred
No. of countiesinvolved (s)
47 - - 47 - -
The Summit Held No. of Summitsmeetings
1 1 1 1 1 1

16
Programme Key Output Key PerformanceIndicators
Planned Target Achieved Target Remarks2013/14 2014/15 2015/16 2013/14 2014/15 2015/16
Sub-Programme 2:IntergovernmentalRelations
IntergovernmentalSectoral forumsestablished andoperationalized
No. of forums 15 - - 7 8 3
Sub-Programme 3:Capacity Building
National Capacitybuilding frameworkdeveloped
The framework - 1 - - 1 -
Civic Education onDevolution conducted
No. of counties 47 47 5 47 47 25
Sub-Sector 4: Ministry of Foreign AffairsProgramme 9:General Administration, Planning and Support Services
Sub programme 1:Administration Services
Policies finalized (Kenyaforeign policy and Kenyadiaspora policy)
Number of policiesfinalized
- 2 - - 2 -
Enhanced Kenya’sinfluence at internationallevels
Placement of Kenyansin internationalorganisations (No.)
4 4 4 5 7 6
Country candidatures indecision making bodies(No.)
6 6 6 4 2 8
JCCsmonitored/Initiated/concluded
JCC frameworkconcluded
4 4 - 2 4 4
Agreement/MOUsConcluded
Number of agreements/MOUs concluded
16 10 - 1 27 20
Programme 10: Foreign Relations and DiplomacySub programme 1:Management of KenyaMissions abroad.
Expanded Kenya’sinfluence abroad
New Missions,Consulates and LiaisonOffices opened (No.)
3 9 2 1 2 -
Honorary Consuls vettedand appointed
Number of HonoraryConsuls appointed
2 9 4 2 4 1
Interests of Kenyanabroad promoted
Number of bilaterallabour agreementsnegotiated
1 2 1 1 2 3

17
Programme Key Output Key PerformanceIndicators
Planned Target Achieved Target Remarks2013/14 2014/15 2015/16 2013/14 2014/15 2015/16
Kenya’s profile asmultilateral andinternational conferenceshub
InternationalConferences hosted(No.)
1 - 3 1 - 3
Peace and security withinthe region promoted
No. of peace forums 3 3 3 3 3 3
Sub programme 2:InfrastructureDevelopment forMissions
Improved image and workenvironment in Kenyanmissions
Number of Chanceriesand official residencerefurbished
5 5 5 3 5
Number of Chanceriesand official residencepurchased-Kampala
- 1 1 - - 1
Number ofChanceries/Ambassadors constructed
2 1 1 2 1 2 .
Programme 11: International Trade and Investment Promotion
Sub-programme 1:International Trade
Trade negotiationscoordinated
Number of negotiationforums coordinated
3 3 4 3 3 4
Trade agreements/MOUs concluded
Number of agreements/MOUs concluded
8 4 4 8 2 4
Kenya’s exports andinvestments promoted
Number of businessinvestments forumsorganized
5 9 8 5 9 8
Regional andinternational integrationmeetings and forumscoordinated
25 25 25 22 22 22
Sub-Sector 5: National TreasuryProgramme 12: General administration planning and support services
Sub-programme 1:Administration services
Group personal accidentinsurance claims settled.
Claims settled (%) 100 100 100 44 41 55

18
Programme Key Output Key PerformanceIndicators
Planned Target Achieved Target Remarks2013/14 2014/15 2015/16 2013/14 2014/15 2015/16
Sub-programme 2:Financial services
Tested modules of iTaxand rolled out
Number of modulesdeveloped and rolledout
6 5 5 6 5 5
Pensions claimsprocessed and paid
Days taken to processclaims
22 22 22 22 20 20
Sub-programme 3: ICTservices
Disaster Data RecoveryCentre operationalized
Disaster Data RecoveryCentre in place
1 1 1 1 1 1
Programme13: Public financial managementSub-programme 1:Resource mobilization
Enhanced Externalresources mobilization
% of External resourcesto total budget
14 14 14 14.6 17.95 16.6
Donor funds disbursed % of donor fundsdisbursed
80 80 80 52.98 68.70 44.4
HIV AIDS , Malaria andTB funds provided(Global Fund)
Funds allocated andutilized
3,136m 11,435 m 14,204m 1,823m 9,036m 11,551m
Public-PrivatePartnerships lawoperationalized
National and CountyPPP Regulations
1 1 1 1 1 1
Sub-programme 2:Budget formulationcoordination andmanagement
PBB capacity built Officers trained (%) 100 100 100 100 100 100
Enhanced Stakeholderparticipation in thebudget process
stakeholderparticipation foraorganized (No.)
2 2 2 3 3 3
Annual National Budgetfinalized
Printed Estimates 1 1 1 1 1 1
Sub-programme 3:Audit Services
Value for Money (VFM)and Performance Audits
Institutions audited(No.)
4 3 3 19 17 55
Internal Audit regulationsand manuals developed
No. Regulations,guidelines and manualsdeveloped
1 1 1 1 1 1
Internal Audit Capacitybuilt in MDAs
Training manual - 1 - - 1 -
Sub-programme 4:Accounting services
Capacity built inInternational PublicSector AccountingStandards (IPSAS)
Number of officerstrained
- - 6000 - - 4300

19
Programme Key Output Key PerformanceIndicators
Planned Target Achieved Target Remarks2013/14 2014/15 2015/16 2013/14 2014/15 2015/16
Re-engineered IFMIS Number of additionalIFMIS modulesactivated
3 - 1 3 - 1
number of Countiesand Parastatalsconnected
47 - 19 SAGAS 47 - 18 SAGAS
Sub-programme 5:Supply ChainManagement Services
Public procurement Legaland regulatoryframeworks reviewed
PPADA Act - - 2 - - 2
Access to GovernmentProcurementOpportunities policyimplemented
Reviewed regulation 1 - - 1 - -
Number of enterprisesregistered under AGPO
- - 36,000 - - 37,000
Sub-programme 6:Public FinancialManagement Reforms
Public financialmanagement reformsCapacity built
Number of officerstrained
500 1000 6000 306 864 5500
County Internal Audit andBudget manualsDeveloped
County Internal Auditand Budget manuals(No.)
- 2 - - 2 -
Sub-programme 7:Government Investmentsand Assets
State owned enterprisesrestructured
Status reports 1 1 1 1 1 1
Equity participation instrategic enterprises
Number of enterprisessupported
3 4 4 3 4 4
Parastatals reformsFramework Developed
Parastatal reformsFramework
1 - - - 1 -
Programme 14: Economic and financial policy formulation and managementSub-programme 1:Fiscal PolicyFormulation,Development andManagement
Sustainable Fiscal deficit % fiscal deficit to GDP 4.9 4.9 4.9 5.4 6.1 7.9
e-ProMIS upgraded androlled out
Number of MDAs andcounties using e-ProMIS.
18 Ministries - Capacitybuilding
- 10counties.
Capacitybuilding- 18Ministries
- Capacitybuilding - 3
counties
Budget Review andOutlook Paper andBudget Policy Statement
Budget review andOutlook Paper; BudgetPolicy Statement.
2. 2. 2 2 2 2
20
Programme Key Output Key PerformanceIndicators
Planned Target Achieved Target Remarks2013/14 2014/15 2015/16 2013/14 2014/15 2015/16
Improved revenuecollection
Revenue as % of GDP 20.5% 20.5% 20.5% 18.9% 19.3% 19.02%
Sub-programme 2: Debtmanagement
Sovereign bond proceedsreceived.
Sovereign Bondproceeds
- 2 bn USD 750mnUSD
2 bn USD 750mn USD
Sub-programme 3:Micro Finance SectorSupport and development
Capacity building forwholesalers
Number of staff of thewholesalers trained
700 700 700 700 700 700
Programme 15: Market competitionSub-programme 1:Elimination of restrictivetrade practices
Competitive Businessenvironment
Guidelines developed 4 5 4 4 5 4
Sub-Sector 6: Public Service and Youth
Programme 16: Youth Empowerment
Sub-programme 1:National Youth Service
Youth empowerment No. of youth recruitstrained in diverse trades
4,000 21,870 21,870 4,000 21,870 10,935
No. of youth trained onsocial transformation
- 75,000 150,000 - 82,636 76,934
No. of communityyouth SACCOsregistered
- 66 234 - 66(Sh 409m)
134(Sh841mm)
CommunityEmpowerment
No. of dams/waterpans Constructed underNYS programme
- 500 - 9 193 -
No. of counties coveredunder vector controlNYS programme
- 6 7 - 3 2
Sub-programme 2:Youth DevelopmentServices
Youth mentored andCapacity build
No. of youth mentoredon leadership andNational Values
- - 4,700 - 5,000

21
Programme Key Output Key PerformanceIndicators
Planned Target Achieved Target Remarks2013/14 2014/15 2015/16 2013/14 2014/15 2015/16
No. of youths sensitizedon AGPO promotion,Entrepreneurship skills,and social vices
- - 29,000 - - 30,000
No. of youth engaged ininternships andApprenticeship
- 4,700 4,700 - 7,919 5,170
Sub-programme3:Youth EmploymentScheme
Enhanced Youthentrepreneurship andfinancial managementcapacity built
Amounts disbursed toyouth (Kshs. M).
700 600 830 796.84 612.33 463.2
No. of youth trained onentrepreneurship skills
44,000 44,000 45,000 45,269 44,082 44,368
Employment secured foryouth
No of youth whosecured jobs outsideKenya
3,000 4,000 4,100 2,504 4,350 1,611
Programme 17: Public Service Transformation
Sub-programme 1:Human ResourceManagement
Improved public servicewelfare
Reviewed andadministered. MedicalScheme
1 1 1 1 1 1
Post-retirement medicalscheme developed andadministered
Draft Post-RetirementMedical Scheme
- - DraftMedicalScheme
- - Draft MedicalScheme
Government HumanResource InformationSystem (GHRIS)upgraded
Modules developed/infrastructure acquired
1 . . . .
Capacity Assessment andRationalization of thePublic Service Report
No of CMDAS underCARPs
- 65 67 - 65 67 .
HumanResource ManagementStrategy developed andimplemented
Human ResourceManagement Strategy
- - 1 - - -

22
Programme Key Output Key PerformanceIndicators
Planned Target Achieved Target Remarks2013/14 2014/15 2015/16 2013/14 2014/15 2015/16
Sub-programme 2:Human ResourceDevelopment
Training Revolving Funddisbursed
Public Service TrainingRevolving Fund (TRF)(Kshs).
96 Million 86 Million 72 Million 96 Million 86 Million 72 Million
National CapacityBuilding Framework(NCBF) status reviewreports and NCBFMedium term initiativesdeveloped andimplemented
No. of staff trained - - 2500 - - 2500
No. of curriculum andtraining manualsdeveloped
- 5 5
No. of countiessupported in developingtheir capacities
- 8 8
No. of Capacitybuilding plansdeveloped
- - 1 - - 1
In-service trainingundertaken
No. of public servantssponsored (lower andMiddle level cadreofficers)
1200 1500 1500 0 0 0
No. of in-servicetrainings programmesreviewed
- - 3 - - 3
Sub-programme 3:ManagementConsultancy Services
Schemes of servicedeveloped
No. Schemes of servicedeveloped/revised
19 20 19 24 28 23
Organization review forpublic service institutionsundertaken CMDAS andcounties undertaken
No. of public serviceinstitutions restructured
89 65 18 89 65 18
Sub-programme 4:Huduma Kenya
Huduma Centresestablished andoperationalized
No. of operationalHuduma centres incounties/sub-countiesestablished
10 10 20 14 10 16
23
Programme Key Output Key PerformanceIndicators
Planned Target Achieved Target Remarks2013/14 2014/15 2015/16 2013/14 2014/15 2015/16
Business processes re-engineered in the publicservice
No. of businessprocesses re-engineered
- 26 21 - 27 13
Sub-programme 5:PerformanceManagement
Public Institutions andCounties placed onPerformance
No. of publicinstitutions andCounties underPerformance Contract
295 342 350 295 298 327
Sub-Sector 9: Commission on Revenue Allocation
Programme 18: Inter government revenue and financial matters.
Sub-Programme 1:Legal and Public Affairs
County legislationimproved
County AllocationRevenue Act (CARA)
1 1 1 1 1 1
Finance Bills/legislations (No.)
47 47 47 47 47 47
Sub Programme 2:Research and Policy
Improved allocation ofresources
Recommendations forVertical and horizontalallocation formuladeveloped
2 2 2 2 2
Improved participation ofcitizens in developmentmatters
Marginalisation policyreviewed
1 - - 1 - -
Sub - Programme 3:County CoordinationServices
Improved financialallocation andmanagement
No. of Finance billsreviewed
47 47 47 47 47 47
Sub-Sector 10: Public Service Commission
Programme 19: General Administration, Planning and Support ServicesSub - Programme 1:Administration
Communication Strategydeveloped andimplemented
The commission’sstrategy implementationlevel (%)
100 100 100 100 100 100

24
Programme Key Output Key PerformanceIndicators
Planned Target Achieved Target Remarks2013/14 2014/15 2015/16 2013/14 2014/15 2015/16
PSC Act fully aligned toCOK 2010
Reviewed PublicService CommissionAct 2012
- - 1 - - 1
Developed policyguidelines and regulations(Public participation andPublic complaints)
No. of policyguidelines developedregulations
- 2 2 - 2 2
Programme 20: Human Resource Management and Development
Sub-Programme 1:Establishment andManagementConsultancy Services
Technical assistance onHuman Resource mattersto counties
No. of counties offeredtechnical assistance
N/A 47 47 N/A 47 countiesinducted
47 countiessupported
Sub-Programme 2:Human ResourceManagement
Human ResourceManagement andDevelopment Policies andguidelines
No. of policies andguidelinesdeveloped/revised
- 2 14 - 2 14
Sub-Programme 3:Human ResourceDevelopment
Develop and reviewedperformance managementtools
Performancemanagement toolsdeveloped and reviewed
- - 1 - - 1
Programme 21: Governance and National Values
Sub-Programme 1:Ethics Governance andNational Values
Declaration of income,Assets and Liabilities bypublic servants
Level of compliance(%)
100 - 100 89 - 97% forMDAs and87% for StateCorporations
Reviewed Code of Ethicsand Conduct
Revised Code of Ethicsand Conduct
- 1 - - 1 -
Sub-Programme 2:Compliance and QualityAssurance
Compliance Audits ofMDAs on organization,administration andpersonnel practices
Number of MDAsaudited
22 22 45 22 22 -
Compliance audit andM&E standards, tools andprocedures manualsreviewed
No. of manualsreviewed
- 2 2 - 2

25
Programme Key Output Key PerformanceIndicators
Planned Target Achieved Target Remarks2013/14 2014/15 2015/16 2013/14 2014/15 2015/16
Sub-Sector 11: Salaries & Remuneration CommissionProgramme 22: Remuneration & Benefits Management
Sub-Programme 1:Remuneration & BenefitsManagement
Comprehensive JobEvaluation for the PublicService executed andimplemented
No. of Sectorsevaluated andimplemented
- 7 sectors - - Jobevaluationfor five (5)
sectorscommenced
JE for 5sectors at
80%
Policy and LegalFramework on PublicRemuneration andBenefits
No. of draft policy andlegal frameworkpublished
- 2 - 2 -
Report on reviewed,rationalized andharmonized allowancesfor Public Officers.
No. of reports onharmonized allowances
- 1 - 1 -
Sub-Sector 12: Auditor GeneralProgramme 23:Audit ServicesSub-Programme 1:National GovernmentAudit
Audit Reports No. of Audit Reports tobe issued
600 607 607 600 607 693
Sub-Programme2:County GovernmentAudit
Audit Reports No. of Audit Reports tobe issued
- 47 47 - 47 47
Sub-Programme 3: CDFAudit
Audit Reports No. of Audit Reports tobe issued
- 290 290 - 290 290
Sub-Programme 4:Specialized Audit
Audit Reports No. of Audit Reports tobe issued
80 110 110 80 110 20
Sub-Sector 13: Controller of BudgetProgramme 24: Control and Management of Public financesSub-Programme 1:Authorization ofwithdrawal from public
Timely approval ofMDAs exchequerrequisitions
No. of days taken toapprove Exchequerrequisitions.
1 1 1 1 1 1

26
Programme Key Output Key PerformanceIndicators
Planned Target Achieved Target Remarks2013/14 2014/15 2015/16 2013/14 2014/15 2015/16
Funds Timely processing ofConsolidated FundServices
No. of weeks taken toprocess public debtservice files andPension files
1 1 1 1 1 1
Sub-Programme 2:Budget implementationReview Analysis
Budget Implementationreview reports
No. of reports producedto the national andcounty governments
8 8 8 8 8 8
Public sensitizationforums on budgetimplementation
No. of public forumsheld
2 2 2 2 2 2
Sub-Programme 3:GeneralAdministration/planningand support services
Efficient Service Delivery Annual reports 1 1 1 1 1 1
No. of Investigationreports
3 - 2 3 2 -
Sub-Programme 4:Research &Development.
Monitoring andEvaluation of projects
Annual County M&Ereports
47 47 47 47 47 47
Sub-Sector 14: Commission on Administrative Justice
Programme 25:Promotion of Administrative Justice
Sub-Programme 1:Ombudsman Services
Addressed and/orResolved publiccomplaints onmaladministration
Complaints handled.(%) - 100 100 100 100 100
Complaints resolved.(%) - 56 62 34 62 82
No. of MDAs certifiedfor compliance onresolution of publiccomplaints.
- 20 220 - 233 250
Increased Ombudsmanservice delivery points.
No. of additionalOmbudsman offices anddesks at HudumaCenters established.
- 2 10 - 3 11
No. of outreach foraheld - 8 10 - 8 13

27
2.2 Expenditure Analysis
The total allocation to the Public Administration and Internal Relations sector during the period2013/14 to 2015/16 financial years was Kshs.522,026million and the actual expenditure duringthe same period was Kshs.434,309million. This represents an absorption rate of 83%. During theMTEF period the allocation to the sector increased by 58%.In the financial years 2013/14 to2014/15 the total allocation increased by 31% while in the period 2014/15 to 2015/16 the increasewas 21%. In terms of actual expenditure the absorption rates were 87%, 90% and 75% in thefinancial years 2013/14, 2014/15 and 2015/16 respectively. This shows a mixed trend in actualexpenditure during the MTEF period with the lowest being in the financial year 2015/16.
2.2.1 Analysis of Programme Expenditure
During the period under review the increase in allocation was mainly contributed by the followingProgrammes; Public Financial Management, General Administration Planning and SupportServices (National Treasury), Economic policy and National Planning, Integrated RegionalDevelopment Planning , Public service transformation, National Statistical Information Servicesand International Trade and Investments. The major reasons for increased funding in theseprogrammes were; funding of the Pension Superannuation Scheme for Public Servants, Securityoperations funds for the leasing of National Police Service vehicles, Allocation for strategicinterventions for state corporations, House allowance, Mortgage and Car loan, funds for civilservants in other MDAs, Increase in international conferences which include WTO, UNCTADand TICAD, allocation of funds to the KNBS for programme for results funded by the WorldBank and increase in the Youth Development Initiatives activities within the informal settlementsacross the country.
During the review period the following had very good absorption rate of between 95% and 100%;State House Affairs, NGO Regulatory Services, Foreign Relations and Diplomacy,Administration and Support Services (State Department of Devolution), Market Competition andCreation of an enabling Business Environment, Public Service Transformation, Human ResourceManagement and Development and Governance and National Values. This was mainly due totransfer of the funds to the relevant government organizations. However it was noted that duringthe financial years 2013/14, 2014/15 and 2015/16 the following programmes had absorption ratesof over 100%; Devolution Support Services, Inter Government Revenue and Financial Matters,General Administration, Planning and Support Services (Public Service Commission),Government Advisory Services, Youth Empowerment and Deputy President Services. This wasmainly caused by budget cuts during the supplementary budget when the funds have already beenspent by the respective Ministries.
28
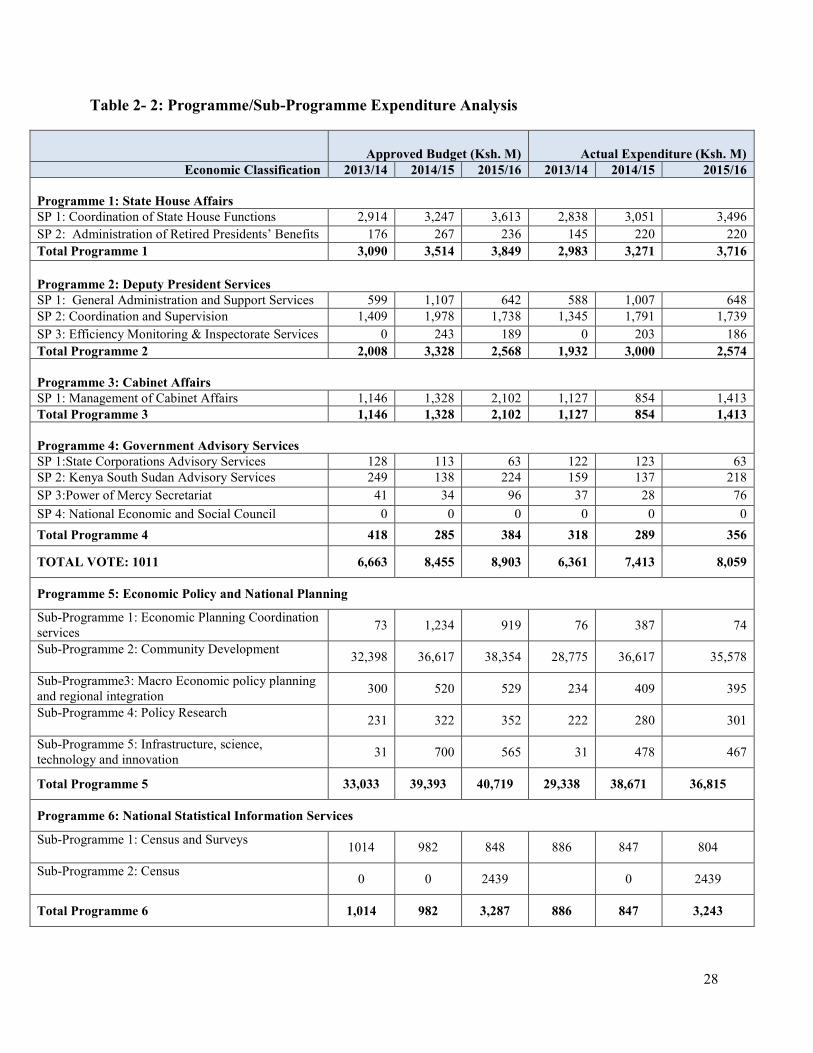
Table 2- 2: Programme/Sub-Programme Expenditure Analysis
Approved Budget (Ksh. M) Actual Expenditure (Ksh. M)Economic Classification 2013/14 2014/15 2015/16 2013/14 2014/15 2015/16
Programme 1: State House AffairsSP 1: Coordination of State House Functions 2,914 3,247 3,613 2,838 3,051 3,496SP 2: Administration of Retired Presidents’ Benefits 176 267 236 145 220 220Total Programme 1 3,090 3,514 3,849 2,983 3,271 3,716
Programme 2: Deputy President ServicesSP 1: General Administration and Support Services 599 1,107 642 588 1,007 648SP 2: Coordination and Supervision 1,409 1,978 1,738 1,345 1,791 1,739SP 3: Efficiency Monitoring & Inspectorate Services 0 243 189 0 203 186Total Programme 2 2,008 3,328 2,568 1,932 3,000 2,574
Programme 3: Cabinet AffairsSP 1: Management of Cabinet Affairs 1,146 1,328 2,102 1,127 854 1,413Total Programme 3 1,146 1,328 2,102 1,127 854 1,413
Programme 4: Government Advisory ServicesSP 1:State Corporations Advisory Services 128 113 63 122 123 63SP 2: Kenya South Sudan Advisory Services 249 138 224 159 137 218SP 3:Power of Mercy Secretariat 41 34 96 37 28 76SP 4: National Economic and Social Council 0 0 0 0 0 0Total Programme 4 418 285 384 318 289 356
TOTAL VOTE: 1011 6,663 8,455 8,903 6,361 7,413 8,059
Programme 5: Economic Policy and National Planning
Sub-Programme 1: Economic Planning Coordinationservices 73 1,234 919 76 387 74
Sub-Programme 2: Community Development 32,398 36,617 38,354 28,775 36,617 35,578
Sub-Programme3: Macro Economic policy planningand regional integration 300 520 529 234 409 395
Sub-Programme 4: Policy Research 231 322 352 222 280 301
Sub-Programme 5: Infrastructure, science,technology and innovation 31 700 565 31 478 467
Total Programme 5 33,033 39,393 40,719 29,338 38,671 36,815
Programme 6: National Statistical Information Services
Sub-Programme 1: Census and Surveys 1014 982 848 886 847 804
Sub-Programme 2: Census 0 0 2439 0 2439
Total Programme 6 1,014 982 3,287 886 847 3,243
29
Approved Budget (Ksh. M) Actual Expenditure (Ksh. M)Economic Classification 2013/14 2014/15 2015/16 2013/14 2014/15 2015/16
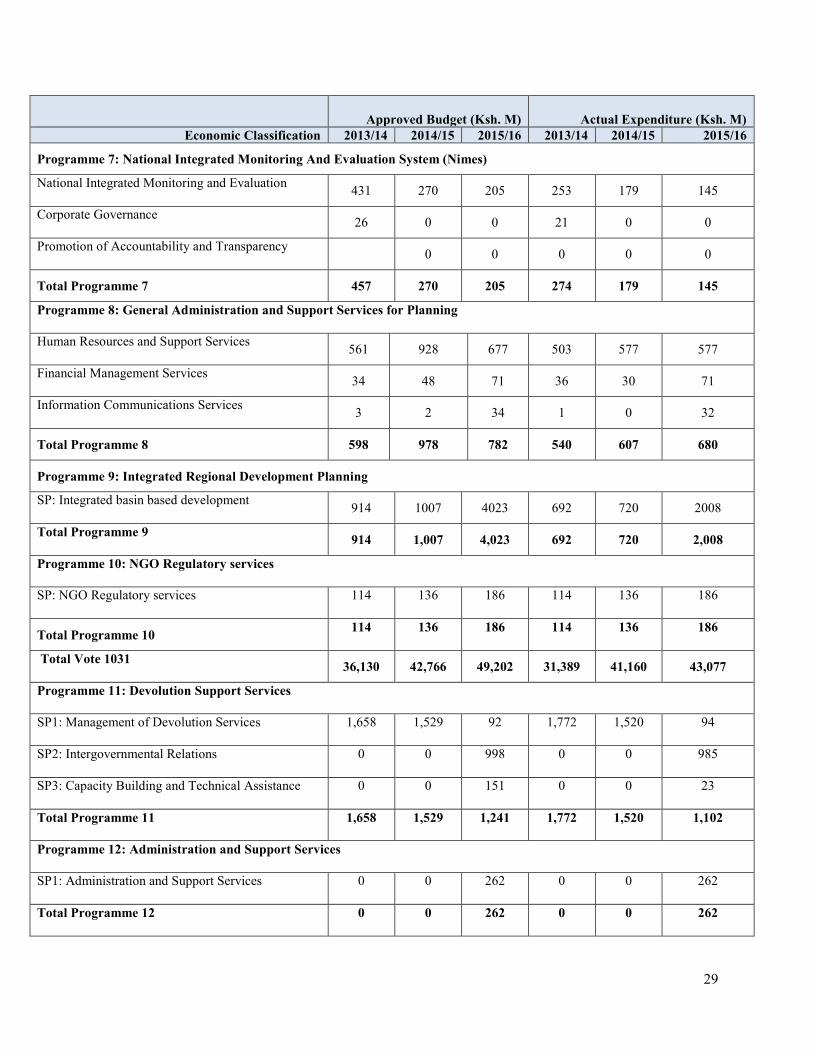
Programme 7: National Integrated Monitoring And Evaluation System (Nimes)
National Integrated Monitoring and Evaluation 431 270 205 253 179 145
Corporate Governance 26 0 0 21 0 0
Promotion of Accountability and Transparency 0 0 0 0 0
Total Programme 7 457 270 205 274 179 145
Programme 8: General Administration and Support Services for Planning
Human Resources and Support Services 561 928 677 503 577 577
Financial Management Services 34 48 71 36 30 71
Information Communications Services 3 2 34 1 0 32
Total Programme 8 598 978 782 540 607 680
Programme 9: Integrated Regional Development Planning
SP: Integrated basin based development 914 1007 4023 692 720 2008
Total Programme 9 914 1,007 4,023 692 720 2,008
Programme 10: NGO Regulatory services
SP: NGO Regulatory services 114 136 186 114 136 186
Total Programme 10 114 136 186 114 136 186
Total Vote 1031 36,130 42,766 49,202 31,389 41,160 43,077
Programme 11: Devolution Support Services
SP1: Management of Devolution Services 1,658 1,529 92 1,772 1,520 94
SP2: Intergovernmental Relations 0 0 998 0 0 985
SP3: Capacity Building and Technical Assistance 0 0 151 0 0 23
Total Programme 11 1,658 1,529 1,241 1,772 1,520 1,102
Programme 12: Administration and Support Services
SP1: Administration and Support Services 0 0 262 0 0 262
Total Programme 12 0 0 262 0 0 262

30
Approved Budget (Ksh. M) Actual Expenditure (Ksh. M)Economic Classification 2013/14 2014/15 2015/16 2013/14 2014/15 2015/16
Total Vote 1032 1,658 1,529 1,503 1,772 1,520 1,364
Programme:13 General Administration, Planning and Support Services
Sub-Programme 1: Administrative Services 2,655 3,080 4,151 2,541 2,921 3,925
Sub-Programme 2:Infrastructure Development - 738 393 - 446 322
Total Programme 13 2,655 3,818 4,544 2,541 3,368 4,247
Programme 14: Foreign Relations and Diplomacy
Sub-Programme 1: Management of Kenya MissionsAbroad
9,340 10,063 9,661 8,999 9,419 9,661
Sub-Programme 2: Infrastructure Development forMissions
342 890 709 285 781 709
Total Programme 14 9,682 10,953 10,370 9,284 10,201 10,370
Programme 15: International Trade and Investments
Sub-Programme 1: International Trade 82 170 1,512 79 146 1,203
Sub-Programme 3: Foreign Trade Services 222 102 101 149 101 -
Total Programme 15 305 272 1,613 228 248 1,203
Total Vote 1051 12,642 15,043 16,527 12,053 13,816 15,820
Programme 16:General Administration, Planning and Support Services
SP 1: Administration Services 6,224 10,226 14,628 4,929 9,698 12,643
SP 2: Human Resources Management Services 71 50 69 66 48 41
SP 3: Financial Services 14,061 17,538 25,707 14,046 17,511 17,560
SP 4: ICT Services - 551 857 - 508 375
Total Programme 16 20,356 28,365 41,261 19,041 27,765 30,618
Programme 17: Public Financial Management
SP 1: Resource Mobilization 194 13,154 17,112 152 8,562 9,187
SP 2: Budget Formulation, Coordination andManagement
5,224 8,610 11,270 3,655 2,589 11,152
SP 3: Audit Services 563 563 612 563 547 312

31
Approved Budget (Ksh. M) Actual Expenditure (Ksh. M)Economic Classification 2013/14 2014/15 2015/16 2013/14 2014/15 2015/16
SP 4: Accounting Services 2,970 2,970 3,308 2,970 2,939 2,216
SP 5: Supply Chain Management Services 572 572 600 572 561 538
SP 6: Public Financial Management Reforms 1,269 1,019 1,251 877 280 420
SP 7: Government Investments and Assets 9,997 12,794 21,868 9,929 11,130 1,157
Total Programme 17 20,790 39,682 56,021 18,719 26,608 24,982
Programme 18: Economic and Financial Policy Formulation and Management
SP 1: Fiscal Policy Formulation, development andManagement
1,827 1,827 1,395 676 1,542 890
SP 2: Debt Management 66 66 89 55 55 38
SP 3: Microfinance Sector Support and Development 521 1,074 824 289 289 13
Total Programme 18 2,414 2,967 2,308 1,020 1,886 941
Programme 19: Market Competition and Creation of an Enabling Business Environment
SP 1: Elimination of Restrictive Trade Practices - 290 375 - 290 375
Total Programme 19 415 290 375 366 290 375
Total Vote 1071 43,975 71,304 99,965 39,146 56,549 56,916
Programme 20: Youth Empowerment
Sub-Programme 1.1. National Youth Service 13,741 19,090 17,963 8,265 21,848 16,967
Sub-Programme 1.2 Youth Development Services 6,753 1,912 704 4,955 1,726 682
Sub-Programme 1.3 Youth Employment Scheme 330 225 531 356 225 531
Sub-Programme 1.4 Youth Coordination andRepresentation
34 44 33 34 34 33
Total Programme 20 20,858 21,270 19,231 13,609 23,833 18,213
Programme 21: Public Service Transformation
Sub-Programme 2.1 Human Resource Management 4,881 4,916 5,158 5,179 4,902 4,996
Sub-Programme 2.2 Human Resource Development 923 680 802 814 658 763
Sub-Programme 2.3 Management ConsultancyServices
82 79 74 74 71 65
Sub-Programme 2.4 Huduma Kenya ServiceDeliveries.
846 2,983 3,402 672 2,967 3,212
32
Approved Budget (Ksh. M) Actual Expenditure (Ksh. M)Economic Classification 2013/14 2014/15 2015/16 2013/14 2014/15 2015/16
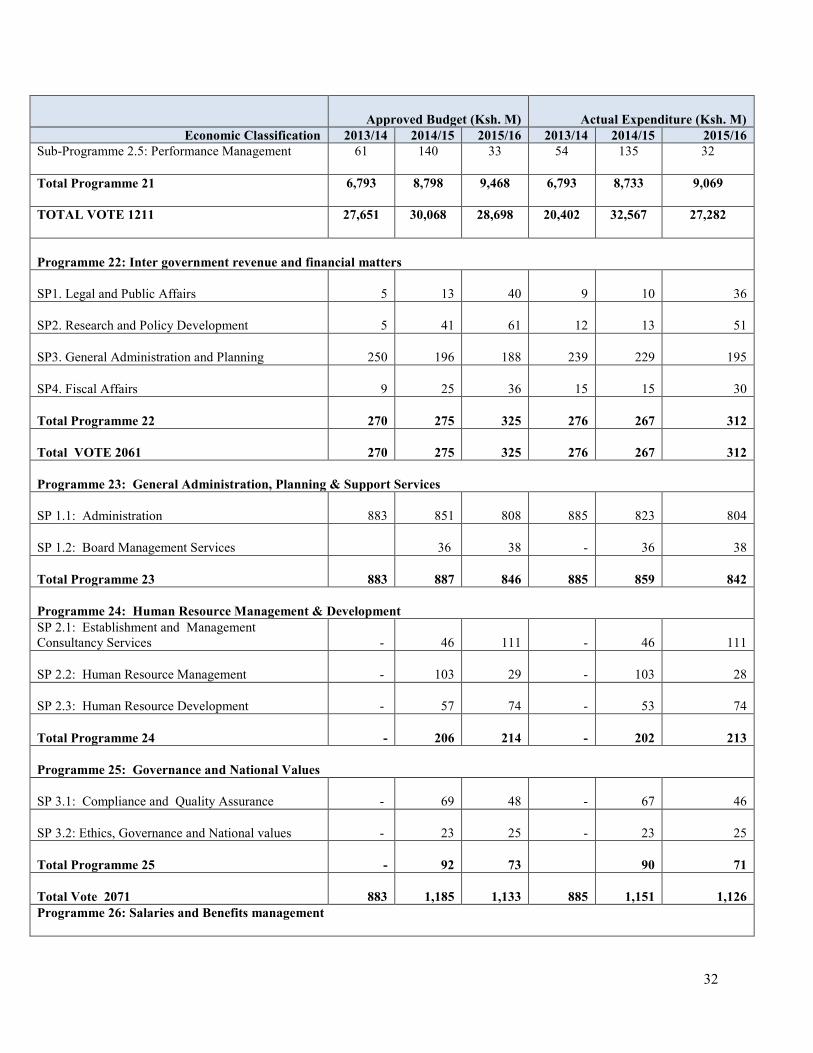
Sub-Programme 2.5: Performance Management 61 140 33 54 135 32
Total Programme 21 6,793 8,798 9,468 6,793 8,733 9,069
TOTAL VOTE 1211 27,651 30,068 28,698 20,402 32,567 27,282
Programme 22: Inter government revenue and financial matters
SP1. Legal and Public Affairs 5 13 40 9 10 36
SP2. Research and Policy Development 5 41 61 12 13 51
SP3. General Administration and Planning 250 196 188 239 229 195
SP4. Fiscal Affairs 9 25 36 15 15 30
Total Programme 22 270 275 325 276 267 312
Total VOTE 2061 270 275 325 276 267 312
Programme 23: General Administration, Planning & Support Services
SP 1.1: Administration 883 851 808 885 823 804
SP 1.2: Board Management Services 36 38 - 36 38
Total Programme 23 883 887 846 885 859 842
Programme 24: Human Resource Management & DevelopmentSP 2.1: Establishment and ManagementConsultancy Services - 46 111 - 46 111
SP 2.2: Human Resource Management - 103 29 - 103 28
SP 2.3: Human Resource Development - 57 74 - 53 74
Total Programme 24 - 206 214 - 202 213
Programme 25: Governance and National Values
SP 3.1: Compliance and Quality Assurance - 69 48 - 67 46
SP 3.2: Ethics, Governance and National values - 23 25 - 23 25
Total Programme 25 - 92 73 90 71
Total Vote 2071 883 1,185 1,133 885 1,151 1,126Programme 26: Salaries and Benefits management

33
Approved Budget (Ksh. M) Actual Expenditure (Ksh. M)Economic Classification 2013/14 2014/15 2015/16 2013/14 2014/15 2015/16
SP: Remuneration & Benefits Management 507 840 970 432 662 731
Total Programme 26 507 840 970 432 662 731
Total Vote 2081 507 840 970 432 662 731
PROGRAMME 27: Audit Services
Sub-Programme 1: National Government Audit - 2,635 3,046 - 2,185 2,928
Sub-Programme 2: County Government Audit - 356 526 - 295 525
Sub-Programme 3: CDF Audit - - 80 - 80
Sub-Programme 4: Specialized Audit - 325 249 - 269 245
Total Programme 27 3,286 3,316 3,900 3,047 2,750 3,778
Total Vote 2111 3,286 3,316 3,900 3,047 2,750 3,778
Programme 28: Control and Management of Public finances
S.P.1 Authorization of withdrawal from publicFunds
155 150 170 133 139 155
S.P.2Budget Implementation Review Analysis
28 34 34 18 32 29
S.P.3General Administration/planning and supportservices
179 202 314 148 190 292
S.P. 4 Research & Development10 10 11 8 8 10
Total Programme 28 372 396 529 307 369 486
Total Vote 2121 372 396 529 307 369 486
Programme 29: Promotion of Administrative Justice
Sub -Programme 1: Ombudsman Services 297 395 465 284 355 425
Total Programme 29 297 395 465 284 355 425
Total Vote 2131 297 395 465 284 355 425
TOTAL SECTOR 134,334 175,572 212,120 116,354 158,579 159,376

34
2.2.2 Analysis of Programme Expenditure by Economic Classification
The total allocation for the MTEF period 2013/14 to 2015/16 was Kshs.522, 026 million out of whichKshs.226,658 and Kshs.295,370 related to current and Capital allocation respectively. The total expenditurefor the period was Kshs.434,309 out of which Kshs.207, 390 and Kshs.226,917related to current and capitalexpenditure respectively. This translates to an absorption rate of 83 percent out of which 91.5 percent and76.8 per cent for current and capital expenditure respectively. The under absorption in the capitalexpenditure was mainly contributed by the acquisition of non-financial assets and other development.
Under the current expenditure, the cumulative sector allocation during the MTEF period 2013/14 to2015/16 amounted to Kshs.57,008 million, Kshs.82,945, Kshs.77,530 and Kshs.9,176 to compensation ofemployees, use of goods and services, grants and other transfers and other recurrent respectively. While theexpenditure for the period amounted to Kshs.55,101, Kshs.75,070 , Kshs.68,852 and 8,367 forcompensation of employees, use of goods and services, grants and other transfers and other recurrentrespectively. This translates to 96.7 percent, 90.7 percent, 89 percent and 91.2 percent for compensation ofemployees, use of goods and services, grants and other transfers and other recurrent respectively.
In the case of the capital expenditure, the sector allocation for the MTEF period 2013/14 to 2015/16amounted to Kshs.40,458, Kshs.150,112, and Kshs.104,800 for acquisition of non-financial assets , capitalgrants to Government agencies and other development respectively. The expenditure for the periodamounted to Ksh.24, 873, Kshs.133,28 and 68,806 for acquisition of non-financial assets, capital grants toGovernment agencies and other development respectively. This translates to an absorption rate of 61.5percent, 88.8 percent and 65.7 percent for acquisition of non-financial assets, capital grants to Governmentagencies and other development respectively. This meant that the absorption for acquisition of non-financialassets and other development was low in the MTEF period as explained in section 2.2.1 above.
The analysis of the sector programmes by economic classification is as detailed in Table 2.3 below:
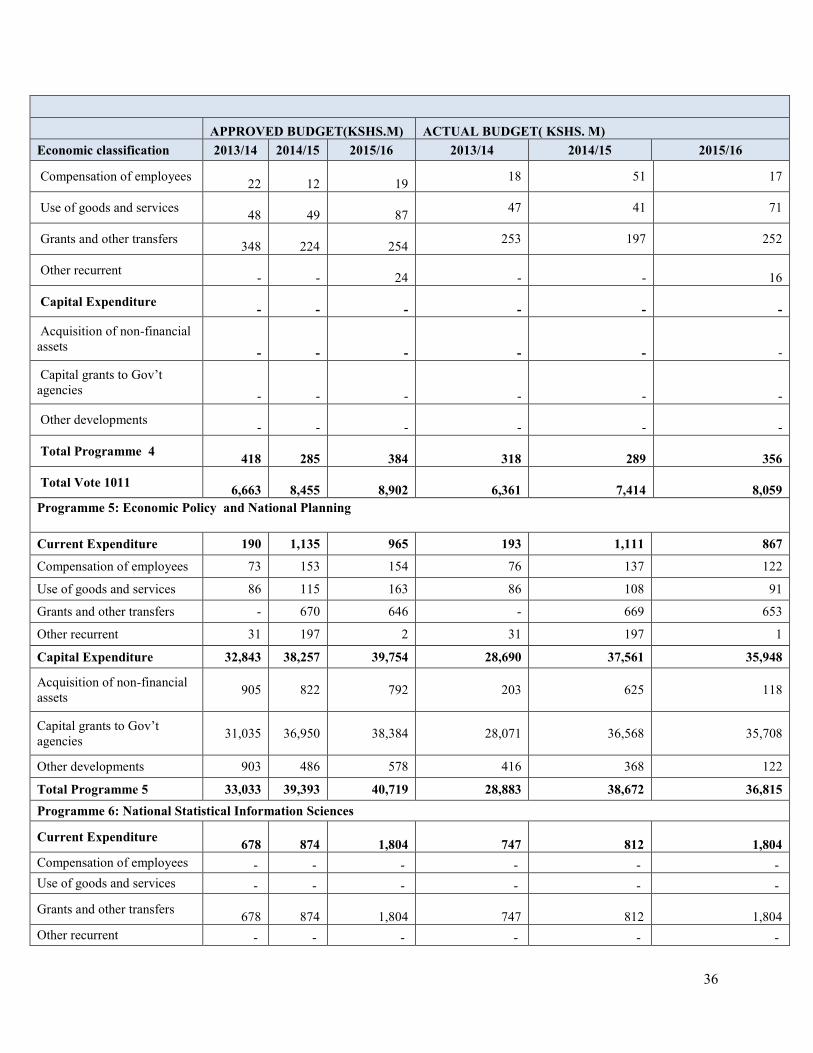
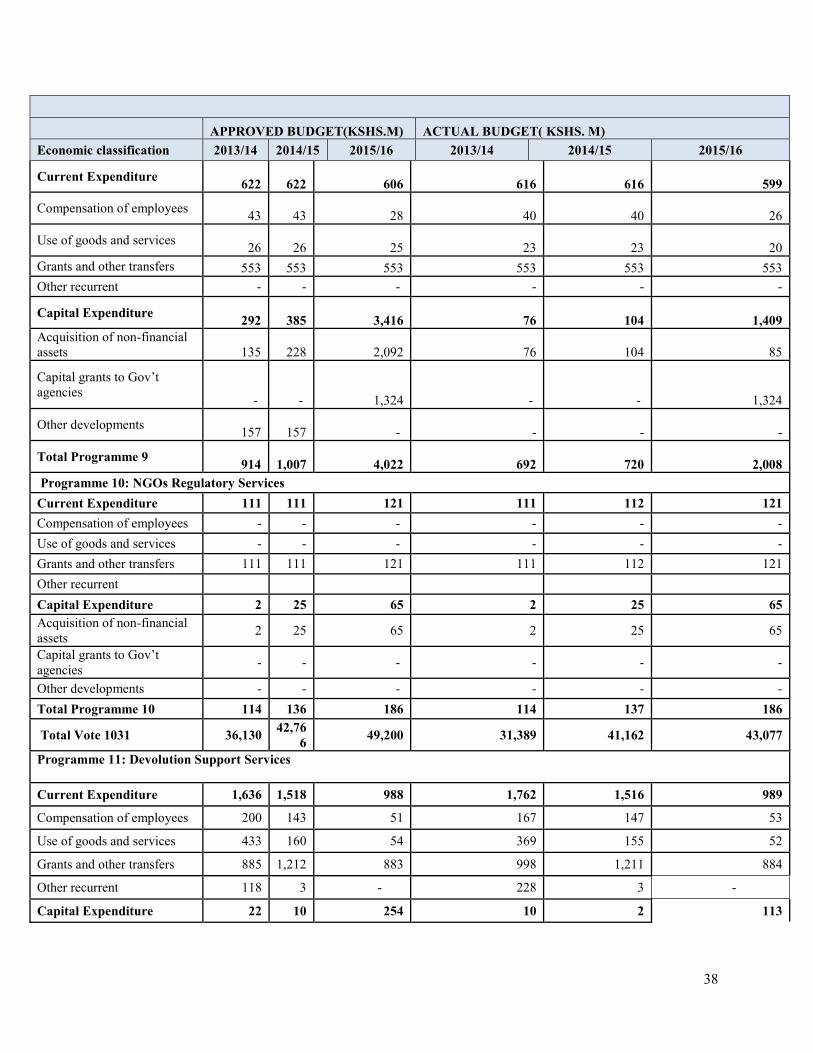
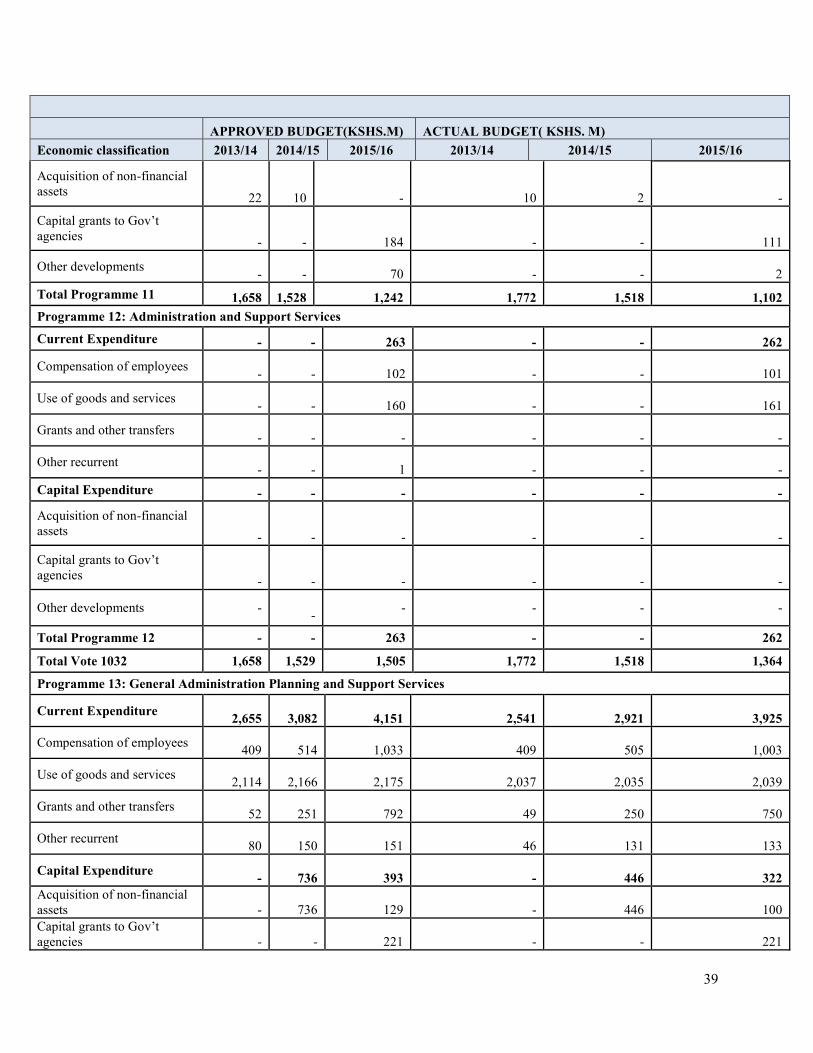
Table 2- 3: Programme Expenditure Analysis by Economic Classification
APPROVED BUDGET(KSHS.M) ACTUAL BUDGET( KSHS. M)Economic classification 2013/14 2014/15 2015/16 2013/14 2014/15 2015/16
Programme 1: State House Affairs
Current Expenditure 2,453 2,848 3,515 2,346 2,726 3,389
Compensation of employees 438 591 657.95 422 579 658
Use of goods and services 1,495 1,630 2,714.02 1,426 1,533 2627
Grants and other transfers - - - - - -
Other recurrent 520 627 143.51 498 614 103
Capital Expenditure 638 666 332.6 637 545 327
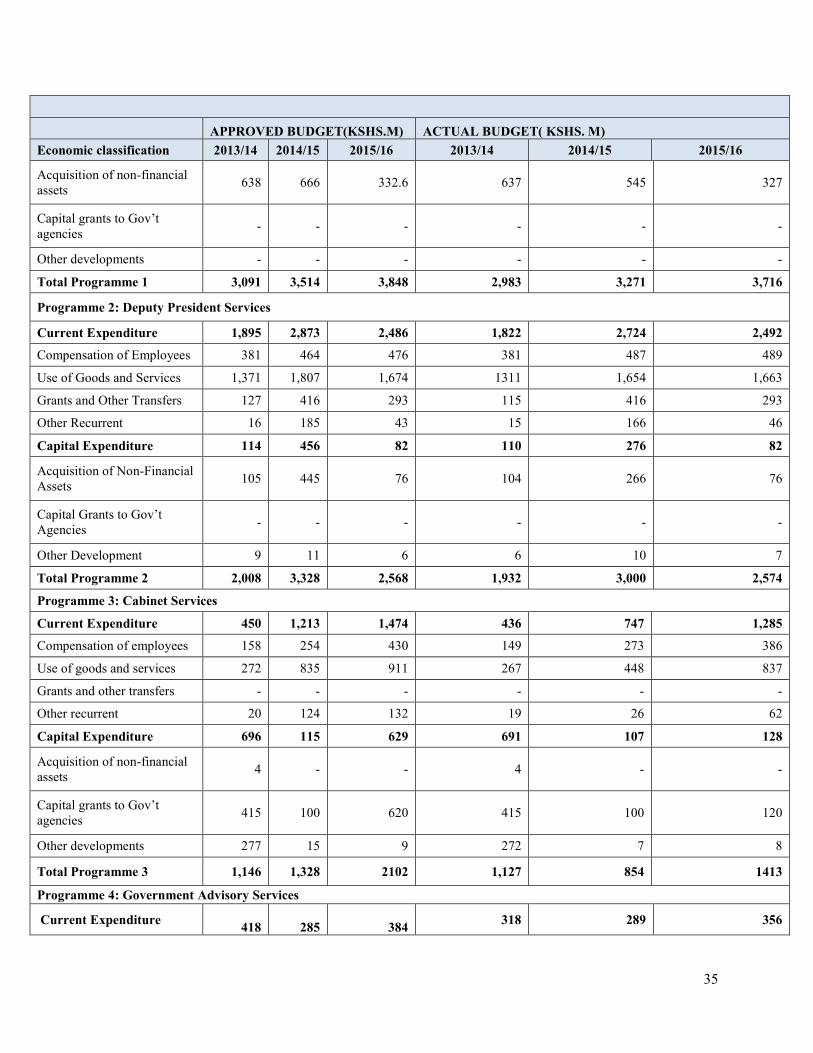
35
APPROVED BUDGET(KSHS.M) ACTUAL BUDGET( KSHS. M)Economic classification 2013/14 2014/15 2015/16 2013/14 2014/15 2015/16
Acquisition of non-financialassets 638 666 332.6 637 545 327
Capital grants to Gov’tagencies - - - - - -
Other developments - - - - - -
Total Programme 1 3,091 3,514 3,848 2,983 3,271 3,716
Programme 2: Deputy President Services
Current Expenditure 1,895 2,873 2,486 1,822 2,724 2,492
Compensation of Employees 381 464 476 381 487 489
Use of Goods and Services 1,371 1,807 1,674 1311 1,654 1,663
Grants and Other Transfers 127 416 293 115 416 293
Other Recurrent 16 185 43 15 166 46
Capital Expenditure 114 456 82 110 276 82
Acquisition of Non-FinancialAssets 105 445 76 104 266 76
Capital Grants to Gov’tAgencies - - - - - -
Other Development 9 11 6 6 10 7
Total Programme 2 2,008 3,328 2,568 1,932 3,000 2,574
Programme 3: Cabinet Services
Current Expenditure 450 1,213 1,474 436 747 1,285
Compensation of employees 158 254 430 149 273 386
Use of goods and services 272 835 911 267 448 837
Grants and other transfers - - - - - -
Other recurrent 20 124 132 19 26 62
Capital Expenditure 696 115 629 691 107 128
Acquisition of non-financialassets 4 - - 4 - -
Capital grants to Gov’tagencies 415 100 620 415 100 120
Other developments 277 15 9 272 7 8
Total Programme 3 1,146 1,328 2102 1,127 854 1413
Programme 4: Government Advisory Services
Current Expenditure 418 285 384 318 289 356
36
APPROVED BUDGET(KSHS.M) ACTUAL BUDGET( KSHS. M)Economic classification 2013/14 2014/15 2015/16 2013/14 2014/15 2015/16
Compensation of employees 22 12 19 18 51 17
Use of goods and services 48 49 87 47 41 71
Grants and other transfers 348 224 254 253 197 252
Other recurrent - - 24 - - 16
Capital Expenditure - - - - - -Acquisition of non-financial
assets - - - - - -
Capital grants to Gov’tagencies - - - - - -
Other developments - - - - - -
Total Programme 4 418 285 384 318 289 356
Total Vote 1011 6,663 8,455 8,902 6,361 7,414 8,059Programme 5: Economic Policy and National Planning
Current Expenditure 190 1,135 965 193 1,111 867
Compensation of employees 73 153 154 76 137 122
Use of goods and services 86 115 163 86 108 91
Grants and other transfers - 670 646 - 669 653
Other recurrent 31 197 2 31 197 1
Capital Expenditure 32,843 38,257 39,754 28,690 37,561 35,948
Acquisition of non-financialassets 905 822 792 203 625 118
Capital grants to Gov’tagencies 31,035 36,950 38,384 28,071 36,568 35,708
Other developments 903 486 578 416 368 122
Total Programme 5 33,033 39,393 40,719 28,883 38,672 36,815Programme 6: National Statistical Information Sciences
Current Expenditure 678 874 1,804 747 812 1,804Compensation of employees - - - - - -Use of goods and services - - - - - -
Grants and other transfers 678 874 1,804 747 812 1,804Other recurrent - - - - - -

37
APPROVED BUDGET(KSHS.M) ACTUAL BUDGET( KSHS. M)Economic classification 2013/14 2014/15 2015/16 2013/14 2014/15 2015/16
Capital Expenditure 336 108 1,483 139 35 1,439Acquisition of non-financialassets - - - - - -
Capital grants to Gov’tagencies 336 108 1,483 139 35 1,439Other developments - - - - - -
Total Programme 6 1,014 982 3,287 886 847 3,243Programme 7:National Intergrated Monitoring and Evaluation System(NIMES)
Current Expenditure 46 70 42 42 47 42
Compensation of employees 21 39 23 21 27 26
Use of goods and services 25 31 19 21 20 16
Grants and other transfers - - - - - -Other recurrent - - - - - -Capital Expenditure 411 200 162 232 131 103
Acquisition of non-financialassets 405 199 93 227 130 83
Capital grants to Gov’tagencies - - 68 - 19
Other developments 6 1 1 5 1 1
Total Programme 7 457 270 204 274 178 145Programme 8: General Administration and Support Services for Planning
Current Expenditure 583 834 657 527 466 560
Compensation of employees 155 158 209 145 139 180
Use of goods and services 156 432 414 143 287 346
Grants and other transfers 269 224 19 239 20 19
Other recurrent 3 20 15 20 15
Capital Expenditure 15 144 125 13 142 120
Acquisition of non-financialassets 15 34 25 13 32 20
Capital grants to Gov’tagencies - - - - - -
Other developments 110 100 - 110 100
Total Programme 8 598 978 782 540 608 680
Programme 9: Integrated Regional Development Planning
38
APPROVED BUDGET(KSHS.M) ACTUAL BUDGET( KSHS. M)Economic classification 2013/14 2014/15 2015/16 2013/14 2014/15 2015/16
Current Expenditure 622 622 606 616 616 599
Compensation of employees 43 43 28 40 40 26
Use of goods and services 26 26 25 23 23 20Grants and other transfers 553 553 553 553 553 553Other recurrent - - - - - -
Capital Expenditure 292 385 3,416 76 104 1,409Acquisition of non-financialassets 135 228 2,092 76 104 85
Capital grants to Gov’tagencies - - 1,324 - - 1,324
Other developments 157 157 - - - -
Total Programme 9 914 1,007 4,022 692 720 2,008Programme 10: NGOs Regulatory Services
Current Expenditure 111 111 121 111 112 121Compensation of employees - - - - - -Use of goods and services - - - - - -Grants and other transfers 111 111 121 111 112 121Other recurrentCapital Expenditure 2 25 65 2 25 65Acquisition of non-financialassets 2 25 65 2 25 65
Capital grants to Gov’tagencies - - - - - -
Other developments - - - - - -Total Programme 10 114 136 186 114 137 186
Total Vote 1031 36,130 42,766 49,200 31,389 41,162 43,077
Programme 11: Devolution Support Services
Current Expenditure 1,636 1,518 988 1,762 1,516 989
Compensation of employees 200 143 51 167 147 53
Use of goods and services 433 160 54 369 155 52
Grants and other transfers 885 1,212 883 998 1,211 884
Other recurrent 118 3 - 228 3 -
Capital Expenditure 22 10 254 10 2 113
39
APPROVED BUDGET(KSHS.M) ACTUAL BUDGET( KSHS. M)Economic classification 2013/14 2014/15 2015/16 2013/14 2014/15 2015/16
Acquisition of non-financialassets 22 10 - 10 2 -
Capital grants to Gov’tagencies - - 184 - - 111
Other developments - - 70 - - 2Total Programme 11 1,658 1,528 1,242 1,772 1,518 1,102Programme 12: Administration and Support Services
Current Expenditure - - 263 - - 262
Compensation of employees - - 102 - - 101
Use of goods and services - - 160 - - 161
Grants and other transfers - - - - - -
Other recurrent - - 1 - - -Capital Expenditure - - - - - -
Acquisition of non-financialassets - - - - - -
Capital grants to Gov’tagencies - - - - - -
Other developments - - - - - -
Total Programme 12 - - 263 - - 262
Total Vote 1032 1,658 1,529 1,505 1,772 1,518 1,364
Programme 13: General Administration Planning and Support Services
Current Expenditure 2,655 3,082 4,151 2,541 2,921 3,925
Compensation of employees 409 514 1,033 409 505 1,003
Use of goods and services 2,114 2,166 2,175 2,037 2,035 2,039
Grants and other transfers 52 251 792 49 250 750
Other recurrent 80 150 151 46 131 133
Capital Expenditure - 736 393 - 446 322Acquisition of non-financialassets - 736 129 - 446 100Capital grants to Gov’tagencies - - 221 - - 221
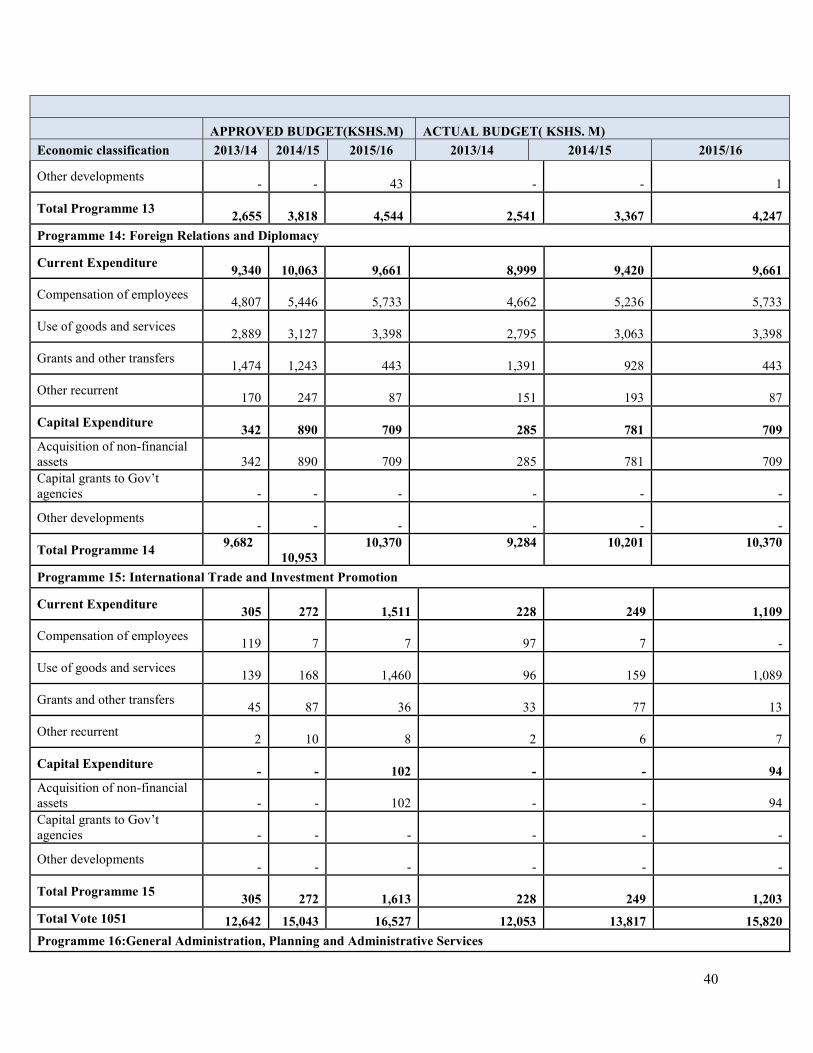
40
APPROVED BUDGET(KSHS.M) ACTUAL BUDGET( KSHS. M)Economic classification 2013/14 2014/15 2015/16 2013/14 2014/15 2015/16
Other developments - - 43 - - 1
Total Programme 13 2,655 3,818 4,544 2,541 3,367 4,247Programme 14: Foreign Relations and Diplomacy
Current Expenditure 9,340 10,063 9,661 8,999 9,420 9,661
Compensation of employees 4,807 5,446 5,733 4,662 5,236 5,733
Use of goods and services 2,889 3,127 3,398 2,795 3,063 3,398
Grants and other transfers 1,474 1,243 443 1,391 928 443
Other recurrent 170 247 87 151 193 87
Capital Expenditure 342 890 709 285 781 709Acquisition of non-financialassets 342 890 709 285 781 709Capital grants to Gov’tagencies - - - - - -
Other developments - - - - - -
Total Programme 14 9,68210,953
10,370 9,284 10,201 10,370
Programme 15: International Trade and Investment Promotion
Current Expenditure 305 272 1,511 228 249 1,109
Compensation of employees 119 7 7 97 7 -
Use of goods and services 139 168 1,460 96 159 1,089
Grants and other transfers 45 87 36 33 77 13
Other recurrent 2 10 8 2 6 7
Capital Expenditure - - 102 - - 94Acquisition of non-financialassets - - 102 - - 94Capital grants to Gov’tagencies - - - - - -
Other developments - - - - - -
Total Programme 15 305 272 1,613 228 249 1,203Total Vote 1051 12,642 15,043 16,527 12,053 13,817 15,820Programme 16:General Administration, Planning and Administrative Services
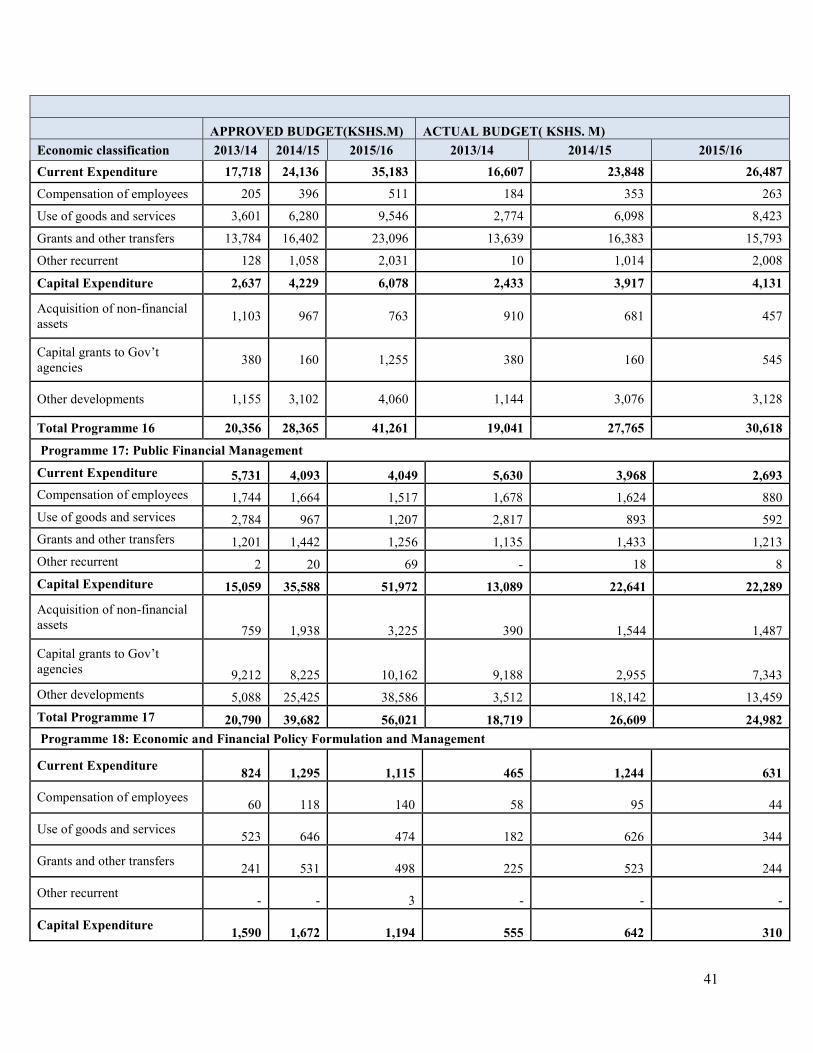
41
APPROVED BUDGET(KSHS.M) ACTUAL BUDGET( KSHS. M)Economic classification 2013/14 2014/15 2015/16 2013/14 2014/15 2015/16Current Expenditure 17,718 24,136 35,183 16,607 23,848 26,487Compensation of employees 205 396 511 184 353 263
Use of goods and services 3,601 6,280 9,546 2,774 6,098 8,423
Grants and other transfers 13,784 16,402 23,096 13,639 16,383 15,793
Other recurrent 128 1,058 2,031 10 1,014 2,008
Capital Expenditure 2,637 4,229 6,078 2,433 3,917 4,131
Acquisition of non-financialassets 1,103 967 763 910 681 457
Capital grants to Gov’tagencies 380 160 1,255 380 160 545
Other developments 1,155 3,102 4,060 1,144 3,076 3,128
Total Programme 16 20,356 28,365 41,261 19,041 27,765 30,618
Programme 17: Public Financial Management
Current Expenditure 5,731 4,093 4,049 5,630 3,968 2,693Compensation of employees 1,744 1,664 1,517 1,678 1,624 880Use of goods and services 2,784 967 1,207 2,817 893 592Grants and other transfers 1,201 1,442 1,256 1,135 1,433 1,213Other recurrent 2 20 69 - 18 8Capital Expenditure 15,059 35,588 51,972 13,089 22,641 22,289
Acquisition of non-financialassets 759 1,938 3,225 390 1,544 1,487
Capital grants to Gov’tagencies 9,212 8,225 10,162 9,188 2,955 7,343Other developments 5,088 25,425 38,586 3,512 18,142 13,459Total Programme 17 20,790 39,682 56,021 18,719 26,609 24,982Programme 18: Economic and Financial Policy Formulation and Management
Current Expenditure 824 1,295 1,115 465 1,244 631
Compensation of employees 60 118 140 58 95 44
Use of goods and services 523 646 474 182 626 344
Grants and other transfers 241 531 498 225 523 244
Other recurrent - - 3 - - -
Capital Expenditure 1,590 1,672 1,194 555 642 310

42
APPROVED BUDGET(KSHS.M) ACTUAL BUDGET( KSHS. M)Economic classification 2013/14 2014/15 2015/16 2013/14 2014/15 2015/16
Acquisition of non-financialassets - 179 70 - 82 1
Capital grants to Gov’tagencies 1,577 265 40 555 216 183
Other developments 13 1,228 1,084 - 344 126
Total Programme 18 2,414 2,967 2,308 1,020 1,886 941Programme 19: Market Competition and Creation an Enabling Business Environment
Current Expenditure 391 290 320 366 290 320Compensation of employees 6 - - - - -Use of goods and services - - - - - -Grants and other transfers 386 290 320 366 290 320Other recurrent - - - - -Capital Expenditure 24 - 55 - - 55
Acquisition of non-financialassets - - - - - -
Capital grants to Gov’tagencies 24 - 55 - - 55Other developments - - - - -Total Programme 19 415 290 375 366 290 375
Total Vote 1071 43,975 71,304 99,966 39,146 56,549 56,916Programme 20: Youth Empowerment
Current Expenditure 4,124 6,113 7,321 3,840 5,675 6,818Compensation of employees 1,342 1,449 1,341 1,174 1,437 1,432Use of goods and services 2,208 4,071 5,163 2,139 3,655 4,620Grants and other transfers 458 593 313 425 583 314Other recurrent 116 - 502 102 - 452Capital Expenditure 16,735 15,158 11,910 9,769 18,158 11,395
Acquisition of non-financialassets 8,407 100 6,129 1,828 1 6,109
Capital grants to Gov’tagencies 6,056 1,207 267 6,064 1,057 267Other developments 2,272 13,851 5,514 1,877 17,100 5,019Total Programme 20 20,858 21,270 19,231 13,609 23,833 18,213
Programme 21: Public Service Transformation
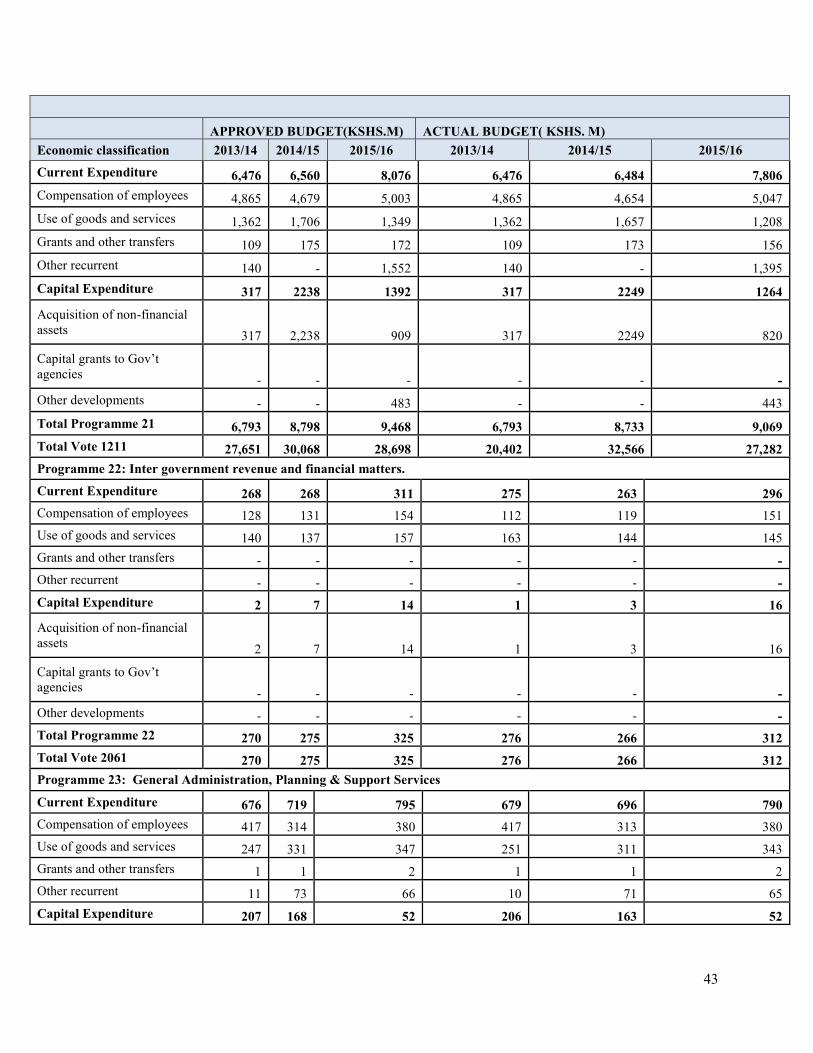
43
APPROVED BUDGET(KSHS.M) ACTUAL BUDGET( KSHS. M)Economic classification 2013/14 2014/15 2015/16 2013/14 2014/15 2015/16Current Expenditure 6,476 6,560 8,076 6,476 6,484 7,806Compensation of employees 4,865 4,679 5,003 4,865 4,654 5,047Use of goods and services 1,362 1,706 1,349 1,362 1,657 1,208Grants and other transfers 109 175 172 109 173 156Other recurrent 140 - 1,552 140 - 1,395Capital Expenditure 317 2238 1392 317 2249 1264
Acquisition of non-financialassets 317 2,238 909 317 2249 820
Capital grants to Gov’tagencies - - - - - -Other developments - - 483 - - 443Total Programme 21 6,793 8,798 9,468 6,793 8,733 9,069Total Vote 1211 27,651 30,068 28,698 20,402 32,566 27,282Programme 22: Inter government revenue and financial matters.
Current Expenditure 268 268 311 275 263 296Compensation of employees 128 131 154 112 119 151Use of goods and services 140 137 157 163 144 145Grants and other transfers - - - - - -Other recurrent - - - - - -Capital Expenditure 2 7 14 1 3 16
Acquisition of non-financialassets 2 7 14 1 3 16
Capital grants to Gov’tagencies - - - - - -Other developments - - - - - -Total Programme 22 270 275 325 276 266 312Total Vote 2061 270 275 325 276 266 312Programme 23: General Administration, Planning & Support Services
Current Expenditure 676 719 795 679 696 790Compensation of employees 417 314 380 417 313 380Use of goods and services 247 331 347 251 311 343Grants and other transfers 1 1 2 1 1 2Other recurrent 11 73 66 10 71 65Capital Expenditure 207 168 52 206 163 52
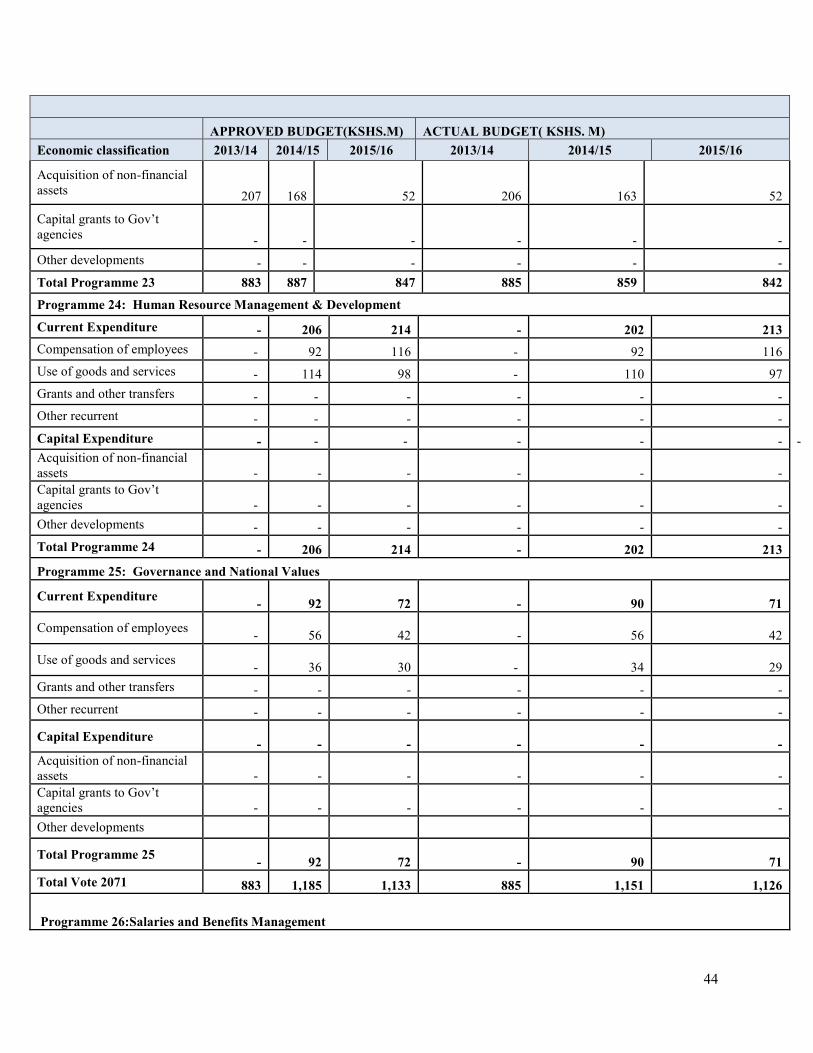
44
APPROVED BUDGET(KSHS.M) ACTUAL BUDGET( KSHS. M)Economic classification 2013/14 2014/15 2015/16 2013/14 2014/15 2015/16
Acquisition of non-financialassets 207 168 52 206 163 52
Capital grants to Gov’tagencies - - - - - -Other developments - - - - - -Total Programme 23 883 887 847 885 859 842
Programme 24: Human Resource Management & Development
Current Expenditure - 206 214 - 202 213Compensation of employees - 92 116 - 92 116Use of goods and services - 114 98 - 110 97Grants and other transfers - - - - - -Other recurrent - - - - - -Capital Expenditure - - - - - - -Acquisition of non-financialassets - - - - - -Capital grants to Gov’tagencies - - - - - -Other developments - - - - - -Total Programme 24 - 206 214 - 202 213Programme 25: Governance and National Values
Current Expenditure - 92 72 - 90 71
Compensation of employees - 56 42 - 56 42
Use of goods and services - 36 30 - 34 29Grants and other transfers - - - - - -Other recurrent - - - - - -
Capital Expenditure - - - - - -Acquisition of non-financialassets - - - - - -Capital grants to Gov’tagencies - - - - - -Other developments
Total Programme 25 - 92 72 - 90 71Total Vote 2071 883 1,185 1,133 885 1,151 1,126
Programme 26:Salaries and Benefits Management
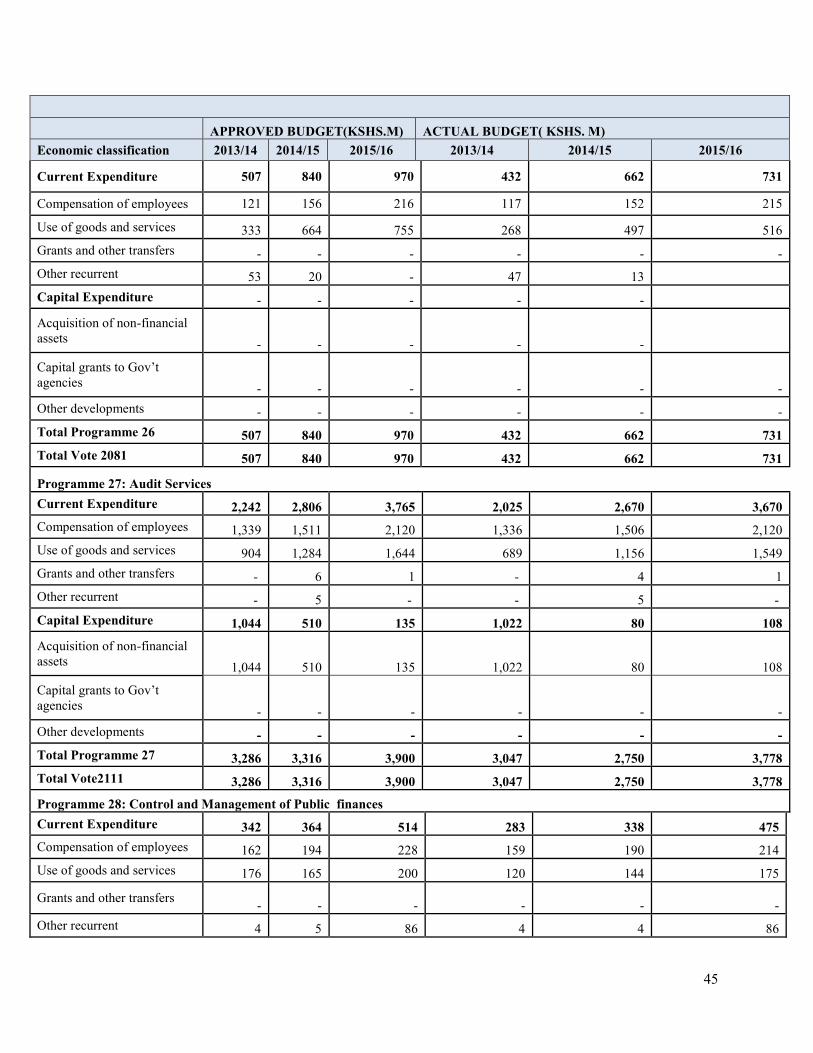
45
APPROVED BUDGET(KSHS.M) ACTUAL BUDGET( KSHS. M)Economic classification 2013/14 2014/15 2015/16 2013/14 2014/15 2015/16
Current Expenditure 507 840 970 432 662 731
Compensation of employees 121 156 216 117 152 215
Use of goods and services 333 664 755 268 497 516Grants and other transfers - - - - - -Other recurrent 53 20 - 47 13Capital Expenditure - - - - -
Acquisition of non-financialassets - - - - -
Capital grants to Gov’tagencies - - - - - -Other developments - - - - - -Total Programme 26 507 840 970 432 662 731Total Vote 2081 507 840 970 432 662 731
Programme 27: Audit ServicesCurrent Expenditure 2,242 2,806 3,765 2,025 2,670 3,670Compensation of employees 1,339 1,511 2,120 1,336 1,506 2,120Use of goods and services 904 1,284 1,644 689 1,156 1,549Grants and other transfers - 6 1 - 4 1Other recurrent - 5 - - 5 -Capital Expenditure 1,044 510 135 1,022 80 108
Acquisition of non-financialassets 1,044 510 135 1,022 80 108
Capital grants to Gov’tagencies - - - - - -Other developments - - - - - -Total Programme 27 3,286 3,316 3,900 3,047 2,750 3,778Total Vote2111 3,286 3,316 3,900 3,047 2,750 3,778
Programme 28: Control and Management of Public financesCurrent Expenditure 342 364 514 283 338 475Compensation of employees 162 194 228 159 190 214Use of goods and services 176 165 200 120 144 175
Grants and other transfers - - - - - -Other recurrent 4 5 86 4 4 86
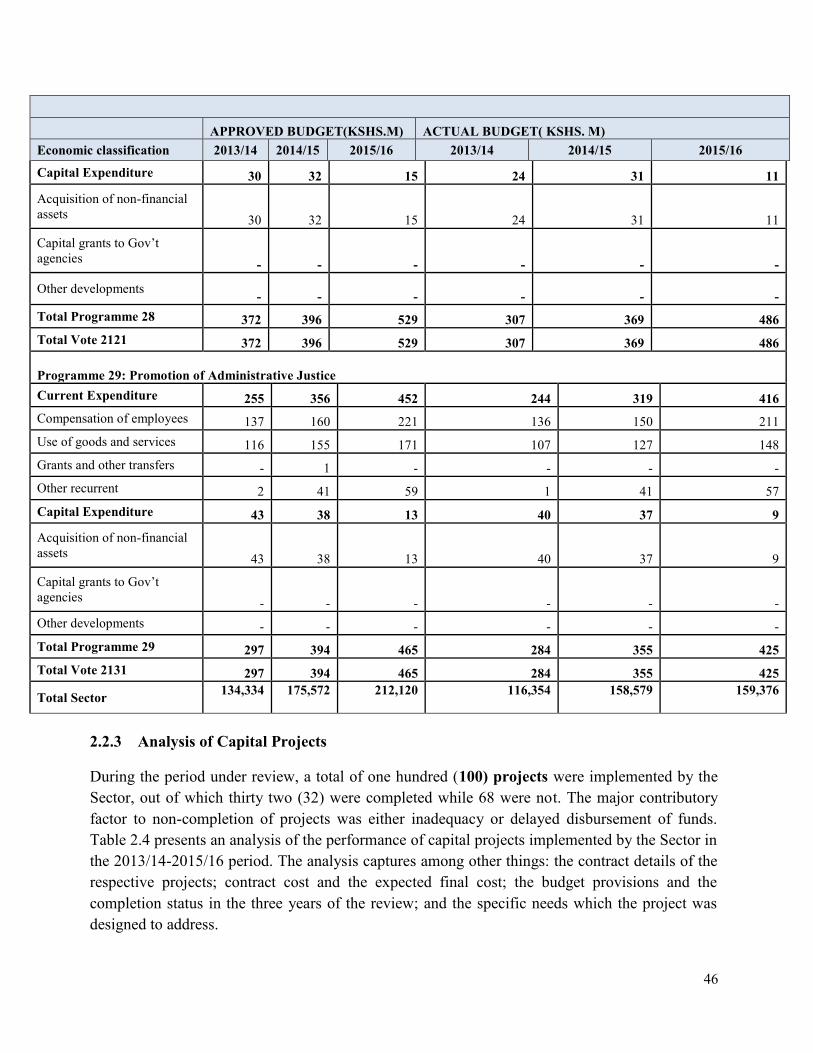
46
APPROVED BUDGET(KSHS.M) ACTUAL BUDGET( KSHS. M)Economic classification 2013/14 2014/15 2015/16 2013/14 2014/15 2015/16
Capital Expenditure 30 32 15 24 31 11
Acquisition of non-financialassets 30 32 15 24 31 11
Capital grants to Gov’tagencies - - - - - -
Other developments - - - - - -Total Programme 28 372 396 529 307 369 486Total Vote 2121 372 396 529 307 369 486
Programme 29: Promotion of Administrative JusticeCurrent Expenditure 255 356 452 244 319 416Compensation of employees 137 160 221 136 150 211Use of goods and services 116 155 171 107 127 148Grants and other transfers - 1 - - - -Other recurrent 2 41 59 1 41 57Capital Expenditure 43 38 13 40 37 9
Acquisition of non-financialassets 43 38 13 40 37 9
Capital grants to Gov’tagencies - - - - - -Other developments - - - - - -Total Programme 29 297 394 465 284 355 425Total Vote 2131 297 394 465 284 355 425
Total Sector 134,334 175,572 212,120 116,354 158,579 159,376
2.2.3 Analysis of Capital Projects
During the period under review, a total of one hundred (100) projects were implemented by theSector, out of which thirty two (32) were completed while 68 were not. The major contributoryfactor to non-completion of projects was either inadequacy or delayed disbursement of funds.Table 2.4 presents an analysis of the performance of capital projects implemented by the Sector inthe 2013/14-2015/16 period. The analysis captures among other things: the contract details of therespective projects; contract cost and the expected final cost; the budget provisions and thecompletion status in the three years of the review; and the specific needs which the project wasdesigned to address.
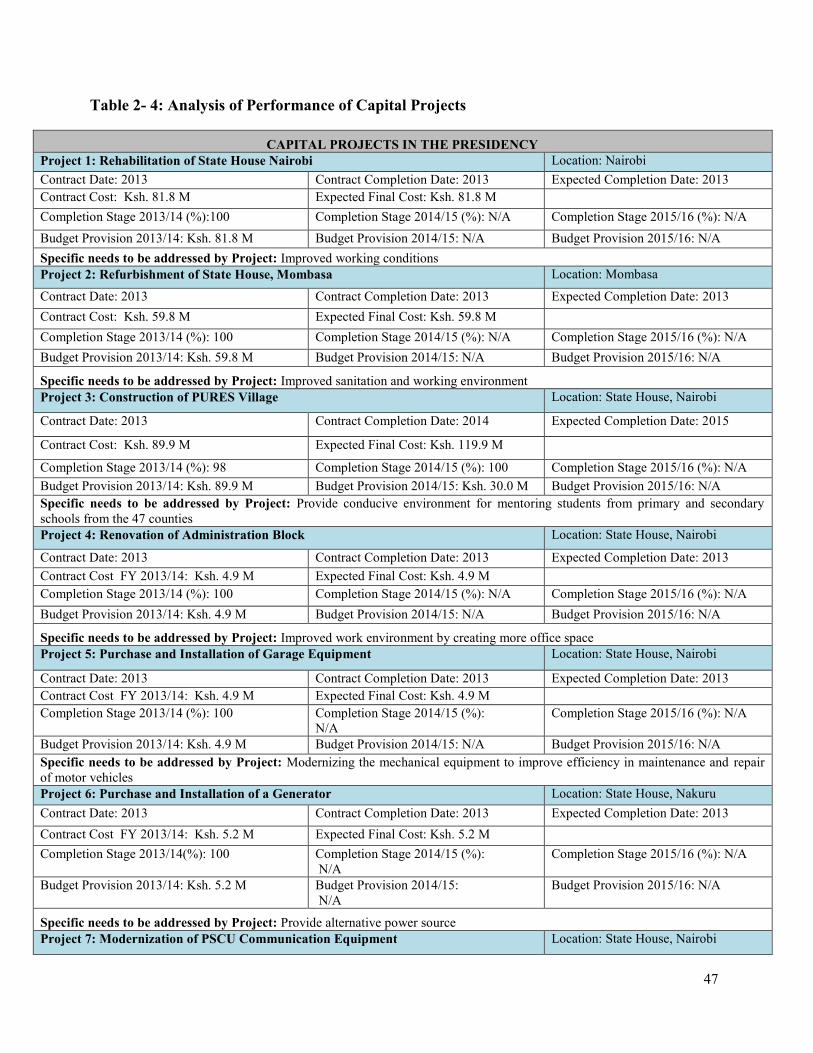
47
Table 2- 4: Analysis of Performance of Capital Projects
CAPITAL PROJECTS IN THE PRESIDENCYProject 1: Rehabilitation of State House Nairobi Location: NairobiContract Date: 2013 Contract Completion Date: 2013 Expected Completion Date: 2013Contract Cost: Ksh. 81.8 M Expected Final Cost: Ksh. 81.8 MCompletion Stage 2013/14 (%):100 Completion Stage 2014/15 (%): N/A Completion Stage 2015/16 (%): N/ABudget Provision 2013/14: Ksh. 81.8 M Budget Provision 2014/15: N/A Budget Provision 2015/16: N/ASpecific needs to be addressed by Project: Improved working conditionsProject 2: Refurbishment of State House, Mombasa Location: Mombasa
Contract Date: 2013 Contract Completion Date: 2013 Expected Completion Date: 2013Contract Cost: Ksh. 59.8 M Expected Final Cost: Ksh. 59.8 MCompletion Stage 2013/14 (%): 100 Completion Stage 2014/15 (%): N/A Completion Stage 2015/16 (%): N/ABudget Provision 2013/14: Ksh. 59.8 M Budget Provision 2014/15: N/A Budget Provision 2015/16: N/A
Specific needs to be addressed by Project: Improved sanitation and working environmentProject 3: Construction of PURES Village Location: State House, Nairobi
Contract Date: 2013 Contract Completion Date: 2014 Expected Completion Date: 2015
Contract Cost: Ksh. 89.9 M Expected Final Cost: Ksh. 119.9 M
Completion Stage 2013/14 (%): 98 Completion Stage 2014/15 (%): 100 Completion Stage 2015/16 (%): N/ABudget Provision 2013/14: Ksh. 89.9 M Budget Provision 2014/15: Ksh. 30.0 M Budget Provision 2015/16: N/ASpecific needs to be addressed by Project: Provide conducive environment for mentoring students from primary and secondaryschools from the 47 countiesProject 4: Renovation of Administration Block Location: State House, Nairobi
Contract Date: 2013 Contract Completion Date: 2013 Expected Completion Date: 2013Contract Cost FY 2013/14: Ksh. 4.9 M Expected Final Cost: Ksh. 4.9 MCompletion Stage 2013/14 (%): 100 Completion Stage 2014/15 (%): N/A Completion Stage 2015/16 (%): N/ABudget Provision 2013/14: Ksh. 4.9 M Budget Provision 2014/15: N/A Budget Provision 2015/16: N/A
Specific needs to be addressed by Project: Improved work environment by creating more office spaceProject 5: Purchase and Installation of Garage Equipment Location: State House, Nairobi
Contract Date: 2013 Contract Completion Date: 2013 Expected Completion Date: 2013Contract Cost FY 2013/14: Ksh. 4.9 M Expected Final Cost: Ksh. 4.9 MCompletion Stage 2013/14 (%): 100 Completion Stage 2014/15 (%):
N/ACompletion Stage 2015/16 (%): N/A
Budget Provision 2013/14: Ksh. 4.9 M Budget Provision 2014/15: N/A Budget Provision 2015/16: N/ASpecific needs to be addressed by Project: Modernizing the mechanical equipment to improve efficiency in maintenance and repairof motor vehiclesProject 6: Purchase and Installation of a Generator Location: State House, NakuruContract Date: 2013 Contract Completion Date: 2013 Expected Completion Date: 2013Contract Cost FY 2013/14: Ksh. 5.2 M Expected Final Cost: Ksh. 5.2 MCompletion Stage 2013/14(%): 100 Completion Stage 2014/15 (%):
N/ACompletion Stage 2015/16 (%): N/A
Budget Provision 2013/14: Ksh. 5.2 M Budget Provision 2014/15:N/A
Budget Provision 2015/16: N/A
Specific needs to be addressed by Project: Provide alternative power sourceProject 7: Modernization of PSCU Communication Equipment Location: State House, Nairobi
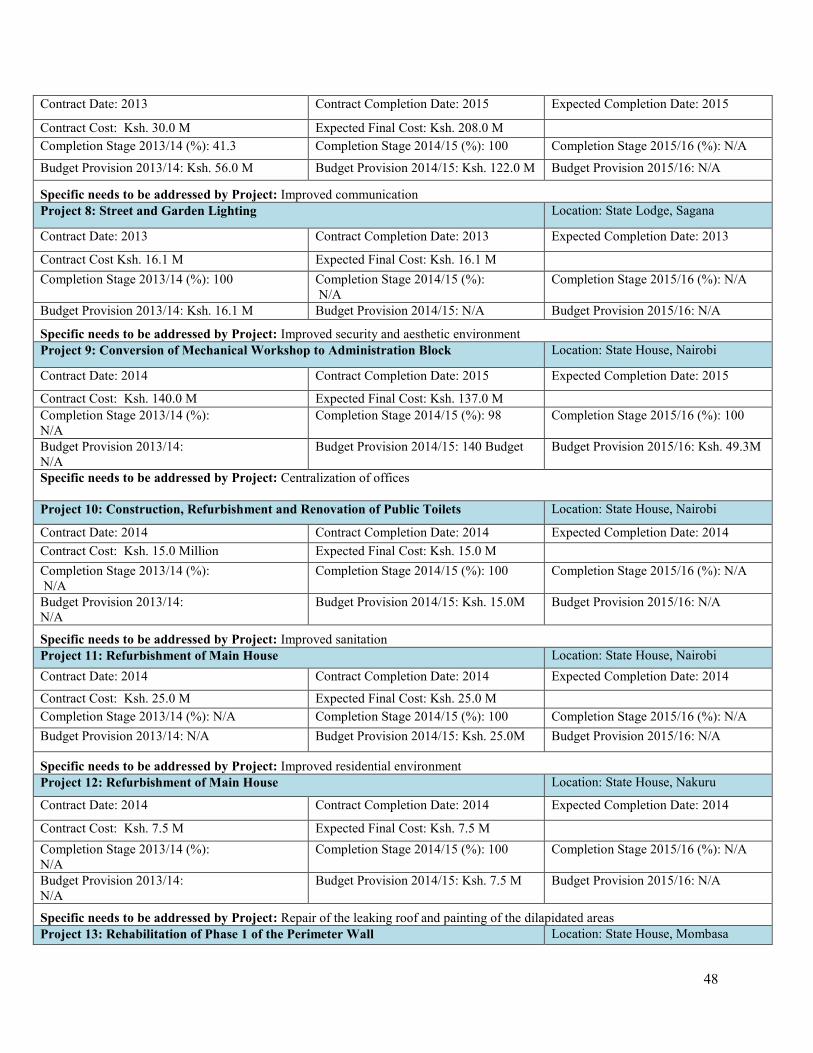
48
Contract Date: 2013 Contract Completion Date: 2015 Expected Completion Date: 2015
Contract Cost: Ksh. 30.0 M Expected Final Cost: Ksh. 208.0 MCompletion Stage 2013/14 (%): 41.3 Completion Stage 2014/15 (%): 100 Completion Stage 2015/16 (%): N/A
Budget Provision 2013/14: Ksh. 56.0 M Budget Provision 2014/15: Ksh. 122.0 M Budget Provision 2015/16: N/A
Specific needs to be addressed by Project: Improved communicationProject 8: Street and Garden Lighting Location: State Lodge, Sagana
Contract Date: 2013 Contract Completion Date: 2013 Expected Completion Date: 2013
Contract Cost Ksh. 16.1 M Expected Final Cost: Ksh. 16.1 MCompletion Stage 2013/14 (%): 100 Completion Stage 2014/15 (%):
N/ACompletion Stage 2015/16 (%): N/A
Budget Provision 2013/14: Ksh. 16.1 M Budget Provision 2014/15: N/A Budget Provision 2015/16: N/A
Specific needs to be addressed by Project: Improved security and aesthetic environmentProject 9: Conversion of Mechanical Workshop to Administration Block Location: State House, Nairobi
Contract Date: 2014 Contract Completion Date: 2015 Expected Completion Date: 2015
Contract Cost: Ksh. 140.0 M Expected Final Cost: Ksh. 137.0 MCompletion Stage 2013/14 (%):N/A
Completion Stage 2014/15 (%): 98 Completion Stage 2015/16 (%): 100
Budget Provision 2013/14:N/A
Budget Provision 2014/15: 140 Budget Budget Provision 2015/16: Ksh. 49.3M
Specific needs to be addressed by Project: Centralization of offices
Project 10: Construction, Refurbishment and Renovation of Public Toilets Location: State House, Nairobi
Contract Date: 2014 Contract Completion Date: 2014 Expected Completion Date: 2014Contract Cost: Ksh. 15.0 Million Expected Final Cost: Ksh. 15.0 MCompletion Stage 2013/14 (%):N/A
Completion Stage 2014/15 (%): 100 Completion Stage 2015/16 (%): N/A
Budget Provision 2013/14:N/A
Budget Provision 2014/15: Ksh. 15.0M Budget Provision 2015/16: N/A
Specific needs to be addressed by Project: Improved sanitationProject 11: Refurbishment of Main House Location: State House, NairobiContract Date: 2014 Contract Completion Date: 2014 Expected Completion Date: 2014
Contract Cost: Ksh. 25.0 M Expected Final Cost: Ksh. 25.0 MCompletion Stage 2013/14 (%): N/A Completion Stage 2014/15 (%): 100 Completion Stage 2015/16 (%): N/ABudget Provision 2013/14: N/A Budget Provision 2014/15: Ksh. 25.0M Budget Provision 2015/16: N/A
Specific needs to be addressed by Project: Improved residential environmentProject 12: Refurbishment of Main House Location: State House, Nakuru
Contract Date: 2014 Contract Completion Date: 2014 Expected Completion Date: 2014
Contract Cost: Ksh. 7.5 M Expected Final Cost: Ksh. 7.5 MCompletion Stage 2013/14 (%):N/A
Completion Stage 2014/15 (%): 100 Completion Stage 2015/16 (%): N/A
Budget Provision 2013/14:N/A
Budget Provision 2014/15: Ksh. 7.5 M Budget Provision 2015/16: N/A
Specific needs to be addressed by Project: Repair of the leaking roof and painting of the dilapidated areasProject 13: Rehabilitation of Phase 1 of the Perimeter Wall Location: State House, Mombasa

49
Contract Date: 2015 Contract Completion Date: 2015 Expected Completion Date: 2015
Contract Cost: Ksh. 20.0 M Expected Final Cost: Ksh. 20.0 MCompletion Stage 2013/14 (%):N/A
Completion Stage 2014/15 (%): 100 Completion Stage 2015/16 (%): N/A
Budget Provision 2013/14:N/A
Budget Provision 2014/15: Ksh. 20.0M Budget Provision 2015/16: N/A
Specific needs to be addressed by Project: Enhanced securityProject 14: Refurbishment of Building Location: State House, Mombasa
Contract Date: 2014 Contract Completion Date: 2014 Expected Completion Date: 2014
Contract Cost: Ksh. 5.0 M Expected Final Cost: Ksh. 5.0 MCompletion Stage 2013/14 (%): N/A Completion Stage 2014/15 (%): 100 Completion Stage 2015/16 (%): N/A
Budget Provision 2013/14: N/A Budget Provision 2014/15: Ksh. 5.0 M Budget Provision 2015/16: N/ASpecific needs to be addressed by Project: Improved residential environment
Project 15: Electrical Installation Location: State Lodge, KisumuContract Date: 2013 Contract Completion Date: 2014 Expected Completion Date: 2014Contract Cost: Ksh. 3.6 M Expected Final Cost: Ksh. 3.6 M
Completion Stage 2013/14 (%): 100 Completion Stage 2014/15 (%): N/A Completion Stage 2015/16 (%): N/A
Budget Provision 2013/14: Ksh. 3.6 M Budget Provision 2014/156: N/A Budget Provision 2015/16: N/ASpecific needs to be addressed by Project: Replacement of the defective electrical system
Project 16: Renovation of the Main House Location: State Lodge, KakamegaContract Date: 2014 Contract Completion Date: 2014 Expected Completion Date: 2014
Contract Cost : Ksh. 5.0 M Expected Final Cost: Ksh. 5.0 M
Completion Stage 2013/14 (%):N/A
Completion Stage 2014/15 (%): 100 Completion Stage 2015/16 (%): N/A
Budget Provision 2013/14:N/A
Budget Provision 2014/15: Ksh. 5.0 M Budget Provision 2015/16: N/A
Specific needs to be addressed by Project: Improved residential environment
Project 17: Refurbishment of Main House Location: State House, NairobiContract Date: 2015 Contract Completion Date: 2016 Expected Completion Date: 2016
Contract Cost: Ksh. 28.0 M Expected Final Cost: Ksh. 28.0 MCompletion Stage 2013/14 (%):N/A
Completion Stage 2014/15 (%):N/A
Completion Stage 2015/16 (%): 100
Budget Provision 2013/14: N/A Budget Provision 2014/15: N/A Budget Provision 2015/16: Ksh. 12.6MSpecific needs to be addressed by Project: Improved residential environment
Project 18: Refurbishment of Buildings at Mombasa State House Location: State House, Mombasa
Contract Date: 2015 Contract Completion Date: 2015 Expected Completion Date: 2015Contract Cost: Ksh. 5.2 M Expected Final Cost: Ksh. 5.2 M
Completion Stage 2013/14 (%):N/A
Completion Stage 2014/15 (%):N/A
Completion Stage 2015/16 (%): 100
Budget Provision 2013/14:N/A
Budget Provision 2014/15:N/A
Budget Provision 2015/16: Ksh. 5.2 M
Specific needs to be addressed by Project: Improved residential environment
Project 19: Refurbishment of Buildings Location: State House, Nakuru
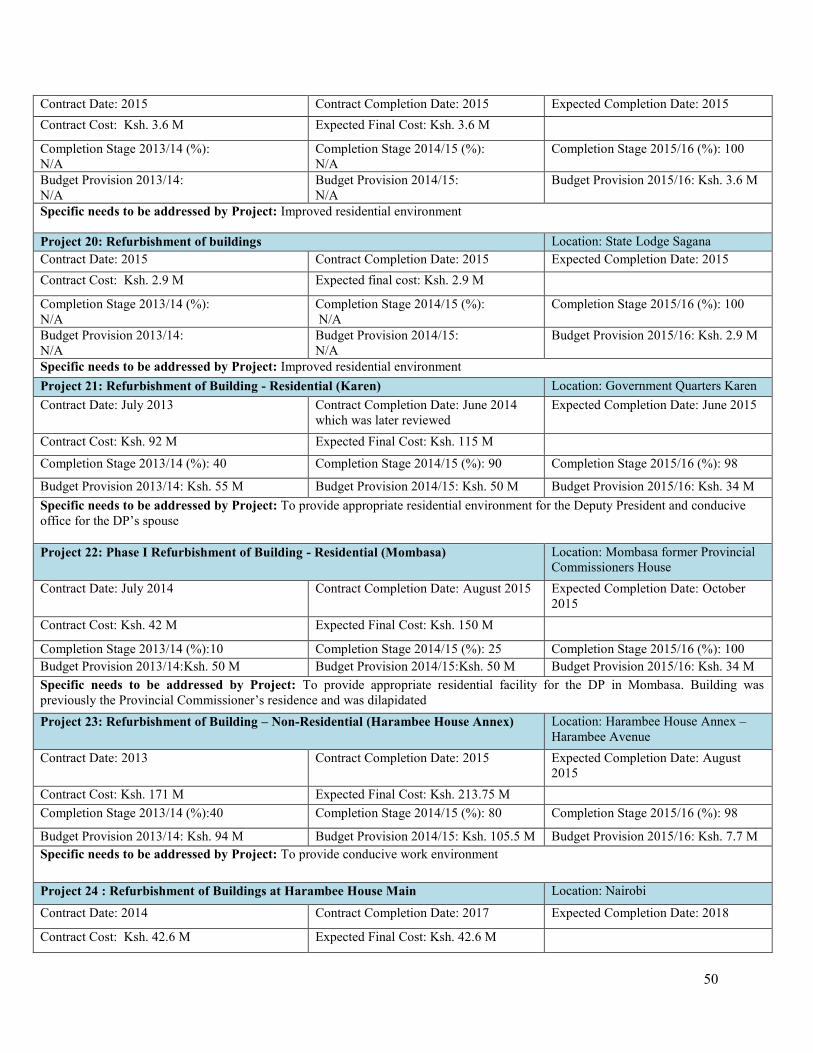
50
Contract Date: 2015 Contract Completion Date: 2015 Expected Completion Date: 2015Contract Cost: Ksh. 3.6 M Expected Final Cost: Ksh. 3.6 M
Completion Stage 2013/14 (%):N/A
Completion Stage 2014/15 (%):N/A
Completion Stage 2015/16 (%): 100
Budget Provision 2013/14:N/A
Budget Provision 2014/15:N/A
Budget Provision 2015/16: Ksh. 3.6 M
Specific needs to be addressed by Project: Improved residential environment
Project 20: Refurbishment of buildings Location: State Lodge SaganaContract Date: 2015 Contract Completion Date: 2015 Expected Completion Date: 2015Contract Cost: Ksh. 2.9 M Expected final cost: Ksh. 2.9 M
Completion Stage 2013/14 (%):N/A
Completion Stage 2014/15 (%):N/A
Completion Stage 2015/16 (%): 100
Budget Provision 2013/14:N/A
Budget Provision 2014/15:N/A
Budget Provision 2015/16: Ksh. 2.9 M
Specific needs to be addressed by Project: Improved residential environmentProject 21: Refurbishment of Building - Residential (Karen) Location: Government Quarters KarenContract Date: July 2013 Contract Completion Date: June 2014
which was later reviewedExpected Completion Date: June 2015
Contract Cost: Ksh. 92 M Expected Final Cost: Ksh. 115 M
Completion Stage 2013/14 (%): 40 Completion Stage 2014/15 (%): 90 Completion Stage 2015/16 (%): 98
Budget Provision 2013/14: Ksh. 55 M Budget Provision 2014/15: Ksh. 50 M Budget Provision 2015/16: Ksh. 34 MSpecific needs to be addressed by Project: To provide appropriate residential environment for the Deputy President and conduciveoffice for the DP’s spouse
Project 22: Phase I Refurbishment of Building - Residential (Mombasa) Location: Mombasa former ProvincialCommissioners House
Contract Date: July 2014 Contract Completion Date: August 2015 Expected Completion Date: October2015
Contract Cost: Ksh. 42 M Expected Final Cost: Ksh. 150 M
Completion Stage 2013/14 (%):10 Completion Stage 2014/15 (%): 25 Completion Stage 2015/16 (%): 100Budget Provision 2013/14:Ksh. 50 M Budget Provision 2014/15:Ksh. 50 M Budget Provision 2015/16: Ksh. 34 MSpecific needs to be addressed by Project: To provide appropriate residential facility for the DP in Mombasa. Building waspreviously the Provincial Commissioner’s residence and was dilapidatedProject 23: Refurbishment of Building – Non-Residential (Harambee House Annex) Location: Harambee House Annex –
Harambee AvenueContract Date: 2013 Contract Completion Date: 2015 Expected Completion Date: August
2015Contract Cost: Ksh. 171 M Expected Final Cost: Ksh. 213.75 MCompletion Stage 2013/14 (%):40 Completion Stage 2014/15 (%): 80 Completion Stage 2015/16 (%): 98
Budget Provision 2013/14: Ksh. 94 M Budget Provision 2014/15: Ksh. 105.5 M Budget Provision 2015/16: Ksh. 7.7 MSpecific needs to be addressed by Project: To provide conducive work environment
Project 24 : Refurbishment of Buildings at Harambee House Main Location: Nairobi
Contract Date: 2014 Contract Completion Date: 2017 Expected Completion Date: 2018
Contract Cost: Ksh. 42.6 M Expected Final Cost: Ksh. 42.6 M
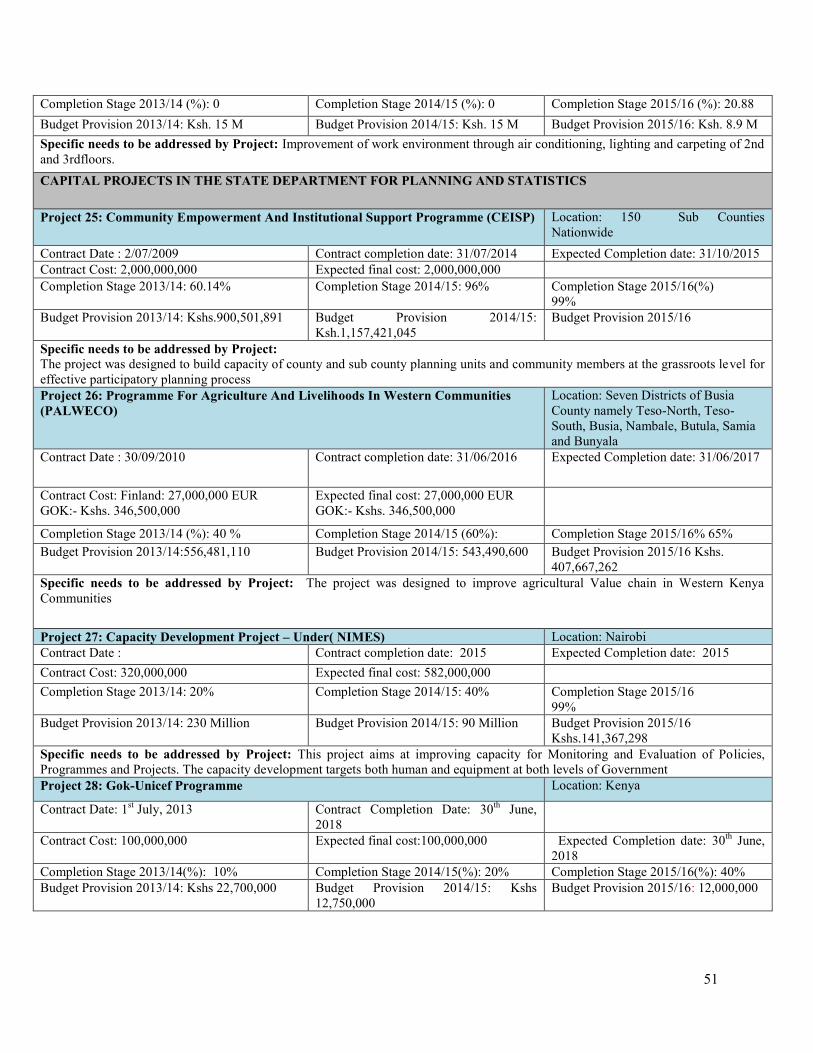
51
Completion Stage 2013/14 (%): 0 Completion Stage 2014/15 (%): 0 Completion Stage 2015/16 (%): 20.88Budget Provision 2013/14: Ksh. 15 M Budget Provision 2014/15: Ksh. 15 M Budget Provision 2015/16: Ksh. 8.9 MSpecific needs to be addressed by Project: Improvement of work environment through air conditioning, lighting and carpeting of 2ndand 3rdfloors.CAPITAL PROJECTS IN THE STATE DEPARTMENT FOR PLANNING AND STATISTICS
Project 25: Community Empowerment And Institutional Support Programme (CEISP) Location: 150 Sub CountiesNationwide
Contract Date : 2/07/2009 Contract completion date: 31/07/2014 Expected Completion date: 31/10/2015Contract Cost: 2,000,000,000 Expected final cost: 2,000,000,000Completion Stage 2013/14: 60.14% Completion Stage 2014/15: 96% Completion Stage 2015/16(%)
99%Budget Provision 2013/14: Kshs.900,501,891 Budget Provision 2014/15:
Ksh.1,157,421,045Budget Provision 2015/16
Specific needs to be addressed by Project:The project was designed to build capacity of county and sub county planning units and community members at the grassroots level foreffective participatory planning processProject 26: Programme For Agriculture And Livelihoods In Western Communities(PALWECO)
Location: Seven Districts of BusiaCounty namely Teso-North, Teso-South, Busia, Nambale, Butula, Samiaand Bunyala
Contract Date : 30/09/2010 Contract completion date: 31/06/2016 Expected Completion date: 31/06/2017
Contract Cost: Finland: 27,000,000 EURGOK:- Kshs. 346,500,000
Expected final cost: 27,000,000 EURGOK:- Kshs. 346,500,000
Completion Stage 2013/14 (%): 40 % Completion Stage 2014/15 (60%): Completion Stage 2015/16% 65%Budget Provision 2013/14:556,481,110 Budget Provision 2014/15: 543,490,600 Budget Provision 2015/16 Kshs.
407,667,262Specific needs to be addressed by Project: The project was designed to improve agricultural Value chain in Western KenyaCommunities
Project 27: Capacity Development Project – Under( NIMES) Location: NairobiContract Date : Contract completion date: 2015 Expected Completion date: 2015Contract Cost: 320,000,000 Expected final cost: 582,000,000Completion Stage 2013/14: 20% Completion Stage 2014/15: 40% Completion Stage 2015/16
99%Budget Provision 2013/14: 230 Million Budget Provision 2014/15: 90 Million Budget Provision 2015/16
Kshs.141,367,298Specific needs to be addressed by Project: This project aims at improving capacity for Monitoring and Evaluation of Policies,Programmes and Projects. The capacity development targets both human and equipment at both levels of GovernmentProject 28: Gok-Unicef Programme Location: Kenya
Contract Date: 1st July, 2013 Contract Completion Date: 30th June,2018
Contract Cost: 100,000,000 Expected final cost:100,000,000 Expected Completion date: 30th June,2018
Completion Stage 2013/14(%): 10% Completion Stage 2014/15(%): 20% Completion Stage 2015/16(%): 40%Budget Provision 2013/14: Kshs 22,700,000 Budget Provision 2014/15: Kshs
12,750,000Budget Provision 2015/16: 12,000,000

52
Specific needs to be addressed by Project:The projects promotes social accountability in public finance reporting at devolved levelsof governance
Project 29: Economic Empowerment Programme Location: KenyaContract Date: 1st March, 2013 Contract Completion Date: 30th June,
2018Expected Completion date:30th June,2018
Contract Cost: Kshs 160,950,000 Expected final cost:Kshs 160,950,000Completion Stage 2013/14(%): 20% Completion Stage 2014/15(%): 40% Completion Stage 2015/16 (%): 60%Budget Provision 2013/14: Kshs 59,885,000 Budget Provision 2014/15: Kshs
40,050,000Budget Provision 2015/16: Kshs
Specific needs to be addressed by Project: The major objective of the programme is to enhance and mainstream inclusiveness of thepoor and vulnerable in the institutional and policy frameworks and private sector participation in job-rich and pro-poor growth; andempower the poor and vulnerable (in particular, women and youth) as economic agents.
Project 30 : High Grand Falls Multi- Purpose Dam Project Location: Tharaka Nithi, Kitui andEmbu Counties
Contract Date:1st July 2011
Contract Completion Date:30th June 2020
Expected Completion Date:30th June 2020
Contract Cost:USD 1,689 Million.
Expected Final Cost:USD 1,689 Million.
Completion Stage 2013/14 (%):5%
Completion stage 2014/15 (%):5%
Completion Stage 2015/16 (%): 5%
Budget Provision 2013/14:1 Million
Budget Provision 2014/15:4 million
Budget Provision 2015/16:5million
Specific needs to be addressed by Project:The Project is geared towards improving economic development in the Country as a wholeby producing 700 MW of hydro energy power to the national grid, provide water for irrigation (180,000 ha) and to enhance foodsecurityProject 31: Tana Delta Irrigation Project (Tdip Polder 1 Rice). Location: Tana River CountyContract Date:1st July 2009
Contract Completion Date:30th June 2017
Expected Completion Date:30th June 2017
Contract Cost:KES 2,303,195,900
Expected Final Cost:KES 2,303,195,900
Completion Stage 2013/14 (%):31%
Completion stage 2014/15 (%):33%
Completion Stage 2015/16 (%): 37%
Budget Provision 2013/14:28,500,000
Budget Provision 2014/15:45,000,000
Budget Provision 2015/16:20,000,000
Specific needs to be addressed by Project:The overall goal of the project is centred on achieving food security through sustainableintegrated agribusiness development and management of the Tana Delta area and employment creation.Project 32: Munyu Multi- Purpose Dam Project Location: Thika, Machakos and
Makueni countiesContract Date:1st July 2008
Contract Completion Date:30th June 2019
Expected Completion Date:30th June 2020
Contract Cost:1,000,100,000
Expected Final Cost:23,183,823,000
Completion Stage 2013/14 (%):NIL
Completion stage 2014/15 (%):NIL
Completion Stage 2015/16 (%): 5%
Budget Provision 2013/14:NIL
Budget Provision 2014/15:10,000,000
Budget Provision 2015/16:10,000,000
Specific needs to be addressed by Project:The Project is geared towards spurring economic development in the Country as a wholethrough storage and provision of water for irrigation (20,000 ha) and to enhance food security and production of about 100 MW ofhydro energy power to the national grid

53
Project 33: Integrated Regional Development Master Plan Location: TARDA’s 17 CountiesContract Date:1st July 2013
Contract Completion Date:30th June 2019
Expected Completion Date:30th June 2020
Contract Cost:80,000,000
Expected Final Cost:1,000,100,000
Completion Stage 2013/14 (%):NIL
Completion stage 2014/15 (%):1%
Completion Stage 2015/16 (%): 20%
Budget Provision 2013/14:NIL
Budget Provision 2014/15:10,000,000
Budget Provision 2015/16:4,500,000
Specific needs to be addressed by Project:The Overall Goal is to create a data base and resource maps for the natural resources withinthe TARDA region to guide forward planning and investment opportunities for the counties in the region hence achieve the Vision2030 goals.Project 34: Masinga Eco-Tourism Development Location: Machakos CountyContract Date:1st July 1981
Contract Completion Date:30th June 2018
Expected Completion Date:30th June 2018
Contract Cost:260,000,000
Expected Final Cost:2,000,000,000
Completion Stage 2013/14 (%):12%
Completion stage 2014/15 (%):13%
Completion Stage 2015/16 (%): 15%
Budget Provision 2012/13:12,000.000
Budget Provision 2013/14:23,000,000
Budget Provision 2015/16:18,00,000
Specific needs to be addressed by Project: The overall objective of this programme is to promote eco tourism in the eastern circuitregion , job creation and earn revenues for the AuthorityProject 35: Murang’a Food Security Program Location: Murang’a CountyContract Date:1st July 2013
Contract Completion Date:30th June 2017
Expected Completion Date:30th June 2017
Contract Cost:900,000,000
Expected Final Cost:900,,000,000
Completion Stage 2013/14 (%):10%
Completion stage 2014/15 (%):11%
Completion Stage 2015/16 (%): 16%
Budget Provision 2013/14:5,000,000
Budget Provision 2014/15:17,000,000
Budget Provision 2015/16:33,000,000
Specific needs to be addressed by Project:The Project is geared towards bringing about socio-economic development in Murang’aCounty and the country as a whole by developing infrastructure to irrigate 5,000 hectares and catchment management. These willreduce poverty through job creation and enhance food security status of the communitiesProject 36: Kieni Integrated Program Location: Nyeri CountyContract Date:1st July 2013
Contract Completion Date:30th June 2017
Expected Completion Date:30th June 2017
Contract Cost:2,000,000,000
Expected Final Cost:2,000,000,000
Completion Stage 2013/14 (%):%
Completion stage 2014/15 (%):5%
Completion Stage 2015/16 (%):10%
Budget Provision 2013/14: Budget Provision 2014/15: Budget Provision 2015/16:5,000,000
Specific needs to be addressed by Project:The Project is geared towards improving economic development in the Country as a wholeby developing 3,000 hectares for irrigation, catchment management and creation of job opportunities. These will reduce poverty andaddress food security.Project 37: Magwagwa Multipurpose Dam Development Project Location:Bomet, Kericho, Nyamira,
Homabay And Kisumu CountiesContract date: July 2014 Contract completion date: July 2024 Expected completion date: July 2024Contract cost:Ksh. 86.8 billion
Expected final cost:Ksh. 86,813,624,000
Completion stage 2013/2014 (%): 0.001% Completion stage 2014/2015 (%): Completion stage 2015/2016 (%):
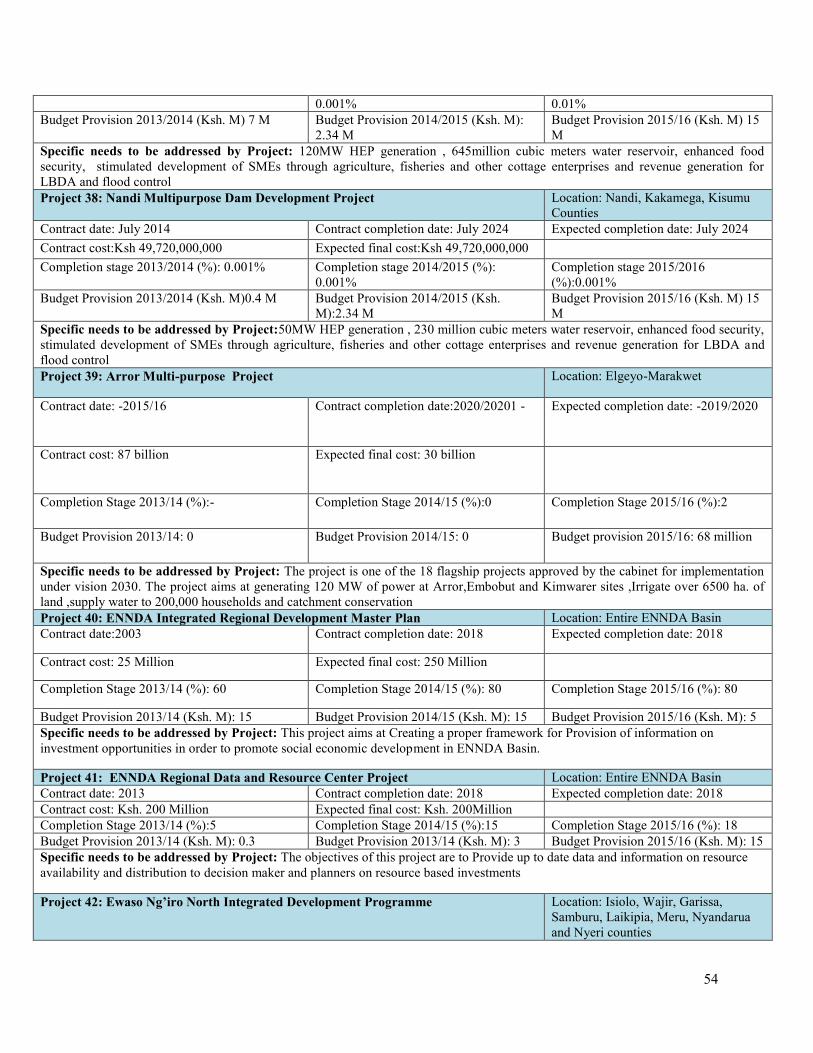
54
0.001% 0.01%Budget Provision 2013/2014 (Ksh. M) 7 M Budget Provision 2014/2015 (Ksh. M):
2.34 MBudget Provision 2015/16 (Ksh. M) 15M
Specific needs to be addressed by Project: 120MW HEP generation , 645million cubic meters water reservoir, enhanced foodsecurity, stimulated development of SMEs through agriculture, fisheries and other cottage enterprises and revenue generation forLBDA and flood controlProject 38: Nandi Multipurpose Dam Development Project Location: Nandi, Kakamega, Kisumu
CountiesContract date: July 2014 Contract completion date: July 2024 Expected completion date: July 2024Contract cost:Ksh 49,720,000,000 Expected final cost:Ksh 49,720,000,000Completion stage 2013/2014 (%): 0.001% Completion stage 2014/2015 (%):
0.001%Completion stage 2015/2016(%):0.001%
Budget Provision 2013/2014 (Ksh. M)0.4 M Budget Provision 2014/2015 (Ksh.M):2.34 M
Budget Provision 2015/16 (Ksh. M) 15M
Specific needs to be addressed by Project:50MW HEP generation , 230 million cubic meters water reservoir, enhanced food security,stimulated development of SMEs through agriculture, fisheries and other cottage enterprises and revenue generation for LBDA andflood controlProject 39: Arror Multi-purpose Project Location: Elgeyo-Marakwet
Contract date: -2015/16 Contract completion date:2020/20201 - Expected completion date: -2019/2020
Contract cost: 87 billion Expected final cost: 30 billion
Completion Stage 2013/14 (%):- Completion Stage 2014/15 (%):0 Completion Stage 2015/16 (%):2
Budget Provision 2013/14: 0 Budget Provision 2014/15: 0 Budget provision 2015/16: 68 million
Specific needs to be addressed by Project: The project is one of the 18 flagship projects approved by the cabinet for implementationunder vision 2030. The project aims at generating 120 MW of power at Arror,Embobut and Kimwarer sites ,Irrigate over 6500 ha. ofland ,supply water to 200,000 households and catchment conservationProject 40: ENNDA Integrated Regional Development Master Plan Location: Entire ENNDA BasinContract date:2003 Contract completion date: 2018 Expected completion date: 2018
Contract cost: 25 Million Expected final cost: 250 Million
Completion Stage 2013/14 (%): 60 Completion Stage 2014/15 (%): 80 Completion Stage 2015/16 (%): 80
Budget Provision 2013/14 (Ksh. M): 15 Budget Provision 2014/15 (Ksh. M): 15 Budget Provision 2015/16 (Ksh. M): 5Specific needs to be addressed by Project: This project aims at Creating a proper framework for Provision of information oninvestment opportunities in order to promote social economic development in ENNDA Basin.
Project 41: ENNDA Regional Data and Resource Center Project Location: Entire ENNDA BasinContract date: 2013 Contract completion date: 2018 Expected completion date: 2018Contract cost: Ksh. 200 Million Expected final cost: Ksh. 200MillionCompletion Stage 2013/14 (%):5 Completion Stage 2014/15 (%):15 Completion Stage 2015/16 (%): 18Budget Provision 2013/14 (Ksh. M): 0.3 Budget Provision 2013/14 (Ksh. M): 3 Budget Provision 2015/16 (Ksh. M): 15Specific needs to be addressed by Project: The objectives of this project are to Provide up to date data and information on resourceavailability and distribution to decision maker and planners on resource based investments
Project 42: Ewaso Ng’iro North Integrated Development Programme Location: Isiolo, Wajir, Garissa,Samburu, Laikipia, Meru, Nyandaruaand Nyeri counties

55
Contract date: 2007 Contract completion date: 2030 Expected completion date: 2030Contract cost: Ksh. 85 Billion Expected final cost: Ksh. 85 BillionCompletion Stage 2013/14 (%): 5 Completion Stage 2014/15 (%): 7 Completion Stage 2015/16 (%): 7
Budget Provision 2013/14 (Ksh. M): 50 Budget Provision 2014/15 (Ksh. M): 25 Budget Provision 2015/16 (Ksh. M): 2Specific needs to be addressed by Project: The project seeks to build a multipurpose dam to regulate the Ewaso Ng’iro North Riverand control the flooding downstream, promote the achievement of the Kenya Vision 2030, throughprovision of water to Isiolo resortcity, generation of 40mw of electricity for the national grid, promoting food security through irrigation of 16,000 acres downstream ofEwaso Ng’iro North River multipurpose dam.Project 43: Chalbi Desert Integrated Development Programme Location: Marsabit, Wajir and ManderaContract date: 2007 Contract completion date: 2030 Expected completion date: 2030Contract cost: Ksh. 65 Billion Expected final cost: Ksh. 65 BillionCompletion Stage 2013/14 (%):5 Completion Stage 2014/15 (%):5 Completion Stage 2015/16 (%): 6Budget Provision 2013/14 (Ksh. M): 1 Budget Provision 2014/15 (Ksh. M): 10 Budget Provision 2015/16 (Ksh. M): 15Specific needs to be addressed by Project: This project aims at promoting Kenya Vision 2030 by provision of 300mw of green andrenewable energy and put Kenya in the league of carbon credit traders as well as opens up the region to investments which will createemployment and ensure poverty reduction.Project 44: Ewaso Ng’iro North Catchment and Riparian Conservation andRehabilitation Programme
Location: Entire ENNDA Basin
Contract date: 2013 Contract completion date: 2020 Expected completion date: 2020
Contract cost: Ksh. 1.5 Billion Expected final cost: Ksh. 1.5 BillionCompletion Stage 2013/14 (%): 10 Completion Stage 2014/15 (%): 15 Completion Stage 2015/16 (%): 20Budget Provision 2013/14 (Ksh. M): 20 Budget Provision 2014/15 (Ksh. M): 30 Budget Provision 2015/16 (Ksh. M): 30Specific needs to be addressed by Project: The aim of the project is to Improve water resources management, through Rehabilitationof degraded forest and riparian within Ewaso Ng’iro North River (ENNR) catchmentProject 45: Gum Arabic and Resins Integrated Development Proramme Location: Marsabit, Isiolo, Wajir,
Garissa, Mandera, Samburu and Merucounties
Contract date: 2011 Contract completion date: 2017 Expected completion date: 2017Contract cost: Ksh. 250 Million Expected final cost: Ksh. 250 MillionCompletion Stage 2012/13 (%): 40 Completion Stage 2013/14 (%): 55 Completion Stage 2015/16 (%): 60Budget Provision 2012/13 (Ksh. M): 15 Budget Provision 2013/14 (Ksh. M): 15 Budget Provision 2015/16 (Ksh. M):5
Specific needs to be addressed by Project: The project aims at eradicating poverty and reducing resource based conflict in the regionthrough provision of alternative sources of incomes and mitigate against the effects of climate change to communities whose livestockhave been ravaged by frequent and more severe droughtProject 46: ENNDA Integrated Camel Development Programme Location: Marsabit, Isiolo, Wajir,
Garissa, Mandera, Samburu andLaikipia counties
Contract date:2010 Contract completion date: 2025 Expected completion date: 2025Contract cost: Ksh. 200 Million Expected final cost: Ksh. 200 MillionCompletion Stage 2013/14 (%): 10 Completion Stage 2014/15 (%): 20 Completion Stage 2015/16 (%): 22Budget Provision 2013/14 (Ksh. M): 10 Budget Provision 2014/15 (%): 15 Budget Provision 2015/16 (Ksh. M):10Specific needs to be addressed by Project: This project aim at improving food security and livelihood of local communities byHarnessing the abundant but unexploited camel milk product through market provision and value addition of the camel milk
Project 47: ENNDA Northern Kenya Integrated Central Abattoir Location: Wajir, Marsabit, ManderaGarissa, Samburu, Laikipia and Merucounties
Contract date: 2012 Contract completion date: 2020 Expected completion date:2020
Contract cost:Ksh. 2.4 billion Expected final cost: Ksh.2.4 billion
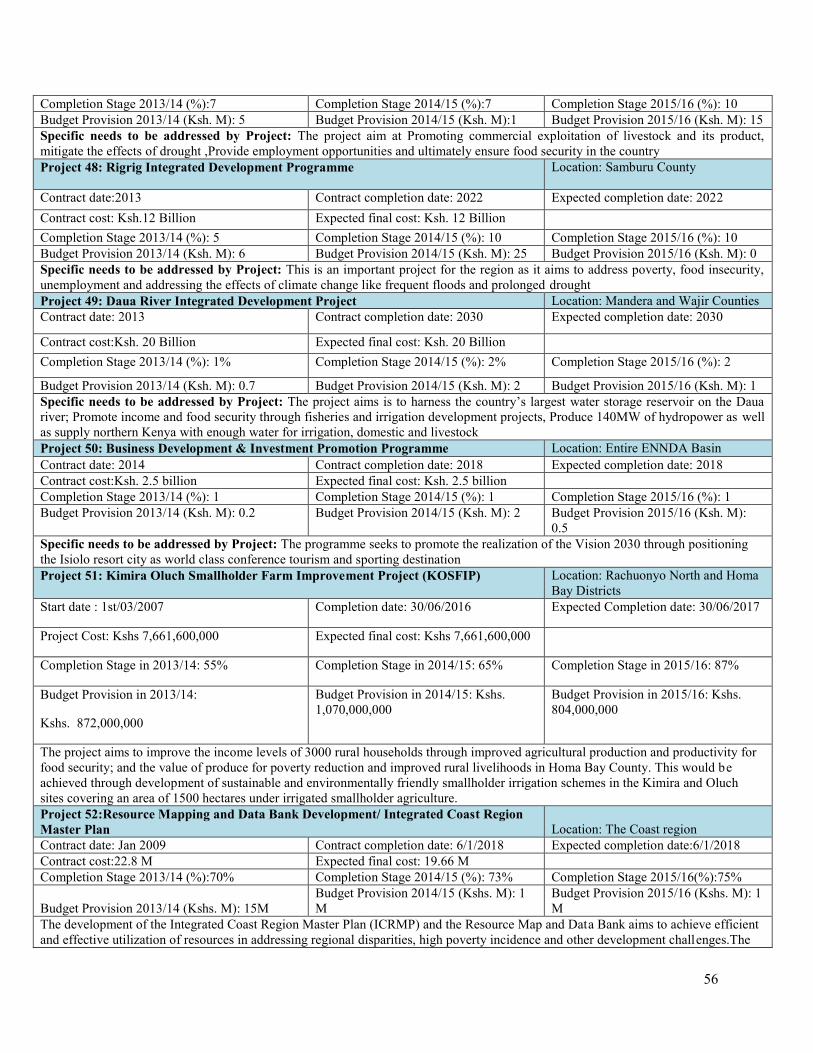
56
Completion Stage 2013/14 (%):7 Completion Stage 2014/15 (%):7 Completion Stage 2015/16 (%): 10Budget Provision 2013/14 (Ksh. M): 5 Budget Provision 2014/15 (Ksh. M):1 Budget Provision 2015/16 (Ksh. M): 15Specific needs to be addressed by Project: The project aim at Promoting commercial exploitation of livestock and its product,mitigate the effects of drought ,Provide employment opportunities and ultimately ensure food security in the countryProject 48: Rigrig Integrated Development Programme Location: Samburu County
Contract date:2013 Contract completion date: 2022 Expected completion date: 2022Contract cost: Ksh.12 Billion Expected final cost: Ksh. 12 BillionCompletion Stage 2013/14 (%): 5 Completion Stage 2014/15 (%): 10 Completion Stage 2015/16 (%): 10Budget Provision 2013/14 (Ksh. M): 6 Budget Provision 2014/15 (Ksh. M): 25 Budget Provision 2015/16 (Ksh. M): 0Specific needs to be addressed by Project: This is an important project for the region as it aims to address poverty, food insecurity,unemployment and addressing the effects of climate change like frequent floods and prolonged droughtProject 49: Daua River Integrated Development Project Location: Mandera and Wajir CountiesContract date: 2013 Contract completion date: 2030 Expected completion date: 2030
Contract cost:Ksh. 20 Billion Expected final cost: Ksh. 20 BillionCompletion Stage 2013/14 (%): 1% Completion Stage 2014/15 (%): 2% Completion Stage 2015/16 (%): 2
Budget Provision 2013/14 (Ksh. M): 0.7 Budget Provision 2014/15 (Ksh. M): 2 Budget Provision 2015/16 (Ksh. M): 1Specific needs to be addressed by Project: The project aims is to harness the country’s largest water storage reservoir on the Dauariver; Promote income and food security through fisheries and irrigation development projects, Produce 140MW of hydropower as wellas supply northern Kenya with enough water for irrigation, domestic and livestockProject 50: Business Development & Investment Promotion Programme Location: Entire ENNDA BasinContract date: 2014 Contract completion date: 2018 Expected completion date: 2018Contract cost:Ksh. 2.5 billion Expected final cost: Ksh. 2.5 billionCompletion Stage 2013/14 (%): 1 Completion Stage 2014/15 (%): 1 Completion Stage 2015/16 (%): 1Budget Provision 2013/14 (Ksh. M): 0.2 Budget Provision 2014/15 (Ksh. M): 2 Budget Provision 2015/16 (Ksh. M):
0.5Specific needs to be addressed by Project: The programme seeks to promote the realization of the Vision 2030 through positioningthe Isiolo resort city as world class conference tourism and sporting destinationProject 51: Kimira Oluch Smallholder Farm Improvement Project (KOSFIP) Location: Rachuonyo North and Homa
Bay DistrictsStart date : 1st/03/2007 Completion date: 30/06/2016 Expected Completion date: 30/06/2017
Project Cost: Kshs 7,661,600,000 Expected final cost: Kshs 7,661,600,000
Completion Stage in 2013/14: 55% Completion Stage in 2014/15: 65% Completion Stage in 2015/16: 87%
Budget Provision in 2013/14:
Kshs. 872,000,000
Budget Provision in 2014/15: Kshs.1,070,000,000
Budget Provision in 2015/16: Kshs.804,000,000
The project aims to improve the income levels of 3000 rural households through improved agricultural production and productivity forfood security; and the value of produce for poverty reduction and improved rural livelihoods in Homa Bay County. This would beachieved through development of sustainable and environmentally friendly smallholder irrigation schemes in the Kimira and Oluchsites covering an area of 1500 hectares under irrigated smallholder agriculture.Project 52:Resource Mapping and Data Bank Development/ Integrated Coast RegionMaster Plan Location: The Coast regionContract date: Jan 2009 Contract completion date: 6/1/2018 Expected completion date:6/1/2018Contract cost:22.8 M Expected final cost: 19.66 MCompletion Stage 2013/14 (%):70% Completion Stage 2014/15 (%): 73% Completion Stage 2015/16(%):75%
Budget Provision 2013/14 (Kshs. M): 15MBudget Provision 2014/15 (Kshs. M): 1M
Budget Provision 2015/16 (Kshs. M): 1M
The development of the Integrated Coast Region Master Plan (ICRMP) and the Resource Map and Data Bank aims to achieve efficientand effective utilization of resources in addressing regional disparities, high poverty incidence and other development challenges.The
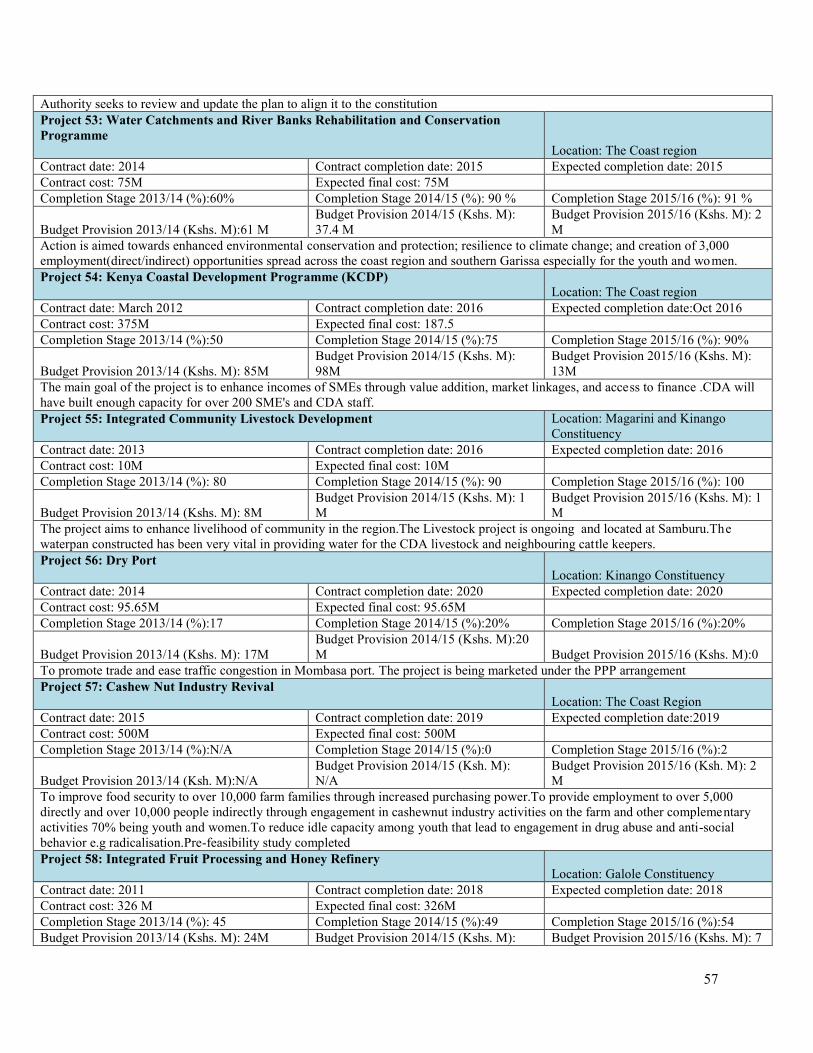
57
Authority seeks to review and update the plan to align it to the constitutionProject 53: Water Catchments and River Banks Rehabilitation and ConservationProgramme
Location: The Coast regionContract date: 2014 Contract completion date: 2015 Expected completion date: 2015Contract cost: 75M Expected final cost: 75MCompletion Stage 2013/14 (%):60% Completion Stage 2014/15 (%): 90 % Completion Stage 2015/16 (%): 91 %
Budget Provision 2013/14 (Kshs. M):61 MBudget Provision 2014/15 (Kshs. M):37.4 M
Budget Provision 2015/16 (Kshs. M): 2M
Action is aimed towards enhanced environmental conservation and protection; resilience to climate change; and creation of 3,000employment(direct/indirect) opportunities spread across the coast region and southern Garissa especially for the youth and women.Project 54: Kenya Coastal Development Programme (KCDP)
Location: The Coast regionContract date: March 2012 Contract completion date: 2016 Expected completion date:Oct 2016Contract cost: 375M Expected final cost: 187.5Completion Stage 2013/14 (%):50 Completion Stage 2014/15 (%):75 Completion Stage 2015/16 (%): 90%
Budget Provision 2013/14 (Kshs. M): 85MBudget Provision 2014/15 (Kshs. M):98M
Budget Provision 2015/16 (Kshs. M):13M
The main goal of the project is to enhance incomes of SMEs through value addition, market linkages, and access to finance .CDA willhave built enough capacity for over 200 SME's and CDA staff.Project 55: Integrated Community Livestock Development Location: Magarini and Kinango
ConstituencyContract date: 2013 Contract completion date: 2016 Expected completion date: 2016Contract cost: 10M Expected final cost: 10MCompletion Stage 2013/14 (%): 80 Completion Stage 2014/15 (%): 90 Completion Stage 2015/16 (%): 100
Budget Provision 2013/14 (Kshs. M): 8MBudget Provision 2014/15 (Kshs. M): 1M
Budget Provision 2015/16 (Kshs. M): 1M
The project aims to enhance livelihood of community in the region.The Livestock project is ongoing and located at Samburu.Thewaterpan constructed has been very vital in providing water for the CDA livestock and neighbouring cattle keepers.Project 56: Dry Port
Location: Kinango ConstituencyContract date: 2014 Contract completion date: 2020 Expected completion date: 2020Contract cost: 95.65M Expected final cost: 95.65MCompletion Stage 2013/14 (%):17 Completion Stage 2014/15 (%):20% Completion Stage 2015/16 (%):20%
Budget Provision 2013/14 (Kshs. M): 17MBudget Provision 2014/15 (Kshs. M):20M Budget Provision 2015/16 (Kshs. M):0
To promote trade and ease traffic congestion in Mombasa port. The project is being marketed under the PPP arrangementProject 57: Cashew Nut Industry Revival
Location: The Coast RegionContract date: 2015 Contract completion date: 2019 Expected completion date:2019Contract cost: 500M Expected final cost: 500MCompletion Stage 2013/14 (%):N/A Completion Stage 2014/15 (%):0 Completion Stage 2015/16 (%):2
Budget Provision 2013/14 (Ksh. M):N/ABudget Provision 2014/15 (Ksh. M):N/A
Budget Provision 2015/16 (Ksh. M): 2M
To improve food security to over 10,000 farm families through increased purchasing power.To provide employment to over 5,000directly and over 10,000 people indirectly through engagement in cashewnut industry activities on the farm and other complementaryactivities 70% being youth and women.To reduce idle capacity among youth that lead to engagement in drug abuse and anti-socialbehavior e.g radicalisation.Pre-feasibility study completedProject 58: Integrated Fruit Processing and Honey Refinery
Location: Galole ConstituencyContract date: 2011 Contract completion date: 2018 Expected completion date: 2018Contract cost: 326 M Expected final cost: 326MCompletion Stage 2013/14 (%): 45 Completion Stage 2014/15 (%):49 Completion Stage 2015/16 (%):54Budget Provision 2013/14 (Kshs. M): 24M Budget Provision 2014/15 (Kshs. M): Budget Provision 2015/16 (Kshs. M): 7

58
5M MThe project aims to enhance food security, creation of wealth and alternative livelihoods.To provide market outlets for 5,000 farmersagricultural fruit products through value addition.To create employment 400 directly and 2000 indirectly mainly to youth and women.PROJECT 59: Mineral Exploration and exploitation: Limestone and gemstone. Location: Kilifi North, Matuga and
Mwatate ConstituenciesContract date: 2014 Contract completion date: 2017 Expected completion date: 2017Contract cost: 500 Expected final cost: 500MCompletion Stage 2013/14 (%):0 Completion Stage 2014/15 (%): 10 Completion Stage 2015/16 (%): 20
Budget Provision 2013/14 (Ksh. M): 30Budget Provision 2014/15 (Ksh. M):28.9 Budget Provision 2015/16 (Ksh. M): 30
To create employment opportunities for local youth and women that could increase the incomes of the same people as well. To set anexample of sustainable utilization of the natural resource base in the regionProject 60: Solar Power Generation Project
Location: Samburu,KwaleContract date: 2016 Contract completion date: 2018 Expected completion date: 2018Contract cost: 30B Expected final cost: 30BCompletion Stage 2013/14 (%):0 Completion Stage 2014/15 (%):0 Completion Stage 2015/16 (%): 1
Budget Provision 2013/14 (Ksh. M): N/ABudget Provision 2014/15 (Ksh. M):N/A
Budget Provision 2015/16 (Ksh. M): 1M
The project is expected to generate 300 mw,energy reliability to 1,000 homes and provide employment.Feasibili ty study completed.Theproject is being marketed under the PPP arrangement awaiting approval .MOU signed with potential investor.Project 61: Mwache Dam Location: Kinango ConstituencyContract date: 2010 Contract completion date: 2018 Expected completion date: 2018Contract cost: Ksh 20 billion Expected final cost: 20BCompletion Stage 2013/14 (%):0 Completion Stage 2014/15 (%):0 Completion Stage 2015/16 (%): 2Budget Provision 2013/14 (Ksh. M): 0 Budget Provision 2014/15 (Ksh. M):0 Budget Provision 2015/16 (Ksh. M): 2Improve the living standards of Kwale and Mombasa residents: 1,536, 000 people through water supply for domestic, industrial andlivestock and fisheries.World Bank has released funding for the project.Project 62: Lake Chala Water Resources Development
Location: Taveta ConstituencyContract date: Jan 2011 Contract completion date: 2022 Expected completion date: 2022Contract cost: Ksh 3.289B Expected final cost: 3.289BCompletion Stage 2013/14 (%):1 Completion Stage 2014/15 (%):2 Completion Stage 2015/16 (%): 3Budget Provision 2013/14 (Ksh. M): 2 Budget Provision 2014/15 (Ksh. M):34 Budget Provision 2015/16 (Ksh. M): 54Provide clean drinking water to 2,000 households and 30,000 livestock, put 2,000 ha of land on irrigation.Project 63: Water Pans Location: Coast RegionContract date: 2014 Contract completion date: 2015 Expected completion date: 2015Contract cost: 100M Expected final cost: 100MCompletion Stage 2013/14 (%):34 Completion Stage 2014/15 (%):69 Completion Stage 2015/16 (%): 100Budget Provision 2013/14 (Ksh. M): 34 Budget Provision 2014/15 (Ksh. M):35 Budget Provision 2015/16 (Ksh. M):31The waterpans were constructed under the Water Harvesting and Storage Project.
CAPITAL PROJECTS IN STATE DEPARTMENT FOR DEVOLUTION
Project 64: Kenya Devolution Support Programme (Performance For Results)Location: Nairobi
Contract Date: 15th April,2016 Contract Completion Date: 31stDec, 2020 Expected Completion Date: 31stDec,2020
Contract Cost: Ksh.20.4 Billion Expected Final Cost: Kshs. 28.73 Billion
Completion Stage: 2013/14 N/A Completion Stage: 2014/15 N/A Completion Stage: 2015/16 10%

59
Budget Provision 2013/14 N/A Budget Provision 2014/15 N/A Budget Provision 2015/16 Kshs. 120m
Specific needs to be addressed by Project:The project is meant to develop capacity of both the national and county governments onvarious management aspect including and not limited to Human Resource, Planning, Monitoring and Evaluation, Public FinanceManagement, Environmental management etc.Project 65: Kenya Symbiocity Programme Location: NairobiContract Date: 1st April 2015 Contract Completion Date: 31st Dec 2018 Expected Completion Date: 31st Dec
2018
Contract Cost: Kshs 365 million Expected Final Cost: Kshs. 365 Million
Completion Stage: 2013/14 N/A Completion Stage: 2014/15: NIL Completion Stage: 2015/16 (%): 30
Budget Provision 2013/14 N/A Budget Provision 2014/15 NIL Budget Provision 2015/16 Kshs. 111.1M
Specific needs to be addressed by Project:The objective of the programme is to build the capacity of urban development stakeholdersto guide Kenya urban development in a more sustainable directionProject 66: Effective Implementation of Gender Functions Location: Nairobi
Contract Date: 1/7/2015 Contract Completion Date: 2018/19 Expected Completion Date: June 2019
Contract Cost: 60million Expected Final Cost: Kshs. 60million
Completion Stage: 2013/14N/A
Completion Stage: 2014/15N/A
Completion Stage:16%
Budget Provision 2013/14N/A
Budget Provision 2014/15N/A
Budget Provision 2015/16 Kshs (M). 20
Specific needs to be addressed by Project: The project will be contributing to the transformative governance, women empowermentand participation in economic development of the country and at the county level.Project 67: Integrated Programme to support Devolution in Kenya (UNDP) Location: NairobiContract Date: Jan,2014 Contract Completion Date: Dec,2018 Expected Completion Date: Dec,2018
Contract Cost: Ksh.160M Expected Final Cost: Kshs. Ksh.200M
Completion Stage: 2013/14: 30% Completion Stage: 2014/15 :41% Completion Stage: 2015/16:75%
Budget Provision 2013/14 :Ksh.40 M Budget Provision 2014/15: Ksh.40 M Budget Provision 2015/16 : Ksh.40 M
Specific needs to be addressed by Project:The objective of the programme is to improve service delivery, capacity building foreffective implementation of DevolutionProject 68: Network Infrastructure Location: NairobiContract Date: July 2016 Contract Completion Date: July 2020 Expected Completion Date: July 2020
Contract Cost: Kshs. 160M Expected Final Cost: Kshs. 160 Million
Completion Stage: 2013/14 N/A Completion Stage: 2014/15 Completion Stage: 2015/16 NIL

60
NIL
Budget Provision 2013/14 N/A Budget Provision 2014/15 NIL Budget Provision 2015/16NIL
Specific needs to be addressed by Project:To strengthen the information management system in the State Department and create aplatform of information sharing within the government on devolution
Project 69: Instruments for Devolution Advice and support (IDEAS). Location: NairobiContract Date: Sep,2014 Contract Completion Date: 2019/2020 Expected Completion Date: 2019/2020
Contract Cost: ksh. 2.86 Billion Expected Final Cost: Kshs. 2.86 Billion
Completion Stage: 2013/14 N/A Completion Stage: 2014/15NIL
Completion Stage: 2015/16 (%): 10%
Budget Provision 2013/14 N/A Budget Provision 2014/15 NIL Budget Provision 2015/16 NIL
Specific needs to be addressed by Project:The objective of the programme is to support national and county governments to createcapacities through responsible transfer and use of resources for the achievements of Local Economic Development at county levels
CAPITAL PROJECTS IN THE MINISTRY OF FOREIGN AFFAIRSProject 70: Construction of Chancery and High Commissioner’s Residence Location: Pretoria South AfricaContract date:August, 2015
Contract completion date: 31st
January,2017Expected completion date: 31st January,2017
Contract cost:ksh. 215.0 million(R 102,000,000)
Expected final cost:ksh. 215.0 million(R 102,000,000)
Completion stage 2013/14 (%): N/A Completion stage 2014/15: 25% Completion stage 2015/16 (%):Budget provision 2013/14: -N/A Budget provision 2014/15: - Kshs. 140 m Budget provision 2015/16:Specific needs to be addressed by Project:The project is aimed at reducing expenditure on renting/leasing premises for officeaccommodation and residences. The Chancery and staff houses are being reconstructed anew since the former residence wasdilapidated. The Ministry has completed design and documentation, awarded and signed the contract and construction works currentlybeing undertaken.Project 71: Purchase of Chancery Location: Kampala, UgandaContract date: February 2015 Contract completion date: May 2015 Completion date: May 2015Cost: Ksh. 594 million (USD 6.5 million) Expected final cost:
Ksh. 632,610,000Completion stage 2013/14 (%): -N/A Completion stage 2014/15 :100 Completion stage 2015/16 (%):100Budget provision 2013/14: - N/A Budget provision 2014/15: - 594,000,000 Budget provision 2015/16:N/ASpecific needs to be addressed by Project: Uganda is the leading single export market for Kenyan products accounting for 28.4 percent of total exports to Africa and 13.4 per cent of exports globally. To strengthen Kenya’s presence in Uganda as well as deepen ourbilateral relations it has been considered important that Kenya establishes itself permanently in Uganda. The purchased of the Chancerywas finalized in the 2014/15 year.Project 72: Construction of Chancery and High Commissioners Residence Location: Islamabad, PakistanContract date:March 2015
Contract completion date:August 2016 (revised)
Expected completion date: -August 2016
Cost:Ksh. 100 million
Expected final cost:Ksh. 100 million
Completion stage 2013/14 (%): N/A Completion stage 2014/15:(%):10
Completion stage 2015/16 (%): 90
Budget provision 2013/14:none
Budget provision 2014/15:Ksh. 13 million
Budget provision 2015/16: -Ksh. 60 million
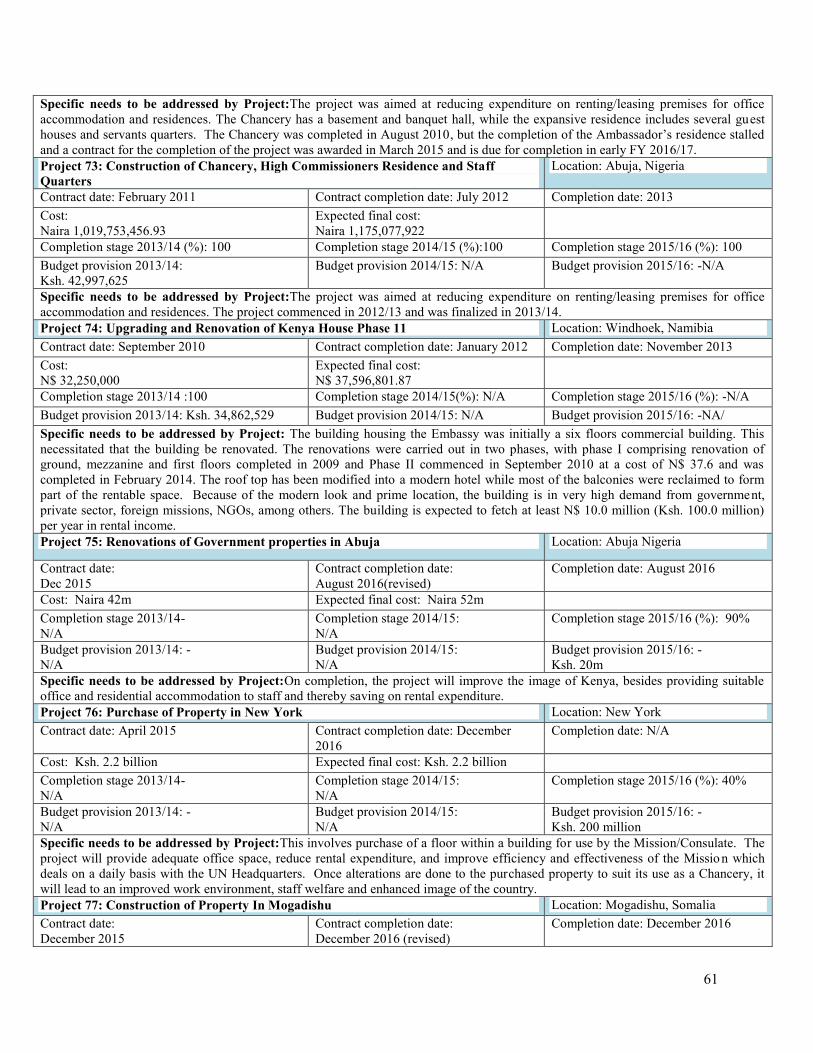
61
Specific needs to be addressed by Project:The project was aimed at reducing expenditure on renting/leasing premises for officeaccommodation and residences. The Chancery has a basement and banquet hall, while the expansive residence includes several guesthouses and servants quarters. The Chancery was completed in August 2010, but the completion of the Ambassador’s residence stalledand a contract for the completion of the project was awarded in March 2015 and is due for completion in early FY 2016/17.Project 73: Construction of Chancery, High Commissioners Residence and StaffQuarters
Location: Abuja, Nigeria
Contract date: February 2011 Contract completion date: July 2012 Completion date: 2013Cost:Naira 1,019,753,456.93
Expected final cost:Naira 1,175,077,922
Completion stage 2013/14 (%): 100 Completion stage 2014/15 (%):100 Completion stage 2015/16 (%): 100Budget provision 2013/14:Ksh. 42,997,625
Budget provision 2014/15: N/A Budget provision 2015/16: -N/A
Specific needs to be addressed by Project:The project was aimed at reducing expenditure on renting/leasing premises for officeaccommodation and residences. The project commenced in 2012/13 and was finalized in 2013/14.Project 74: Upgrading and Renovation of Kenya House Phase 11 Location: Windhoek, NamibiaContract date: September 2010 Contract completion date: January 2012 Completion date: November 2013Cost:N$ 32,250,000
Expected final cost:N$ 37,596,801.87
Completion stage 2013/14 :100 Completion stage 2014/15(%): N/A Completion stage 2015/16 (%): -N/ABudget provision 2013/14: Ksh. 34,862,529 Budget provision 2014/15: N/A Budget provision 2015/16: -NA/Specific needs to be addressed by Project: The building housing the Embassy was initially a six floors commercial building. Thisnecessitated that the building be renovated. The renovations were carried out in two phases, with phase I comprising renovation ofground, mezzanine and first floors completed in 2009 and Phase II commenced in September 2010 at a cost of N$ 37.6 and wascompleted in February 2014. The roof top has been modified into a modern hotel while most of the balconies were reclaimed to formpart of the rentable space. Because of the modern look and prime location, the building is in very high demand from government,private sector, foreign missions, NGOs, among others. The building is expected to fetch at least N$ 10.0 million (Ksh. 100.0 million)per year in rental income.Project 75: Renovations of Government properties in Abuja Location: Abuja Nigeria
Contract date:Dec 2015
Contract completion date:August 2016(revised)
Completion date: August 2016
Cost: Naira 42m Expected final cost: Naira 52mCompletion stage 2013/14-N/A
Completion stage 2014/15:N/A
Completion stage 2015/16 (%): 90%
Budget provision 2013/14: -N/A
Budget provision 2014/15:N/A
Budget provision 2015/16: -Ksh. 20m
Specific needs to be addressed by Project:On completion, the project will improve the image of Kenya, besides providing suitableoffice and residential accommodation to staff and thereby saving on rental expenditure.Project 76: Purchase of Property in New York Location: New YorkContract date: April 2015 Contract completion date: December
2016Completion date: N/A
Cost: Ksh. 2.2 billion Expected final cost: Ksh. 2.2 billionCompletion stage 2013/14-N/A
Completion stage 2014/15:N/A
Completion stage 2015/16 (%): 40%
Budget provision 2013/14: -N/A
Budget provision 2014/15:N/A
Budget provision 2015/16: -Ksh. 200 million
Specific needs to be addressed by Project:This involves purchase of a floor within a building for use by the Mission/Consulate. Theproject will provide adequate office space, reduce rental expenditure, and improve efficiency and effectiveness of the Missio n whichdeals on a daily basis with the UN Headquarters. Once alterations are done to the purchased property to suit its use as a Chancery, itwill lead to an improved work environment, staff welfare and enhanced image of the country.Project 77: Construction of Property In Mogadishu Location: Mogadishu, SomaliaContract date:December 2015
Contract completion date:December 2016 (revised)
Completion date: December 2016
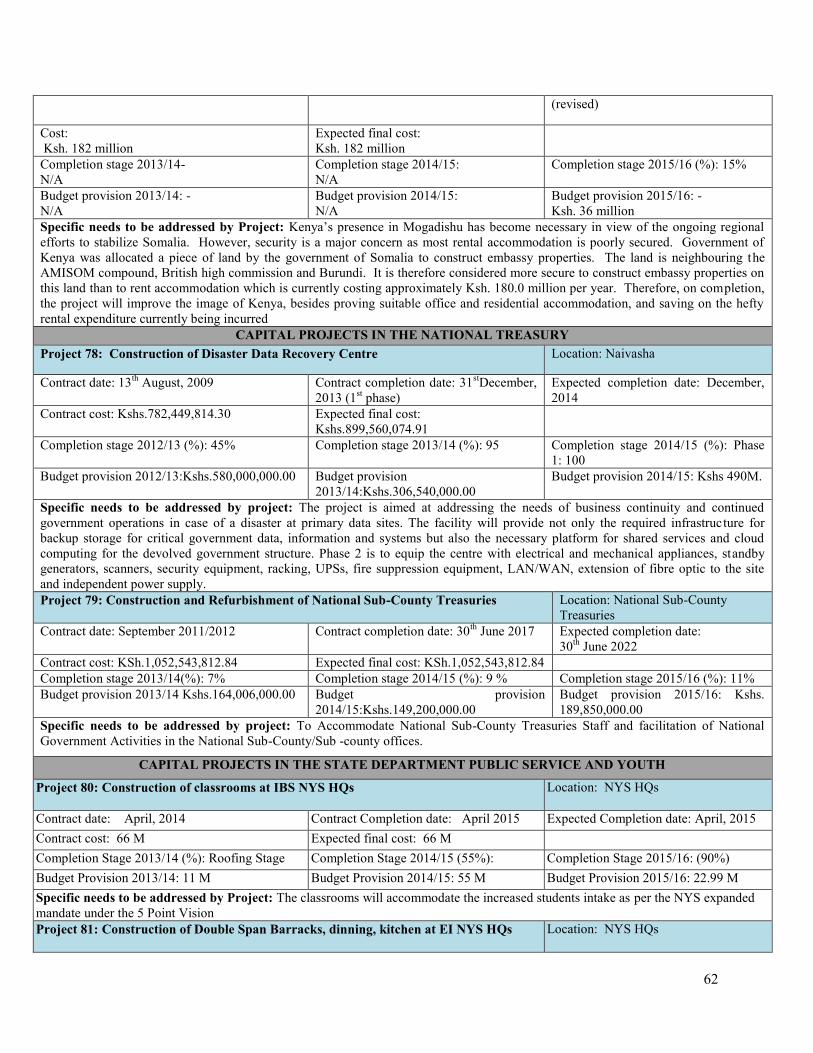
62
(revised)
Cost:Ksh. 182 million
Expected final cost:Ksh. 182 million
Completion stage 2013/14-N/A
Completion stage 2014/15:N/A
Completion stage 2015/16 (%): 15%
Budget provision 2013/14: -N/A
Budget provision 2014/15:N/A
Budget provision 2015/16: -Ksh. 36 million
Specific needs to be addressed by Project: Kenya’s presence in Mogadishu has become necessary in view of the ongoing regionalefforts to stabilize Somalia. However, security is a major concern as most rental accommodation is poorly secured. Government ofKenya was allocated a piece of land by the government of Somalia to construct embassy properties. The land is neighbouring theAMISOM compound, British high commission and Burundi. It is therefore considered more secure to construct embassy properties onthis land than to rent accommodation which is currently costing approximately Ksh. 180.0 million per year. Therefore, on completion,the project will improve the image of Kenya, besides proving suitable office and residential accommodation, and saving on the heftyrental expenditure currently being incurred
CAPITAL PROJECTS IN THE NATIONAL TREASURYProject 78: Construction of Disaster Data Recovery Centre Location: Naivasha
Contract date: 13th August, 2009 Contract completion date: 31stDecember,2013 (1st phase)
Expected completion date: December,2014
Contract cost: Kshs.782,449,814.30 Expected final cost:Kshs.899,560,074.91
Completion stage 2012/13 (%): 45% Completion stage 2013/14 (%): 95 Completion stage 2014/15 (%): Phase1: 100
Budget provision 2012/13:Kshs.580,000,000.00 Budget provision2013/14:Kshs.306,540,000.00
Budget provision 2014/15: Kshs 490M.
Specific needs to be addressed by project: The project is aimed at addressing the needs of business continuity and continuedgovernment operations in case of a disaster at primary data sites. The facility will provide not only the required infrastructure forbackup storage for critical government data, information and systems but also the necessary platform for shared services and cloudcomputing for the devolved government structure. Phase 2 is to equip the centre with electrical and mechanical appliances, standbygenerators, scanners, security equipment, racking, UPSs, fire suppression equipment, LAN/WAN, extension of fibre optic to the siteand independent power supply.Project 79: Construction and Refurbishment of National Sub-County Treasuries Location: National Sub-County
TreasuriesContract date: September 2011/2012 Contract completion date: 30th June 2017 Expected completion date:
30th June 2022Contract cost: KSh.1,052,543,812.84 Expected final cost: KSh.1,052,543,812.84Completion stage 2013/14(%): 7% Completion stage 2014/15 (%): 9 % Completion stage 2015/16 (%): 11%Budget provision 2013/14 Kshs.164,006,000.00 Budget provision
2014/15:Kshs.149,200,000.00Budget provision 2015/16: Kshs.189,850,000.00
Specific needs to be addressed by project: To Accommodate National Sub-County Treasuries Staff and facilitation of NationalGovernment Activities in the National Sub-County/Sub -county offices.
CAPITAL PROJECTS IN THE STATE DEPARTMENT PUBLIC SERVICE AND YOUTH
Project 80: Construction of classrooms at IBS NYS HQs Location: NYS HQsl
Contract date: April, 2014 Contract Completion date: April 2015 Expected Completion date: April, 2015Contract cost: 66 M Expected final cost: 66 MCompletion Stage 2013/14 (%): Roofing Stage Completion Stage 2014/15 (55%): Completion Stage 2015/16: (90%)Budget Provision 2013/14: 11 M Budget Provision 2014/15: 55 M Budget Provision 2015/16: 22.99 MSpecific needs to be addressed by Project: The classrooms will accommodate the increased students intake as per the NYS expandedmandate under the 5 Point VisionProject 81: Construction of Double Span Barracks, dinning, kitchen at EI NYS HQs Location: NYS HQs
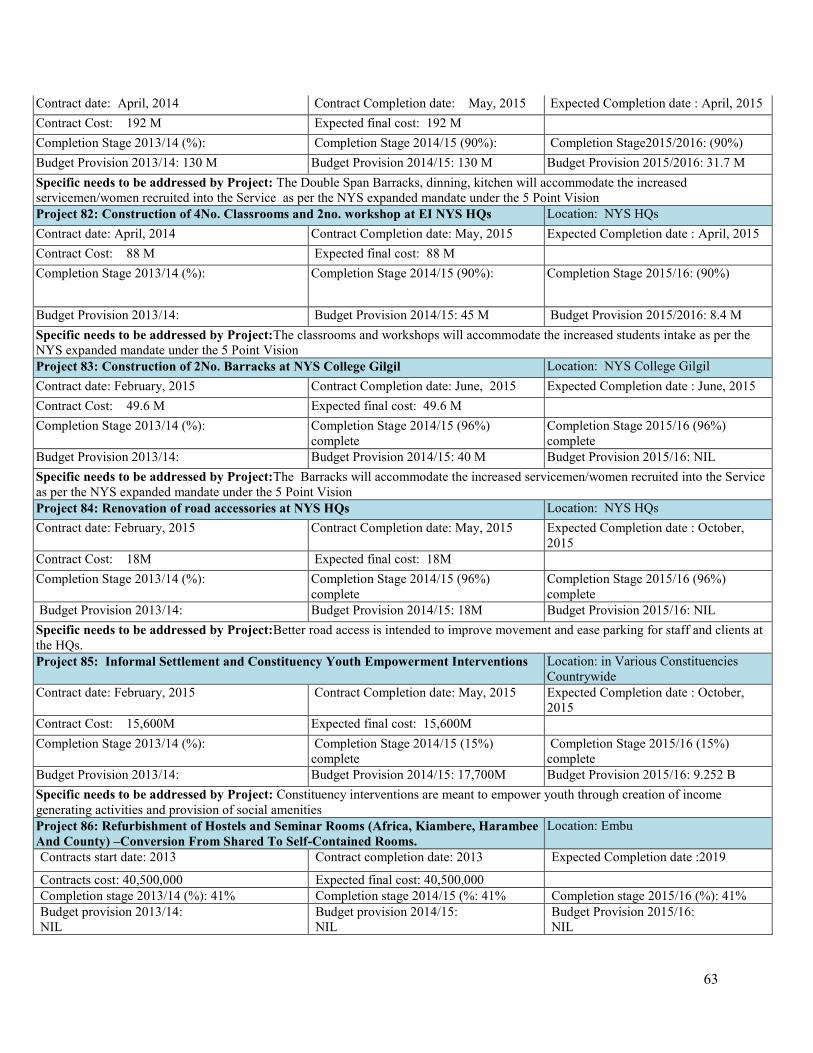
63
Contract date: April, 2014 Contract Completion date: May, 2015 Expected Completion date : April, 2015Contract Cost: 192 M Expected final cost: 192 MCompletion Stage 2013/14 (%): Completion Stage 2014/15 (90%): Completion Stage2015/2016: (90%)Budget Provision 2013/14: 130 M Budget Provision 2014/15: 130 M Budget Provision 2015/2016: 31.7 MSpecific needs to be addressed by Project: The Double Span Barracks, dinning, kitchen will accommodate the increasedservicemen/women recruited into the Service as per the NYS expanded mandate under the 5 Point VisionProject 82: Construction of 4No. Classrooms and 2no. workshop at EI NYS HQs Location: NYS HQsContract date: April, 2014 Contract Completion date: May, 2015 Expected Completion date : April, 2015Contract Cost: 88 M Expected final cost: 88 MCompletion Stage 2013/14 (%): Completion Stage 2014/15 (90%): Completion Stage 2015/16: (90%)
Budget Provision 2013/14: Budget Provision 2014/15: 45 M Budget Provision 2015/2016: 8.4 MSpecific needs to be addressed by Project:The classrooms and workshops will accommodate the increased students intake as per theNYS expanded mandate under the 5 Point VisionProject 83: Construction of 2No. Barracks at NYS College Gilgil Location: NYS College GilgilContract date: February, 2015 Contract Completion date: June, 2015 Expected Completion date : June, 2015Contract Cost: 49.6 M Expected final cost: 49.6 MCompletion Stage 2013/14 (%): Completion Stage 2014/15 (96%)
completeCompletion Stage 2015/16 (96%)complete
Budget Provision 2013/14: Budget Provision 2014/15: 40 M Budget Provision 2015/16: NILSpecific needs to be addressed by Project:The Barracks will accommodate the increased servicemen/women recruited into the Serviceas per the NYS expanded mandate under the 5 Point VisionProject 84: Renovation of road accessories at NYS HQs Location: NYS HQsContract date: February, 2015 Contract Completion date: May, 2015 Expected Completion date : October,
2015Contract Cost: 18M Expected final cost: 18MCompletion Stage 2013/14 (%): Completion Stage 2014/15 (96%)
completeCompletion Stage 2015/16 (96%)complete
Budget Provision 2013/14: Budget Provision 2014/15: 18M Budget Provision 2015/16: NILSpecific needs to be addressed by Project:Better road access is intended to improve movement and ease parking for staff and clients atthe HQs.Project 85: Informal Settlement and Constituency Youth Empowerment Interventions Location: in Various Constituencies
CountrywideContract date: February, 2015 Contract Completion date: May, 2015 Expected Completion date : October,
2015Contract Cost: 15,600M Expected final cost: 15,600MCompletion Stage 2013/14 (%): Completion Stage 2014/15 (15%)
completeCompletion Stage 2015/16 (15%)
completeBudget Provision 2013/14: Budget Provision 2014/15: 17,700M Budget Provision 2015/16: 9.252 BSpecific needs to be addressed by Project: Constituency interventions are meant to empower youth through creation of incomegenerating activities and provision of social amenitiesProject 86: Refurbishment of Hostels and Seminar Rooms (Africa, Kiambere, HarambeeAnd County) –Conversion From Shared To Self-Contained Rooms.
Location: Embu
Contracts start date: 2013 Contract completion date: 2013 Expected Completion date :2019
Contracts cost: 40,500,000 Expected final cost: 40,500,000Completion stage 2013/14 (%): 41% Completion stage 2014/15 (%: 41% Completion stage 2015/16 (%): 41%Budget provision 2013/14:NIL
Budget provision 2014/15:NIL
Budget Provision 2015/16:NIL
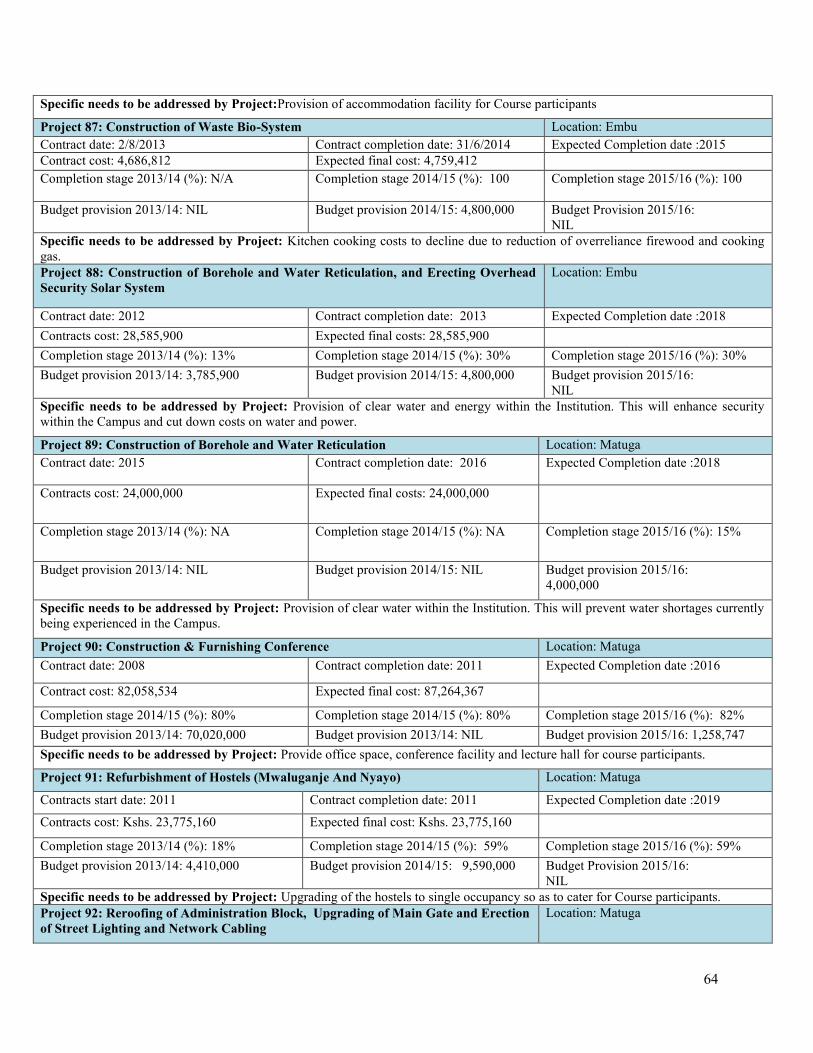
64
Specific needs to be addressed by Project:Provision of accommodation facility for Course participants
Project 87: Construction of Waste Bio-System Location: EmbuContract date: 2/8/2013 Contract completion date: 31/6/2014 Expected Completion date :2015Contract cost: 4,686,812 Expected final cost: 4,759,412Completion stage 2013/14 (%): N/A Completion stage 2014/15 (%): 100 Completion stage 2015/16 (%): 100
Budget provision 2013/14: NIL Budget provision 2014/15: 4,800,000 Budget Provision 2015/16:NIL
Specific needs to be addressed by Project: Kitchen cooking costs to decline due to reduction of overreliance firewood and cookinggas.Project 88: Construction of Borehole and Water Reticulation, and Erecting OverheadSecurity Solar System
Location: Embu
Contract date: 2012 Contract completion date: 2013 Expected Completion date :2018Contracts cost: 28,585,900 Expected final costs: 28,585,900Completion stage 2013/14 (%): 13% Completion stage 2014/15 (%): 30% Completion stage 2015/16 (%): 30%Budget provision 2013/14: 3,785,900 Budget provision 2014/15: 4,800,000 Budget provision 2015/16:
NILSpecific needs to be addressed by Project: Provision of clear water and energy within the Institution. This will enhance securitywithin the Campus and cut down costs on water and power.
Project 89: Construction of Borehole and Water Reticulation Location: MatugaContract date: 2015 Contract completion date: 2016 Expected Completion date :2018
Contracts cost: 24,000,000 Expected final costs: 24,000,000
Completion stage 2013/14 (%): NA Completion stage 2014/15 (%): NA Completion stage 2015/16 (%): 15%
Budget provision 2013/14: NIL Budget provision 2014/15: NIL Budget provision 2015/16:4,000,000
Specific needs to be addressed by Project: Provision of clear water within the Institution. This will prevent water shortages currentlybeing experienced in the Campus.
Project 90: Construction & Furnishing Conference Location: MatugaContract date: 2008 Contract completion date: 2011 Expected Completion date :2016
Contract cost: 82,058,534 Expected final cost: 87,264,367
Completion stage 2014/15 (%): 80% Completion stage 2014/15 (%): 80% Completion stage 2015/16 (%): 82%Budget provision 2013/14: 70,020,000 Budget provision 2013/14: NIL Budget provision 2015/16: 1,258,747Specific needs to be addressed by Project: Provide office space, conference facility and lecture hall for course participants.
Project 91: Refurbishment of Hostels (Mwaluganje And Nyayo) Location: Matuga
Contracts start date: 2011 Contract completion date: 2011 Expected Completion date :2019
Contracts cost: Kshs. 23,775,160 Expected final cost: Kshs. 23,775,160
Completion stage 2013/14 (%): 18% Completion stage 2014/15 (%): 59% Completion stage 2015/16 (%): 59%Budget provision 2013/14: 4,410,000 Budget provision 2014/15: 9,590,000 Budget Provision 2015/16:
NILSpecific needs to be addressed by Project: Upgrading of the hostels to single occupancy so as to cater for Course participants.Project 92: Reroofing of Administration Block, Upgrading of Main Gate and Erectionof Street Lighting and Network Cabling
Location: Matuga

65
Contract date: 2012 Contract completion date: 2014 Expected Completion date :2014
Contract cost: 10,900,00 Expected final cost: 12,900,000Completion stage 2013/14 (%): 100 Completion stage 2014/15 (%): 100 Completion stage 2015/16 (%): 100Budget provision 2013/14: 9,736,000 Budget provision 2014/15: NIL Budget provision 2015/16:
NILSpecific needs to be addressed by Project: Removal of asbestos roofing, improve communication infrastructure and enhance securityProject 93: Completion of Administration Block, Construction of Modern Gate,Perimeter Wall, Parking Lots, Demolition of Structures and Construction of InternalRoad
Location: EMBU
Contract date: 2015 Contract completion date: 2018 Expected Completion date :2018
Contracts cost: 182,170,000 Expected final cost: 227,712,500Completion stage 2013/14 (%): N/A Completion stage 2014/145 (%): N/A Completion stage 2015/16 (%): 52%Budget provision 2013/14:NIL
Budget Provision 2014/15:NIL
Budget Provision 2015/16:Ksh 94,033,169
Specific needs to be addressed by Project:Provision of offices, seminar rooms, dining area, parking lot, conference facility andsecurity to the Campus.Project 94: Construction of Ultra-Modern Conference Center Location: MombasaContract date:2011 Contract completion date: 2020 Expected Completion date :2020
Contract cost: 830,210,662 Expected final cost: 1,037,763,327.00Completion stage 2013/14 (%): 15.7% Completion stage 2012/13 (%): 16% Completion stage 2013/14 (%): 24%Budget provision 2013/1460,985,800
Budget provision 2014/155,057,972
Budget Provision 2015/16:17,719,385
Specific needs to be addressed by Project: Provision of ultra-modern conference facility and additional officesProject 95: Construction and Furnishing of Auditorium and Administration Block Location: BaringoContract date: May 2009 Contract completion date: November
2012Expected completion date: November2014
Contract cost: Kshs.105.9M Expected final cost: Kshs.109.5MCompletion stage 2013/14 (%): N/A Completion stage 2014/15 (%): 100 Completion stage 2015/16 (%): 100Budget provision 2013/14: 30,000,000 Budget provision 2014/15: 26,019,700 Budget Provision 2015/16:
NILSpecific needs to be addressed by Project: Provide office space, lecture rooms and conference facilityProject 96: Government Human Resource Information System (GHRIS) Location: Head QuartersContract date: 2013 Contract completion date: June 2016 Expected completion date: June 2016
Contract cost: Expected final cost: Kshs. 110,000,000Completion stage 2013/14 (%): 100 Completion stage 2014/15 (%): 100 Completion stage 2015/16 (%): 100Budget provision 2013/14: Kshs. 36.98 M Budget provision 2014/15: KShs. 13.71 Budget Provision 2015/16:
Kshs. 98.83MSpecific needs to be addressed by Project: To digitise Human Resource processes and provide easy access to HR information toGovernment employees and other stakeholders.Project 97: Refurbishment of Huduma Centres Location: Head QuartersContract date: 2013/14 Contract completion date: N/A Expected completion date: 2016Completion stage 2013/14 (%): N/A Completion stage 2014/15 (%): N/A Completion stage 2015/16 (%):100Contract cost Kshs 21.3B Expected final cost 21.3 BBudget provision 2013/14: NIL Budget provision 2014/15: 3B Budget Provision 2015/16: Kshs.2.5BSpecific needs to be addressed by Project: Provide one stop shop services by operationalising the Huduma M portal, Huduma Eportal, Huduma Contact Centre, Huduma MultiChannel Payment Gateway and Huduma Self Service Kiosks.
CAPITAL PROJECTS IN THE PUBLIC SERVICE COMMISSION

66
Project 9: Construction of additional Office Space and Attendant Facilities Location: Public Service CommissionHouse
Contract date: 17thJanuary 2013 Contract completion date: 30th June 2018 Expected completion date: 30th June2018
Revised Contract Cost: Kshs.475,300,000 Expected final cost:Kshs.475,300,000
Completion stage 2013/14:26%
Completion stage FY 2014/15:75%
Completion stage FY 2015/16: 90%
Budget Provision FY 2013/14:Ksh.207,000,000
Budget Provision FY 2014/15:Ksh.168,000,000
Budget Provision FY 2015/16:Ksh.51,831,450
Specific needs to be addressed by Project: The project will partially address the acute shortage of office space, furniture and officeequipment in the new seven storey building.
CAPITAL PROJECTS IN THE OFFICE OF THE AUDITOR GENERAL
Project 99: Construction of OAG Headquarters Location: NairobiContract Date: June 2013 Contract Completion Date: June 2019 Expected Completion Date: June 2021Contract Cost: Kshs. 3500m Expected Final Cost: Kshs. 3500mCompletion Stage: 2013/14 15% Completion Stage: 2014/15 15% Completion Stage: 2015/16 (%): 15Budget Provision 2013/14 Kshs.525m Budget Provision 2014/15 Khs. 405m Budget Provision 2015/16Khs. 0Specific needs to be addressed by Project:Setting up of the Office of Auditor-General headquarters will establish a centralized secureoffice where staff and documents will be housed. From the project, it is expected that OAG staff will be working in a clean and secureenvironment with accessible services. The documents and reports generated by the Auditor General will be secured.Project 100: Construction of Office of Auditor-General Garissa County Offices Location: GarissaContract Date: January 2016 Contract Completion Date: December
2016Expected Completion Date: December2016
Contract Cost: Kshs. 134m Expected Final Cost: Kshs. 134mCompletion Stage: 2013/14 N/A Completion Stage: 2014/15
N/ACompletion Stage: 2015/16 (%): 80
Budget Provision 2013/14 Kshs.0 Budget Provision 2014/15Khs. 0
Budget Provision 2015/16Khs. 135.
Specific needs to be addressed by Project: The purpose of the projects is to establish secure county offices for Auditor-General staffin Garissa which will facilitate audit of Garissa Hub county governments. The project will also save government funds paid out onrental costs to private accommodation providers
2.3 Review of Pending Bills
In the financial years 2013/14, 2014/15 and 2015/16, the Sector incurred pending bills totallingKsh 21,964.53 million. Most of the pending bills occurred due to late or non-exchequer release;re-organisation of Government leading to late transfer of funds; forex exchange loses; andreduction of AIA through implementation the e-citizen platform.
Analysis of the recurrent and development pending bills for the period under review is presentedin Table 2.5.
2.3.1 Recurrent Pending Bills
The recurrent pending bills for the period were Ksh. 14,379.85 million, which represented 65.5 %of the total pending bills.

67
2.3.2 Development Pending Bills
The development pending bills for the period were Ksh. 7584.68 million. This accounted for34.5% of the Sector’s pending bills.
Table 2- 5: Analysis of Recurrent and Development Pending Bills
No. Sub-Sector RecurrentPending Bills(Ksh. M)
Development PendingBills (Ksh. M)
1 The Presidency 808.10 366.972 State Department for Planning and Statistics 1402.80 321.393 State Department for Devolution 7055.33 303.444 Ministry of Foreign Affairs 890.90 198.965 The National Treasury 44.06 1008.706 State Department for Public Service and Youth 4083.90 5308.627 Commission on Revenue Allocation 0.753 08 Public Service Commission 12.80 76.69 Salaries and Remuneration Commission 1.64 010 Auditor General 74.62 011 Controller of Budget 0 012 Commission on Administrative Justice 4.95 0
TOTAL 14379.85 7584.68
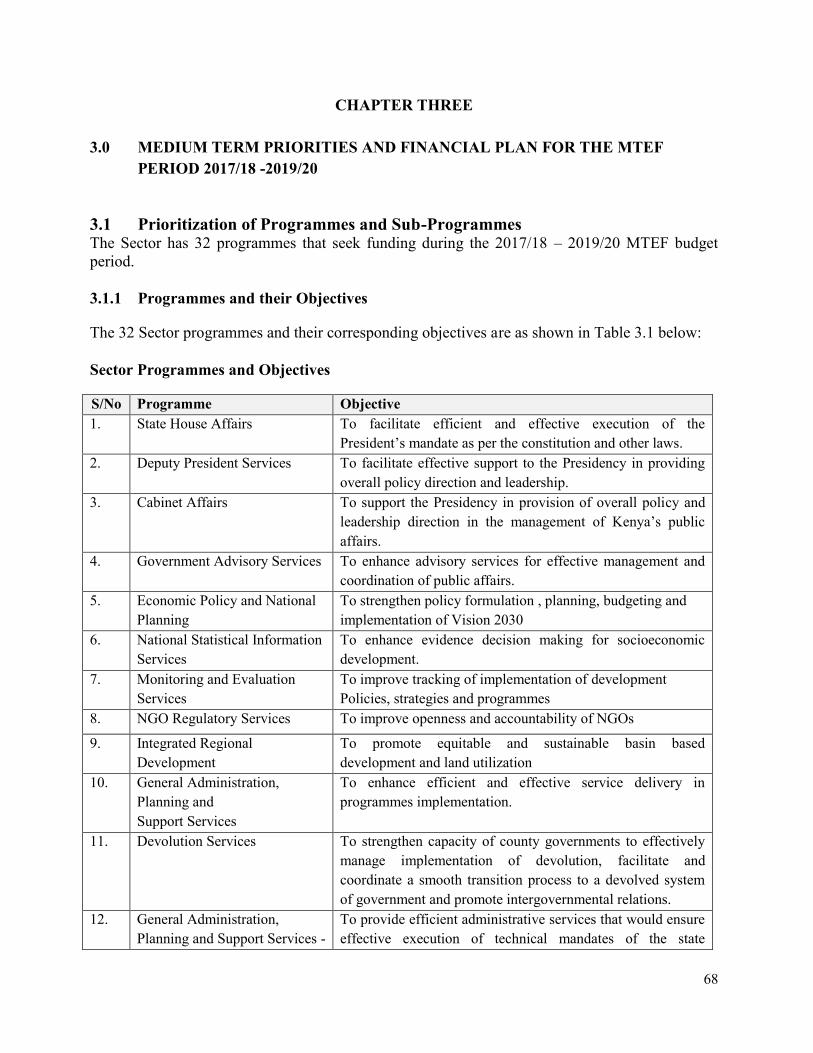
68
CHAPTER THREE
3.0 MEDIUM TERM PRIORITIES AND FINANCIAL PLAN FOR THE MTEFPERIOD 2017/18 -2019/20
3.1 Prioritization of Programmes and Sub-ProgrammesThe Sector has 32 programmes that seek funding during the 2017/18 – 2019/20 MTEF budgetperiod.
3.1.1 Programmes and their Objectives
The 32 Sector programmes and their corresponding objectives are as shown in Table 3.1 below:
Sector Programmes and Objectives
S/No Programme Objective1. State House Affairs To facilitate efficient and effective execution of the
President’s mandate as per the constitution and other laws.2. Deputy President Services To facilitate effective support to the Presidency in providing
overall policy direction and leadership.3. Cabinet Affairs To support the Presidency in provision of overall policy and
leadership direction in the management of Kenya’s publicaffairs.
4. Government Advisory Services To enhance advisory services for effective management andcoordination of public affairs.
5. Economic Policy and NationalPlanning
To strengthen policy formulation , planning, budgeting andimplementation of Vision 2030
6. National Statistical InformationServices
To enhance evidence decision making for socioeconomicdevelopment.
7. Monitoring and EvaluationServices
To improve tracking of implementation of developmentPolicies, strategies and programmes
8. NGO Regulatory Services To improve openness and accountability of NGOs
9. Integrated RegionalDevelopment
To promote equitable and sustainable basin baseddevelopment and land utilization
10. General Administration,Planning andSupport Services
To enhance efficient and effective service delivery inprogrammes implementation.
11. Devolution Services To strengthen capacity of county governments to effectivelymanage implementation of devolution, facilitate andcoordinate a smooth transition process to a devolved systemof government and promote intergovernmental relations.
12. General Administration,Planning and Support Services -
To provide efficient administrative services that would ensureeffective execution of technical mandates of the state
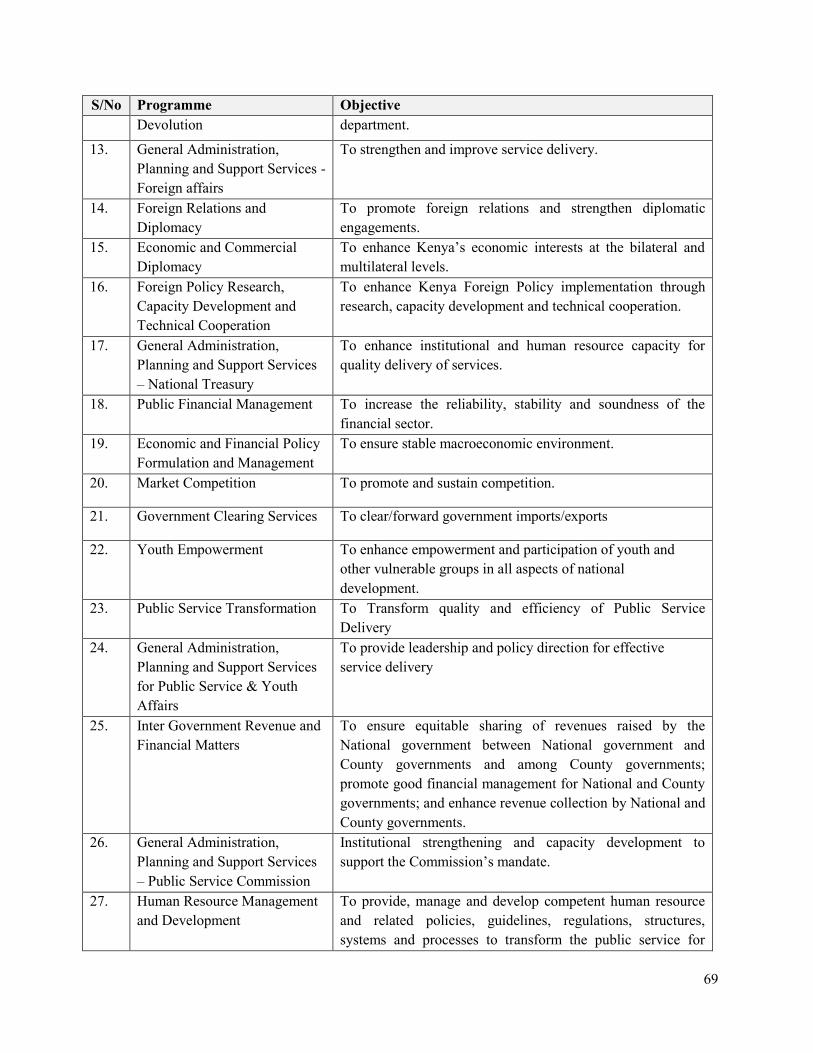
69
S/No Programme ObjectiveDevolution department.
13. General Administration,Planning and Support Services -Foreign affairs
To strengthen and improve service delivery.
14. Foreign Relations andDiplomacy
To promote foreign relations and strengthen diplomaticengagements.
15. Economic and CommercialDiplomacy
To enhance Kenya’s economic interests at the bilateral andmultilateral levels.
16. Foreign Policy Research,Capacity Development andTechnical Cooperation
To enhance Kenya Foreign Policy implementation throughresearch, capacity development and technical cooperation.
17. General Administration,Planning and Support Services– National Treasury
To enhance institutional and human resource capacity forquality delivery of services.
18. Public Financial Management To increase the reliability, stability and soundness of thefinancial sector.
19. Economic and Financial PolicyFormulation and Management
To ensure stable macroeconomic environment.
20. Market Competition To promote and sustain competition.
21. Government Clearing Services To clear/forward government imports/exports
22. Youth Empowerment To enhance empowerment and participation of youth andother vulnerable groups in all aspects of nationaldevelopment.
23. Public Service Transformation To Transform quality and efficiency of Public ServiceDelivery
24. General Administration,Planning and Support Servicesfor Public Service & YouthAffairs
To provide leadership and policy direction for effectiveservice delivery
25. Inter Government Revenue andFinancial Matters
To ensure equitable sharing of revenues raised by theNational government between National government andCounty governments and among County governments;promote good financial management for National and Countygovernments; and enhance revenue collection by National andCounty governments.
26. General Administration,Planning and Support Services– Public Service Commission
Institutional strengthening and capacity development tosupport the Commission’s mandate.
27. Human Resource Managementand Development
To provide, manage and develop competent human resourceand related policies, guidelines, regulations, structures,systems and processes to transform the public service for
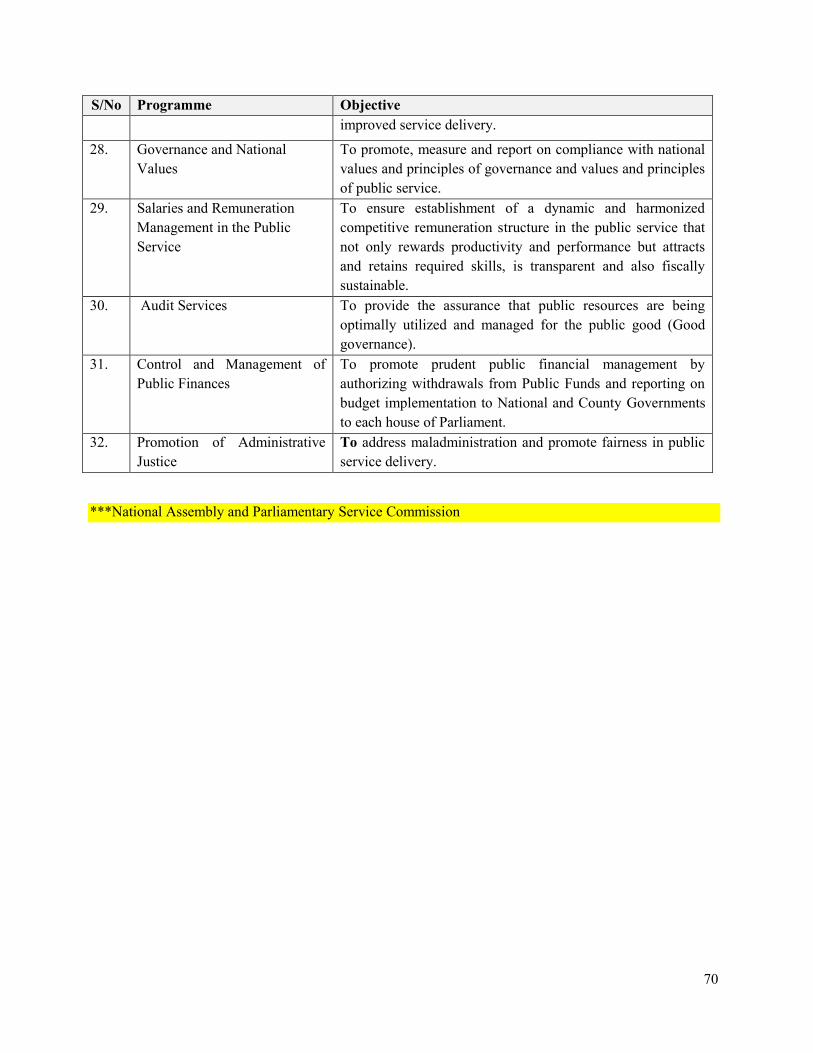
70
S/No Programme Objectiveimproved service delivery.
28. Governance and NationalValues
To promote, measure and report on compliance with nationalvalues and principles of governance and values and principlesof public service.
29. Salaries and RemunerationManagement in the PublicService
To ensure establishment of a dynamic and harmonizedcompetitive remuneration structure in the public service thatnot only rewards productivity and performance but attractsand retains required skills, is transparent and also fiscallysustainable.
30. Audit Services To provide the assurance that public resources are beingoptimally utilized and managed for the public good (Goodgovernance).
31. Control and Management ofPublic Finances
To promote prudent public financial management byauthorizing withdrawals from Public Funds and reporting onbudget implementation to National and County Governmentsto each house of Parliament.
32. Promotion of AdministrativeJustice
To address maladministration and promote fairness in publicservice delivery.
***National Assembly and Parliamentary Service Commission

71
3.1.2 Programmes, Sub-Programmes, Expected Outcomes, Outputs, and Key Performance Indicators for the Sub Sector
Table 3. 1: Programmes/ Sub-Programme, Outcomes, Outputs and Key Performance IndicatorsProgramme Delivery Unit Key Outputs Key Performance
IndicatorsTarget2015/16
ActualAchievement2015/16
Target(Baseline)
2016/17
Target2017/18
Target2018/19
Target2019/20
The PresidencyName of Programme: State House AffairsProgramme Outcome: Effective National Leadership
SP 1:Coordination ofState HouseFunctions
Administration Fulfilment ofConstitutional Mandatesof the President
National Leadershipfor National Unityand Growth
Oversight ofcountry’sdevelopmentagenda andmaintenance ofsustainablegrowth
MTP IIimplementedand GDPgrowth rate at5.7%
Oversight ofcountry’sdevelopmentagenda andmaintenance ofsustainablegrowth
Oversight ofcountry’sdevelopmentagenda andmaintenance ofsustainablegrowth
Oversight ofcountry’sdevelopmentagenda andmaintenance ofsustainablegrowth
Oversight ofcountry’sdevelopmentagenda andmaintenance ofsustainablegrowth
Administration Improved State Househospitality services
% of events serviced 100% 100% 100% 100% 100% 100%
One (1) femaleHospitality officerrecruited anddeployed
One (1) Officer One (1) Officer Optimal staffinglevels
Training ofstaff
Training of staff Training of staff
Improved infrastructurewithin State Houses andLodges
State Houses andState Lodgesrefurbished andmaintained
Three (3) StateHouses and 4State Lodges
Three (3) StateHouses and 4State Lodgesmaintained
Two (2) StateHouses and (3)State Lodges
Two (2) StateHouse and (2)State Lodges
Two (2) StateHouse and (2)State Lodges
Two (2) StateHouse and (2)State Lodges
Office of the 1st
LadyOffice of the 1st Lady’sprogrammesoperationalized
PURES Village PURESestablished andmentor andreward students
PURESestablishedand 532studentsmentored 282 students
rewarded
282 282 282 282
1st Lady halfmarathon
1 1 1 1 1 1

72
Programme Delivery Unit Key Outputs Key PerformanceIndicators
Target2015/16
ActualAchievement2015/16
Target(Baseline)
2016/17
Target2017/18
Target2018/19
Target2019/20
PSCU EffectiveCommunication ofPresidential Functionsand Information
PSCU Modernized(equipment andsystems)
Install Videoautomation anddigitalarchivingsystem
Videoautomation anddigitalarchivingsystem installed
Acquisition ofassortedequipment
Acquisition ofassortedequipment
Acquisition ofassortedequipment
Acquisition ofassortedequipment
% of Presidentialevents covered
100% 100% 100% 100% 100% 100%
Administration Officers recruitedand deployed (oneFemale)
One (1) officerrecruited anddeployed
Optimalstaffing levelsachieved
Training of staff Training ofstaff
Training of staff Training of staff
SP 2:Administrationof RetiredPresidentsBenefits
Office of theRetired Presidents
Available office spacefor the 2nd RetiredPresident
Office Block for the2nd Retired PresidentAcquired
One (1) officeblock
OperationalOffice
Continuousmaintenance
Continuousmaintenance
Continuousmaintenance
Continuousmaintenance
Improved infrastructure Refurbished 1stRetired President’sOffice
Refurbish theoffice
Refurbishedoffice
Continuousmaintenance
Continuousmaintenance
Continuousmaintenance
Continuousmaintenance
Office for Retired VicePresident
Office Block forRetired VicePresident Acquired
N/A N/A N/A OperationalOffice
Continuousmaintenance
Continuousmaintenance
Name of Programme: Deputy President ServicesProgramme Outcome: Efficient Policy Direction, Leadership, Coordination and Supervision of Government Operations For Attainment of Vision 2030
SP 1:Administration,Planning andSupportServices
Administration Fulfilment of theConstitutional Mandatesof the Deputy President
% DP’s Local,Regional andInternationalEngagementsEffectivelyFacilitated
100% 100% 100% 100% 100% 100%
Security enhancedthrough acquisition andfencing of Plot No.209/11540
Plot acquired andfenced
Gazettement ofplot
Kenya LandCommissionhas gazetted theplot forcompulsoryacquisition byGovernment onsecurity
4 commitmentpayments
Principalpayment madeand fencing ofplot
N/A N/A

73
Programme Delivery Unit Key Outputs Key PerformanceIndicators
Target2015/16
ActualAchievement2015/16
Target(Baseline)
2016/17
Target2017/18
Target2018/19
Target2019/20
grounds
Improved workenvironment
% completion ofworks at HarambeeHouse Annex
100%HarambeeHouse Annex
98% atHarambeeHouse Annex
100% Replacement ofVIP lift androof
Acquisition &installation ofsecurityequipment
Acquisition &installation ofsecurityequipment
Improved workenvironment
% completion ofworks at DP’sofficial residence(Mombasa)
Rehabilitationof old PChouse inMombasa 70%
40% 100% Fencing,landscaping &security houses
Fencing,landscaping &security houses
Fencing,landscaping &security houses
Improved workenvironment
% completion ofworks at DP’sofficial residence(Karen)
100% KarenResidence
98% 100% Modernconferencefacilities &securityequipment
Modernconferencefacilities &securityequipment
Modernconferencefacilities &securityequipment
Hospitality services forDP’s events provided
% of events serviced 100% 100% 100% 100% 100% 100%
Cabinet Committeemeetings and accuraterecommendations of theCommittees forwardedto Cabinet
No. of memorandaprepared
12 12 12 12 12 12
SP 2:Coordinationand Supervision
Legislative andIntergovernmentalLiaison Office(LILO)
Draft Bills from MDAssubmitted to Parliament
% of Bills receivedby ODP that aresubmitted toParliament
100% 100% 100% 100% 100% 100%
Legislative calendardeveloped and Billstracked
% of bills tracked 100% 100% 100% 100% 100% 100%
LILO & Strategyand Delivery Unit(SDU)
Collaboration ingovernment legislativeand policy-makingprocesses
No. of ConsultativeForums
12 12 12 12 12 12
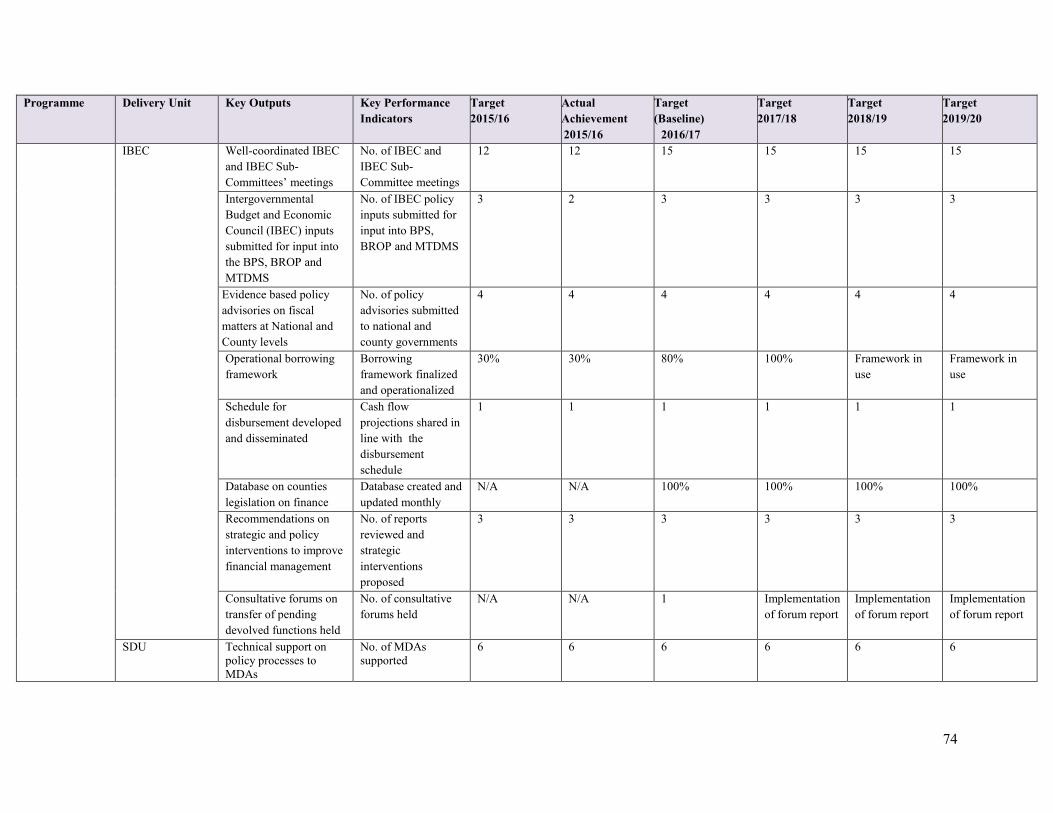
74
Programme Delivery Unit Key Outputs Key PerformanceIndicators
Target2015/16
ActualAchievement2015/16
Target(Baseline)
2016/17
Target2017/18
Target2018/19
Target2019/20
IBEC Well-coordinated IBECand IBEC Sub-Committees’ meetings
No. of IBEC andIBEC Sub-Committee meetings
12 12 15 15 15 15
IntergovernmentalBudget and EconomicCouncil (IBEC) inputssubmitted for input intothe BPS, BROP andMTDMS
No. of IBEC policyinputs submitted forinput into BPS,BROP and MTDMS
3 2 3 3 3 3
Evidence based policyadvisories on fiscalmatters at National andCounty levels
No. of policyadvisories submittedto national andcounty governments
4 4 4 4 4 4
Operational borrowingframework
Borrowingframework finalizedand operationalized
30% 30% 80% 100% Framework inuse
Framework inuse
Schedule fordisbursement developedand disseminated
Cash flowprojections shared inline with thedisbursementschedule
1 1 1 1 1 1
Database on countieslegislation on finance
Database created andupdated monthly
N/A N/A 100% 100% 100% 100%
Recommendations onstrategic and policyinterventions to improvefinancial management
No. of reportsreviewed andstrategicinterventionsproposed
3 3 3 3 3 3
Consultative forums ontransfer of pendingdevolved functions held
No. of consultativeforums held
N/A N/A 1 Implementationof forum report
Implementationof forum report
Implementationof forum report
SDU Technical support onpolicy processes toMDAs
No. of MDAssupported
6 6 6 6 6 6

75
Programme Delivery Unit Key Outputs Key PerformanceIndicators
Target2015/16
ActualAchievement2015/16
Target(Baseline)
2016/17
Target2017/18
Target2018/19
Target2019/20
SDU Presidency prioritypolicy coordinationreports
No. of reports 4 4 4 4 4 4
Food Security &RegionalIntegration(FSRI)
Value chain initiativescoordinated foragricultural andlivestock products
No. of value chaininitiativescoordinated
5 for crops 4 for crops 5 for crops 5 for crops 5 for crops 5 for crops3 for livestock 1 for livestock 3 for livestock 3 for livestock 3 for livestock 3 for livestock
FSRI Collaborative initiativesand partnerships inagriculture and livestockproduction
No. of collaborativeinitiatives andpartnershipsestablished
2 2 3 3 3 3
Office of the DP’sSpouse
Capacity of women builtthrough training
No. of womentrained on table-banking, livelihoodprojects, marketaccess,entrepreneurship andpublic procurementprocesses andopportunities
6,500 7,433 6,500 6,500 6,500 6,500
Office of the DP’sSpouse
Kenyan studentsaccessing scholarshipsKenyan students intertiary institutionsaccessing internshipopportunities
No. of scholarshipsand internshipopportunitiessourced for students
200 267 200 200 200 200
Communication Comprehensive mediacoverage of the DP’sevents
% of DP’s eventscovered
100% 100% 100% 100% 100% 100%
Modern equipment forthe DP’s Press Unit
No. of equipmentprocured
Assortedequipment
Nil Assortedequipment
Assortedequipment
Assortedequipment
Assortedequipment
ConflictManagement andPeace BuildingUnit
Implementation ofcommitments made inDP’s peace consultativeforums followed up
% of peacecommitmentsfollowed up
100% 100% 100% 100% 100% 100%
CMPBU Multi-stakeholderconsultative forums toaddress existing andemerging conflicts
No. of forumsconvened
4 3 4 4 4 4

76
Programme Delivery Unit Key Outputs Key PerformanceIndicators
Target2015/16
ActualAchievement2015/16
Target(Baseline)
2016/17
Target2017/18
Target2018/19
Target2019/20
Name of Programme: Cabinet AffairsName of Programme Outcome: Effective Cabinet Decisions For Harmonious Operations in Government
SP 1:Management ofCabinet Affairs
CabinetSecretariat
National SecurityAdvisory Committee(NSAC) meetings
No. of NSACmeetings facilitated
12 12 12 12 12 12
CabinetSecretariat
Cabinet Meetings PolicyMemoranda
No. of CabinetMeetings held andpolicy decisionsmade
48 48 48 52 52 52
KenyaInternationalBoundaries Office
Consultative initiativeson demarcation ofKenya’s internationalboundaries
No. of initiatives andstrategiesheld/initiated
5 5 12 36 36 36
Finance andAdministration
Consultative forumsbetween the governmentand private sector(Presidential RoundTables)
No. of PresidentialRound Tables held
1 2 2 1 1 1
GovernmentDigital PaymentsOffice
Increased uptake ofdigital payments
No. of MDAssensitized onGovernment DigitalPayments (GDP)
2 2 3 10 15 15
SP 2: AdvisoryServices onEconomic andSocial Affairs
PresidentialDelivery Unit
M&E and review reportson flagship projectsdelivery
No. of M&E andreviews undertakenon national flagshipprojects
15 8 8 15 17 17
StrategicInitiatives Office
Peace initiatives involatile regions/communities
No. of peacedialogue andengagementplatforms andworkshops held
5 5 12 24 24 24
National Valueand CohesionOffice
Annual Presidentialreport on national valuesand principles ofgovernance
No. of reports 1 1 1 1 1 1
National Valueand CohesionOffice
Awareness createdamong Ministries,Counties, Departmentsand Agencies (MCDAs)on National Values and
No. of MCDAssensitized
10 10 10 20 20 20

77
Programme Delivery Unit Key Outputs Key PerformanceIndicators
Target2015/16
ActualAchievement2015/16
Target(Baseline)
2016/17
Target2017/18
Target2018/19
Target2019/20
CohesionOffice of theNorthern Corridor
Timely implementationof northern corridorflagship projects
No. of flagshipprojects withinimplementationschedule
2 2 2 3 3 6
NationalEconomic andSocial Council(NESC)
Pilot study reporton blue economy
Pilot study reportprepared
1
Recommendations ofNESC meetings
No. of NESCmeetings
4 4 4 4 4 4
Name of Programme: Government Advisory ServicesProgramme Outcome: Effective Public Policy Advisory For Effective Management of Public Affairs
SP 1: StateCorporationsAdvisoryServices
StateCorporationsAdvisoryCommittee
Quarterly reports onPolicy advisory to StateCorporations
No. of policy reports 4 4 4 4 4 4
SP 2: KenyaSouth SudanAdvisoryServices
Kenya SouthSudan LiaisonOffice
Capacity buildingprovided to Governmentof South Sudan Officials
No. of officialstrained
300 919 919 1,000 1,200 1,500
SP 3: Power ofMercy AdvisoryServices
Power of MercyAdvisoryCommittee
Reports on hearings incorrectional facilities
No. of reports 1 1 1 1 1 1
Power of MercyAdvisoryCommittee
Sensitization forumsamongst convictedprisoners, leaders andgeneral public
No. of forums 3 5 21 31 36 39
SP 4:Coordination ofVision 2030
Vision 2030Advisory Office
Policy advisory reportson Vision 2030 flagshipprojects
No. of policyadvisory reportsprovided
4 4 4 4 4 4
SP 5: Counter-TerrorismAdvisoryServices
Counter-TerrorismAdvisoryCommittee
Strategic advisoryreports on counter-terrorism
No. of strategicadvisory reportsprovided
4 4 4 4 4 4
SP 6: EfficiencyMonitoring and
Inspectorate ofStateCorporations
Integrated StateCorporationsInformation
Operational ISCIMScomprising:
N/A N/A 25% 50% 75% 100%
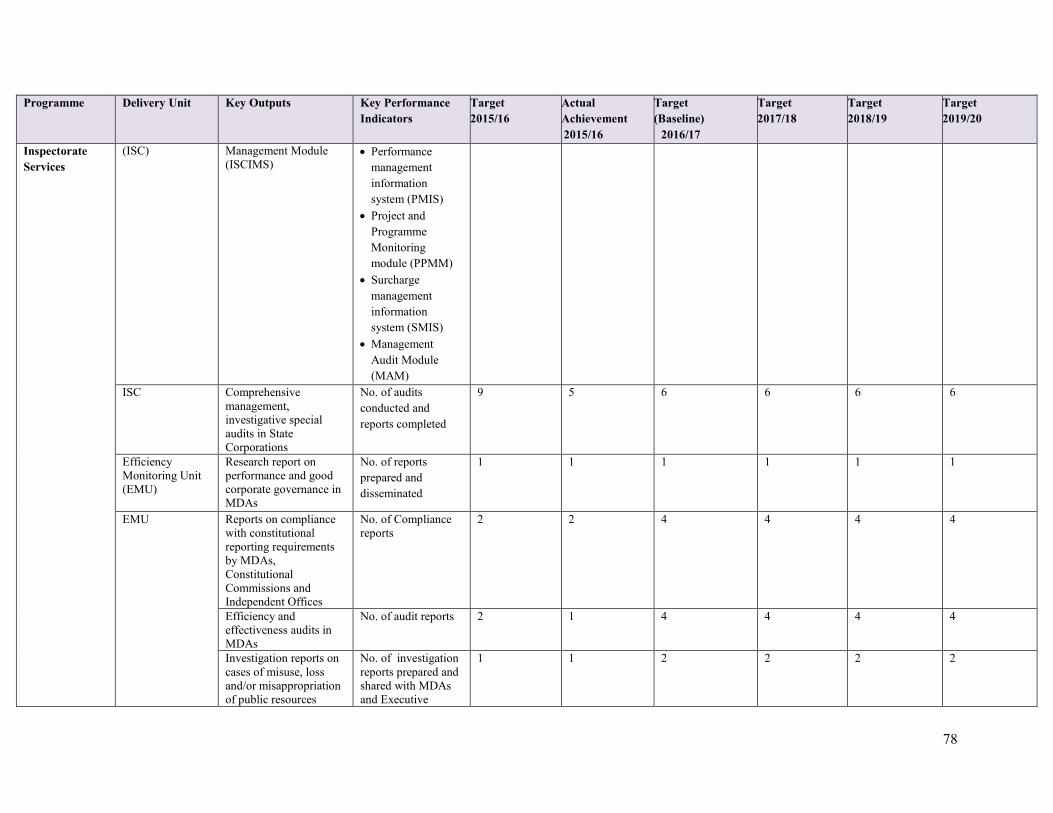
78
Programme Delivery Unit Key Outputs Key PerformanceIndicators
Target2015/16
ActualAchievement2015/16
Target(Baseline)
2016/17
Target2017/18
Target2018/19
Target2019/20
InspectorateServices
(ISC) Management Module(ISCIMS)
Performancemanagementinformationsystem (PMIS) Project and
ProgrammeMonitoringmodule (PPMM) Surcharge
managementinformationsystem (SMIS) Management
Audit Module(MAM)
ISC Comprehensivemanagement,investigative specialaudits in StateCorporations
No. of auditsconducted andreports completed
9 5 6 6 6 6
EfficiencyMonitoring Unit(EMU)
Research report onperformance and goodcorporate governance inMDAs
No. of reportsprepared anddisseminated
1 1 1 1 1 1
EMU Reports on compliancewith constitutionalreporting requirementsby MDAs,ConstitutionalCommissions andIndependent Offices
No. of Compliancereports
2 2 4 4 4 4
Efficiency andeffectiveness audits inMDAs
No. of audit reports 2 1 4 4 4 4
Investigation reports oncases of misuse, lossand/or misappropriationof public resources
No. of investigationreports prepared andshared with MDAsand Executive
1 1 2 2 2 2

79
Programme Delivery Unit Key Outputs Key PerformanceIndicators
Target2015/16
ActualAchievement2015/16
Target(Baseline)
2016/17
Target2017/18
Target2018/19
Target2019/20
State Department for Planning & StatisticsProgramme : Economic Policy and National Planning
Outcome: Improved economy and development planning
SP 1.1 Nationaland CountyEconomicPlanning andCoordinationServices
EconomicDevelopmentCoordinationDepartment(EDCD)
County PlanningServices provided
No. of countydevelopmentplanning officesestablished
47 0 47 47 - -
Revised CountyIntegratedDevelopment Planguidelines
- - 1 1 -
County annualDevelopment Planguidelines developedand disseminated
- - 1 - 1
Mid-Term CIDPReview Guidelines
1 1 - - 1 -
% of countiesprovided technicalassistance ondevelopmentplanning
100% 100% 100% 100% 100% 100%
CIDPS statuspreparation reviewreport
1 1 - - 1
No. of countyplanning unitstrained on Countydevelopmentplanning
- 47 47 47 -
SP 1.2CommunityDevelopment
EDCD andEnablersCoordinationDepartment
Communitydevelopment services
No. of assessmentReports produced
2 2 1 - - -
EnablersCoordinationDepartment
Coordination of SDGs No. of high levelsummit held(UNECOSOC/UNGA)
4 4 6 6 7 7

80
Programme Delivery Unit Key Outputs Key PerformanceIndicators
Target2015/16
ActualAchievement2015/16
Target(Baseline)
2016/17
Target2017/18
Target2018/19
Target2019/20
(ECD) Social infrastructurefacilities constructedunder SDGs
0 0 - 10 14 25
Forums on post 2015development agenda
4 4 10 15 15 15
SDGs status report - - - - 1 1No. of countiescovered on SDGsawareness andlocalization
- - 47 47 47 47
PALWECO Socio economicempowerment ofcommunities in westernKenya
No. of targetedbeneficiaries reachedunder each projectcomponent.
1500 1,680 2,000 - - -
Exit strategyprepared andimplemented
- - 1 - - -
No. of projectscompleted andoperational
40 33 30 - - -
NationalGovernment-CDF
Funded constituencyprojects/programmes
Amount of CDFMoney Disbursed(Kshs. Millions)
35,213 35,213 35,505 42,160 45,160 45,160
No. of CDF fundedprojects
SP 1.3Economic policyplanning andregionalintegration
Macro-EconomicPlanning andInternationalCooperation
Macroeconomic policiesand development plansdeveloped
No. of MTP II Mid-Term Review reportsprepared
1 0 1 - - -
No. of MTPIIIstakeholderconsultation forums
- - 47 1 - -
No. of third MTP2018-2022 preparedand disseminated
- - - 1 - -
No. of MTP IIISector Plansprepared anddisseminated
- - - 21

81
Programme Delivery Unit Key Outputs Key PerformanceIndicators
Target2015/16
ActualAchievement2015/16
Target(Baseline)
2016/17
Target2017/18
Target2018/19
Target2019/20
No. of MDAsofficers capacitybuilt on Modeling(T21)
35 35 35 35 35 35
No. of T21 Reportsprepared
1 1 1 1 1 1
Regional andInternational Economiccooperation
No. of Economiccooperation reports(TICAD, ACP/ACP-EU, ECOSOC,ECA, EAC, South-South and TriangularCooperationprepared
5 6 6 6 6 6
No. of RegionalEconomicIntegration agendaimplemented
3 3 3 3 3 3
NEPAD/APRMSecretariat
APRM Country Review 2nd Country ReviewReport prepared andtabled at AU Summit
- - 2nd CountryReview Reportprepared
- - -
No. of annualprogress report onimplementation ofAPRM national planof action
1 0 1 1 1 1
No. of NEPADprogrammesprogress reportprepared
1 1 1 1 1 1
SP 1.4 PolicyResearch
KIPPRA Public Policy Researchand Analysis reports
No. of policyResearch Papers andReports Preparedand disseminated
115
132
136 140 144 148
No. of Journal andInternationalWorking Paperspublished
16 12 16 17 17 18
Capacity building on No. of YoungProfessionals trained
12 12 12 12 12 12

82
Programme Delivery Unit Key Outputs Key PerformanceIndicators
Target2015/16
ActualAchievement2015/16
Target(Baseline)
2016/17
Target2017/18
Target2018/19
Target2019/20
Public PolicyFormulation
No. of Governmentand Private SectorOfficers Trained /capacity-built
870 791 831 872 916 961
SP 1.5SocioeconomicPolicy andPlanning
Social andGovernance
Socio-economiccoordination services
No of SRA oneprogress reports
4 4 4 4 4 4
No. of EEP progressreports
1 1 1 1 1 1
E-SIR system - - 1 - - -PPA basic andCounty reports
- - - - 48 -
8th and 9th KNHDR - - 1 - 1 -No of Social Pillarprogress reports
1 1 1 1 1 1
PovertyEradication Unit
Povertyreduction services
No of progressreports on povertyreduction initiatives
4 4 4 4 4 4
Infrastructure,ScienceTechnology&Innovations(IST&I)
Science Technology andInnovation (IST&I)services
No. of IST&Istakeholder forums
1 1 4 4 4 4
No of data basedeveloped/updatedon Kenyaninnovations
- - 1 1 1 1
No. of impactassessments visitsconducted andreports prepared anddisseminated
2 2 4 6 8 8
S.P 1.6PopulationManagementServices
NCPD National populationmanagement services
No. of Plans ofActions/policybriefs/documentsdeveloped toimplementPopulation Policy
27 27 23 18 17 17
No. of stakeholderscoordination forumsheld
18 18 25 12 10 6
Institutional legal Draft bill developed - - - 1

83
Programme Delivery Unit Key Outputs Key PerformanceIndicators
Target2015/16
ActualAchievement2015/16
Target(Baseline)
2016/17
Target2017/18
Target2018/19
Target2019/20
framework and M&Esystems
No. of PopulationData Centerestablished
- - - 1
Improved knowledgeand information base onpopulation issues
No of stakeholderstrained on PADIS
20 40 20 20 20 20
No. of researches onpopulation issuesconducted
2 2 2 2 1 1
No. of disseminationforums onpopulation Policies
11 12 11 11 11 11
Programme 2: National statistical information servicesOutcome: Enhanced evidence based decision making
SP 2.1 Surveys KNBS Statistical publicationsand reports
No. of AnnualStatisticalpublications andreports
33 33 33 33 33 33
SP 2.2 Censusand surveys
KNBS Surveys and censuses No. of Survey andcensuses reportsproduced anddisseminated(KCHSP)
22 15 22 22 22 22
Business register Updated businessregister
- - Updated businessregister
Updatedbusinessregister
- -
National Strategy for theDevelopment ofStatistics (NSDS)
Sector statisticsPlans;Consolidated NSDS
1 0 1 1 - -
Programme 3: Monitoring and Evaluation ServicesOutcome: Improved implementation of programmes, projects and strategies
SP 3.1 NationalIntegratedMonitoring andEvaluation
Monitoring andEvaluationDepartment(MED)
Integrated Monitoringand Evaluation system
No. of M&E onlineSystems modulesdeveloped in MDAs& Counties
2 2 71 - - -
National M&EPolicy prepared anddisseminated
- - - - - -
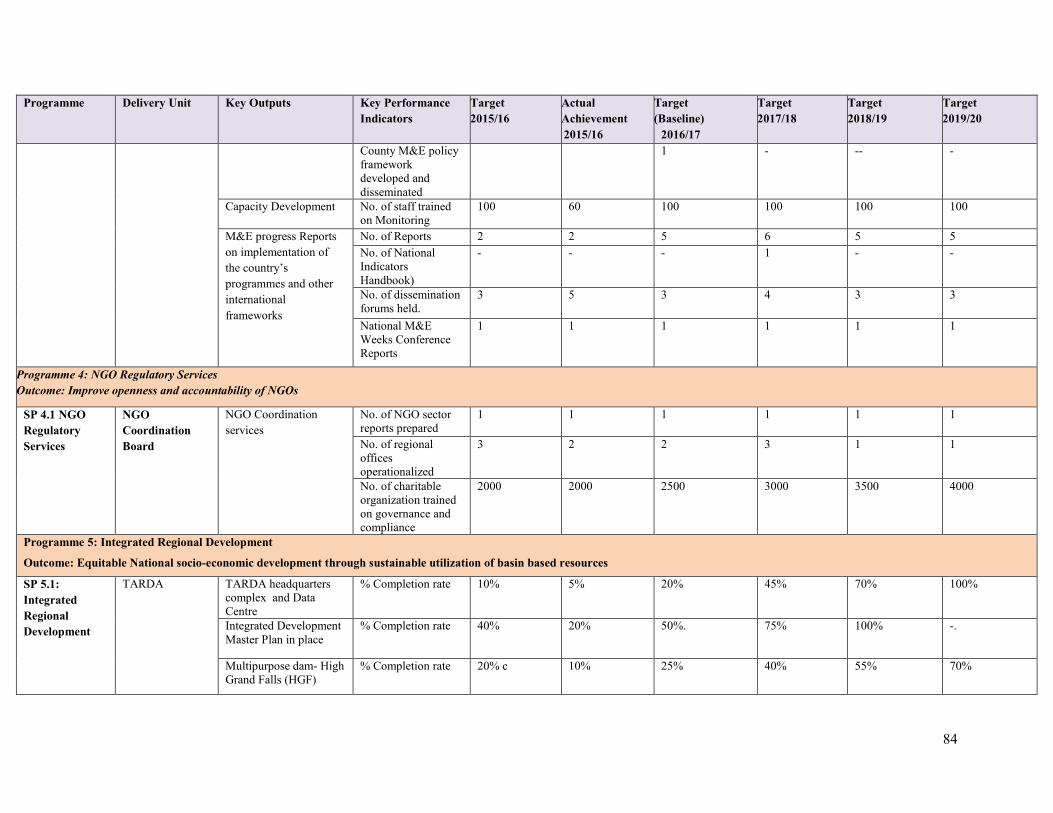
84
Programme Delivery Unit Key Outputs Key PerformanceIndicators
Target2015/16
ActualAchievement2015/16
Target(Baseline)
2016/17
Target2017/18
Target2018/19
Target2019/20
County M&E policyframeworkdeveloped anddisseminated
1 - -- -
Capacity Development No. of staff trainedon Monitoring
100 60 100 100 100 100
M&E progress Reportson implementation ofthe country’sprogrammes and otherinternationalframeworks
No. of Reports 2 2 5 6 5 5No. of NationalIndicatorsHandbook)
- - - 1 - -
No. of disseminationforums held.
3 5 3 4 3 3
National M&EWeeks ConferenceReports
1 1 1 1 1 1
Programme 4: NGO Regulatory ServicesOutcome: Improve openness and accountability of NGOs
SP 4.1 NGORegulatoryServices
NGOCoordinationBoard
NGO Coordinationservices
No. of NGO sectorreports prepared
1 1 1 1 1 1
No. of regionalofficesoperationalized
3 2 2 3 1 1
No. of charitableorganization trainedon governance andcompliance
2000 2000 2500 3000 3500 4000
Programme 5: Integrated Regional Development
Outcome: Equitable National socio-economic development through sustainable utilization of basin based resources
SP 5.1:IntegratedRegionalDevelopment
TARDA TARDA headquarterscomplex and DataCentre
% Completion rate 10% 5% 20% 45% 70% 100%
Integrated DevelopmentMaster Plan in place
% Completion rate 40% 20% 50%. 75% 100% -.
Multipurpose dam- HighGrand Falls (HGF)
% Completion rate 20% c 10% 25% 40% 55% 70%

85
Programme Delivery Unit Key Outputs Key PerformanceIndicators
Target2015/16
ActualAchievement2015/16
Target(Baseline)
2016/17
Target2017/18
Target2018/19
Target2019/20
Tana Delta RiceIrrigation Project
No. of Ha under riceproduction
1,200 300 1,200 2,400 4,000 6,000
No. of rice tonnesproduced
3,600 1,000 - - 12,000 18,000
Multipurpose dam-Munyu dam
% Completion rate 5 3 5 10 25 40
Irrigation scheme-Murang’a IntegratedProgramme
No. of Ha underirrigation
- - 300 2000 2700 -
No. of Householdswith water access 500 3000 4000 5000
Multipurpose dams-Kieni IntegratedProgramme
% Completion rate 20% 10% 25 % 35% 70% 100%
Improved Masinga DamResort to three-star
% Completion rate 40 30 40 50 60 70
Kerio ValleyDevelopmentAuthority(KVDA)
Weiwei Integratedproject Phase IIIIrrigation of 325ha. forfood security
% Completion rate 10 10 50 90 100
Production of treeseedlings forconservation(Greengrowth)
No. of tree seedlingsraised
150,000 200,000 - 100,000 120,000 150,000
Pasture Development(Chemeron,Chesongoch)
No. of tonnes ofgrass seed produced
8 10 15 25 35 50
Livestock improvement(Nomotio,Chesongoch)
No. of breedsimproved
115 110 150 200 250 300
Cereal seed production No. of Cereal seedTonnes produced
900 1,000 1,000 1,000 1,000 1,000
Honey production No. of Honeyprocessingequipmentpurchased andoperational
- - 1 - - -
No. of tonnes ofhoney purchased
38 38.5 32 35 40 45
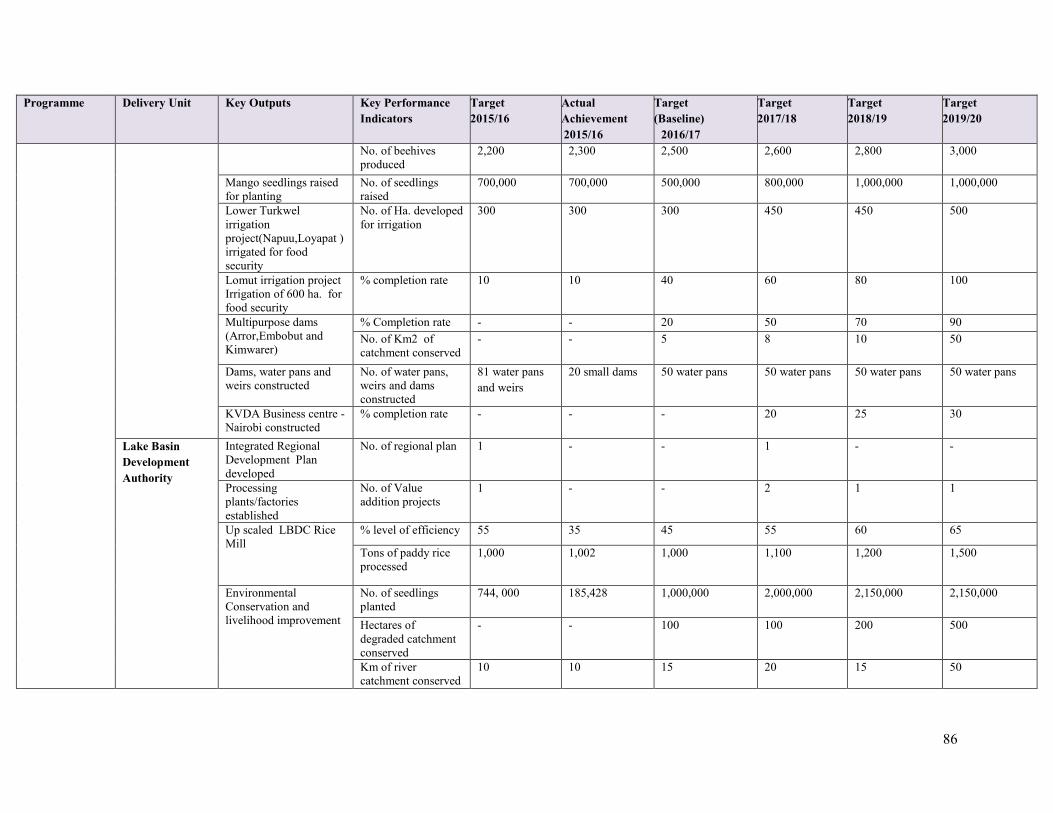
86
Programme Delivery Unit Key Outputs Key PerformanceIndicators
Target2015/16
ActualAchievement2015/16
Target(Baseline)
2016/17
Target2017/18
Target2018/19
Target2019/20
No. of beehivesproduced
2,200 2,300 2,500 2,600 2,800 3,000
Mango seedlings raisedfor planting
No. of seedlingsraised
700,000 700,000 500,000 800,000 1,000,000 1,000,000
Lower Turkwelirrigationproject(Napuu,Loyapat )irrigated for foodsecurity
No. of Ha. developedfor irrigation
300 300 300 450 450 500
Lomut irrigation projectIrrigation of 600 ha. forfood security
% completion rate 10 10 40 60 80 100
Multipurpose dams(Arror,Embobut andKimwarer)
% Completion rate - - 20 50 70 90No. of Km2 ofcatchment conserved
- - 5 8 10 50
Dams, water pans andweirs constructed
No. of water pans,weirs and damsconstructed
81 water pansand weirs
20 small dams 50 water pans 50 water pans 50 water pans 50 water pans
KVDA Business centre -Nairobi constructed
% completion rate - - - 20 25 30
Lake BasinDevelopmentAuthority
Integrated RegionalDevelopment Plandeveloped
No. of regional plan 1 - - 1 - -
Processingplants/factoriesestablished
No. of Valueaddition projects
1 - - 2 1 1
Up scaled LBDC RiceMill
% level of efficiency 55 35 45 55 60 65
Tons of paddy riceprocessed
1,000 1,002 1,000 1,100 1,200 1,500
EnvironmentalConservation andlivelihood improvement
No. of seedlingsplanted
744, 000 185,428 1,000,000 2,000,000 2,150,000 2,150,000
Hectares ofdegraded catchmentconserved
- - 100 100 200 500
Km of rivercatchment conserved
10 10 15 20 15 50
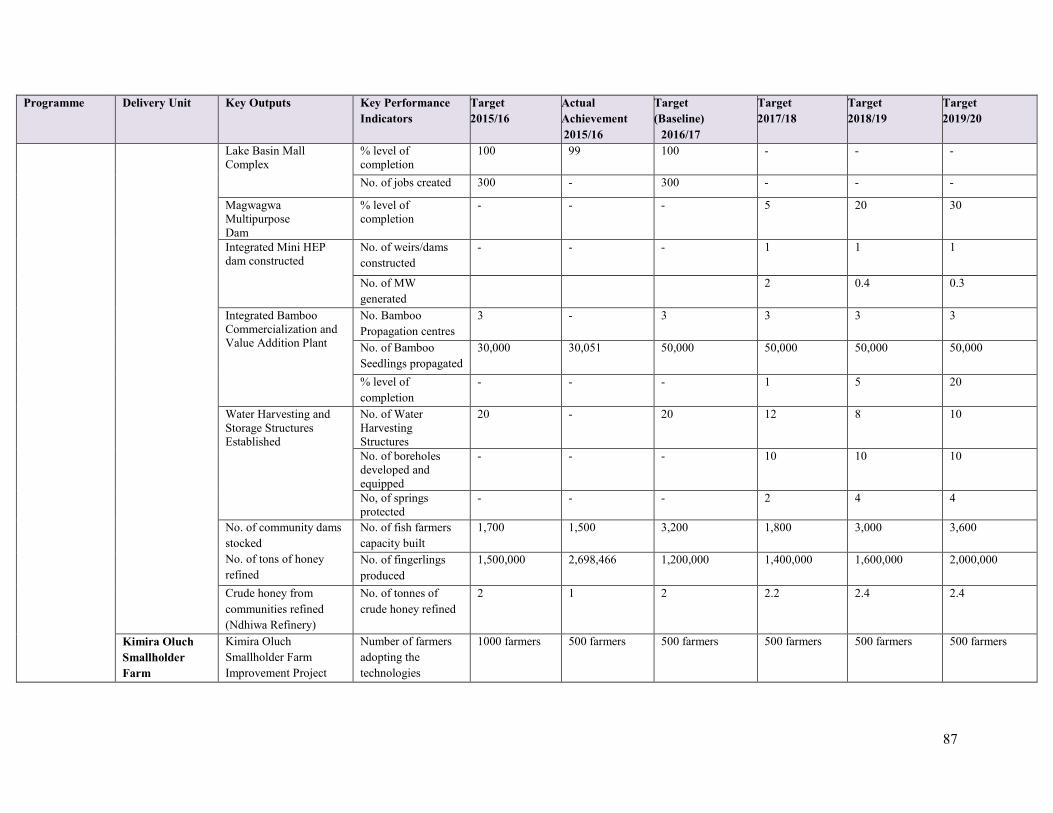
87
Programme Delivery Unit Key Outputs Key PerformanceIndicators
Target2015/16
ActualAchievement2015/16
Target(Baseline)
2016/17
Target2017/18
Target2018/19
Target2019/20
Lake Basin MallComplex
% level ofcompletion
100 99 100 - - -
No. of jobs created 300 - 300 - - -
MagwagwaMultipurposeDam
% level ofcompletion
- - - 5 20 30
Integrated Mini HEPdam constructed
No. of weirs/damsconstructed
- - - 1 1 1
No. of MWgenerated
2 0.4 0.3
Integrated BambooCommercialization andValue Addition Plant
No. BambooPropagation centres
3 - 3 3 3 3
No. of BambooSeedlings propagated
30,000 30,051 50,000 50,000 50,000 50,000
% level ofcompletion
- - - 1 5 20
Water Harvesting andStorage StructuresEstablished
No. of WaterHarvestingStructures
20 - 20 12 8 10
No. of boreholesdeveloped andequipped
- - - 10 10 10
No, of springsprotected
- - - 2 4 4
No. of community damsstockedNo. of tons of honeyrefined
No. of fish farmerscapacity built
1,700 1,500 3,200 1,800 3,000 3,600
No. of fingerlingsproduced
1,500,000 2,698,466 1,200,000 1,400,000 1,600,000 2,000,000
Crude honey fromcommunities refined(Ndhiwa Refinery)
No. of tonnes ofcrude honey refined
2 1 2 2.2 2.4 2.4
Kimira OluchSmallholderFarm
Kimira OluchSmallholder FarmImprovement Project
Number of farmersadopting thetechnologies
1000 farmers 500 farmers 500 farmers 500 farmers 500 farmers 500 farmers
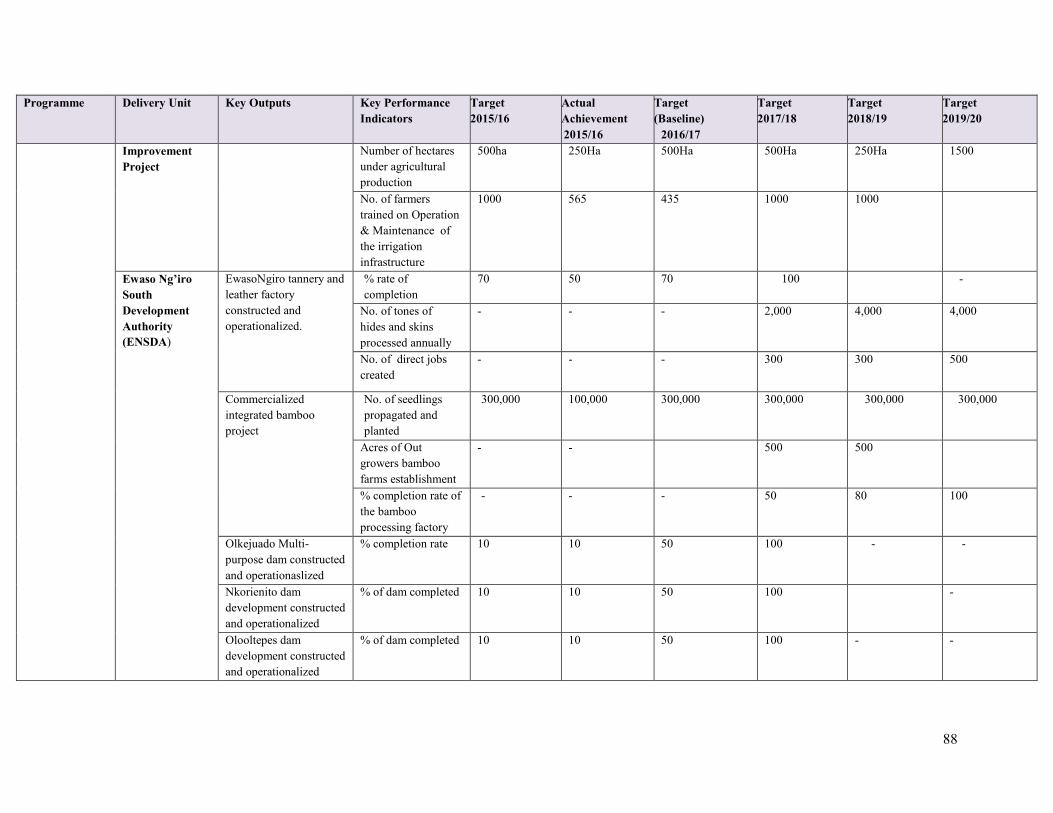
88
Programme Delivery Unit Key Outputs Key PerformanceIndicators
Target2015/16
ActualAchievement2015/16
Target(Baseline)
2016/17
Target2017/18
Target2018/19
Target2019/20
ImprovementProject
Number of hectaresunder agriculturalproduction
500ha 250Ha 500Ha 500Ha 250Ha 1500
No. of farmerstrained on Operation& Maintenance ofthe irrigationinfrastructure
1000 565 435 1000 1000
Ewaso Ng’iroSouthDevelopmentAuthority(ENSDA)
EwasoNgiro tannery andleather factoryconstructed andoperationalized.
% rate ofcompletion
70 50 70 100 -
No. of tones ofhides and skinsprocessed annually
- - - 2,000 4,000 4,000
No. of direct jobscreated
- - - 300 300 500
Commercializedintegrated bambooproject
No. of seedlingspropagated andplanted
300,000 100,000 300,000 300,000 300,000 300,000
Acres of Outgrowers bamboofarms establishment
- - 500 500
% completion rate ofthe bambooprocessing factory
- - - 50 80 100
Olkejuado Multi-purpose dam constructedand operationaslized
% completion rate 10 10 50 100 - -
Nkorienito damdevelopment constructedand operationalized
% of dam completed 10 10 50 100 -
Olooltepes damdevelopment constructedand operationalized
% of dam completed 10 10 50 100 - -

89
Programme Delivery Unit Key Outputs Key PerformanceIndicators
Target2015/16
ActualAchievement2015/16
Target(Baseline)
2016/17
Target2017/18
Target2018/19
Target2019/20
Suswa-Magadicatchment arearehabilitated.
No of Ha of landrehabilitated andconserved
- - - 1,000 2,000 2,000
No.of check Dam sconstructed
- - - 1 1
No. of communitymembers sensitized
- - - 200 200 200
Lower EwasoMultipurpose damconstructed
% completion ofcascaded dam
- - 5 50 70 100
Constructed Waterharvesting and storagedams.
No. of damscompleted
- - - 3 2
Ewaso NyiroNorthDevelopmentAuthority
Gum Arabic and ResinsIntegrated Factorycompleted andoperational
% of completion andoperationalization ofthe factory
20 10 60 80 100
% of completion ofcollection facilities
- - 20 80 100
No. of tonnes of gumand resins processed
- - - 10,000 20,000
Ewaso Ng’iro NorthIntegrated Camel Milkfactory completed
% completion andoperationalization ofthe 10million litrescapacity camel milkprocessing factoryand collectionfacilities
15 10 10 60 80 100
- % completion ofcamel milk supplychain development
10 10 10 20 60 100
Ewaso Ngíro North riverCatchment and riparianareas conserved andrehabilitated
No. of tree seedlingplanted.
200,000 250,000 200,000 200,000 200,000 200,000
No. of Ha ofcatchment and
2 2.5 2 2 2 2
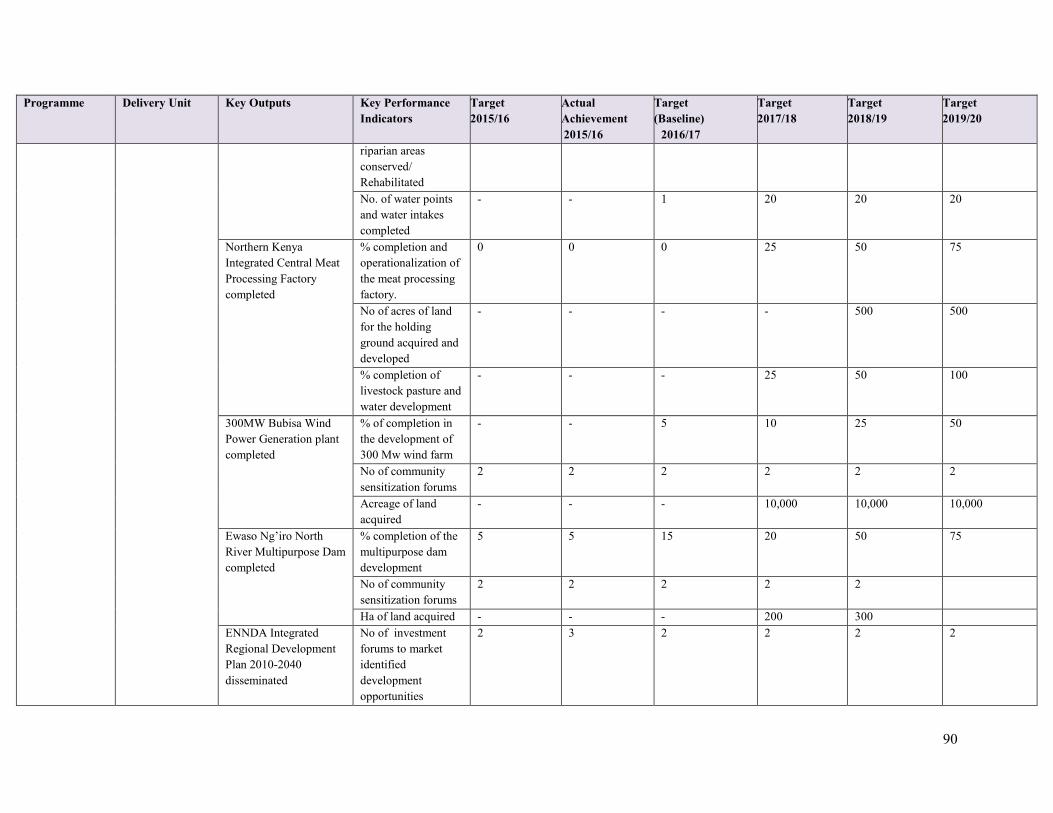
90
Programme Delivery Unit Key Outputs Key PerformanceIndicators
Target2015/16
ActualAchievement2015/16
Target(Baseline)
2016/17
Target2017/18
Target2018/19
Target2019/20
riparian areasconserved/RehabilitatedNo. of water pointsand water intakescompleted
- - 1 20 20 20
Northern KenyaIntegrated Central MeatProcessing Factorycompleted
% completion andoperationalization ofthe meat processingfactory.
0 0 0 25 50 75
No of acres of landfor the holdingground acquired anddeveloped
- - - - 500 500
% completion oflivestock pasture andwater development
- - - 25 50 100
300MW Bubisa WindPower Generation plantcompleted
% of completion inthe development of300 Mw wind farm
- - 5 10 25 50
No of communitysensitization forums
2 2 2 2 2 2
Acreage of landacquired
- - - 10,000 10,000 10,000
Ewaso Ng’iro NorthRiver Multipurpose Damcompleted
% completion of themultipurpose damdevelopment
5 5 15 20 50 75
No of communitysensitization forums
2 2 2 2 2
Ha of land acquired - - - 200 300ENNDA IntegratedRegional DevelopmentPlan 2010-2040disseminated
No of investmentforums to marketidentifieddevelopmentopportunities
2 3 2 2 2 2
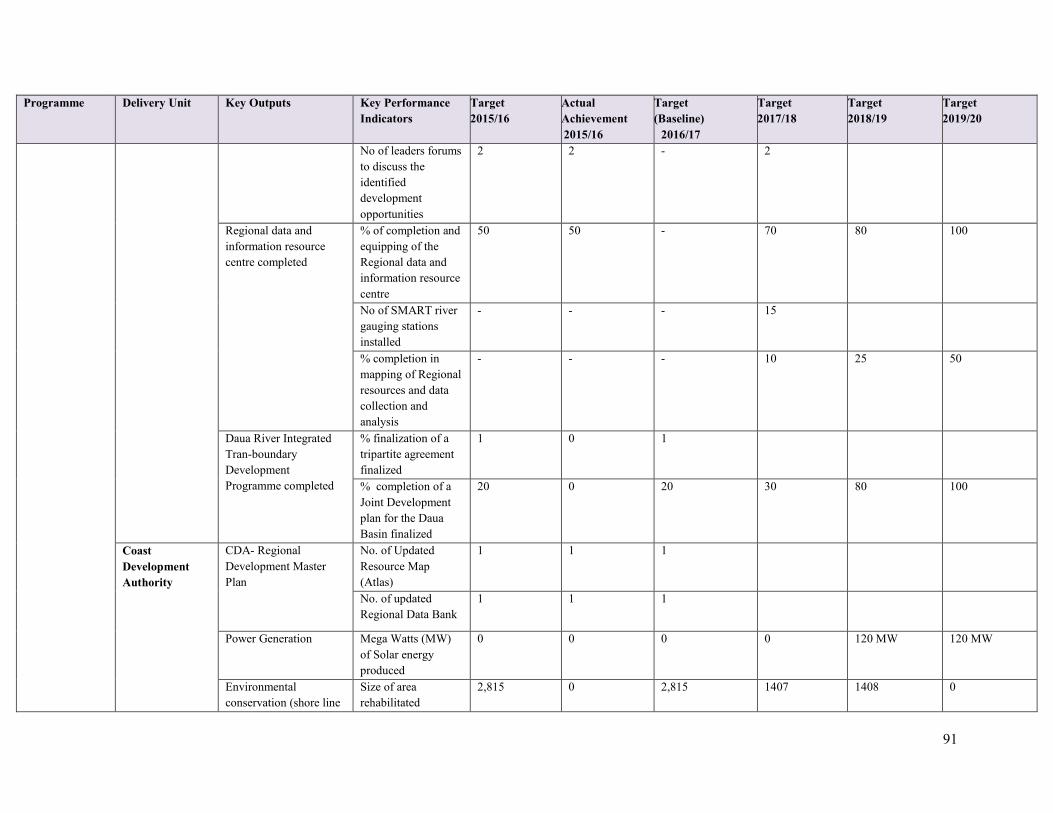
91
Programme Delivery Unit Key Outputs Key PerformanceIndicators
Target2015/16
ActualAchievement2015/16
Target(Baseline)
2016/17
Target2017/18
Target2018/19
Target2019/20
No of leaders forumsto discuss theidentifieddevelopmentopportunities
2 2 - 2
Regional data andinformation resourcecentre completed
% of completion andequipping of theRegional data andinformation resourcecentre
50 50 - 70 80 100
No of SMART rivergauging stationsinstalled
- - - 15
% completion inmapping of Regionalresources and datacollection andanalysis
- - - 10 25 50
Daua River IntegratedTran-boundaryDevelopmentProgramme completed
% finalization of atripartite agreementfinalized
1 0 1
% completion of aJoint Developmentplan for the DauaBasin finalized
20 0 20 30 80 100
CoastDevelopmentAuthority
CDA- RegionalDevelopment MasterPlan
No. of UpdatedResource Map(Atlas)
1 1 1
No. of updatedRegional Data Bank
1 1 1
Power Generation Mega Watts (MW)of Solar energyproduced
0 0 0 0 120 MW 120 MW
Environmentalconservation (shore line
Size of arearehabilitated
2,815 0 2,815 1407 1408 0

92
Programme Delivery Unit Key Outputs Key PerformanceIndicators
Target2015/16
ActualAchievement2015/16
Target(Baseline)
2016/17
Target2017/18
Target2018/19
Target2019/20
and roof catchments)-KCCAP Project
No. of litres of cleanwater provided
120000 0 120000 120000 0 0
SMEs capacityDevelopment-KenyaCoastal DevelopmentProgramme
No. of SMEs trained 200 383 200
No. of business plans 200 138 200
Revival of Cashew nutIndustry and MineralExploration &Exploitation
No. of jobs created 0 0 0 1.5M 1.5M 1.5MNo. of seedlingsplanted
- - - 300,000 1.5 million 3 million
Multipurpose dams % completion rate 10% 5% 10% 20% 30% 100%
Water Supply m3 0 0 0 0 186,000Size of ha conserved 0 0 0 0 20,000
Programme 6: General Administration Planning and Support ServicesOutcome: Improved and efficient administrative, financial and planning support services
SP 6.1 HumanResource andSupportServices
Administration Administrative Services No of NationalCohesion andNational Valuesprogress reports
1 1 1 1 1 1
SP 6.2 FinancialManagementServices
Administration Financial ManagementServices
Timely release ofresources to allspending units in theMinistry
Timely releaseof resources toall spendingunits in theMinistry
Timely releaseof resources toall spendingunits in theMinistry
Timely release ofresources to allspending units inthe Ministry
Timely releaseof resources toall spendingunits in theMinistry
Timely releaseof resources toall spendingunits in theMinistry
Timely releaseof resources toall spendingunits in theMinistry
SP 6.3InformationCommunicationServices
Administration Information andCommunicationServices
Inventory System fortracking assetsdeveloped
- - Inventory Systemfor tracking assetsdeveloped
- - -
EDMS (ElectronicDocumentManagementSystems) developed
- - EDMS(ElectronicDocumentManagementSystems)developed
- - -
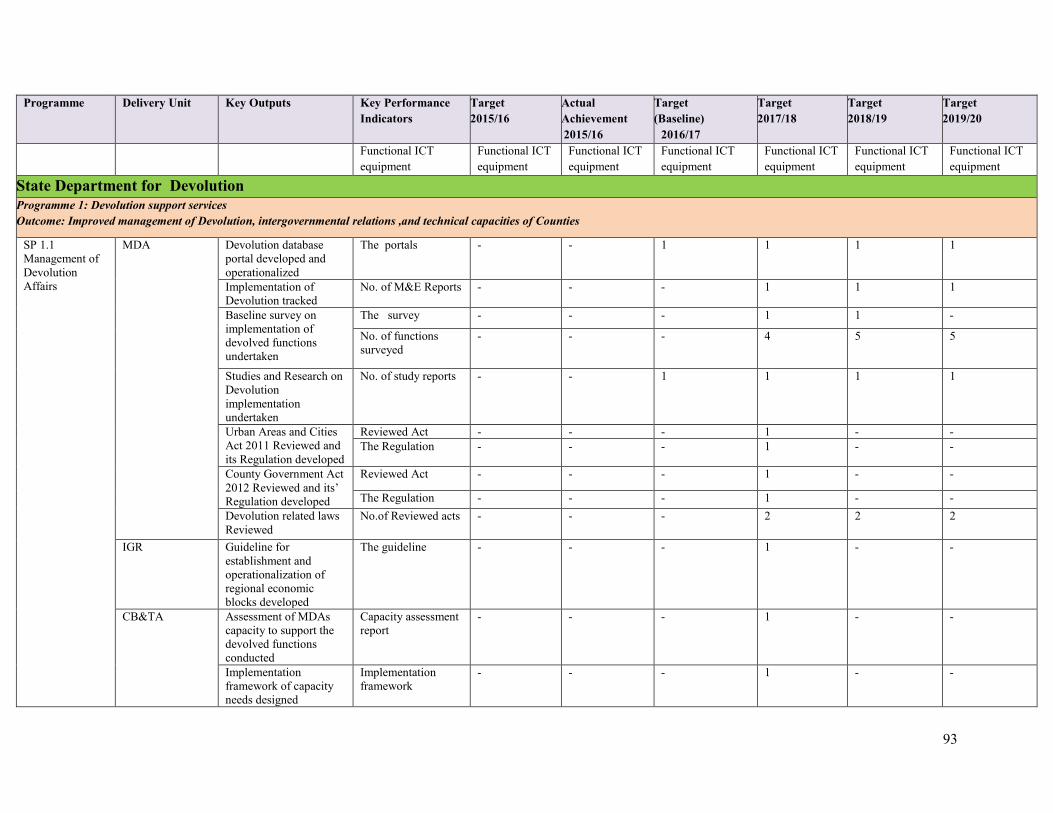
93
Programme Delivery Unit Key Outputs Key PerformanceIndicators
Target2015/16
ActualAchievement2015/16
Target(Baseline)
2016/17
Target2017/18
Target2018/19
Target2019/20
Functional ICTequipment
Functional ICTequipment
Functional ICTequipment
Functional ICTequipment
Functional ICTequipment
Functional ICTequipment
Functional ICTequipment
State Department for DevolutionProgramme 1: Devolution support servicesOutcome: Improved management of Devolution, intergovernmental relations ,and technical capacities of Counties
SP 1.1Management ofDevolutionAffairs
MDA Devolution databaseportal developed andoperationalized
The portals - - 1 1 1 1
Implementation ofDevolution tracked
No. of M&E Reports - - - 1 1 1
Baseline survey onimplementation ofdevolved functionsundertaken
The survey - - - 1 1 -
No. of functionssurveyed
- - - 4 5 5
Studies and Research onDevolutionimplementationundertaken
No. of study reports - - 1 1 1 1
Urban Areas and CitiesAct 2011 Reviewed andits Regulation developed
Reviewed Act - - - 1 - -The Regulation - - - 1 - -
County Government Act2012 Reviewed and its’Regulation developed
Reviewed Act - - - 1 - -
The Regulation - - - 1 - -Devolution related lawsReviewed
No.of Reviewed acts - - - 2 2 2
IGR Guideline forestablishment andoperationalization ofregional economicblocks developed
The guideline - - - 1 - -
CB&TA Assessment of MDAscapacity to support thedevolved functionsconducted
Capacity assessmentreport
- - - 1 - -
Implementationframework of capacityneeds designed
Implementationframework
- - - 1 - -

94
Programme Delivery Unit Key Outputs Key PerformanceIndicators
Target2015/16
ActualAchievement2015/16
Target(Baseline)
2016/17
Target2017/18
Target2018/19
Target2019/20
Donor support toDevolution programmestracked
M&E reports - - - 2 2 2
Training on Donorsupport programmesconducted
No.of trainings - - - 1 1 1
CoG CoG affairs Facilitated No.of meetings ofCoG sectoral workingcommittees
72 72 72 72 72 72
No.of CoG Councilmeetings
2 2 2 2 2 2
The Devolutionconference
1 1 1 1 1 1
No.of regional andGlobal forumsparticipated in
3 3 3 3 3 3
SP 1.2: Capacitybuilding andTechnicalassistance
CB&TA Training of MDAs onDevolution conducted
No. of MDAs - - - 20 20 20
Induction training ofcounty executives andassemblies conducted
No of counties - - - 47 - -
Civic education onDevolution Conducted
No. of Countiescovered
25 10 10 47 47 47
Knowledge sharingplatforms on Devolutionorganized
No. of platforms - - - 5 5 5
Peer to peer learningconducted
No.of forums - - 2 5 5 5
Devolution anddecentralizedgovernance Center ofExcellence Supported
The centre - - - 1 1 1
IGR Participation in national,regional and globaldevolution/ LocalGovernment forumsenhanced
No. of forums 3 5 5 5 5 5
CB&TA Public participationlegislation finalized
The legislation - - 1 1 - -
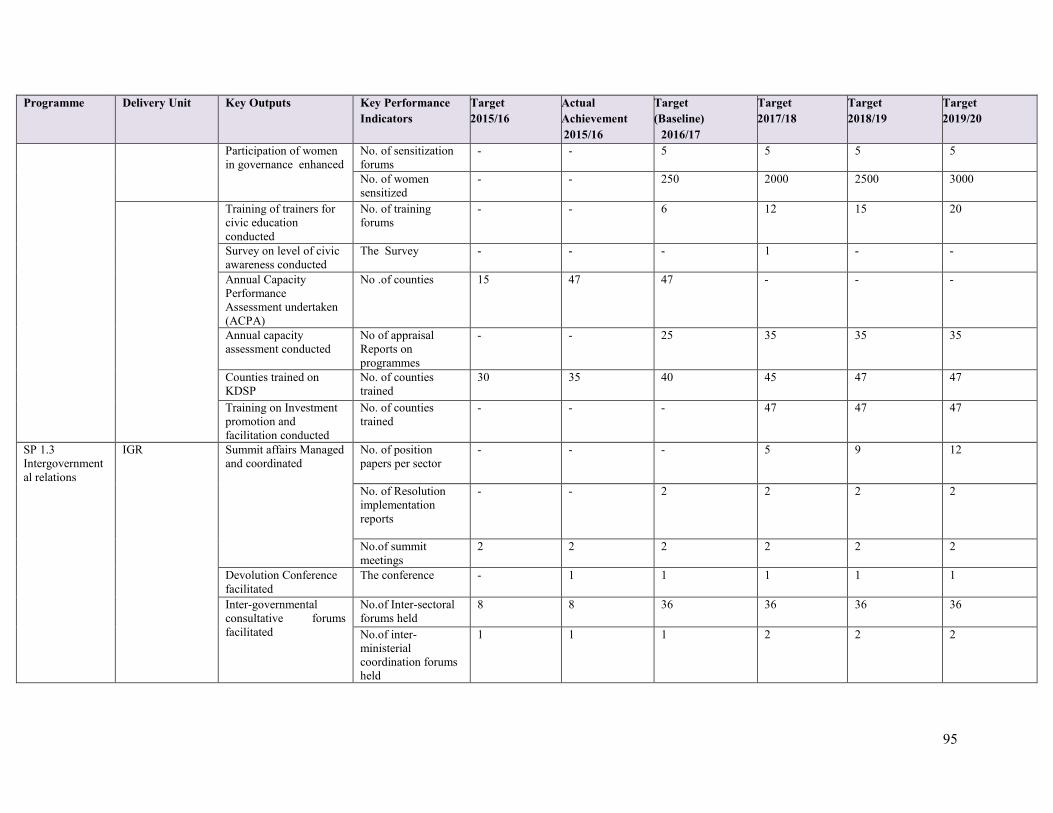
95
Programme Delivery Unit Key Outputs Key PerformanceIndicators
Target2015/16
ActualAchievement2015/16
Target(Baseline)
2016/17
Target2017/18
Target2018/19
Target2019/20
Participation of womenin governance enhanced
No. of sensitizationforums
- - 5 5 5 5
No. of womensensitized
- - 250 2000 2500 3000
Training of trainers forcivic educationconducted
No. of trainingforums
- - 6 12 15 20
Survey on level of civicawareness conducted
The Survey - - - 1 - -
Annual CapacityPerformanceAssessment undertaken(ACPA)
No .of counties 15 47 47 - - -
Annual capacityassessment conducted
No of appraisalReports onprogrammes
- - 25 35 35 35
Counties trained onKDSP
No. of countiestrained
30 35 40 45 47 47
Training on Investmentpromotion andfacilitation conducted
No. of countiestrained
- - - 47 47 47
SP 1.3Intergovernmental relations
IGR Summit affairs Managedand coordinated
No. of positionpapers per sector
- - - 5 9 12
No. of Resolutionimplementationreports
- - 2 2 2 2
No.of summitmeetings
2 2 2 2 2 2
Devolution Conferencefacilitated
The conference - 1 1 1 1 1
Inter-governmentalconsultative forumsfacilitated
No.of Inter-sectoralforums held
8 8 36 36 36 36
No.of inter-ministerialcoordination forumsheld
1 1 1 2 2 2

96
Programme Delivery Unit Key Outputs Key PerformanceIndicators
Target2015/16
ActualAchievement2015/16
Target(Baseline)
2016/17
Target2017/18
Target2018/19
Target2019/20
No. of Inter-sectorcoordination forumsheld
- - - 2 2 2
No. of disputesarbitrated (ADROperationalized)
- - - 10 10 10
IntergovernmentalSteering Committeefacilitated
No.of meetings held - - - 4 4 4No. follow upreports
- - - 4 4 4
IGRTC IGTRC affairs facilitated No.of summitmeetings
2 2 2 2 2 2
No.of consultativeforums held
2 2 2 3 3 3
No. of reports oncompetencyassignment andfunctional analysisfor state corporations
- - - 3 3 3
Public Asset andLiabilities auditreports
- - - 48 - -
No. of M&E reports - - - 4 4 4IGRTC Assets and Liabilities of
defunct local authoritiesAudited
Audit Report - - - 1 1 -
Programme 2: General Administration, Planning and Support ServicesProgramme Outcome: Efficient and Effective Services
SP 2.1Administrationand SupportServices
ADM Improved governance No. of meetings heldon governance
- - 2 4 4 4
ISO certification No. of internal auditreports
- - 2 1 - -
Knowledge onleadership andawareness on nationalvalues enhanced
No. of staffsensitized
- - 40 45 45 50
Procurement Asset registerEstablished/updated
Asset register 1 1 1 1 1 1
HRM Employee satisfactionsurvey conducted
The survey report - - - 1 1 1
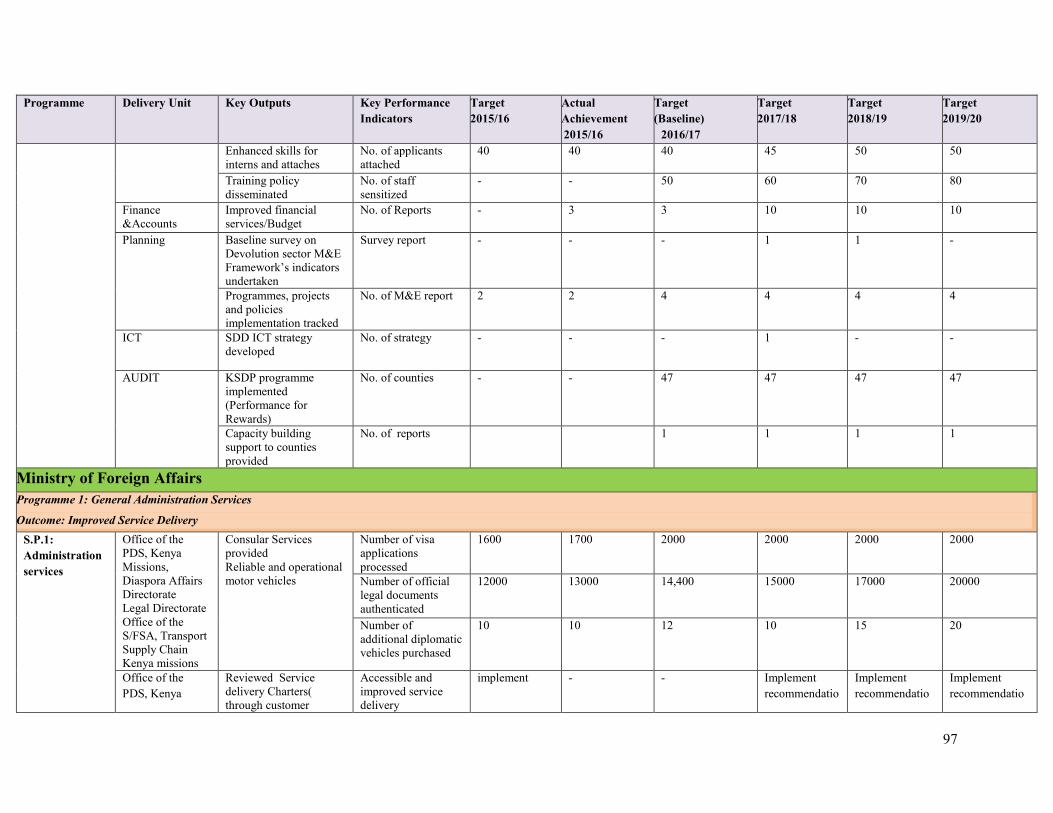
97
Programme Delivery Unit Key Outputs Key PerformanceIndicators
Target2015/16
ActualAchievement2015/16
Target(Baseline)
2016/17
Target2017/18
Target2018/19
Target2019/20
Enhanced skills forinterns and attaches
No. of applicantsattached
40 40 40 45 50 50
Training policydisseminated
No. of staffsensitized
- - 50 60 70 80
Finance&Accounts
Improved financialservices/Budget
No. of Reports - 3 3 10 10 10
Planning Baseline survey onDevolution sector M&EFramework’s indicatorsundertaken
Survey report - - - 1 1 -
Programmes, projectsand policiesimplementation tracked
No. of M&E report 2 2 4 4 4 4
ICT SDD ICT strategydeveloped
No. of strategy - - - 1 - -
AUDIT KSDP programmeimplemented(Performance forRewards)
No. of counties - - 47 47 47 47
Capacity buildingsupport to countiesprovided
No. of reports 1 1 1 1
Ministry of Foreign AffairsProgramme 1: General Administration Services
Outcome: Improved Service DeliveryS.P.1:Administrationservices
Office of thePDS, KenyaMissions,Diaspora AffairsDirectorateLegal DirectorateOffice of theS/FSA, TransportSupply ChainKenya missions
Consular ServicesprovidedReliable and operationalmotor vehicles
Number of visaapplicationsprocessed
1600 1700 2000 2000 2000 2000
Number of officiallegal documentsauthenticated
12000 13000 14,400 15000 17000 20000
Number ofadditional diplomaticvehicles purchased
10 10 12 10 15 20
Office of thePDS, Kenya
Reviewed Servicedelivery Charters(through customer
Accessible andimproved servicedelivery
implement - - Implementrecommendatio
Implementrecommendatio
Implementrecommendatio

98
Programme Delivery Unit Key Outputs Key PerformanceIndicators
Target2015/16
ActualAchievement2015/16
Target(Baseline)
2016/17
Target2017/18
Target2018/19
Target2019/20
Missions, SFSA,HRM, CPPMD
surveys) ns ns ns
Coordinate Staff/Attaches in Missionsabroad
officers posted inStaffing levels inMissions
Posting officers Posting officers inKey Missions
Posting officersin KeyMissions
Posting officersin Key Missions
Posting officersin Key Missions
Report on Monitoringimplementation ofStrategic Plan
Review report Reviewed SP Reviewed SP Implementation implementation Revised SPdeveloped-2018/19-2023/24
Implementationof revised SP
ISO 9001:2008 Improved servicedelivery
ISOcertification
QMS finalized Finalize QMS andAudits done
ImplementQMS and ISOcertification
ImplementQMS and ISOcertification
ImplementQMS and ISOcertification
Office of theS/FSA, SupplyChain, FinanceKenya missions
ICT policy developedand implemented
ICT policy in placeand implemented
Develop policy Draft Policy Finalize andlaunch policy
Implementation Implementation Implementation
Wide Area Network(WAN) betweenMinistry headquarterand Diplomatic Missions
Number ofdiplomatic Missionsconnected toheadquarters
2 2 (Geneva andBrussels)
31 15 All All
Private VSAT network Number ofDiplomatic Missions
0 0 10 15 15 All
IFMIS in DiplomaticMissionsMinistry global website
Improved financialmanagement
- - - 20 20 15
Website developed Developwebsite
- - Websitedeveloped andupdated
Websitedeveloped andupdated
Websitedeveloped andupdated
IP telephony in missions Efficientcommunicationplatform
- Brussels - 15 Missions 15 Missions 15 Missions
Programme 2: Foreign Relations and Diplomacy
Outcome: Enhanced foreign relations and diplomatic engagementS.P 2.1 :Internationalrelations andcooperation
Office of thePDS, PublicAffairs &Communication,Kenya Missions
New Missions opened Number of NewMissions andConsulates opened
7 2 9 3 3 3
Multiple accreditation Number of Missionsaccredited
All missions - - 20 20 16
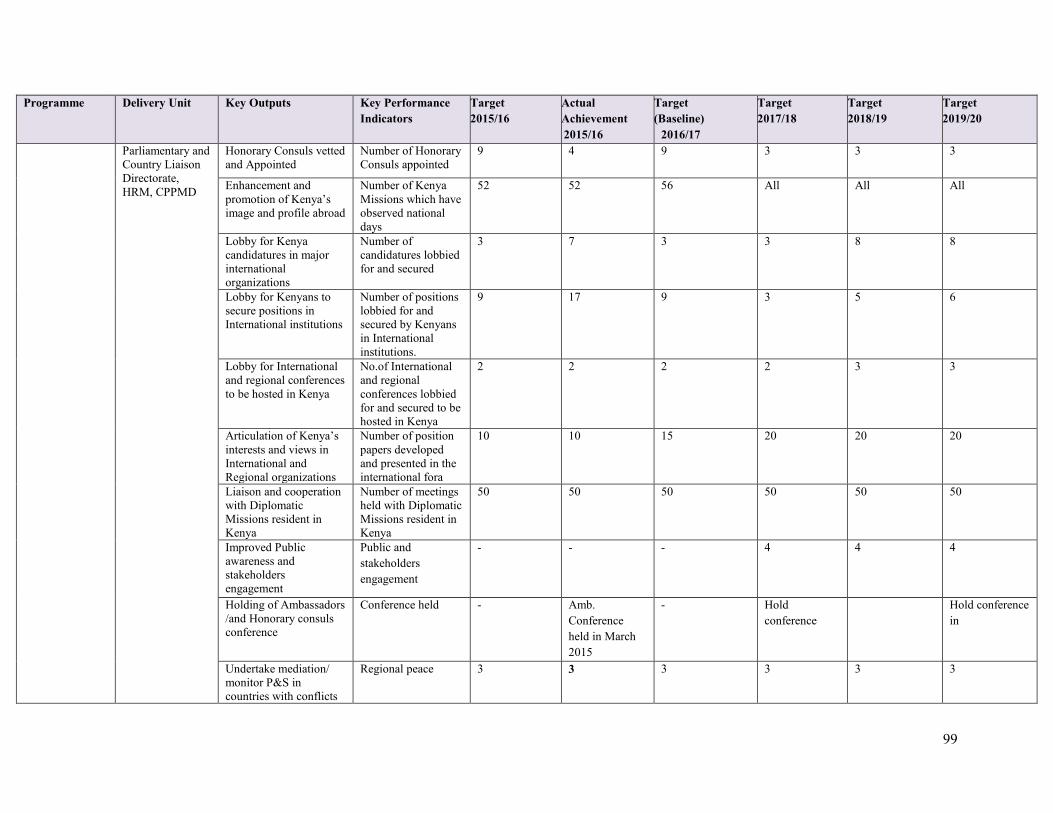
99
Programme Delivery Unit Key Outputs Key PerformanceIndicators
Target2015/16
ActualAchievement2015/16
Target(Baseline)
2016/17
Target2017/18
Target2018/19
Target2019/20
Parliamentary andCountry LiaisonDirectorate,HRM, CPPMD
Honorary Consuls vettedand Appointed
Number of HonoraryConsuls appointed
9 4 9 3 3 3
Enhancement andpromotion of Kenya’simage and profile abroad
Number of KenyaMissions which haveobserved nationaldays
52 52 56 All All All
Lobby for Kenyacandidatures in majorinternationalorganizations
Number ofcandidatures lobbiedfor and secured
3 7 3 3 8 8
Lobby for Kenyans tosecure positions inInternational institutions
Number of positionslobbied for andsecured by Kenyansin Internationalinstitutions.
9 17 9 3 5 6
Lobby for Internationaland regional conferencesto be hosted in Kenya
No.of Internationaland regionalconferences lobbiedfor and secured to behosted in Kenya
2 2 2 2 3 3
Articulation of Kenya’sinterests and views inInternational andRegional organizations
Number of positionpapers developedand presented in theinternational fora
10 10 15 20 20 20
Liaison and cooperationwith DiplomaticMissions resident inKenya
Number of meetingsheld with DiplomaticMissions resident inKenya
50 50 50 50 50 50
Improved Publicawareness andstakeholdersengagement
Public andstakeholdersengagement
- - - 4 4 4
Holding of Ambassadors/and Honorary consulsconference
Conference held - Amb.Conferenceheld in March2015
- Holdconference
Hold conferencein
Undertake mediation/monitor P&S incountries with conflicts
Regional peace 3 3 3 3 3 3

100
Programme Delivery Unit Key Outputs Key PerformanceIndicators
Target2015/16
ActualAchievement2015/16
Target(Baseline)
2016/17
Target2017/18
Target2018/19
Target2019/20
Under take BorderCommissions meetings
Meetings /sessionsheld
3-Ethiopia,Tanzania,Uganda
3 3 4 4 4
Enhancing Nairobi as acenter for Environmentaldiplomacy
Nairobi enhanced asa diplomatic hub
UNEP officesupgraded
UNEP officesupgraded
Nairobi enhancedas a diplomatichub
Nairobienhanced as adiplomatic hub
Nairobienhanced as adiplomatic hub
Nairobienhanced as adiplomatic hub
Appointment of SpecialEnvoy (SE) and SpecialRepresentatives (SR)
Improved diplomaticengagement
- - - 5 5 5
Framework on culturaldiplomacy office
Enhanced culturaldiplomacy
Operationalizeoffice ofculturaldiplomacy
Officeoperationalized
Officeoperationalized
Frameworkimplemented
Frameworkimplemented
Frameworkimplemented
Sensitizationworkshops/Forums onMinistry policies
Informationdissemination
Sensitizationforums
Sensitizationforums held inselectedcounties
Sensitizationforums incounties
Sensitizationforums held
Sensitizationforums held
Sensitizationforums held
Political Auditsundertaken
Audits done andimplementation ofrecommendations
- - 4 5 5 5
Establish a KnowledgeManagement Unit
Improve KnowledgeManagement andInformation Sharing
- - - Established andoperationalized
Established andoperationalized
Established andoperationalized
Bilateral cooperationframework coordinated
Coordinate bilateralcooperationframeworks
3 3 3 2 2 3
Implementation ofbilateral cooperationagreements and MOUS
Agreementsimplemented
Agreementsimplemented
Agreementsimplemented
Agreementsimplemented
Agreementsimplemented
Agreementsimplemented
Agreementsimplemented
Peace and Securityinitiatives
Coordinate/participate in P& S mediation
P&S meetingsattended
P&S meetingsattended
P&S meetingsattended
P&S meetingsattended
P&S meetingsattended
P&S meetingsattended
International /Regionalmeetings and forumscoordinated
Meeting coordinated Conferencesand meetingsattended
Conferencesand meetingsattended
Conferences andmeetings attended
Conferencesand meetingsattended
Conferences andmeetingsattended
Conferences andmeetingsattended
Subscriptions toorganizations
Enhance Kenyaimage
Subscriptionpaid
Subscriptionpaid
Subscription paid Subscriptionpaid
Subscriptionpaid
Subscriptionpaid
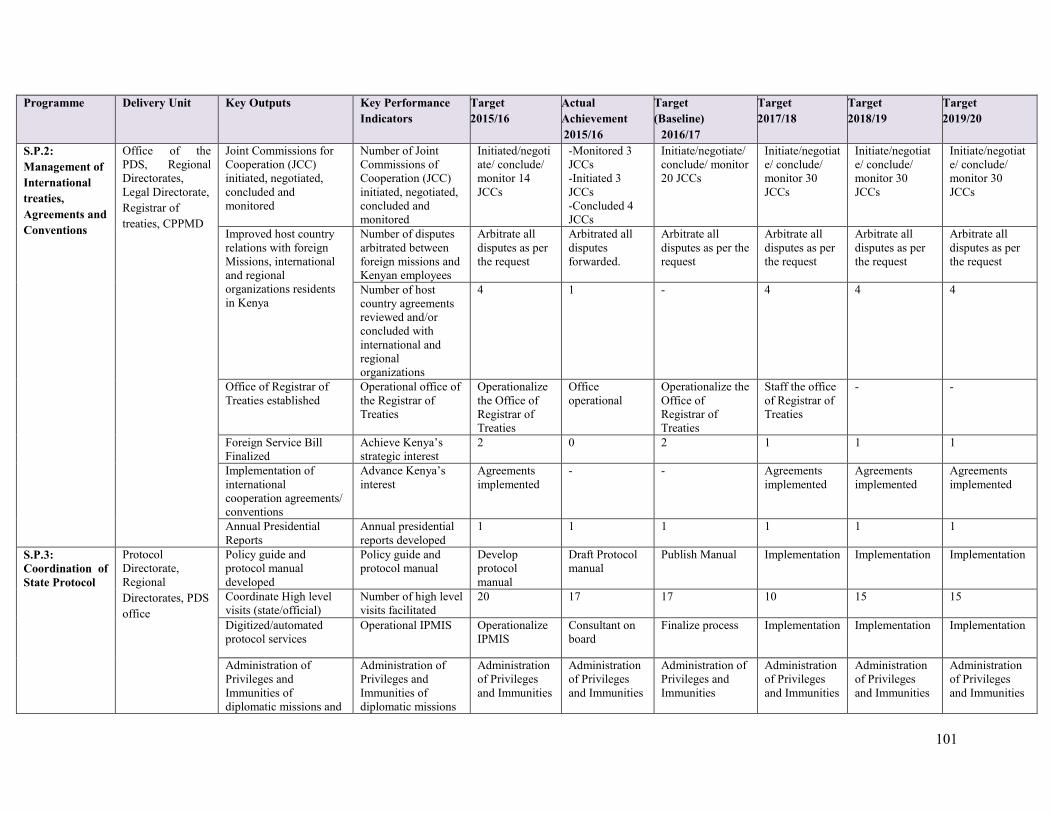
101
Programme Delivery Unit Key Outputs Key PerformanceIndicators
Target2015/16
ActualAchievement2015/16
Target(Baseline)
2016/17
Target2017/18
Target2018/19
Target2019/20
S.P.2:Management ofInternationaltreaties,Agreements andConventions
Office of thePDS, RegionalDirectorates,Legal Directorate,Registrar oftreaties, CPPMD
Joint Commissions forCooperation (JCC)initiated, negotiated,concluded andmonitored
Number of JointCommissions ofCooperation (JCC)initiated, negotiated,concluded andmonitored
Initiated/negotiate/ conclude/monitor 14JCCs
-Monitored 3JCCs-Initiated 3JCCs-Concluded 4JCCs
Initiate/negotiate/conclude/ monitor20 JCCs
Initiate/negotiate/ conclude/monitor 30JCCs
Initiate/negotiate/ conclude/monitor 30JCCs
Initiate/negotiate/ conclude/monitor 30JCCs
Improved host countryrelations with foreignMissions, internationaland regionalorganizations residentsin Kenya
Number of disputesarbitrated betweenforeign missions andKenyan employees
Arbitrate alldisputes as perthe request
Arbitrated alldisputesforwarded.
Arbitrate alldisputes as per therequest
Arbitrate alldisputes as perthe request
Arbitrate alldisputes as perthe request
Arbitrate alldisputes as perthe request
Number of hostcountry agreementsreviewed and/orconcluded withinternational andregionalorganizations
4 1 - 4 4 4
Office of Registrar ofTreaties established
Operational office ofthe Registrar ofTreaties
Operationalizethe Office ofRegistrar ofTreaties
Officeoperational
Operationalize theOffice ofRegistrar ofTreaties
Staff the officeof Registrar ofTreaties
- -
Foreign Service BillFinalized
Achieve Kenya’sstrategic interest
2 0 2 1 1 1
Implementation ofinternationalcooperation agreements/conventions
Advance Kenya’sinterest
Agreementsimplemented
- - Agreementsimplemented
Agreementsimplemented
Agreementsimplemented
Annual PresidentialReports
Annual presidentialreports developed
1 1 1 1 1 1
S.P.3:Coordination ofState Protocol
ProtocolDirectorate,RegionalDirectorates, PDSoffice
Policy guide andprotocol manualdeveloped
Policy guide andprotocol manual
Developprotocolmanual
Draft Protocolmanual
Publish Manual Implementation Implementation Implementation
Coordinate High levelvisits (state/official)
Number of high levelvisits facilitated
20 17 17 10 15 15
Digitized/automatedprotocol services
Operational IPMIS OperationalizeIPMIS
Consultant onboard
Finalize process Implementation Implementation Implementation
Administration ofPrivileges andImmunities ofdiplomatic missions and
Administration ofPrivileges andImmunities ofdiplomatic missions
Administrationof Privilegesand Immunities
Administrationof Privilegesand Immunities
Administration ofPrivileges andImmunities
Administrationof Privilegesand Immunities
Administrationof Privilegesand Immunities
Administrationof Privilegesand Immunities

102
Programme Delivery Unit Key Outputs Key PerformanceIndicators
Target2015/16
ActualAchievement2015/16
Target(Baseline)
2016/17
Target2017/18
Target2018/19
Target2019/20
Internationalorganizations
and Internationalorganizations
Consular servicesrelating to embassies,ITOs and Agencies inKenya
Facilitate operationsfor IOs
Consularservicesprovided
Consularservicesprovided
Consular servicesprovided
Consularservicesprovided
Consularservicesprovided
Consularservicesprovided
S.P 2.4 :Management ofDiaspora andConsularAffairs
Office of thePDS,Diaspora AffairsDirectorate,Kenya Missions
Effective engagementwith the KenyanDiaspora
Updated data-baseon Kenyan Diasporain place
Update Updated Update Update Update Update
Operational Diasporaweb portal
OperationalDiaspora webportal
OperationalDiaspora webportal
OperationalDiaspora webportal
OperationalDiaspora webportal
OperationalDiaspora webportal
OperationalDiaspora webportal
Evacuations in casesof emergency
Kenyansevacuated
Kenyansevacuated
Kenyansevacuated
Kenyansevacuated
Kenyansevacuated
Kenyansevacuated
Consular Assistanceto Kenyan Diasporain Distress
ConsularAssistanceprovided toKenyan
ConsularAssistanceprovided toKenyan
ConsularAssistanceprovided toKenyan
ConsularAssistanceprovided toKenyan
ConsularAssistanceprovided toKenyan
ConsularAssistanceprovided toKenyan
Diaspora InvestmentConferences andexpos in Kenya &abroad
1 2 2 1 1 1
Kenya’s labour forcePromoted internationallyi.e. migrant workers andexpatriates
Number of labouragreementsinitiated/concluded
2 2 5 3 3 3
S.P 2.5:Infrastructuredevelopmentandmaintenance
Office of thePDS, KenyaMissions, AssetManagement,SFSA
RefurbishedGovernment buildings inmissions
Number ofrefurbishedGovernmentbuildings in missions
16 16 23 26 26 26
Chanceries and officialresidence purchased
No. of Chanceriesand officialresidence purchased
1 1 1 3 2 2
Chanceries and officialresidence constructed
No. of Chanceriesand officialresidenceconstructed
0 2 2 2 2 2
Refurbished MinistryHeadquarter
Number of floorsrefurbished
4 2 2 2 - -

103
Programme Delivery Unit Key Outputs Key PerformanceIndicators
Target2015/16
ActualAchievement2015/16
Target(Baseline)
2016/17
Target2017/18
Target2018/19
Target2019/20
Construct MinistryHeadquarter
Ministry headquarterconstructed
Procureconsultant,Design andDocumentation
Advertised forconsultant
Acquire/Purchaseland
Acquire/Purchase land
Commenceconstructionworks
Continue withconstructionworks
Land for Diplomaticenclave
Identification of landfor Diplomaticenclave
- - - Land identifiedand procured
Allocation toMissions
Allocation toMission
Branding of chanceriesand residences as part ofcultural diplomacy
Promote culturaldiplomacy
Promotionalactivities done
Promotionalactivities done
Promotionalactivities done
Promotionalactivities done
Programme 3: Economic and Commercial Diplomacy
Outcome: Increased Trade and Foreign Direct Investments
S.P 3.1EconomicCooperationandCommercialDiplomacy
Office of thePDS, Economicand CommercialDiplomacyKenya Missions,RegionalDirectorates,Public Affairs &Communication
Joint trade committeeforums
Number of tradecommittees held
3 4 4 3 3 3
Trade and investmentMissions
Number of missionsfacilitated
3 7 7 8 8 8
Business/investmentforums
Number of Forumsheld
3 7 7 8 8 8
Economic and tradepolicy analysis
Studies developed - - - 1 1 1
follow up of Multilateralcooperation aspectsunder SGDs( Goal 17)
Implementation ofSDGs
- - - Implementationof SDGs
Implementationof SDGs
Implementationof SDGs
Economic and tradeadvisory services
Advisory servicesgiven
Advisoryservices
Advisoryservices
Advisory services Advisoryservices
Advisoryservices
Advisoryservices
Sub-Programme3.2:Regionalintegration,bilateral andMultilateral
Economic andCommercialDiplomacyDirectorate, PDSoffice, Legal,Missions
Coordinate Tradenegotiations at the WTOlevel
Number ofnegotiation forumscoordinated
10 12 12 15 15 15
Promotion ofMultilateral TradeRelations
Integration of Kenyato multilateral trade
Engagementsundertaken atMultilaterallevel
Engagementsundertaken atMultilaterallevel
Engagementsundertaken atMultilaterallevel
Engagementsundertaken atMultilaterallevel
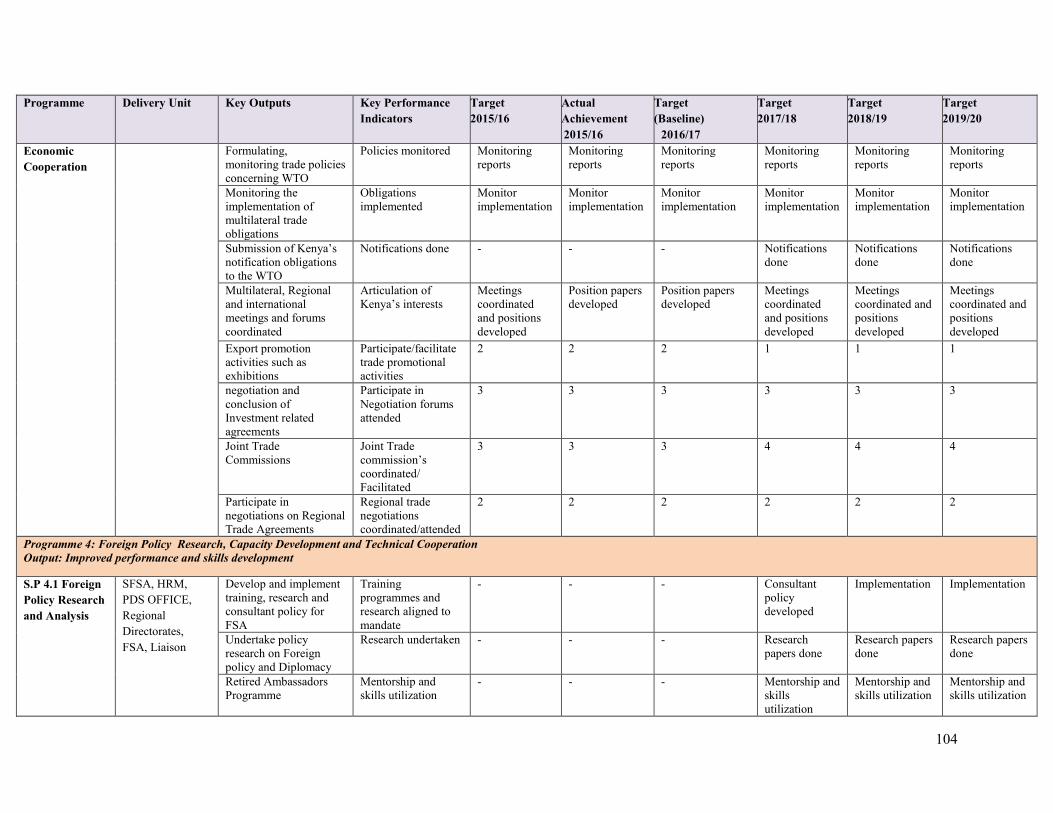
104
Programme Delivery Unit Key Outputs Key PerformanceIndicators
Target2015/16
ActualAchievement2015/16
Target(Baseline)
2016/17
Target2017/18
Target2018/19
Target2019/20
EconomicCooperation
Formulating,monitoring trade policiesconcerning WTO
Policies monitored Monitoringreports
Monitoringreports
Monitoringreports
Monitoringreports
Monitoringreports
Monitoringreports
Monitoring theimplementation ofmultilateral tradeobligations
Obligationsimplemented
Monitorimplementation
Monitorimplementation
Monitorimplementation
Monitorimplementation
Monitorimplementation
Monitorimplementation
Submission of Kenya’snotification obligationsto the WTO
Notifications done - - - Notificationsdone
Notificationsdone
Notificationsdone
Multilateral, Regionaland internationalmeetings and forumscoordinated
Articulation ofKenya’s interests
Meetingscoordinatedand positionsdeveloped
Position papersdeveloped
Position papersdeveloped
Meetingscoordinatedand positionsdeveloped
Meetingscoordinated andpositionsdeveloped
Meetingscoordinated andpositionsdeveloped
Export promotionactivities such asexhibitions
Participate/facilitatetrade promotionalactivities
2 2 2 1 1 1
negotiation andconclusion ofInvestment relatedagreements
Participate inNegotiation forumsattended
3 3 3 3 3 3
Joint TradeCommissions
Joint Tradecommission’scoordinated/Facilitated
3 3 3 4 4 4
Participate innegotiations on RegionalTrade Agreements
Regional tradenegotiationscoordinated/attended
2 2 2 2 2 2
Programme 4: Foreign Policy Research, Capacity Development and Technical CooperationOutput: Improved performance and skills development
S.P 4.1 ForeignPolicy Researchand Analysis
SFSA, HRM,PDS OFFICE,RegionalDirectorates,FSA, Liaison
Develop and implementtraining, research andconsultant policy forFSA
Trainingprogrammes andresearch aligned tomandate
- - - Consultantpolicydeveloped
Implementation Implementation
Undertake policyresearch on Foreignpolicy and Diplomacy
Research undertaken - - - Researchpapers done
Research papersdone
Research papersdone
Retired AmbassadorsProgramme
Mentorship andskills utilization
- - - Mentorship andskillsutilization
Mentorship andskills utilization
Mentorship andskills utilization

105
Programme Delivery Unit Key Outputs Key PerformanceIndicators
Target2015/16
ActualAchievement2015/16
Target(Baseline)
2016/17
Target2017/18
Target2018/19
Target2019/20
Colloquiums andthematic discussions
Colloquiums held - - - Colloquiumsheld
Colloquiumsheld
Colloquiumsheld
Strategic Collaboration,partnership andnetworking
Enhanced training Enhancecollaboration
Variouscollaborationinitiatives inplace
Collaborationwith variousinstitutions
Collaborationwith variousinstitutions
Collaborationwith variousinstitutions
Collaborationwith variousinstitutions
Capacity on foreignpolicy, trade negotiation,leadership and protocolmatters developed andtraining for diplomats inthe region
Number of officerstrained and trainingprogrammes forparliament andcounty governmentsheld
Train officersand diplomatsin the regionalon diplomacy,tradenegotiation andmediation
The Ministrytrained officersin SLDP, SMC,diplomacy,tradenegotiation,mediation anddiplomats in theregion
Train officers anddiplomats in theregional ondiplomacy, tradenegotiation andmediation
Train officersand diplomatsin the regionalon diplomacy,tradenegotiation andmediation
Train officersand diplomats inthe regional ondiplomacy,tradenegotiation andmediation
Train officersand diplomats inthe regional ondiplomacy,tradenegotiation andmediation
Training and Capacitybuilding
Number of Officerstrained
Train officers Ministry trainedofficers inpromotionalrelated courses
Train officers Train officers-35
Train officers-35
Train officers-35
Undertaking trainingneed assessment
TNA done - - - UndertakeTNA
Implementrecommend-ations
Implementrecommend-ations
Secondment programmefor officers to Regionaland Internationalorganizations
Number of officersseconded
2 1 1 3 Secondofficers
3 Secondofficers
3 Secondofficers
Review andimplementation of FSACurriculum
sustainable andimproved qualitytraining
FSACurriculumdeveloped
- - FSACurriculumdeveloped
Implementation Implementation
Establish and e-learningand resource/referencecenter
Enhanced trainingand skillsdevelopment
- - - established Established andoperational
Established andoperational
Review and implementFSR
Enhancedprofessionalismamong staff
- - - Reviewed FSR Reviewed FSR Reviewed FSR
Develop and implementa HRM plan
Efficientmanagement ofhuman resources
Plan Developed - - PlanDeveloped
Implementation Implementation
Youth internship andmentorship
Number ofinternships provided
100 348 100 100 100 100

106
Programme Delivery Unit Key Outputs Key PerformanceIndicators
Target2015/16
ActualAchievement2015/16
Target(Baseline)
2016/17
Target2017/18
Target2018/19
Target2019/20
Induction programmefor state and publicofficers on protocol,etiquette and Kenya’sinternational obligations
Increasedsensitization
Conductinductionprogrammes
Various countyofficials trained
Conduct inductionprogrammes
Conductinductionprogrammes
Conductinductionprogrammes
Conductinductionprogrammes
S.P 4.2:InternationalTechnicalCooperation
PDS OFFICE,SFSA, FSA,RegionalDirectorates,CPPMD, Liaison
Coordinate andadministration ofTechnical fund forcooperation
programmesmanaged under TF
Programmesdeveloped andimplemented
Programmesdeveloped andimplemented
Programmesdeveloped andimplemented
Programmesdeveloped andimplemented
Policy on TechnicalCooperation
Policy developed - - - Policydeveloped
Policy Finalizedandimplementation
Policy Finalizedandimplementation
Administer scholarshipand exchangeprogrammes
Enhanced skillsdevelopment
Scholarshipsprovided
Scholarshipsprovided
Scholarshipsprovided
Scholarshipsprovided
Scholarshipsprovided
The National TreasuryProgramme : General Administration, Planning and Support ServicesOutcome: An efficient, effective and service-oriented staff and empowered and informed customers
SP 1.1AdministrationServices
HeadquartersAdministrativeServices
Administrative services Percentage ofcustomer andemployeesatisfactionachieved
100% 100% 100% 100% 100% 100%
Fleet managementsystem and lease ofadditional vehicles andsecurity equipment.
Number of vehiclesleased
800 vehiclesleased
500 vehiclesleased
Lease of 500police vehicles.
Lease of 500police vehicles
Lease of 500police vehicles
Lease of 500police vehicles
Monitoring andevaluation.
Number of reports QuarterlyReports
4 reports 4 Reports 4 reports 4 reports 4 reports
Directorate ofAdministrativeServices
Quality ManagementSystem.
Percentagereduction in numberof non-conformities
50% 50% 50% 50% 50% 50%
AIE management system AIE managementsystem installed
- - AIE managementsystem installed.
AIEmanagementsysteminstalled
- -

107
Programme Delivery Unit Key Outputs Key PerformanceIndicators
Target2015/16
ActualAchievement2015/16
Target(Baseline)
2016/17
Target2017/18
Target2018/19
Target2019/20
ISO 9001:2008 QualityManagement Systemmaintained
Internal audit reportsand managementreview reports.
Re-certification 2 Internalaudits and onemanagementreviewmeeting.
Capacity buildingfor the users.(Kshs 100m).
Surveillanceaudits (Kshs15m)
Surveillanceaudits and Re-certification(Kshs15m)
Surveillanceaudits (Kshs15m)
Replacement offour (4No.) liftsat Bima
Access provided to allfloors ofBima House
New Bima Houselifts.
BIMA Houselifts repairedand the newones procured.
Lifts repairedContract fornew liftssigned.
New BIMAhouse liftsinstalled.
- - -
WaterReticulationworks atTreasury, Bimaand Herufi House
Functioning washroomsand wet areas.Adequate water supplyto three buildings.Proper drainage in theparking areas.
Pressurized metallictanks installed.Plumbing andmechanical systemsin the washroomsrenewed
Functioningwashrooms andwet areas.Adequatewater supply tothree buildingsProperdrainage in theparking areas
Existing tanks,washrooms anddrainagefacilitiesmaintained
Treasury Buildingtargeted for:Functioningwashrooms andwet areas.Adequate watersupply to threebuildingsProper drainagein the parkingareas
BIMABuildingtargeted for:Functioningwashroomsand wet areas.Adequatewater supply tothree buildings.Properdrainage in theparking areas
HerufiBuildingtargeted for:Functioningwashrooms andwet areas.Adequate watersupply to threebuildingsProper drainagein the parkingareas.
Equity andSubscriptions inInternationalFinancialInstitutions
Governmentshareholding ininternational financialinstitutions
Value of governmentshareholding
KSh.3.1 billion KSh.3.1 billion KSh.3.1 billion KSh.3.1billion
KSh.3.1 billion KSh.3.1 billion
Treasury-Bima-Herufi SecuritySystem: CarScanners FireSystems CCTV
Security surveillancesystems.
CCTV system,Firefighting Systemand VehicleScanners installed
Firefightingsystem ,,Canopies andsecurityscanners at theentrances of thethree buildingsinstalled.
Firefightingsystem,Canopies andsecurityscanners at theentrances ofthe threebuildingsinstalled
Vehicle scannersinstalled.
CCTV systeminstalled.Maintenanceof thefirefightingand thesecurityscanners
Maintenance ofthe securitysurveillancesystems
Maintenance ofthe securitysurveillancesystems
SP 1.2 HumanResources
Headquarters Administrative services Scheme of servicefor National
Draft schemedeveloped
Draft schemedeveloped
Three foreignschemes of
Schemeimplemented
Substantiveposts filled
Substantiveposts filled
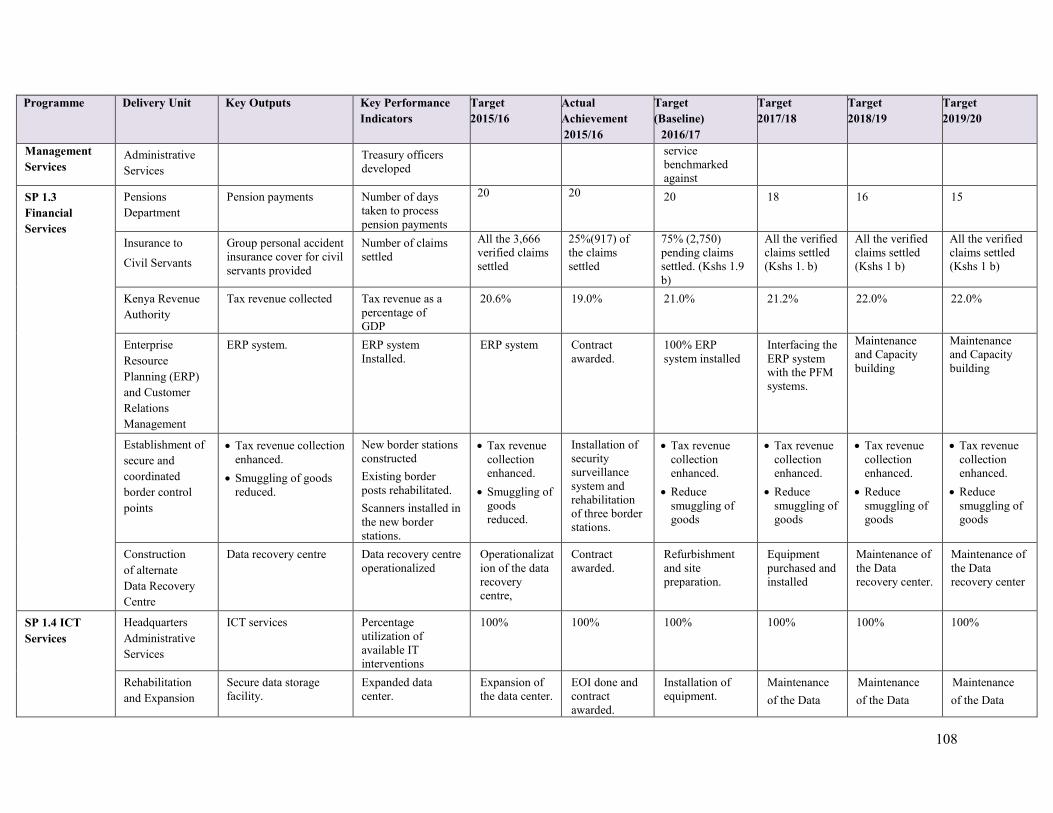
108
Programme Delivery Unit Key Outputs Key PerformanceIndicators
Target2015/16
ActualAchievement2015/16
Target(Baseline)
2016/17
Target2017/18
Target2018/19
Target2019/20
ManagementServices
AdministrativeServices
Treasury officersdeveloped
servicebenchmarkedagainst
SP 1.3FinancialServices
PensionsDepartment
Pension payments Number of daystaken to processpension payments
20 20 20 18 16 15
Insurance to
Civil Servants
Group personal accidentinsurance cover for civilservants provided
Number of claimssettled
All the 3,666verified claimssettled
25%(917) ofthe claimssettled
75% (2,750)pending claimssettled. (Kshs 1.9b)
All the verifiedclaims settled(Kshs 1. b)
All the verifiedclaims settled(Kshs 1 b)
All the verifiedclaims settled(Kshs 1 b)
Kenya RevenueAuthority
Tax revenue collected Tax revenue as apercentage ofGDP
20.6% 19.0% 21.0% 21.2% 22.0% 22.0%
EnterpriseResourcePlanning (ERP)and CustomerRelationsManagement
ERP system. ERP systemInstalled.
ERP system Contractawarded.
100% ERPsystem installed
Interfacing theERP systemwith the PFMsystems.
Maintenanceand Capacitybuilding
Maintenanceand Capacitybuilding
Establishment ofsecure andcoordinatedborder controlpoints
Tax revenue collectionenhanced. Smuggling of goods
reduced.
New border stationsconstructedExisting borderposts rehabilitated.Scanners installed inthe new borderstations.
Tax revenuecollectionenhanced. Smuggling of
goodsreduced.
Installation ofsecuritysurveillancesystem andrehabilitationof three borderstations.
Tax revenuecollectionenhanced. Reduce
smuggling ofgoods
Tax revenuecollectionenhanced. Reduce
smuggling ofgoods
Tax revenuecollectionenhanced. Reduce
smuggling ofgoods
Tax revenuecollectionenhanced. Reduce
smuggling ofgoods
Constructionof alternateData RecoveryCentre
Data recovery centre Data recovery centreoperationalized
Operationalization of the datarecoverycentre,
Contractawarded.
Refurbishmentand sitepreparation.
Equipmentpurchased andinstalled
Maintenance ofthe Datarecovery center.
Maintenance ofthe Datarecovery center
SP 1.4 ICTServices
HeadquartersAdministrativeServices
ICT services Percentageutilization ofavailable ITinterventions
100% 100% 100% 100% 100% 100%
Rehabilitationand Expansion
Secure data storagefacility.
Expanded datacenter.
Expansion ofthe data center.
EOI done andcontractawarded.
Installation ofequipment.
Maintenanceof the Data
Maintenanceof the Data
Maintenanceof the Data

109
Programme Delivery Unit Key Outputs Key PerformanceIndicators
Target2015/16
ActualAchievement2015/16
Target(Baseline)
2016/17
Target2017/18
Target2018/19
Target2019/20
of Herufi DataCenter
center center center
Equipping,Operationalization of DisasterRecoveryCentre-Phase III
Disaster recovery centre Tier 4 certificationof Disaster DataRecovery Centre
Phase I of theprojectfinalized
Phase II of theprojectfinalized
Phase III of theproject initiated
Phase III of theprojectcompleted.
Certification Maintenanceand operation
Upgrading,Integration ofPensionsManagementInformationSystem
Upgraded PensionManagementInformationSystem
PensionManagementInformationSystem upgraded.
UpgradedPensionManagementInformationSystem
Tender floated,contractawarded andthe worksongoing. Rollout of thePMIS systemto all HudumaCenters.
Integration of thePMIS with theIFMIS system.
Maintenanceof the PMISsystem
Maintenance ofthe PMISsystem
Maintenance ofthe PMISsystem
Programme: Public Financial ManagementOutcome: A transparent and accountable system for the management of public resources
SP 2.1 ResourceMobilization
ResourceMobilizationDepartment
Resourcesmobilized fromdevelopmentpartners
External resourcesmobilized as apercentage of totalbudget.
15% 26% 20% 20% 20% 20%
Funds disbursed as apercentage of theexternal resourcesmobilized.
80% 80% 80% 80% 80%
Global Fund Global fundadministrativeservices.
Percentageabsorption of globalfunds.
100% 83.1% 100% 100% 100% 100%
HIV/AIDS Round7
Medical supplies forHIV/AIDS
Percentage ofbudgeted fundsabsorbed
100% 81% 100% 100% 100% 100%
TuberculosisRound 6
Medical suppliesprocured forinterventions againstTuberculosis
Percentage ofbudgeted fundsabsorbed
100% 64% 100% 100% 100% 100%

110
Programme Delivery Unit Key Outputs Key PerformanceIndicators
Target2015/16
ActualAchievement2015/16
Target(Baseline)
2016/17
Target2017/18
Target2018/19
Target2019/20
Malaria Round10 - SpecialGlobal Fund
Medical supplies forMalaria
Percentage ofbudgeted fundsabsorbed
100% 75% 100% 100% 100% 100%
Public PrivatePartnershipSecretariat
PPP Administrativeservices
Legal institution andregulatoryframework for PPPsestablished.
PPP policy andregulations.
PPP policyformulated.
PPP regulations. PPP policy andregulationsimplementation.
PPP policy andregulationsimplementation
PPP policy andregulationsimplementation
PPP fund established 500 million - 1.5 billion 5 billion 15 billion 45 billion.
Regulations forNational and CountyGovernmentdeveloped.
Draftregulations
Regulationsdrafted
Finalization ofregulations
Operationalization of theregulations.
Operationalization of theregulations
Operationalization of theregulations
InfrastructureFinance AndPublic PrivatePartnership Project(IF-PPP)
PPP capacity build. Number of stafftrained on PPP
2000 1000 5000 5000 5000 5000
Pipeline of bankablePPP projects
Number of pipelineof bankable PPPprojects.
45 67 60 60 65 65
Kenya PetroleumTechnicalAssistance Project(KEPTAP)
PPP capacity build. Percentage of fundsutilized
100% 32% 100% 100% 100% 100%
TechnicalSupportProgramme (ERD)
Financial services Percentage ofbudgeted fundsabsorbed
100% 43% 100% 100% 100% 100%
Support ToMonitoring OfUNDAF InDelivery As OneApproach
Financial services Percentage ofbudgeted fundsabsorbed
100% 100% 100% 100% 100% 100%
Financial SectorSupport Project(FSSP)
Financial services Percentage ofbudgeted fundsabsorbed
100% 19% 100% 100% 100% 100%
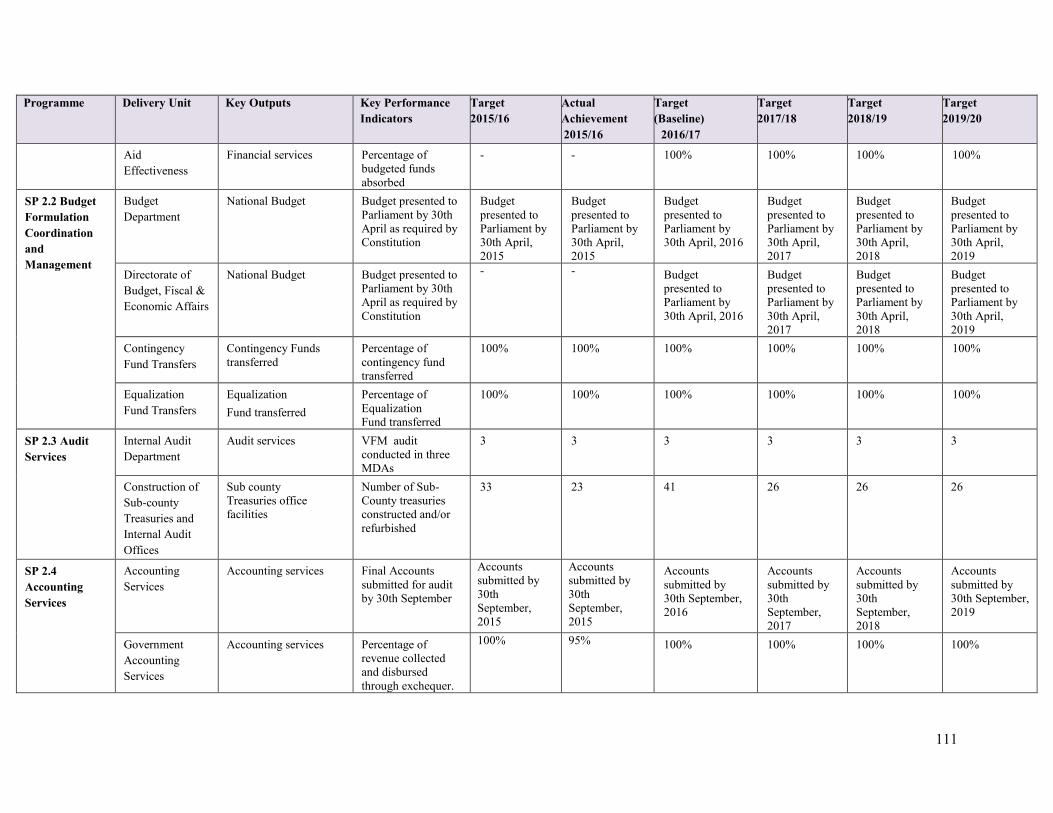
111
Programme Delivery Unit Key Outputs Key PerformanceIndicators
Target2015/16
ActualAchievement2015/16
Target(Baseline)
2016/17
Target2017/18
Target2018/19
Target2019/20
AidEffectiveness
Financial services Percentage ofbudgeted fundsabsorbed
- - 100% 100% 100% 100%
SP 2.2 BudgetFormulationCoordinationandManagement
BudgetDepartment
National Budget Budget presented toParliament by 30thApril as required byConstitution
Budgetpresented toParliament by30th April,2015
Budgetpresented toParliament by30th April,2015
Budgetpresented toParliament by30th April, 2016
Budgetpresented toParliament by30th April,2017
Budgetpresented toParliament by30th April,2018
Budgetpresented toParliament by30th April,2019
Directorate ofBudget, Fiscal &Economic Affairs
National Budget Budget presented toParliament by 30thApril as required byConstitution
- - Budgetpresented toParliament by30th April, 2016
Budgetpresented toParliament by30th April,2017
Budgetpresented toParliament by30th April,2018
Budgetpresented toParliament by30th April,2019
ContingencyFund Transfers
Contingency Fundstransferred
Percentage ofcontingency fundtransferred
100% 100% 100% 100% 100% 100%
EqualizationFund Transfers
EqualizationFund transferred
Percentage ofEqualizationFund transferred
100% 100% 100% 100% 100% 100%
SP 2.3 AuditServices
Internal AuditDepartment
Audit services VFM auditconducted in threeMDAs
3 3 3 3 3 3
Construction ofSub-countyTreasuries andInternal AuditOffices
Sub countyTreasuries officefacilities
Number of Sub-County treasuriesconstructed and/orrefurbished
33 23 41 26 26 26
SP 2.4AccountingServices
AccountingServices
Accounting services Final Accountssubmitted for auditby 30th September
Accountssubmitted by30thSeptember,2015
Accountssubmitted by30thSeptember,2015
Accountssubmitted by30th September,2016
Accountssubmitted by30thSeptember,2017
Accountssubmitted by30thSeptember,2018
Accountssubmitted by30th September,2019
GovernmentAccountingServices
Accounting services Percentage ofrevenue collectedand disbursedthrough exchequer.
100% 95% 100% 100% 100% 100%
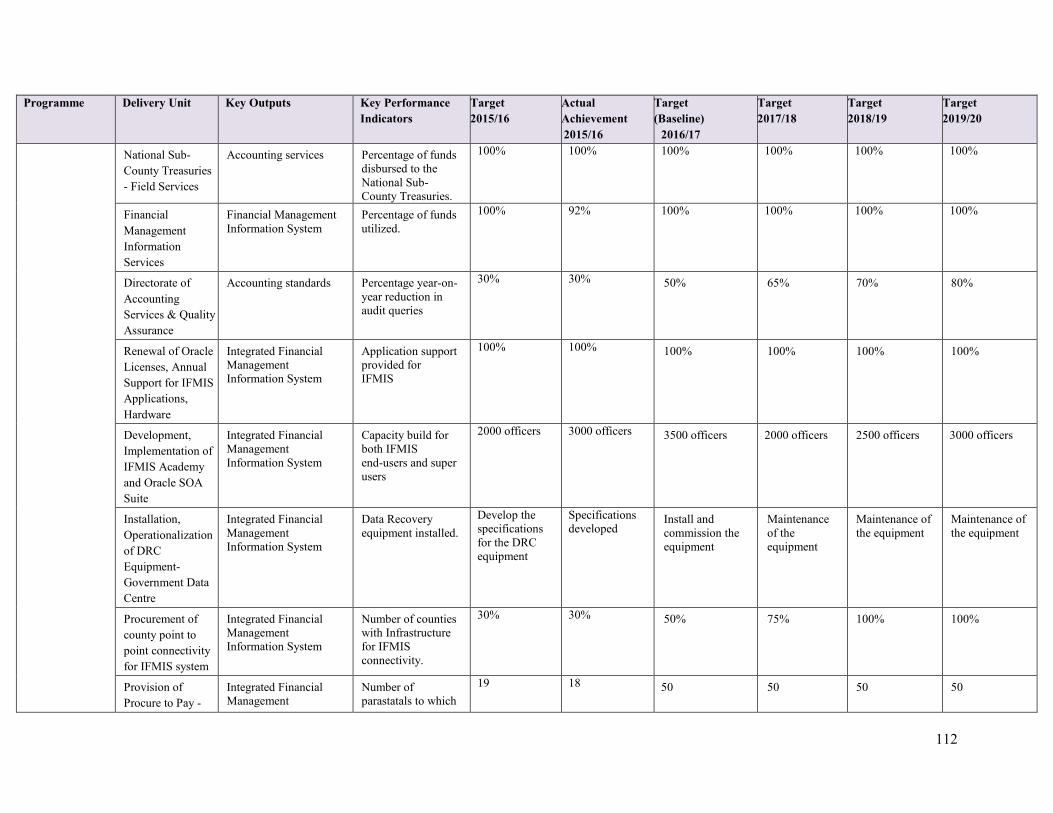
112
Programme Delivery Unit Key Outputs Key PerformanceIndicators
Target2015/16
ActualAchievement2015/16
Target(Baseline)
2016/17
Target2017/18
Target2018/19
Target2019/20
National Sub-County Treasuries- Field Services
Accounting services Percentage of fundsdisbursed to theNational Sub-County Treasuries.
100% 100% 100% 100% 100% 100%
FinancialManagementInformationServices
Financial ManagementInformation System
Percentage of fundsutilized.
100% 92% 100% 100% 100% 100%
Directorate ofAccountingServices & QualityAssurance
Accounting standards Percentage year-on-year reduction inaudit queries
30% 30% 50% 65% 70% 80%
Renewal of OracleLicenses, AnnualSupport for IFMISApplications,Hardware
Integrated FinancialManagementInformation System
Application supportprovided forIFMIS
100% 100% 100% 100% 100% 100%
Development,Implementation ofIFMIS Academyand Oracle SOASuite
Integrated FinancialManagementInformation System
Capacity build forboth IFMISend-users and superusers
2000 officers 3000 officers 3500 officers 2000 officers 2500 officers 3000 officers
Installation,Operationalizationof DRCEquipment-Government DataCentre
Integrated FinancialManagementInformation System
Data Recoveryequipment installed.
Develop thespecificationsfor the DRCequipment
Specificationsdeveloped
Install andcommission theequipment
Maintenanceof theequipment
Maintenance ofthe equipment
Maintenance ofthe equipment
Procurement ofcounty point topoint connectivityfor IFMIS system
Integrated FinancialManagementInformation System
Number of countieswith Infrastructurefor IFMISconnectivity.
30% 30% 50% 75% 100% 100%
Provision ofProcure to Pay -
Integrated FinancialManagement
Number ofparastatals to which
19 18 50 50 50 50
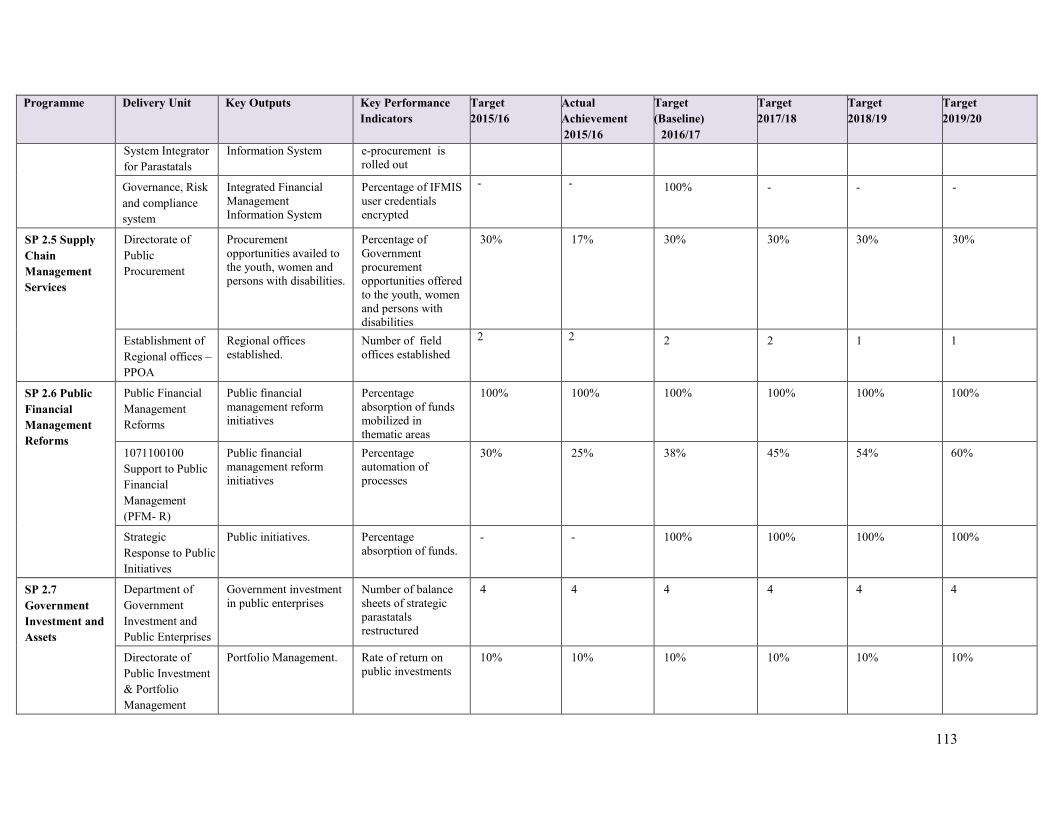
113
Programme Delivery Unit Key Outputs Key PerformanceIndicators
Target2015/16
ActualAchievement2015/16
Target(Baseline)
2016/17
Target2017/18
Target2018/19
Target2019/20
System Integratorfor Parastatals
Information System e-procurement isrolled out
Governance, Riskand compliancesystem
Integrated FinancialManagementInformation System
Percentage of IFMISuser credentialsencrypted
- - 100% - - -
SP 2.5 SupplyChainManagementServices
Directorate ofPublicProcurement
Procurementopportunities availed tothe youth, women andpersons with disabilities.
Percentage ofGovernmentprocurementopportunities offeredto the youth, womenand persons withdisabilities
30% 17% 30% 30% 30% 30%
Establishment ofRegional offices –PPOA
Regional officesestablished.
Number of fieldoffices established
2 2 2 2 1 1
SP 2.6 PublicFinancialManagementReforms
Public FinancialManagementReforms
Public financialmanagement reforminitiatives
Percentageabsorption of fundsmobilized inthematic areas
100% 100% 100% 100% 100% 100%
1071100100Support to PublicFinancialManagement(PFM- R)
Public financialmanagement reforminitiatives
Percentageautomation ofprocesses
30% 25% 38% 45% 54% 60%
StrategicResponse to PublicInitiatives
Public initiatives. Percentageabsorption of funds.
- - 100% 100% 100% 100%
SP 2.7GovernmentInvestment andAssets
Department ofGovernmentInvestment andPublic Enterprises
Government investmentin public enterprises
Number of balancesheets of strategicparastatalsrestructured
4 4 4 4 4 4
Directorate ofPublic Investment& PortfolioManagement
Portfolio Management. Rate of return onpublic investments
10% 10% 10% 10% 10% 10%
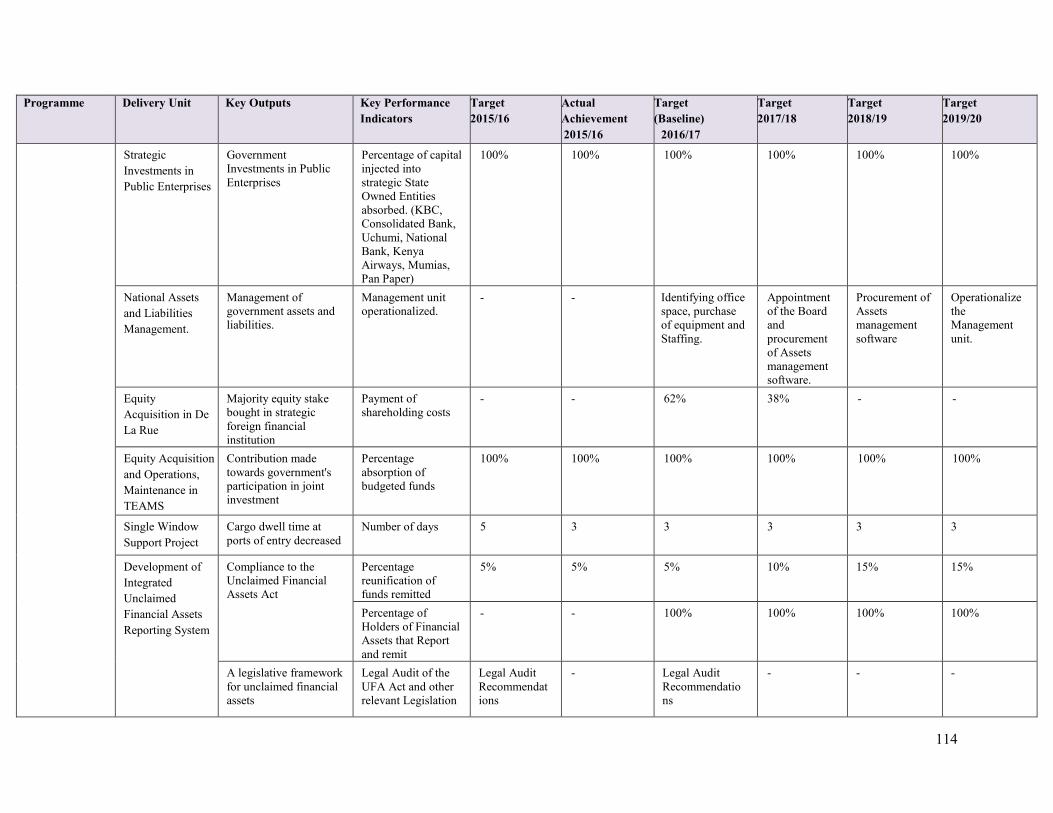
114
Programme Delivery Unit Key Outputs Key PerformanceIndicators
Target2015/16
ActualAchievement2015/16
Target(Baseline)
2016/17
Target2017/18
Target2018/19
Target2019/20
StrategicInvestments inPublic Enterprises
GovernmentInvestments in PublicEnterprises
Percentage of capitalinjected intostrategic StateOwned Entitiesabsorbed. (KBC,Consolidated Bank,Uchumi, NationalBank, KenyaAirways, Mumias,Pan Paper)
100% 100% 100% 100% 100% 100%
National Assetsand LiabilitiesManagement.
Management ofgovernment assets andliabilities.
Management unitoperationalized.
- - Identifying officespace, purchaseof equipment andStaffing.
Appointmentof the Boardandprocurementof Assetsmanagementsoftware.
Procurement ofAssetsmanagementsoftware
OperationalizetheManagementunit.
EquityAcquisition in DeLa Rue
Majority equity stakebought in strategicforeign financialinstitution
Payment ofshareholding costs
- - 62% 38% - -
Equity Acquisitionand Operations,Maintenance inTEAMS
Contribution madetowards government'sparticipation in jointinvestment
Percentageabsorption ofbudgeted funds
100% 100% 100% 100% 100% 100%
Single WindowSupport Project
Cargo dwell time atports of entry decreased
Number of days 5 3 3 3 3 3
Development ofIntegratedUnclaimedFinancial AssetsReporting System
Compliance to theUnclaimed FinancialAssets Act
Percentagereunification offunds remitted
5% 5% 5% 10% 15% 15%
Percentage ofHolders of FinancialAssets that Reportand remit
- - 100% 100% 100% 100%
A legislative frameworkfor unclaimed financialassets
Legal Audit of theUFA Act and otherrelevant Legislation
Legal AuditRecommendations
- Legal AuditRecommendations
- - -
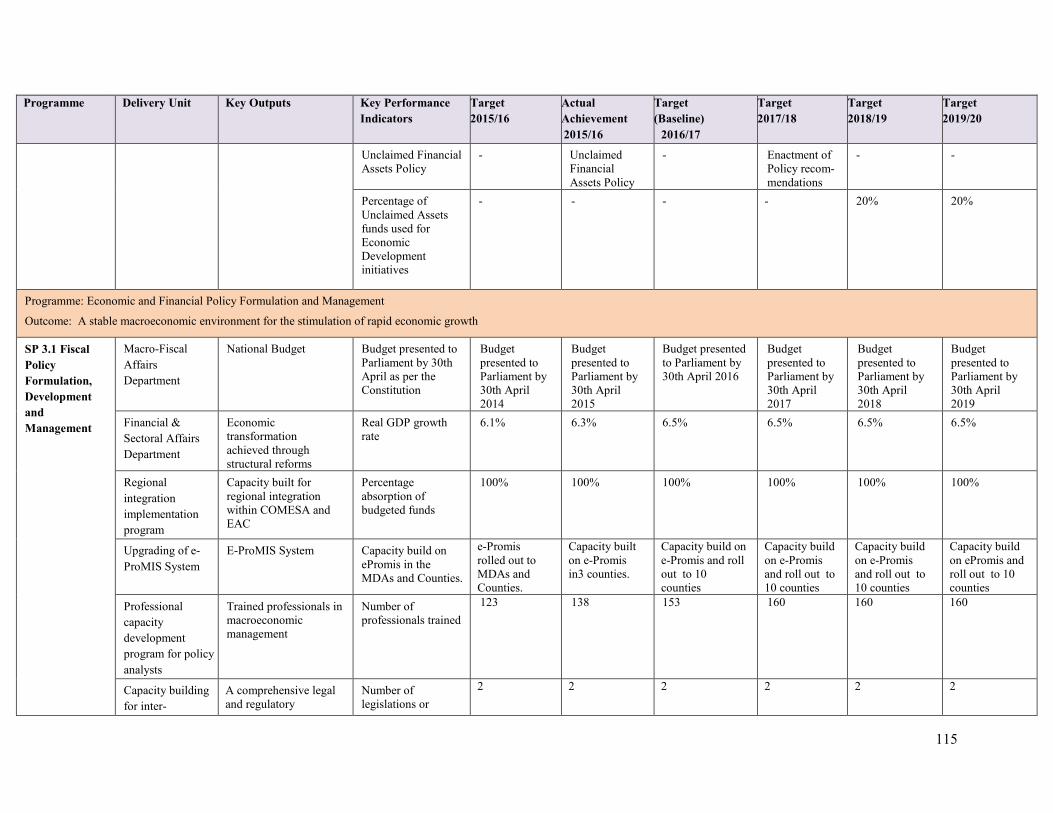
115
Programme Delivery Unit Key Outputs Key PerformanceIndicators
Target2015/16
ActualAchievement2015/16
Target(Baseline)
2016/17
Target2017/18
Target2018/19
Target2019/20
Unclaimed FinancialAssets Policy
- UnclaimedFinancialAssets Policy
- Enactment ofPolicy recom-mendations
- -
Percentage ofUnclaimed Assetsfunds used forEconomicDevelopmentinitiatives
- - - - 20% 20%
Programme: Economic and Financial Policy Formulation and Management
Outcome: A stable macroeconomic environment for the stimulation of rapid economic growth
SP 3.1 FiscalPolicyFormulation,DevelopmentandManagement
Macro-FiscalAffairsDepartment
National Budget Budget presented toParliament by 30thApril as per theConstitution
Budgetpresented toParliament by30th April2014
Budgetpresented toParliament by30th April2015
Budget presentedto Parliament by30th April 2016
Budgetpresented toParliament by30th April2017
Budgetpresented toParliament by30th April2018
Budgetpresented toParliament by30th April2019
Financial &Sectoral AffairsDepartment
Economictransformationachieved throughstructural reforms
Real GDP growthrate
6.1% 6.3% 6.5% 6.5% 6.5% 6.5%
Regionalintegrationimplementationprogram
Capacity built forregional integrationwithin COMESA andEAC
Percentageabsorption ofbudgeted funds
100% 100% 100% 100% 100% 100%
Upgrading of e-ProMIS System
E-ProMIS System Capacity build onePromis in theMDAs and Counties.
e-Promisrolled out toMDAs andCounties.
Capacity builton e-Promisin3 counties.
Capacity build one-Promis and rollout to 10counties
Capacity buildon e-Promisand roll out to10 counties
Capacity buildon e-Promisand roll out to10 counties
Capacity buildon ePromis androll out to 10counties
Professionalcapacitydevelopmentprogram for policyanalysts
Trained professionals inmacroeconomicmanagement
Number ofprofessionals trained
123 138 153 160 160 160
Capacity buildingfor inter-
A comprehensive legaland regulatory
Number oflegislations or
2 2 2 2 2 2
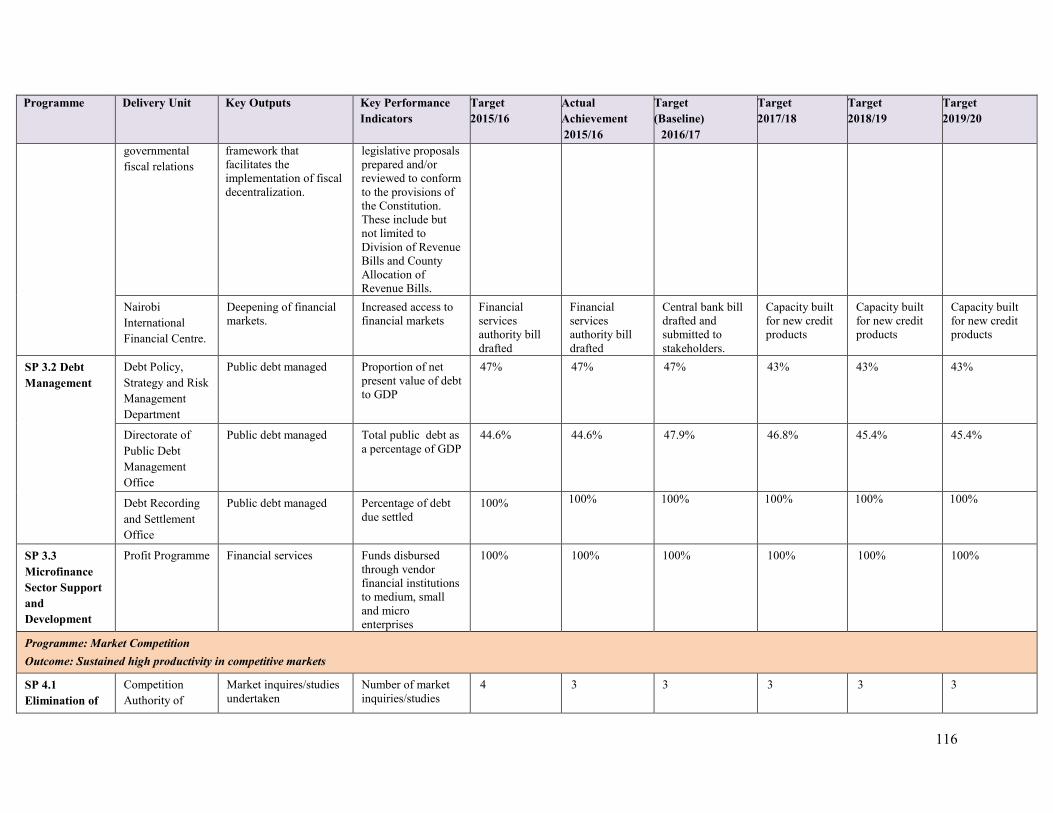
116
Programme Delivery Unit Key Outputs Key PerformanceIndicators
Target2015/16
ActualAchievement2015/16
Target(Baseline)
2016/17
Target2017/18
Target2018/19
Target2019/20
governmentalfiscal relations
framework thatfacilitates theimplementation of fiscaldecentralization.
legislative proposalsprepared and/orreviewed to conformto the provisions ofthe Constitution.These include butnot limited toDivision of RevenueBills and CountyAllocation ofRevenue Bills.
NairobiInternationalFinancial Centre.
Deepening of financialmarkets.
Increased access tofinancial markets
Financialservicesauthority billdrafted
Financialservicesauthority billdrafted
Central bank billdrafted andsubmitted tostakeholders.
Capacity builtfor new creditproducts
Capacity builtfor new creditproducts
Capacity builtfor new creditproducts
SP 3.2 DebtManagement
Debt Policy,Strategy and RiskManagementDepartment
Public debt managed Proportion of netpresent value of debtto GDP
47% 47% 47% 43% 43% 43%
Directorate ofPublic DebtManagementOffice
Public debt managed Total public debt asa percentage of GDP
44.6% 44.6% 47.9% 46.8% 45.4% 45.4%
Debt Recordingand SettlementOffice
Public debt managed Percentage of debtdue settled
100% 100% 100% 100% 100% 100%
SP 3.3MicrofinanceSector SupportandDevelopment
Profit Programme Financial services Funds disbursedthrough vendorfinancial institutionsto medium, smalland microenterprises
100% 100% 100% 100% 100% 100%
Programme: Market CompetitionOutcome: Sustained high productivity in competitive markets
SP 4.1Elimination of
CompetitionAuthority of
Market inquires/studiesundertaken
Number of marketinquiries/studies
4 3 3 3 3 3

117
Programme Delivery Unit Key Outputs Key PerformanceIndicators
Target2015/16
ActualAchievement2015/16
Target(Baseline)
2016/17
Target2017/18
Target2018/19
Target2019/20
RestrictiveTrade Practices
Kenya reports
Merger guidelines,Restrictive TradePractices and Consumerprotection guidelines
Number ofguidelines developed
4 4 2 2 1 1
Mergers evaluated anddetermined
Number of mergersevaluated anddetermined
151 151 130 130 130 130
Restrictive TradePractices and consumercases investigated
Number of casesinvestigated
18 93 96 100 105 115
Programme : Government Clearing ServicesOutcome: Improved efficiency in clearing of government imports/exports
SP. 5.1GovernmentClearingServices
GovernmentClearing Services
Authority established RegulatoryAuthority
- - Task forceconstituted
Policydeveloped andapproved
Regulationsdeveloped
AuthorityOperationalized
State Department for Public Service & YouthName of Programme: Youth EmpowermentOutcome: Enhanced empowerment and participation of youth and other vulnerable groups in all aspects of National Development
SP 1.1: NationalYouth Service
National YouthService
Youth trained inparamilitary andregimented
No. of youth recruitstrained andregimented
21,870 10,935 21,870 21,870 21,870 21,870
Youth engaged innational service and re-socialized
No. of communityyouth trained onsocial transformation
75,000 76,934 75,000 75,000 75,000 75,000
No. of dams/waterpans Constructedunder NYSprogramme
- - 22 - - -
Empowered youththrough employment
No. of communityyouth SACCOsregistered
234 134 300 330 400 400
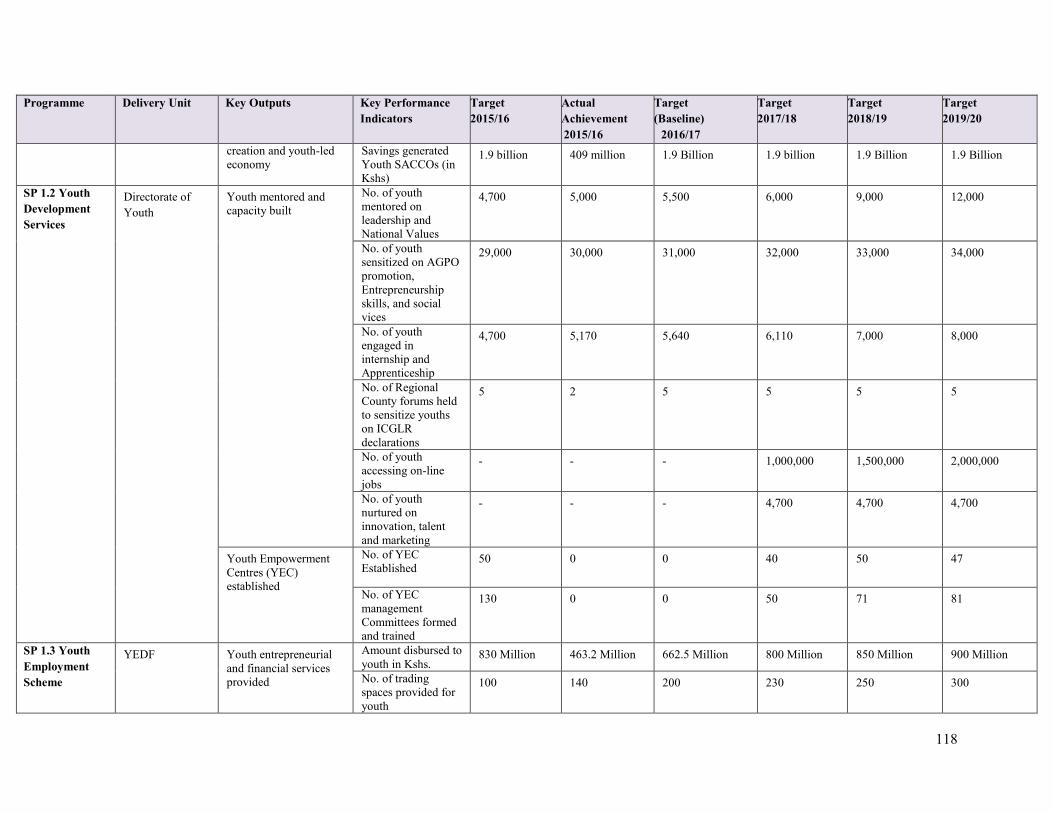
118
Programme Delivery Unit Key Outputs Key PerformanceIndicators
Target2015/16
ActualAchievement2015/16
Target(Baseline)
2016/17
Target2017/18
Target2018/19
Target2019/20
creation and youth-ledeconomy
Savings generatedYouth SACCOs (inKshs)
1.9 billion 409 million 1.9 Billion 1.9 billion 1.9 Billion 1.9 Billion
SP 1.2 YouthDevelopmentServices
Directorate ofYouth
Youth mentored andcapacity built
No. of youthmentored onleadership andNational Values
4,700 5,000 5,500 6,000 9,000 12,000
No. of youthsensitized on AGPOpromotion,Entrepreneurshipskills, and socialvices
29,000 30,000 31,000 32,000 33,000 34,000
No. of youthengaged ininternship andApprenticeship
4,700 5,170 5,640 6,110 7,000 8,000
No. of RegionalCounty forums heldto sensitize youthson ICGLRdeclarations
5 2 5 5 5 5
No. of youthaccessing on-linejobs
- - - 1,000,000 1,500,000 2,000,000
No. of youthnurtured oninnovation, talentand marketing
- - - 4,700 4,700 4,700
Youth EmpowermentCentres (YEC)established
No. of YECEstablished
50 0 0 40 50 47
No. of YECmanagementCommittees formedand trained
130 0 0 50 71 81
SP 1.3 YouthEmploymentScheme
YEDF Youth entrepreneurialand financial servicesprovided
Amount disbursed toyouth in Kshs.
830 Million 463.2 Million 662.5 Million 800 Million 850 Million 900 Million
No. of tradingspaces provided foryouth
100 140 200 230 250 300

119
Programme Delivery Unit Key Outputs Key PerformanceIndicators
Target2015/16
ActualAchievement2015/16
Target(Baseline)
2016/17
Target2017/18
Target2018/19
Target2019/20
No. of youth trainedon entrepreneurshipskills
45,000 44,368 47,000 48,000 49,000 50,000
No. of youthfacilitated to markettheir Products
750 947 1,200 1,550 1,650 1,750
No. of youth whosecured jobs outsideKenya
4,100 1,611 5,000 5,500 6,000 6,500
SP 1.4 YouthCoordinationandrepresentation
National YouthCouncil
Youth empowermentservices provided
No. of youthsensitized onentrepreneurship,and leadership skills
3,000 4,050 4,500 5,000 5,500 6,000
National YouthPolicy 2007reviewed
NYP 2007reviewed
- NYP 2007reviewed
Disseminationin 47 Countiesand reviewNYC Act
- -
NYC Actreviewed
NYC Actreviewed
- - NYC Actreviewed
Implementationof the reviewedAct
-
Name of programme: Public Service TransformationOutcome: Transformed quality and efficiency of Public Service DeliverySP 2.1 HumanResourceManagement
HRM Policy Medical InsuranceScheme reviewedadministered
Reviewed MedicalInsurance Scheme
ReviewMedicalInsuranceScheme forCivil ServantsandDisciplinedServices
Reviewed andsigned contractMedicalInsuranceScheme forCivil Servantsand DisciplinedServices
ReviewMedicalInsurance Schemefor Civil Servants
ReviewMedicalInsuranceScheme forCivil Servants
ReviewMedicalInsuranceScheme forCivil Servants
ReviewMedicalInsuranceScheme forCivil Servants
Post-retirement medicalScheme developed andadministered.
Post-RetirementMedical Scheme
Draft Post-RetirementMedicalScheme
Draft Post-RetirementMedicalScheme
Finalize andimplement thePost-RetirementMedical Scheme
Implementation and annualreviews
Implementationand annualreviews
Implementationand annualreviews
Government HumanResource InformationSystem( GHRIS)upgraded
GHRIS Integratedwith IFMIS, IPPD,NRB and KRA
- - Partial integrationwith IFMIS
Full integrationwith IPPD
Partialintegration withNRBPartialintegration withKRA
Full integrationwith NRBFull integrationwith KRA

120
Programme Delivery Unit Key Outputs Key PerformanceIndicators
Target2015/16
ActualAchievement2015/16
Target(Baseline)
2016/17
Target2017/18
Target2018/19
Target2019/20
Reviewed staffperformanceappraisal system(SPAS)
- - Review anddevelop anelectronic SPASCarry outsensitizations onSPAS and roll itout to CMDAs
ImplementSPAS inCMDAs
ImplementSPAS inCMDAs
Review SPAS
Activated inactivemodules in GHRIS
- - Initiate andreview leavemanagement andtrainingmanagementmodules
Roll out leavemanagementand trainingmanagementmodules
Review anddevelop apayroll module
Roll out payrollmodule
Coordinatedimplementation ofCARPs in the publicservice
No. of CMDAsunder CARPs
67 67 67 67 67 67
CARPs Frameworkreviewed
Review andgazette CARPsframework
Reviewed andgazzettedCARPsframework
Implement phaseII CARPs
Implementphase IICARPs
Implementphase III ofCARPs
Implementphase III ofCARPs
Human ResourceManagement Strategydeveloped andimplemented
No. of CMDAsimplementingstrategy
Develop DraftHumanResourceManagementStrategy
Draft HumanResourceManagementStrategy
40 27 67 67
Public Service Guidanceand Counselling Policydeveloped
No. of MDAsimplementing PublicService Guidanceand CounsellingPolicy
20 20 20 20 20 20
Establishment of PublicService PsychologicalCentre
No. of PublicServicePsychologicalCentre
- - - 1 - -
Schemes of serviceadministered by DPSMreviewed
No. of reviewedschemes of service 2 2 2 2 - -
SP 2.2: HumanResourceDevelopment
HRD Public Servantsaccessing training andrevolving fund
Increase in PublicService TrainingRevolving Fund(TRF) (Kshs).
72 72 90 100 100 100
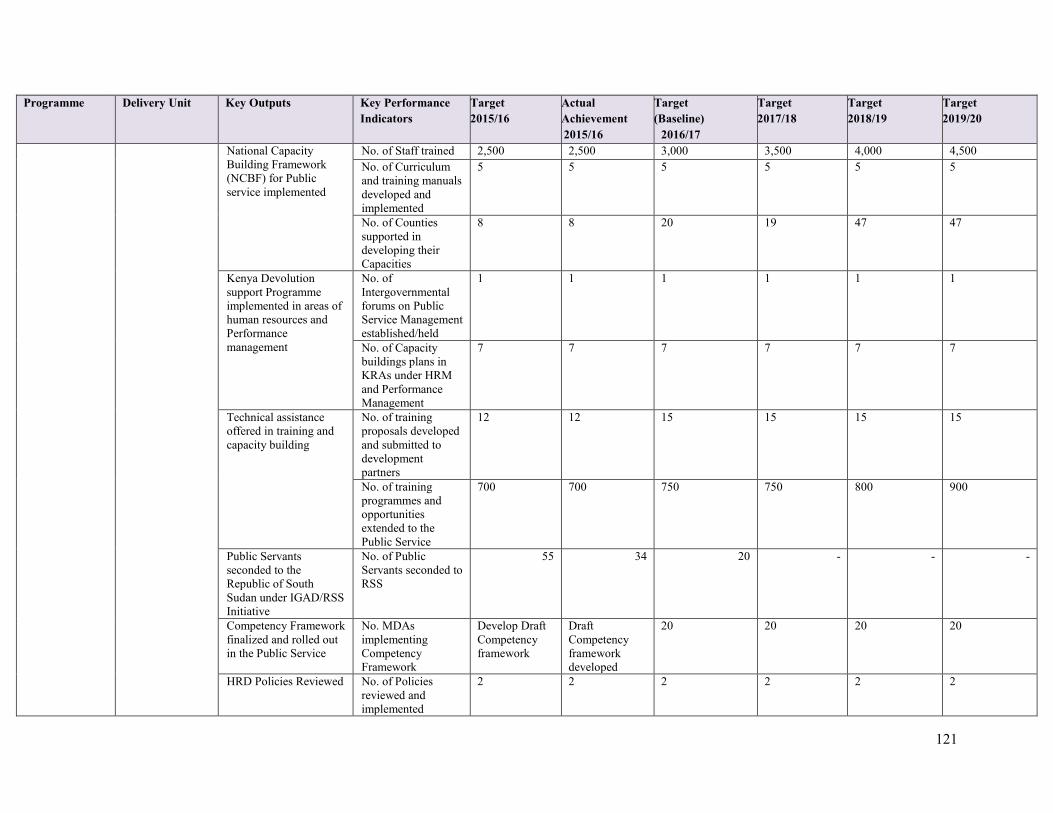
121
Programme Delivery Unit Key Outputs Key PerformanceIndicators
Target2015/16
ActualAchievement2015/16
Target(Baseline)
2016/17
Target2017/18
Target2018/19
Target2019/20
National CapacityBuilding Framework(NCBF) for Publicservice implemented
No. of Staff trained 2,500 2,500 3,000 3,500 4,000 4,500No. of Curriculumand training manualsdeveloped andimplemented
5 5 5 5 5 5
No. of Countiessupported indeveloping theirCapacities
8 8 20 19 47 47
Kenya Devolutionsupport Programmeimplemented in areas ofhuman resources andPerformancemanagement
No. ofIntergovernmentalforums on PublicService Managementestablished/held
1 1 1 1 1 1
No. of Capacitybuildings plans inKRAs under HRMand PerformanceManagement
7 7 7 7 7 7
Technical assistanceoffered in training andcapacity building
No. of trainingproposals developedand submitted todevelopmentpartners
12 12 15 15 15 15
No. of trainingprogrammes andopportunitiesextended to thePublic Service
700 700 750 750 800 900
Public Servantsseconded to theRepublic of SouthSudan under IGAD/RSSInitiative
No. of PublicServants seconded toRSS
55 34 20 - - -
Competency Frameworkfinalized and rolled outin the Public Service
No. MDAsimplementingCompetencyFramework
Develop DraftCompetencyframework
DraftCompetencyframeworkdeveloped
20 20 20 20
HRD Policies Reviewed No. of Policiesreviewed andimplemented
2 2 2 2 2 2

122
Programme Delivery Unit Key Outputs Key PerformanceIndicators
Target2015/16
ActualAchievement2015/16
Target(Baseline)
2016/17
Target2017/18
Target2018/19
Target2019/20
In- Service trainingundertaken
No. of publicservants sponsored(lower and middlelevel cadres)
1500 0 1200 1500 1500 1500
KSG National CapacityBuilding Framework(NCBF) for Publicservice implemented
No. of Participantsfrom NationalGovernment trainedand certified
20,000 21,650 20,000 25,000 30,000 35,000
No. of Participantsfrom countyGovernments trainedand certified
5,000 5,423 5,000 6,000 6,500 7,000
SP 2.3:ManagementConsultancyServices
ManagementConsultancyServices (MCS)
Develop/revise Schemesof Service
No. of schemes ofservicedeveloped/revised
19 23 25 30 35 40
Career progressionguidelines for Ministriesand Counties
No. of guidelinesdeveloped
20 24 30 40 45 50
Organizational reviewsfor public serviceinstitutions
No. of PublicService Institutionsrestructured
18 18 22 As perExecutiveOrders
As perExecutiveOrders
As perExecutiveOrders
Organization studies Organizational studyreports
15 24 30 35 40 50
Grading structures in thecivil service reviewed
Policy document ongrading structures
Develop Policydocument
Policydocumentdeveloped
Provide technicaladvice duringimplementation
Providetechnicaladvice duringimplementation
Providetechnical adviceduringimplementation
Providetechnical adviceduringimplementation
IPPD system upgraded No. of sites withupgraded IPPDsystem
150 150 80 80 80 80
IPPD system integratedwith GHRIS
No. of CMDAswhose capacity builton integratedsystem
- - Develop systemmanuals
67CMDAs 67CMDAs 67CMDAs
Improved servicedelivery throughreplication ofinnovations
Public Serviceinnovation Centre
Establish centre Concept paperandguidelines oninnovationdeveloped
Seek partnershipsto fund the centre
Establish andOperationalCentre
Equipping andmodernizing thecentre
Carry out asurvey on theimpact of thecentre onservice delivery

123
Programme Delivery Unit Key Outputs Key PerformanceIndicators
Target2015/16
ActualAchievement2015/16
Target(Baseline)
2016/17
Target2017/18
Target2018/19
Target2019/20
No. of PCinnovations to beanchored in thecentre
58 22 30 40 50 60
No. of CMDAswhose capacity hasbeen built oninnovation
30 30 35 40 50 60
Succession ManagementPolicy and Strategies
Policy document - - Develop andlaunch SuccessionManagementPolicy andStrategies
ImplementSuccessionManagementPolicy andStrategies
ImplementSuccessionManagementPolicy andStrategies
ImplementSuccessionManagementPolicy andStrategies
Payroll Support Harmonizeddesignations forCountyGovernments
- - 20 30 40 50
SP 2.4: HudumaKenya
Huduma KenyaSecretariat
Operational HudumaCentres in Counties andSub-Counties
Number ofoperational HudumaCentres
20 16 6 20 40 55
Business Process Re-engineered
No. of businessprocesses re-engineered anduploaded to theHuduma Centres
21 13 5 8 10 12
Service deliverystandards maintained
% increase insatisfaction level
- - 62 95 95 95
Huduma KenyaBusiness ManagementInformation Systems.(ERP)
BusinessManagementInformation System
- - 1 - - -
No of Automatedservices offeredthrough ERP
- - 5 10 15 20
Established HudumaCall centre
Call centre 1 1 - - - -
No. of MDAs whoseservices are in a callcentre
- - 5 50 100 150
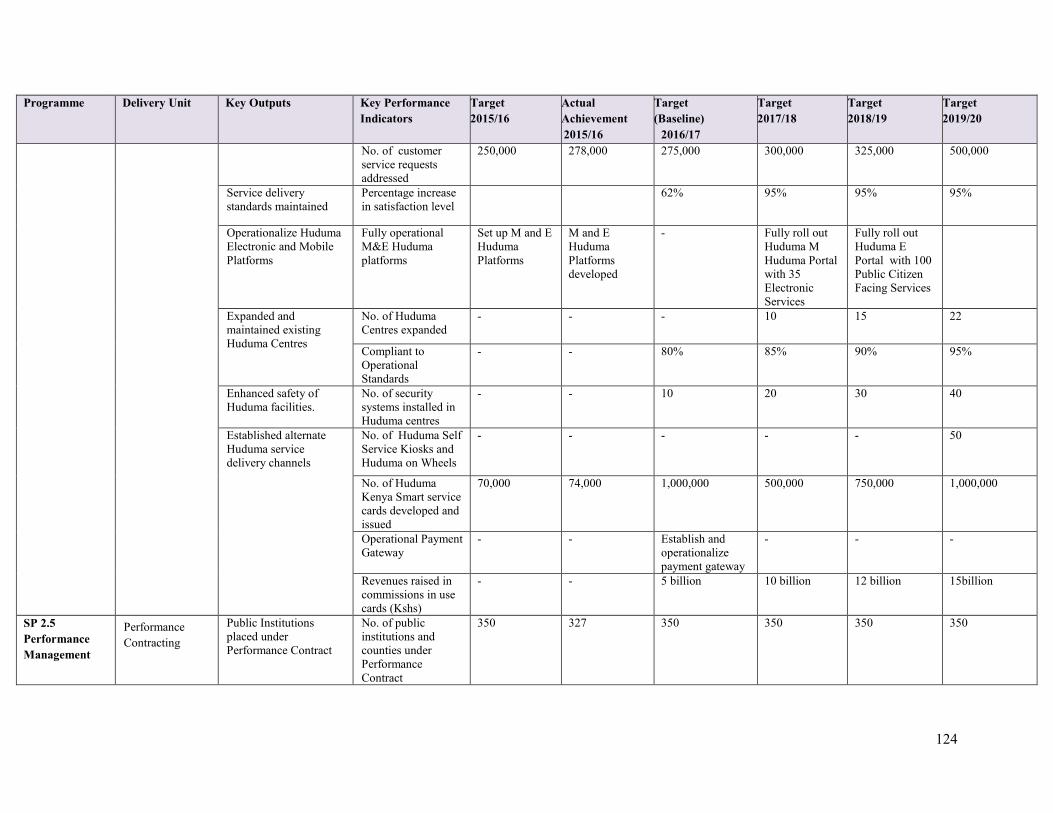
124
Programme Delivery Unit Key Outputs Key PerformanceIndicators
Target2015/16
ActualAchievement2015/16
Target(Baseline)
2016/17
Target2017/18
Target2018/19
Target2019/20
No. of customerservice requestsaddressed
250,000 278,000 275,000 300,000 325,000 500,000
Service deliverystandards maintained
Percentage increasein satisfaction level
62% 95% 95% 95%
Operationalize HudumaElectronic and MobilePlatforms
Fully operationalM&E Hudumaplatforms
Set up M and EHudumaPlatforms
M and EHudumaPlatformsdeveloped
- Fully roll outHuduma MHuduma Portalwith 35ElectronicServices
Fully roll outHuduma EPortal with 100Public CitizenFacing Services
Expanded andmaintained existingHuduma Centres
No. of HudumaCentres expanded
- - - 10 15 22
Compliant toOperationalStandards
- - 80% 85% 90% 95%
Enhanced safety ofHuduma facilities.
No. of securitysystems installed inHuduma centres
- - 10 20 30 40
Established alternateHuduma servicedelivery channels
No. of Huduma SelfService Kiosks andHuduma on Wheels
- - - - - 50
No. of HudumaKenya Smart servicecards developed andissued
70,000 74,000 1,000,000 500,000 750,000 1,000,000
Operational PaymentGateway
- - Establish andoperationalizepayment gateway
- - -
Revenues raised incommissions in usecards (Kshs)
- - 5 billion 10 billion 12 billion 15billion
SP 2.5PerformanceManagement
PerformanceContracting
Public Institutionsplaced underPerformance Contract
No. of publicinstitutions andcounties underPerformanceContract
350 327 350 350 350 350

125
Programme Delivery Unit Key Outputs Key PerformanceIndicators
Target2015/16
ActualAchievement2015/16
Target(Baseline)
2016/17
Target2017/18
Target2018/19
Target2019/20
Institutions capacitybuilt on PerformanceContract
No. of institutionsbenefitting fromcapacity building onPerformanceContract
20 30 50 75 100 150
SP 2.6: PublicService Reforms
PSTD Rapid results initiativesundertaken in nationaland County Governmentinstitutions
No. of Institutions onRRI
368 17 350 350 350 350
Build the capacity ofNational and CountyGovernmentsInstitutions toimplement RBMapproach and Tools
No. Institutionssensitized on BPRand RRI
47 47 350 350 350 350
Public ServiceTransformationFramework developedand rolled out
Public ServiceTransformationFramework
Finalize androll out PublicServiceTransformationFramework
DevelopedDraft PublicServiceTransformationFramework
Finalize and Rollout Public ServiceTransformationFramework
Coordinateimplementationof PublicServiceTransformationFramework
Coordinateimplementationof PublicServiceTransformationFramework
Monitorimplementationof PublicServiceTransformationFramework
Institutional CapacityBuilding and StrategicPartnerships
No. of RRI and BPRChampions trainedto roll outtransformationprogrammes inCMDA
200 100 300 350 400 500
Transformativeleadership Policies andPlans developed androlled out forimplementation
No of CMDASimplementingTransformativeleadership Policiesand Plans
- - Develop/reviewand implementtransformativeleadershipPolicies and Plans
30 40 45
Public Service Emeritusprogramme rolled out
No of Emeritusrecruited
- - Develop andfinalize guidelineson recruitment
200 300 250
Young Leaders naturedand trained
No of young leadersnatured and trained
- - Develop trainingCurriculum andidentify targetinstitutions
300 500 600

126
Programme Delivery Unit Key Outputs Key PerformanceIndicators
Target2015/16
ActualAchievement2015/16
Target(Baseline)
2016/17
Target2017/18
Target2018/19
Target2019/20
Programme: General Administration Planning and Support ServicesOutcome: Improved and efficient administrative, financial and planning support servicesSP 3.1 HumanResource andSupportServices
Administration Administrative Services Service Charterreviewed andimplemented
Review ServiceCharterreviewed andimplemented
Service Charterreviewed andimplemented
Service Charterreviewed andimplemented
Service Charterreviewed andimplemented
Service Charterreviewed andimplemented
Service Charterreviewed andimplemented
SP 3.2 FinancialManagementServices
Administration Financial ManagementServices
Timely release ofresources to allspending units in theMinistry
Timely releaseof resources toall spendingunits in theMinistry
Timely releaseof resources toall spendingunits in theMinistry
Timely release ofresources to allspending units inthe Ministry
Timely releaseof resources toall spendingunits in theMinistry
Timely releaseof resources toall spendingunits in theMinistry
Timely releaseof resources toall spendingunits in theMinistry
SP 3.3InformationCommunicationServices
Administration Information andCommunicationServices
Improved network inall the buildings thathouse the statedepartment
- - 12 access-points 2 virtual local
area networks
8 access-points 2 virtual
local areanetwork
8 access-points 2 virtual
local areanetwork
No of in-housetrainings on basicICT skills andsystems securityconducted
- - 2 4 4 4
Commission on Revenue Allocation
Programme: Inter government revenue and financial mattersProgramme Outcome: Enhanced Economic Growth and Equitable National DevelopmentS.P.1. Legal andPublic Affairs
Legal and PublicAffairs
Reviewed Bills No. of passed Billsto Acts
CountyAllocationRevenue Act(CARA),Division ofRevenue Bill
CountyAllocation ofRevenue Act(CARA)
County AllocationRevenue Act(CARA)
50 Bills 100 Bills 150 Bills
S.P.2. Researchand PolicyDevelopment
Research andPolicyDirectorate
Equitable sharingrevenue betweennational and countygovernmentsFY2017/18
Recommendation onRevenue Sharingbetween Nationaland CountygovernmentsFY2017/18
Recommendations on verticalformula for FY2015/16
Recommendation on divisionof revenue2015/16
Recommendations on verticalformula for FY2016/17
Recommendations on basis forRevenueSharingbetweennational andcountygovernments
Recommendations on basis forRevenueSharing betweennational andcountygovernments forFY 2018/19
Recommendations on basis forRevenueSharing betweennational andcountygovernments forFY 2019/20

127
Programme Delivery Unit Key Outputs Key PerformanceIndicators
Target2015/16
ActualAchievement2015/16
Target(Baseline)
2016/17
Target2017/18
Target2018/19
Target2019/20
for FY 2017/18
Costing of governmentfunctions
Report on Normsand standards forcosted governmentfunctions
Costing of newcountystructures
Ceilings forcountygovernmentssubmitted tosenate.
Draft report oncosting of Health,Agriculture,Natural resources,Environment,Water andForeign Affairssectors.
Prepare anddisseminate areport oncosting normsand standardsHealth,Agriculture,livestock,livestock andfisheries
Prepare a normsand standardsfor water,transport andinfrastructure
-
Equitable revenuesharing among countyGovernments
Published a report onSectoral Model forrevenue sharing
Review of firstrevenue sharingformula for2016/17 –2019/20
Approvedsecond revenuesharing formula
Dissemination ofthe secondrevenue sharingformula
Impact ofEquitableSharing ofrevenue onDevolution onservicedelivery,DevelopSectoral modelfor sharing ofrevenue
Review of theSecond RevenueSharingFormula
Recommendations on ThirdRevenue sharingformula
Improved Planning andBudgeting by the countygovernments
Reviewed CFSPs,CBROPs, CountyDebt ManagementStrategy
Review 47CFSPs,CBROPs andDebtManagementStrategy
Reviewed 47CIDPs, CFSPs,CBROPs andDebtManagementStrategy
Review 47CIDPs, CFSPs,CBROPs andDebt ManagementStrategy
Review 47CFSPs,CBROPs andDebtManagementStrategy
Review 47CIDPs, CFSPs,CBROPs andDebtManagementStrategy
Review 47CIDPs, CFSPs,CBROPs andDebtManagementStrategy
Policy onmarginalization
Determine, publishand review a policyon Marginalizedareas
Review the firstpolicy onmarginalization
Draft study onthe criteria foridentifyingmarginalizedareas
Second policy onmarginalization
Develop acriteria foridentifyingmarginalizedareas
Develop andoperationalize apolicy onmarginalizedareas
-
Integrated CRADatabase for Nationaland County statistics
Established databasefor National andcounty governmentstatistics
Develop a Datamanagementand governancestrategydeveloped infor CRA and
Datamanagementand governancestrategydeveloped infor CRA and
OperationalIntegratedDatabase CRAand five pilotcounties
CRA/ 47CountyIntegrated DataManagementsystem
CRA/ 47CountyIntegrated DataManagementsystem
CRA/ 47CountyIntegrated DataManagementsystem
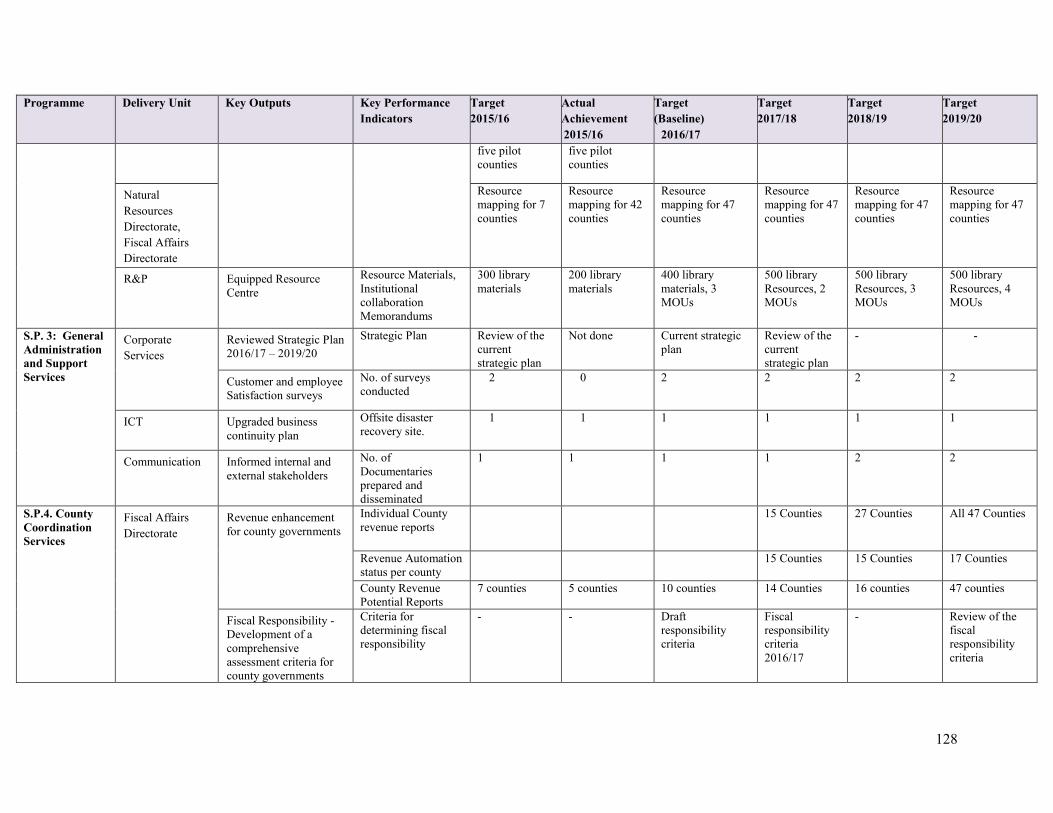
128
Programme Delivery Unit Key Outputs Key PerformanceIndicators
Target2015/16
ActualAchievement2015/16
Target(Baseline)
2016/17
Target2017/18
Target2018/19
Target2019/20
five pilotcounties
five pilotcounties
NaturalResourcesDirectorate,Fiscal AffairsDirectorate
Resourcemapping for 7counties
Resourcemapping for 42counties
Resourcemapping for 47counties
Resourcemapping for 47counties
Resourcemapping for 47counties
Resourcemapping for 47counties
R&P Equipped ResourceCentre
Resource Materials,InstitutionalcollaborationMemorandums
300 librarymaterials
200 librarymaterials
400 librarymaterials, 3MOUs
500 libraryResources, 2MOUs
500 libraryResources, 3MOUs
500 libraryResources, 4MOUs
S.P. 3: GeneralAdministrationand SupportServices
CorporateServices
Reviewed Strategic Plan2016/17 – 2019/20
Strategic Plan Review of thecurrentstrategic plan
Not done Current strategicplan
Review of thecurrentstrategic plan
- -
Customer and employeeSatisfaction surveys
No. of surveysconducted
2 0 2 2 2 2
ICT Upgraded businesscontinuity plan
Offsite disasterrecovery site.
1 1 1 1 1 1
Communication Informed internal andexternal stakeholders
No. ofDocumentariesprepared anddisseminated
1 1 1 1 2 2
S.P.4. CountyCoordinationServices
Fiscal AffairsDirectorate
Revenue enhancementfor county governments
Individual Countyrevenue reports
15 Counties 27 Counties All 47 Counties
Revenue Automationstatus per county
15 Counties 15 Counties 17 Counties
County RevenuePotential Reports
7 counties 5 counties 10 counties 14 Counties 16 counties 47 counties
Fiscal Responsibility -Development of acomprehensiveassessment criteria forcounty governments
Criteria fordetermining fiscalresponsibility
- - Draftresponsibilitycriteria
Fiscalresponsibilitycriteria2016/17
- Review of thefiscalresponsibilitycriteria

129
Programme Delivery Unit Key Outputs Key PerformanceIndicators
Target2015/16
ActualAchievement2015/16
Target(Baseline)
2016/17
Target2017/18
Target2018/19
Target2019/20
Fiscal Responsibility -Impact assessment ofcounty expenditure
Impact assessmentreport
- - 7 counties 15 Counties 15 Counties 10 Counties
Public Service CommissionName of Programme : General Administration, Planning and Support ServicesOutcome: Efficient and effective service delivery by the Commission
SP1.1:Administration
GeneralAdministration
Annual report to thePresident andParliament on theoperations of theCommission
Report to Presidentand Parliamentsubmitted by 31stDecember
1 1 1 1 1 1
Institutionalstrengthening andcapacity development ofthe Commission to beable to deliver itsmandate
Review of salariesand benefits report
- - - 1 - -
Provisions of the revisedCode of Conduct andthe Public Officer EthicsAct (2003) implementedas part of corruptioneradication andgovernance
% of provision of theCode of Conduct andthe Public OfficerEthics Act (2003)implemented
- - 30% 60% 100% -
Human resourcedevelopment at theCommission
No. of staff trained 90 84 80 70 65 50
Communication strategyImplementation plan
% of targetedstrategic initiativesimplemented
- - 100% 100% 100% 100%
Stakeholder engagementon policy development
No. of forums held 6 4 6 6 6 6
Adopted best practiceson the functions of theCommission forenhanced performanceof the public service
No. of programmesstudied on bestpractices
2 1 2 2 2 2
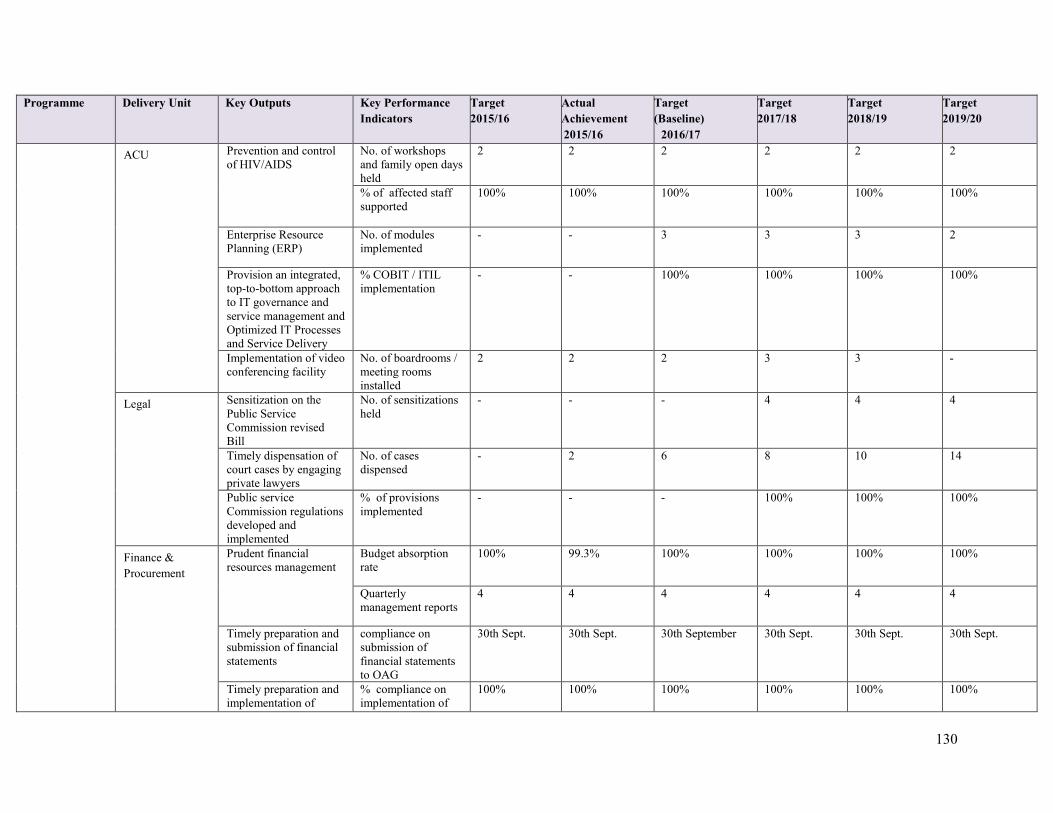
130
Programme Delivery Unit Key Outputs Key PerformanceIndicators
Target2015/16
ActualAchievement2015/16
Target(Baseline)
2016/17
Target2017/18
Target2018/19
Target2019/20
ACU Prevention and controlof HIV/AIDS
No. of workshopsand family open daysheld
2 2 2 2 2 2
% of affected staffsupported
100% 100% 100% 100% 100% 100%
Enterprise ResourcePlanning (ERP)
No. of modulesimplemented
- - 3 3 3 2
Provision an integrated,top-to-bottom approachto IT governance andservice management andOptimized IT Processesand Service Delivery
% COBIT / ITILimplementation
- - 100% 100% 100% 100%
Implementation of videoconferencing facility
No. of boardrooms /meeting roomsinstalled
2 2 2 3 3 -
Legal Sensitization on thePublic ServiceCommission revisedBill
No. of sensitizationsheld
- - - 4 4 4
Timely dispensation ofcourt cases by engagingprivate lawyers
No. of casesdispensed
- 2 6 8 10 14
Public serviceCommission regulationsdeveloped andimplemented
% of provisionsimplemented
- - - 100% 100% 100%
Finance &Procurement
Prudent financialresources management
Budget absorptionrate
100% 99.3% 100% 100% 100% 100%
Quarterlymanagement reports
4 4 4 4 4 4
Timely preparation andsubmission of financialstatements
compliance onsubmission offinancial statementsto OAG
30th Sept. 30th Sept. 30th September 30th Sept. 30th Sept. 30th Sept.
Timely preparation andimplementation of
% compliance onimplementation of
100% 100% 100% 100% 100% 100%

131
Programme Delivery Unit Key Outputs Key PerformanceIndicators
Target2015/16
ActualAchievement2015/16
Target(Baseline)
2016/17
Target2017/18
Target2018/19
Target2019/20
annual procurementplans
plans
Planning andResearch
ISO 9001:2015 QMSBased certification
% of ISOcertification processimplemented
- - 40% 75% 100% -
Annual ISO9001:2015maintenance
- - - - - 100%
Revised strategic plan Annual review ofstrategic plan
1 1 1 1 1 -
Organizationalperformance contract
% of overallperformance targetachieved
100% 70% 100% 100% 100% 100%
Quarterly performancetargets assessmentreports
% of Quarterlyperformance targetachieved
100% 100% 100% 100% 100% 100%
Annual performancetargets evaluations
No. of performancetargets evaluationreports
1 1 1 1 1 1
Internal Audit Annual audit planprepared and executed
No. of internal auditconducted
5 5 6 8 8 8
Institutional riskmanagement frameworkdeveloped andimplemented
No. of risk registersmaintained
- - 2 2 2 2
Capacity building forboard audit committee
No. of auditcommittee memberstrained andprofessional coursesattended
6 - 6 6 6 6
Audit committeemeetings
No of auditcommittee meetingsheld
4 4 4 4 4 4
Capacity building forboard audit committee
No. of auditcommittee memberstrained andprofessional coursesattended.
6 - 6 6 6 6

132
Programme Delivery Unit Key Outputs Key PerformanceIndicators
Target2015/16
ActualAchievement2015/16
Target(Baseline)
2016/17
Target2017/18
Target2018/19
Target2019/20
SP1.2: BoardManagement
BoardManagementServices
Timely communicationof Commission’sdecisions
Quarterly reportsreport onCommissionsdecisions andappointments
4 4 4 4 4 4
Name of Programme : Human Resource Management and DevelopmentOutcome: Improved service delivery for attainment of national development goals
SP 2.1:EstablishmentandManagementConsultancy
Establishmentand Restructuring
Guidelines onestablishment andabolition of offices inthe public servicedisseminated
No. of MDAsMHRMAC memberssensitized
- - 45 45 45 45
Guidelines onestablishment andabolition of offices inthe public servicereviewed
No. of guidelinesreviewed
- - - - 1 1
Job Evaluationand Schemes ofService
Competency frameworkfor civil servicedisseminated
No. of MDAsMHRMAC memberssensitized
- - 45 45 45 45
Framework on careerprogression guidelinesin MDAs implemented
Framework on careerprogressionguidelinesimplemented byMDAs
1 1 1 -
New grading structurein the civil serviceimplemented
Grading structureImplemented
- - - 100% - -
Authorizedestablishment in theMDA’s maintained
Authorizedestablishmentdatabase maintained
- - 1 1 1 1
OrganizationalDevelopment andDesign
Guidelines on design oforganizational structuresfor public servicedisseminated
No. of MDAsMHRMAC memberssensitized
- - - 45 -
Organizationalstructures for MDAsreviewed
No. of MDAsorganizationalstructures reviewed
45 16 45 45 45
Business Process HR norms and standardsof public service
Norms and standardguidelines developed
- - 1 - - -

133
Programme Delivery Unit Key Outputs Key PerformanceIndicators
Target2015/16
ActualAchievement2015/16
Target(Baseline)
2016/17
Target2017/18
Target2018/19
Target2019/20
Re-Engineering Guidelines on normsand standards of publicservice disseminated
No. of MDAsMHRMAC memberssensitized
- 45 45 45
Transition andDevolutionMatters
Technical assistance tocounty governments ondevolution matters
No. of countiesoffered technicalassistance
47 47 47 47 47 47
SP2.2 HumanResourceManagement
Recruitment &Selection
Vacant positionsdeclared by variousMDAs filled incompliance with theprovisions of theconstitution inrecruitment andappointments in theCivil Service as perArticle, 232 (g) (h) and(i).
% of vacantpositions filled anddata segregated bygender, PWDs,minority andmarginalized
100% 100% 100% 100% 100% 100%
Recruitment andselection tools reviewed
No. of recruitmentand selection toolsreviewed
- - 2 2 2 2
HR recruitment andselection policy
HR recruitment andselection policydeveloped
- - 1 - - -
Human resourceplanning guidelines
Human resourceplanning guidelinesdeveloped
- - - 1 - -
DisciplineAppeals andPetitions
Reviewed disciplinemanual disseminated
County publicservice boardssensitized
- - - 47 - -
Discipline managementsystem
No. of MDAs headsof HR and disciplineunits sensitized
45 45 45 - - -
Research on trend ofcourt cases related todiscipline in the publicservice
Research report - - - 2 - -
Processed disciplineand appeals cases
% of cases submittedand determined bythe Commission
100% 96.7% 100% 100% 100% 100%

134
Programme Delivery Unit Key Outputs Key PerformanceIndicators
Target2015/16
ActualAchievement2015/16
Target(Baseline)
2016/17
Target2017/18
Target2018/19
Target2019/20
Processed countyappeals cases
% of county appealscases submitted anddetermined by theCommission
100% 100% 100% 100% 100% 100%
SP2.3 HumanResourceDevelopment
HumanResource Policyand IndustrialRelations
Improved terms andconditions of civilservice
Reviewed terms andconditions report
- - - 1 - -
Human resourcemanagement policiesdeveloped /reviewed
No. of HRMpolicies/guidelinesdeveloped/ reviewed
3 10 4 2 5 5
Institutional Frameworkfor engagement withpublic service TradeUnions developed
Frameworkdeveloped
- - - 100% - -
No. of MDAsMHRMAC memberssensitized
- - - - 45 -
Human resource masterplan developed inphases
Human resourcemaster plandeveloped
10% 10% 30% 50% 70% 100%
Dissemination of HRMpolicies/guidelines to theservice
No. of MDAsSensitized
45 44 - - 45 45
Framework forcompetency testdeveloped
Framework forcompetency testsdeveloped
- - - 50% 70% 100%
Administration ofpromotionalexaminations
No. of examinationsadministered
4 4 4 4 4 4
Training andCareerDevelopment
HRD Policies andguidelines disseminated
No. of MDAsMHRMAC memberssensitized
- - - 45 - -
Human resourcecapacity building forMDAs and countypublic service boards
No. of MDAs andcounty public serviceboards
- - - 92 - -
HRM policies subjectedto stakeholder
No. of policiessubjected tostakeholders
- - - 1 1 1
PerformanceManagement
Capacity building andsensitization of publicofficers on revised staffperformance appraisal
No. of MDAs headof HR, deputies andtwo PAS championscapacity built
- - 45 - - -
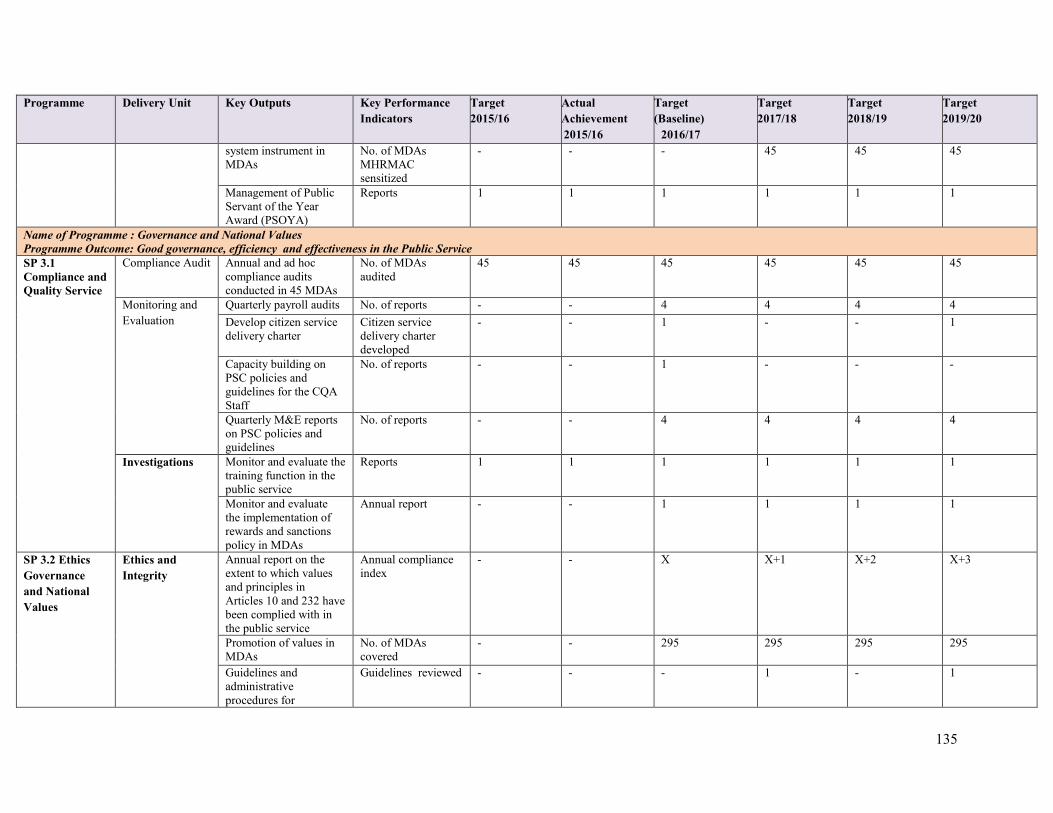
135
Programme Delivery Unit Key Outputs Key PerformanceIndicators
Target2015/16
ActualAchievement2015/16
Target(Baseline)
2016/17
Target2017/18
Target2018/19
Target2019/20
system instrument inMDAs
No. of MDAsMHRMACsensitized
- - - 45 45 45
Management of PublicServant of the YearAward (PSOYA)
Reports 1 1 1 1 1 1
Name of Programme : Governance and National ValuesProgramme Outcome: Good governance, efficiency and effectiveness in the Public ServiceSP 3.1Compliance andQuality Service
Compliance Audit Annual and ad hoccompliance auditsconducted in 45 MDAs
No. of MDAsaudited
45 45 45 45 45 45
Monitoring andEvaluation
Quarterly payroll audits No. of reports - - 4 4 4 4Develop citizen servicedelivery charter
Citizen servicedelivery charterdeveloped
- - 1 - - 1
Capacity building onPSC policies andguidelines for the CQAStaff
No. of reports - - 1 - - -
Quarterly M&E reportson PSC policies andguidelines
No. of reports - - 4 4 4 4
Investigations Monitor and evaluate thetraining function in thepublic service
Reports 1 1 1 1 1 1
Monitor and evaluatethe implementation ofrewards and sanctionspolicy in MDAs
Annual report - - 1 1 1 1
SP 3.2 EthicsGovernanceand NationalValues
Ethics andIntegrity
Annual report on theextent to which valuesand principles inArticles 10 and 232 havebeen complied with inthe public service
Annual complianceindex
- - X X+1 X+2 X+3
Promotion of values inMDAs
No. of MDAscovered
- - 295 295 295 295
Guidelines andadministrativeprocedures for
Guidelines reviewed - - - 1 - 1
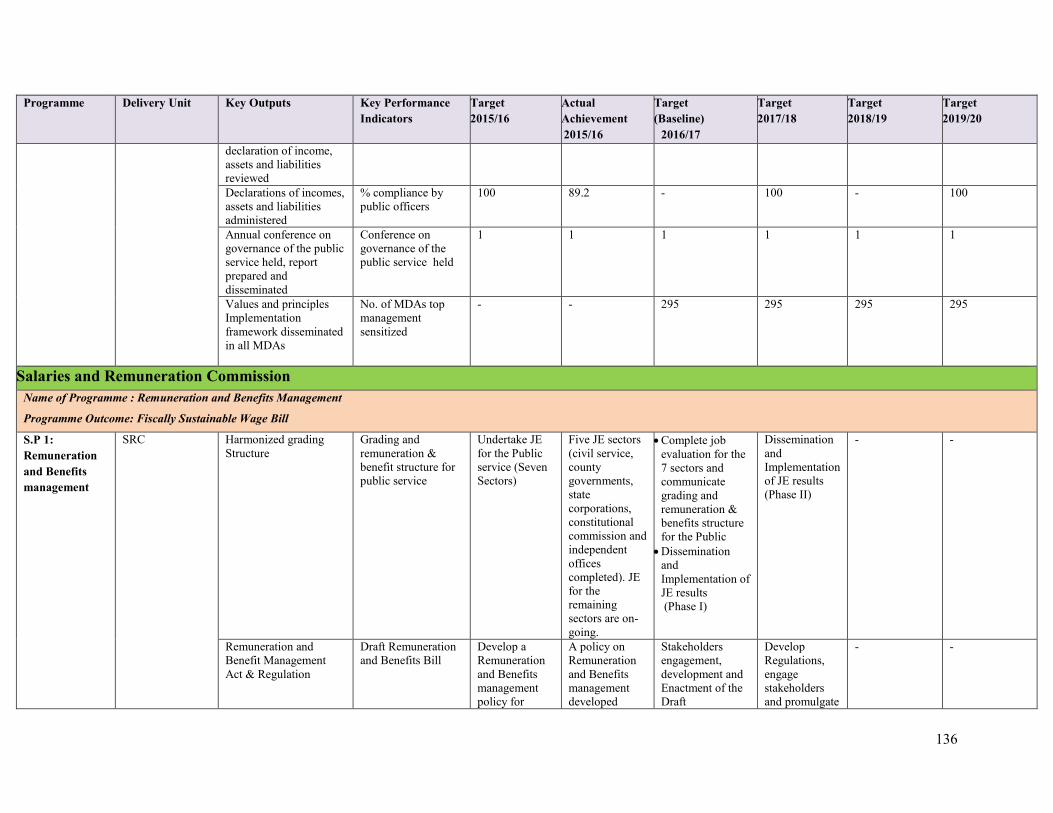
136
Programme Delivery Unit Key Outputs Key PerformanceIndicators
Target2015/16
ActualAchievement2015/16
Target(Baseline)
2016/17
Target2017/18
Target2018/19
Target2019/20
declaration of income,assets and liabilitiesreviewedDeclarations of incomes,assets and liabilitiesadministered
% compliance bypublic officers
100 89.2 - 100 - 100
Annual conference ongovernance of the publicservice held, reportprepared anddisseminated
Conference ongovernance of thepublic service held
1 1 1 1 1 1
Values and principlesImplementationframework disseminatedin all MDAs
No. of MDAs topmanagementsensitized
- - 295 295 295 295
Salaries and Remuneration CommissionName of Programme : Remuneration and Benefits Management
Programme Outcome: Fiscally Sustainable Wage Bill
S.P 1:Remunerationand Benefitsmanagement
SRC Harmonized gradingStructure
Grading andremuneration &benefit structure forpublic service
Undertake JEfor the Publicservice (SevenSectors)
Five JE sectors(civil service,countygovernments,statecorporations,constitutionalcommission andindependentofficescompleted). JEfor theremainingsectors are on-going.
Complete jobevaluation for the7 sectors andcommunicategrading andremuneration &benefits structurefor the PublicDissemination
andImplementation ofJE results(Phase I)
DisseminationandImplementationof JE results(Phase II)
- -
Remuneration andBenefit ManagementAct & Regulation
Draft Remunerationand Benefits Bill
Develop aRemunerationand Benefitsmanagementpolicy for
A policy onRemunerationand Benefitsmanagementdeveloped
Stakeholdersengagement,development andEnactment of theDraft
DevelopRegulations,engagestakeholdersand promulgate
- -
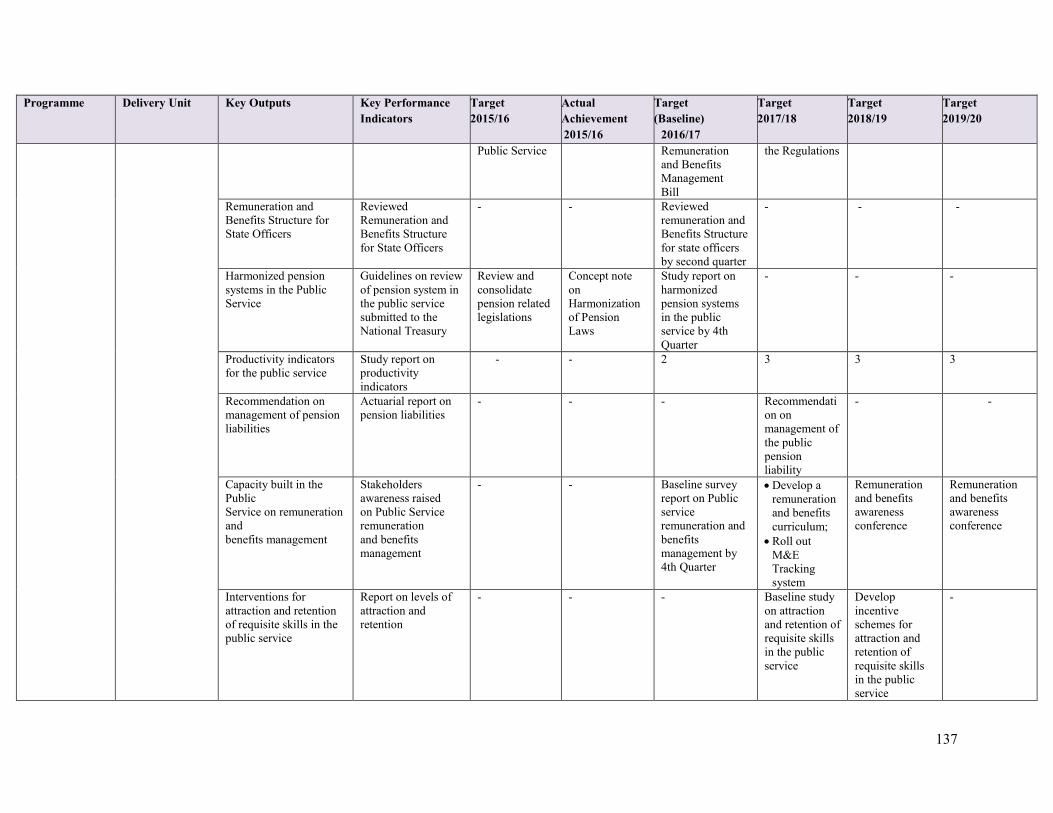
137
Programme Delivery Unit Key Outputs Key PerformanceIndicators
Target2015/16
ActualAchievement2015/16
Target(Baseline)
2016/17
Target2017/18
Target2018/19
Target2019/20
Public Service Remunerationand BenefitsManagementBill
the Regulations
Remuneration andBenefits Structure forState Officers
ReviewedRemuneration andBenefits Structurefor State Officers
- - Reviewedremuneration andBenefits Structurefor state officersby second quarter
- - -
Harmonized pensionsystems in the PublicService
Guidelines on reviewof pension system inthe public servicesubmitted to theNational Treasury
Review andconsolidatepension relatedlegislations
Concept noteonHarmonizationof PensionLaws
Study report onharmonizedpension systemsin the publicservice by 4thQuarter
- - -
Productivity indicatorsfor the public service
Study report onproductivityindicators
- - 2 3 3 3
Recommendation onmanagement of pensionliabilities
Actuarial report onpension liabilities
- - - Recommendation onmanagement ofthe publicpensionliability
- -
Capacity built in thePublicService on remunerationandbenefits management
Stakeholdersawareness raisedon Public Serviceremunerationand benefitsmanagement
- - Baseline surveyreport on Publicserviceremuneration andbenefitsmanagement by4th Quarter
Develop aremunerationand benefitscurriculum;Roll out
M&ETrackingsystem
Remunerationand benefitsawarenessconference
Remunerationand benefitsawarenessconference
Interventions forattraction and retentionof requisite skills in thepublic service
Report on levels ofattraction andretention
- - - Baseline studyon attractionand retention ofrequisite skillsin the publicservice
Developincentiveschemes forattraction andretention ofrequisite skillsin the publicservice
-
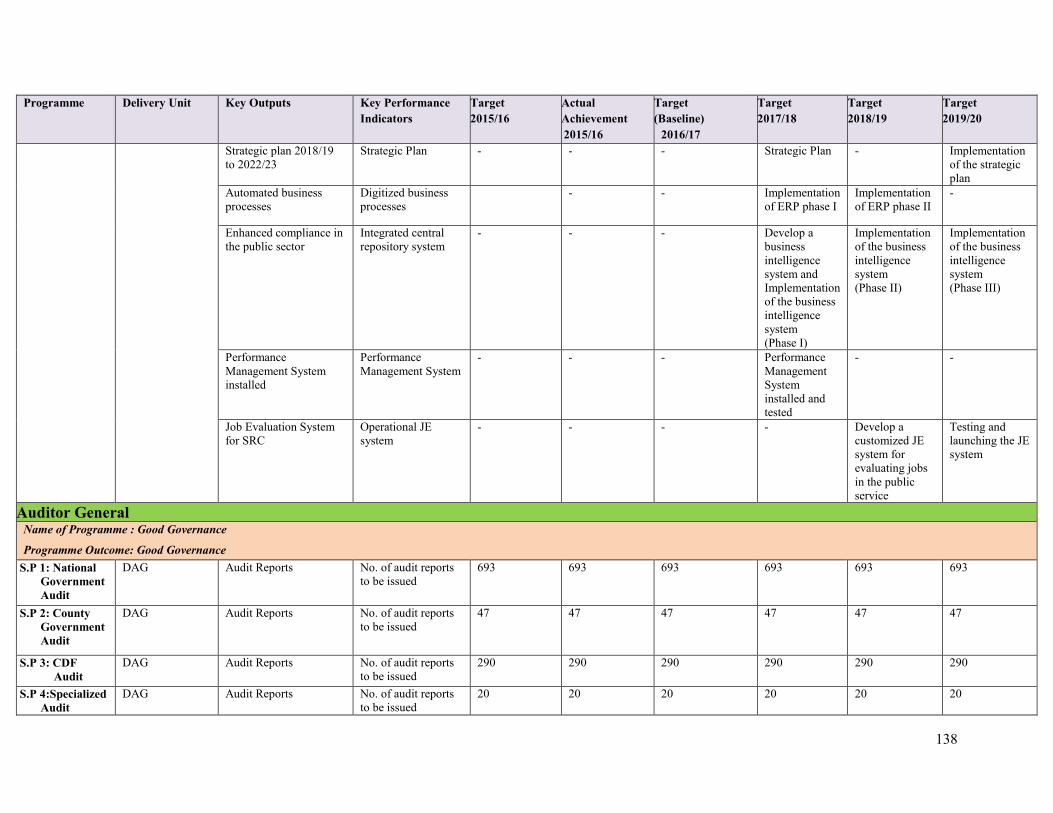
138
Programme Delivery Unit Key Outputs Key PerformanceIndicators
Target2015/16
ActualAchievement2015/16
Target(Baseline)
2016/17
Target2017/18
Target2018/19
Target2019/20
Strategic plan 2018/19to 2022/23
Strategic Plan - - - Strategic Plan - Implementationof the strategicplan
Automated businessprocesses
Digitized businessprocesses
- - Implementationof ERP phase I
Implementationof ERP phase II
-
Enhanced compliance inthe public sector
Integrated centralrepository system
- - - Develop abusinessintelligencesystem andImplementationof the businessintelligencesystem(Phase I)
Implementationof the businessintelligencesystem(Phase II)
Implementationof the businessintelligencesystem(Phase III)
PerformanceManagement Systeminstalled
PerformanceManagement System
- - - PerformanceManagementSysteminstalled andtested
- -
Job Evaluation Systemfor SRC
Operational JEsystem
- - - - Develop acustomized JEsystem forevaluating jobsin the publicservice
Testing andlaunching the JEsystem
Auditor GeneralName of Programme : Good Governance
Programme Outcome: Good GovernanceS.P 1: National
GovernmentAudit
DAG Audit Reports No. of audit reportsto be issued
693 693 693 693 693 693
S.P 2: CountyGovernmentAudit
DAG Audit Reports No. of audit reportsto be issued
47 47 47 47 47 47
S.P 3: CDFAudit
DAG Audit Reports No. of audit reportsto be issued
290 290 290 290 290 290
S.P 4:SpecializedAudit
DAG Audit Reports No. of audit reportsto be issued
20 20 20 20 20 20
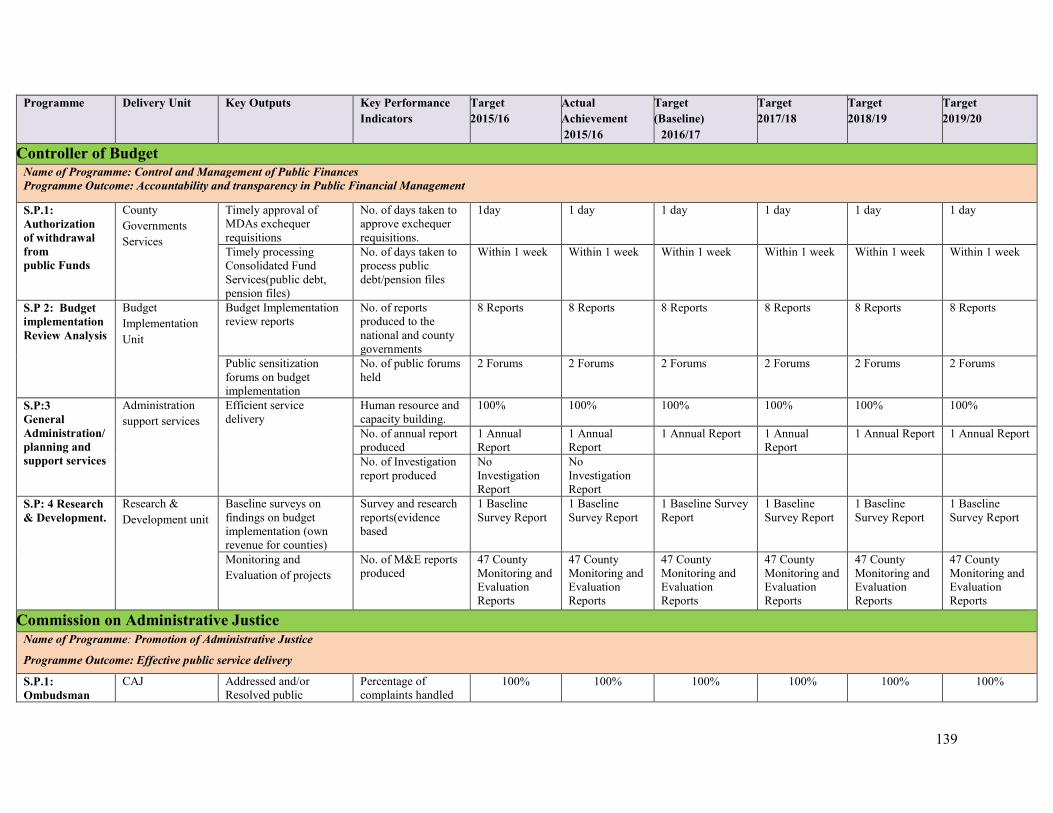
139
Programme Delivery Unit Key Outputs Key PerformanceIndicators
Target2015/16
ActualAchievement2015/16
Target(Baseline)
2016/17
Target2017/18
Target2018/19
Target2019/20
Controller of BudgetName of Programme: Control and Management of Public FinancesProgramme Outcome: Accountability and transparency in Public Financial Management
S.P.1:Authorizationof withdrawalfrompublic Funds
CountyGovernmentsServices
Timely approval ofMDAs exchequerrequisitions
No. of days taken toapprove exchequerrequisitions.
1day 1 day 1 day 1 day 1 day 1 day
Timely processingConsolidated FundServices(public debt,pension files)
No. of days taken toprocess publicdebt/pension files
Within 1 week Within 1 week Within 1 week Within 1 week Within 1 week Within 1 week
S.P 2: BudgetimplementationReview Analysis
BudgetImplementationUnit
Budget Implementationreview reports
No. of reportsproduced to thenational and countygovernments
8 Reports 8 Reports 8 Reports 8 Reports 8 Reports 8 Reports
Public sensitizationforums on budgetimplementation
No. of public forumsheld
2 Forums 2 Forums 2 Forums 2 Forums 2 Forums 2 Forums
S.P:3GeneralAdministration/planning andsupport services
Administrationsupport services
Efficient servicedelivery
Human resource andcapacity building.
100% 100% 100% 100% 100% 100%
No. of annual reportproduced
1 AnnualReport
1 AnnualReport
1 Annual Report 1 AnnualReport
1 Annual Report 1 Annual Report
No. of Investigationreport produced
NoInvestigationReport
NoInvestigationReport
S.P: 4 Research& Development.
Research &Development unit
Baseline surveys onfindings on budgetimplementation (ownrevenue for counties)
Survey and researchreports(evidencebased
1 BaselineSurvey Report
1 BaselineSurvey Report
1 Baseline SurveyReport
1 BaselineSurvey Report
1 BaselineSurvey Report
1 BaselineSurvey Report
Monitoring andEvaluation of projects
No. of M&E reportsproduced
47 CountyMonitoring andEvaluationReports
47 CountyMonitoring andEvaluationReports
47 CountyMonitoring andEvaluationReports
47 CountyMonitoring andEvaluationReports
47 CountyMonitoring andEvaluationReports
47 CountyMonitoring andEvaluationReports
Commission on Administrative JusticeName of Programme: Promotion of Administrative Justice
Programme Outcome: Effective public service delivery
S.P.1:Ombudsman
CAJ Addressed and/orResolved public
Percentage ofcomplaints handled
100% 100% 100% 100% 100% 100%
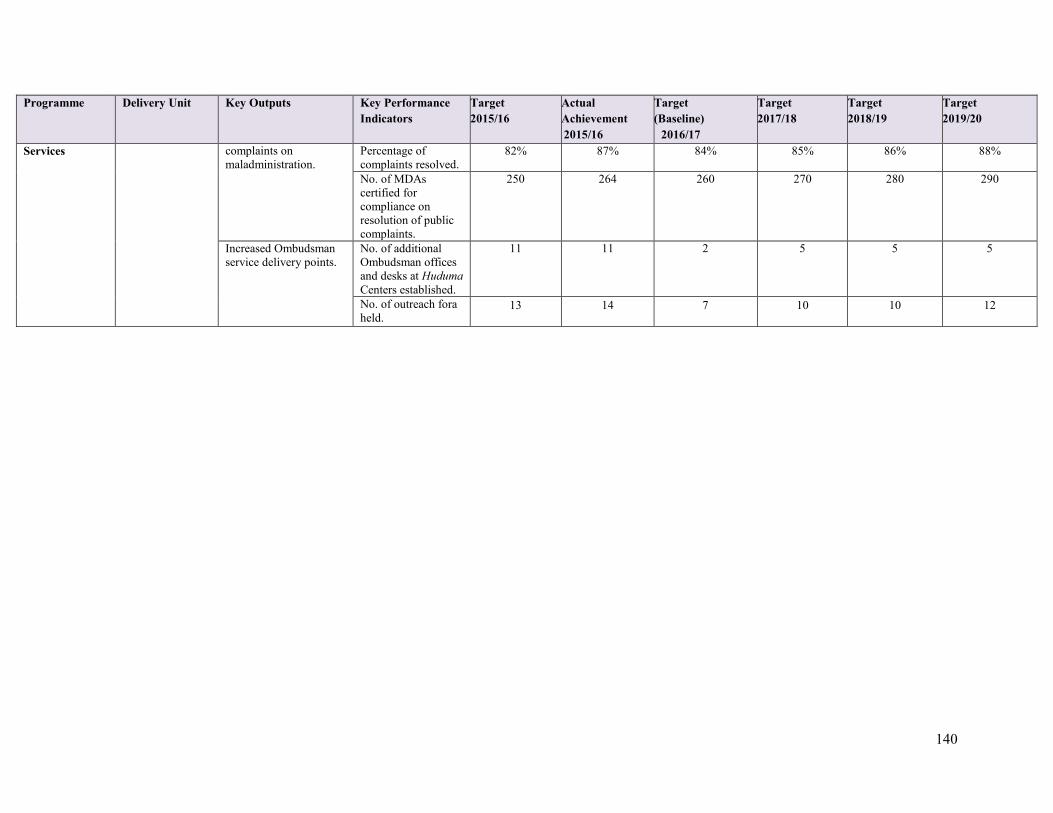
140
Programme Delivery Unit Key Outputs Key PerformanceIndicators
Target2015/16
ActualAchievement2015/16
Target(Baseline)
2016/17
Target2017/18
Target2018/19
Target2019/20
Services complaints onmaladministration.
Percentage ofcomplaints resolved.
82% 87% 84% 85% 86% 88%
No. of MDAscertified forcompliance onresolution of publiccomplaints.
250 264 260 270 280 290
Increased Ombudsmanservice delivery points.
No. of additionalOmbudsman officesand desks at HudumaCenters established.
11 11 2 5 5 5
No. of outreach foraheld.
13 14 7 10 10 12

141
3.1.3 Programmes by Order of Ranking (Criteria)
The programmes in the sector were ranked based on their conformity to the nine (9) factorslisted below. Each factor represented one score and the maximum score was 9. These weightsare shown in table 3.2 below.
a) Immediate response to the requirements and furtherance of the implementation of theConstitution.
b) Linkage of the programme with Kenya Vision 2030 objectives and its 2nd MediumTerm Plan (2013 – 2017).
c) Degree to which a programme addresses core poverty interventions.d) Degree to which the programme is addressing the core mandate of the sub-sector.e) Expected outputs and outcomes from a programme.f) Linkages with other programmes within the sector.g) On-going programmes/projects.h) Contribution to Prudent Financial Management.i) Affirmative action and harmonization

142
Ranking of Programmes
S/No Programme A B C D E F G H I Total1. State House Affairs x x x x x x x x x 9
2. Deputy President Services x x x x x x x x x 9
3. Management of CabinetAffairs
x x x x x x x x x 9
4. Government AdvisoryServices
x x x x x x x x x 9
5. Economic Policy andNational Planning
x x x x x x x x x 9
6. National StatisticalInformation Services
x x x x x x x x x 9
7. Monitoring and EvaluationServices
x x x x x x x x 8
8. NGO Regulatory Services x x x x 49. Integrated Regional
Developmentx x x x x x x x x 9
10. General AdministrationPlanning and SupportServices – Planning
x x x x x x x x 9
11. Devolution Services x x x x x x x x x 912. General Administration
Planning and SupportServices - Devolution
x x x x x x x x 8
13. General Administration,Planning and SupportServices – Foreign affairs
x x x x x x x x 8
14. Foreign Relations andDiplomacy.
x x x x x x x x x 9
15. Economic and CommercialDiplomacy
x x x x x x x x x 9
16. Foreign Policy Research,Capacity Development andTechnical Cooperation
x x x x x x x x x 9
17. General Administration,Planning and SupportServices – National Treasury
x x x x x x x x 8
18. Public FinancialManagement
x x x x x x x x x 9
19. Economic and Financial x x x x x x x x x 9
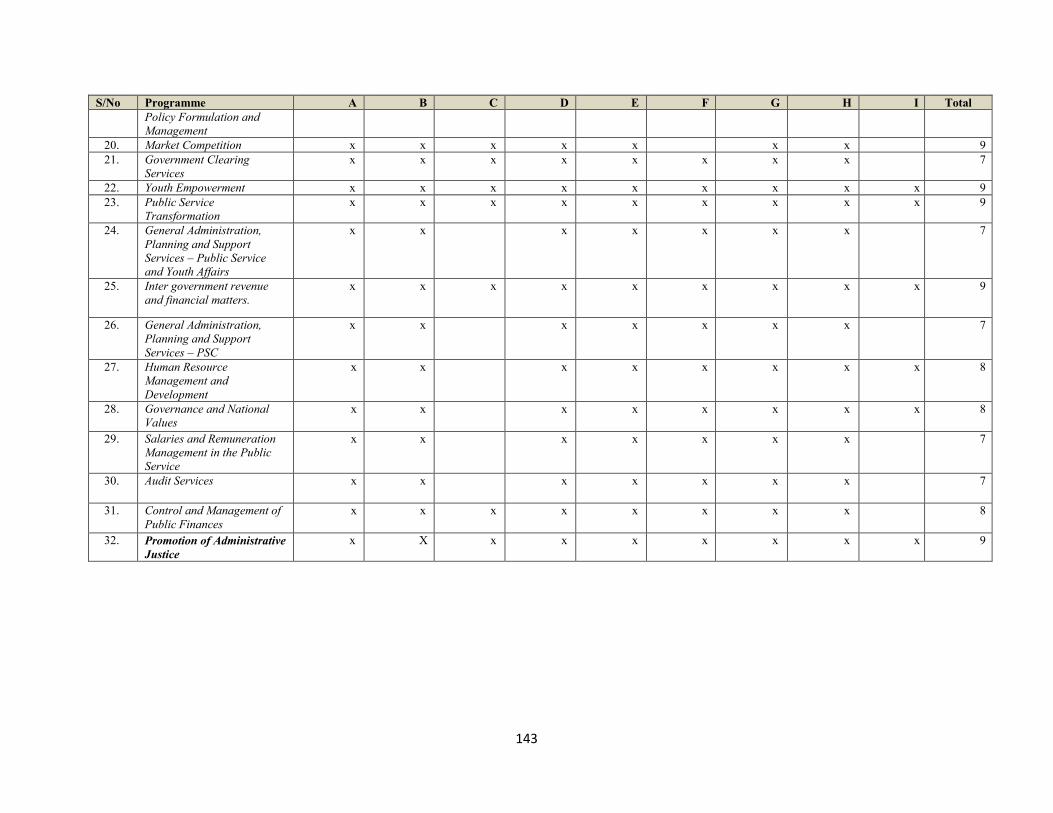
143
S/No Programme A B C D E F G H I TotalPolicy Formulation andManagement
20. Market Competition x x x x x x x 921. Government Clearing
Servicesx x x x x x x x 7
22. Youth Empowerment x x x x x x x x x 923. Public Service
Transformationx x x x x x x x x 9
24. General Administration,Planning and SupportServices – Public Serviceand Youth Affairs
x x x x x x x 7
25. Inter government revenueand financial matters.
x x x x x x x x x 9
26. General Administration,Planning and SupportServices – PSC
x x x x x x x 7
27. Human ResourceManagement andDevelopment
x x x x x x x x 8
28. Governance and NationalValues
x x x x x x x x 8
29. Salaries and RemunerationManagement in the PublicService
x x x x x x x 7
30. Audit Services x x x x x x x 7
31. Control and Management ofPublic Finances
x x x x x x x x 8
32. Promotion of AdministrativeJustice
x X x x x x x x x 9

144
3.2 Analysis of the Resource Requirement versus Allocation by Sector
The sector resource requirement is Kshs. 323,040million, Kshs 359,286million and Kshs.410,303million in 2017/18, 2018/19, and 2019/20 FY respectively compared to an allocation ofKshs. Kshs. 208,157million, Kshs. 212,743million and Kshs. 219,494million over the sameperiod. This represents a resource shortfall of Kshs. 112,292 million, Kshs. 143,832 million andKshs. 187,857million in 2017/18, 2018/19, and 2019/20 FY. The sector was allocated Kshs.204,526million during the FY 2017/18 compared to the baseline Kshs. 193,431million.Resource allocation to the sector is projected to rise to Kshs. 207,804 million and Kshs. 216,140million in 2018/19 and 2019/20 FY respectively.
The sector’s resource requirements versus allocations for both development and recurrent areshown in table 3.4 below.
Analysis of Resource Requirement versus Allocation by Sector, 2017/2018 - 2019/2020
Public Administrationand InternationalRelations
Baseline Requirements Allocations2016/17 2017/18 2018/19 2019/20 2017/18 2018/19 2019/20
Vote:Recurrent 87,578 147,534 159,611 168,752 95,581 90,920 92,147
Development 105,853 175,506 199,675 241,551 108,946 116,884 123,994Total 193,431 323,040 359,286 410,303 204,526 207,804 216,140
3.2.1 Resource requirement by sector -RecurrentThe sector recurrent resource requirement during the FY 2017/18 is Kshs. 147,534 millioncompared to the allocation of Kshs. 95,581 million. Recurrent resource requirements areprojected to rise to Kshs. 159,611 million and Kshs. 168,752 million in 2018/19 and 2019/20respectively. Table below shows the analysis of the recurrent resource requirement versusallocation.
Table 3. 2: Recurrent Requirements/AllocationsBaseline Requirement (Kshs. Millions) Allocation (Kshs. Millions)
2016/17 2017/18 2018/19 2019/20 2017/18 2018/19 2019/20
Gross 87,578 147,534 159,611 168,752 95,581 90,920 92,147AIA 831 756
756756 831 665 665
Net86,748
146,778158,855 167,996 94,750 90,255 91,482
Compensation toEmployees 21,045 45,350 46,992 48,670 28,076 22,240 22,877Transfers
26,36433,487
41,472 45,295 26,363 26,363 26,363OtherRecurrent 40,166
68,69571,145 74,783 41,136 42,314 42,902
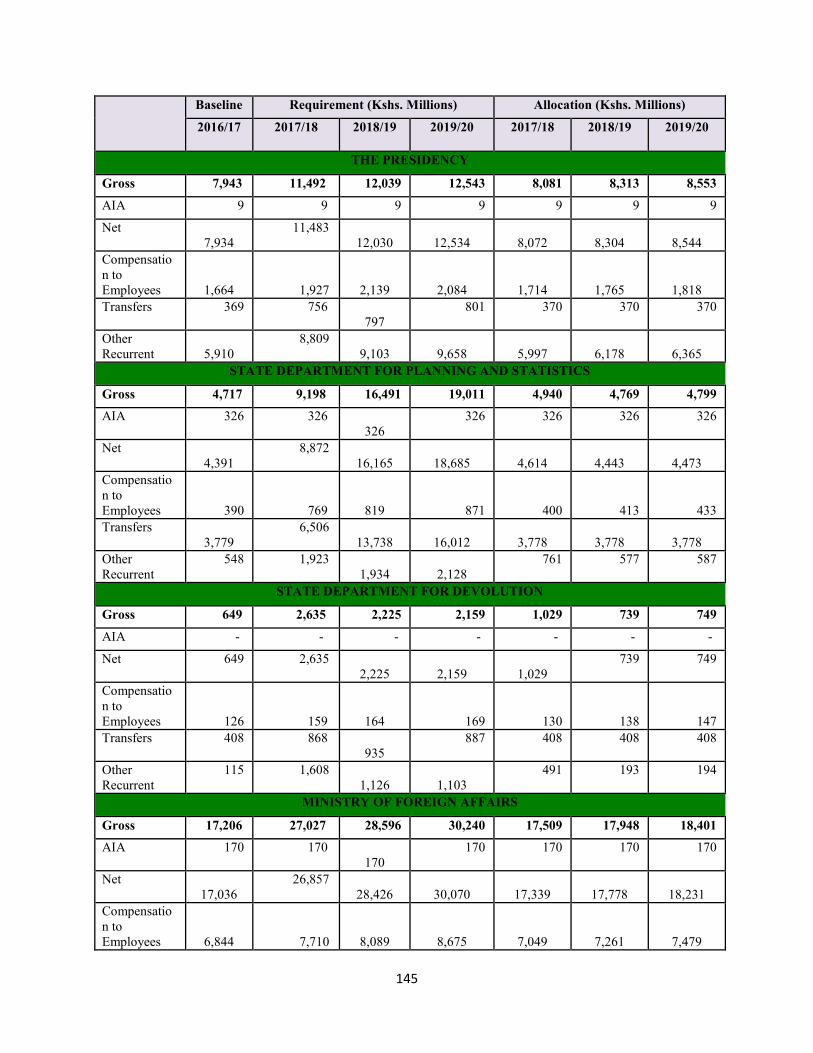
145
Baseline Requirement (Kshs. Millions) Allocation (Kshs. Millions)
2016/17 2017/18 2018/19 2019/20 2017/18 2018/19 2019/20
THE PRESIDENCY
Gross 7,943 11,492 12,039 12,543 8,081 8,313 8,553AIA 9 9 9 9 9 9 9
Net7,934
11,48312,030 12,534 8,072 8,304 8,544
Compensation toEmployees 1,664 1,927 2,139 2,084 1,714 1,765 1,818Transfers 369 756
797801 370 370 370
OtherRecurrent 5,910
8,8099,103 9,658 5,997 6,178 6,365
STATE DEPARTMENT FOR PLANNING AND STATISTICS
Gross 4,717 9,198 16,491 19,011 4,940 4,769 4,799AIA 326 326
326326 326 326 326
Net4,391
8,87216,165 18,685 4,614 4,443 4,473
Compensation toEmployees 390 769 819 871 400 413 433Transfers
3,7796,506
13,738 16,012 3,778 3,778 3,778OtherRecurrent
548 1,9231,934 2,128
761 577 587
STATE DEPARTMENT FOR DEVOLUTION
Gross 649 2,635 2,225 2,159 1,029 739 749AIA - - - - - - -
Net 649 2,6352,225 2,159 1,029
739 749
Compensation toEmployees 126 159 164 169 130 138 147Transfers 408 868
935887 408 408 408
OtherRecurrent
115 1,6081,126 1,103
491 193 194
MINISTRY OF FOREIGN AFFAIRS
Gross 17,206 27,027 28,596 30,240 17,509 17,948 18,401AIA 170 170
170170 170 170 170
Net17,036
26,85728,426 30,070 17,339 17,778 18,231
Compensation toEmployees 6,844 7,710 8,089 8,675 7,049 7,261 7,479

146
Baseline Requirement (Kshs. Millions) Allocation (Kshs. Millions)
2016/17 2017/18 2018/19 2019/20 2017/18 2018/19 2019/20
Transfers2,859
3,0453,255 3,547 2,859 2,859 2,859
OtherRecurrent 7,503
16,27217,252 18,018 7,601 7,828 8,063
THE NATIONAL TREASURY
Gross 36,741 64,547 65,756 68,178 43,395 38,025 38,006AIA - - - - - - -
Net36,741
64,54765,756 68,178 43,395 38,025 38,006
Compensation toEmployees 2,562 22,097 22,249 22,515 9,138 2,824 2,966Transfers
18,22121,432
21,805 23,036 18,221 18,221 18,221OtherRecurrent 15,958
21,01821,702 22,627 16,036 16,980 16,819
STATE DEPARTMENT FOR PUBLIC SERVICE AND YOUTH AFFAIRS
Gross 13,038 20,631 21,519 22,522 13,173 13,450 13,736AIA
176 176 176 176 176 176 176Net
12,862 20,455 21,343 22,346 12,997 13,274 13,560Compensation toEmployees 5,433 7,884 8,119 8,501 5,500 5,568 5,639Transfers
721 873 935 1,005 721 721 721OtherRecurrent 6,884 11,874 12,465 13,016 6,952 7,161 7,376
COMMISSION ON REVENUE ALLOCATION
Gross 357 526 536 550 365 376 387AIA - - - - - - -
Net 357 526536
550 365 376 387
Compensation toEmployees 191 192 234 256 196 202 207Transfers - - - - - - -
OtherRecurrent
166 334302
294 169 174 180
PUBLIC SERVICE COMMISSION
Gross 1,179 1,990 2,154 2,352 1,209 1,246 1,281AIA 1 1 1 1 1 1 1Net
1,178 1,989 2,153 2,351 1,208 1,245 1,280

147
Baseline Requirement (Kshs. Millions) Allocation (Kshs. Millions)
2016/17 2017/18 2018/19 2019/20 2017/18 2018/19 2019/20
Compensation toEmployees 556 603 813 843 573 591 607Transfers 2 2 2 2 2 2 2OtherRecurrent 621 1,385 1,339 1,507 634 653 672
SALARIES AND REMUNERATION COMMISSION
Gross 533 914 941 968 546 563 579AIA - - - - - - -Net
533 914 941 968 546 563 579Compensation toEmployees 228 254 267 280 235 242 249Transfers - - - - - - -OtherRecurrent 305 660 674 688 311 321 330
AUDITOR GENERAL
Gross 4,183 7,223 7,945 8,737 4,276 4,404 4,536AIA
150 150 150 150 150 150 150Net
4,033 7,073 7,795 8,587 4,126 4,254 4,386Compensation toEmployees 2,540 3,219 3,541 3,894 2,616 2,695 2,776Transfers 6 6 6 6 6 6 6OtherRecurrent 1,637 3,998 4,398 4,837 1,654 1,703 1,754
OFFICE OF THE CONTROLLER OF BUDGET
Gross 561 600 623 650 575 593 610AIA - - - - - - -Net
561 600 623 650 575 593 610Compensation toEmployees 277 296 308 320 285 294 302Transfers - - - - - - -OtherRecurrent 284 304 315 330 290 299 308
COMMISSION ON ADMINISTRATIVE JUSTICE
Gross 469 751 786 840 480 494 508AIA - - - - - - -Net 469 751 840 480 494 508
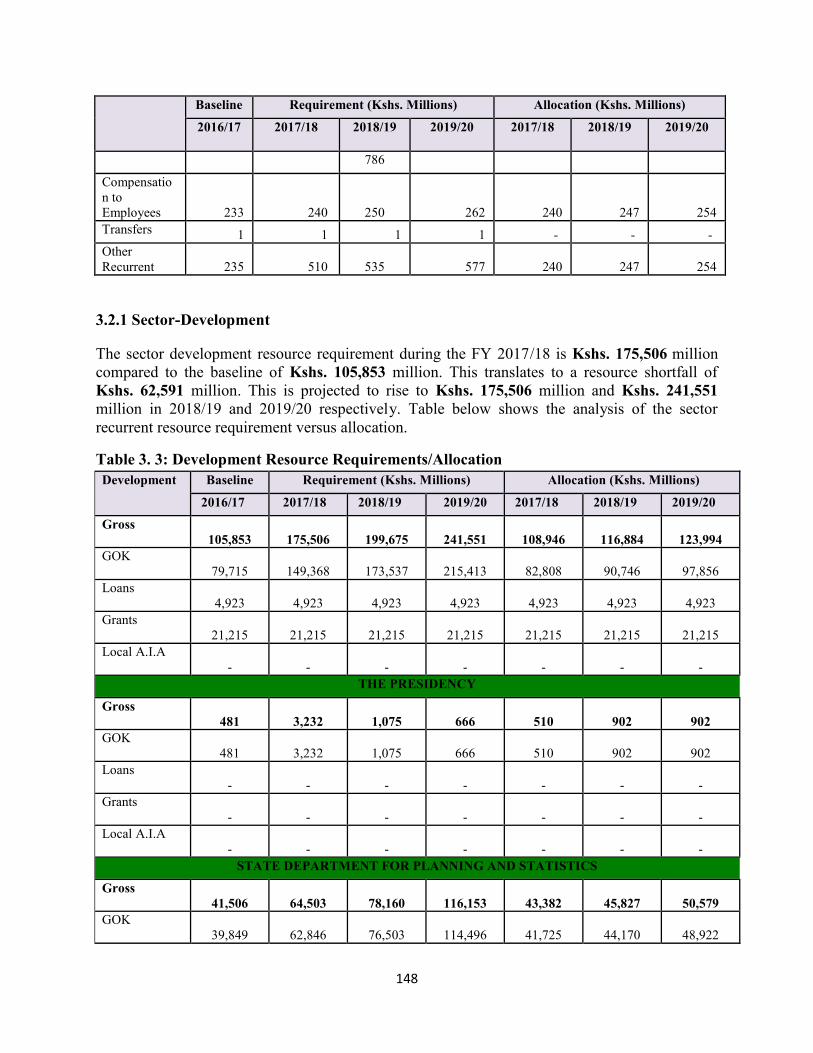
148
Baseline Requirement (Kshs. Millions) Allocation (Kshs. Millions)
2016/17 2017/18 2018/19 2019/20 2017/18 2018/19 2019/20
786
Compensation toEmployees 233 240 250 262 240 247 254Transfers 1 1 1 1 - - -OtherRecurrent 235 510 535 577 240 247 254
3.2.1 Sector-Development
The sector development resource requirement during the FY 2017/18 is Kshs. 175,506 millioncompared to the baseline of Kshs. 105,853 million. This translates to a resource shortfall ofKshs. 62,591 million. This is projected to rise to Kshs. 175,506 million and Kshs. 241,551million in 2018/19 and 2019/20 respectively. Table below shows the analysis of the sectorrecurrent resource requirement versus allocation.
Table 3. 3: Development Resource Requirements/AllocationDevelopment Baseline Requirement (Kshs. Millions) Allocation (Kshs. Millions)
2016/17 2017/18 2018/19 2019/20 2017/18 2018/19 2019/20Gross
105,853 175,506 199,675 241,551 108,946 116,884 123,994GOK
79,715 149,368 173,537 215,413 82,808 90,746 97,856Loans
4,923 4,923 4,923 4,923 4,923 4,923 4,923Grants
21,215 21,215 21,215 21,215 21,215 21,215 21,215Local A.I.A
- - - - - - -THE PRESIDENCY
Gross481 3,232 1,075 666 510 902 902
GOK481 3,232 1,075 666 510 902 902
Loans- - - - - - -
Grants- - - - - - -
Local A.I.A- - - - - - -
STATE DEPARTMENT FOR PLANNING AND STATISTICS
Gross41,506 64,503 78,160 116,153 43,382 45,827 50,579
GOK39,849 62,846 76,503 114,496 41,725 44,170 48,922
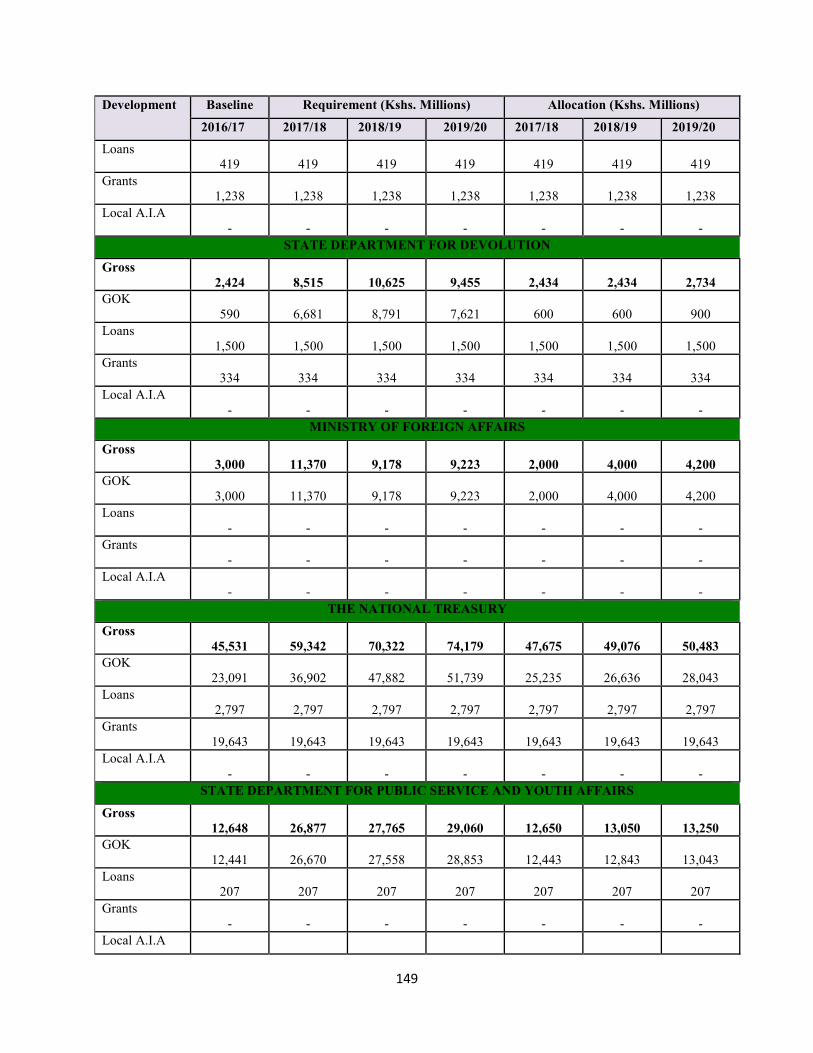
149
Development Baseline Requirement (Kshs. Millions) Allocation (Kshs. Millions)
2016/17 2017/18 2018/19 2019/20 2017/18 2018/19 2019/20Loans
419 419 419 419 419 419 419Grants
1,238 1,238 1,238 1,238 1,238 1,238 1,238Local A.I.A
- - - - - - -STATE DEPARTMENT FOR DEVOLUTION
Gross2,424 8,515 10,625 9,455 2,434 2,434 2,734
GOK590 6,681 8,791 7,621 600 600 900
Loans1,500 1,500 1,500 1,500 1,500 1,500 1,500
Grants334 334 334 334 334 334 334
Local A.I.A- - - - - - -
MINISTRY OF FOREIGN AFFAIRS
Gross3,000 11,370 9,178 9,223 2,000 4,000 4,200
GOK3,000 11,370 9,178 9,223 2,000 4,000 4,200
Loans- - - - - - -
Grants- - - - - - -
Local A.I.A- - - - - - -
THE NATIONAL TREASURY
Gross45,531 59,342 70,322 74,179 47,675 49,076 50,483
GOK23,091 36,902 47,882 51,739 25,235 26,636 28,043
Loans2,797 2,797 2,797 2,797 2,797 2,797 2,797
Grants19,643 19,643 19,643 19,643 19,643 19,643 19,643
Local A.I.A- - - - - - -
STATE DEPARTMENT FOR PUBLIC SERVICE AND YOUTH AFFAIRS
Gross12,648 26,877 27,765 29,060 12,650 13,050 13,250
GOK12,441 26,670 27,558 28,853 12,443 12,843 13,043
Loans207 207 207 207 207 207 207
Grants- - - - - - -
Local A.I.A

150
Development Baseline Requirement (Kshs. Millions) Allocation (Kshs. Millions)
2016/17 2017/18 2018/19 2019/20 2017/18 2018/19 2019/20- - - - - - -
PUBLIC SERVICE COMMISSION
Gross39 167 900 1,000 60 860 1,000
GOK39 167 900 1,000 60 860 1,000
Loans- - - - - - -
Grants- - - - - - -
Local A.I.A- - - - - - -
AUDITOR GENERAL
Gross224 1,500 1,650 1,815 235 735 846
GOK224 1,500 1,650 1,815 235 735 846
Loans- - - - - - -
Grants- - - - - - -
Local A.I.A- - - - - - -
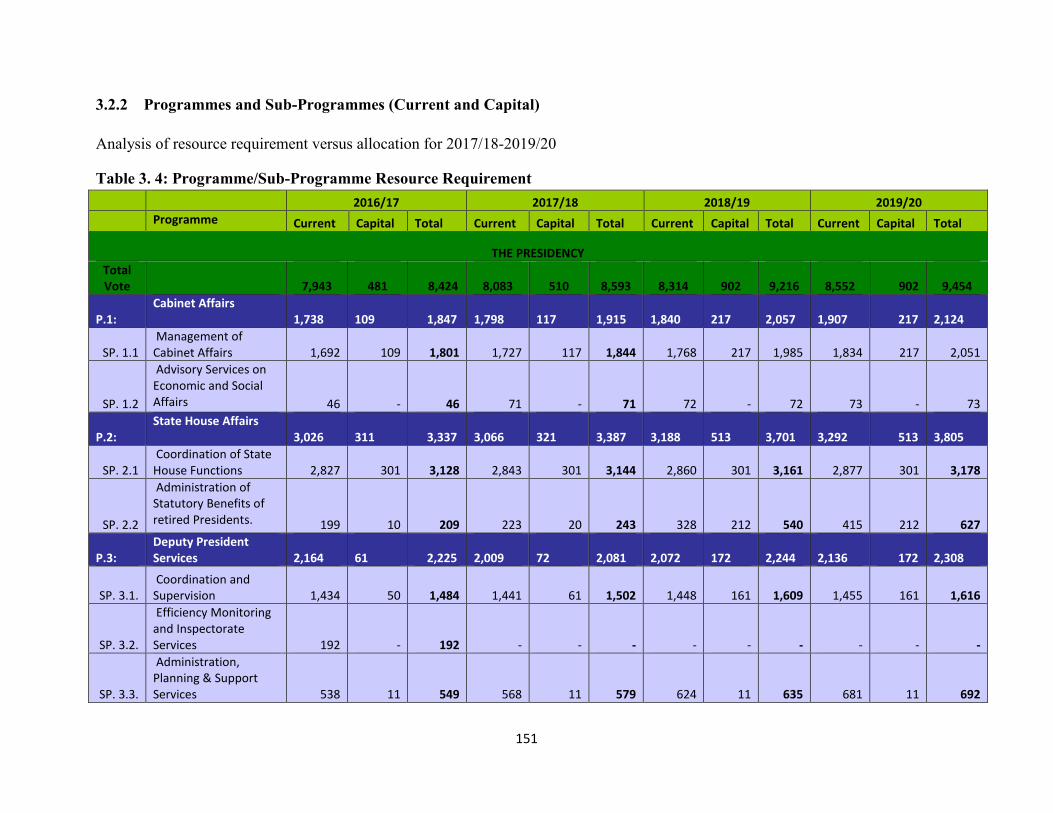
151
3.2.2 Programmes and Sub-Programmes (Current and Capital)
Analysis of resource requirement versus allocation for 2017/18-2019/20
Table 3. 4: Programme/Sub-Programme Resource Requirement2016/17 2017/18 2018/19 2019/20
Programme Current Capital Total Current Capital Total Current Capital Total Current Capital Total
THE PRESIDENCYTotalVote 7,943 481 8,424 8,083 510 8,593 8,314 902 9,216 8,552 902 9,454
P.1:Cabinet Affairs
1,738 109 1,847 1,798 117 1,915 1,840 217 2,057 1,907 217 2,124
SP. 1.1Management of
Cabinet Affairs 1,692 109 1,801 1,727 117 1,844 1,768 217 1,985 1,834 217 2,051
SP. 1.2
Advisory Services onEconomic and SocialAffairs 46 - 46 71 - 71 72 - 72 73 - 73
P.2:State House Affairs
3,026 311 3,337 3,066 321 3,387 3,188 513 3,701 3,292 513 3,805
SP. 2.1Coordination of State
House Functions 2,827 301 3,128 2,843 301 3,144 2,860 301 3,161 2,877 301 3,178
SP. 2.2
Administration ofStatutory Benefits ofretired Presidents. 199 10 209 223 20 243 328 212 540 415 212 627
P.3:Deputy PresidentServices 2,164 61 2,225 2,009 72 2,081 2,072 172 2,244 2,136 172 2,308
SP. 3.1.Coordination and
Supervision 1,434 50 1,484 1,441 61 1,502 1,448 161 1,609 1,455 161 1,616
SP. 3.2.
Efficiency Monitoringand InspectorateServices 192 - 192 - - - - - - - - -
SP. 3.3.
Administration,Planning & SupportServices 538 11 549 568 11 579 624 11 635 681 11 692
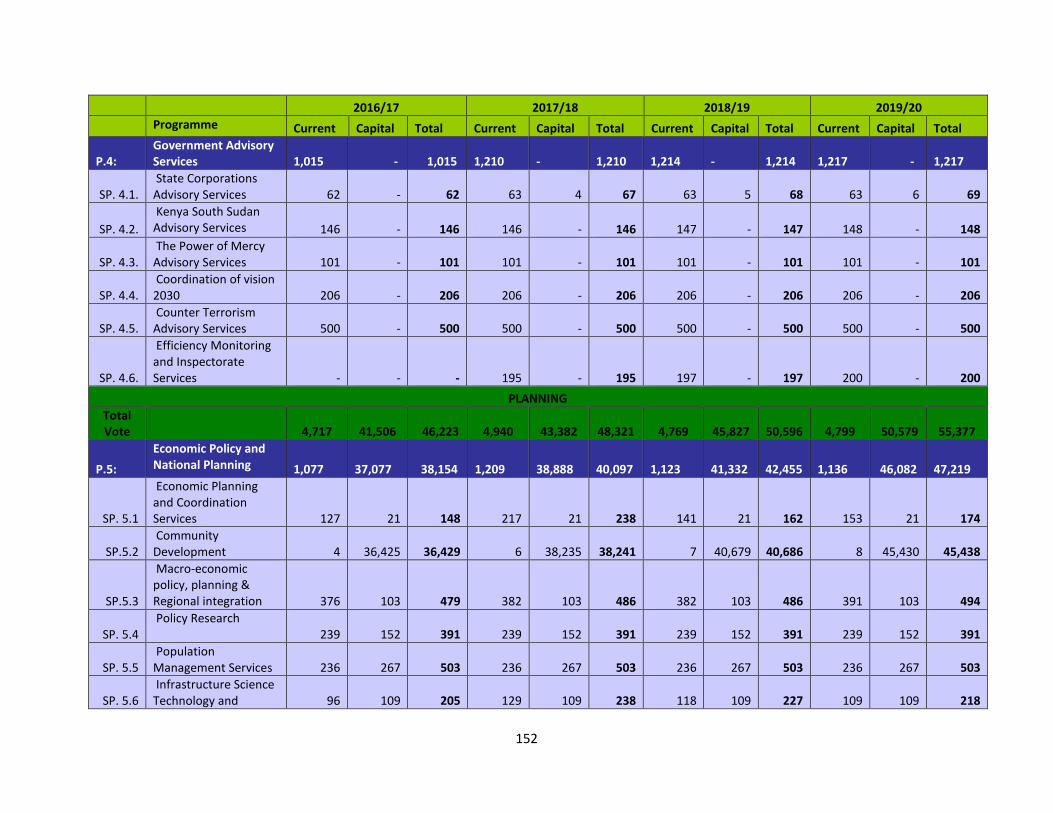
152
2016/17 2017/18 2018/19 2019/20Programme Current Capital Total Current Capital Total Current Capital Total Current Capital Total
P.4:Government AdvisoryServices 1,015 - 1,015 1,210 - 1,210 1,214 - 1,214 1,217 - 1,217
SP. 4.1.State Corporations
Advisory Services 62 - 62 63 4 67 63 5 68 63 6 69
SP. 4.2.Kenya South Sudan
Advisory Services 146 - 146 146 - 146 147 - 147 148 - 148
SP. 4.3.The Power of Mercy
Advisory Services 101 - 101 101 - 101 101 - 101 101 - 101
SP. 4.4.Coordination of vision
2030 206 - 206 206 - 206 206 - 206 206 - 206
SP. 4.5.Counter Terrorism
Advisory Services 500 - 500 500 - 500 500 - 500 500 - 500
SP. 4.6.
Efficiency Monitoringand InspectorateServices - - - 195 - 195 197 - 197 200 - 200
PLANNINGTotalVote 4,717 41,506 46,223 4,940 43,382 48,321 4,769 45,827 50,596 4,799 50,579 55,377
P.5:Economic Policy andNational Planning 1,077 37,077 38,154 1,209 38,888 40,097 1,123 41,332 42,455 1,136 46,082 47,219
SP. 5.1
Economic Planningand CoordinationServices 127 21 148 217 21 238 141 21 162 153 21 174
SP.5.2Community
Development 4 36,425 36,429 6 38,235 38,241 7 40,679 40,686 8 45,430 45,438
SP.5.3
Macro-economicpolicy, planning &Regional integration 376 103 479 382 103 486 382 103 486 391 103 494
SP. 5.4Policy Research
239 152 391 239 152 391 239 152 391 239 152 391
SP. 5.5Population
Management Services 236 267 503 236 267 503 236 267 503 236 267 503
SP. 5.6Infrastructure Science
Technology and 96 109 205 129 109 238 118 109 227 109 109 218

153
2016/17 2017/18 2018/19 2019/20Programme Current Capital Total Current Capital Total Current Capital Total Current Capital TotalInnovation
P.6:National StatisticalInformation Services 1,833 1,465 3,298 1,833 1,465 3,298 1,833 1,447 3,280 1,833 1,447 3,280
SP. 6.1Census and Survey
783 76 859 783 76 859 783 58 841 783 58 841
SP. 6.2Surveys
1,050 1,389 2,439 1,050 1,389 2,439 1,050 1,389 2,439 1,050 1,389 2,439
P.7:Monitoring andEvaluation Services 53 112 165 149 212 361 64 231 296 80 232 313
SP.7.1
National IntegratedMonitoring andEvaluation 53 112 165 149 212 361 64 231 296 80 232 313
P.8:
GeneralAdministration andSupport Services forPlanning 583 35 618 578 - 578 578 - 578 578 - 578
SP.8.1Human Resource &
Support Services 450 35 485 442 - 442 442 - 442 442 - 442
SP.8.2Financial
Management Services 106 - 106 113 - 113 113 - 113 113 - 113
SP.8.3
Information andCommunicationTechnology 27 - 27 23 - 23 23 - 23 23 - 23
P.9:Integrated RegionalDevelopment 1,045 2,817 3,862 1,045 2,817 3,862 1,045 2,817 3,862 1,046 2,817 3,863
SP. 9.1Integrated Bain Based
Development 1,045 2,817 3,862 1,045 2,817 3,862 1,045 2,817 3,862 1,046 2,817 3,863
P.10:NGO RegulatoryServices 126 - 126 125 - 125 125 - 125 125 - 125
SP.10.1
NGO RegulatoryServices 126 - 126 125 - 125 125 - 125 125 - 125
DEVOLUTIONTotalVote 649 2,424 3,072 1,029 2,434 7,327 739 2,434 8,320 749 2,734 7,069

154
2016/17 2017/18 2018/19 2019/20Programme Current Capital Total Current Capital Total Current Capital Total Current Capital Total
P.11:
GeneralAdministrationServices 133 20 153 246 20 266 251 - 251 254 - 254
SP.11.1
AdministrativeHeadquarters 121 - 121 234 - 234 237 - 237 240 - 240
SP.11.2
Finance and PlanningServices 7 - 7 7 - 7 8 - 8 8 - 8
SP.11.3
ICT5 20 25 5 20 25 6 - 6 6 - 6
P.12:Devolution Services
516 2,404 2,919 783 2,414 7,061 488 2,434 8,069 495 2,734 6,815SP.12.1
Management ofDevolution Affairs 88 120 207 55 120 273 60 120 281 67 150 317
SP.12.2
IntergovernmentalRelations 413 134 548 713 144 857 413 144 557 413 145 548
SP.12.3
Capacity Building15 2,150 2,165 15 2,150 5,931 15 2,170 7,231 15 2,439 5,950
FOREIGN AFFAIRSTotalVote 17,206 3,000 20,206 17,508 2,000 19,508 17,948 4,000 21,948 18,401 4,200 22,601
P.13:
GeneralAdministration,Planning and SupportServices 4,783 234 5,017 3,097 20 3,117 3,113 50 3,163 3,129 70 3,199
SP.13.1
PlanningAdministrationServices 4,783 234 5,017 3,097 20 3,117 3,113 50 3,163 3,129 70 3,199
P.14:Foreign Relations andDiplomacy 12,423 2,766 15,189 14,323 1,730 16,053 14,684 3,650 18,334 14,891 3,766 18,657
SP.14.1
International Relationsand Cooperation 12,423 2,000 14,423 12,655 - 12,655 12,951 - 12,951 13,153 - 13,153

155
2016/17 2017/18 2018/19 2019/20Programme Current Capital Total Current Capital Total Current Capital Total Current Capital Total
SP.14.2
Management ofInternational Treaties,Agreements andConventions - - - 49 - 49 49 - 49 49 - 49
SP.14.3
Coordination of StateProtocol - - - 1,589 - 1,589 1,589 - 1,589 1,589 - 1,589
SP.14.4
Management ofDiaspora and ConsularAffairs - - - 30 - 30 95 - 95 100 - 100
SP.14.5
InfrastructureDevelopment forMissions Abroad - 766 766 - 1,730 1,730 - 3,650 3,650 - 3,766 3,766
P.15:
Economic andCommercialDiplomacy - - - 40 - 40 130 - 130 180 - 180
SP.15.1
Economic andCommercialCooperation - - - 20 - 20 30 - 30 100 - 100
SP.15.2
Regional Integration,Bilateral andMultilateral EconomicCooperation - - - 20 - 20 100 - 100 80 - 80
P.16:
Foreign PolicyResearch, CapacityDevelopment andTechnical Cooperation - - - 48 250 298 21 300 321 201 364 565
SP.16.1
Foreign PolicyResearch and Analysis - - - 48 - 48 21 - 21 111 - 111
SP.16.2
Regional TechnicalCooperation - - - - 250 250 - 300 300 90 364 454
NATIONAL TREASURYTotalVote 36,740 45,531 82,271 43,396 47,675 91,071 38,025 49,076 87,101 38,006 50,483 88,489
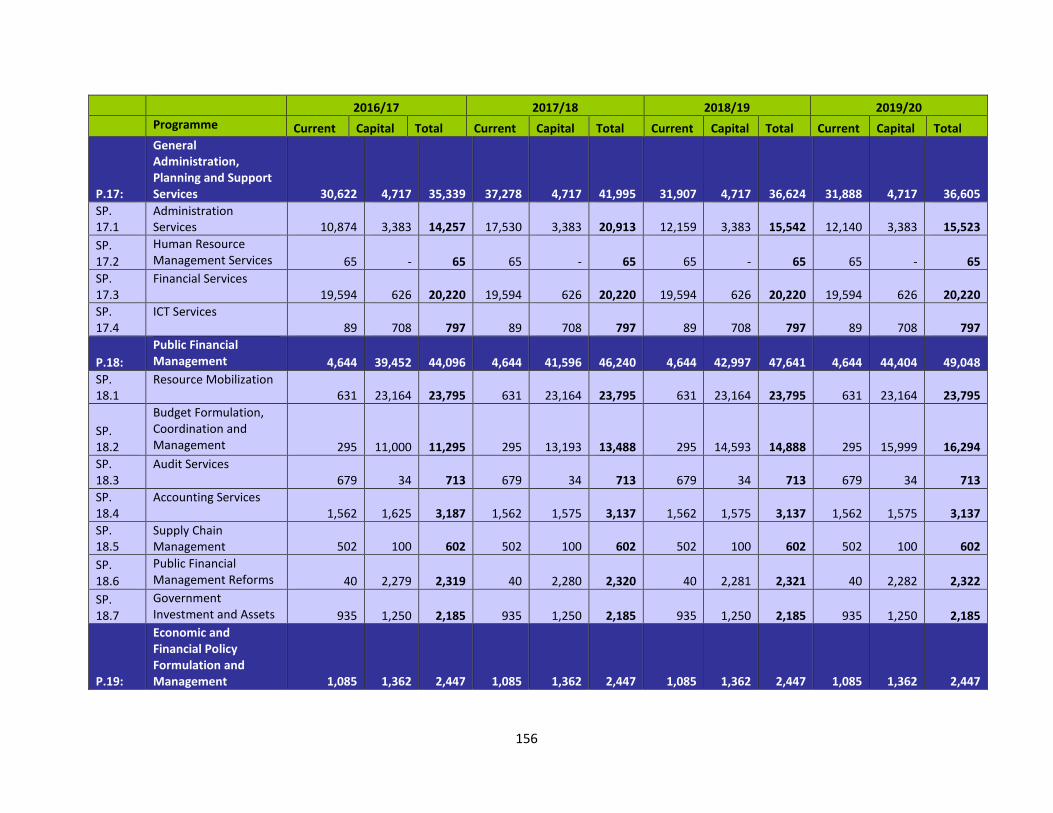
156
2016/17 2017/18 2018/19 2019/20Programme Current Capital Total Current Capital Total Current Capital Total Current Capital Total
P.17:
GeneralAdministration,Planning and SupportServices 30,622 4,717 35,339 37,278 4,717 41,995 31,907 4,717 36,624 31,888 4,717 36,605
SP.17.1
AdministrationServices 10,874 3,383 14,257 17,530 3,383 20,913 12,159 3,383 15,542 12,140 3,383 15,523
SP.17.2
Human ResourceManagement Services 65 - 65 65 - 65 65 - 65 65 - 65
SP.17.3
Financial Services19,594 626 20,220 19,594 626 20,220 19,594 626 20,220 19,594 626 20,220
SP.17.4
ICT Services89 708 797 89 708 797 89 708 797 89 708 797
P.18:Public FinancialManagement 4,644 39,452 44,096 4,644 41,596 46,240 4,644 42,997 47,641 4,644 44,404 49,048
SP.18.1
Resource Mobilization631 23,164 23,795 631 23,164 23,795 631 23,164 23,795 631 23,164 23,795
SP.18.2
Budget Formulation,Coordination andManagement 295 11,000 11,295 295 13,193 13,488 295 14,593 14,888 295 15,999 16,294
SP.18.3
Audit Services679 34 713 679 34 713 679 34 713 679 34 713
SP.18.4
Accounting Services1,562 1,625 3,187 1,562 1,575 3,137 1,562 1,575 3,137 1,562 1,575 3,137
SP.18.5
Supply ChainManagement 502 100 602 502 100 602 502 100 602 502 100 602
SP.18.6
Public FinancialManagement Reforms 40 2,279 2,319 40 2,280 2,320 40 2,281 2,321 40 2,282 2,322
SP.18.7
GovernmentInvestment and Assets 935 1,250 2,185 935 1,250 2,185 935 1,250 2,185 935 1,250 2,185
P.19:
Economic andFinancial PolicyFormulation andManagement 1,085 1,362 2,447 1,085 1,362 2,447 1,085 1,362 2,447 1,085 1,362 2,447

157
2016/17 2017/18 2018/19 2019/20Programme Current Capital Total Current Capital Total Current Capital Total Current Capital Total
SP.19.1
Fiscal PolicyFormulation andManagement 953 512 1,465 953 512 1,465 953 512 1,465 953 512 1,465
SP.19.2
Debt Management132 - 132 132 - 132 132 - 132 132 - 132
SP.19.3
Micro Finance SectorSupport andDevelopment - 850 850 - 850 850 - 850 850 - 850 850
P.20:
Market Competitionand Creation of anEnabling BusinessEnvironment 340 - 340 340 - 340 340 - 340 340 - 340
SP.20.1
Elimination ofRestrictive TradePractices 340 - 340 340 - 340 340 - 340 340 - 340
P.21:Government ClearingServices 49 - 49 49 - 49 49 - 49 49 - 49
P.21:1Government ClearingServices 49 - 49 49 - 49 49 - 49 49 - 49
STATE DEPARTMENT OF PUBLIC SERVICE AND YOUTH AFFAIRSTotalVote 13,038 12,648 25,686 13,173 12,652 25,825 13,449 13,052 26,501 13,735 13,252 26,987
P.22:Youth Empowerment
7,588 10,911 18,499 7,632 10,912 18,544 7,676 11,062 18,738 7,723 11,162 18,885
SP.22.1National Youth Service
6,465 10,399 16,864 6,497 10,400 16,896 6,529 10,550 17,079 6,563 10,650 17,213
SP.22.2Youth DevelopmentServices 798 207 1,005 810 207 1,017 822 207 1,029 835 207 1,042
SP.22.3Youth EmploymentScheme 291 305 596 291 305 597 291 305 596 291 305 596
SP.22.4Youth Coordinationand Representation 34 - 34 34 - 34 34 - 34 34 - 34
P.23:Public ServiceTransformation 5,450 1,737 7,187 5,473 1,740 7,213 5,496 1,990 7,486 5,520 2,090 7,610
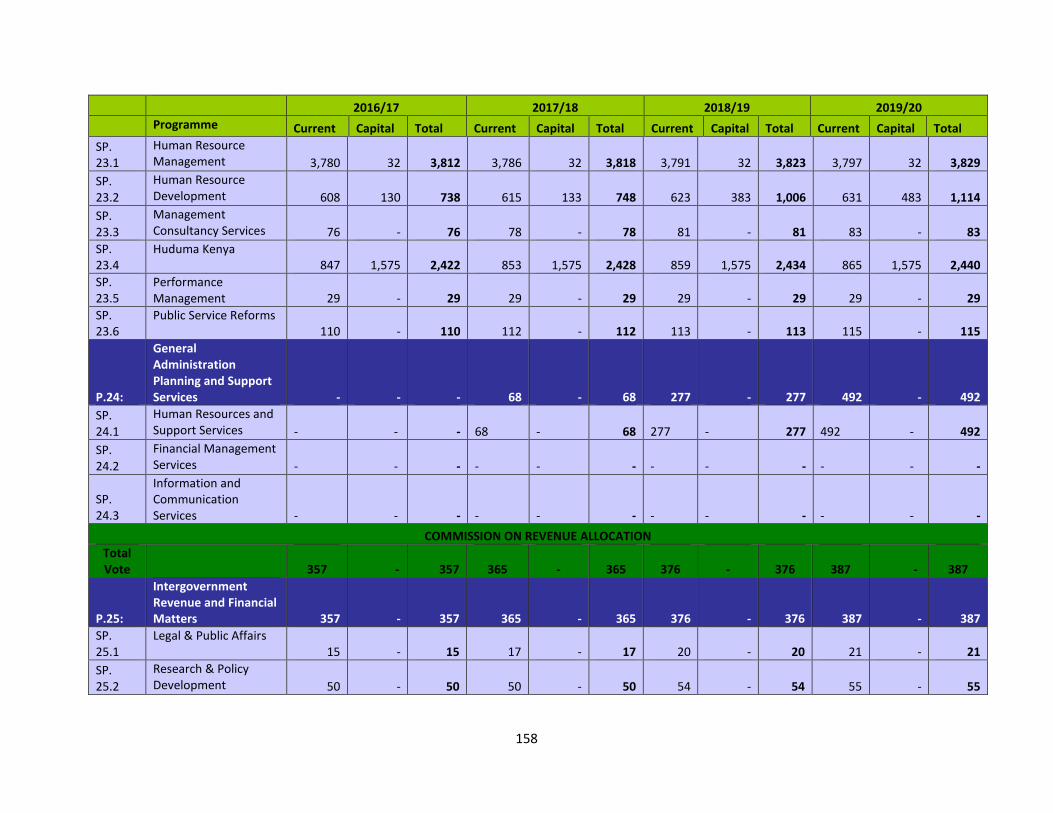
158
2016/17 2017/18 2018/19 2019/20Programme Current Capital Total Current Capital Total Current Capital Total Current Capital Total
SP.23.1
Human ResourceManagement 3,780 32 3,812 3,786 32 3,818 3,791 32 3,823 3,797 32 3,829
SP.23.2
Human ResourceDevelopment 608 130 738 615 133 748 623 383 1,006 631 483 1,114
SP.23.3
ManagementConsultancy Services 76 - 76 78 - 78 81 - 81 83 - 83
SP.23.4
Huduma Kenya847 1,575 2,422 853 1,575 2,428 859 1,575 2,434 865 1,575 2,440
SP.23.5
PerformanceManagement 29 - 29 29 - 29 29 - 29 29 - 29
SP.23.6
Public Service Reforms110 - 110 112 - 112 113 - 113 115 - 115
P.24:
GeneralAdministrationPlanning and SupportServices - - - 68 - 68 277 - 277 492 - 492
SP.24.1
Human Resources andSupport Services - - - 68 - 68 277 - 277 492 - 492
SP.24.2
Financial ManagementServices - - - - - - - - - - - -
SP.24.3
Information andCommunicationServices - - - - - - - - - - - -
COMMISSION ON REVENUE ALLOCATIONTotalVote 357 - 357 365 - 365 376 - 376 387 - 387
P.25:
IntergovernmentRevenue and FinancialMatters 357 - 357 365 - 365 376 - 376 387 - 387
SP.25.1
Legal & Public Affairs15 - 15 17 - 17 20 - 20 21 - 21
SP.25.2
Research & PolicyDevelopment 50 - 50 50 - 50 54 - 54 55 - 55
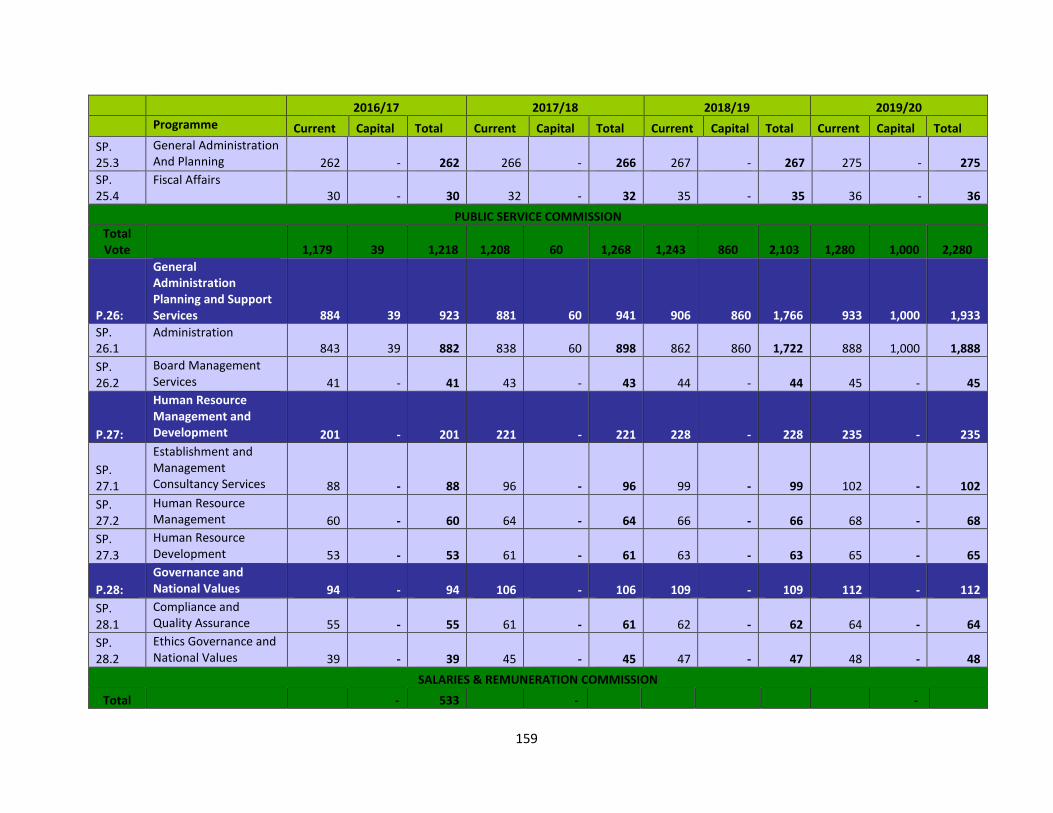
159
2016/17 2017/18 2018/19 2019/20Programme Current Capital Total Current Capital Total Current Capital Total Current Capital Total
SP.25.3
General AdministrationAnd Planning 262 - 262 266 - 266 267 - 267 275 - 275
SP.25.4
Fiscal Affairs30 - 30 32 - 32 35 - 35 36 - 36
PUBLIC SERVICE COMMISSIONTotalVote 1,179 39 1,218 1,208 60 1,268 1,243 860 2,103 1,280 1,000 2,280
P.26:
GeneralAdministrationPlanning and SupportServices 884 39 923 881 60 941 906 860 1,766 933 1,000 1,933
SP.26.1
Administration843 39 882 838 60 898 862 860 1,722 888 1,000 1,888
SP.26.2
Board ManagementServices 41 - 41 43 - 43 44 - 44 45 - 45
P.27:
Human ResourceManagement andDevelopment 201 - 201 221 - 221 228 - 228 235 - 235
SP.27.1
Establishment andManagementConsultancy Services 88 - 88 96 - 96 99 - 99 102 - 102
SP.27.2
Human ResourceManagement 60 - 60 64 - 64 66 - 66 68 - 68
SP.27.3
Human ResourceDevelopment 53 - 53 61 - 61 63 - 63 65 - 65
P.28:Governance andNational Values 94 - 94 106 - 106 109 - 109 112 - 112
SP.28.1
Compliance andQuality Assurance 55 - 55 61 - 61 62 - 62 64 - 64
SP.28.2
Ethics Governance andNational Values 39 - 39 45 - 45 47 - 47 48 - 48
SALARIES & REMUNERATION COMMISSIONTotal - 533 - -

160
2016/17 2017/18 2018/19 2019/20Programme Current Capital Total Current Capital Total Current Capital Total Current Capital Total
Vote 533 546 546 562 - 562 579 579
P.29:
Salaries andRemunerationManagement in thePublic Service 533 - 533 546 - 546 562 - 562 579 - 579
SP.29.1
Remuneration andBenefits Management 533 - 533 546 - 546 562 - 562 579 - 579
OFFICE OF AUDITOR GENERALTotalVote 4,183 224 4,407 4,276 235 4,510 4,405 735 5,139 4,535 846 5,381
P.30:Audit Services
4,183 224 4,407 4,276 235 4,510 4,405 735 5,139 4,535 846 5,381SP.30.1
National GovernmentAudit 3,126 224 3,350 3,037 235 3,272 3,128 735 3,863 3,221 846 4,067
SP.30.2
County GovernmentAudit 698 - 698 688 - 688 709 - 709 730 - 730
SP.30.3
CDF Audit56 - 56 216 - 216 223 - 223 229 - 229
SP.30.4
Special Projects303 - 303 335 - 335 345 - 345 355 - 355
OFFICE OF CONTROLLER OF BUDGETTotalVote 561 - 561 575 - 575 592 - 592 610 - 610
P.31:
Control andManagement of Publicfinances 561 - 561 575 - 575 592 - 592 610 - 610
SP.31.1
Authorization ofwithdrawal from Publicfunds 204 - 204 209 - 209 215 - 215 222 - 222
SP.31.2
BudgetImplementation,Monitoring andReporting 41 - 41 40 - 40 41 - 41 42 - 42

161
2016/17 2017/18 2018/19 2019/20Programme Current Capital Total Current Capital Total Current Capital Total Current Capital Total
SP.31.3
General AdministrationPlanning and supportservices 300 - 300 304 - 304 313 - 313 323 - 323
SP.31.4
Research &Development. 16 - 16 22 - 22 23 - 23 23 - 23
COMMISSION ON ADMINISTRATIVE JUSTICETotalVote 469 - 469 480 - 480 494 - 494 510 - 509
P.32:Promotion ofAdministrative Justice 469 - 469 480 - 480 494 - 494 510 - 509
SP.32.1
Ombudsman Services469 - 469 480 - 480 494 - 494 510 - 509
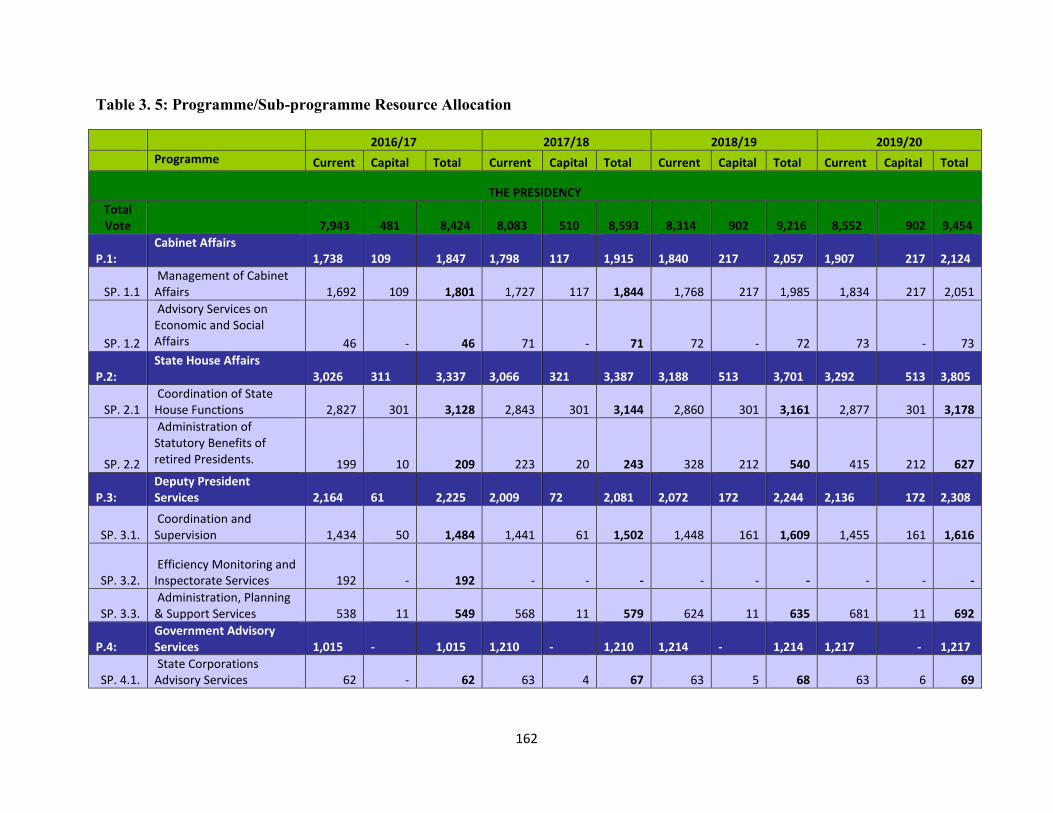
162
Table 3. 5: Programme/Sub-programme Resource Allocation
2016/17 2017/18 2018/19 2019/20Programme Current Capital Total Current Capital Total Current Capital Total Current Capital Total
THE PRESIDENCYTotalVote 7,943 481 8,424 8,083 510 8,593 8,314 902 9,216 8,552 902 9,454
P.1:Cabinet Affairs
1,738 109 1,847 1,798 117 1,915 1,840 217 2,057 1,907 217 2,124
SP. 1.1Management of Cabinet
Affairs 1,692 109 1,801 1,727 117 1,844 1,768 217 1,985 1,834 217 2,051
SP. 1.2
Advisory Services onEconomic and SocialAffairs 46 - 46 71 - 71 72 - 72 73 - 73
P.2:State House Affairs
3,026 311 3,337 3,066 321 3,387 3,188 513 3,701 3,292 513 3,805
SP. 2.1Coordination of State
House Functions 2,827 301 3,128 2,843 301 3,144 2,860 301 3,161 2,877 301 3,178
SP. 2.2
Administration ofStatutory Benefits ofretired Presidents. 199 10 209 223 20 243 328 212 540 415 212 627
P.3:Deputy PresidentServices 2,164 61 2,225 2,009 72 2,081 2,072 172 2,244 2,136 172 2,308
SP. 3.1.Coordination and
Supervision 1,434 50 1,484 1,441 61 1,502 1,448 161 1,609 1,455 161 1,616
SP. 3.2.Efficiency Monitoring and
Inspectorate Services 192 - 192 - - - - - - - - -
SP. 3.3.Administration, Planning
& Support Services 538 11 549 568 11 579 624 11 635 681 11 692
P.4:Government AdvisoryServices 1,015 - 1,015 1,210 - 1,210 1,214 - 1,214 1,217 - 1,217
SP. 4.1.State Corporations
Advisory Services 62 - 62 63 4 67 63 5 68 63 6 69
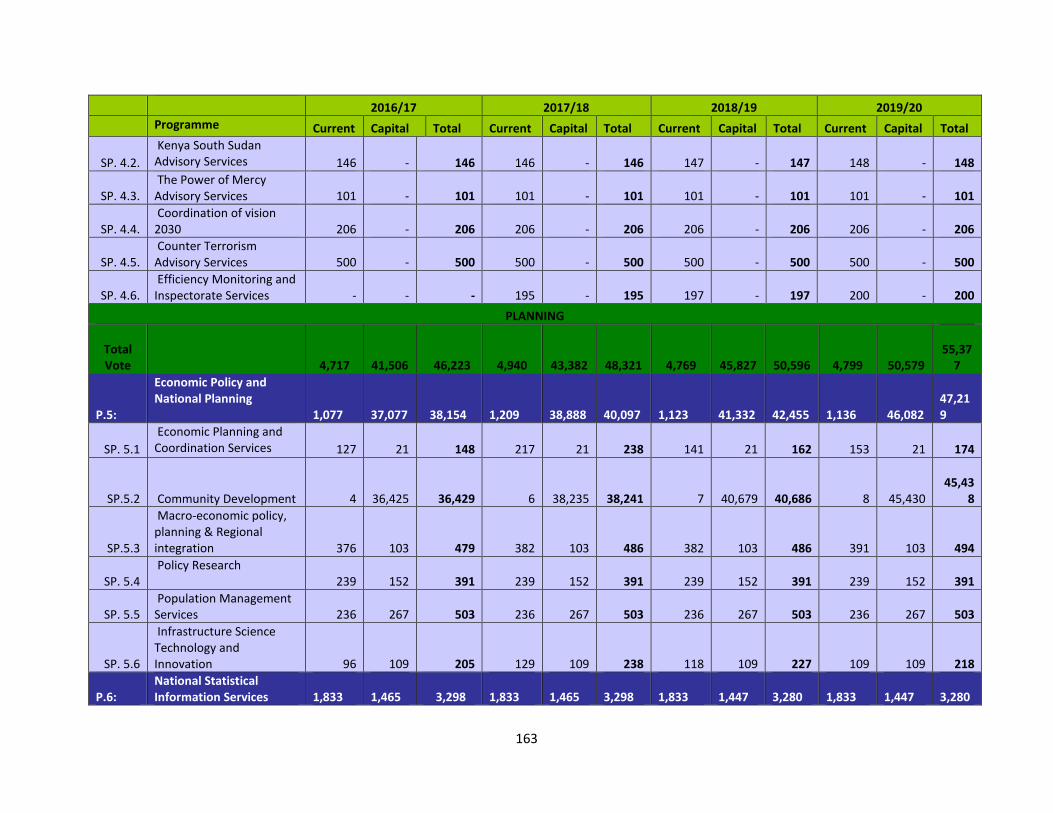
163
2016/17 2017/18 2018/19 2019/20Programme Current Capital Total Current Capital Total Current Capital Total Current Capital Total
SP. 4.2.Kenya South Sudan
Advisory Services 146 - 146 146 - 146 147 - 147 148 - 148
SP. 4.3.The Power of Mercy
Advisory Services 101 - 101 101 - 101 101 - 101 101 - 101
SP. 4.4.Coordination of vision
2030 206 - 206 206 - 206 206 - 206 206 - 206
SP. 4.5.Counter Terrorism
Advisory Services 500 - 500 500 - 500 500 - 500 500 - 500
SP. 4.6.Efficiency Monitoring and
Inspectorate Services - - - 195 - 195 197 - 197 200 - 200PLANNING
TotalVote 4,717 41,506 46,223 4,940 43,382 48,321 4,769 45,827 50,596 4,799 50,579
55,377
P.5:
Economic Policy andNational Planning
1,077 37,077 38,154 1,209 38,888 40,097 1,123 41,332 42,455 1,136 46,08247,219
SP. 5.1Economic Planning and
Coordination Services 127 21 148 217 21 238 141 21 162 153 21 174
SP.5.2 Community Development 4 36,425 36,429 6 38,235 38,241 7 40,679 40,686 8 45,43045,43
8
SP.5.3
Macro-economic policy,planning & Regionalintegration 376 103 479 382 103 486 382 103 486 391 103 494
SP. 5.4Policy Research
239 152 391 239 152 391 239 152 391 239 152 391
SP. 5.5Population Management
Services 236 267 503 236 267 503 236 267 503 236 267 503
SP. 5.6
Infrastructure ScienceTechnology andInnovation 96 109 205 129 109 238 118 109 227 109 109 218
P.6:National StatisticalInformation Services 1,833 1,465 3,298 1,833 1,465 3,298 1,833 1,447 3,280 1,833 1,447 3,280
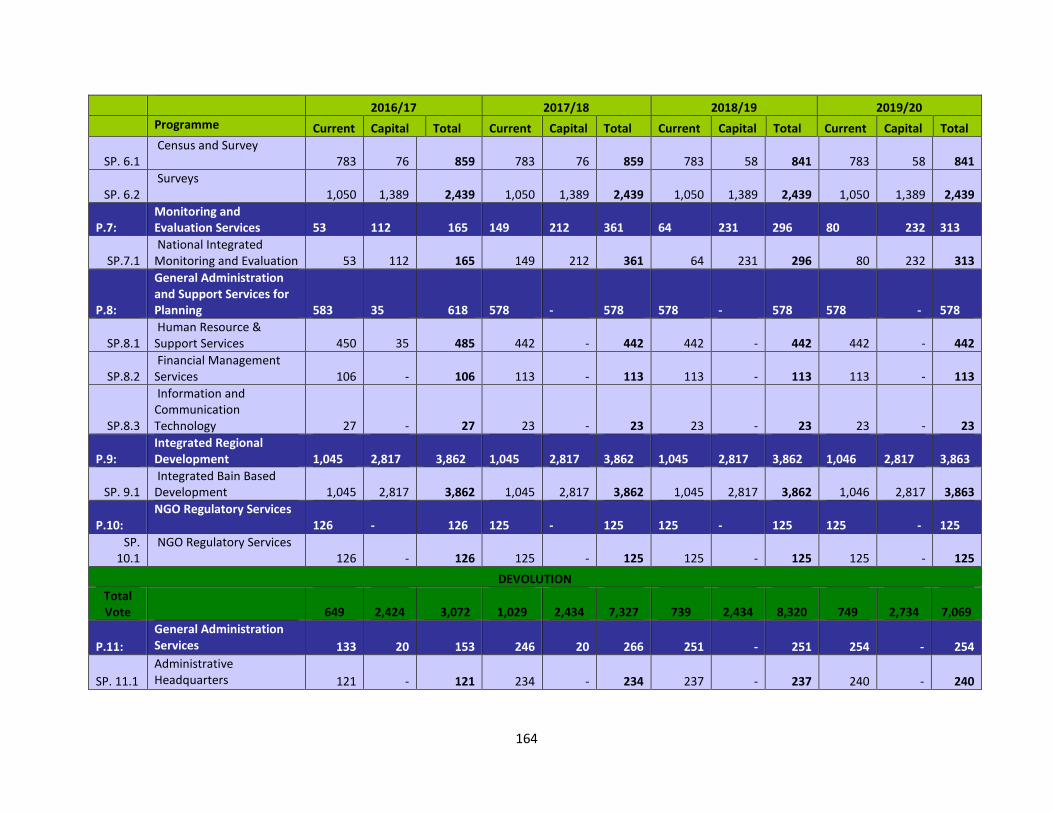
164
2016/17 2017/18 2018/19 2019/20Programme Current Capital Total Current Capital Total Current Capital Total Current Capital Total
SP. 6.1Census and Survey
783 76 859 783 76 859 783 58 841 783 58 841
SP. 6.2Surveys
1,050 1,389 2,439 1,050 1,389 2,439 1,050 1,389 2,439 1,050 1,389 2,439
P.7:Monitoring andEvaluation Services 53 112 165 149 212 361 64 231 296 80 232 313
SP.7.1National Integrated
Monitoring and Evaluation 53 112 165 149 212 361 64 231 296 80 232 313
P.8:
General Administrationand Support Services forPlanning 583 35 618 578 - 578 578 - 578 578 - 578
SP.8.1Human Resource &
Support Services 450 35 485 442 - 442 442 - 442 442 - 442
SP.8.2Financial Management
Services 106 - 106 113 - 113 113 - 113 113 - 113
SP.8.3
Information andCommunicationTechnology 27 - 27 23 - 23 23 - 23 23 - 23
P.9:Integrated RegionalDevelopment 1,045 2,817 3,862 1,045 2,817 3,862 1,045 2,817 3,862 1,046 2,817 3,863
SP. 9.1Integrated Bain Based
Development 1,045 2,817 3,862 1,045 2,817 3,862 1,045 2,817 3,862 1,046 2,817 3,863
P.10:NGO Regulatory Services
126 - 126 125 - 125 125 - 125 125 - 125SP.
10.1NGO Regulatory Services
126 - 126 125 - 125 125 - 125 125 - 125DEVOLUTION
TotalVote 649 2,424 3,072 1,029 2,434 7,327 739 2,434 8,320 749 2,734 7,069
P.11:General AdministrationServices 133 20 153 246 20 266 251 - 251 254 - 254
SP. 11.1AdministrativeHeadquarters 121 - 121 234 - 234 237 - 237 240 - 240

165
2016/17 2017/18 2018/19 2019/20Programme Current Capital Total Current Capital Total Current Capital Total Current Capital Total
SP. 11.2Finance and PlanningServices 7 - 7 7 - 7 8 - 8 8 - 8
SP. 11.3ICT
5 20 25 5 20 25 6 - 6 6 - 6
P.12:Devolution Services
516 2,404 2,919 783 2,414 7,061 488 2,434 8,069 495 2,734 6,815
SP. 12.1Management ofDevolution Affairs 88 120 207 55 120 273 60 120 281 67 150 317
SP. 12.2IntergovernmentalRelations 413 134 548 713 144 857 413 144 557 413 145 548
SP. 12.3Capacity Building
15 2,150 2,165 15 2,150 5,931 15 2,170 7,231 15 2,439 5,950FOREIGN AFFAIRS
TotalVote 17,206 3,000 20,206 17,508 2,000 19,508 17,948 4,000 21,948 18,401 4,200 22,601
P.13:
General Administration,Planning and SupportServices 4,783 234 5,017 3,097 20 3,117 3,113 50 3,163 3,129 70 3,199
SP. 13.1Planning AdministrationServices 4,783 234 5,017 3,097 20 3,117 3,113 50 3,163 3,129 70 3,199
P.14:Foreign Relations andDiplomacy 12,423 2,766 15,189 14,323 1,730 16,053 14,684 3,650 18,334 14,891 3,766 18,657
SP. 14.1International Relationsand Cooperation 12,423 2,000 14,423 12,655 - 12,655 12,951 - 12,951 13,153 - 13,153
SP. 14.2
Management ofInternational Treaties,Agreements andConventions - - - 49 - 49 49 - 49 49 - 49
SP. 14.3Coordination of StateProtocol - - - 1,589 - 1,589 1,589 - 1,589 1,589 - 1,589
SP. 14.4Management of Diasporaand Consular Affairs - - - 30 - 30 95 - 95 100 - 100

166
2016/17 2017/18 2018/19 2019/20Programme Current Capital Total Current Capital Total Current Capital Total Current Capital Total
SP. 14.5
InfrastructureDevelopment for MissionsAbroad - 766 766 - 1,730 1,730 - 3,650 3,650 - 3,766 3,766
P.15:Economic andCommercial Diplomacy - - - 40 - 40 130 - 130 180 - 180
SP. 15.1Economic and CommercialCooperation - - - 20 - 20 30 - 30 100 - 100
SP. 15.2
Regional Integration,Bilateral and MultilateralEconomic Cooperation - - - 20 - 20 100 - 100 80 - 80
P.16:
Foreign Policy Research,Capacity Developmentand TechnicalCooperation - - - 48 250 298 21 300 321 201 364 565
SP. 16.1Foreign Policy Researchand Analysis - - - 48 - 48 21 - 21 111 - 111
SP. 16.2Regional TechnicalCooperation - - - - 250 250 - 300 300 90 364 454
NATIONAL TREASURYTotalVote 36,740 45,531 82,271 43,396 47,675 91,071 38,025 49,076 87,101 38,006 50,483 88,489
P.17:
General Administration,Planning and SupportServices 30,622 4,717 35,339 37,278 4,717 41,995 31,907 4,717 36,624 31,888 4,717 36,605
SP. 17.1Administration Services
10,874 3,383 14,257 17,530 3,383 20,913 12,159 3,383 15,542 12,140 3,383 15,523
SP. 17.2Human ResourceManagement Services 65 - 65 65 - 65 65 - 65 65 - 65
SP. 17.3Financial Services
19,594 626 20,220 19,594 626 20,220 19,594 626 20,220 19,594 626 20,220
SP. 17.4ICT Services
89 708 797 89 708 797 89 708 797 89 708 797
P.18:Public FinancialManagement 4,644 39,452 44,096 4,644 41,596 46,240 4,644 42,997 47,641 4,644 44,404 49,048

167
2016/17 2017/18 2018/19 2019/20Programme Current Capital Total Current Capital Total Current Capital Total Current Capital Total
SP. 18.1Resource Mobilization
631 23,164 23,795 631 23,164 23,795 631 23,164 23,795 631 23,164 23,795
SP. 18.2
Budget Formulation,Coordination andManagement 295 11,000 11,295 295 13,193 13,488 295 14,593 14,888 295 15,999 16,294
SP. 18.3Audit Services
679 34 713 679 34 713 679 34 713 679 34 713
SP. 18.4Accounting Services
1,562 1,625 3,187 1,562 1,575 3,137 1,562 1,575 3,137 1,562 1,575 3,137
SP. 18.5Supply ChainManagement 502 100 602 502 100 602 502 100 602 502 100 602
SP. 18.6Public FinancialManagement Reforms 40 2,279 2,319 40 2,280 2,320 40 2,281 2,321 40 2,282 2,322
SP. 18.7Government Investmentand Assets 935 1,250 2,185 935 1,250 2,185 935 1,250 2,185 935 1,250 2,185
P.19:
Economic and FinancialPolicy Formulation andManagement 1,085 1,362 2,447 1,085 1,362 2,447 1,085 1,362 2,447 1,085 1,362 2,447
SP. 19.1Fiscal Policy Formulationand Management 953 512 1,465 953 512 1,465 953 512 1,465 953 512 1,465
SP. 19.2Debt Management
132 - 132 132 - 132 132 - 132 132 - 132
SP. 19.3Micro Finance SectorSupport and Development - 850 850 - 850 850 - 850 850 - 850 850
P.20:
Market Competition andCreation of an EnablingBusiness Environment 340 - 340 340 - 340 340 - 340 340 - 340
SP. 20.1Elimination of RestrictiveTrade Practices 340 - 340 340 - 340 340 - 340 340 - 340
P.21:Government ClearingServices 49 - 49 49 - 49 49 - 49 49 - 49
P.21:1Government ClearingServices 49 - 49 49 - 49 49 - 49 49 - 49

168
2016/17 2017/18 2018/19 2019/20Programme Current Capital Total Current Capital Total Current Capital Total Current Capital Total
STATE DEPARTMENT OF PUBLIC SERVICE AND YOUTH AFFAIRSTotalVote 13,038 12,648 25,686 13,173 12,652 25,825 13,449 13,052 26,501 13,735 13,252 26,987
P.22:Youth Empowerment
7,588 10,911 18,499 7,632 10,912 18,544 7,676 11,062 18,738 7,723 11,162 18,885
SP.22.1National Youth Service
6,465 10,399 16,864 6,497 10,400 16,896 6,529 10,550 17,079 6,563 10,650 17,213
SP.22.2Youth DevelopmentServices 798 207 1,005 810 207 1,017 822 207 1,029 835 207 1,042
SP.22.3Youth EmploymentScheme 291 305 596 291 305 597 291 305 596 291 305 596
SP.22.4Youth Coordination andRepresentation 34 - 34 34 - 34 34 - 34 34 - 34
P.23:Public ServiceTransformation 5,450 1,737 7,187 5,473 1,740 7,213 5,496 1,990 7,486 5,520 2,090 7,610
SP. 23.1Human ResourceManagement 3,780 32 3,812 3,786 32 3,818 3,791 32 3,823 3,797 32 3,829
SP. 23.2Human ResourceDevelopment 608 130 738 615 133 748 623 383 1,006 631 483 1,114
SP. 23.3Management ConsultancyServices 76 - 76 78 - 78 81 - 81 83 - 83
SP. 23.4Huduma Kenya
847 1,575 2,422 853 1,575 2,428 859 1,575 2,434 865 1,575 2,440
SP. 23.5PerformanceManagement 29 - 29 29 - 29 29 - 29 29 - 29
SP. 23.6Public Service Reforms
110 - 110 112 - 112 113 - 113 115 - 115
P.24:
General AdministrationPlanning and SupportServices - - - 68 - 68 277 - 277 492 - 492
SP. 24.1Human Resources andSupport Services - - - 68 - 68 277 - 277 492 - 492
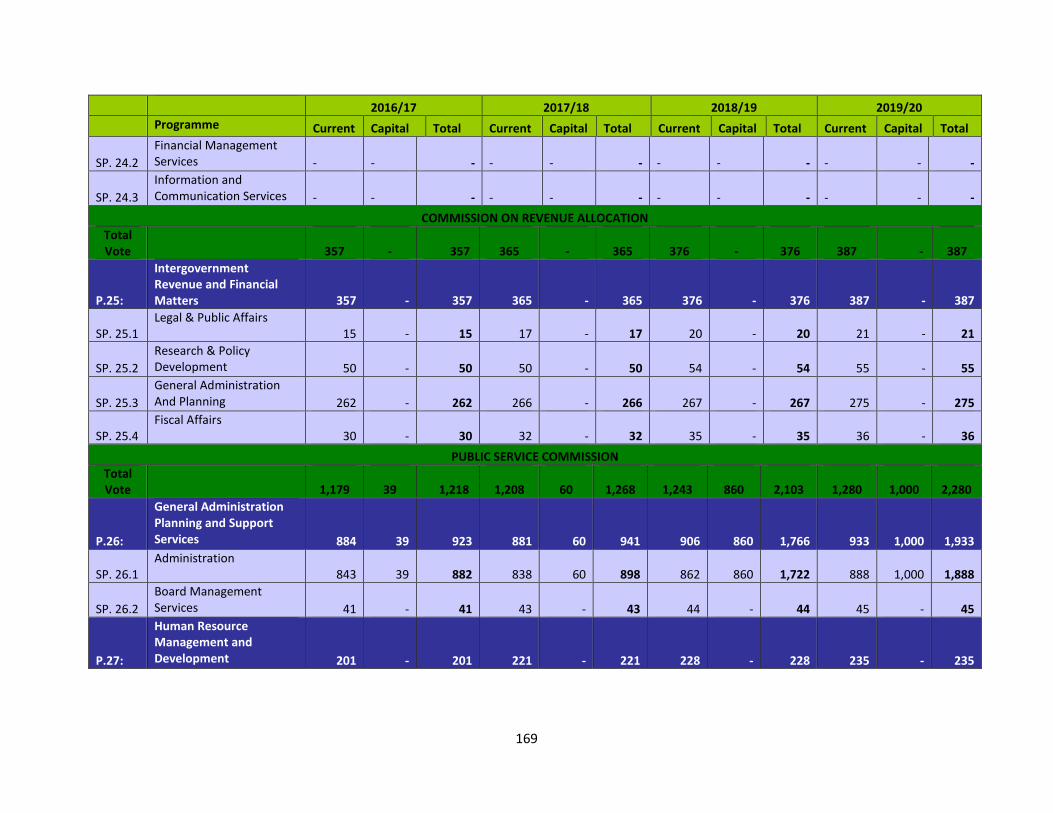
169
2016/17 2017/18 2018/19 2019/20Programme Current Capital Total Current Capital Total Current Capital Total Current Capital Total
SP. 24.2Financial ManagementServices - - - - - - - - - - - -
SP. 24.3Information andCommunication Services - - - - - - - - - - - -
COMMISSION ON REVENUE ALLOCATIONTotalVote 357 - 357 365 - 365 376 - 376 387 - 387
P.25:
IntergovernmentRevenue and FinancialMatters 357 - 357 365 - 365 376 - 376 387 - 387
SP. 25.1Legal & Public Affairs
15 - 15 17 - 17 20 - 20 21 - 21
SP. 25.2Research & PolicyDevelopment 50 - 50 50 - 50 54 - 54 55 - 55
SP. 25.3General AdministrationAnd Planning 262 - 262 266 - 266 267 - 267 275 - 275
SP. 25.4Fiscal Affairs
30 - 30 32 - 32 35 - 35 36 - 36PUBLIC SERVICE COMMISSION
TotalVote 1,179 39 1,218 1,208 60 1,268 1,243 860 2,103 1,280 1,000 2,280
P.26:
General AdministrationPlanning and SupportServices 884 39 923 881 60 941 906 860 1,766 933 1,000 1,933
SP. 26.1Administration
843 39 882 838 60 898 862 860 1,722 888 1,000 1,888
SP. 26.2Board ManagementServices 41 - 41 43 - 43 44 - 44 45 - 45
P.27:
Human ResourceManagement andDevelopment 201 - 201 221 - 221 228 - 228 235 - 235
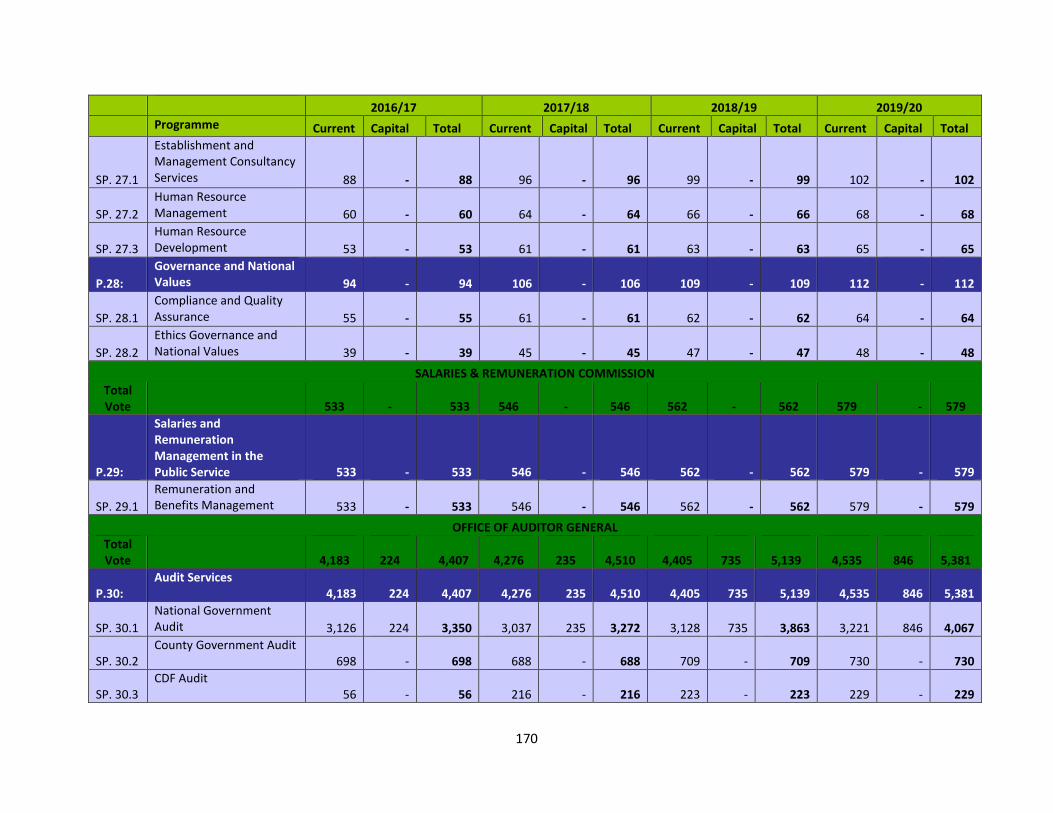
170
2016/17 2017/18 2018/19 2019/20Programme Current Capital Total Current Capital Total Current Capital Total Current Capital Total
SP. 27.1
Establishment andManagement ConsultancyServices 88 - 88 96 - 96 99 - 99 102 - 102
SP. 27.2Human ResourceManagement 60 - 60 64 - 64 66 - 66 68 - 68
SP. 27.3Human ResourceDevelopment 53 - 53 61 - 61 63 - 63 65 - 65
P.28:Governance and NationalValues 94 - 94 106 - 106 109 - 109 112 - 112
SP. 28.1Compliance and QualityAssurance 55 - 55 61 - 61 62 - 62 64 - 64
SP. 28.2Ethics Governance andNational Values 39 - 39 45 - 45 47 - 47 48 - 48
SALARIES & REMUNERATION COMMISSIONTotalVote 533 - 533 546 - 546 562 - 562 579 - 579
P.29:
Salaries andRemunerationManagement in thePublic Service 533 - 533 546 - 546 562 - 562 579 - 579
SP. 29.1Remuneration andBenefits Management 533 - 533 546 - 546 562 - 562 579 - 579
OFFICE OF AUDITOR GENERALTotalVote 4,183 224 4,407 4,276 235 4,510 4,405 735 5,139 4,535 846 5,381
P.30:Audit Services
4,183 224 4,407 4,276 235 4,510 4,405 735 5,139 4,535 846 5,381
SP. 30.1National GovernmentAudit 3,126 224 3,350 3,037 235 3,272 3,128 735 3,863 3,221 846 4,067
SP. 30.2County Government Audit
698 - 698 688 - 688 709 - 709 730 - 730
SP. 30.3CDF Audit
56 - 56 216 - 216 223 - 223 229 - 229
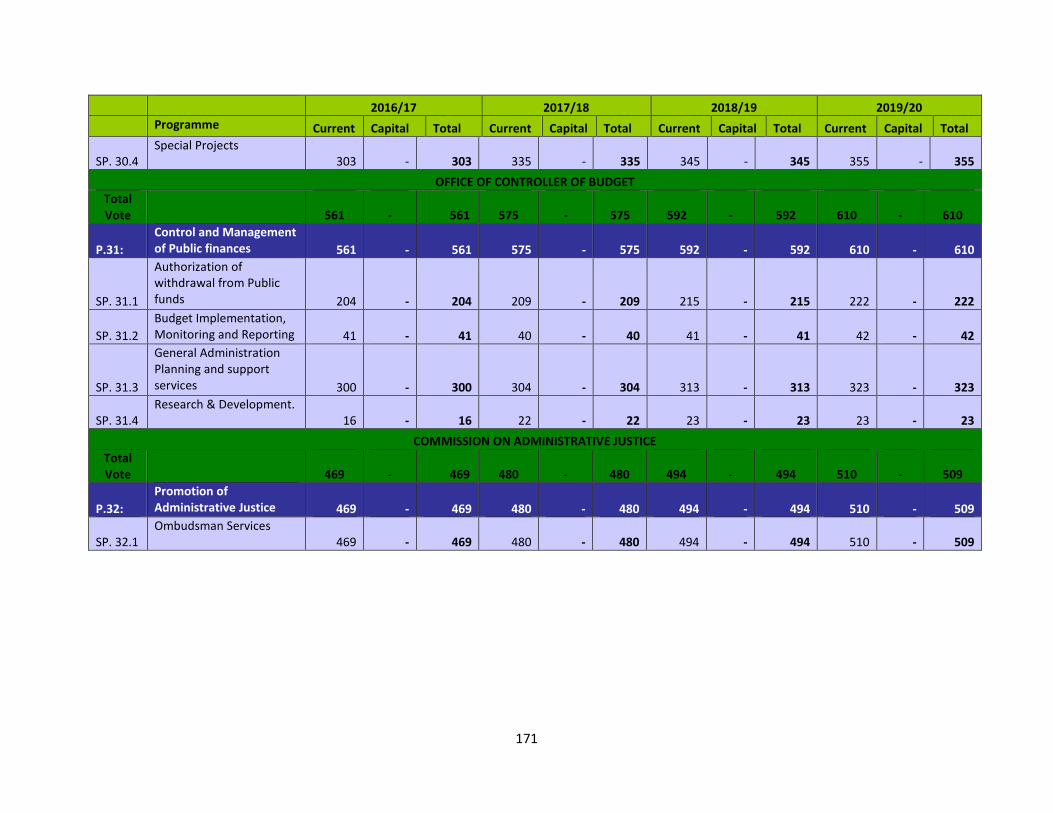
171
2016/17 2017/18 2018/19 2019/20Programme Current Capital Total Current Capital Total Current Capital Total Current Capital Total
SP. 30.4Special Projects
303 - 303 335 - 335 345 - 345 355 - 355OFFICE OF CONTROLLER OF BUDGET
TotalVote 561 - 561 575 - 575 592 - 592 610 - 610
P.31:Control and Managementof Public finances 561 - 561 575 - 575 592 - 592 610 - 610
SP. 31.1
Authorization ofwithdrawal from Publicfunds 204 - 204 209 - 209 215 - 215 222 - 222
SP. 31.2Budget Implementation,Monitoring and Reporting 41 - 41 40 - 40 41 - 41 42 - 42
SP. 31.3
General AdministrationPlanning and supportservices 300 - 300 304 - 304 313 - 313 323 - 323
SP. 31.4Research & Development.
16 - 16 22 - 22 23 - 23 23 - 23COMMISSION ON ADMINISTRATIVE JUSTICE
TotalVote 469 - 469 480 - 480 494 - 494 510 - 509
P.32:Promotion ofAdministrative Justice 469 - 469 480 - 480 494 - 494 510 - 509
SP. 32.1Ombudsman Services
469 - 469 480 - 480 494 - 494 510 - 509

172
3.2.3 Programmes and Sub-programmes by economic classification
Table 3. 6: Programmes and Sub Programmes by Economic Classification
ApprovedEstimates
Resource Requirement Resource AllocationEstimates Estimates Estimates Estimates Estimates Estimates
Programme 2016/17 2017/18 2018/19 2019/20 2017/18 2018/19 2019/20THE PRESIDENCY
P.1: Cabinet Affairs1,847 2,441 2,388 2,343 1,915 2,057 2,124
1. CurrentExpenditure 1,738 2,221 2,165 2,113 1,798 1,840 1,907Compensation toEmployees 509 483 636 542 525 540 556Use of goods andservices 974 1,515 1,287 1,351 996 1,023 1,074Current TransfersGovt. Agencies - - - - - - -
Other Recurrent254 223 242 220 277 277 277
2. CapitalExpenditure 109 220 223 230 117 217 217Acquisition ofNon-FinancialAssets
9 20 15 22 17 17 17
Capital Transfersto Govt. Agencies 100 200 208 208 100 200 200
OtherDevelopment - - - - - - -Sub-Programme(SP)
SP. 1.1 Management ofCabinet Affairs 1,801 1,938 1,881 1,828 1,844 1,985 2,0511. CurrentExpenditure 1,692 1,718 1,658 1,598 1,727 1,768 1,834Compensation toEmployees 475 448 600 508 490 504 519Use of goods andservices 962 1,148 902 956 983 1,010 1,061Current TransfersGovt. Agencies - - - - - - -Other Recurrent
254 122 156 134 254 254 2542. CapitalExpenditure 109 220 223 230 117 217 217Acquisition ofNon-FinancialAssets
9 20 15 22 17 17 17

173
ApprovedEstimates
Resource Requirement Resource AllocationEstimates Estimates Estimates Estimates Estimates Estimates
Programme 2016/17 2017/18 2018/19 2019/20 2017/18 2018/19 2019/20Capital Transfersto Govt. Agencies 100 200 208 208 100 200 200OtherDevelopment - - - - - - -
SP. 1.2 Advisory Serviceson Economic andSocial Affairs
46 503 507 515 71 72 73
1. CurrentExpenditure 46 503 507 515 71 72 73Compensation toEmployees 34 35 36 34 35 36 37Use of goods andservices 13 367 385 395 13 13 13Current TransfersGovt. Agencies - - - - - - -Other Recurrent
0 101 86 86 23 23 232. CapitalExpenditure - - - - - - -Acquisition ofNon-FinancialAssets
- - - - - - -
Capital Transfersto Govt. Agencies - - - - - - -OtherDevelopment - - - - - - -
P.2: State HouseAffairs 3,337 5,505 5,031 5,382 3,387 3,701 3,8051. CurrentExpenditure 3,026 4,246 4,585 4,962 3,066 3,188 3,292Compensation toEmployees 654 763 782 802 673 694 714Use of goods andservices 2,192 2,963 3,486 3,772 2,213 2,314 2,398Current TransfersGovt. Agencies - - - - - - -
Other Recurrent180 520 317 388 180 180 180
2. CapitalExpenditure 311 1,259 446 420 321 513 513Acquisition ofNon-FinancialAssets
311 1,259 446 420 321 513 513
Capital Transfersto Govt. Agencies - - - - - - -OtherDevelopment - - - - - - -Sub-Programme

174
ApprovedEstimates
Resource Requirement Resource AllocationEstimates Estimates Estimates Estimates Estimates Estimates
Programme 2016/17 2017/18 2018/19 2019/20 2017/18 2018/19 2019/20(SP)
SP. 2.1 Coordination ofState HouseFunctions
3,128 4,857 4,603 4,910 3,144 3,161 3,178
1. CurrentExpenditure 2,827 3,868 4,177 4,510 2,843 2,860 2,877Compensation toEmployees 531 637 653 669 546 563 580Use of goods andservices 2,116 2,767 3,282 3,550 2,117 2,117 2,117Current TransfersGovt. Agencies - - - - - - -Other Recurrent
180 464 242 291 180 180 1802. CapitalExpenditure 301 989 426 400 301 301 301Acquisition ofNon-FinancialAssets
301 989 426 400 301 301 301
Capital Transfersto Govt. Agencies - - - - - - -OtherDevelopment - - - - - - -
SP. 2.2 Administration ofStatutory Benefitsof retiredPresidents.
209 648 428 472 243 540 627
1. CurrentExpenditure 199 378 408 452 223 328 415Compensation toEmployees 123 126 129 133 127 131 134Use of goods andservices 76 196 204 222 96 197 281Current TransfersGovt. Agencies - - - - - - -Other Recurrent
- 56 75 97 - - -2. CapitalExpenditure 10 270 20 20 20 212 212Acquisition ofNon-FinancialAssets
10 270 20 20 20 212 212
Capital Transfersto Govt. Agencies - - - - - - -OtherDevelopment - - - - - - -
P.3: Deputy PresidentServices 2,225 4,448 3,264 3,048 2,080 2,242 2,3071. Current

175
ApprovedEstimates
Resource Requirement Resource AllocationEstimates Estimates Estimates Estimates Estimates Estimates
Programme 2016/17 2017/18 2018/19 2019/20 2017/18 2018/19 2019/20Expenditure 2,164 2,696 2,860 3,035 2,006 2,071 2,136Compensation toEmployees 477 445 463 482 407 419 432Use of goods andservices 1,526 2,014 2,145 2,284 1,442 1,495 1,547Current TransfersGovt. Agencies - - - - - - -Other Recurrent
161 237 252 269 157 157 1572. CapitalExpenditure 61 1,752 404 13 72 172 172Acquisition ofNon-FinancialAssets
50 1,739 391 - 61 161 161
Capital Transfersto Govt. Agencies - - - - - - -OtherDevelopment 11 13 13 13 11 11 11Sub-Programme(SP)
SP. 3.1. Cordination andSupervision 1,484 2,418 2,446 2,213 1,502 1,609 1,6161. CurrentExpenditure 1,434 1,963 2,085 2,213 1,441 1,448 1,455Compensation toEmployees 218 261 272 283 225 232 239Use of goods andservices 1,102 1,563 1,665 1,772 1,102 1,102 1,102Current TransfersGovt. Agencies - - - - - - -Other Recurrent
114 139 148 158 114 114 1142. CapitalExpenditure 50 455 361 - 61 161 161Acquisition ofNon-FinancialAssets
50 455 361 - 61 161 161
Capital Transfersto Govt. Agencies - - - - - - -OtherDevelopment - - - - - - -
SP. 3.2. EfficiencyMonitoring andInspectorateServices
192 - - - - - -
1. CurrentExpenditure 192 - - - - - -Compensation toEmployees 82 - - - - - -
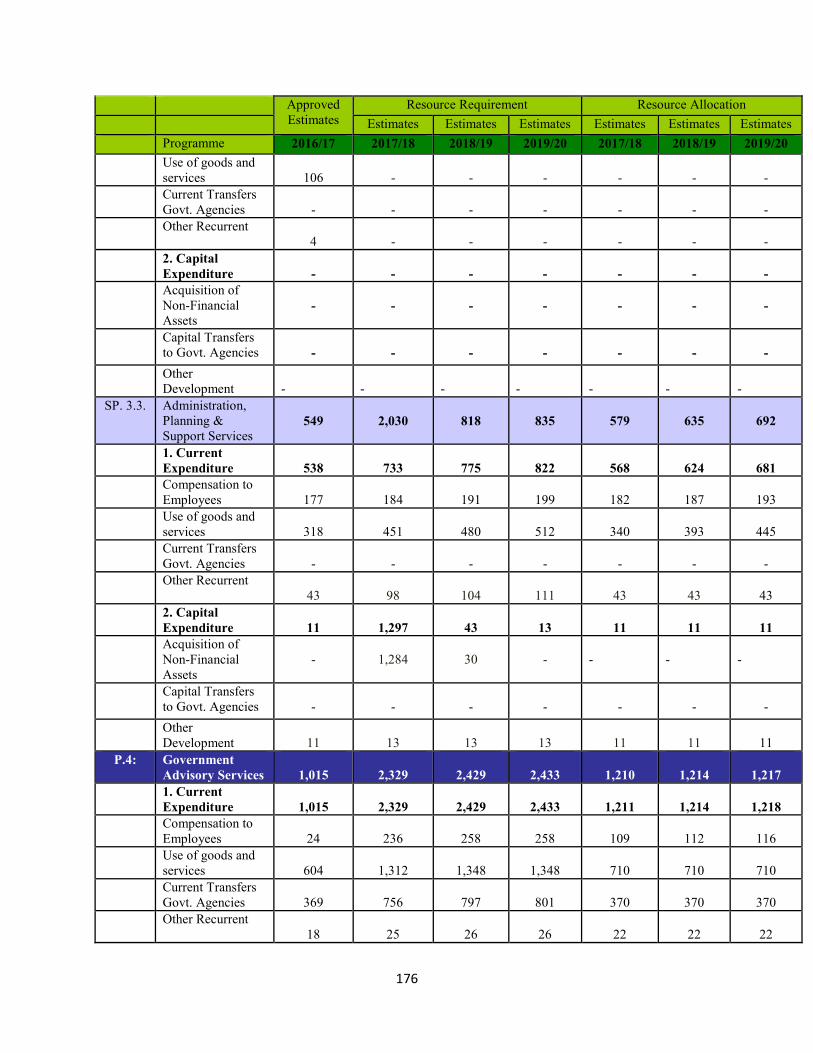
176
ApprovedEstimates
Resource Requirement Resource AllocationEstimates Estimates Estimates Estimates Estimates Estimates
Programme 2016/17 2017/18 2018/19 2019/20 2017/18 2018/19 2019/20Use of goods andservices 106 - - - - - -Current TransfersGovt. Agencies - - - - - - -Other Recurrent
4 - - - - - -2. CapitalExpenditure - - - - - - -Acquisition ofNon-FinancialAssets
- - - - - - -
Capital Transfersto Govt. Agencies - - - - - - -OtherDevelopment - - - - - - -
SP. 3.3. Administration,Planning &Support Services
549 2,030 818 835 579 635 692
1. CurrentExpenditure 538 733 775 822 568 624 681Compensation toEmployees 177 184 191 199 182 187 193Use of goods andservices 318 451 480 512 340 393 445Current TransfersGovt. Agencies - - - - - - -Other Recurrent
43 98 104 111 43 43 432. CapitalExpenditure 11 1,297 43 13 11 11 11Acquisition ofNon-FinancialAssets
- 1,284 30 - - - -
Capital Transfersto Govt. Agencies - - - - - - -OtherDevelopment 11 13 13 13 11 11 11
P.4: GovernmentAdvisory Services 1,015 2,329 2,429 2,433 1,210 1,214 1,2171. CurrentExpenditure 1,015 2,329 2,429 2,433 1,211 1,214 1,218Compensation toEmployees 24 236 258 258 109 112 116Use of goods andservices 604 1,312 1,348 1,348 710 710 710Current TransfersGovt. Agencies 369 756 797 801 370 370 370Other Recurrent
18 25 26 26 22 22 22

177
ApprovedEstimates
Resource Requirement Resource AllocationEstimates Estimates Estimates Estimates Estimates Estimates
Programme 2016/17 2017/18 2018/19 2019/20 2017/18 2018/19 2019/202. CapitalExpenditure - 1 2 3 - - -Acquisition ofNon-FinancialAssets
- - - - - - -
Capital Transfersto Govt. Agencies - - - - - - -OtherDevelopment - 1 2 3 - - -Sub-Programme(SP)
SP. 4.1. State Co-oporationsAdvisory Services
62 121 122 123 67 68 69
1. CurrentExpenditure 62 120 120 120 63 63 63Compensation toEmployees - - - - - - -Use of goods andservices - - - - - - -Current TransfersGovt. Agencies 62 120 120 120 63 63 63Other Recurrent
-2. CapitalExpenditure - 1 2 3 4 5 6Acquisition ofNon-FinancialAssets
- - - - - - -
Capital Transfersto Govt. Agencies - - - - - - -OtherDevelopment - 1 2 3 4 5 6
SP. 4.2. Kenya SouthSudan AdvisoryServices
146 277 278 278 146 147 148
1. CurrentExpenditure 146 277 278 278 146 147 148Compensation toEmployees 24 24 25 25 24 25 26Use of goods andservices 19 20 21 21 19 19 19Current TransfersGovt. Agencies 101 231 231 231 101 101 101Other Recurrent
2 2 1 1 2 2 22. CapitalExpenditure - - - - - - -

178
ApprovedEstimates
Resource Requirement Resource AllocationEstimates Estimates Estimates Estimates Estimates Estimates
Programme 2016/17 2017/18 2018/19 2019/20 2017/18 2018/19 2019/20Acquisition ofNon-FinancialAssets
- - - - - - -
Capital Transfersto Govt. Agencies - - - - - - -OtherDevelopment - - - - - - -
SP. 4.3. The Power ofMercy AdvisoryServices
101 131 131 131 101 101 101
1. CurrentExpenditure 101 131 131 131 101 101 101Compensation toEmployees - - - - - - -Use of goods andservices 85 112 112 112 85 85 85Current TransfersGovt. Agencies - - - - - - -Other Recurrent
16 19 19 19 16 16 162. CapitalExpenditure - - - - - - -Acquisition ofNon-FinancialAssets
- - - - - - -
Capital Transfersto Govt. Agencies - - - - - - -OtherDevelopment - - - - - - -
SP. 4.4. Coordination ofvision 2030 206 405 446 450 206 206 2061. CurrentExpenditure 206 405 446 450 206 206 206Compensation toEmployees - - - - - - -Use of goods andservices - - - - - - -Current TransfersGovt. Agencies 206 405 446 450 206 206 206Other Recurrent
- - - - - - -2. CapitalExpenditure - - - - - - -Acquisition ofNon-FinancialAssets
- - - - - - -
Capital Transfersto Govt. Agencies - - - - - - -Other
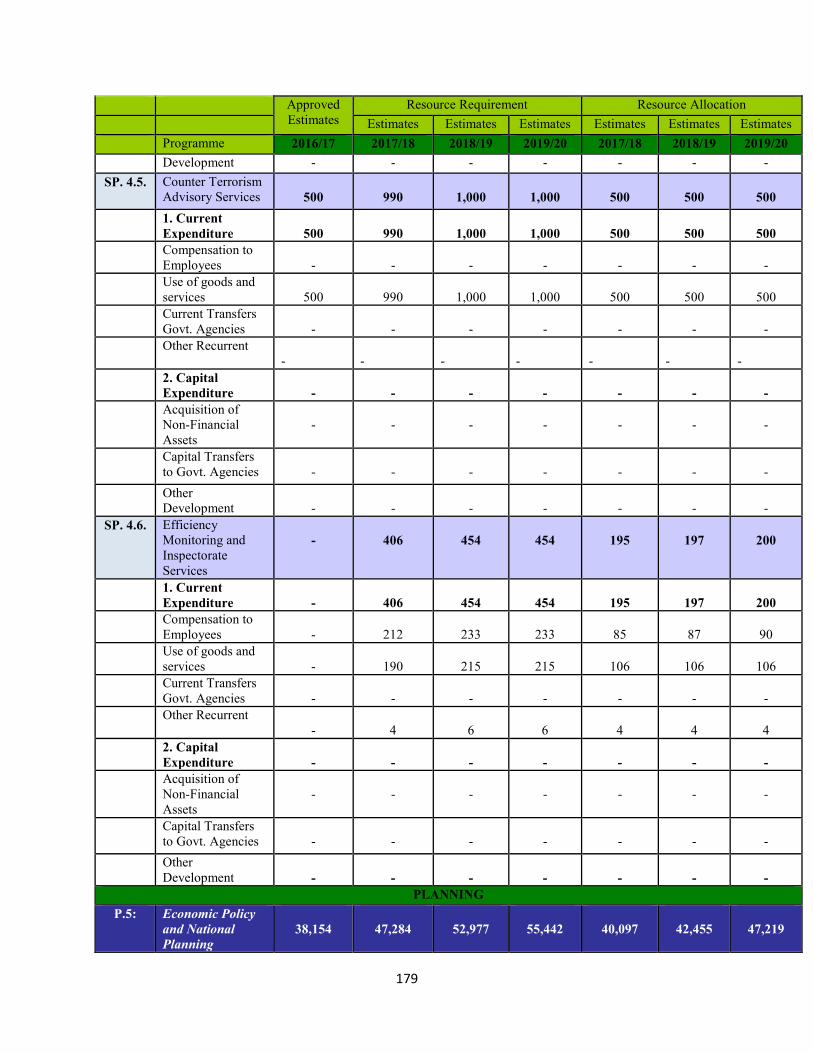
179
ApprovedEstimates
Resource Requirement Resource AllocationEstimates Estimates Estimates Estimates Estimates Estimates
Programme 2016/17 2017/18 2018/19 2019/20 2017/18 2018/19 2019/20Development - - - - - - -
SP. 4.5. Counter TerrorismAdvisory Services 500 990 1,000 1,000 500 500 5001. CurrentExpenditure 500 990 1,000 1,000 500 500 500Compensation toEmployees - - - - - - -Use of goods andservices 500 990 1,000 1,000 500 500 500Current TransfersGovt. Agencies - - - - - - -Other Recurrent
- - - - - - -2. CapitalExpenditure - - - - - - -Acquisition ofNon-FinancialAssets
- - - - - - -
Capital Transfersto Govt. Agencies - - - - - - -OtherDevelopment - - - - - - -
SP. 4.6. EfficiencyMonitoring andInspectorateServices
- 406 454 454 195 197 200
1. CurrentExpenditure - 406 454 454 195 197 200Compensation toEmployees - 212 233 233 85 87 90Use of goods andservices - 190 215 215 106 106 106Current TransfersGovt. Agencies - - - - - - -Other Recurrent
- 4 6 6 4 4 42. CapitalExpenditure - - - - - - -Acquisition ofNon-FinancialAssets
- - - - - - -
Capital Transfersto Govt. Agencies - - - - - - -OtherDevelopment - - - - - - -
PLANNINGP.5: Economic Policy
and NationalPlanning
38,154 47,284 52,977 55,442 40,097 42,455 47,219
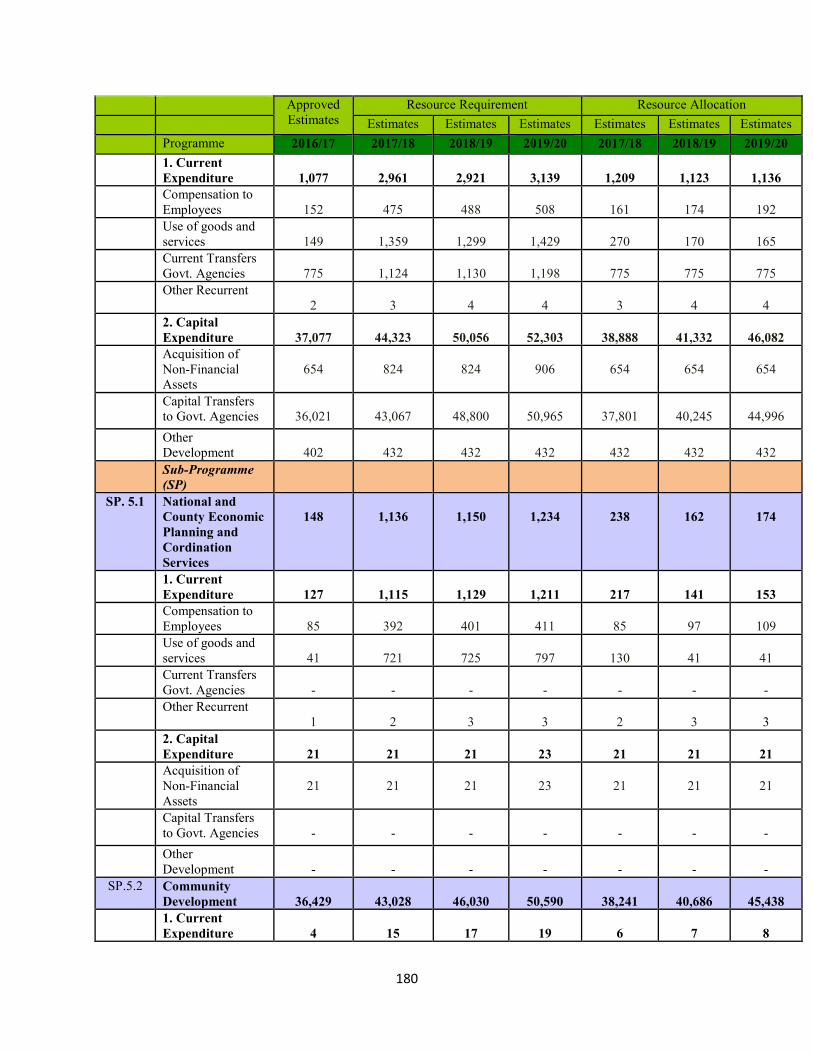
180
ApprovedEstimates
Resource Requirement Resource AllocationEstimates Estimates Estimates Estimates Estimates Estimates
Programme 2016/17 2017/18 2018/19 2019/20 2017/18 2018/19 2019/201. CurrentExpenditure 1,077 2,961 2,921 3,139 1,209 1,123 1,136Compensation toEmployees 152 475 488 508 161 174 192Use of goods andservices 149 1,359 1,299 1,429 270 170 165Current TransfersGovt. Agencies 775 1,124 1,130 1,198 775 775 775Other Recurrent
2 3 4 4 3 4 42. CapitalExpenditure 37,077 44,323 50,056 52,303 38,888 41,332 46,082Acquisition ofNon-FinancialAssets
654 824 824 906 654 654 654
Capital Transfersto Govt. Agencies 36,021 43,067 48,800 50,965 37,801 40,245 44,996OtherDevelopment 402 432 432 432 432 432 432Sub-Programme(SP)
SP. 5.1 National andCounty EconomicPlanning andCordinationServices
148 1,136 1,150 1,234 238 162 174
1. CurrentExpenditure 127 1,115 1,129 1,211 217 141 153Compensation toEmployees 85 392 401 411 85 97 109Use of goods andservices 41 721 725 797 130 41 41Current TransfersGovt. Agencies - - - - - - -Other Recurrent
1 2 3 3 2 3 32. CapitalExpenditure 21 21 21 23 21 21 21Acquisition ofNon-FinancialAssets
21 21 21 23 21 21 21
Capital Transfersto Govt. Agencies - - - - - - -OtherDevelopment - - - - - - -
SP.5.2 CommunityDevelopment 36,429 43,028 46,030 50,590 38,241 40,686 45,4381. CurrentExpenditure 4 15 17 19 6 7 8
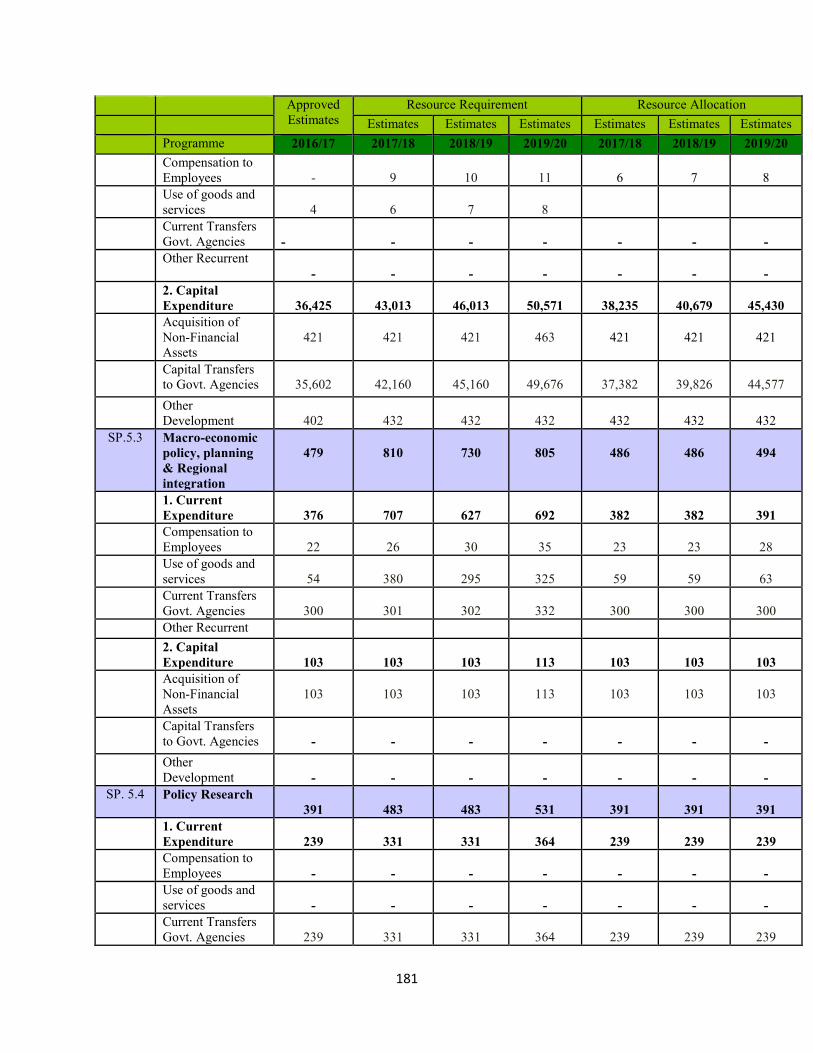
181
ApprovedEstimates
Resource Requirement Resource AllocationEstimates Estimates Estimates Estimates Estimates Estimates
Programme 2016/17 2017/18 2018/19 2019/20 2017/18 2018/19 2019/20Compensation toEmployees - 9 10 11 6 7 8Use of goods andservices 4 6 7 8Current TransfersGovt. Agencies - - - - - - -Other Recurrent
- - - - - - -2. CapitalExpenditure 36,425 43,013 46,013 50,571 38,235 40,679 45,430Acquisition ofNon-FinancialAssets
421 421 421 463 421 421 421
Capital Transfersto Govt. Agencies 35,602 42,160 45,160 49,676 37,382 39,826 44,577OtherDevelopment 402 432 432 432 432 432 432
SP.5.3 Macro-economicpolicy, planning& Regionalintegration
479 810 730 805 486 486 494
1. CurrentExpenditure 376 707 627 692 382 382 391Compensation toEmployees 22 26 30 35 23 23 28Use of goods andservices 54 380 295 325 59 59 63Current TransfersGovt. Agencies 300 301 302 332 300 300 300Other Recurrent2. CapitalExpenditure 103 103 103 113 103 103 103Acquisition ofNon-FinancialAssets
103 103 103 113 103 103 103
Capital Transfersto Govt. Agencies - - - - - - -OtherDevelopment - - - - - - -
SP. 5.4 Policy Research391 483 483 531 391 391 391
1. CurrentExpenditure 239 331 331 364 239 239 239Compensation toEmployees - - - - - - -Use of goods andservices - - - - - - -Current TransfersGovt. Agencies 239 331 331 364 239 239 239

182
ApprovedEstimates
Resource Requirement Resource AllocationEstimates Estimates Estimates Estimates Estimates Estimates
Programme 2016/17 2017/18 2018/19 2019/20 2017/18 2018/19 2019/20Other Recurrent2. CapitalExpenditure 152 152 152 167 152 152 152Acquisition ofNon-FinancialAssets
- - - - - - -
Capital Transfersto Govt. Agencies 152 152 152 167 152 152 152OtherDevelopment - - - - - - -
SP. 5.5 PopulationManagementServices
503 1,247 3,985 1,624 503 503 503
1. CurrentExpenditure 236 492 497 502 236 236 236Compensation toEmployees - - - - - - -Use of goods andservices - - - - - - -Current TransfersGovt. Agencies 236 492 497 502 236 236 236Other Recurrent
- - - - - - -2. CapitalExpenditure 267 755 3,488 1,122 267 267 267Acquisition ofNon-FinancialAssets
- - - - - - -
Capital Transfersto Govt. Agencies 267 755 3,488 1,122 267 267 267OtherDevelopment - - - - - - -
SP. 5.6 InfrastructureScienceTechnology andInnovation
205 580 599 658 238 227 218
1. CurrentExpenditure 96 301 320 351 129 118 109Compensation toEmployees 45 48 47 51 47 47 47Use of goods andservices 50 252 272 299 81 70 61Current TransfersGovt. Agencies - - - - - - -Other Recurrent
1 1 1 1 1 1 12. CapitalExpenditure 109 279 279 307 109 109 109

183
ApprovedEstimates
Resource Requirement Resource AllocationEstimates Estimates Estimates Estimates Estimates Estimates
Programme 2016/17 2017/18 2018/19 2019/20 2017/18 2018/19 2019/20Acquisition ofNon-FinancialAssets
109 279 279 307 109 109 109
Capital Transfersto Govt. Agencies - - - - - - -OtherDevelopment - - - - - - -
P.6: NationalStatisticalInformationServices
3,298 4,682 11,643 13,586 3,298 3,280 3,280
1. CurrentExpenditure 1,833 3,217 10,196 12,139 1,833 1,833 1,833Compensation toEmployees - - - - - - -Use of goods andservices - - - - - - -Current TransfersGovt. Agencies 1,833 3,217 10,196 12,139 1,833 1,833 1,833Other Recurrent
- - - - - - -2. CapitalExpenditure 1,465 1,465 1,447 1,447 1,465 1,447 1,447Acquisition ofNon-FinancialAssets
- - - - - - -
Capital Transfersto Govt. Agencies 1,465 1,465 1,447 1,447 1,465 1,447 1,447OtherDevelopment - - - - - - -Sub-Programme(SP)
SP. 6.1 Census andSurvey 859 2,243 9,204 11,147 859 841 8411. CurrentExpenditure 783 2,167 9,146 11,089 783 783 783Compensation toEmployees - - - - - - -Use of goods andservices - - - - - - -Current TransfersGovt. Agencies 783 2,167 9,146 11,089 783 783 783Other Recurrent
- - - - - - -2. CapitalExpenditure 76 76 58 58 76 58 58Acquisition ofNon-FinancialAssets
- - - - - - -
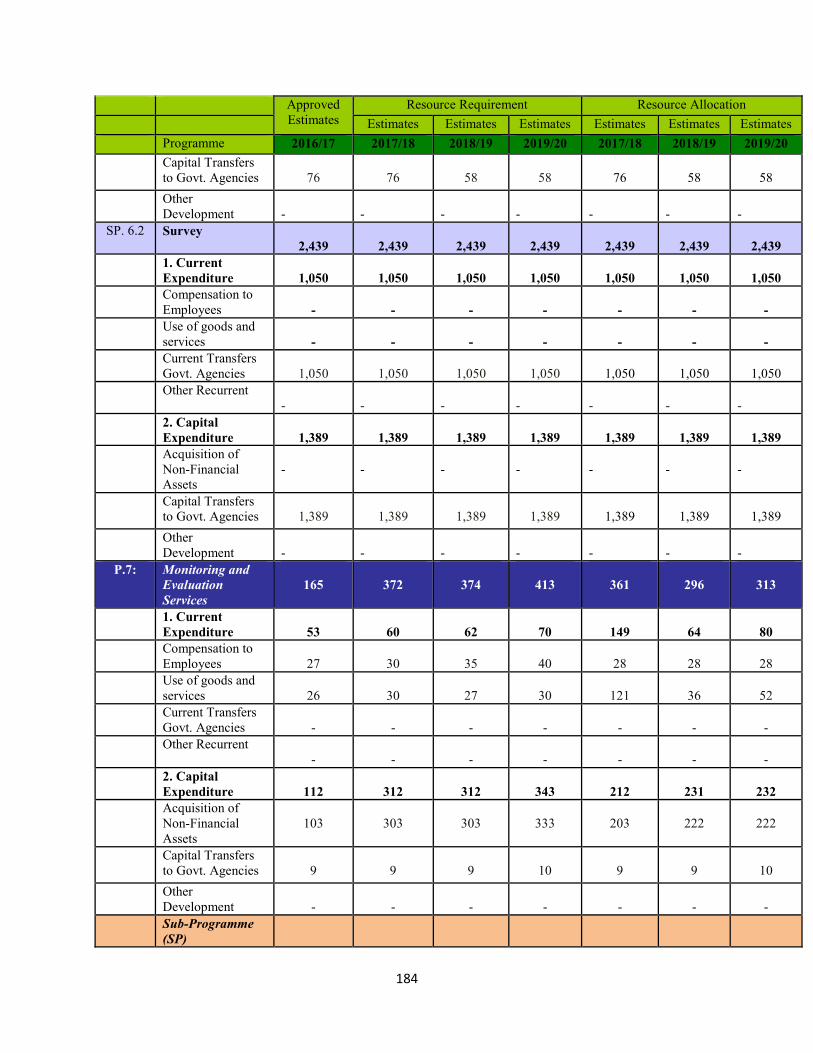
184
ApprovedEstimates
Resource Requirement Resource AllocationEstimates Estimates Estimates Estimates Estimates Estimates
Programme 2016/17 2017/18 2018/19 2019/20 2017/18 2018/19 2019/20Capital Transfersto Govt. Agencies 76 76 58 58 76 58 58OtherDevelopment - - - - - - -
SP. 6.2 Survey2,439 2,439 2,439 2,439 2,439 2,439 2,439
1. CurrentExpenditure 1,050 1,050 1,050 1,050 1,050 1,050 1,050Compensation toEmployees - - - - - - -Use of goods andservices - - - - - - -Current TransfersGovt. Agencies 1,050 1,050 1,050 1,050 1,050 1,050 1,050Other Recurrent
- - - - - - -2. CapitalExpenditure 1,389 1,389 1,389 1,389 1,389 1,389 1,389Acquisition ofNon-FinancialAssets
- - - - - - -
Capital Transfersto Govt. Agencies 1,389 1,389 1,389 1,389 1,389 1,389 1,389OtherDevelopment - - - - - - -
P.7: Monitoring andEvaluationServices
165 372 374 413 361 296 313
1. CurrentExpenditure 53 60 62 70 149 64 80Compensation toEmployees 27 30 35 40 28 28 28Use of goods andservices 26 30 27 30 121 36 52Current TransfersGovt. Agencies - - - - - - -Other Recurrent
- - - - - - -2. CapitalExpenditure 112 312 312 343 212 231 232Acquisition ofNon-FinancialAssets
103 303 303 333 203 222 222
Capital Transfersto Govt. Agencies 9 9 9 10 9 9 10OtherDevelopment - - - - - - -Sub-Programme(SP)

185
ApprovedEstimates
Resource Requirement Resource AllocationEstimates Estimates Estimates Estimates Estimates Estimates
Programme 2016/17 2017/18 2018/19 2019/20 2017/18 2018/19 2019/20SP.7.1 National
IntegratedMonitoring andEvaluation
165 372 374 413 361 296 313
1. CurrentExpenditure 53 60 62 70 149 64 80Compensation toEmployees 27 30 35 40 28 28 28Use of goods andservices 26 30 27 30 121 36 52Current TransfersGovt. Agencies - - - - - - -Other Recurrent
- - - - - - -2. CapitalExpenditure 112 312 312 343 212 231 232Acquisition ofNon-FinancialAssets
103 303 303 333 203 222 222
Capital Transfersto Govt. Agencies 9 9 9 10 9 9 10OtherDevelopment - - - - - - -
P.8: GeneralAdministrationand SupportServices forPlanning
618 925 1,029 1,129 579 579 579
1. CurrentExpenditure 583 790 894 981 578 578 578Compensation toEmployees 204 256 287 313 205 205 205Use of goods andservices 354 477 548 603 349 349 349Current TransfersGovt. Agencies 20 20 20 22 20 20 20Other Recurrent
4 37 39 43 4 4 42. CapitalExpenditure 35 135 135 148 - - -Acquisition ofNon-FinancialAssets
35 135 135 148 - - -
Capital Transfersto Govt. Agencies - - - - - - -OtherDevelopment - - - - - - -Sub-Programme(SP)

186
ApprovedEstimates
Resource Requirement Resource AllocationEstimates Estimates Estimates Estimates Estimates Estimates
Programme 2016/17 2017/18 2018/19 2019/20 2017/18 2018/19 2019/20SP.8.1 Human Resource
& SupportServices
485 680 768 840 442 442 442
1. CurrentExpenditure 450 545 633 692 442 442 442Compensation toEmployees 146 180 201 217 139 139 139Use of goods andservices 284 345 412 453 283 283 283Current TransfersGovt. Agencies 20 20 20 22 20 20 20Other Recurrent
-2. CapitalExpenditure 35 135 135 148 - - -Acquisition ofNon-FinancialAssets
35 135 135 148 - - -
Capital Transfersto Govt. Agencies - - - - - - -OtherDevelopment - - - - - - -
SP.8.2 FinancialManagementServices
106 156 163 179 113 113 113
1. CurrentExpenditure 106 156 163 179 113 113 113Compensation toEmployees 56 71 78 86 63 63 63Use of goods andservices 50 85 85 93 50 50 50Current TransfersGovt. Agencies - - - - - - -Other Recurrent2. CapitalExpenditure - - - - - - -Acquisition ofNon-FinancialAssets
- - - - - - -
Capital Transfersto Govt. Agencies - - - - - - -OtherDevelopment - - - - - - -
SP.8.3 Information andCommunicationTechnology
27 89 98 110 23 23 23
1. CurrentExpenditure 27 89 98 110 23 23 23Compensation to

187
ApprovedEstimates
Resource Requirement Resource AllocationEstimates Estimates Estimates Estimates Estimates Estimates
Programme 2016/17 2017/18 2018/19 2019/20 2017/18 2018/19 2019/20Employees 2 5 8 10 3 3 3Use of goods andservices 20 47 51 57 16 16 16Current TransfersGovt. Agencies - - - - - - -Other Recurrent
4 37 39 43 4 4 42. CapitalExpenditure - - - - - - -Acquisition ofNon-FinancialAssets
- - - - - - -
Capital Transfersto Govt. Agencies - - - - - - -OtherDevelopment - - - - - - -
P.9: IntegratedRegionalDevelopment
3,862 20,155 28,312 64,254 3,862 3,862 3,863
1. CurrentExpenditure 1,045 1,887 2,102 2,342 1,045 1,045 1,046Compensation toEmployees 7 8 9 10 7 7 8Use of goods andservices 13 17 17 19 13 13 13Current TransfersGovt. Agencies 1,025 1,862 2,076 2,313 1,025 1,025 1,025Other Recurrent
- - - - - - -2. CapitalExpenditure 2,817 18,268 26,210 61,912 2,817 2,817 2,817Acquisition ofNon-FinancialAssets
922 1,107 803 352 922 922 922
Capital Transfersto Govt. Agencies 1,895 17,026 25,301 61,500 1,895 1,895 1,895OtherDevelopment - 135 106 60 - - -Sub-Programme(SP)
SP. 9.1 Integrated BainBasedDevelopment
3,862 20,155 28,312 64,254 3,862 3,862 3,862
1. CurrentExpenditure 1,045 1,887 2,102 2,342 1,045 1,045 1,046Compensation toEmployees 7 8 9 10 7 7 8Use of goods andservices 13 17 17 19 13 13 13

188
ApprovedEstimates
Resource Requirement Resource AllocationEstimates Estimates Estimates Estimates Estimates Estimates
Programme 2016/17 2017/18 2018/19 2019/20 2017/18 2018/19 2019/20Current TransfersGovt. Agencies 1,025 1,862 2,076 2,313 1,025 1,025 1,025Other Recurrent
- - - - - - -2. CapitalExpenditure 2,817 18,268 26,210 61,912 2,817 2,817 2,817Acquisition ofNon-FinancialAssets
922 1,107 803 352 922 922 922
Capital Transfersto Govt. Agencies 1,895 17,026 25,301 61,500 1,895 1,895 1,895OtherDevelopment - 135 106 60
P.10: NGO RegulatoryServices 126 283 316 340 125 125 1251. CurrentExpenditure 126 283 316 340 125 125 125Compensation toEmployees - - - - - - -Use of goods andservices - - - - - - -Current TransfersGovt. Agencies 126 283 316 340 125 125 125Other Recurrent
- - - - - - -2. CapitalExpenditure - - - - - - -Acquisition ofNon-FinancialAssets
- - - - - - -
Capital Transfersto Govt. Agencies - - - - - - -OtherDevelopment - - - - - - -Sub-Programme(SP)
SP. 10.1 NGO RegulatoryServices 126 283 316 340 125 125 1251. CurrentExpenditure 126 283 316 340 125 125 125Compensation toEmployees - - - - - - -Use of goods andservices - - - - - - -Current TransfersGovt. Agencies 126 283 316 340 125 125 125Other Recurrent
- - - - - - -2. Capital

189
ApprovedEstimates
Resource Requirement Resource AllocationEstimates Estimates Estimates Estimates Estimates Estimates
Programme 2016/17 2017/18 2018/19 2019/20 2017/18 2018/19 2019/20Expenditure - - - - - - -Acquisition ofNon-FinancialAssets
- - - - - - -
Capital Transfersto Govt. Agencies - - - - - - -OtherDevelopment - - - - - - -
DEVOLUTIONP.11: General
AdministrationServices
153 425 431 415 266 251 254
1. CurrentExpenditure 133 395 401 415 246 251 254Compensation toEmployees 67 100 103 106 80 83 86Use of goods andservices 65 281 291 302 163 165 165Current TransfersGovt. Agencies - - - - - - -Other Recurrent
1 14 7 7 3 3 32. CapitalExpenditure 20 30 30 - 20 - -Acquisition ofNon-FinancialAssets
20 30 30 - 20 - -
Capital Transfersto Govt. Agencies - - - - - - -OtherDevelopment - - - - - - -Sub-Programme(SP)
SP. 11.1 AdministrativeHeadquarters 121 377 380 391 234 237 2401. CurrentExpenditure 121 377 380 391 234 237 240Compensation toEmployees 67 100 103 106 80 83 86Use of goods andservices 54 266 274 282 154 154 154Current TransfersGovt. Agencies - - - - - - -Other Recurrent
11 3 32. CapitalExpenditure - - - - - - -Acquisition ofNon-Financial - - - - - - -

190
ApprovedEstimates
Resource Requirement Resource AllocationEstimates Estimates Estimates Estimates Estimates Estimates
Programme 2016/17 2017/18 2018/19 2019/20 2017/18 2018/19 2019/20Assets
Capital Transfersto Govt. Agencies - - - - - - -OtherDevelopment - - - - - - -
SP. 11.2 Finance andPlanning Services 7 12 14 15 7 8 81. CurrentExpenditure 7 12 14 15 7 8 8Compensation toEmployeesUse of goods andservices 7 10 11 12 5 6 6Current TransfersGovt. Agencies - - - - - - -Other Recurrent
- 2 3 3 2 2 22. CapitalExpenditure - - - - - - -Acquisition ofNon-FinancialAssets
- - - - - - -
Capital Transfersto Govt. Agencies - - - - - - -OtherDevelopment - - - - - - -
SP. 11.3 ICT25 36 37 9 25 6 6
1. CurrentExpenditure 5 6 7 9 5 6 6Compensation toEmployeesUse of goods andservices 4 5 6 8 4 5 5Current TransfersGovt. AgenciesOther Recurrent
1 1 1 1 1 1 12. CapitalExpenditure 20 30 30 - 20 - -Acquisition ofNon-FinancialAssets
20 30 30 20
Capital Transfersto Govt. Agencies - - - - - - -OtherDevelopment - - - - - - -
P.12: Devolution
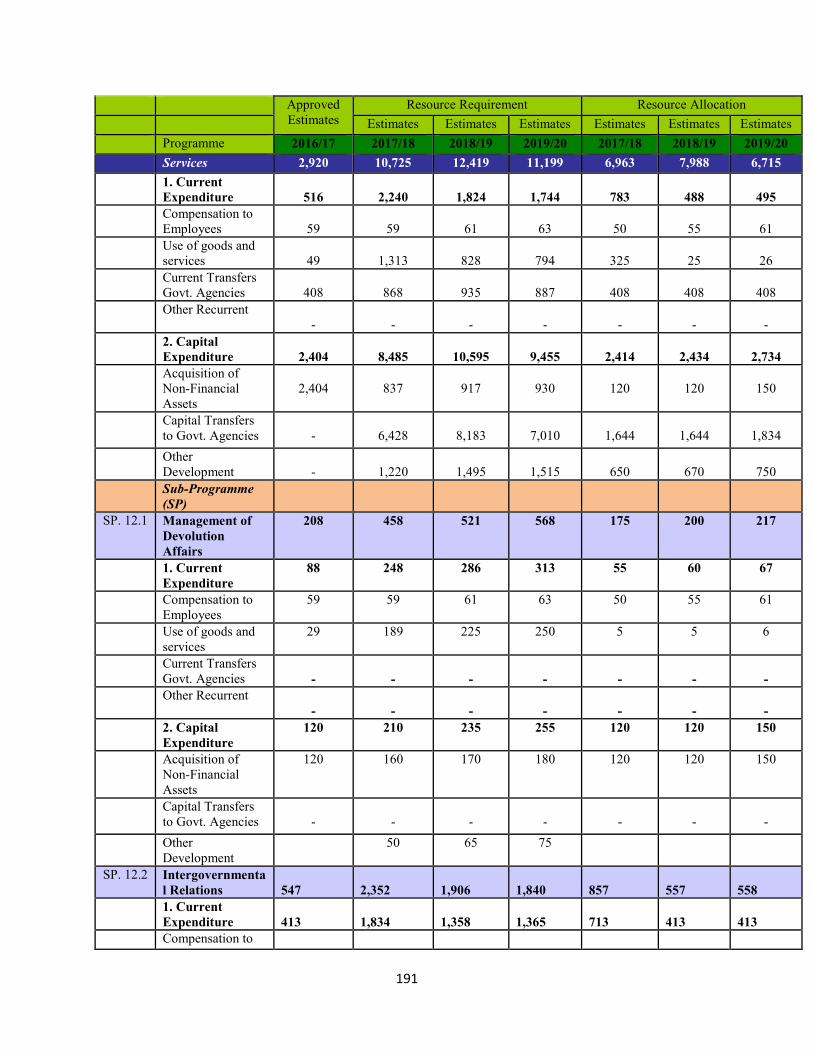
191
ApprovedEstimates
Resource Requirement Resource AllocationEstimates Estimates Estimates Estimates Estimates Estimates
Programme 2016/17 2017/18 2018/19 2019/20 2017/18 2018/19 2019/20Services 2,920 10,725 12,419 11,199 6,963 7,988 6,7151. CurrentExpenditure 516 2,240 1,824 1,744 783 488 495Compensation toEmployees 59 59 61 63 50 55 61Use of goods andservices 49 1,313 828 794 325 25 26Current TransfersGovt. Agencies 408 868 935 887 408 408 408Other Recurrent
- - - - - - -2. CapitalExpenditure 2,404 8,485 10,595 9,455 2,414 2,434 2,734Acquisition ofNon-FinancialAssets
2,404 837 917 930 120 120 150
Capital Transfersto Govt. Agencies - 6,428 8,183 7,010 1,644 1,644 1,834OtherDevelopment - 1,220 1,495 1,515 650 670 750Sub-Programme(SP)
SP. 12.1 Management ofDevolutionAffairs
208 458 521 568 175 200 217
1. CurrentExpenditure
88 248 286 313 55 60 67
Compensation toEmployees
59 59 61 63 50 55 61
Use of goods andservices
29 189 225 250 5 5 6
Current TransfersGovt. Agencies - - - - - - -Other Recurrent
- - - - - - -2. CapitalExpenditure
120 210 235 255 120 120 150
Acquisition ofNon-FinancialAssets
120 160 170 180 120 120 150
Capital Transfersto Govt. Agencies - - - - - - -OtherDevelopment
50 65 75
SP. 12.2 Intergovernmental Relations 547 2,352 1,906 1,840 857 557 5581. CurrentExpenditure 413 1,834 1,358 1,365 713 413 413Compensation to
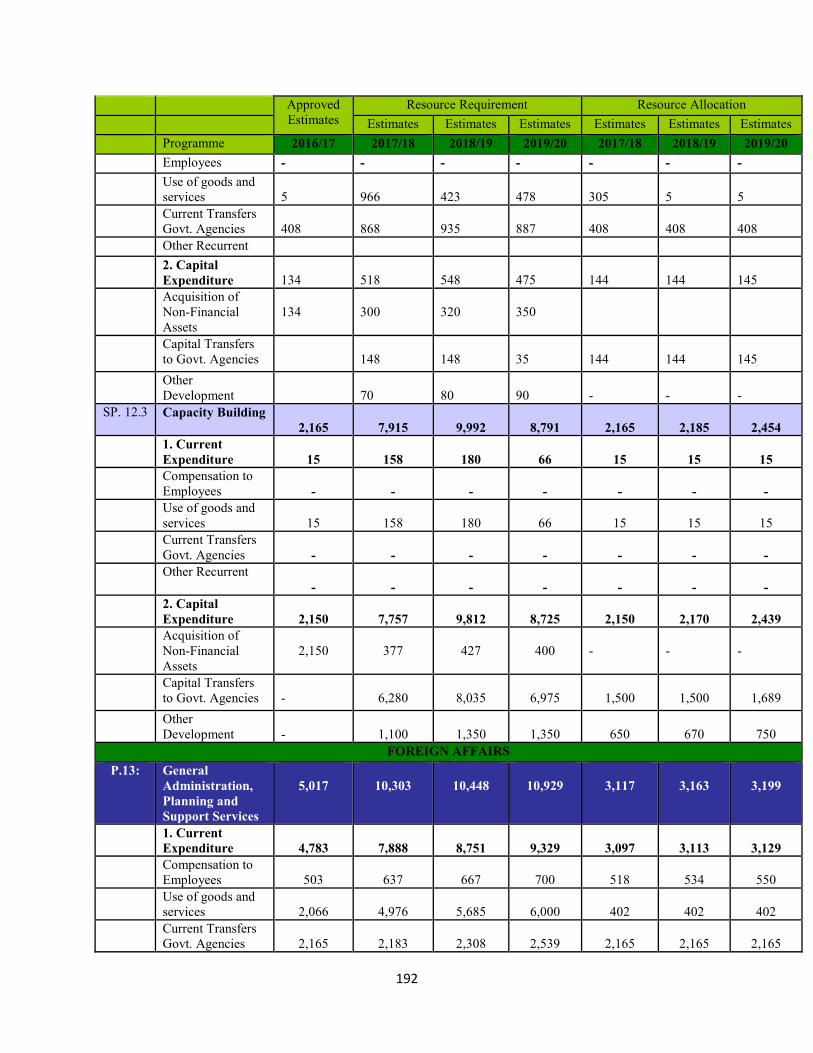
192
ApprovedEstimates
Resource Requirement Resource AllocationEstimates Estimates Estimates Estimates Estimates Estimates
Programme 2016/17 2017/18 2018/19 2019/20 2017/18 2018/19 2019/20Employees - - - - - - -Use of goods andservices 5 966 423 478 305 5 5Current TransfersGovt. Agencies 408 868 935 887 408 408 408Other Recurrent2. CapitalExpenditure 134 518 548 475 144 144 145Acquisition ofNon-FinancialAssets
134 300 320 350
Capital Transfersto Govt. Agencies 148 148 35 144 144 145OtherDevelopment 70 80 90 - - -
SP. 12.3 Capacity Building2,165 7,915 9,992 8,791 2,165 2,185 2,454
1. CurrentExpenditure 15 158 180 66 15 15 15Compensation toEmployees - - - - - - -Use of goods andservices 15 158 180 66 15 15 15Current TransfersGovt. Agencies - - - - - - -Other Recurrent
- - - - - - -2. CapitalExpenditure 2,150 7,757 9,812 8,725 2,150 2,170 2,439Acquisition ofNon-FinancialAssets
2,150 377 427 400 - - -
Capital Transfersto Govt. Agencies - 6,280 8,035 6,975 1,500 1,500 1,689OtherDevelopment - 1,100 1,350 1,350 650 670 750
FOREIGN AFFAIRSP.13: General
Administration,Planning andSupport Services
5,017 10,303 10,448 10,929 3,117 3,163 3,199
1. CurrentExpenditure 4,783 7,888 8,751 9,329 3,097 3,113 3,129Compensation toEmployees 503 637 667 700 518 534 550Use of goods andservices 2,066 4,976 5,685 6,000 402 402 402Current TransfersGovt. Agencies 2,165 2,183 2,308 2,539 2,165 2,165 2,165

193
ApprovedEstimates
Resource Requirement Resource AllocationEstimates Estimates Estimates Estimates Estimates Estimates
Programme 2016/17 2017/18 2018/19 2019/20 2017/18 2018/19 2019/20Other Recurrent
49 92 91 90 12 12 122. CapitalExpenditure 234 2,415 1,697 1,600 20 50 70Acquisition ofNon-FinancialAssets
- 1,050 300 200 20 50 70
Capital Transfersto Govt. Agencies 234 1,365 1,397 1,400 - - -OtherDevelopment - - - - - - -Sub-Programme(SP)
SP. 13.1 AdministrationServices 5,017 10,303 10,448 10,929 3,117 3,163 3,1991. CurrentExpenditure 4,783 7,888 8,751 9,329 3,097 3,113 3,129Compensation toEmployees 503 637 667 700 518 534 550Use of goods andservices 2,066 4,976 5,685 6,000 402 402 402Current TransfersGovt. Agencies 2,165 2,183 2,308 2,539 2,165 2,165 2,165Other Recurrent
49 92 91 90 12 12 122. CapitalExpenditure 234 2,415 1,697 1,600 20 50 70Acquisition ofNon-FinancialAssets
- 1,050 300 200 20 50 70
Capital Transfersto Govt. Agencies 234 1,365 1,397 1,400 - - -OtherDevelopment - - - - - - -
P.14: Foreign Relationsand Diplomacy 9,107 25,494 24,606 25,574 16,053 18,334 18,6571. CurrentExpenditure 12,423 16,839 17,525 18,451 14,323 14,684 14,891Compensation toEmployees 6,341 7,073 7,422 7,975 6,531 6,727 6,929Use of goods andservices 5,183 10,366 10,804 11,118 6,893 7,057 7,062Current TransfersGovt. Agencies 694 862 947 1,008 694 694 694Other Recurrent
205 588 452 450 206 206 2062. CapitalExpenditure 2,766 8,655 7,081 7,123 1,730 3,650 3,766

194
ApprovedEstimates
Resource Requirement Resource AllocationEstimates Estimates Estimates Estimates Estimates Estimates
Programme 2016/17 2017/18 2018/19 2019/20 2017/18 2018/19 2019/20Acquisition ofNon-FinancialAssets
2,766 8,605 7,028 6,923 1,730 3,650 3,766
Capital Transfersto Govt. Agencies - 50 53 200 - - -OtherDevelopment - - - - - - -Sub-Programme(SP)
SP. 14.1 InternationalRelations andCooperation
14,423 16,789 17,475 18,401 12,656 12,951 13,153
1. CurrentExpenditure 12,423 16,789 17,475 18,401 12,656 12,951 13,153Compensation toEmployees 6,341 7,073 7,422 7,975 6,531 6,727 6,929Use of goods andservices 5,183 8,266 8,654 8,968 5,225 5,324 5,324Current TransfersGovt. Agencies 694 862 947 1,008 694 694 694Other Recurrent
205 588 452 450 206 206 2062. CapitalExpenditure 2,000 - - - - - -Acquisition ofNon-FinancialAssets
2,000 - - - - - -
Capital Transfersto Govt. Agencies - - - - - - -OtherDevelopment - - - - - - -
SP. 14.2 Management ofInternationalTreaties,Agreements andConventions
- 50 50 50 49 49 49
1. CurrentExpenditure - 50 50 50 49 49 49Compensation toEmployees - - - - - - -Use of goods andservices - 50 50 50 49 49 49Current TransfersGovt. Agencies - - - - - - -Other Recurrent
- - - - - - -2. CapitalExpenditure - - - - - - -
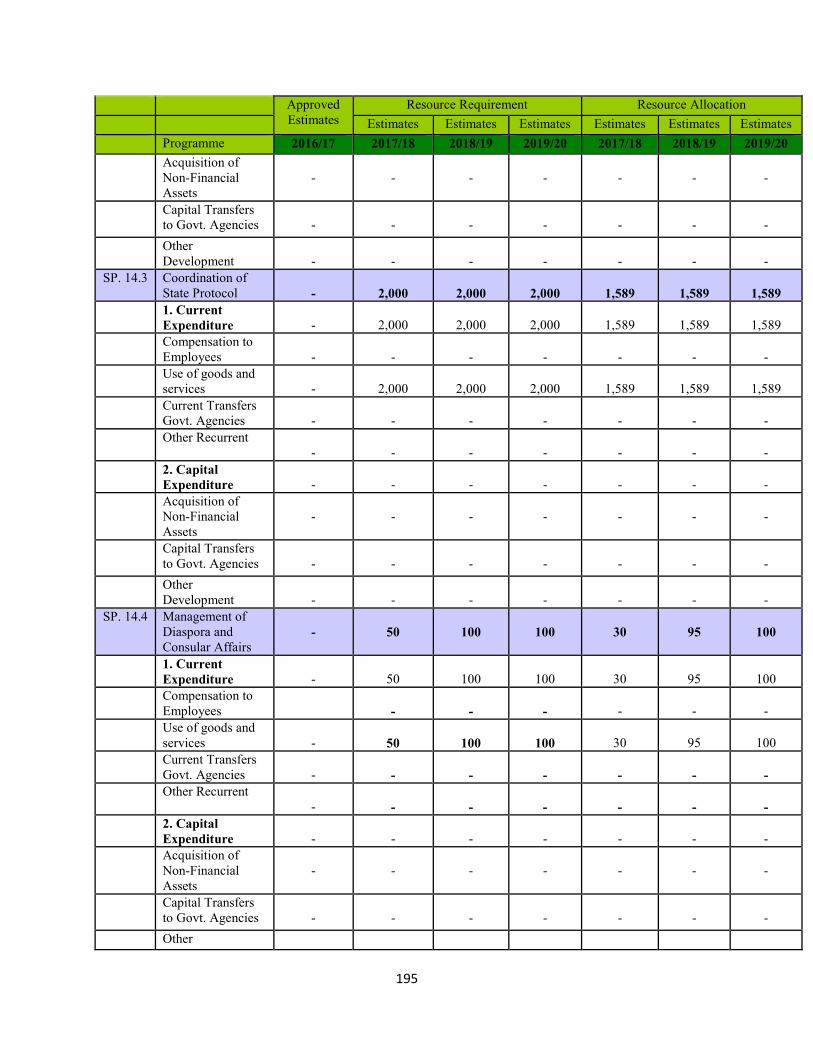
195
ApprovedEstimates
Resource Requirement Resource AllocationEstimates Estimates Estimates Estimates Estimates Estimates
Programme 2016/17 2017/18 2018/19 2019/20 2017/18 2018/19 2019/20Acquisition ofNon-FinancialAssets
- - - - - - -
Capital Transfersto Govt. Agencies - - - - - - -OtherDevelopment - - - - - - -
SP. 14.3 Coordination ofState Protocol - 2,000 2,000 2,000 1,589 1,589 1,5891. CurrentExpenditure - 2,000 2,000 2,000 1,589 1,589 1,589Compensation toEmployees - - - - - - -Use of goods andservices - 2,000 2,000 2,000 1,589 1,589 1,589Current TransfersGovt. Agencies - - - - - - -Other Recurrent
- - - - - - -2. CapitalExpenditure - - - - - - -Acquisition ofNon-FinancialAssets
- - - - - - -
Capital Transfersto Govt. Agencies - - - - - - -OtherDevelopment - - - - - - -
SP. 14.4 Management ofDiaspora andConsular Affairs
- 50 100 100 30 95 100
1. CurrentExpenditure - 50 100 100 30 95 100Compensation toEmployees - - - - - -Use of goods andservices - 50 100 100 30 95 100Current TransfersGovt. Agencies - - - - - - -Other Recurrent
- - - - - - -2. CapitalExpenditure - - - - - - -Acquisition ofNon-FinancialAssets
- - - - - - -
Capital Transfersto Govt. Agencies - - - - - - -Other
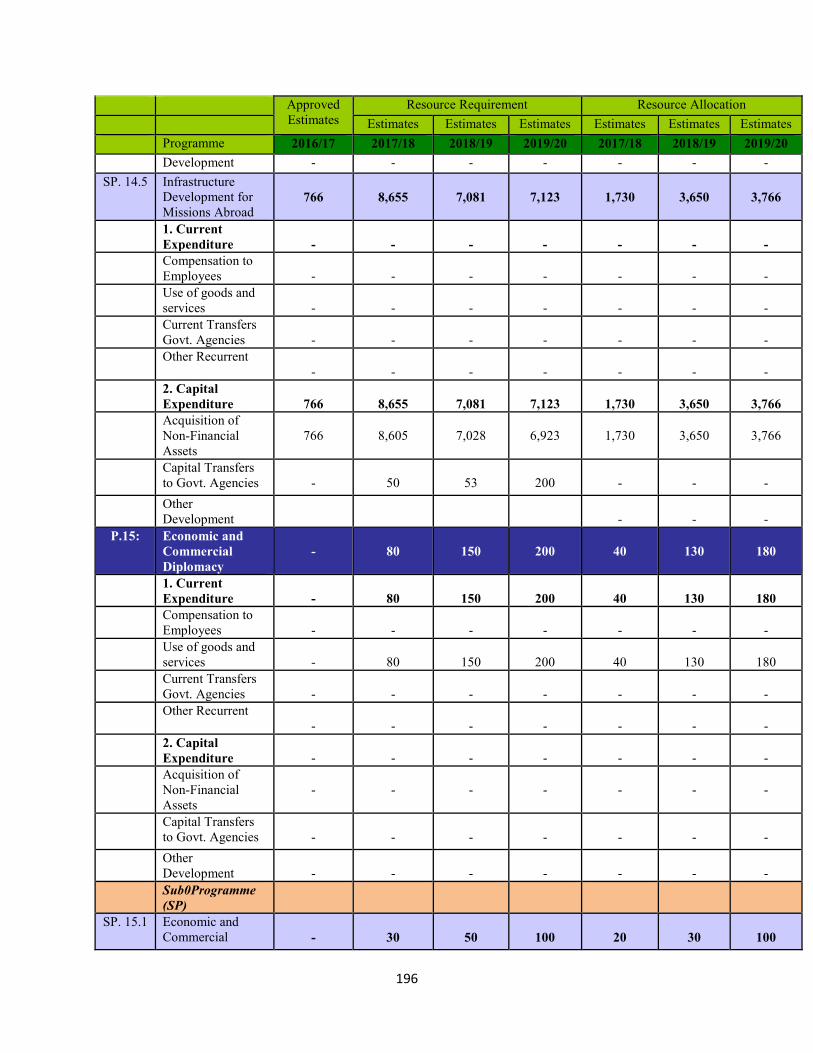
196
ApprovedEstimates
Resource Requirement Resource AllocationEstimates Estimates Estimates Estimates Estimates Estimates
Programme 2016/17 2017/18 2018/19 2019/20 2017/18 2018/19 2019/20Development - - - - - - -
SP. 14.5 InfrastructureDevelopment forMissions Abroad
766 8,655 7,081 7,123 1,730 3,650 3,766
1. CurrentExpenditure - - - - - - -Compensation toEmployees - - - - - - -Use of goods andservices - - - - - - -Current TransfersGovt. Agencies - - - - - - -Other Recurrent
- - - - - - -2. CapitalExpenditure 766 8,655 7,081 7,123 1,730 3,650 3,766Acquisition ofNon-FinancialAssets
766 8,605 7,028 6,923 1,730 3,650 3,766
Capital Transfersto Govt. Agencies - 50 53 200 - - -OtherDevelopment - - -
P.15: Economic andCommercialDiplomacy
- 80 150 200 40 130 180
1. CurrentExpenditure - 80 150 200 40 130 180Compensation toEmployees - - - - - - -Use of goods andservices - 80 150 200 40 130 180Current TransfersGovt. Agencies - - - - - - -Other Recurrent
- - - - - - -2. CapitalExpenditure - - - - - - -Acquisition ofNon-FinancialAssets
- - - - - - -
Capital Transfersto Govt. Agencies - - - - - - -OtherDevelopment - - - - - - -Sub0Programme(SP)
SP. 15.1 Economic andCommercial - 30 50 100 20 30 100

197
ApprovedEstimates
Resource Requirement Resource AllocationEstimates Estimates Estimates Estimates Estimates Estimates
Programme 2016/17 2017/18 2018/19 2019/20 2017/18 2018/19 2019/20Cooperation
1. CurrentExpenditure - 30 50 100 20 30 100Compensation toEmployees - - - - - - -Use of goods andservices - 30 50 100 20 30 100Current TransfersGovt. Agencies - - - - - - -Other Recurrent
- - - - - - -2. CapitalExpenditure - - - - - - -Acquisition ofNon0FinancialAssets
- - - - - - -
Capital Transfersto Govt. Agencies - - - - - - -OtherDevelopment - - - - - - -
SP. 15.2 RegionalIntergration,Bilateral andMultilateralEconomicCooperation
- 50 100 100 20 100 80
1. CurrentExpenditure - 50 100 100 20 100 80Compensation toEmployees - - - - - - -Use of goods andservices - 50 100 100 20 100 80Current TransfersGovt. Agencies - - - - - - -Other Recurrent
- - - - - - -2. CapitalExpenditure - - - - - - -Acquisition ofNon-FinancialAssets
- - - - - - -
Capital Transfersto Govt. Agencies - - - - - - -OtherDevelopment - - - - - - -
P.16: Foreign PolicyResearch,Capacity
- 470 470 660 298 321 565
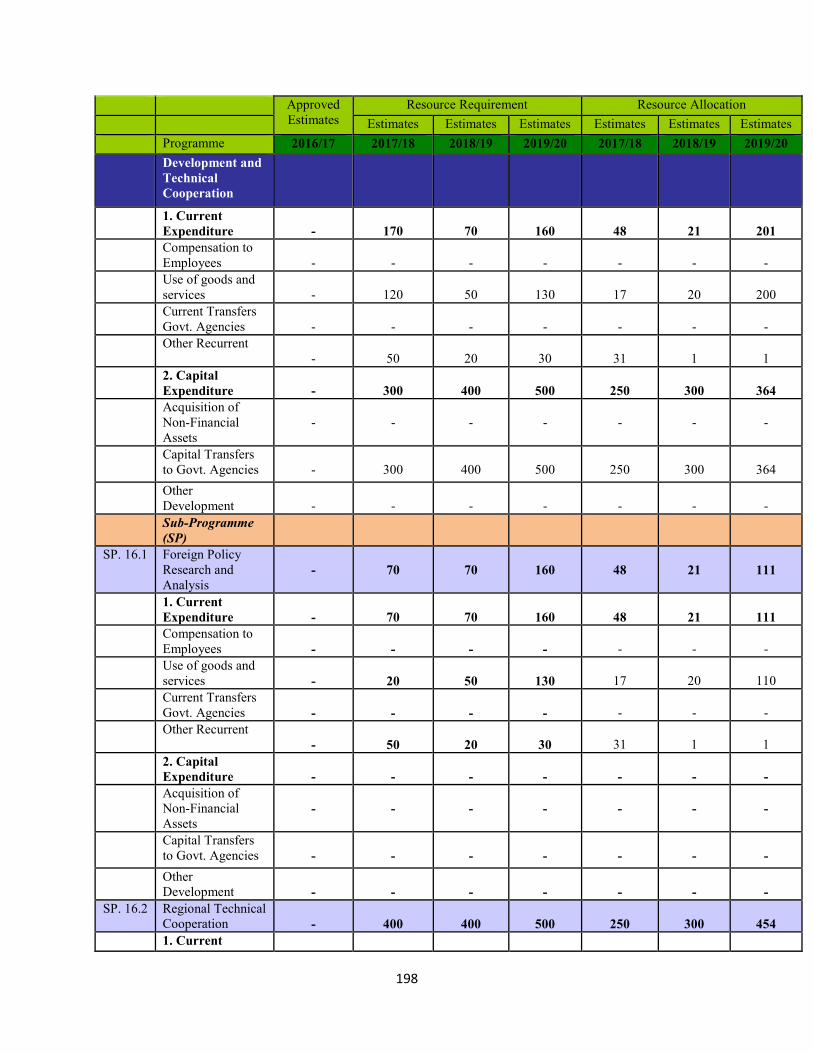
198
ApprovedEstimates
Resource Requirement Resource AllocationEstimates Estimates Estimates Estimates Estimates Estimates
Programme 2016/17 2017/18 2018/19 2019/20 2017/18 2018/19 2019/20Development andTechnicalCooperation
1. CurrentExpenditure - 170 70 160 48 21 201Compensation toEmployees - - - - - - -Use of goods andservices - 120 50 130 17 20 200Current TransfersGovt. Agencies - - - - - - -Other Recurrent
- 50 20 30 31 1 12. CapitalExpenditure - 300 400 500 250 300 364Acquisition ofNon-FinancialAssets
- - - - - - -
Capital Transfersto Govt. Agencies - 300 400 500 250 300 364OtherDevelopment - - - - - - -Sub-Programme(SP)
SP. 16.1 Foreign PolicyResearch andAnalysis
- 70 70 160 48 21 111
1. CurrentExpenditure - 70 70 160 48 21 111Compensation toEmployees - - - - - - -Use of goods andservices - 20 50 130 17 20 110Current TransfersGovt. Agencies - - - - - - -Other Recurrent
- 50 20 30 31 1 12. CapitalExpenditure - - - - - - -Acquisition ofNon-FinancialAssets
- - - - - - -
Capital Transfersto Govt. Agencies - - - - - - -OtherDevelopment - - - - - - -
SP. 16.2 Regional TechnicalCooperation - 400 400 500 250 300 4541. Current
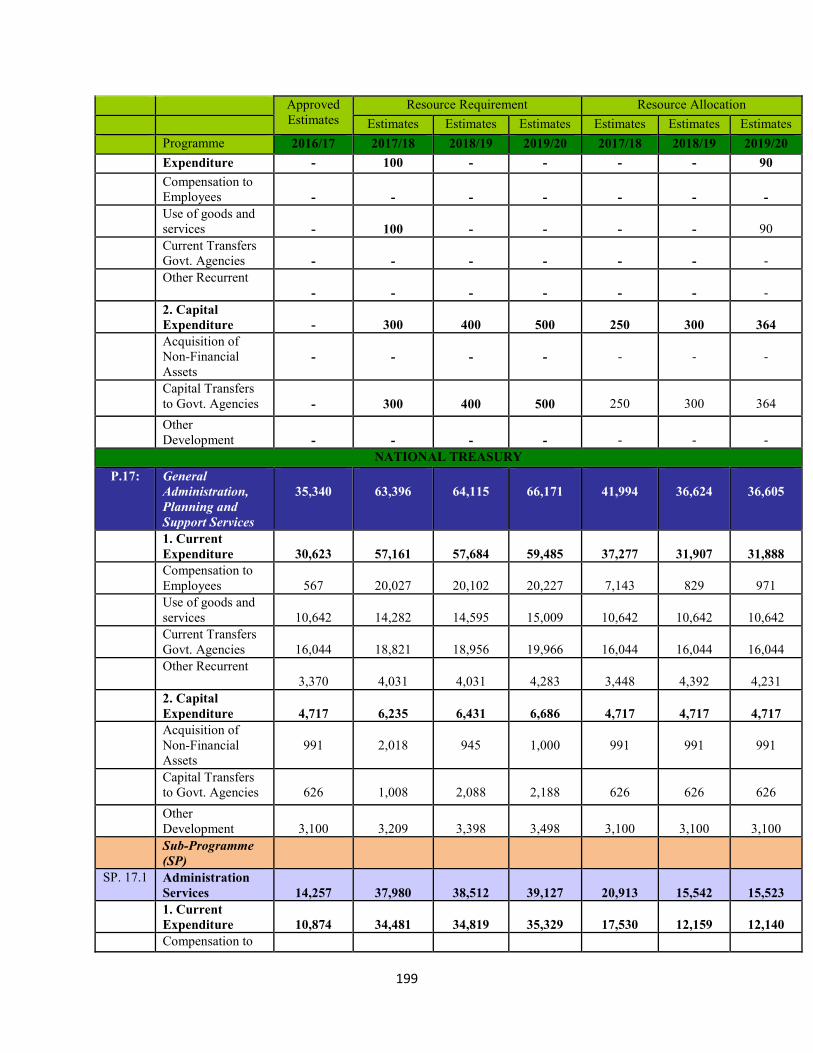
199
ApprovedEstimates
Resource Requirement Resource AllocationEstimates Estimates Estimates Estimates Estimates Estimates
Programme 2016/17 2017/18 2018/19 2019/20 2017/18 2018/19 2019/20Expenditure - 100 - - - - 90Compensation toEmployees - - - - - - -Use of goods andservices - 100 - - - - 90Current TransfersGovt. Agencies - - - - - - -Other Recurrent
- - - - - - -2. CapitalExpenditure - 300 400 500 250 300 364Acquisition ofNon-FinancialAssets
- - - - - - -
Capital Transfersto Govt. Agencies - 300 400 500 250 300 364OtherDevelopment - - - - - - -
NATIONAL TREASURYP.17: General
Administration,Planning andSupport Services
35,340 63,396 64,115 66,171 41,994 36,624 36,605
1. CurrentExpenditure 30,623 57,161 57,684 59,485 37,277 31,907 31,888Compensation toEmployees 567 20,027 20,102 20,227 7,143 829 971Use of goods andservices 10,642 14,282 14,595 15,009 10,642 10,642 10,642Current TransfersGovt. Agencies 16,044 18,821 18,956 19,966 16,044 16,044 16,044Other Recurrent
3,370 4,031 4,031 4,283 3,448 4,392 4,2312. CapitalExpenditure 4,717 6,235 6,431 6,686 4,717 4,717 4,717Acquisition ofNon-FinancialAssets
991 2,018 945 1,000 991 991 991
Capital Transfersto Govt. Agencies 626 1,008 2,088 2,188 626 626 626OtherDevelopment 3,100 3,209 3,398 3,498 3,100 3,100 3,100Sub-Programme(SP)
SP. 17.1 AdministrationServices 14,257 37,980 38,512 39,127 20,913 15,542 15,5231. CurrentExpenditure 10,874 34,481 34,819 35,329 17,530 12,159 12,140Compensation to

200
ApprovedEstimates
Resource Requirement Resource AllocationEstimates Estimates Estimates Estimates Estimates Estimates
Programme 2016/17 2017/18 2018/19 2019/20 2017/18 2018/19 2019/20Employees 229 19,679 19,744 19,844 6,805 491 633Use of goods andservices 8,549 12,027 12,274 12,474 8,549 8,549 8,549Current TransfersGovt. Agencies 238 262 288 298 238 238 238Other Recurrent
1,858 2,513 2,513 2,713 1,938 2,881 2,7202. CapitalExpenditure 3,383 3,499 3,693 3,798 3,383 3,383 3,383Acquisition ofNon-FinancialAssets
283 290 295 300 283 283 283
Capital Transfersto Govt. Agencies
- - - - - - -
OtherDevelopment 3,100 3,209 3,398 3,498 3,100 3,100 3,100
SP. 17.2 Human ResourceManagementServices
65 172 175 191 65 65 65
1. CurrentExpenditure 65 172 175 191 65 65 65Compensation toEmployees 47 49 51 56 47 47 47Use of goods andservices 17 120 121 131 17 17 17Current TransfersGovt. Agencies
- - - - - - -
Other Recurrent1 3 3 4 1 1 1
2. CapitalExpenditure - - - - - - -Acquisition ofNon-FinancialAssets
- - - - - - -
Capital Transfersto Govt. Agencies - - - - - - -OtherDevelopment - - - - - - -
SP. 17.3 Financial Services20,220 23,415 24,673 26,033 20,220 20,220 20,220
1. CurrentExpenditure 19,594 22,407 22,585 23,845 19,594 19,594 19,594Compensation toEmployees 239 245 251 261 239 239 239Use of goods andservices 2,049 2,103 2,166 2,366 2,049 2,049 2,049Current TransfersGovt. Agencies 15,806 18,559 18,668 19,668 15,806 15,806 15,806Other Recurrent

201
ApprovedEstimates
Resource Requirement Resource AllocationEstimates Estimates Estimates Estimates Estimates Estimates
Programme 2016/17 2017/18 2018/19 2019/20 2017/18 2018/19 2019/201,500 1,500 1,500 1,550 1,500 1,500 1,500
2. CapitalExpenditure 626 1,008 2,088 2,188 626 626 626Acquisition ofNon-FinancialAssets
- - - - - - -
Capital Transfersto Govt. Agencies 626 1,008 2,088 2,188 626 626 626OtherDevelopment
- - - -
SP. 17.4 ICT Services797 1,829 755 820 797 797 797
1. CurrentExpenditure 89 101 105 120 89 89 89Compensation toEmployees 52 54 56 66 52 52 52Use of goods andservices 27 32 34 38 27 27 27Current TransfersGovt. Agencies
- - - - - - -
Other Recurrent10 15 15 16 10 10 10
2. CapitalExpenditure 708 1,728 650 700 708 708 708Acquisition ofNon-FinancialAssets
708 1,728 650 700 708 708 708
Capital Transfersto Govt. Agencies
- - - - - - -
OtherDevelopment
- - - - - - -
P.18: Public FinancialManagement 44,096 56,195 66,579 70,620 46,194 47,597 49,0061. CurrentExpenditure 4,644 5,516 5,996 6,518 4,644 4,644 4,644Compensation toEmployees 1,779 1,849 1,920 2,047 1,779 1,779 1,779Use of goods andservices 1,351 1,831 2,140 2,375 1,351 1,351 1,351Current TransfersGovt. Agencies 1,437 1,708 1,797 1,947 1,437 1,437 1,437Other Recurrent
77 128 139 149 77 77 772. CapitalExpenditure 39,452 50,679 60,583 64,102 41,596 42,997 44,404Acquisition ofNon-FinancialAssets
2,744 3,230 2,802 3,745 2,071 2,073 2,075
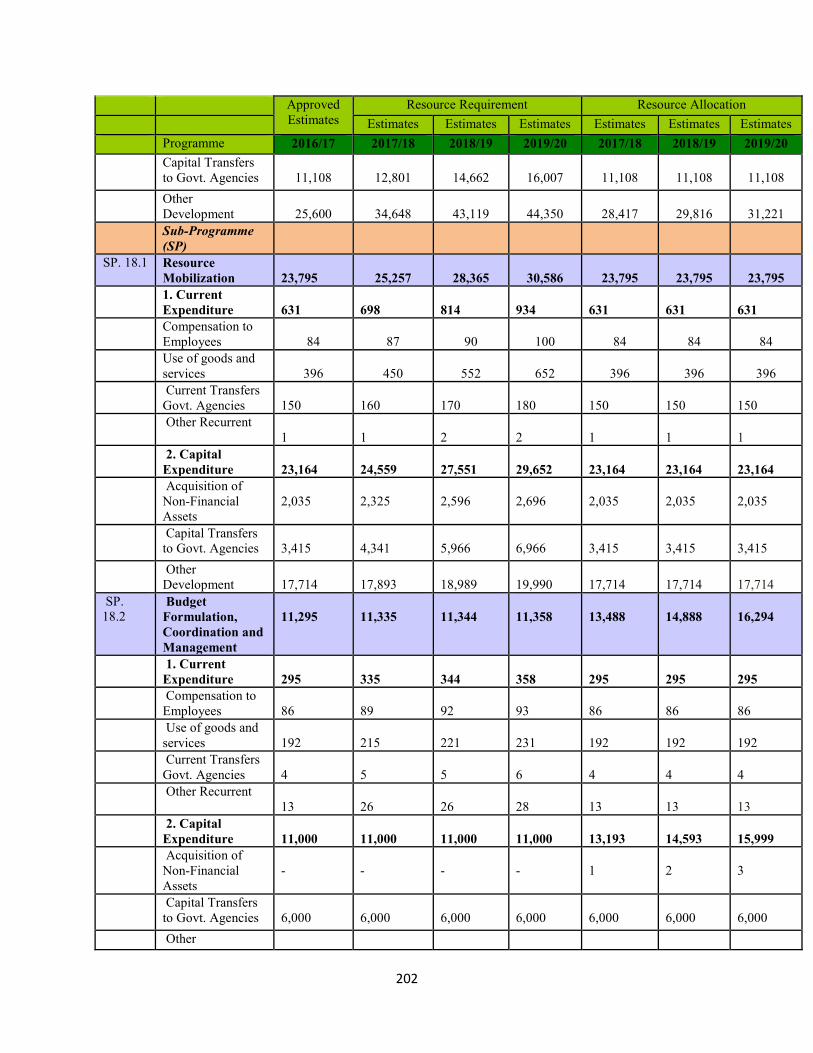
202
ApprovedEstimates
Resource Requirement Resource AllocationEstimates Estimates Estimates Estimates Estimates Estimates
Programme 2016/17 2017/18 2018/19 2019/20 2017/18 2018/19 2019/20Capital Transfersto Govt. Agencies 11,108 12,801 14,662 16,007 11,108 11,108 11,108OtherDevelopment 25,600 34,648 43,119 44,350 28,417 29,816 31,221Sub-Programme(SP)
SP. 18.1 ResourceMobilization 23,795 25,257 28,365 30,586 23,795 23,795 23,7951. CurrentExpenditure 631 698 814 934 631 631 631Compensation toEmployees 84 87 90 100 84 84 84Use of goods andservices 396 450 552 652 396 396 396Current Transfers
Govt. Agencies 150 160 170 180 150 150 150Other Recurrent
1 1 2 2 1 1 12. Capital
Expenditure 23,164 24,559 27,551 29,652 23,164 23,164 23,164Acquisition of
Non-FinancialAssets
2,035 2,325 2,596 2,696 2,035 2,035 2,035
Capital Transfersto Govt. Agencies 3,415 4,341 5,966 6,966 3,415 3,415 3,415Other
Development 17,714 17,893 18,989 19,990 17,714 17,714 17,714SP.
18.2Budget
Formulation,Coordination andManagement
11,295 11,335 11,344 11,358 13,488 14,888 16,294
1. CurrentExpenditure 295 335 344 358 295 295 295Compensation to
Employees 86 89 92 93 86 86 86Use of goods and
services 192 215 221 231 192 192 192Current Transfers
Govt. Agencies 4 5 5 6 4 4 4Other Recurrent
13 26 26 28 13 13 132. Capital
Expenditure 11,000 11,000 11,000 11,000 13,193 14,593 15,999Acquisition of
Non-FinancialAssets
- - - - 1 2 3
Capital Transfersto Govt. Agencies 6,000 6,000 6,000 6,000 6,000 6,000 6,000Other

203
ApprovedEstimates
Resource Requirement Resource AllocationEstimates Estimates Estimates Estimates Estimates Estimates
Programme 2016/17 2017/18 2018/19 2019/20 2017/18 2018/19 2019/20Development 5,000 5,000 5,000 5,000 7,192 8,591 9,996
SP.18.3
Audit Services713 829 909 938 713 713 713
1. CurrentExpenditure 679 765 845 870 679 679 679Compensation to
Employees 433 451 469 479 433 433 433Use of goods and
services 236 289 341 351 236 236 236Current Transfers
Govt. Agencies - - - - - - -Other Recurrent
10 25 35 40 10 10 102. Capital
Expenditure 34 64 64 68 34 34 34Acquisition of
Non-FinancialAssets
34 64 64 68 34 34 34
Capital Transfersto Govt. Agencies - - - - - - -Other
Development - - - - - - -SP.
18.4Accounting
Services 3,187 4,016 2,614 3,758 3,137 3,137 3,1371. Current
Expenditure 1,562 1,780 2,002 2,212 1,562 1,562 1,562Compensation to
Employees 1,024 1,064 1,106 1,206 1,024 1,024 1,024Use of goods and
services 382 505 652 752 382 382 382Current Transfers
Govt. Agencies 114 151 181 190 114 114 114Other Recurrent
42 60 63 64 42 42 422. Capital
Expenditure 1,625 2,236 612 1,546 1,575 1,575 1,575Acquisition of
Non-FinancialAssets
675 786 82 916 - - -
Capital Transfersto Govt. Agencies - - - - - - -Other
Development 950 1,450 530 630 1,575 1,575 1,575SP.
18.5Supply Chain
Management 602 793 914 1,154 602 602 6021. Current
Expenditure 502 643 754 849 502 502 502Compensation to
Employees 65 68 70 75 65 65 65
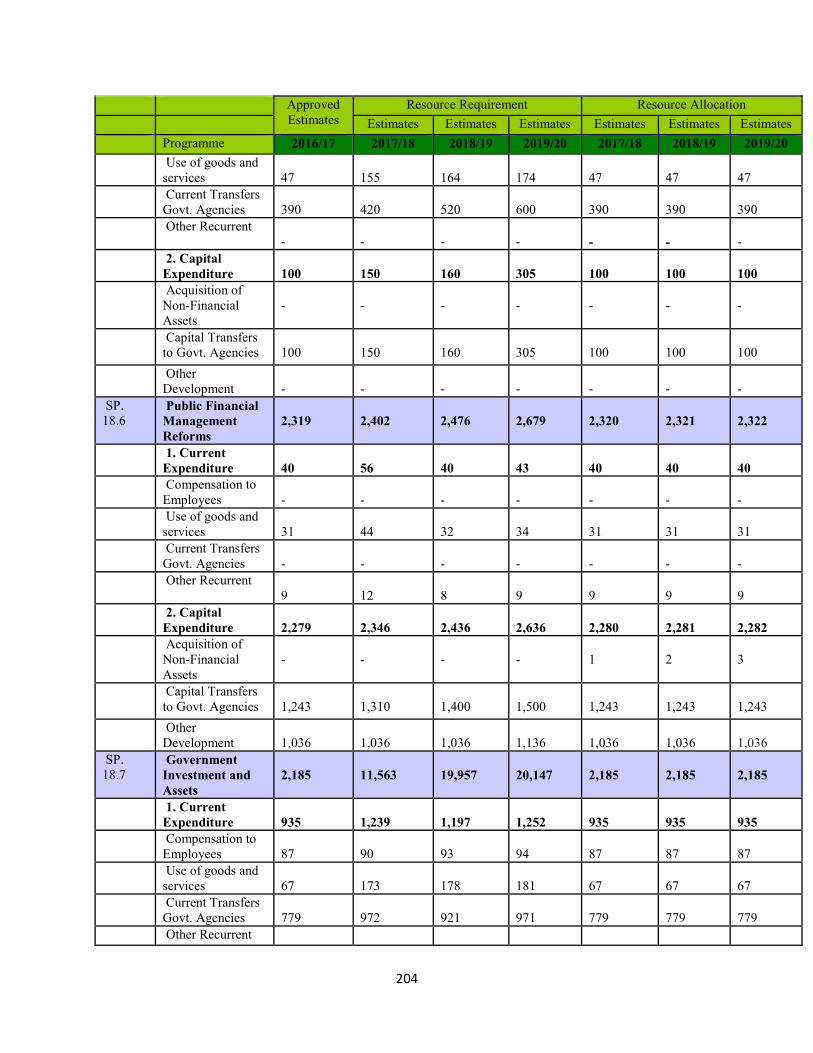
204
ApprovedEstimates
Resource Requirement Resource AllocationEstimates Estimates Estimates Estimates Estimates Estimates
Programme 2016/17 2017/18 2018/19 2019/20 2017/18 2018/19 2019/20Use of goods and
services 47 155 164 174 47 47 47Current Transfers
Govt. Agencies 390 420 520 600 390 390 390Other Recurrent
- - - - - - -2. Capital
Expenditure 100 150 160 305 100 100 100Acquisition of
Non-FinancialAssets
- - - - - - -
Capital Transfersto Govt. Agencies 100 150 160 305 100 100 100Other
Development - - - - - - -SP.
18.6Public Financial
ManagementReforms
2,319 2,402 2,476 2,679 2,320 2,321 2,322
1. CurrentExpenditure 40 56 40 43 40 40 40Compensation to
Employees - - - - - - -Use of goods and
services 31 44 32 34 31 31 31Current Transfers
Govt. Agencies - - - - - - -Other Recurrent
9 12 8 9 9 9 92. Capital
Expenditure 2,279 2,346 2,436 2,636 2,280 2,281 2,282Acquisition of
Non-FinancialAssets
- - - - 1 2 3
Capital Transfersto Govt. Agencies 1,243 1,310 1,400 1,500 1,243 1,243 1,243Other
Development 1,036 1,036 1,036 1,136 1,036 1,036 1,036SP.
18.7Government
Investment andAssets
2,185 11,563 19,957 20,147 2,185 2,185 2,185
1. CurrentExpenditure 935 1,239 1,197 1,252 935 935 935Compensation to
Employees 87 90 93 94 87 87 87Use of goods and
services 67 173 178 181 67 67 67Current Transfers
Govt. Agencies 779 972 921 971 779 779 779Other Recurrent
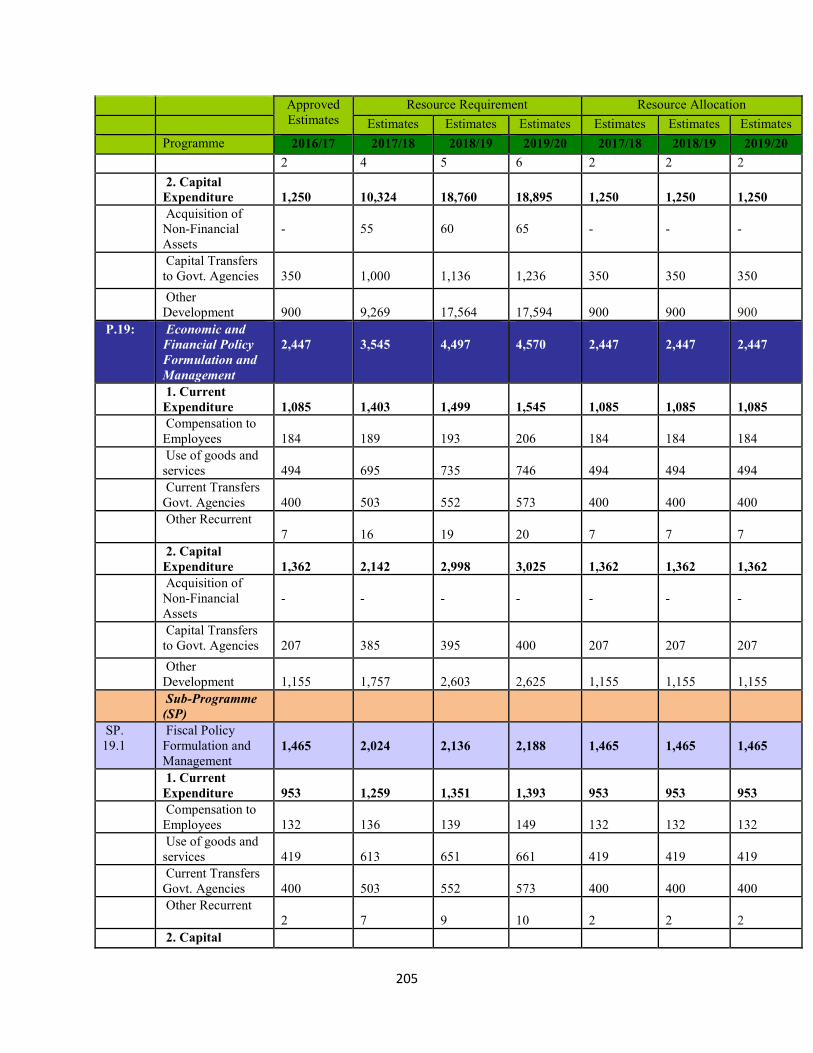
205
ApprovedEstimates
Resource Requirement Resource AllocationEstimates Estimates Estimates Estimates Estimates Estimates
Programme 2016/17 2017/18 2018/19 2019/20 2017/18 2018/19 2019/202 4 5 6 2 2 2
2. CapitalExpenditure 1,250 10,324 18,760 18,895 1,250 1,250 1,250Acquisition of
Non-FinancialAssets
- 55 60 65 - - -
Capital Transfersto Govt. Agencies 350 1,000 1,136 1,236 350 350 350Other
Development 900 9,269 17,564 17,594 900 900 900P.19: Economic and
Financial PolicyFormulation andManagement
2,447 3,545 4,497 4,570 2,447 2,447 2,447
1. CurrentExpenditure 1,085 1,403 1,499 1,545 1,085 1,085 1,085Compensation to
Employees 184 189 193 206 184 184 184Use of goods and
services 494 695 735 746 494 494 494Current Transfers
Govt. Agencies 400 503 552 573 400 400 400Other Recurrent
7 16 19 20 7 7 72. Capital
Expenditure 1,362 2,142 2,998 3,025 1,362 1,362 1,362Acquisition of
Non-FinancialAssets
- - - - - - -
Capital Transfersto Govt. Agencies 207 385 395 400 207 207 207Other
Development 1,155 1,757 2,603 2,625 1,155 1,155 1,155Sub-Programme
(SP)SP.
19.1Fiscal Policy
Formulation andManagement
1,465 2,024 2,136 2,188 1,465 1,465 1,465
1. CurrentExpenditure 953 1,259 1,351 1,393 953 953 953Compensation to
Employees 132 136 139 149 132 132 132Use of goods and
services 419 613 651 661 419 419 419Current Transfers
Govt. Agencies 400 503 552 573 400 400 400Other Recurrent
2 7 9 10 2 2 22. Capital

206
ApprovedEstimates
Resource Requirement Resource AllocationEstimates Estimates Estimates Estimates Estimates Estimates
Programme 2016/17 2017/18 2018/19 2019/20 2017/18 2018/19 2019/20Expenditure 512 765 785 795 512 512 512Acquisition of
Non-FinancialAssets
- - - - - - -
Capital Transfersto Govt. Agencies 207 385 395 400 207 207 207Other
Development 305 380 390 395 305 305 305SP.
19.2Debt Management
132 144 148 152 132 132 1321. Current
Expenditure 132 144 148 152 132 132 132Compensation to
Employees 52 53 54 57 52 52 52Use of goods and
services 75 82 84 85 75 75 75Current Transfers
Govt. Agencies- - - - - - -
Other Recurrent5 9 10 10 5 5 5
2. CapitalExpenditure - - - - - - -Acquisition of
Non-FinancialAssets
- - - - - - -
Capital Transfersto Govt. Agencies
- - - - - - -
OtherDevelopment
- - - - - - -
SP.19.3
Micro FinanceSector Support andDevelopment
850 1,377 2,213 2,230 850 850 850
1. CurrentExpenditure - - - - - - -Compensation to
Employees- - - - - - -
Use of goods andservices
- - - - - - -
Current TransfersGovt. Agencies
- - - - - - -
Other Recurrent - - - - - - -2. Capital
Expenditure 850 1,377 2,213 2,230 850 850 850Acquisition of
Non-FinancialAssets
- - - -
Capital Transfersto Govt. Agencies
- - - -
Other

207
ApprovedEstimates
Resource Requirement Resource AllocationEstimates Estimates Estimates Estimates Estimates Estimates
Programme 2016/17 2017/18 2018/19 2019/20 2017/18 2018/19 2019/20Development 850 1,377 2,213 2,230 850 850 850
P.20: MarketCompetition andCreation of anEnabling BusinessEnvironment
340 686 810 916 340 340 340
1. CurrentExpenditure 340 400 500 550 340 340 340Compensation to
Employees - - - - - - -Use of goods and
services - - - - - - -Current Transfers
Govt. Agencies 340 400 500 550 340 340 340Other Recurrent
- - - - - - -2. Capital
Expenditure - 286 310 366 - - -Acquisition of
Non-FinancialAssets
- - - - - - -
Capital Transfersto Govt. Agencies - 286 310 366 - - -Other
Development - - - - - - -Sub-Programme
(SP)SP.
20.1Elimination of
Restrictive TradePractices
340 686 810 916 340 340 340
1. CurrentExpenditure 340 400 500 550 340 340 340Compensation to
Employees- - - -
Use of goods andservices
- - - -
Current TransfersGovt. Agencies 340 400 500 550 340 340 340Other Recurrent - - - -2. Capital
Expenditure - 286 310 366 - - -Acquisition of
Non-FinancialAssets
- - -
Capital Transfersto Govt. Agencies
-286 310 366 - - -
OtherDevelopment - - - - - - -
P.21: Government

208
ApprovedEstimates
Resource Requirement Resource AllocationEstimates Estimates Estimates Estimates Estimates Estimates
Programme 2016/17 2017/18 2018/19 2019/20 2017/18 2018/19 2019/20Clearing Services 49 67 77 80 49 49 491. Current
Expenditure 49 67 77 80 49 49 49Compensation to
Employees 32 32 34 35 32 32 32Use of goods and
services 17 35 43 45 17 17 17Current Transfers
Govt. Agencies - - - - - - -Other Recurrent
- - - - - - -2. Capital
Expenditure - - - - - - -Acquisition of
Non-FinancialAssets
- - - - - - -
Capital Transfersto Govt. Agencies - - - - - - -Other
Development - - - - - - -Sub-Programme
(SP)SP.
21.1Government
Clearing Services 49 67 77 80 49 49 491. Current
Expenditure 49 67 77 80 49 49 49Compensation to
Employees 32 32 34 35 32 32 32Use of goods and
services 17 35 43 45 17 17 17Current Transfers
Govt. AgenciesOther Recurrent - - - -2. Capital
Expenditure - - - - - - -Acquisition of
Non-FinancialAssets
- - - - - - -
Capital Transfersto Govt. Agencies
- - - - - - -
OtherDevelopment
- - - - - - -
STATE DEPARTMENT OF PUBLIC SERVICE AND YOUTH AFFAIRSP.22: Youth
Empowerement 18,499 33,926 34,936 35,773 18,544 18,739 18,8861. Current
Expenditure 7,588 11,441 11,974 12,264 7,633 7,678 7,725

209
ApprovedEstimates
Resource Requirement Resource AllocationEstimates Estimates Estimates Estimates Estimates Estimates
Programme 2016/17 2017/18 2018/19 2019/20 2017/18 2018/19 2019/20Compensation to
Employees 1,462 2,131 2,473 2,581 1,506 1,551 1,598Use of goods and
services 5,116 8,112 8,224 8,319 5,116 5,116 5,116Current Transfers
Govt. Agencies 515 604 653 709 515 515 515Other Recurrent
495 594 624 655 496 496 4962. Capital
Expenditure 10,911 22,485 22,962 23,509 10,911 11,061 11,161Acquisition of
Non-FinancialAssets
4,608 11,707 11,707 11,707 4,608 4,758 4,858
Capital Transfersto Govt. Agencies 305 336 369 406 305 305 305Other
Development 5,998 10,442 10,886 11,396 5,998 5,998 5,998Sub-Programme
(SP)SP.
22.1National Youth
Service 16,864 31,920 32,540 33,248 16,896 17,079 17,2131. Current
Expenditure 6,465 10,128 10,304 10,502 6,497 6,529 6,563Compensation to
Employees 1,056 1,684 1,752 1,839 1,088 1,121 1,154Use of goods and
services 4,914 7,850 7,928 8,008 4,914 4,914 4,914Current Transfers
Govt. Agencies- - - - - - -
Other Recurrent495 594 624 655 495 495 495
2. CapitalExpenditure 10,399 21,792 22,236 22,746 10,400 10,550 10,650Acquisition of
Non-FinancialAssets
4,608 11,707 11,707 11,707 4,608 4,758 4,858
Capital Transfersto Govt. Agencies
- - - - - - -
OtherDevelopment 5,791 10,085 10,529 11,039 5,791 5,791 5,791
SP.22.2 YouthDevelopmentServices
1,004 1,260 1,570 1,608 1,017 1,029 1,042
1. CurrentExpenditure 798 903 1,213 1,251 810 822 835Compensation to
Employees 406 447 721 742 418 431 443Use of goods and
services 202 262 296 311 202 202 202
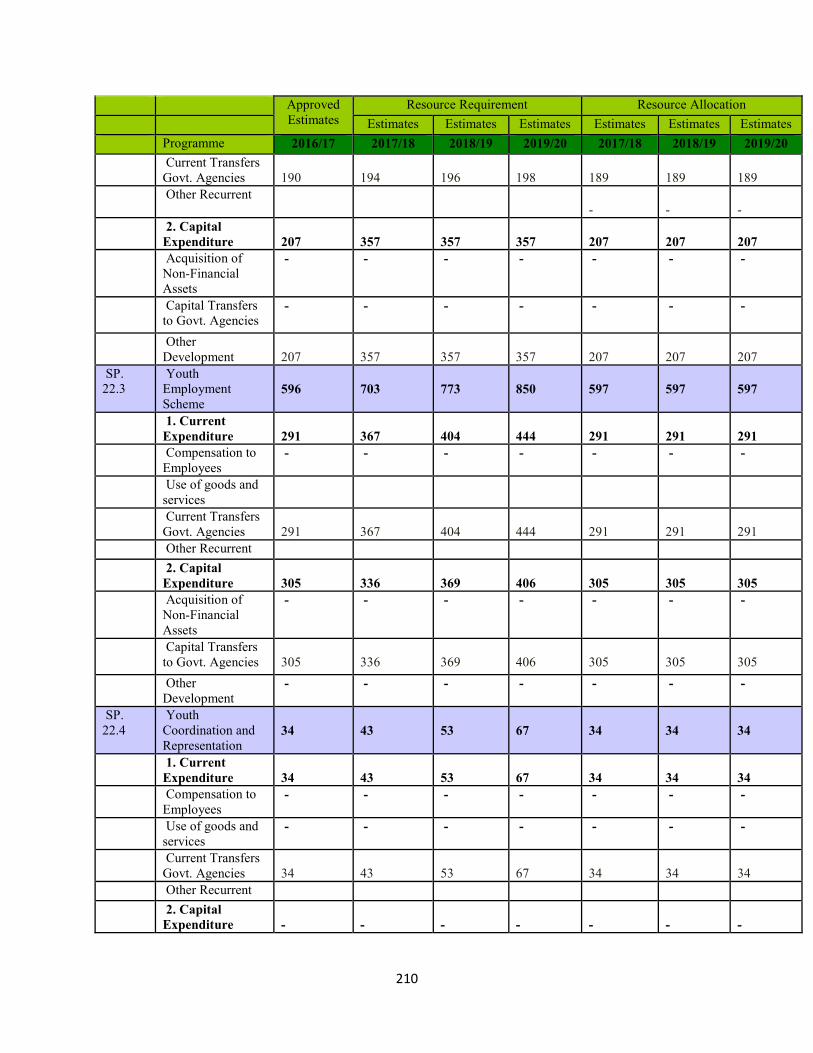
210
ApprovedEstimates
Resource Requirement Resource AllocationEstimates Estimates Estimates Estimates Estimates Estimates
Programme 2016/17 2017/18 2018/19 2019/20 2017/18 2018/19 2019/20Current Transfers
Govt. Agencies 190 194 196 198 189 189 189Other Recurrent
- - -2. Capital
Expenditure 207 357 357 357 207 207 207Acquisition of
Non-FinancialAssets
- - - - - - -
Capital Transfersto Govt. Agencies
- - - - - - -
OtherDevelopment 207 357 357 357 207 207 207
SP.22.3
YouthEmploymentScheme
596 703 773 850 597 597 597
1. CurrentExpenditure 291 367 404 444 291 291 291Compensation to
Employees- - - - - - -
Use of goods andservicesCurrent Transfers
Govt. Agencies 291 367 404 444 291 291 291Other Recurrent2. Capital
Expenditure 305 336 369 406 305 305 305Acquisition of
Non-FinancialAssets
- - - - - - -
Capital Transfersto Govt. Agencies 305 336 369 406 305 305 305Other
Development- - - - - - -
SP.22.4
YouthCoordination andRepresentation
34 43 53 67 34 34 34
1. CurrentExpenditure 34 43 53 67 34 34 34Compensation to
Employees- - - - - - -
Use of goods andservices
- - - - - - -
Current TransfersGovt. Agencies 34 43 53 67 34 34 34Other Recurrent2. Capital
Expenditure - - - - - - -

211
ApprovedEstimates
Resource Requirement Resource AllocationEstimates Estimates Estimates Estimates Estimates Estimates
Programme 2016/17 2017/18 2018/19 2019/20 2017/18 2018/19 2019/20Acquisition of
Non-FinancialAssets
- - - - - - -
Capital Transfersto Govt. Agencies - - - - - - -Other
Development - --
- - - -P.23: Public Service
Transformation 7,187 12,848 13,581 15,006 7,212 7,485 7,6091. Current
Expenditure 5,450 8,591 8,919 9,603 5,473 5,496 5,520Compensation to
Employees 3,971 5,612 5,502 5,770 3,994 4,017 4,041Use of goods and
services 1,082 1,918 2,240 2,487 1,081 1,081 1,081Current Transfers
Govt. Agencies 206 269 282 296 206 206 206Other Recurrent
191 792 895 1,050 191 191 1912. Capital
Expenditure 1,737 4,257 4,662 5,403 1,739 1,989 2,089Acquisition of
Non-FinancialAssets
1,403 2,372 2,526 2,795 1,406 1,656 1,756
Capital Transfersto Govt. Agencies - - - - - - -Other
Development 334 1,885 2,136 2,608 333 333 333Sub-Programme
(SP)SP.
23.1Human Resource
Management 3,812 5,365 5,317 5,537 3,817 3,823 3,8281. Current
Expenditure 3,780 5,267 5,212 5,476 3,786 3,791 3,797Compensation to
Employees 3,402 4,759 4,616 4,847 3,408 3,413 3,419Use of goods and
services 317 444 529 558 317 317 317Current Transfers
Govt. Agencies- - - - - - -
Other Recurrent61 64 67 71 61 61 61
2. CapitalExpenditure 32 98 105 61 32 32 32Acquisition of
Non-FinancialAssets
- 65 70 25 - - -
Capital Transfersto Govt. Agencies - - - - - - -
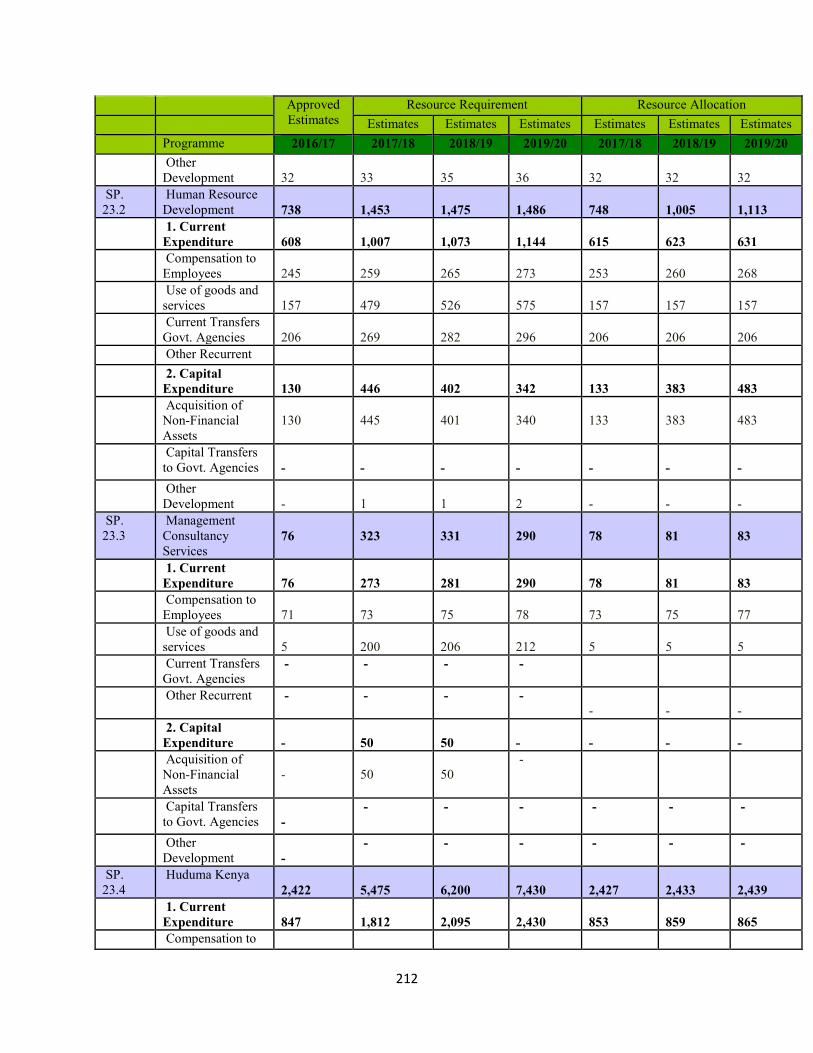
212
ApprovedEstimates
Resource Requirement Resource AllocationEstimates Estimates Estimates Estimates Estimates Estimates
Programme 2016/17 2017/18 2018/19 2019/20 2017/18 2018/19 2019/20Other
Development 32 33 35 36 32 32 32SP.
23.2Human Resource
Development 738 1,453 1,475 1,486 748 1,005 1,1131. Current
Expenditure 608 1,007 1,073 1,144 615 623 631Compensation to
Employees 245 259 265 273 253 260 268Use of goods and
services 157 479 526 575 157 157 157Current Transfers
Govt. Agencies 206 269 282 296 206 206 206Other Recurrent2. Capital
Expenditure 130 446 402 342 133 383 483Acquisition of
Non-FinancialAssets
130 445 401 340 133 383 483
Capital Transfersto Govt. Agencies - - - - - - -Other
Development - 1 1 2 - - -SP.
23.3Management
ConsultancyServices
76 323 331 290 78 81 83
1. CurrentExpenditure 76 273 281 290 78 81 83Compensation to
Employees 71 73 75 78 73 75 77Use of goods and
services 5 200 206 212 5 5 5Current Transfers
Govt. Agencies- - - -
Other Recurrent - - - -- - -
2. CapitalExpenditure - 50 50 - - - -Acquisition of
Non-FinancialAssets
- 50 50-
Capital Transfersto Govt. Agencies -
- - - - - -
OtherDevelopment -
- - - - - -
SP.23.4
Huduma Kenya2,422 5,475 6,200 7,430 2,427 2,433 2,439
1. CurrentExpenditure 847 1,812 2,095 2,430 853 859 865Compensation to
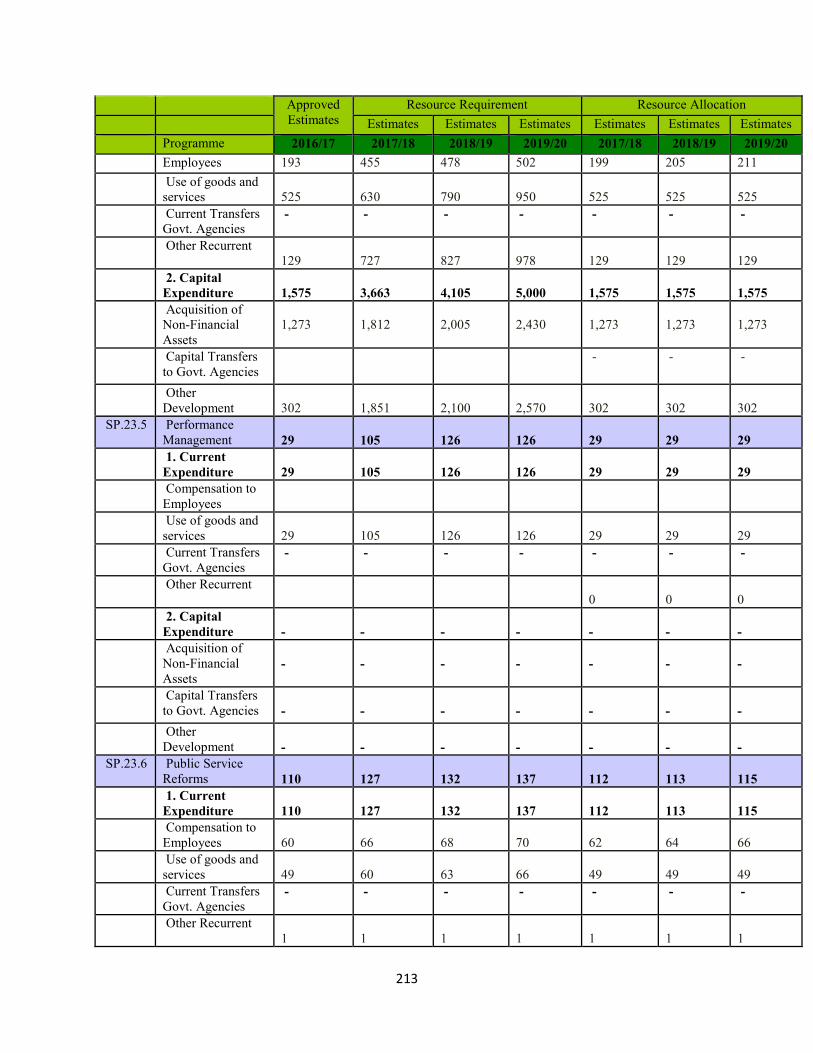
213
ApprovedEstimates
Resource Requirement Resource AllocationEstimates Estimates Estimates Estimates Estimates Estimates
Programme 2016/17 2017/18 2018/19 2019/20 2017/18 2018/19 2019/20Employees 193 455 478 502 199 205 211Use of goods and
services 525 630 790 950 525 525 525Current Transfers
Govt. Agencies- - - - - - -
Other Recurrent129 727 827 978 129 129 129
2. CapitalExpenditure 1,575 3,663 4,105 5,000 1,575 1,575 1,575Acquisition of
Non-FinancialAssets
1,273 1,812 2,005 2,430 1,273 1,273 1,273
Capital Transfersto Govt. Agencies
- - -
OtherDevelopment 302 1,851 2,100 2,570 302 302 302
SP.23.5 PerformanceManagement 29 105 126 126 29 29 291. Current
Expenditure 29 105 126 126 29 29 29Compensation to
EmployeesUse of goods and
services 29 105 126 126 29 29 29Current Transfers
Govt. Agencies- - - - - - -
Other Recurrent0 0 0
2. CapitalExpenditure - - - - - - -Acquisition of
Non-FinancialAssets
- - - - - - -
Capital Transfersto Govt. Agencies - - - - - - -Other
Development - - - - - - -SP.23.6 Public Service
Reforms 110 127 132 137 112 113 1151. Current
Expenditure 110 127 132 137 112 113 115Compensation to
Employees 60 66 68 70 62 64 66Use of goods and
services 49 60 63 66 49 49 49Current Transfers
Govt. Agencies- - - - - - -
Other Recurrent1 1 1 1 1 1 1
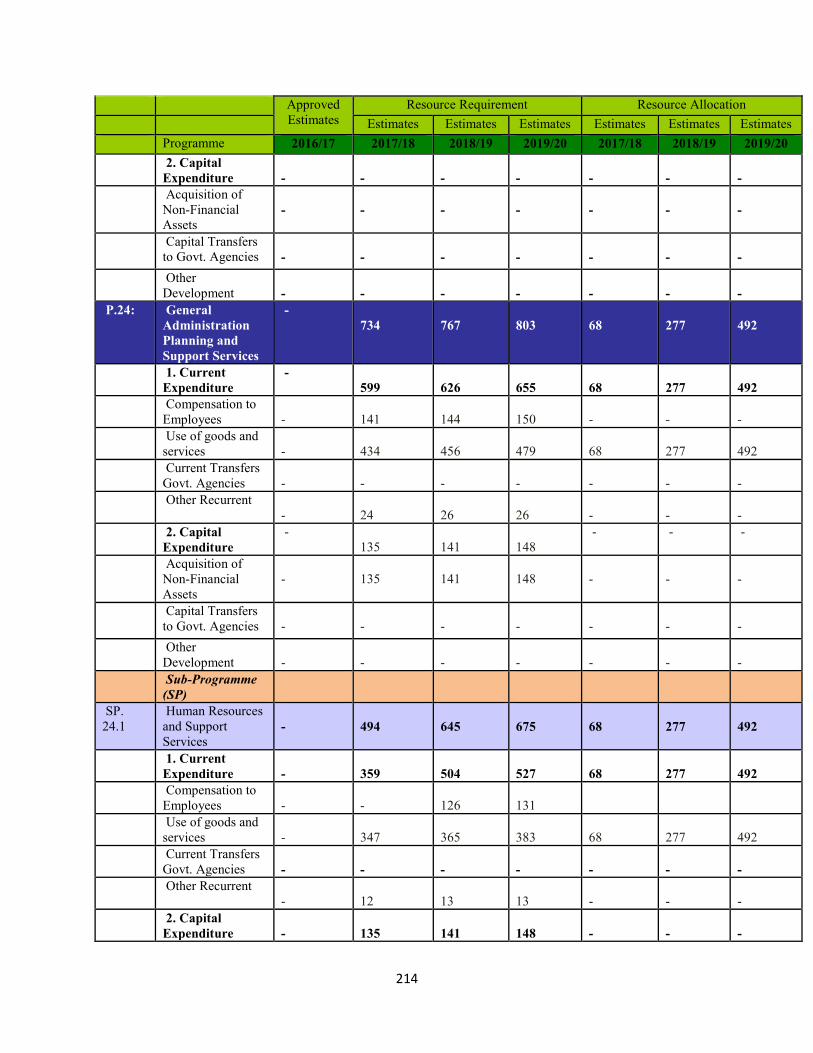
214
ApprovedEstimates
Resource Requirement Resource AllocationEstimates Estimates Estimates Estimates Estimates Estimates
Programme 2016/17 2017/18 2018/19 2019/20 2017/18 2018/19 2019/202. Capital
Expenditure - - - - - - -Acquisition of
Non-FinancialAssets
- - - - - - -
Capital Transfersto Govt. Agencies - - - - - - -Other
Development - - - - - - -P.24: General
AdministrationPlanning andSupport Services
-734 767 803 68 277 492
1. CurrentExpenditure
-599 626 655 68 277 492
Compensation toEmployees - 141 144 150 - - -Use of goods and
services - 434 456 479 68 277 492Current Transfers
Govt. Agencies - - - - - - -Other Recurrent
- 24 26 26 - - -2. Capital
Expenditure-
135 141 148- - -
Acquisition ofNon-FinancialAssets
- 135 141 148 - - -
Capital Transfersto Govt. Agencies - - - - - - -Other
Development - - - - - - -Sub-Programme
(SP)SP.
24.1Human Resources
and SupportServices
- 494 645 675 68 277 492
1. CurrentExpenditure - 359 504 527 68 277 492Compensation to
Employees - - 126 131Use of goods and
services - 347 365 383 68 277 492Current Transfers
Govt. Agencies - - - - - - -Other Recurrent
- 12 13 13 - - -2. Capital
Expenditure - 135 141 148 - - -

215
ApprovedEstimates
Resource Requirement Resource AllocationEstimates Estimates Estimates Estimates Estimates Estimates
Programme 2016/17 2017/18 2018/19 2019/20 2017/18 2018/19 2019/20Acquisition of
Non-FinancialAssets
- 135 141 148 - - -
Capital Transfersto Govt. Agencies - - - - - - -Other
Development - - - - - - -SP.
24.2Financial
ManagementServices
-78 81 86
- - -
1. CurrentExpenditure - 78 81 86 - - -Compensation to
Employees - 13 13 14 - - -Use of goods and
services - 65 68 72 - - -Current Transfers
Govt. Agencies - - - - - - -Other Recurrent
- - - - - - -2. Capital
Expenditure - - - - - - -Acquisition of
Non-FinancialAssets
- - - - - - -
Capital Transfersto Govt. Agencies - - - - - - -Other
Development - - - - - - -SP.
24.3Information and
CommunicationServices
-39 41 42
- - -
1. CurrentExpenditure - 39 41 42 - - -Compensation to
Employees - 5 5 5 - - -Use of goods and
services - 22 23 24 - - -Current Transfers
Govt. Agencies -- - -
- - -Other Recurrent
- 12 13 13 - - -2. Capital
Expenditure - - - - - - -Acquisition of
Non-FinancialAssets
- - - - - - -
Capital Transfersto Govt. Agencies - - - - - - -

216
ApprovedEstimates
Resource Requirement Resource AllocationEstimates Estimates Estimates Estimates Estimates Estimates
Programme 2016/17 2017/18 2018/19 2019/20 2017/18 2018/19 2019/20Other
Development - - - - - - -COMMISSION ON REVENUE ALLOCATION
P.25: IntergovernmentRevenue andFinancial Matters
357 526 536 550 365 376 387
1. CurrentExpenditure 357 526 536 550 365 376 387Compensation to
Employees 191 192 234 256 196 202 207Use of goods and
services 159 326 294 288 161 166 172Current Transfers
Govt. Agencies - - - - - - -Other Recurrent
7 8 8 6 8 8 82. Capital
Expenditure - - - - - - -Acquisition of
Non-FinancialAssets
- - - - - - -
Capital Transfersto Govt. Agencies - - - - - - -Other
Development - - - - - - -Sub-Programme
(SP)SP.
25.1Legal & Public
Affairs 15 22 25 28 17 20 211. Current
Expenditure 15 22 25 28 17 20 21Compensation to
Employees 10 10 13 16 11 13 13Use of goods and
services 5 12 12 12 6 7 8Current Transfers
Govt. Agencies - - - - - - -Other Recurrent
- - - - - - -2. Capital
Expenditure - - - - - - -Acquisition of
Non-FinancialAssets
- - - - - - -
Capital Transfersto Govt. Agencies - - - - - - -Other
Development - - - - - - -SP. Research & Policy
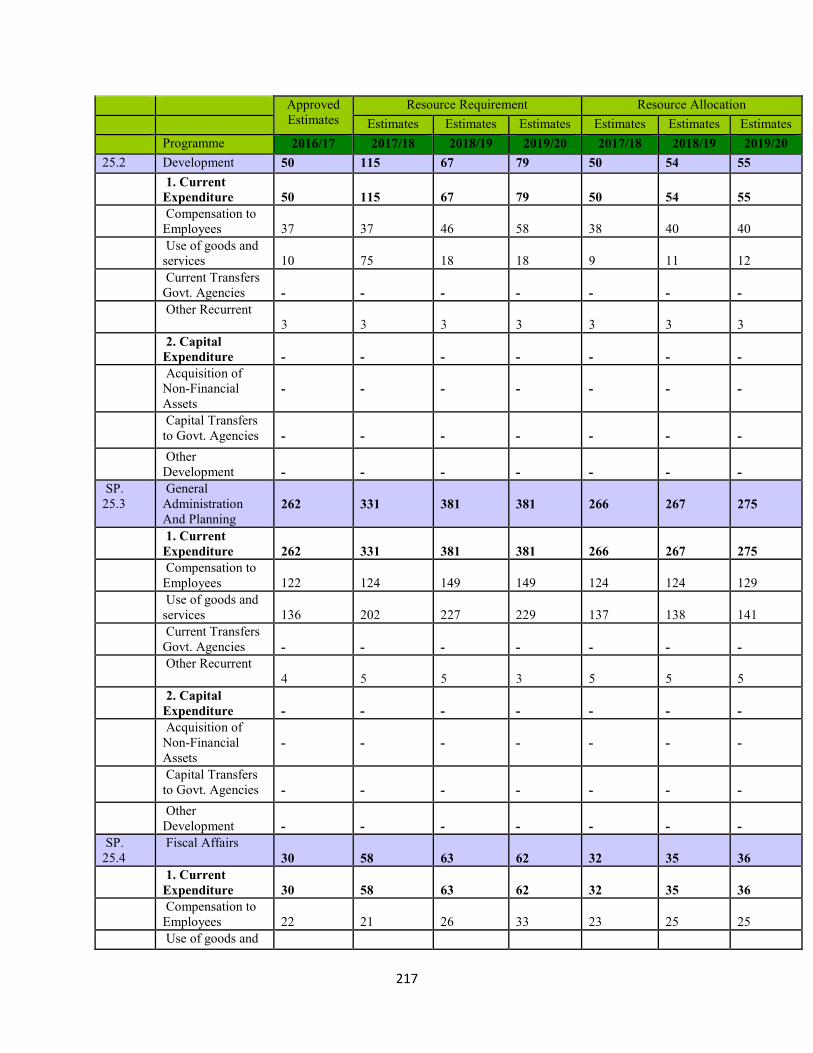
217
ApprovedEstimates
Resource Requirement Resource AllocationEstimates Estimates Estimates Estimates Estimates Estimates
Programme 2016/17 2017/18 2018/19 2019/20 2017/18 2018/19 2019/2025.2 Development 50 115 67 79 50 54 55
1. CurrentExpenditure 50 115 67 79 50 54 55Compensation to
Employees 37 37 46 58 38 40 40Use of goods and
services 10 75 18 18 9 11 12Current Transfers
Govt. Agencies - - - - - - -Other Recurrent
3 3 3 3 3 3 32. Capital
Expenditure - - - - - - -Acquisition of
Non-FinancialAssets
- - - - - - -
Capital Transfersto Govt. Agencies - - - - - - -Other
Development - - - - - - -SP.
25.3General
AdministrationAnd Planning
262 331 381 381 266 267 275
1. CurrentExpenditure 262 331 381 381 266 267 275Compensation to
Employees 122 124 149 149 124 124 129Use of goods and
services 136 202 227 229 137 138 141Current Transfers
Govt. Agencies - - - - - - -Other Recurrent
4 5 5 3 5 5 52. Capital
Expenditure - - - - - - -Acquisition of
Non-FinancialAssets
- - - - - - -
Capital Transfersto Govt. Agencies - - - - - - -Other
Development - - - - - - -SP.
25.4Fiscal Affairs
30 58 63 62 32 35 361. Current
Expenditure 30 58 63 62 32 35 36Compensation to
Employees 22 21 26 33 23 25 25Use of goods and

218
ApprovedEstimates
Resource Requirement Resource AllocationEstimates Estimates Estimates Estimates Estimates Estimates
Programme 2016/17 2017/18 2018/19 2019/20 2017/18 2018/19 2019/20services 8 37 37 29 9 10 11Current Transfers
Govt. Agencies - - - - - - -Other Recurrent
- - - - - - -2. Capital
Expenditure - - - - - - -Acquisition of
Non-FinancialAssets
- - - - - - -
Capital Transfersto Govt. Agencies - - - - - - -Other
Development - - - - - - -PUBLIC SERVICE COMMISSION
P.26: GeneralAdministrationPlanning andSupport Services
923 1,706 1,774 2,392 942 1,768 1,934
1. CurrentExpenditure 884 1,539 1,607 1,792 882 908 934Compensation to
Employees 395 429 548 568 406 418 430Use of goods and
services 254 431 418 419 298 307 316Current Transfers
Govt. Agencies 2 2 2 2 2 2 2Other Recurrent
233 677 639 803 176 181 1862. Capital
Expenditure 39 167 167 600 60 860 1,000Acquisition of
Non-FinancialAssets
39 - - - - - -
Capital Transfersto Govt. Agencies - - - - - - -Other
Development - 167 900 1,000 60 860 1,000Sub-Programme
(SP)SP.
26.1Administration
882 1,662 1,720 2,336 898 1,722 1,8881. Current
Expenditure 843 1,495 1,553 1,736 838 862 888Compensation to
Employees 357 389 500 518 367 378 389Use of goods and
services 251 427 412 413 294 303 312Current Transfers

219
ApprovedEstimates
Resource Requirement Resource AllocationEstimates Estimates Estimates Estimates Estimates Estimates
Programme 2016/17 2017/18 2018/19 2019/20 2017/18 2018/19 2019/20Govt. Agencies 2 2 2 2 2 2 2Other Recurrent
233 677 639 803 176 181 1862. Capital
Expenditure 39 167 900 1,000 60 860 1,000Acquisition of
Non-FinancialAssets
39 - - - - - -
Capital Transfersto Govt. Agencies - - - - - - -Other
Development - 167 900 1,000 60 860 1,000SP.
26.2Board
ManagementServices
41 44 54 56 43 44 45
1. CurrentExpenditure 41 44 54 56 43 44 45Compensation to
Employees 38 40 48 50 39 40 41Use of goods and
services 3 4 6 6 4 4 4Current Transfers
Govt. Agencies - - - - - - -Other Recurrent
- - - - - - -2. Capital
Expenditure - - - - - - -Acquisition of
Non-FinancialAssets
- - - - - - -
Capital Transfersto Govt. Agencies - - - - - - -Other
Development - - - - - - -P.27: Human Resource
Management andDevelopment
201 297 378 387 221 228 235
1. CurrentExpenditure 201 297 378 387 221 228 235Compensation to
Employees 109 118 194 201 113 117 120Use of goods and
services 92 179 184 186 108 111 115Current Transfers
Govt. Agencies - - - - - - -Other Recurrent
- - - - - - -2. Capital
Expenditure - - - - - - -
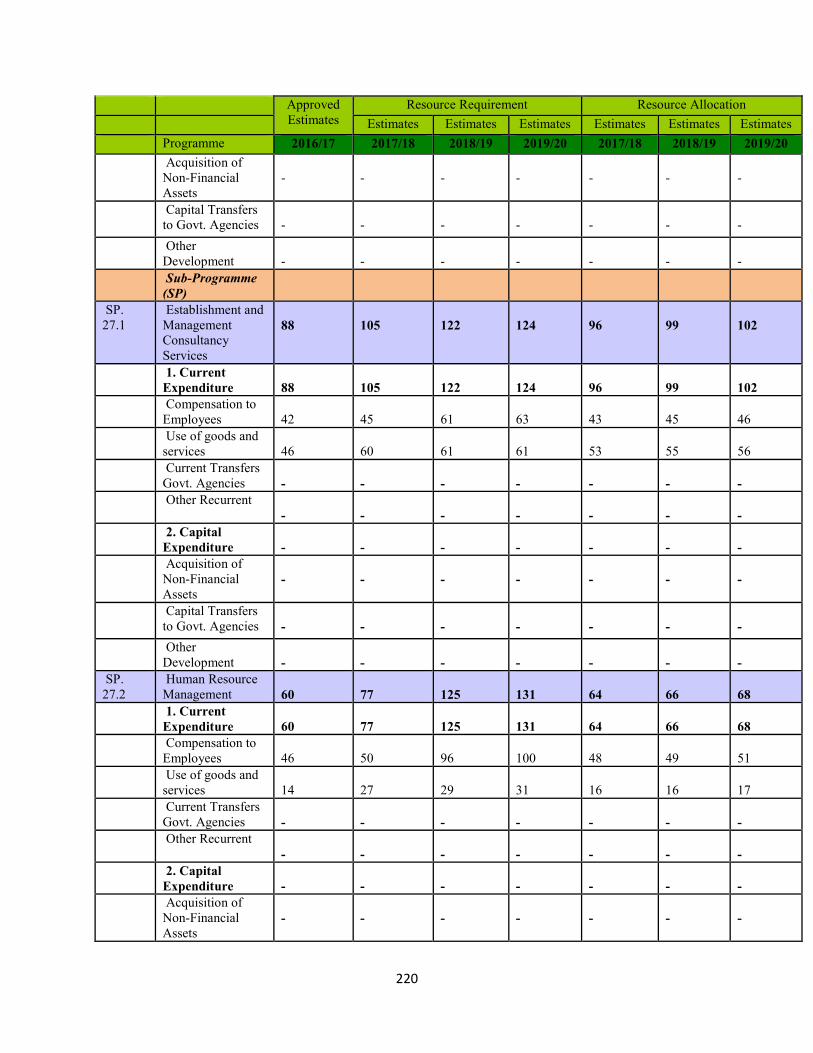
220
ApprovedEstimates
Resource Requirement Resource AllocationEstimates Estimates Estimates Estimates Estimates Estimates
Programme 2016/17 2017/18 2018/19 2019/20 2017/18 2018/19 2019/20Acquisition of
Non-FinancialAssets
- - - - - - -
Capital Transfersto Govt. Agencies - - - - - - -Other
Development - - - - - - -Sub-Programme
(SP)SP.
27.1Establishment and
ManagementConsultancyServices
88 105 122 124 96 99 102
1. CurrentExpenditure 88 105 122 124 96 99 102Compensation to
Employees 42 45 61 63 43 45 46Use of goods and
services 46 60 61 61 53 55 56Current Transfers
Govt. Agencies - - - - - - -Other Recurrent
- - - - - - -2. Capital
Expenditure - - - - - - -Acquisition of
Non-FinancialAssets
- - - - - - -
Capital Transfersto Govt. Agencies - - - - - - -Other
Development - - - - - - -SP.
27.2Human Resource
Management 60 77 125 131 64 66 681. Current
Expenditure 60 77 125 131 64 66 68Compensation to
Employees 46 50 96 100 48 49 51Use of goods and
services 14 27 29 31 16 16 17Current Transfers
Govt. Agencies - - - - - - -Other Recurrent
- - - - - - -2. Capital
Expenditure - - - - - - -Acquisition of
Non-FinancialAssets
- - - - - - -
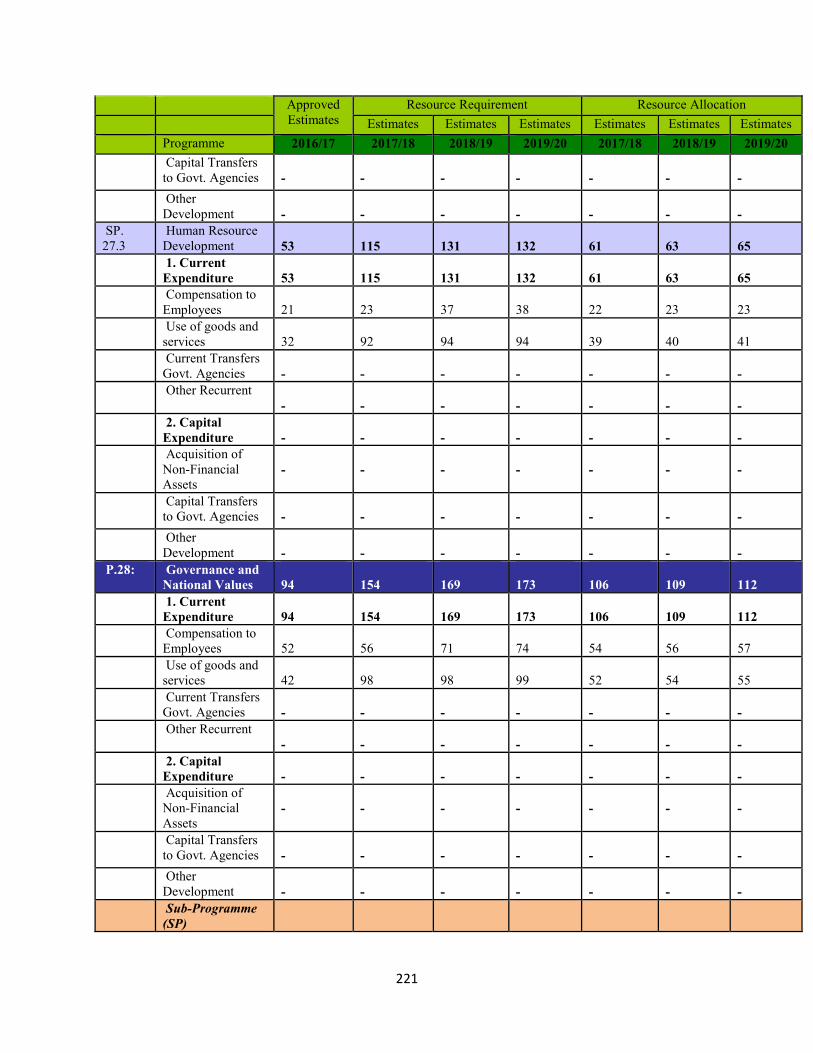
221
ApprovedEstimates
Resource Requirement Resource AllocationEstimates Estimates Estimates Estimates Estimates Estimates
Programme 2016/17 2017/18 2018/19 2019/20 2017/18 2018/19 2019/20Capital Transfers
to Govt. Agencies - - - - - - -Other
Development - - - - - - -SP.
27.3Human Resource
Development 53 115 131 132 61 63 651. Current
Expenditure 53 115 131 132 61 63 65Compensation to
Employees 21 23 37 38 22 23 23Use of goods and
services 32 92 94 94 39 40 41Current Transfers
Govt. Agencies - - - - - - -Other Recurrent
- - - - - - -2. Capital
Expenditure - - - - - - -Acquisition of
Non-FinancialAssets
- - - - - - -
Capital Transfersto Govt. Agencies - - - - - - -Other
Development - - - - - - -P.28: Governance and
National Values 94 154 169 173 106 109 1121. Current
Expenditure 94 154 169 173 106 109 112Compensation to
Employees 52 56 71 74 54 56 57Use of goods and
services 42 98 98 99 52 54 55Current Transfers
Govt. Agencies - - - - - - -Other Recurrent
- - - - - - -2. Capital
Expenditure - - - - - - -Acquisition of
Non-FinancialAssets
- - - - - - -
Capital Transfersto Govt. Agencies - - - - - - -Other
Development - - - - - - -Sub-Programme
(SP)

222
ApprovedEstimates
Resource Requirement Resource AllocationEstimates Estimates Estimates Estimates Estimates Estimates
Programme 2016/17 2017/18 2018/19 2019/20 2017/18 2018/19 2019/20SP.
28.1Compliance and
Quality Assurance 55 93 103 106 61 62 641. Current
Expenditure 55 93 103 106 61 62 64Compensation to
Employees 33 35 45 47 34 35 36Use of goods and
services 22 58 58 59 27 27 28Current Transfers
Govt. Agencies - - - - - - -Other Recurrent
- - - - - - -2. Capital
Expenditure - - - - - - -Acquisition of
Non-FinancialAssets
- - - - - - -
Capital Transfersto Govt. Agencies - - - - - - -Other
Development - - - - - - -SP.
28.2Ethics
Governance andNational Values
39 61 66 67 45 47 48
1. CurrentExpenditure 39 61 66 67 45 47 48Compensation to
Employees 19 21 26 27 20 21 21Use of goods and
services 20 40 40 40 25 26 27Current Transfers
Govt. Agencies - - - - - - -Other Recurrent
- - - - - - -2. Capital
Expenditure - - - - - - -Acquisition of
Non-FinancialAssets
- - - - - - -
Capital Transfersto Govt. Agencies - - - - - - -Other
Development - - - - - - -SALARIES & REMUNERATION COMMISSIONP.29: Salaries and
RemunerationManagement inthe Public Service
533 914 941 968 546 562 579
1. Current
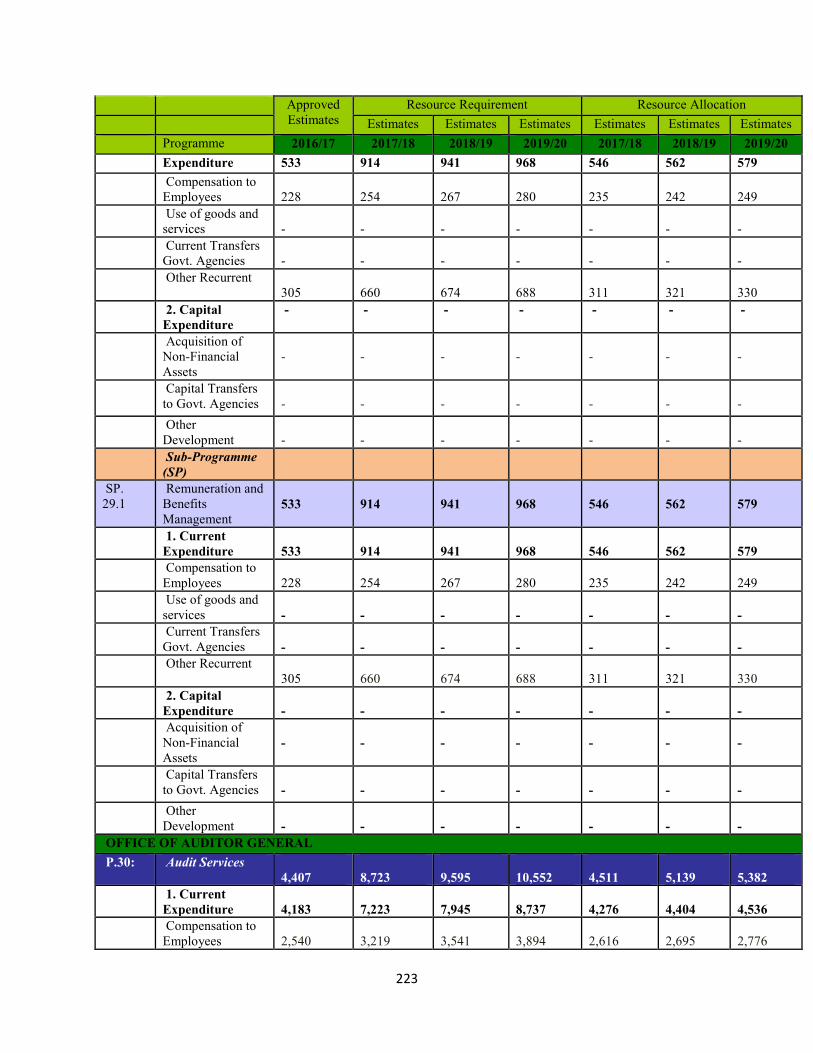
223
ApprovedEstimates
Resource Requirement Resource AllocationEstimates Estimates Estimates Estimates Estimates Estimates
Programme 2016/17 2017/18 2018/19 2019/20 2017/18 2018/19 2019/20Expenditure 533 914 941 968 546 562 579Compensation to
Employees 228 254 267 280 235 242 249Use of goods and
services - - - - - - -Current Transfers
Govt. Agencies - - - - - - -Other Recurrent
305 660 674 688 311 321 3302. Capital
Expenditure- - - - - - -
Acquisition ofNon-FinancialAssets
- - - - - - -
Capital Transfersto Govt. Agencies - - - - - - -Other
Development - - - - - - -Sub-Programme
(SP)SP.
29.1Remuneration and
BenefitsManagement
533 914 941 968 546 562 579
1. CurrentExpenditure 533 914 941 968 546 562 579Compensation to
Employees 228 254 267 280 235 242 249Use of goods and
services - - - - - - -Current Transfers
Govt. Agencies - - - - - - -Other Recurrent
305 660 674 688 311 321 3302. Capital
Expenditure - - - - - - -Acquisition of
Non-FinancialAssets
- - - - - - -
Capital Transfersto Govt. Agencies - - - - - - -Other
Development - - - - - - -OFFICE OF AUDITOR GENERALP.30: Audit Services
4,407 8,723 9,595 10,552 4,511 5,139 5,3821. Current
Expenditure 4,183 7,223 7,945 8,737 4,276 4,404 4,536Compensation to
Employees 2,540 3,219 3,541 3,894 2,616 2,695 2,776
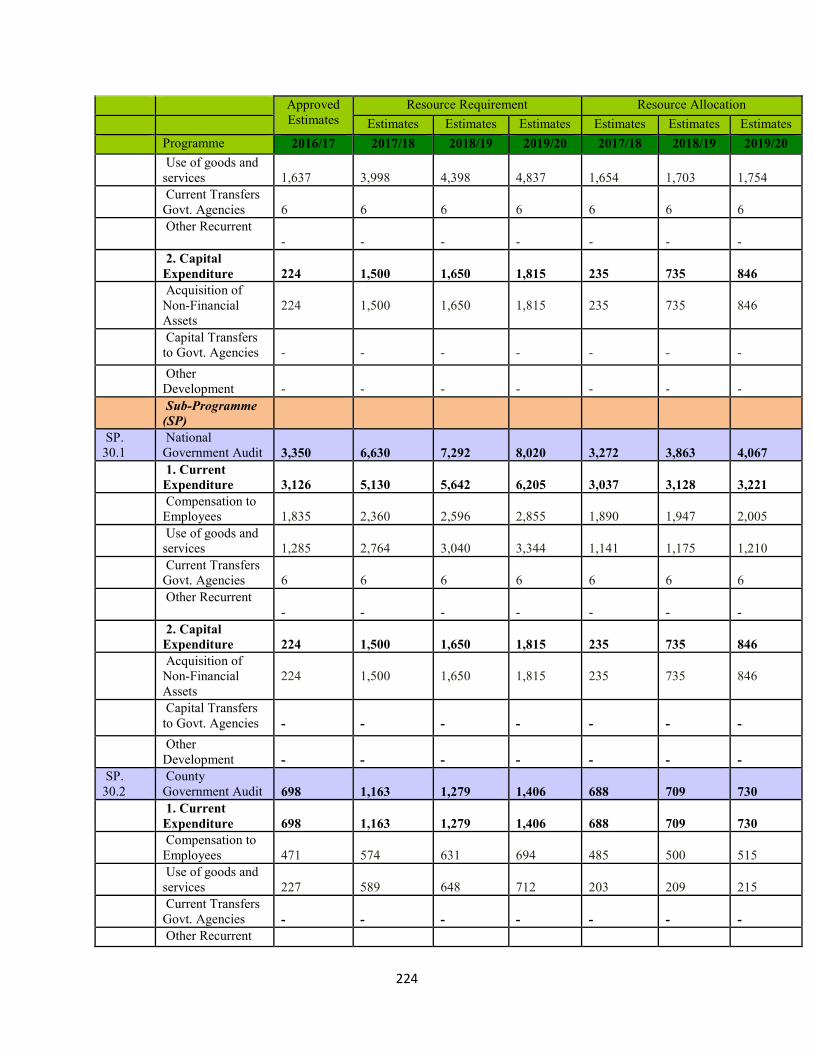
224
ApprovedEstimates
Resource Requirement Resource AllocationEstimates Estimates Estimates Estimates Estimates Estimates
Programme 2016/17 2017/18 2018/19 2019/20 2017/18 2018/19 2019/20Use of goods and
services 1,637 3,998 4,398 4,837 1,654 1,703 1,754Current Transfers
Govt. Agencies 6 6 6 6 6 6 6Other Recurrent
- - - - - - -2. Capital
Expenditure 224 1,500 1,650 1,815 235 735 846Acquisition of
Non-FinancialAssets
224 1,500 1,650 1,815 235 735 846
Capital Transfersto Govt. Agencies - - - - - - -Other
Development - - - - - - -Sub-Programme
(SP)SP.
30.1National
Government Audit 3,350 6,630 7,292 8,020 3,272 3,863 4,0671. Current
Expenditure 3,126 5,130 5,642 6,205 3,037 3,128 3,221Compensation to
Employees 1,835 2,360 2,596 2,855 1,890 1,947 2,005Use of goods and
services 1,285 2,764 3,040 3,344 1,141 1,175 1,210Current Transfers
Govt. Agencies 6 6 6 6 6 6 6Other Recurrent
- - - - - - -2. Capital
Expenditure 224 1,500 1,650 1,815 235 735 846Acquisition of
Non-FinancialAssets
224 1,500 1,650 1,815 235 735 846
Capital Transfersto Govt. Agencies - - - - - - -Other
Development - - - - - - -SP.
30.2County
Government Audit 698 1,163 1,279 1,406 688 709 7301. Current
Expenditure 698 1,163 1,279 1,406 688 709 730Compensation to
Employees 471 574 631 694 485 500 515Use of goods and
services 227 589 648 712 203 209 215Current Transfers
Govt. Agencies - - - - - - -Other Recurrent
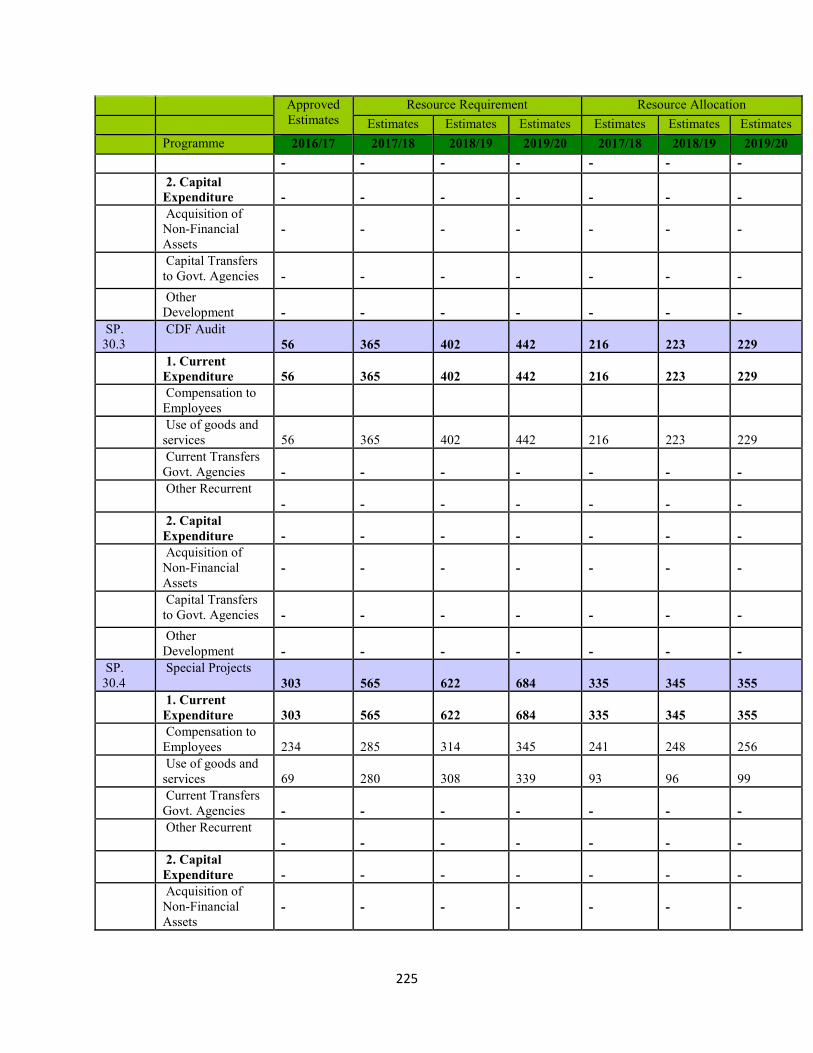
225
ApprovedEstimates
Resource Requirement Resource AllocationEstimates Estimates Estimates Estimates Estimates Estimates
Programme 2016/17 2017/18 2018/19 2019/20 2017/18 2018/19 2019/20- - - - - - -
2. CapitalExpenditure - - - - - - -Acquisition of
Non-FinancialAssets
- - - - - - -
Capital Transfersto Govt. Agencies - - - - - - -Other
Development - - - - - - -SP.
30.3CDF Audit
56 365 402 442 216 223 2291. Current
Expenditure 56 365 402 442 216 223 229Compensation to
EmployeesUse of goods and
services 56 365 402 442 216 223 229Current Transfers
Govt. Agencies - - - - - - -Other Recurrent
- - - - - - -2. Capital
Expenditure - - - - - - -Acquisition of
Non-FinancialAssets
- - - - - - -
Capital Transfersto Govt. Agencies - - - - - - -Other
Development - - - - - - -SP.
30.4Special Projects
303 565 622 684 335 345 3551. Current
Expenditure 303 565 622 684 335 345 355Compensation to
Employees 234 285 314 345 241 248 256Use of goods and
services 69 280 308 339 93 96 99Current Transfers
Govt. Agencies - - - - - - -Other Recurrent
- - - - - - -2. Capital
Expenditure - - - - - - -Acquisition of
Non-FinancialAssets
- - - - - - -
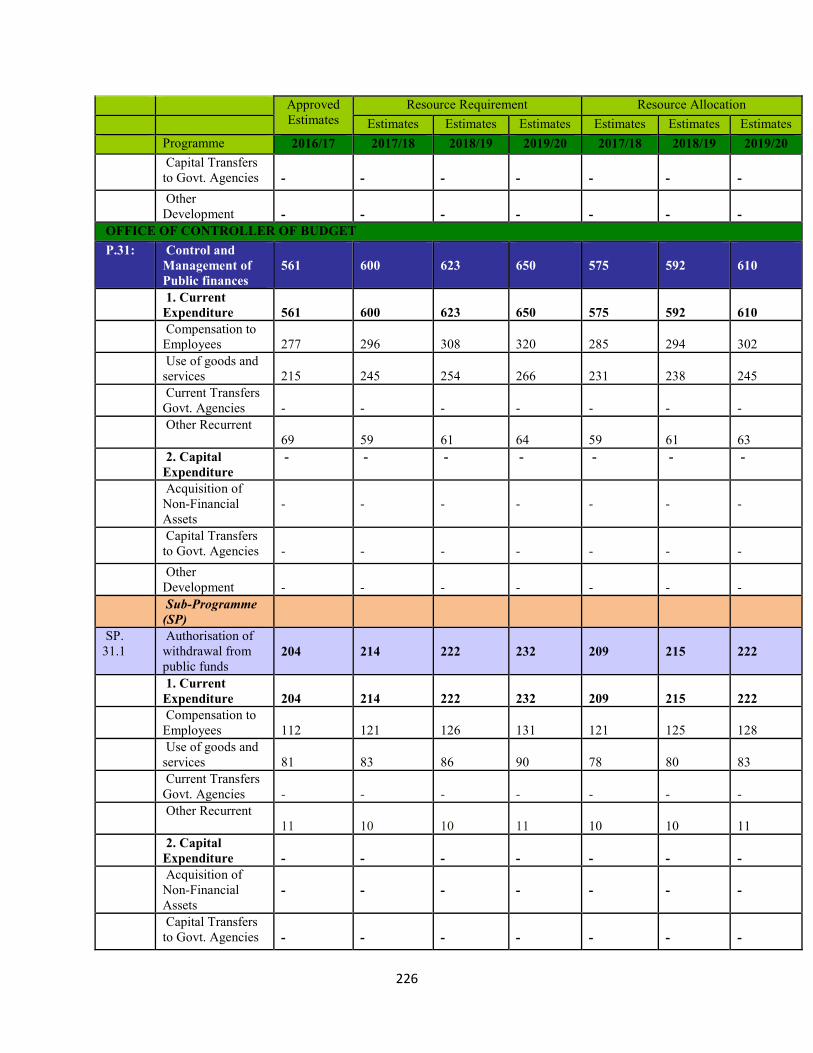
226
ApprovedEstimates
Resource Requirement Resource AllocationEstimates Estimates Estimates Estimates Estimates Estimates
Programme 2016/17 2017/18 2018/19 2019/20 2017/18 2018/19 2019/20Capital Transfers
to Govt. Agencies - - - - - - -Other
Development - - - - - - -OFFICE OF CONTROLLER OF BUDGETP.31: Control and
Management ofPublic finances
561 600 623 650 575 592 610
1. CurrentExpenditure 561 600 623 650 575 592 610Compensation to
Employees 277 296 308 320 285 294 302Use of goods and
services 215 245 254 266 231 238 245Current Transfers
Govt. Agencies - - - - - - -Other Recurrent
69 59 61 64 59 61 632. Capital
Expenditure- - - - - - -
Acquisition ofNon-FinancialAssets
- - - - - - -
Capital Transfersto Govt. Agencies - - - - - - -Other
Development - - - - - - -Sub-Programme
(SP)SP.
31.1Authorisation of
withdrawal frompublic funds
204 214 222 232 209 215 222
1. CurrentExpenditure 204 214 222 232 209 215 222Compensation to
Employees 112 121 126 131 121 125 128Use of goods and
services 81 83 86 90 78 80 83Current Transfers
Govt. Agencies - - - - - - -Other Recurrent
11 10 10 11 10 10 112. Capital
Expenditure - - - - - - -Acquisition of
Non-FinancialAssets
- - - - - - -
Capital Transfersto Govt. Agencies - - - - - - -
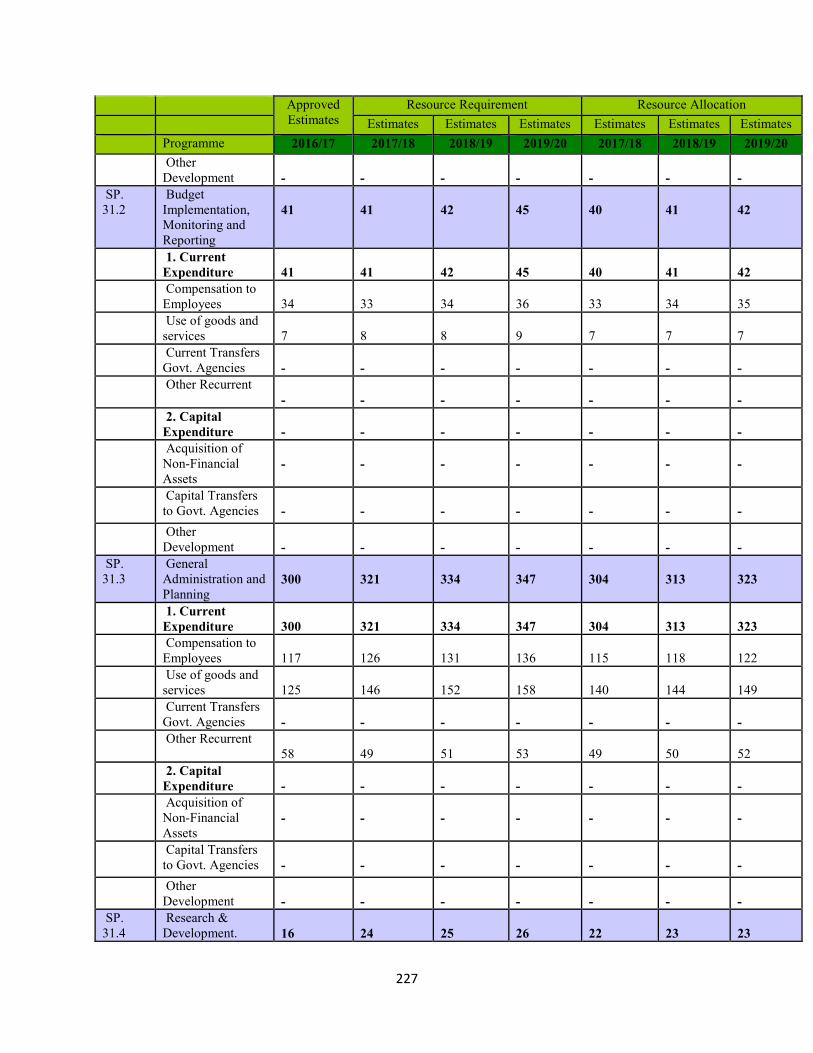
227
ApprovedEstimates
Resource Requirement Resource AllocationEstimates Estimates Estimates Estimates Estimates Estimates
Programme 2016/17 2017/18 2018/19 2019/20 2017/18 2018/19 2019/20Other
Development - - - - - - -SP.
31.2Budget
Implementation,Monitoring andReporting
41 41 42 45 40 41 42
1. CurrentExpenditure 41 41 42 45 40 41 42Compensation to
Employees 34 33 34 36 33 34 35Use of goods and
services 7 8 8 9 7 7 7Current Transfers
Govt. Agencies - - - - - - -Other Recurrent
- - - - - - -2. Capital
Expenditure - - - - - - -Acquisition of
Non-FinancialAssets
- - - - - - -
Capital Transfersto Govt. Agencies - - - - - - -Other
Development - - - - - - -SP.
31.3General
Administration andPlanning
300 321 334 347 304 313 323
1. CurrentExpenditure 300 321 334 347 304 313 323Compensation to
Employees 117 126 131 136 115 118 122Use of goods and
services 125 146 152 158 140 144 149Current Transfers
Govt. Agencies - - - - - - -Other Recurrent
58 49 51 53 49 50 522. Capital
Expenditure - - - - - - -Acquisition of
Non-FinancialAssets
- - - - - - -
Capital Transfersto Govt. Agencies - - - - - - -Other
Development - - - - - - -SP.
31.4Research &
Development. 16 24 25 26 22 23 23

228
ApprovedEstimates
Resource Requirement Resource AllocationEstimates Estimates Estimates Estimates Estimates Estimates
Programme 2016/17 2017/18 2018/19 2019/20 2017/18 2018/19 2019/201. Current
Expenditure 16 24 25 26 22 23 23Compensation to
Employees 14 16 17 17 16 16 17Use of goods and
services 2 8 8 9 6 6 6Current Transfers
Govt. Agencies - - - - - - -Other Recurrent
- - - - - - -2. Capital
Expenditure - - - - - - -Acquisition of
Non-FinancialAssets
- - - - - - -
Capital Transfersto Govt. Agencies - - - - - - -Other
Development - - - - - - -COMMISSION ON ADMINISTRATIVE JUSTICEP.32: Promotion of
AdministrativeJustice
469 751 786 840 480 494 509
1. CurrentExpenditure 469 751 786 840 480 494 509Compensation to
Employees 233 240 250 262 240 247 254Use of goods and
services 171 191 191 201 170 177 181Current Transfers
Govt. Agencies 1 1 1 1 - - -Other Recurrent
64 319 344 376 70 70 732. Capital
Expenditure - - - - - - -Acquisition of
Non-FinancialAssets
- - - - - - -
Capital Transfersto Govt. Agencies - - - - - - -Other
Development - - - - - - -Sub-Programme
(SP)SP.
32.1Ombudsman
Services 469 751 786 840 480 494 5091. Current
Expenditure 469 751 786 840 480 494 510Compensation to

229
ApprovedEstimates
Resource Requirement Resource AllocationEstimates Estimates Estimates Estimates Estimates Estimates
Programme 2016/17 2017/18 2018/19 2019/20 2017/18 2018/19 2019/20Employees 233 240 250 262 240 247 254Use of goods and
services 171 191 191 201 170 177 183Current Transfers
Govt. Agencies 1 1 1 1 - - -Other Recurrent
64 319 344 376 70 70 732. Capital
Expenditure - - - - - - -Acquisition of
Non-FinancialAssets
- - - - - - -
Capital Transfersto Govt. Agencies - - - - - - -Other
Development - - - - - - -
3.4 Analysis of Resources Requirements VS Allocation for 2017/18-2019/20
Table 3. 7: Semi-Autonomous Government AgenciesAnalysis of Semi-Autonomous Government Agencies (SAGAs) by Economic Classification
Economic Classification Allocation Resource Requirements Allocation
2016/2017 2017/2018 2018/2019 2019/2020 2017/2018 2018/2019 2019/2020
Kenya Revenue AuthorityCurrent Expenditure 15,358.00 27,281.00 28,833.00 30,274.00 - - -
Compensation of Employees 14,910.00 17,631.00 19,394.00 20,364.00 - - -
Use of goods and services 448.00 7,883.00 8,672.00 9,105.00 - - -
Current Transfers Govt.Agencies
- - - - - - -
Other Recurrent - 1,767.00 767.00 805.00 - - -
Capital Expenditure 626.00 5,694.00 5,552.00 5,103.00 - - -
Acquisition of Non-FinancialAssets
626.00 1,200.00 1,822.00 1,913.00 - - -
Capital Transfers to Govt.Agencies
- - - - - - -
Other Development - 4,494.00 3,730.00 3,190.00 - - -
Total Expenditure 15,984.00 32,975.00 34,385.00 35,377.00 - - -
Financial Reporting Centre - - -
Current Expenditure 300.00 464.00 514.00 564.00 - - -
Compensation of Employees 164.00 164.00 164.00 164.00 - - -
Use of goods and services 136.00 300.00 350.00 400.00 - - -
Current Transfers Govt.Agencies
- - - - - - -
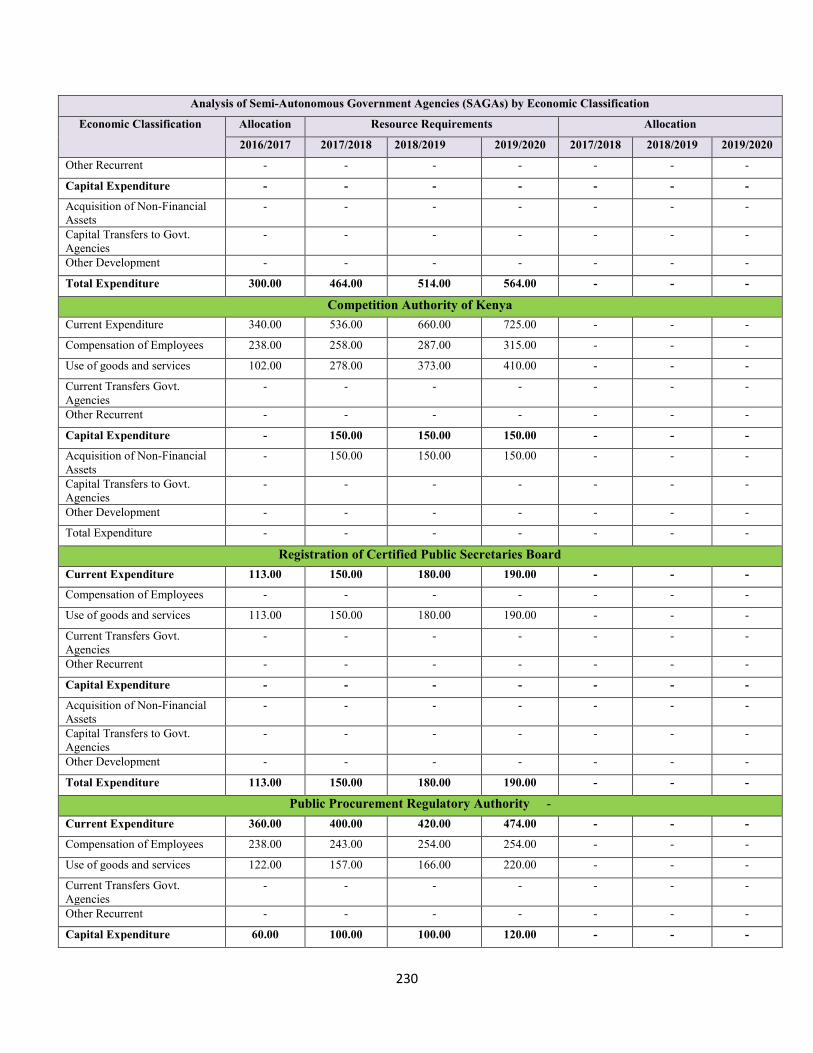
230
Analysis of Semi-Autonomous Government Agencies (SAGAs) by Economic Classification
Economic Classification Allocation Resource Requirements Allocation
2016/2017 2017/2018 2018/2019 2019/2020 2017/2018 2018/2019 2019/2020
Other Recurrent - - - - - - -
Capital Expenditure - - - - - - -
Acquisition of Non-FinancialAssets
- - - - - - -
Capital Transfers to Govt.Agencies
- - - - - - -
Other Development - - - - - - -
Total Expenditure 300.00 464.00 514.00 564.00 - - -
Competition Authority of KenyaCurrent Expenditure 340.00 536.00 660.00 725.00 - - -
Compensation of Employees 238.00 258.00 287.00 315.00 - - -
Use of goods and services 102.00 278.00 373.00 410.00 - - -
Current Transfers Govt.Agencies
- - - - - - -
Other Recurrent - - - - - - -
Capital Expenditure - 150.00 150.00 150.00 - - -
Acquisition of Non-FinancialAssets
- 150.00 150.00 150.00 - - -
Capital Transfers to Govt.Agencies
- - - - - - -
Other Development - - - - - - -
Total Expenditure - - - - - - -
Registration of Certified Public Secretaries BoardCurrent Expenditure 113.00 150.00 180.00 190.00 - - -
Compensation of Employees - - - - - - -
Use of goods and services 113.00 150.00 180.00 190.00 - - -
Current Transfers Govt.Agencies
- - - - - - -
Other Recurrent - - - - - - -
Capital Expenditure - - - - - - -
Acquisition of Non-FinancialAssets
- - - - - - -
Capital Transfers to Govt.Agencies
- - - - - - -
Other Development - - - - - - -
Total Expenditure 113.00 150.00 180.00 190.00 - - -
Public Procurement Regulatory Authority -Current Expenditure 360.00 400.00 420.00 474.00 - - -
Compensation of Employees 238.00 243.00 254.00 254.00 - - -
Use of goods and services 122.00 157.00 166.00 220.00 - - -
Current Transfers Govt.Agencies
- - - - - - -
Other Recurrent - - - - - - -
Capital Expenditure 60.00 100.00 100.00 120.00 - - -
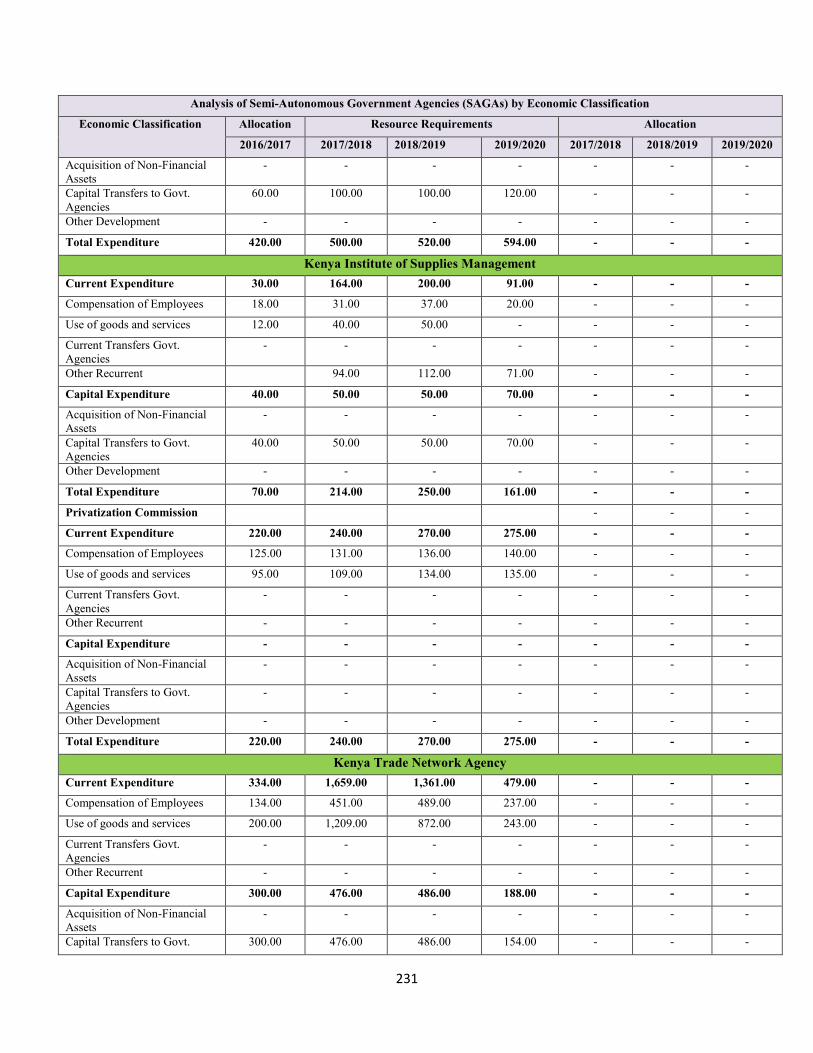
231
Analysis of Semi-Autonomous Government Agencies (SAGAs) by Economic Classification
Economic Classification Allocation Resource Requirements Allocation
2016/2017 2017/2018 2018/2019 2019/2020 2017/2018 2018/2019 2019/2020
Acquisition of Non-FinancialAssets
- - - - - - -
Capital Transfers to Govt.Agencies
60.00 100.00 100.00 120.00 - - -
Other Development - - - - - - -
Total Expenditure 420.00 500.00 520.00 594.00 - - -
Kenya Institute of Supplies ManagementCurrent Expenditure 30.00 164.00 200.00 91.00 - - -
Compensation of Employees 18.00 31.00 37.00 20.00 - - -
Use of goods and services 12.00 40.00 50.00 - - - -
Current Transfers Govt.Agencies
- - - - - - -
Other Recurrent 94.00 112.00 71.00 - - -
Capital Expenditure 40.00 50.00 50.00 70.00 - - -
Acquisition of Non-FinancialAssets
- - - - - - -
Capital Transfers to Govt.Agencies
40.00 50.00 50.00 70.00 - - -
Other Development - - - - - - -
Total Expenditure 70.00 214.00 250.00 161.00 - - -
Privatization Commission - - -
Current Expenditure 220.00 240.00 270.00 275.00 - - -
Compensation of Employees 125.00 131.00 136.00 140.00 - - -
Use of goods and services 95.00 109.00 134.00 135.00 - - -
Current Transfers Govt.Agencies
- - - - - - -
Other Recurrent - - - - - - -
Capital Expenditure - - - - - - -
Acquisition of Non-FinancialAssets
- - - - - - -
Capital Transfers to Govt.Agencies
- - - - - - -
Other Development - - - - - - -
Total Expenditure 220.00 240.00 270.00 275.00 - - -
Kenya Trade Network AgencyCurrent Expenditure 334.00 1,659.00 1,361.00 479.00 - - -
Compensation of Employees 134.00 451.00 489.00 237.00 - - -
Use of goods and services 200.00 1,209.00 872.00 243.00 - - -
Current Transfers Govt.Agencies
- - - - - - -
Other Recurrent - - - - - - -
Capital Expenditure 300.00 476.00 486.00 188.00 - - -
Acquisition of Non-FinancialAssets
- - - - - - -
Capital Transfers to Govt. 300.00 476.00 486.00 154.00 - - -

232
Analysis of Semi-Autonomous Government Agencies (SAGAs) by Economic Classification
Economic Classification Allocation Resource Requirements Allocation
2016/2017 2017/2018 2018/2019 2019/2020 2017/2018 2018/2019 2019/2020
Agencies
Other Development - - - 34.00 - - -
Total Expenditure 634.00 2,135.00 1,847.00 668.00 - - -
Nairobi International Financial CentreCurrent Expenditure 55.00 400.00 470.00 530.00 - - -
Compensation of Employees - - 70.00 80.00 - - -
Use of goods and services 55.00 400.00 400.00 450.00 - - -
Current Transfers Govt.Agencies
- - - - - - -
Other Recurrent - - - - - - -
Capital Expenditure - - - - - - -
Acquisition of Non-FinancialAssets
- - - - - - -
Capital Transfers to Govt.Agencies
- - - - - - -
Other Development - - - - - - -
Total Expenditure 55.00 400.00 470.00 530.00 - - -
Unclaimed Financial Assets AuthorityCurrent Expenditure 170.00 363.00 415.00 435.00 - - -
Compensation of Employees 109.00 175.00 205.00 216.00 - - -
Use of goods and services 61.00 176.00 195.00 201.00 - - -
Current Transfers Govt.Agencies
- - - - - - -
Other Recurrent - 12.00 15.00 18.00 - - -
Capital Expenditure 50.00 235.00 564.00 507.00 - - -
Acquisition of Non-FinancialAssets
235.00 564.00 507.00 - - -
Capital Transfers to Govt.Agencies
50.00 - - - - - -
Other Development - - - - - - -
Total Expenditure 220.00 598.00 979.00 942.00 - - -
National Council for Population DevelopmentCurrent Expenditure 236.00 492.00 497.00 502.00 - - -
Compensation to Employees 170.00 283.00 285.00 288.00 - - -
Use of Goods and Services 66.00 210.00 212.00 214.00 - - -
Interest - - - - - - -
Subsidies - - - - - - -
Current Transfers to Govt.Agencies
- - - - - - -
Social Benefits - - - - - - -
Other Expense - - - - - - -
Non-Financial Assets - - - - - - -
Financial Assets - - - - - - -

233
Analysis of Semi-Autonomous Government Agencies (SAGAs) by Economic Classification
Economic Classification Allocation Resource Requirements Allocation
2016/2017 2017/2018 2018/2019 2019/2020 2017/2018 2018/2019 2019/2020
Capital Expenditure 267.00 755.00 3,488.00 1,122.00 - - -
Compensation to Employees - - - - - - -
Use of Goods and Services - - - - - - -
Interest - - - - - - -
Subsidies - - - - - - -
Current Transfers to Govt.Agencies
- - - - - - -
Social Benefits - - - - - - -
Other Expense - - - - - - -
Non-Financial Assets 267.00 755.00 3,488.00 1,122.00 - - -
Financial Assets - - - - - - -
Total Expenditure 503.00 1,247.00 3,985.00 1,624.00 - - -
Kenya National Bureau of StatisticsCurrent Expenditure 1,842.00 1,913.00 10,196.00 12,139.00 - - -
Compensation to Employees 783.00 788.00 906.00 1,042.00 - - -
Use of Goods and Services 1,059.00 1,125.00 9,290.00 11,097.00 - - -
Interest - - - - - - -
Subsidies - - - - - - -
Current Transfers to Govt.Agencies
- - - - - - -
Social Benefits - - - - - - -
Other Expense - - - - - - -
Non-Financial Assets - - - - - - -
Financial Assets - - - - - - -
Capital Expenditure 1,498.00 1,526.00 1,458.00 1,677.00 - - -
Compensation to Employees - - - - - - -
Use of Goods and Services - - - - - - -
Interest - - - - - - -
Subsidies - - - - - - -
Current Transfers to Govt.Agencies
- - - - - - -
Social Benefits - - - - - - -
Other Expense - - -
Non-Financial Assets 1,498.00 1,526.00 1,458.00 1,677.00 - - -
Financial Assets - - - - - - -
Total Expenditure 3,340.00 3,439.00 11,654.00 13,816.00 - - -
NGO Coordination BoardCurrent Expenditure 126.00 283.00 316.00 340.00 - - -
Compensation to Employees 101.00 133.00 146.00 160.00 - - -
Use of Goods and Services 25.00 75.00 150.00 165.00 - - -
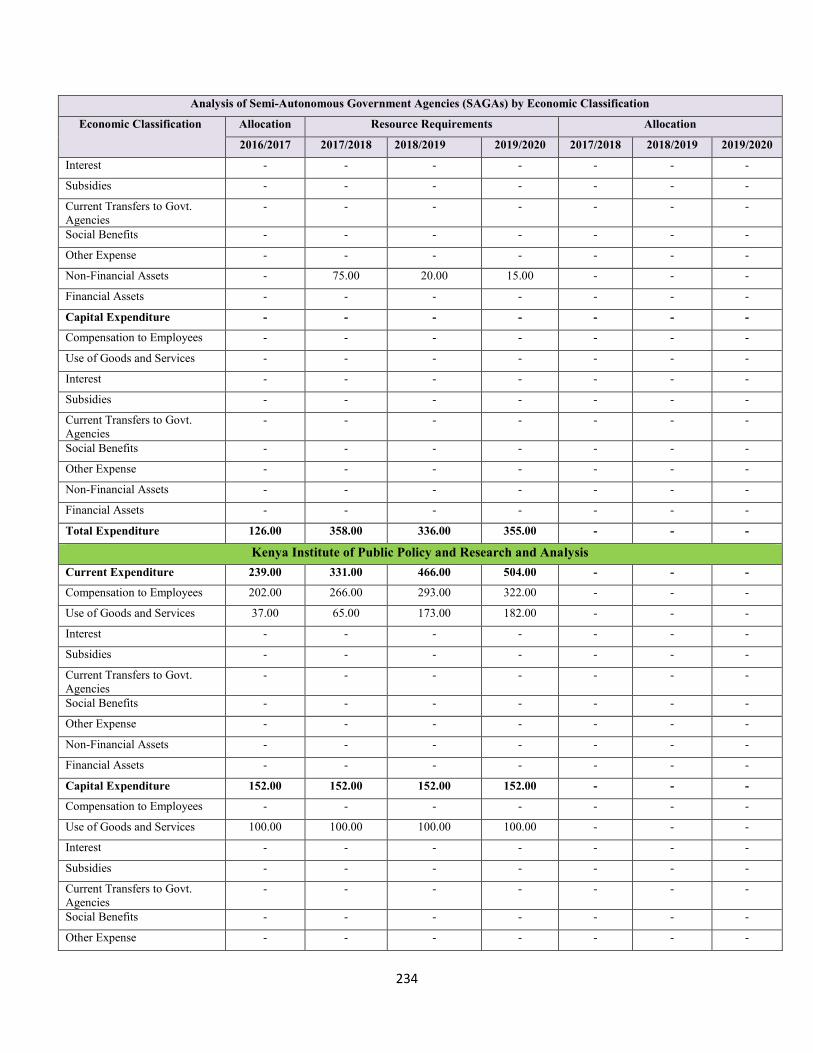
234
Analysis of Semi-Autonomous Government Agencies (SAGAs) by Economic Classification
Economic Classification Allocation Resource Requirements Allocation
2016/2017 2017/2018 2018/2019 2019/2020 2017/2018 2018/2019 2019/2020
Interest - - - - - - -
Subsidies - - - - - - -
Current Transfers to Govt.Agencies
- - - - - - -
Social Benefits - - - - - - -
Other Expense - - - - - - -
Non-Financial Assets - 75.00 20.00 15.00 - - -
Financial Assets - - - - - - -
Capital Expenditure - - - - - - -
Compensation to Employees - - - - - - -
Use of Goods and Services - - - - - - -
Interest - - - - - - -
Subsidies - - - - - - -
Current Transfers to Govt.Agencies
- - - - - - -
Social Benefits - - - - - - -
Other Expense - - - - - - -
Non-Financial Assets - - - - - - -
Financial Assets - - - - - - -
Total Expenditure 126.00 358.00 336.00 355.00 - - -
Kenya Institute of Public Policy and Research and AnalysisCurrent Expenditure 239.00 331.00 466.00 504.00 - - -
Compensation to Employees 202.00 266.00 293.00 322.00 - - -
Use of Goods and Services 37.00 65.00 173.00 182.00 - - -
Interest - - - - - - -
Subsidies - - - - - - -
Current Transfers to Govt.Agencies
- - - - - - -
Social Benefits - - - - - - -
Other Expense - - - - - - -
Non-Financial Assets - - - - - - -
Financial Assets - - - - - - -
Capital Expenditure 152.00 152.00 152.00 152.00 - - -
Compensation to Employees - - - - - - -
Use of Goods and Services 100.00 100.00 100.00 100.00 - - -
Interest - - - - - - -
Subsidies - - - - - - -
Current Transfers to Govt.Agencies
- - - - - - -
Social Benefits - - - - - - -
Other Expense - - - - - - -

235
Analysis of Semi-Autonomous Government Agencies (SAGAs) by Economic Classification
Economic Classification Allocation Resource Requirements Allocation
2016/2017 2017/2018 2018/2019 2019/2020 2017/2018 2018/2019 2019/2020
Non-Financial Assets 52.00 52.00 52.00 52.00 - - -
Financial Assets - - - - - - -
Total Expenditure 391.00 531.00 618.00 656.00 - - -
NG-CDF BoardCurrent Expenditure - - - - - - -
Compensation to Employees - - - - - - -
Use of Goods and Services - - - - - - -
Interest - - - - - - -
Subsidies - - - - - - -
Current Transfers to Govt.Agencies
- - - - - - -
Social Benefits - - - - - - -
Other Expense - - - - - - -
Non-Financial Assets - - - - - - -
Financial Assets - - - - - - -
Capital Expenditure 35,505.00 35,505.00 35,505.00 35,505.00 - - -
Compensation to Employees 500.00 500.00 500.00 500.00 - - -
Use of Goods and Services 1,275.25 1,275.25 1,275.25 1,275.25 - - -
Interest - - - - - - -
Subsidies - - - - - - -
Current Transfers to Govt.Agencies
- - - - - - -
Social Benefits - - - - - - -
Other Expense - - - - - - -
Non-Financial Assets 33,729.75 33,729.75 33,729.75 33,729.75 - - -
Financial Assets - - - - - - -
Total Expenditure 35,505.00 35,505.00 35,505.00 35,505.00 - - -
New Partnerships for Africa's DevelopmentCurrent Expenditure 196.00 275.00 357.00 465.00 - - -
Compensation to Employees 61.00 85.00 110.00 143.00 - - -
Use of Goods and Services 136.00 190.00 247.00 321.00 - - -
Current Transfers to Govt.Agencies
- - - - - - -
Non-Financial Assets - - - - - - -
Capital Expenditure 9.00 12.00 16.00 21.00 - - -
Acquisition of Non-FinancialAssets
9.00 12.00 16.00 21.00 - - -
Capital Grants to GovtAgencies
- - - - - - -
Other Development - - - - - - -
Total Expenditure 205.00 287.00 373.00 485.00 - - -

236
Analysis of Semi-Autonomous Government Agencies (SAGAs) by Economic Classification
Economic Classification Allocation Resource Requirements Allocation
2016/2017 2017/2018 2018/2019 2019/2020 2017/2018 2018/2019 2019/2020
Tana and Athi Rivers Development AuthorityCurrent Expenditure 191.00 488.00 523.00 560.00 - - -
Compensation to Employees 191.00 408.00 428.00 450.00 - - -
Use of Goods and Services - 80.00 95.00 110.00 - - -
Interest - - - - - - -
Subsidies - - - - - - -
Current Transfers to Govt.Agencies
- - - - - - -
Social Benefits - - - - - - -
Other Expense - - - - - - -
Non-Financial Assets - - - - - - -
Financial Assets - - - - - - -
Capital Expenditure 325.00 1,250.00 1,305.00 1,200.00 - - -
Compensation to Employees - - - - - - -
Use of Goods and Services - - - - - - -
Interest - - - - - - -
Subsidies - - - - - - -
Current Transfers to Govt.Agencies
- - - - - - -
Social Benefits - - - - - - -
Other Expense - - - - - - -
Non-Financial Assets 325.00 1,250.00 1,305.00 1,200.00 - - -
Financial Assets - - - - - - -
Total Expenditure 516.00 1,738.00 1,828.00 1,760.00 - - -
Lake Basin Development AuthorityCurrent Expenditure 157.00 356.00 394.00 419.00 - - -
Compensation to Employees 157.00 245.00 272.00 285.00 - - -
Use of Goods and Services - 111.00 122.00 134.00 - - -
Interest - - - - - - -
Subsidies - - - - - - -
Current Transfers to Govt.Agencies
- - - - - - -
Social Benefits - - - - - - -
Other Expense - - - - - - -
Non-Financial Assets - - - - - - -
Financial Assets - - - - - - -
Capital Expenditure 124.00 951.00 4,421.00 2,803.00 - - -
Compensation to Employees - - - - - - -
Use of Goods and Services 25.00 48.00 111.00 70.00 - - -
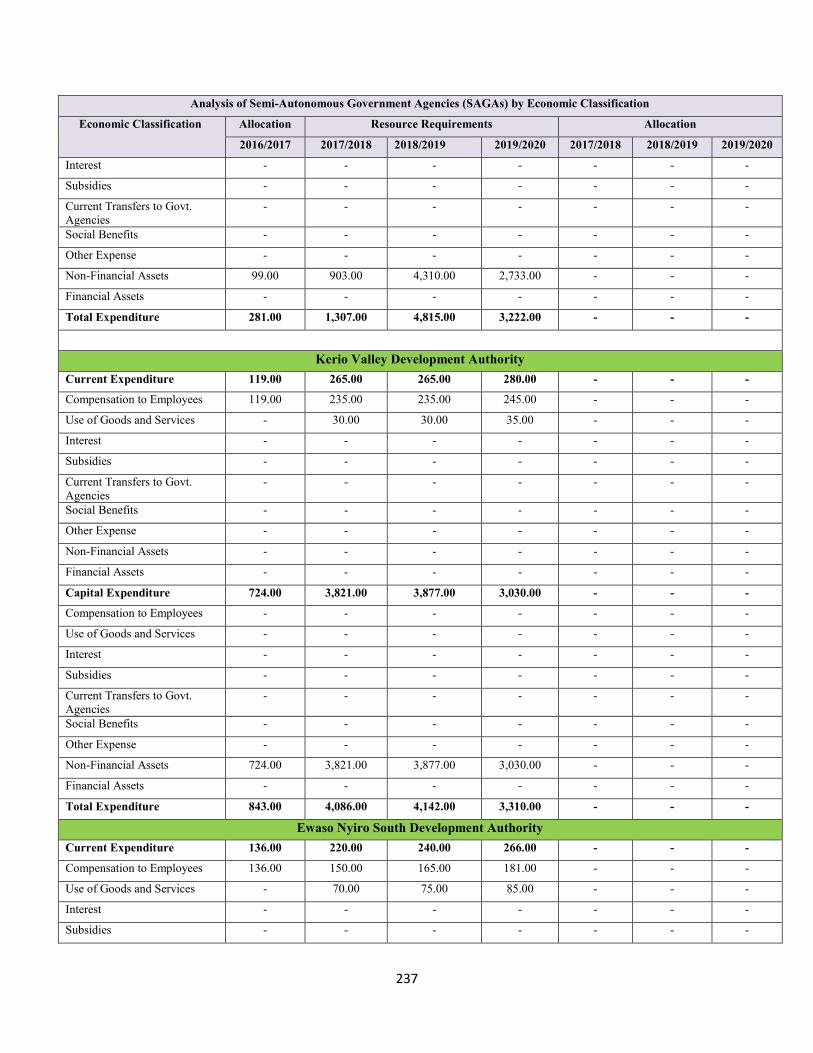
237
Analysis of Semi-Autonomous Government Agencies (SAGAs) by Economic Classification
Economic Classification Allocation Resource Requirements Allocation
2016/2017 2017/2018 2018/2019 2019/2020 2017/2018 2018/2019 2019/2020
Interest - - - - - - -
Subsidies - - - - - - -
Current Transfers to Govt.Agencies
- - - - - - -
Social Benefits - - - - - - -
Other Expense - - - - - - -
Non-Financial Assets 99.00 903.00 4,310.00 2,733.00 - - -
Financial Assets - - - - - - -
Total Expenditure 281.00 1,307.00 4,815.00 3,222.00 - - -
Kerio Valley Development AuthorityCurrent Expenditure 119.00 265.00 265.00 280.00 - - -
Compensation to Employees 119.00 235.00 235.00 245.00 - - -
Use of Goods and Services - 30.00 30.00 35.00 - - -
Interest - - - - - - -
Subsidies - - - - - - -
Current Transfers to Govt.Agencies
- - - - - - -
Social Benefits - - - - - - -
Other Expense - - - - - - -
Non-Financial Assets - - - - - - -
Financial Assets - - - - - - -
Capital Expenditure 724.00 3,821.00 3,877.00 3,030.00 - - -
Compensation to Employees - - - - - - -
Use of Goods and Services - - - - - - -
Interest - - - - - - -
Subsidies - - - - - - -
Current Transfers to Govt.Agencies
- - - - - - -
Social Benefits - - - - - - -
Other Expense - - - - - - -
Non-Financial Assets 724.00 3,821.00 3,877.00 3,030.00 - - -
Financial Assets - - - - - - -
Total Expenditure 843.00 4,086.00 4,142.00 3,310.00 - - -
Ewaso Nyiro South Development AuthorityCurrent Expenditure 136.00 220.00 240.00 266.00 - - -
Compensation to Employees 136.00 150.00 165.00 181.00 - - -
Use of Goods and Services - 70.00 75.00 85.00 - - -
Interest - - - - - - -
Subsidies - - - - - - -

238
Analysis of Semi-Autonomous Government Agencies (SAGAs) by Economic Classification
Economic Classification Allocation Resource Requirements Allocation
2016/2017 2017/2018 2018/2019 2019/2020 2017/2018 2018/2019 2019/2020
Current Transfers to Govt.Agencies
- - - - - - -
Social Benefits - - - - - - -
Other Expense - - - - - - -
Non-Financial Assets - - - - - - -
Financial Assets - - - - - - -
Capital Expenditure 488.00 5,187.00 3,878.00 3,127.00 - - -
Compensation to Employees - - - - - - -
Use of Goods and Services - - - - - - -
Interest - - - - - - -
Subsidies - - - - - - -
Current Transfers to Govt.Agencies
- - - - - - -
Social Benefits - - - - - - -
Other Expense - - - - - - -
Non-Financial Assets 488.00 5,187.00 3,878.00 3,127.00 - - -
Financial Assets - - - - - - -
Total Expenditure 624.00 5,407.00 4,118.00 3,393.00 - - -
Ewaso Nyiro North Development AuthorityCurrent Expenditure 118.00 246.00 279.00 326.00 - - -
Compensation to Employees 118.00 186.00 214.00 256.00 - - -
Use of Goods and Services - 60.00 65.00 70.00 - - -
Interest - - - - - - -
Subsidies - - - - - - -
Current Transfers to Govt.Agencies
- - - - - - -
Social Benefits - - - - - - -
Other Expense - - - - - - -
Non-Financial Assets - - - - - - -
Financial Assets - - - - - - -
Capital Expenditure 160.00 2,957.00 9,205.00 49,405.00 - - -
Compensation to Employees 6.00 - - - - - -
Use of Goods and Services 110.00 1,810.00 4,950.00 20,100.00 - - -
Interest - - - - - - -
Subsidies - - - - - - -
Current Transfers to Govt.Agencies
- - - - - - -
Social Benefits - - - - - - -
Other Expense - - - - - - -
Non-Financial Assets 44.00 1,147.00 4,255.00 29,305.00 - - -
Financial Assets - - - - - - -

239
Analysis of Semi-Autonomous Government Agencies (SAGAs) by Economic Classification
Economic Classification Allocation Resource Requirements Allocation
2016/2017 2017/2018 2018/2019 2019/2020 2017/2018 2018/2019 2019/2020
Total Expenditure 278.00 3,203.00 9,484.00 49,731.00 - - -
Coast Development AuthorityCurrent Expenditure 479.00 287.00 375.00 462.00 - - -
Compensation to Employees 161.00 207.00 279.00 347.00 - - -
Use of Goods and Services 318.00 80.00 96.00 115.00 - - -
Interest - - - - - - -
Subsidies - - - - - - -
Current Transfers to Govt.Agencies
- - - - - - -
Social Benefits - - - - - - -
Other Expense - - - - - - -
Non-Financial Assets - - - - - - -
Financial Assets - - - - - - -
Capital Expenditure 200.00 2,860.00 2,615.00 1,935.00 - - -
Compensation to Employees - - - - - - -
Use of Goods and Services - - - - - - -
Interest - - - - - - -
Subsidies - - - - - - -
Current Transfers to Govt.Agencies
- - - - - - -
Social Benefits - - - - - - -
Other Expense - - - - - - -
Non-Financial Assets 200.00 2,860.00 2,615.00 1,935.00 - - -
Financial Assets - - - - - - -
Total Expenditure 679.00 3,147.00 2,990.00 2,397.00 - - -
Vision 2030Current Expenditure 205.00 405.00 446.00 455.00 - - -
Compensation to Employees 98.00 150.00 166.00 170.00 - - -
Use of Goods and Services 107.00 96.00 106.00 106.00 - - -
Interest - - - - - - -
Subsidies - - - - - - -
Current Transfers to Govt.Agencies
- - - - - - -
Social Benefits - - - - - - -
Other Expense - - - - - - -
Non-Financial Assets - 145.00 160.00 1,645.00 - - -
Financial Assets - - - - - - -
Capital Expenditure - 14.00 14.00 14.00 - - -
Compensation to Employees - - - - - - -
Use of Goods and Services - - - - - - -
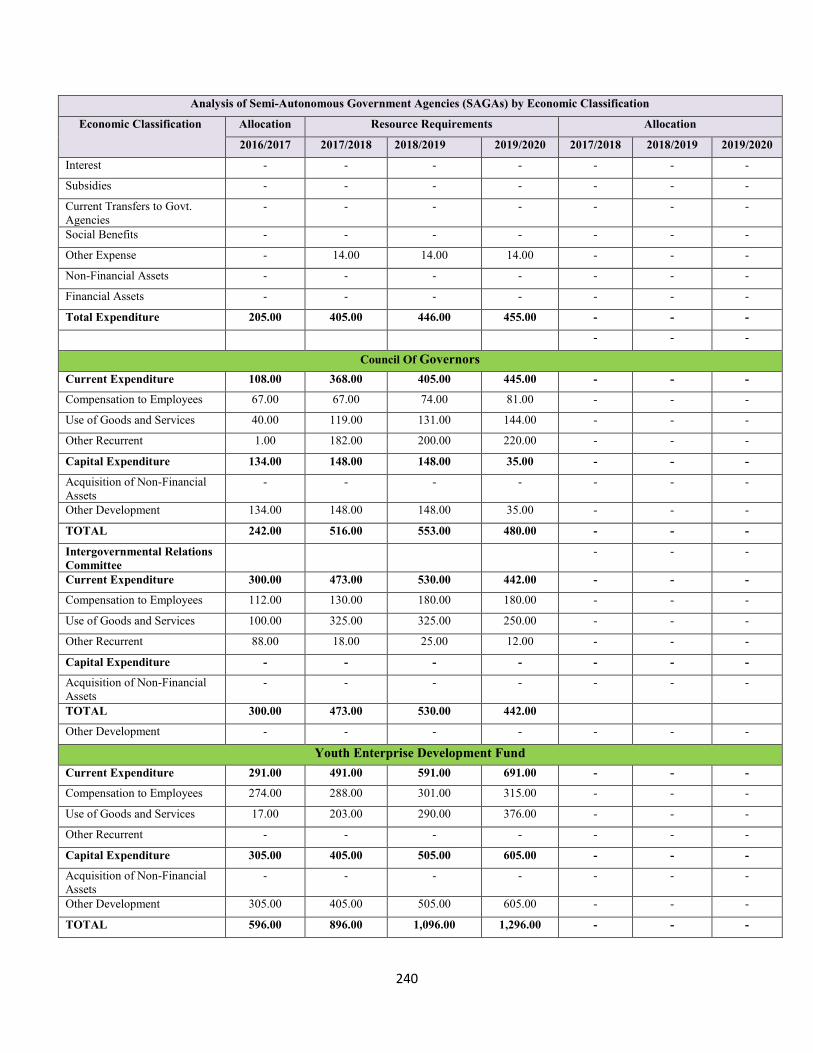
240
Analysis of Semi-Autonomous Government Agencies (SAGAs) by Economic Classification
Economic Classification Allocation Resource Requirements Allocation
2016/2017 2017/2018 2018/2019 2019/2020 2017/2018 2018/2019 2019/2020
Interest - - - - - - -
Subsidies - - - - - - -
Current Transfers to Govt.Agencies
- - - - - - -
Social Benefits - - - - - - -
Other Expense - 14.00 14.00 14.00 - - -
Non-Financial Assets - - - - - - -
Financial Assets - - - - - - -
Total Expenditure 205.00 405.00 446.00 455.00 - - -
- - -
Council Of GovernorsCurrent Expenditure 108.00 368.00 405.00 445.00 - - -
Compensation to Employees 67.00 67.00 74.00 81.00 - - -
Use of Goods and Services 40.00 119.00 131.00 144.00 - - -
Other Recurrent 1.00 182.00 200.00 220.00 - - -
Capital Expenditure 134.00 148.00 148.00 35.00 - - -
Acquisition of Non-FinancialAssets
- - - - - - -
Other Development 134.00 148.00 148.00 35.00 - - -
TOTAL 242.00 516.00 553.00 480.00 - - -
Intergovernmental RelationsCommittee
- - -
Current Expenditure 300.00 473.00 530.00 442.00 - - -
Compensation to Employees 112.00 130.00 180.00 180.00 - - -
Use of Goods and Services 100.00 325.00 325.00 250.00 - - -
Other Recurrent 88.00 18.00 25.00 12.00 - - -
Capital Expenditure - - - - - - -
Acquisition of Non-FinancialAssets
- - - - - - -
TOTAL 300.00 473.00 530.00 442.00
Other Development - - - - - - -
Youth Enterprise Development FundCurrent Expenditure 291.00 491.00 591.00 691.00 - - -
Compensation to Employees 274.00 288.00 301.00 315.00 - - -
Use of Goods and Services 17.00 203.00 290.00 376.00 - - -
Other Recurrent - - - - - - -
Capital Expenditure 305.00 405.00 505.00 605.00 - - -
Acquisition of Non-FinancialAssets
- - - - - - -
Other Development 305.00 405.00 505.00 605.00 - - -
TOTAL 596.00 896.00 1,096.00 1,296.00 - - -

241
Analysis of Semi-Autonomous Government Agencies (SAGAs) by Economic Classification
Economic Classification Allocation Resource Requirements Allocation
2016/2017 2017/2018 2018/2019 2019/2020 2017/2018 2018/2019 2019/2020
National Youth Council - - -
Current Expenditure 34.00 84.00 124.00 154.00 - - -
Compensation to Employees 12.00 14.00 16.00 18.00 - - -
Use of Goods and Services 22.00 70.00 108.00 136.00 - - -
Other Recurrent - - - - - - -
Capital Expenditure - - - - - - -
Acquisition of Non-FinancialAssets
- - - - - - -
Other Development - - - - - - -
TOTAL 34.00 84.00 124.00 154.00 - - -
International Convention of Great Lakes Region(ICGLR)Current Expenditure 180.00 180.00 180.00 180.00
Compensation to Employees 14.00 16.00 18.00 20.00 - - -
Use of Goods and Services 166.00 164.00 162.00 160.00 - - -
Other Recurrent - - - - - - -
Capital Expenditure - - - - - - -
Acquisition of Non-FinancialAssets
- - - - - - -
Other Development - - - - - - -
TOTAL 180.00 180.00 180.00 180.00 - - -
Presidents' Award SecretariatCurrent Expenditure 20.00 30.00 40.00 60.00 - - -
Compensation to Employees 5.00 8.00 12.00 14.00 - - -
Use of Goods and Services 15.00 22.00 28.00 46.00 - - -
Other Recurrent - - - - - - -
Capital Expenditure - - - - - - -
Acquisition of Non-FinancialAssets
- - - - - - -
Other Development - - - - - - -
TOTAL 20.00 30.00 40.00 60.00 - - -
Consolidated TotalsCurrent Expenditure 22,158.00 38,508.00 49,207.00 53,943.00 - - -
Compensation to Employees 18,717.00 22,743.00 25,136.00 26,307.00 - - -
Use of Goods and Services 3,352.00 13,472.00 22,772.00 24,850.00 - - -
Interest - - - - - - -
Subsidies - - - - - - -
Current Transfers to Govt.Agencies
- - - - - - -
Social Benefits - - - - - - -

242
Analysis of Semi-Autonomous Government Agencies (SAGAs) by Economic Classification
Economic Classification Allocation Resource Requirements Allocation
2016/2017 2017/2018 2018/2019 2019/2020 2017/2018 2018/2019 2019/2020
Other Expense - - - - - - -
Non-Financial Assets 89.00 2,293.00 1,299.00 2,786.00 - - -
Financial Assets - - - - - - -
Capital Expenditure 40,517.00 61,608.00 72,839.00 106,411.00 - - -
Compensation to Employees 506.00 500.00 500.00 500.00 - - -
Use of Goods and Services 1,949.25 8,280.25 10,819.25 25,409.25
Interest - - - - - - -
Subsidies - - - - - - -
Current Transfers to Govt.Agencies
- - - - - - -
Social Benefits - - - - - - -
Other Expense - - - - - - -
Non-Financial Assets 38,061.75 52,827.75 61,519.75 80,501.75 - - -
Financial Assets - - - - - - -
Total Expenditure 62,675.00 100,116.00 122,046.00 160,354.00
3.5 Key Priorities for the Sector
Over the MTEF period, the sector will spent the above allocation on the following priorities:
Fulfillment of constitutional mandates of the President and the Deputy President. Provision of leadership for national unity, growth and prosperity. Provision of policy direction and oversight to Ministries, Departments and Agencies for
sustainable growth. Fostering intergovernmental relations between the two levels of government. Affirmative initiatives towards enhancing access to health, empowerment of youth and
women under the First Lady’s and Deputy President’s Spouse programmes. Coordinate formulation and implementation of national development policies. Production of national statistics for evidence based decision-making. Coordinate implementation of integrated regional development initiatives. Coordinate Public Benefits Organizations. Ensure successful implementation of devolution Managing inter-governmental relations Articulation of Kenya’s Foreign Policy at the International, Continental, Regional and
Multilateral Forums. Strengthening and Expanding Kenya’s Diplomatic Footprint and Representation: Promotion of Economic and Commercial Diplomacy Foreign Policy Research and Technical Cooperation Infrastructure Development and Modernization Ensure prudent financial management in the public sector. Ensure macro-economic stability for sustainable development.
243
Mobilization and efficient allocation of resources for development. Regulation of the financial services sector. Public Service Transformation Youth Empowerment Promote equitable sharing of revenue between National and County Governments and
among counties Promote financial management and financing of county governments Human Resource Management and Development in the Public Service Promotion of Governance, Ethics and National Values in the Public Service Harmonization of remuneration and benefits in the public service. To promote and support good governance and accountability in the public sector Oversee budget implementation for both national and county governments. Promotion of Administrative Justice in the Public Sector.

244
CHAPTER FOUR
4.0 CROSS SECTOR LINKAGES, EMERGING ISSUES ANDCHALLENGES
4.1 Cross Sector Linkages
The PAIR Sector provides overall leadership, policy direction and oversight in the conduct andmanagement of public affairs. It coordinates Government business, foreign policy and relations,planning and budgeting, devolution affairs, mobilization and management of both financial andhuman resources, remuneration and benefits management and general development of the publicservice. The Sector also facilitates the provision of official statistics and supports public policyresearch, both of which are critical for planning purposes by government, private sector and civilsociety. In addition, the Sector plays a major role in public service performance management andpromotion of national values and principles of governance.
In coordinating its functions, the Sector maintains close links with other Sectors. Throughinstitutions like The Parliament, The National Treasury, Commissions and Independent Offices,the Sector ensures prudent utilization of public resources. In addition, it facilitates other Sectorsin policy guidance and formulation, legal, regulatory and institutional reforms as well asenactment of legislation to enable them discharge their mandates. Moreover, it works closelywith other Sectors in ensuring transparency and accountability in management of publicresources and in addressing public complaints to ensure that public institutions are responsive tothe consumers’ demand for quality services.
The Sector links with other public institutions in the implementation of the Constitution, Vision2030 and MTP II. It links with regional and international communities/organizations in matterspertaining to trade, development, peace and security, tourism and environment. It supportsplanning, budgeting and resource allocation, monitoring and evaluation of programmes andpolicies at both national and county levels. The Sector also facilitates linkages between thenational and county governments through the Intergovernmental Budget and Economic Council(IBEC), which seeks to promote mutual and well-coordinated relations between the two levels ofgovernment. Further, the Sector links with various stakeholders including the media inimplementing affirmative actions to address issues affecting the youth, women and persons withdisability, marginalised, minority groups and arid and semi-arid areas. The Sector also links withother institutions in the implementation of programmes relating to devolution, disastermanagement, climate change and sustainable livelihoods.
4.2 Emerging IssuesThe Sector has identified various emerging issues that may affect the implementation of itsprogrammes. The emerging issues include:
245
a) Fiscal Responsibility and AccountabilityRecent reports of the Auditor General and investigations by the Ethics and Anti-CorruptionCommission have raised multiple issues of concern with regard to misuse and misappropriationof public funds, especially at county level. This emerging trend is raising a lot of public concernand requires greater and urgent attention by both levels of government.
b) Public Service Wage BillThe public sector wage bill in Kenya consumes about 50% of ordinary revenue and is higherthan the recommended 30 – 35% of a country with similar economic status. Between 2008/09 –2013/14, the public sector wage bill grew from 10.7% of GDP to 13% mainly due toreorganization of government in 2013. Even with this high wage bill, there is high and frequentdemand for pay reviews amongst groups of public servants such as health workers and teachers.Meeting such demands would augment the wage bill; hence depress economic growth asresources are diverted from development to recurrent expenditure. Currently, the Government iscarrying out a Job Evaluation exercise for public service with a view to determining appropriatepay levels for the roles serving in the Service. This initiative is however unlikely to solelyaddress the issue of wage bill hence the need for Government to come up with a morecomprehensive strategy to address the matter.
c) LitigationsIn the recent past, the country has experienced an increased number of litigations by institutions,individuals and groups seeking legal intervention on matters related to project identification andimplementation. This is partially attributable to the increased democratic space and stakeholders’interests in development programmes. The court processes related to such litigations have highcost implications and in some instances result in delay in implementation of projects andprogrammes.
d) Reorganization of Government Following 2017 General ElectionsThe transition of Government following the 2017 general elections may lead to somereorganisation of the sector institutions. This is expected to lead to adjustments in resourcerequirements for the sector.
e) Formation of Economic Blocs by County GovernmentsRecently, some County Governments have formed economic blocs with unclear integrationmechanism. This calls for development of a framework, standards and norms to be used in suchintegration.
f) Inadequate Norms and Standards in Management of Human Resource at the CountyLevel
The norms and standards which guide management of human resource recruitment,remuneration, discipline and other human resource issues at the County level are inadequate.This has resulted to among other things, irregular recruitment, inconsistent remuneration, uncleardisciplinary processes, upsurge of appeal cases and high expenditure in related litigation.
246
g) Unconstitutional County LegislationSince the operationalisation of County Governments, there have been cases of passage oflegislations which are inconsistent with the Constitution and the law, particularly those relatingto principles of separation of powers. This impacts on expenditure, hence negatively affectingservice delivery.
4.3 ChallengesThe Sector has identified various challenges that affect budget implementation. The challengesinclude:
a) Pressure on Resource AllocationThe implementation of devolution exerts pressure to raise additional resources against arelatively inelastic revenue base. In addition, the shift in budget preparation policy that requiresParliament to vet the budget before it is approved has in some instances resulted in allocationinefficiency where priority programmes informed by macroeconomic fundamentals remainunfunded in favour of others informed by political considerations.
b) Inadequate FundingThe Sector implemented 32 budget programmes in 2016/17 with an increase to 33 in 2017/18.The Programmes cover wide mandates, yet the allocation to the Sector has grown marginallyover the years. This is not commensurate in meeting the expectations of effective servicedelivery, thereby rationalising the need for additional.
c) Slow Implementation of Capital ProjectsThe implementation of capital projects in the Sector is hampered by systemic challenges such asdelays in design, procurement of contractors and implementation. The incompatibility of thePublic Procurement and Assets Disposal Act, 2015 with procurement procedures in foreigncountries has affected capital projects in Kenya’s foreign offices.
d) Human Resource Capacity GapsFollowing reorganisation of Government in 2013, various initiatives for staff rationalization havebeen carried out. However, there are still some MDAs that are understaffed relative to the rolesthey have to play. For example, some of the Sector MDAs have to respond toincreased demandfor services at the county level. The understaffing constrains effective service delivery.
e) Austerity Measures and Budget CutsWhereas austerity measures and budget cuts are rationalised for macroeconomic reasons, theirapplication across all subsectors without regard to functions and mandates adversely affects theimplementation of projects and programmes.
f) Delays in Exchequer ReleasesDelays in exchequer releases negatively affect implementation of projects and programmesresulting in low absorption of funds in the Sector and thus affecting service delivery.
g) Inefficiencies in “Own” Revenue Collection by the Counties

247
Own revenue collection by the county governments has remained largely sub-optimal. Whilesome counties’ own revenue has risen, others have stagnated or even dwindled. Theunderperformance means that the counties continue to rely heavily on the national transfers. It iscrucial that the challenges impinging on greater revenue collection at county level be addressed.
h) Inadequate DataEffective planning, implementation and monitoring and evaluation of government programmesrequire high quality and up to date data. Whereas, Sector institutions have been working closelywith the Kenya National Bureau of Statistics (KNBS) to provide data, there exist some data gaps.
i) Inadequate Office Accommodation and EquipmentSome Sector institutions are faced with shortage of office space and equipment which constrainsservice delivery.
j) Pending BillsThe management of the Sector’s budget has been negatively affected by pending bills. By takingfirst charge in the succeeding Financial Year, the pending bills often derail planned developmentand recurrent activities hence compromising service delivery.
k) Weak Monitoring and Evaluation SystemThe Monitoring and Evaluation System does not provide timely and quality feedback on theimplementation of projects, programmes and policies.
l) Weak Financial Management Systems at County LevelMost of the County Governments are yet to fully embrace and operationalize IFMIS due tocapacity challenges. Most of the data from sub-county level is mainly captured manually.Further, the capacity of some county staff in terms of budget preparation, execution andmonitoring and evaluation is weak. This negatively affects optimal budget allocation, absorptionand reporting.
m) Lack of Harmony in Standards and Terms of Service in Public ServiceThe sensitivity of the salaries, allowances and other remuneration issues in the public service haspresented challenges. The challenges include high wage bill, outdated schemes of service, somecadres operating without schemes of service, collective bargaining agreements that take too longto resolve and the numerous requests for salary reviews. The Sector which is charged withproviding advisories on terms of service in the public sector faces challenges relating toresistance, failure to heed or seek advice and non-compliance by some players.
n) Impact of Climate ChangeThe increasing frequency and intensity of impacts of climate change such as drought, la-nina andel-nino have resulted to vulnerability of the communities, thus undermining sustainabledevelopment. The negative impacts are most grave in the arid and semi-arid areas. This putsstrain on Government’s emergency and drought response mechanisms due to the multiple needfor providing relief and other interventions to the affected communities.
248
o) Pooling of Advertising and Awareness BudgetThe pooling of funds meant for advertisement is posing challenges to Sector institutions. First,the failure to indicate the amount allocated to each MDA makes it difficult to plan. Second, thepolicy is constraining timely access to the pooled funds.

249
CHAPTER FIVE5.0 CONCLUSION
The PAIR Sector spearheads the implementation of the country’s development agenda and theConstitution. Broadly, the fourteen subsectors in the Sector provide overall leadership andoversight in the management of the economy; mobilization, allocation and management ofresources; human resource development and management; implementation of devolution; andfostering international relations and trade. During the 2017/18 – 2019/20 budget cycle, the Sectorwill continue supporting the Government towards realizing the targets of the second MediumTerm Plan of the Kenya Vision 2030 and the third Medium Term Plan (MTP III) which isexpected to be launched in 2017/18. Furthermore, the Sector will endeavor to meet the diverseexpectations of its stakeholders which largely revolve around effective leadership, macro-economic stability and improved service delivery. It will also be sensitive to the expectations ofKenyans as the country conducts the second election under the Constitution of Kenya, 2010.
In the 2013/14 – 2015/16 MTEF period, the Sector implemented twenty eight (28) programmes.Within the programmes, a total of one hundred (100) capital projects were implemented. Someof the projects were completed while others are ongoing and will be completed in the 2017/18 –2019/20 MTEF period. Review of programmes’ performance for 2013/14– 2015/16 found thatmost of the planned outputs were fully achieved. The budgetary absorption rate was 96 percent,88 percent and 75percent respectively. In the same period, the total pending bills were Ksh.21,964.53 million, out of which Ksh. 14,379.85 million was recurrent bills and Ksh. 7,584.68million development bills. The pending bills mainly resulted from delayed exchequer releases,rationalization of budget and reorganization of Government leading to late transfer of funds.
In the 2017/18 – 2019/20 MTEF period, the Sector has outlined the key outputs it intends toachieve. The priorities included in this report are aligned to the MTP II of the Kenya Vision 2030and will be re-aligned to the MTP III upon its launch. The Sector’s MTEF programmes willincrease from thirty two implemented in the 2016/17 to thirty three in the 2017/18 financial year.The number may be reviewed in 2018/19 and 2019/20 to accommodate emerging issues. Theprogrammes are geared towards achieving a diverse set of defined objectives, outcomes andoutputs. The realization of the priorities will require the Sector’s budget to rise from the 2016/17baseline allocation of Ksh. 193,450 million to Ksh. 320,439 million, Ksh. 355,831 million andKsh. 406,938 million for 2017/18, 2018/19, and 2019/20 financial years respectively. This isagainst ceilings of Kshs 208,662 million, Kshs 212,728 million and Kshs219,477 million,leaving resources gaps of Kshs 111,777 million, Kshs 143,103 and Kshs 187,461 in 2017/18,2018/19 and 2019/20 respectively.
Taking cognizance of the resource constraints, the prioritization of the Sector programmes isinformed by, among other things, their potential to contribute to MTP II of the Kenya Vision2030 and poverty alleviation; one-off allocation to strategic projects and/or initiatives; extent towhich the programmes address the core mandate of the respective subsector and nurture cross-sector linkages; and the cost effectiveness and sustainability of the programmes. Tracking ofprogrammes’ implementation will be done using the objectively verifiable indicators discussedin Chapter Three.

250
The Sector hosts the Presidency, key ministries, constitutional commissions and independentoffices whose functions cut across the entire public sector; hence its MTEF programmes link andimpact on all the other sectors. Apart from specific linkages with MDAs, the Sector alsofacilitates linkages between the national and county governments through the IntergovernmentalBudget and Economic Council (IBEC), which seeks to promote mutual and well-coordinatedrelations between the two levels of government. Additionally, the Sector links with variousstakeholders in implementing affirmative actions to address issues affecting the youth, women,persons with disabilities, marginalised, minority groups and arid and semi-arid areas. The cross-sector linkages are mutual and foster synergy between the PAIR Sector and other sectors.
Regarding budget making and implementation, the Sector has identified a number of emergingissues and challenges that are likely to impact on implementation of planned programmes. Theemerging issues include: fiscal responsibility and accountability; public service wage bill;litigations affecting government programmes; adjustments of resources to accommodatereorganisation of Government following the 2017 general elections; formation of economic blocsby County Governments; inadequate norms and standards in the management of humanresources at the county level; and cases of development of unconstitutional county legislations.
The key challenges encountered by the Sector include: inadequate funding; pressure on resourceallocation; slow implementation of capital projects; human resource capacity gaps among sectorinstitutions; application of austerity measures and budget cuts; delays in exchequer releases;inadequate data and weak monitoring and evaluation systems; lack of harmony in standards andterms of service in the public service; inefficiencies of “own” revenue collection by the counties;pending bills; and weak financial management systems at the county level.
The Sector recognizes the need to progressively respond to the emerging issues as well asaddress the challenges. Some of the key measures that the Sector will take in this regard arediscussed in Chapter Six.
251
CHAPTER SIX6.0 RECOMMENDATIONS
This chapter provides key recommendations following the review of the PAIR Sector’sexpenditures and performance in the 2013/14 – 2015/16 and the proposed estimates and expectedoutputs for the 2017/18 – 2019/20 periods. The recommendations are aimed at improving theSector’s budget making, execution and monitoring of the allocated resources and include:
a) Improving fiscal responsibility and accountabilityTo address issues of misuse and misappropriation of public resources, the Government shouldstrengthen budget implementation and monitoring as well the institutions with oversightfunctions on financial and governance issues. To improve transparency and standardizereporting, the implementation of the IFMIS should be fast tracked to ensure full rollout to countygovernments. This process should be properly managed and involve stakeholders so that it canachieve the intended results, reduce resistance and enhance system ownership. Further, countiesshould establish effective internal audit departments and audit committees.
b) Devising strategies for addressing the wage billIn view of the pressure for the Sector to mobilize resources to accommodate the rising wage bill,the Government should continue undertaking the annual human resource audits at both nationaland county levels to ensure only eligible personnel is retained. In addition, Government shouldrationalise staff at both levels of government.
c) Reducing delays in implementation of Government programmes resulting fromlitigations
To reduce litigation related to Government programmes, the Sector should promote stakeholders’participation in the design and implementation processes for projects. The Government shouldalso employ alternative dispute resolution (ADR) mechanisms in resolution of emergent disputesrather than going through lengthy and expensive court processes. The capacity of the Office ofthe Attorney General and Department of Justice should be strengthened to comprehensivelyhandle all public cases to minimise costs of using private attorneys.
d) Mitigating the effects of reorganization of government in 2017In view of changes that may result from the reorganisation of Government following the 2017general elections, Sector institutions are expected to rationalise their resources to ensure minimaldisruption in service delivery.
e) Developing framework for guiding economic integration among countiesTo support the effective integration of counties, the government should develop a framework thatprovides the standards and norms to guide the integration processes.
f) Strengthening Human Resource Management at County LevelTo address challenges related to human resource recruitment, remuneration, discipline and otherhuman resource issues at the County level, the Government should fast track the enactment ofthe Public Service Commission Bill.

252
g) Improving alignment of county legislations to the Constitution and the lawTo support counties develop legislation which is aligned to the Constitution and the law,Counties should be guided to use the model laws developed by the Kenya Law ReformCommission. The Government should also build the capacity of county assemblies and technicalstaff at the county level who participate in the development of such legislation.
h) Addessing resource gaps in the sectorTo improve optimal resource allocation, the sector should have continual engagement tocomprehensively deliberate, understand and agree on sector priorities. The sector should preparedetailed justification for consideration of enhanced ceiling by the Macro Working Group and theParliament. MDAs in the Sector should proactively identify projects and programmes which canbe implemented within the Public Private Partnership framework in order to supplementgovernment budgetary allocations. In addition, MDAs should identify cost saving measures toeliminate wastage.
i) Devising strategies for addressing pressure on resource needsIn view of the pressure for the Sector to mobilize resources against moderate economic growth,Treasury and Kenya Revenue Authority need to come up with strategies to bridge the deficits inrevenue collections. The government should also entrench public financial management reformsto improve revenue collection and minimise misuse.
j) Improving implementation of capital projectsTo improve implementation of capital projects, MDAs should entrench Project Committees toimprove on vetting, appraisal and monitoring and evaluation of projects. They should alsoprepare appropriate tender documents on timely basis to improve procurement processes andimplementation of the respective projects. Foreign offices undertaking capital projects shouldundertake pre-implementation analysis to identify legal and other operational issues that need tobe addressed to ensure such projects are not delayed.
k) Alleviating human resource gapsIn view of the guidelines freezing recruitment, subsectors facing acute human resourcechallenges should seek special approval and consequently make adequate budgetary provisionsand liaise with the PSC on the recruitment processes.
l) Reducing negative effects of austerity measures and budget cutsTo reduce negative effects of austerity measures and budget cuts, consideration should be madeto determine the importance of the economic classification items that is affected vis-à-vis thecore mandate of the respective MDAs so that their application is differentiated. Austeritymeasures should be applied selectively to safeguard MDAs whose core activities depend onspecific items of expenditure targeted for budget reduction.
m) Improving exchequer releasesThe National Treasury working with other relevant institutions such as the Controller of Budgetand Parliament should improve on exchequer releases to national and county levels. County

253
governments should also ensure that they release exchequer to their downstream institutions on atimely basis to minimize service delivery disruptions. In addition, supplementary budgets shouldbe passed in good time to allow appropriate planning and budget implementation.
n) Addressing inefficiencies in “own” revenue collection by countiesCounties should undertake resource mapping to guide them in setting realistic local revenuetargets. To minimise revenue evasion and diversion, the Sector should support the counties inbuilding capacity for efficient and effective local revenue collection, while the oversightinstitutions should monitor the revenue collection processes in respective counties.
o) Strengthening monitoring and evaluationSub-sectors should put into place M&E structures to support effective monitoring of programmesand build capacity for monitoring and reporting. In particular, the need for strengthening M&Ecapacity at county level is urgent. Further, and taking into consideration the criticality of data inM&E, the Government should increase its investment for data gathering, while Sectorinstitutions should build data bases for the data they use regularly.
p) Addressing office accommodation and equipment gapsGovernment should carry out an office space and equipment audit and rationalise their use.Subsectors with gaps should make annual budgetary provisions to progressively cater for officeaccommodation and equipment gaps. In cases of large gaps, a phased approach is recommended.It is also important for Government to take stock of the total amount used in rent to inform policydecision as to whether construction of centralised office blocks for all MDAs is the sustainableoption in the long run.
q) Addressing pending billsTo alleviate the perennial challenge of pending bills, the supplementary budget should be passedon time to allow the National Treasury dispatch the resources on time. In addition, the SectorMDAs should undertake progressive monitoring of budget execution in all quarters to identifyareas that may result to pending bills and take mitigating actions.
r) Improving financial management systems at county levelTo improve financial management at county level, it is important to improve the necessaryinfrastructure to support IFMIS as well as build the capacity of staff involved in the publicfinance management functions. It is also crucial to progressively review the Public FinanceManagement Act and make appropriate amendments to address emergent issues which impingeon the efficiency of financial processes at county level.
s) Harmonizing terms of service in the public serviceTo improve job satisfaction and service delivery, the government should institutionalizeremuneration reviews and harmonization of remuneration and benefits in the public service toaddress inequities occasioned by disparities that have accumulated over time. The NationalTreasury should also ensure all MDAs are accessing resources for the implementation ofmortgage and car loan scheme for public officers.

254
t) Preparedness for drought and other disastersThe Sector should make adequate provisions to cater for emergencies while linking with othersectors to implement development programmes aimed at sustainable solutions.
u) Improving utilization of advertising and awareness budgetTo improve efficiency in use of the pooled advertising and awareness budget, the GovernmentAdvertising Agency should provide information on the amount allocated to the various MDAs toenable them plan and execute their activities without delays or being turned down.
The foregoing recommendations will require formulation of specific actions by various actors. Inthis regard, it is expected that all the actors and in particular the respective subsectors in thePAIR Sector will take proactive actions to actualize the recommendations.
Recommended


![Republic v Edward Kirui [2010] eKLR REPUBLIC OF KENYA …kenyalaw.org/Downloads_FreeCases/75128.pdf · Republic v Edward Kirui [2010] eKLR . REPUBLIC OF KENYA . ... AT NAIROBI (NAIROBI](https://img.pdfslide.us/doc/110x75/5acfc9f67f8b9a4e7a8d1a22/republic-v-edward-kirui-2010-eklr-republic-of-kenya-v-edward-kirui-2010.jpg)