
Half-yearly financial report 2016
Report on business activity
Consolidated financial statements

Half-yearly financial report 2016
TABLE OF CONTENTS
Declaration from the person responsible for the half-yearly financial report
1
Report on 2016 first-half business activity and results 3
o Key figures 3
o Presentation of financial information 4
o Order intake 7
o Sales 8
o Adjusted results 9
o Consolidated results 10
o Financial situation at 30 June 2016 11
o Related party transactions 11
o Main risks and uncertainties in the second half of 2016 fiscal year 11
o Outlook for the current year 12
o Appendix 13
Consolidated financial statements at 30 June 2016 16
o Table of contents 17
o Consolidated profit and loss account 18
o Consolidated statement of comprehensive income 19
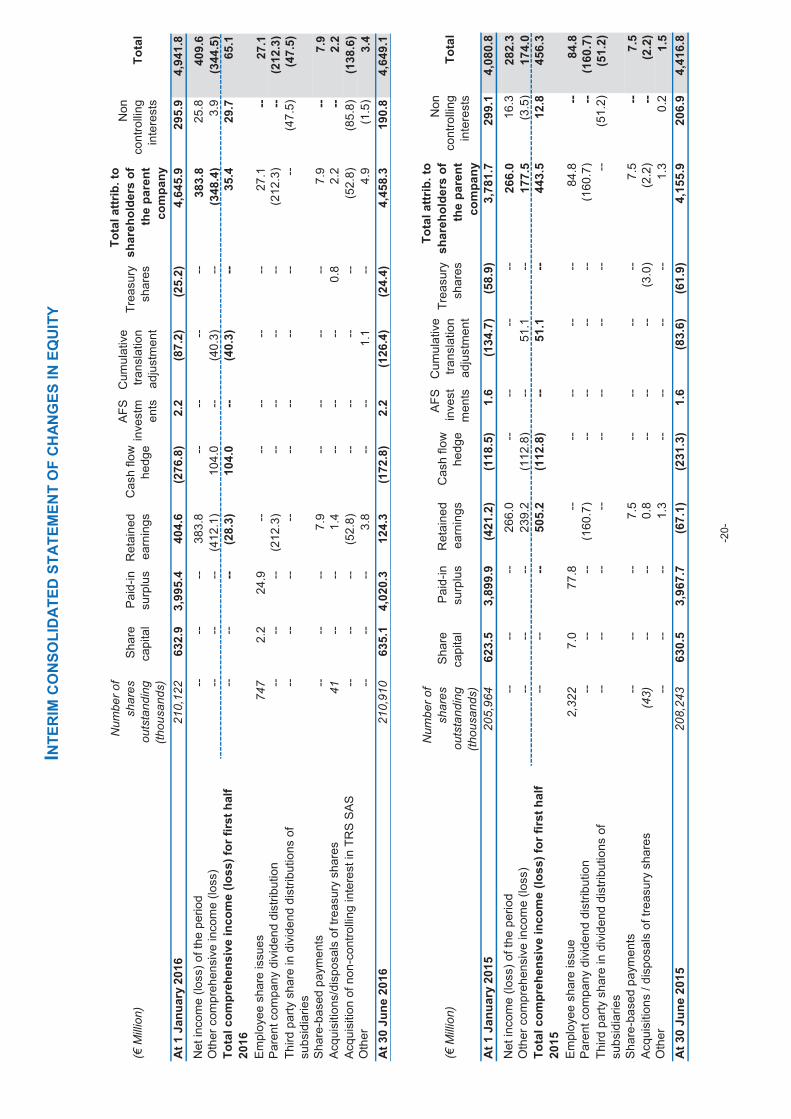
o Consolidated statement of changes in equity 20
o Consolidated balance sheet 21
o Consolidated statement of cash flows 22
o Notes to the consolidated financial statements 23
Statutory auditors’ report 43
The English language version of this report is a free translation from the original, which was prepared and filed with the AMF in French language. All possible care has been taken to ensure that the translation is an accurate presentation of the original. However, in all matters of interpretation, views or opinion expressed in the original language version of the report in French take precedence over the translation.

1
Declaration by person responsible for the half-yearly financial report
“I certify that, to the best of my knowledge, the condensed financial statements at 30 June 2016
have been prepared in accordance with applicable accounting standards and give a fair view of
the assets, liabilities, financial position and results of the company and of all the entities taken as
a whole included in the consolidation, and that the attached half-yearly business report presents
a fair view of the significant events that occurred during the first six months of the financial year,
their impact on the financial statements, the main related party transactions as well as a
description of the main risks and uncertainties for the remaining six months of the financial year.”
Paris La Défense, 21 July 2016 Patrice Caine
Chairman & Chief Executive Officer

2

3
REPORT ON 2016 FIRST HALF
BUSINESS ACTIVITY AND RESULTS
KEY FIGURES (ADJUSTED)1
in millions of euros except income per share (in euros)
H1 2016 H1 2015 Total
change
Organic
change
Order intake 5,423 6,224 -13% -12%
Order book at end of period 30,374 32,2922 -6% -4%
Sales 6,846 6,347 +7.9% +8.9%
EBIT3 551 473 +17% +19%
in % of sales 8.1% 7.5% +0.6 pts +0.7 pts
Adjusted net income, Group share2
367 313 +17%
Adjusted net income, Group share, per share2
1.74 1.51 +15%
Consolidated net income, Group share 384 266 +44%
Free operating cash flow2
45 (304) NM
Net cash at end of period 1,439 1,9782 -27%
1 In order to enable better monitoring and benchmarking of its financial and operating performance, Thales presents adjusted data, including EBIT and adjusted net income,
non-GAAP measures, which exclude non-operating and non-recurring items. Details of the adjustments are given in the "Presentation of financial information" in this report. 2 At 31 December 2015
3 Non-GAAP measures, see definitions in the appendix, page 4.

4
PRESENTATION OF FINANCIAL INFORMATION
Accounting policies
The condensed interim consolidated financial statements for the six months ended 30 June 2016 have been prepared in accordance with IAS 34 “Interim financial reporting” and with the International Financial Reporting Standards (IFRS) as adopted by the European Union at 30 June 2016
1.
The condensed interim consolidated financial statements have been prepared using the same accounting policies as those used to prepare the full-year financial statements at 31 December 2015, as detailed in the Registration Document 2015 (see notes 1 and 14 of the consolidated financial statements). In particular, the new mandatory standards applicable as from 1 January 2016 (annual improvements for 2010-2012, then 2012-2014 cycles, amendments to IAS 16 and IAS 38, amendments to IFRS 11 and amendments to IAS 19) have no impact on the Group’s financial statements.
Adjusted income statement
In order to facilitate better monitoring of its financial and operating performance, the Group’s executives regularly consider two main non-GAAP indicators determined as follows:
· The EBIT corresponds to income from operations, plus the share in net income of equity affiliates, before the amortisation of intangible assets acquired (purchase price allocation, “PPA”) recorded as part of business combinations. From 1 January 2016, it also excludes other expenses recorded in the income from operations, and directly related to these business combinations, which by their nature are unusual (expenses of € 7.1 million of first half of 2016, nil in 2015).
· The adjusted net income, considered as relevant by the Group because it enables non-recurring items to be excluded, corresponds to the consolidated net income attributable to shareholders of the parent company, excluding the following items, net of the corresponding tax effects:
- amortisation of acquired intangible assets (PPA) recorded as part of business combinations ;
- other expenses recognised in the income from operations, that are directly related to these business combinations, which by their nature are unusual;
- disposal of assets, changes in scope of consolidation and other ;
- changes in fair value of foreign exchange derivatives, recorded in « other financial income » ;
- actuarial gains and losses on long-term employee benefits, included in « financial income on pensions and other employee benefits ».
It is reminded that only the consolidated financial statements were audited by the statutory auditors at 30 June. The consolidated financial statements include the EBIT provided in Note 2 “Segment information” to the consolidated financial statements. Adjusted financial information other than that provided in Note 2 “Segment information” is subject to the verification procedures applicable to all information included in this report.
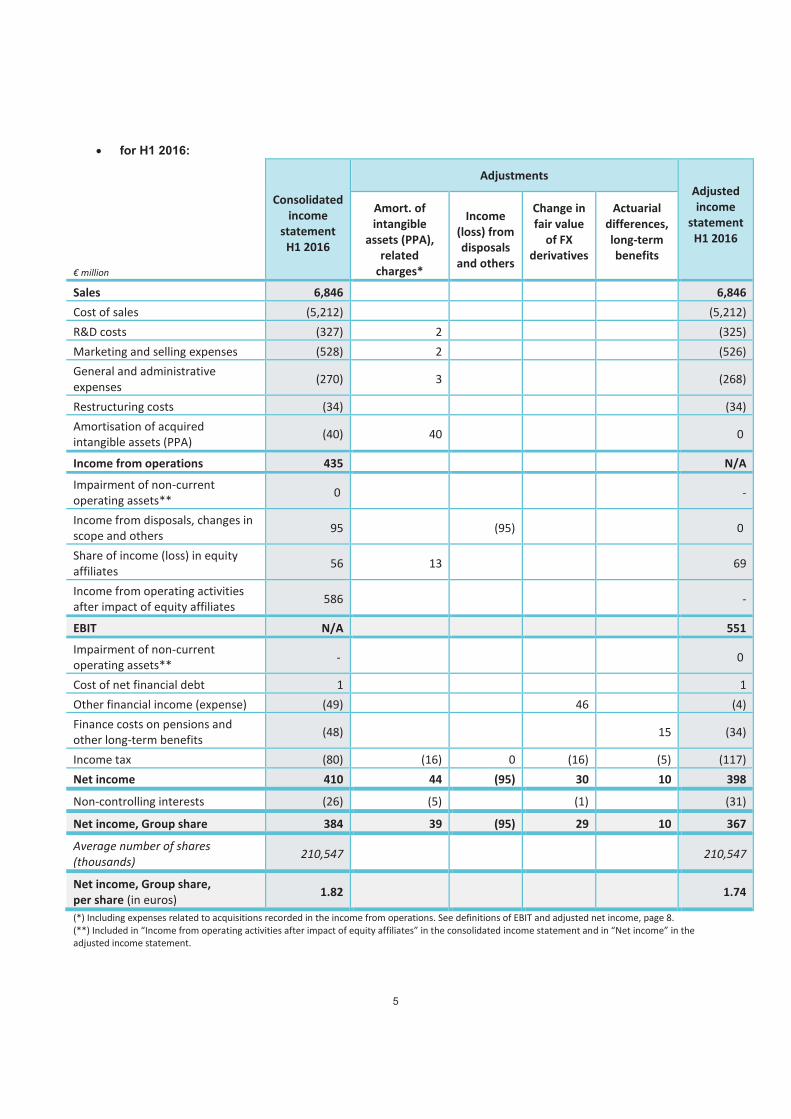
The impact of these adjustments on the income statement at 30 June 2016 and at 30 June 2015 is as follows:
1 Available at the following internet address : http://ec.europa.eu/internal_market/accounting/ias/index_en.htm.
5
· for H1 2016:
Consolidated
income
statement
H1 2016
Adjustments
Adjusted
income
statement
H1 2016
€ million
Amort. of
intangible
assets (PPA),
related
charges*
Income
(loss) from
disposals
and others
Change in
fair value
of FX
derivatives
Actuarial
differences,
long-term
benefits
Sales 6,846 6,846
Cost of sales (5,212) (5,212)
R&D costs (327) 2 (325)
Marketing and selling expenses (528) 2 (526)
General and administrative
expenses (270) 3 (268)
Restructuring costs (34) (34)
Amortisation of acquired
intangible assets (PPA) (40) 40 0
Income from operations 435 N/A
Impairment of non-current
operating assets** 0 -
Income from disposals, changes in
scope and others 95 (95) 0
Share of income (loss) in equity
affiliates 56 13 69
Income from operating activities
after impact of equity affiliates 586 -
EBIT N/A 551
Impairment of non-current
operating assets** - 0
Cost of net financial debt 1 1
Other financial income (expense) (49) 46 (4)
Finance costs on pensions and
other long-term benefits (48) 15 (34)
Income tax (80) (16) 0 (16) (5) (117)
Net income 410 44 (95) 30 10 398
Non-controlling interests (26) (5) (1) (31)
Net income, Group share 384 39 (95) 29 10 367
Average number of shares
(thousands) 210,547 210,547
Net income, Group share,
per share (in euros) 1.82 1.74
(*) Including expenses related to acquisitions recorded in the income from operations. See definitions of EBIT and adjusted net income, page 8.
(**) Included in “Income from operating activities after impact of equity affiliates” in the consolidated income statement and in “Net income” in the
adjusted income statement.

6
· for H1 2015:
Consolidated
income
statement
H1 2015
Adjustments
Adjusted
income
statement
H1 2015
€ million
Amort. of
intangible
assets (PPA)
Income
(loss) from
disposals
and others
Change in
fair value of
FX
derivatives
Actuarial
differences,
long-term
benefits
Sales 6,347 6,347
Cost of sales (4,827) (4,827)
R&D costs (310) (310)
Marketing and selling expenses (495) (495)
General and administrative
expenses (259) (259)
Restructuring costs (43) (43)
Amortisation of acquired
intangible assets (PPA) (53) 53 0
Income from operations 360 N/A
Impairment of non-current
operating assets 0 -
Income from disposals, changes in
scope and others (3) 3 0
Share of income (loss) in equity
affiliates 47 13 60
Income from operating activities
after impact of equity affiliates 404 -
EBIT N/A 473
Impairment of non-current
operating assets - -
Cost of net financial debt 5 5
Other financial income (expense) (13) 15 2
Finance costs on pensions and
other long-term benefits (25) (10) (35)
Income tax (88) (18) (1) (5) 3 (109)
Net income 282 48 2 10 (7) 336
Non-controlling interests (16) (6) (1) 1 (23)
Net income, Group share 266 42 2 9 (6) 313
Average number of shares
(thousands) 207,141 207,141
Net income, Group share,
per share (in euros) 1.28 1.51
7
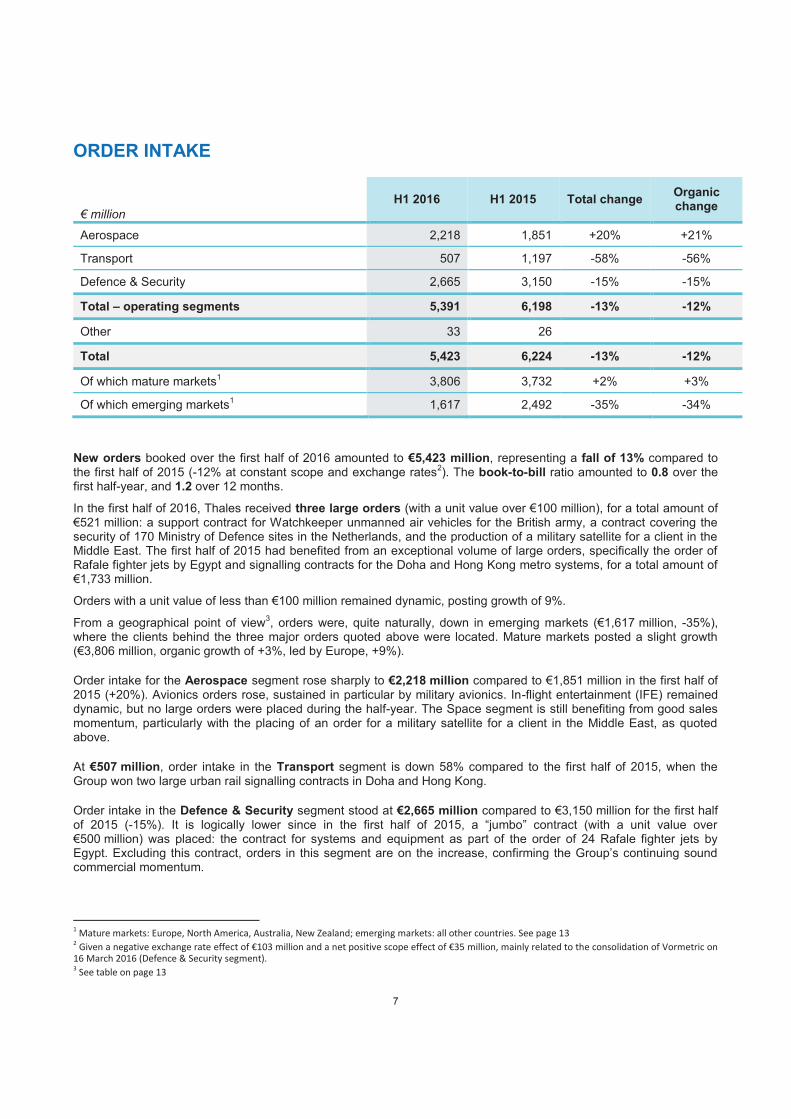
ORDER INTAKE
€ million
H1 2016 H1 2015 Total change Organic change
Aerospace 2,218 1,851 +20% +21%
Transport 507 1,197 -58% -56%
Defence & Security 2,665 3,150 -15% -15%
Total – operating segments 5,391 6,198 -13% -12%
Other 33 26
Total 5,423 6,224 -13% -12%
Of which mature markets1 3,806 3,732 +2% +3%
Of which emerging markets1 1,617 2,492 -35% -34%
New orders booked over the first half of 2016 amounted to €5,423 million, representing a fall of 13% compared to the first half of 2015 (-12% at constant scope and exchange rates2). The book-to-bill ratio amounted to 0.8 over the first half-year, and 1.2 over 12 months.
In the first half of 2016, Thales received three large orders (with a unit value over €100 million), for a total amount of €521 million: a support contract for Watchkeeper unmanned air vehicles for the British army, a contract covering the security of 170 Ministry of Defence sites in the Netherlands, and the production of a military satellite for a client in the Middle East. The first half of 2015 had benefited from an exceptional volume of large orders, specifically the order of Rafale fighter jets by Egypt and signalling contracts for the Doha and Hong Kong metro systems, for a total amount of €1,733 million.
Orders with a unit value of less than €100 million remained dynamic, posting growth of 9%.
From a geographical point of view3, orders were, quite naturally, down in emerging markets (€1,617 million, -35%), where the clients behind the three major orders quoted above were located. Mature markets posted a slight growth (€3,806 million, organic growth of +3%, led by Europe, +9%).
Order intake for the Aerospace segment rose sharply to €2,218 million compared to €1,851 million in the first half of 2015 (+20%). Avionics orders rose, sustained in particular by military avionics. In-flight entertainment (IFE) remained dynamic, but no large orders were placed during the half-year. The Space segment is still benefiting from good sales momentum, particularly with the placing of an order for a military satellite for a client in the Middle East, as quoted above.
At €507 million, order intake in the Transport segment is down 58% compared to the first half of 2015, when the Group won two large urban rail signalling contracts in Doha and Hong Kong.
Order intake in the Defence & Security segment stood at €2,665 million compared to €3,150 million for the first half of 2015 (-15%). It is logically lower since in the first half of 2015, a “jumbo” contract (with a unit value over €500 million) was placed: the contract for systems and equipment as part of the order of 24 Rafale fighter jets by Egypt. Excluding this contract, orders in this segment are on the increase, confirming the Group’s continuing sound commercial momentum.
1 Mature markets: Europe, North America, Australia, New Zealand; emerging markets: all other countries. See page 13
2 Given a negative exchange rate effect of €103 million and a net positive scope effect of €35 million, mainly related to the consolidation of Vormetric on
16 March 2016 (Defence & Security segment). 3 See table on page 13

8
SALES
€ million
H1 2016 H1 2015 Total change Organic change
Aerospace 2,667 2,512 +6.2% +6.8%
Transport 717 569 +26.1% +29.2%
Defence & Security 3,421 3,228 +6.0% +6.9%
Total – operating segments 6,806 6,309 +7.9% +8.9%
Other 40 38
Total 6,846 6,347 +7.9% +8.9%
Of which mature markets 4,856 4,594 +5.7% +6.8%
Of which emerging markets 1,990 1,753 +13.5% +14.2%
Sales for the first half of 2016 stood at €6,846 million, compared to €6,347 million for the first half of 2015, up 7.9% on a reported basis1
, and up 8.9% at constant scope and exchange rates (“organic” change), driven by an excellent momentum in all segments.
From a geographical perspective2, this good performance is explained both by continued strong growth in emerging markets (+14.2%, following on from +21.4% in the first half of 2015) and organic growth on mature markets (+6.8% after +0.6% in the first half of 2015).
Sales in the Aerospace segment totalled €2,667 million, an increase of 6.2% compared with the first half of 2015 (+6.8% at constant scope and exchange rates). The Avionics segment remained strong, particularly in commercial and military aircraft, while IFE returned to high growth in the second quarter following a first quarter impacted by a particularly high basis for comparison. Avionics sales for helicopters, which started to slow in the second quarter of 2015, were still down over the half-year. Sales in the Space segment were up sharply, thanks to contracts signed in 2014 and 2015, specifically in observation activities and in the field of telecom constellation.
In the Transport segment, sales amounted to €717 million, up 26.1% compared to the first half of 2015 (+29.2% at constant scope and exchange rates). This high growth reflects the start of invoicing on the three major projects won last year, combined with a recovery following a first half of 2015 affected by execution difficulties. Growth will nevertheless be significantly lower in the second half of 2016, given that the basis for comparison will be significantly higher (organic growth in H1 2015: -5%, in H2 2015: +11%).
Sales in the Defence & Security segment totalled €3,421 million, an increase of 6.0% compared with the first half of 2015 (+6.9% at constant scope and exchange rates). Almost all businesses contributed to this momentum. The Land & Air Systems segment posted strong growth, specifically in air defence, civil and military radars, and air traffic management (ATM). The Defence Mission Systems segment benefited from high levels of business in fighter aircraft systems as well as surface ship systems. Only the Secure Communications and Information Systems segment witnessed a slowdown, following the delivery last year of several large projects, such as the new French Ministry of Defence site (“Balard”), in part offset by good momentum in radiocommunications.
1 Taking into account a negative exchange rate effect of €88 million and a net positive scope effect of €32 million, mainly related to the consolidation of
Vormetric on 16 March 2016 (Defence & Security segment). 2 See table on page 14

9
ADJUSTED RESULTS
EBIT
EBIT, € million
H1 2016 H1 2015 Total change Organic change
Aerospace 239 224 +7% +8%
in % of sales 9.0% 8.9%
Transport -12 -39 - -
in % of sales -1.6% -6.9%
Defence & Security 335 301 +11% +15%
in % of sales 9.8% 9.3%
Total – operating segments 562 485 +16% +18%
in % of sales 8.3% 7.7%
Others – excluding DCNS -30 -22
Total – excluding DCNS 532 463 +15% +17%
in % of sales 7.8% 7.3%
DCNS (35% share) 20 10
Total 551 473 +17% +19%
in % of sales 8.1% 7.5%
In the first half of 2016, the Group’s EBIT was €551 million, or 8.1% of sales, compared to €473 million (7.5% of sales) for the same period in 2015.
The Aerospace segment posted an EBIT of €239 million (9.0% of sales) compared to €224 million (8.9% of sales) for the same period in 2015. The moderate increase in the EBIT margin can be explained by a change in the rules to allocate shared marketing and selling expenses to the operating segments. This change of rule has a negative 0.2 point impact on the EBIT margin in this segment, offset by a non-material increase in the other segments.
EBIT in the Transport segment was up sharply, reaching -€12 million (-1.6% of sales), compared to -€39 million (-6.9% of sales) for the first half of 2015. The operational recovery plan implemented by the new management team continued as expected, but low or zero margin contracts still weighed down on profitability. After 2016, which should see break-even achieved, the impact of the recovery plan should allow this business to gradually return to profitability in the coming years.
EBIT for the Defence & Security segment increased significantly, totalling €335 million (9.8% of sales) compared to €301 million in the first half of 2015 (9.3% of sales). In addition to the satisfactory execution of contracts, the increase in margins was driven by the good sales momentum, with the strengthening of R&D expenditure being offset by savings made on commercial and administrative costs, and a reduction in restructuring expenses.
The contribution made by DCNS to EBIT amounted to €20 million for the first half of 2016, compared to €10 million for the first half of 2015. The industrial transformation plan is continuing as expected. Over 2016, DCNS expects net profit to grow by around 10–15% in comparison to 2015.

10
Adjusted financial income
At €1 million for the first half of 2016 compared to €5 million for the first half of 2015, net financial interest remained very low, as did other adjusted financial income (expense) (-€4 million in H1 2016 compared to +€2 million in H1 2015). The adjusted finance cost on pensions and other long-term benefits is stable (-€34 million
versus -€35 million for H1 2015), with the reduction in the deficit and changes in exchange rates offsetting the impact of lower discount rates.
Adjusted net income
The adjusted net income, Group share thus stood at €367 million, compared to €313 million in the first half of 2015, after an adjusted tax charge of -€117 million compared to -€109 million in the first half of 2015. The effective tax rate reached 26%, compared to 28% in H1 2015.
Adjusted net income, Group share, per share1 stood at €1.74, up 15% compared to the first half of 2015 (€1.51).
CONSOLIDATED RESULTS
Income from operations
After accounting for the €40 million impact of purchase price allocation (PPA), compared to €53 million in the first half last year, reported income from operations was €435 million, compared to €360 million at 30 June 2015 (representing a 21% increase).
Income of operating activities before share in net income (loss) from equity affiliates was at €530 million, compared to €357 million at 30 June 2015, mainly due to the disposal of interests held in Thales Raytheon Systems LLC (€92 million).
Income of operating activities after share in net income (loss) of equity affiliates
The share in net income (loss) of equity affiliates comes to €56 million, compared to €47 million during the first half of 2015. Income of operating activities after share in net income from equity affiliates therefore comes to €586million, compared to €404 million for the same period last year.
Net financial income/(expense)
Net interest expense was a positive €1 million compared to €5 million in the first half of 2015. Other financial expenses were -€49 million, compared to -€13 million in the first half of 2015, mainly due to a negative impact of change in fair value of derivative exchange instruments (-€46 million against -€15 million). Finance costs on pensions and other employee benefits amounted to -€48 million compared to -€25 million for the first six months of 2015, essentially because of negative actuarial differences due to the decrease of long term rates in UK..
Net income (loss)
The first half of 2016 closed with consolidated net earnings, Group share of €384 million, after an income tax charge of -€80 million compared to -€88 million. Net earnings per share came to €1.82 compared to €1.28 at the end of June 2015.

11
FINANCIAL POSITION AT 30 JUNE 2016
At €45 million, the free operating cash flow for the first half of 2016 is positive, driven by the solid performance achieved in terms of working capital requirements. At 30 June 2016, net cash stood at €1,439 million, down €539 million compared to 31 December 2015, but up €825 million over 12 months (€614 million at 30 June 2015).
€ million H1 2016 H1 2015
Operating cash-flow before interest and tax 704 683
Changes in Working Capital Requirements and in reserves for contingencies
(337) (697)
Payment of pension benefits, excluding contributions related to the reduction of the UK pension deficit
(52) (60)
Net financial interest paid (5) 10
Income tax paid (39) (42)
Net cash flow from operating activities, excluding contributions related to the reduction of the UK pension deficit
271 (106)
Net operating investments (226) (198)
Free operating cash-flow 45 (304)
Net (acquisitions)/disposals (281) (20)
Contributions related to the reduction of the UK pension deficit (45) (46)
Dividends (212) (161)
Exchange rate and other (46) 138
Change in net cash (539) (392)
At 30 June 2016, net cash amounted to €1,439 million compared to €614 million at 30 June 2015 and €1,978 million at 31 December 2015, after the distribution of €212 million in dividends during the half-year (€161 million in H1 2015), the acquisition of Vormetric, completed in March (€372 million), and the cash inflow in connection with the change in scope of the Thales Raytheon Systems joint venture (€81 million).
Shareholders’ equity, Group share, stood at €4,458 million, compared to €4,646 million at 31 December 2015, with consolidated net income, Group share (€384 million) only partially offsetting the increase in net pension obligations and the distribution of dividends.
RELATED PARTY TRANSACTIONS
Main related party transactions are disclosed in note 14 of the consolidated financial statements included in the 2015 registration document.
Revenues with the French Ministry of Defence amounted to € 990.7 million in the first half of 2016 and € 937.2 million in the first half of 2015.
At 30 June 2016, mature receivables bearing interest on overdue payments from the DGA (French defence procurement agency) amounted to € 34.9 million (€ 51.3 million at 30 June 2015 and € 178.3 million at 31 December 2015).

12
MAIN RISKS AND UNCERTAINTIES IN THE SECOND HALF OF 2016
FISCAL YEAR
There are no material changes in risks and uncertainties that are described in the Group management report for 2015 ("1.1.2 Risk Factors" pages 14-24 of the 2015 Registration Document filed with the Autorité des Marchés Financiers (AMF) on 31 March 2016).
OUTLOOK FOR THE CURRENT YEAR
The results for the first half of the year are in line with expectations. In this context, the Group confirms all its
objectives, as set out below.
After the record level seen in 2015, new orders are expected to remain high in 2016, close to the level observed in
2013–20141. Sales should see a mid-single digit organic growth compared to 2015.
This positive trend, combined with continuing efforts to improve competitiveness, should result in Thales posting an
EBIT of between €1,300 and €1,330 million (based on exchange rates in February 2016), which will represent an
increase of between 7% and 9% compared to 2015.
In this context, Thales targets a mid-single digit organic sales growth in 2017 and 2018, and an EBIT margin of 9.5–
10% over the same time frame.
1 Average 2013–14 order intake: €13.6 billion

13
NOTES TO THE REPORT ON OPERATIONS AND RESULTS FOR THE
FIRST HALF OF 2016
Operating segments
Aerospace Avionics, Space
Transport Ground Transportation Systems
Defence & Security Secure Communications and Information Systems, Land & Air Systems,
Defence Mission Systems
Order intake by destination – H1 2016
€ million
H1 2016 H1 2015 Total change Organic change
H1 2016 weighting
in %
France 1,201 1,225 -2% -2% 22%
United Kingdom 463 513 -10% -4% 9%
Rest of Europe 1,304 1,031 +27% +27% 24%
Sub-total Europe 2,968 2,769 +7% +9% 55%
United States and Canada 492 564 -13% -18% 9%
Australia and New Zealand 346 399 -13% -9% 6%
Total mature markets 3,806 3,732 +2% +3% 70%
Asia 659 665 -1% -1% 12%
Middle East 755 1,688 -55% -55% 14%
Rest of the world 203 139 +46% +52% 4%
Total emerging markets 1,617 2,492 -35% -34% 30%
Total all markets 5,423 6,224 -13% -12% 100%

14
Sales by destination – H1 2016
€ million
H1 2016 H1 2015 Total change Organic change
H1 2016 weighting
in %
France 1,661 1,569 +5.9% +5.9% 24%
United-Kingdom 623 638 -2.4% +4.1% 9%
Rest of Europe 1,417 1,263 +12.2% +13.1% 21%
Sub-total Europe 3,701 3,470 +6.7% +8.2% 54%
United States and Canada 780 759 +2.7% -0.3% 11%
Australia and New Zealand 375 365 +2.8% +8.1% 5%
Total mature markets 4,856 4,594 +5.7% +6.8% 71%
Asia 953 842 +13.2% +13.8% 14%
Middle East 804 647 +24.3% +24.8% 12%
Rest of the world 233 265 -11.8% -10.4% 3%
Total emerging markets 1,990 1,753 +13.5% +14.2% 29%
Total all markets 6,846 6,347 +7.9% +8.9% 100%
15
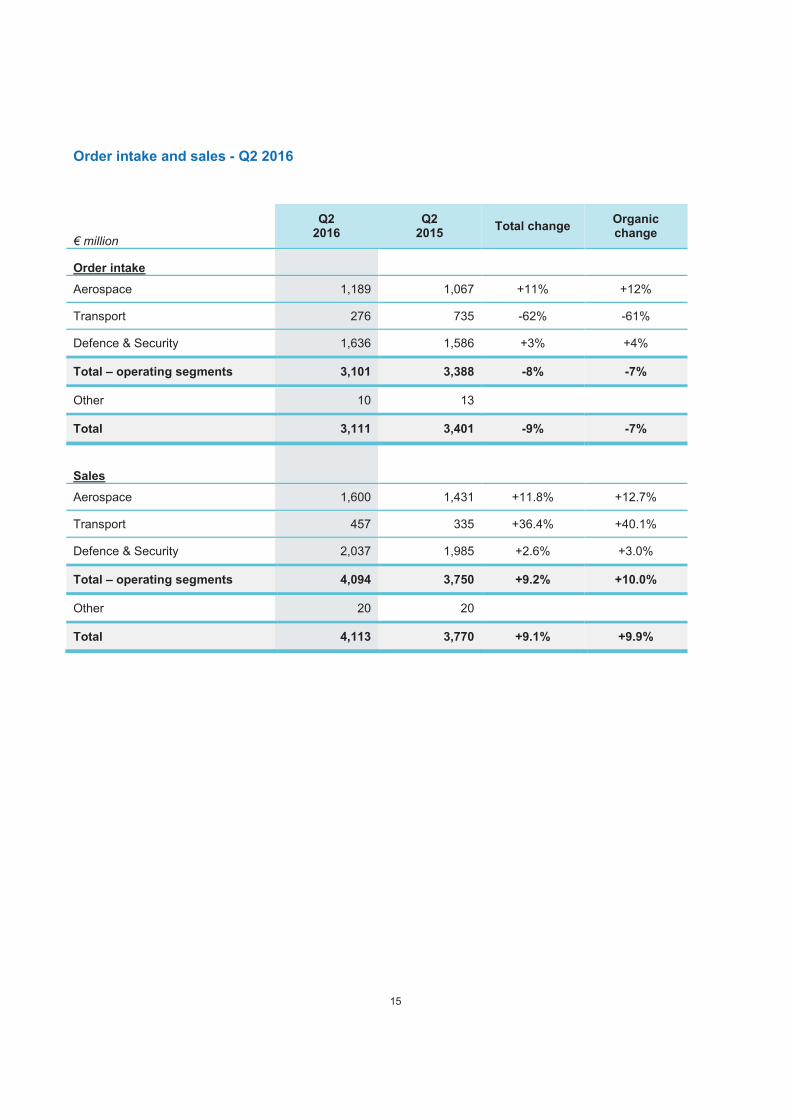
Order intake and sales - Q2 2016
€ million
Q2 2016
Q2 2015
Total change Organic change
Order intake
Aerospace 1,189 1,067 +11% +12%
Transport 276 735 -62% -61%
Defence & Security 1,636 1,586 +3% +4%
Total – operating segments 3,101 3,388 -8% -7%
Other 10 13
Total 3,111 3,401 -9% -7%
Sales
Aerospace 1,600 1,431 +11.8% +12.7%
Transport 457 335 +36.4% +40.1%
Defence & Security 2,037 1,985 +2.6% +3.0%
Total – operating segments 4,094 3,750 +9.2% +10.0%
Other 20 20
Total 4,113 3,770 +9.1% +9.9%

CONDENSED INTERIM CONSOLIDATED
FINANCIAL STATEMENTS
AT 30 JUNE 2016

-17-
SUMMARY
INTERIM CONSOLIDATED PROFIT AND LOSS ACCOUNT ............................................................................................. 18
INTERIM CONSOLIDATED STATEMENT OF COMPREHENSIVE INCOME ....................................................................... 19
INTERIM CONSOLIDATED STATEMENT OF CHANGES IN EQUITY ................................................................................ 20
INTERIM CONSOLIDATED BALANCE SHEET ................................................................................................................ 21
INTERIM CONSOLIDATED STATEMENT OF CASH FLOWS ............................................................................................ 22
NOTES TO THE CONSOLIDATED FINANCIAL STATEMENTS.......................................................................................... 23
1. ACCOUNTING STANDARDS FRAMEWORK......................................................................................................... 23
BASIS OF PREPARATION OF THE CONDENSED INTERIM CONSOLIDATED FINANCIAL STATEMENTS........................................................ 23 1.1
NEW IFRS STANDARDS MANDATORILY APPLICABLE AT 30 JUNE 2016 ....................................................................................... 24 1.2
2. SEGMENT INFORMATION ................................................................................................................................. 24
2.1 INFORMATION BY BUSINESS SEGMENT ................................................................................................................................. 25
2.2 ADJUSTED RESULTS .......................................................................................................................................................... 26 2.3 INFORMATION BY COUNTRY/REGION OF DESTINATION ............................................................................................................ 27
3. IMPACT OF CHANGES IN SCOPE OF CONSOLIDATION ....................................................................................... 28
MAIN CHANGES IN SCOPE OF CONSOLIDATION....................................................................................................................... 28 3.1
DISPOSAL OF ASSETS, CHANGES IN SCOPE OF CONSOLIDATION AND OTHER .................................................................................. 28 3.2
4. TANGIBLE AND INTANGIBLE ASSETS ................................................................................................................. 29
4.1 GOODWILL .................................................................................................................................................................... 29
4.2 TANGIBLE AND INTANGIBLE ASSETS ..................................................................................................................................... 30
5. INVESTMENTS IN JOINT VENTURES AND ASSOCIATES ..................................................................................... 30
5.1 JOINT VENTURES ............................................................................................................................................................. 30
5.2 INVESTMENTS IN ASSOCIATES ............................................................................................................................................. 31
6 FINANCING AND FINANCIAL INSTRUMENTS ..................................................................................................... 32
6.1 OTHER FINANCIAL INCOME (EXPENSE) ................................................................................................................................. 32
6.2 NET CASH (NET DEBT) ...................................................................................................................................................... 32 6.3 SUMMARY OF FINANCIAL ASSETS AND LIABILITIES ................................................................................................................... 32
7. CHANGE IN NET CASH (NET DEBT) .................................................................................................................... 35
7.1 CHANGES IN WORKING CAPITAL REQUIREMENTS .................................................................................................................... 35 7.2 RESERVES FOR CONTINGENCIES (EXCLUDING CONSTRUCTION CONTRACTS) .................................................................................. 36
7.3 NET FINANCIAL INVESTMENT ............................................................................................................................................. 36
8. PENSIONS AND OTHER LONG-TERM BENEFITS ................................................................................................. 37
9. INCOME TAX .................................................................................................................................................... 38
10. EQUITY AND EARNINGS PER SHARE ................................................................................................................. 38
10.1 SHAREHOLDERS’ EQUITY ................................................................................................................................................. 38 10.2 EARNINGS PER SHARE ..................................................................................................................................................... 40
11. LITIGATION....................................................................................................................................................... 40
12. RELATED PARTY TRANSACTIONS ...................................................................................................................... 40
13. EVENTS AFTER REPORTING PERIOD .................................................................................................................. 40

-18-
INTERIM CONSOLIDATED PROFIT AND LOSS ACCOUNT
First First Full
half half Year
(€ Million) Notes 2016 2015 2015
Sales note 2 6,845.6 6,346.6 14,063.2
Cost of sales (5,211.9) (4,827.0) (10,688.1)
Research and development expenses (326.7) (310.4) (692.0)
Marketing and selling expenses (528.2) (494.6) (980.9)
General and administrative expenses (270.0) (259.0) (531.8)
Restructuring costs (34.0) (42.5) (94.3)
Amortisation of intangible assets acquired (PPA) * (39.7) (52.8) (111.6)
Income from operations note 2 435.1 360.3 964.5
Disposal of assets, change in scope of consolidation and other note 3.2 95.3 (3.1) 53.4
Impairment of non-current operating assets note 4 -- -- --
Income of operating activities before impact of equity affiliates 530.4 357.2 1,017.9
Share in net income (loss) of equity affiliates 56.0 46.5 112.8
of which, share in net income of joint-ventures note 5.1 29.9 14.9 55.8
of which, share in net income of associates note 5.2 26.1 31.6 57.0
Income of operating activities after impact of equity affiliates 586.4 403.7 1,130.7
Financial interests on gross debt (6.5) (8.7) (15.5)
Financial income from cash at bank and equivalents 7.7 13.7 19.3
Financial interests, net 1.2 5.0 3.8
Other financial income (expense) note 6.1 (49.3) (13.2) (41.8)
Finance costs on pensions and other employee benefits note 8 (48.3) (25.3) (60.1)
Income tax note 9 (80.4) (87.9) (219.9)
Net income (loss) 409.6 282.3 812.7
Attributable to:
Shareholders of the parent company 383.8 266.0 765.1
Non-controlling interests 25.8 16.3 47.6
Basic earnings per share (in euros) note 10.2 1.82 1.28 3.68
Diluted earnings per share (in euros) note 10.2 1.80 1.28 3.63
* This line corresponds to acquired intangible assets amortisation (Purchase Price Allocation: PPA) of fully consolidated entities. The amortisation of PPA related to entities consolidated under equity method is included in the share in net income (loss) of equity affiliates and detailled in note 2.2.

-19-
I
NT
ER
IM C
ON
SO
LID
AT
ED
ST
AT
EM
EN
T O
F C
OM
PR
EH
EN
SIV
E I
NC
OM
E
(€ M
illio
n)
Sh
are
ho
lde
rs
of th
e p
are
nt
co
mp
an
y
No
n-
co
ntr
ollin
g
inte
res
ts
To
tal
Sh
are
ho
lde
rs
of th
e p
are
nt
co
mp
an
y
No
n-
co
ntr
ollin
g
inte
res
ts
To
tal
Sh
are
ho
lde
rs
of th
e p
are
nt
co
mp
an
y
No
n-
co
ntr
ollin
g
inte
res
ts
To
tal
Ne
t in
co
me
(lo
ss
) fo
r th
e p
eri
od
38
3.8
25
.84
09
.62
66
.01
6.3
28
2.3
76
5.1
47
.68
12
.7
Cu
mu
lative
tra
ns
latio
n a
dju
stm
en
t1
.0(0
.4)
0.6
10
.40
.81
1.2
9.6
1.3
10
.9
De
ferr
ed
ta
x--
----
----
--(1
.3)
--(1
.3)
Jo
int -v
en
ture
s(6
.4)
--(6
.4)
17
.1--
17
.11
1.6
--1
1.6
As
so
cia
tes
(34
.9)
--(3
4.9
)2
3.6
--2
3.6
27
.6--
27
.6
Ne
t(4
0.3
)(0
.4)
(40
.7)
51
.10
.85
1.9
47
.51
.34
8.8
Ca
sh
flo
w h
ed
ge
14
4.1
8.1
15
2.2
(14
4.3
)(8
.3)
(15
2.6
)(1
86
.9)
(4.1
)(1
91
.0)
De
ferr
ed
ta
x(4
0.7
)(3
.1)
(43
.8)
52
.23
.35
5.5
44
.31
.44
5.7
Jo
int -v
en
ture
s(1
.2)
--(1
.2)
(6.7
)--
(6.7
)0
.8--
0.8
As
so
cia
tes
1.8
--1
.8(1
4.0
)--
(14
.0)
(16
.5)
--(1
6.5
)
Ne
t1
04
.05
.01
09
.0(1
12
.8)
(5.0
)(1
17
.8)
(15
8.3
)(2
.7)
(16
1.0
)
Fin
ancia
l assets
ava
ilable
-for-
sale
----
----
----
0.6
--0
.6
Ne
t--
----
----
0.6
--0
.6
Ite
ms
to
be
su
bs
eq
ue
ntl
y r
ec
las
sif
ied
to
P&
L6
3.7
4.6
68
.3(6
1.7
)(4
.2)
(65
.9)
(11
0.2
)(1
.4)
(11
1.6
)
Actu
ari
al g
ain
s (
los
se
s)
on
pe
ns
ion
s: s
ub
sid
iari
es
(45
5.8
)(0
.9)
(45
6.7
)3
01
.91
.23
03
.12
68
.92
.62
71
.5
De
ferr
ed
ta
x4
3.2
0.2
43
.4(6
1.7
)(0
.5)
(62
.2)
5.9
(0.8
)5
.1
Jo
int -v
en
ture
s--
----
(1.1
)--
(1.1
)5
.1--
5.1
As
so
cia
tes
0.5
--0
.50
.1--
0.1
(1.9
)--
(1.9
)
Ite
ms
th
at
will n
ot
be
re
cla
ss
ifie
d t
o P
&L
(41
2.1
)(0
.7)
(41
2.8
)2
39
.20
.72
39
.92
78
.01
.82
79
.8
Oth
er
co
mp
reh
en
siv
e in
co
me
(lo
ss
) fo
r th
e p
eri
od
ne
t
of
tax
(34
8.4
)3
.9(3
44
.5)
17
7.5
(3.5
)1
74
.01
67
.80
.41
68
.2
To
tal c
om
pre
he
ns
ive
in
co
me
(lo
ss
) fo
r th
e p
eri
od
35
.42
9.7
65
.14
43
.51
2.8
45
6.3
93
2.9
48
.09
80
.9
Fir
st
ha
lf 2
01
6Fu
ll y
ea
r 2
01
5
To
tal a
ttri
bu
tab
le t
o:
To
tal a
ttri
bu
tab
le t
o:
Fir
st
ha
lf 2
01
5
To
tal a
ttri
bu
tab
le t
o:
-20-
INT
ER
IM C
ON
SO
LID
AT
ED
ST
AT
EM
EN
T O
F C
HA
NG
ES
IN
EQ
UIT
Y
(€ M
illio
n)
Num
be
r o
f
sh
are
s
ou
tsta
nd
ing
(th
ou
sa
nd
s)
Sh
are
ca
pita
l
Pa
id-i
n
su
rplu
s
Reta
ine
d
ea
rnin
gs
Cash
flo
w
he
dg
e
AF
S
inve
stm
en
ts
Cum
ula
tive
tra
nsla
tio
n
ad
justm
en
t
Tre
asu
ry
sh
are
s
To
tal
att
rib
. to
sh
are
ho
lde
rs o
f
the
pa
ren
t
co
mp
an
y
Non
co
ntr
olli
ng
inte
rests
To
tal
At
1 J
an
ua
ry 2
01
62
10
,12
26
32
.93
,99
5.4
40
4.6
(27
6.8
)2
.2(8
7.2
)(2
5.2
)4
,64
5.9
29
5.9
4,9
41
.8
Net
inco
me
(lo
ss)
of
the
pe
rio
d--
----
38
3.8
----
----
38
3.8
25
.84
09
.6O
the
r co
mp
reh
en
siv
e in
co
me
(lo
ss)
----
--(4
12
.1)
10
4.0
--(4
0.3
)--
(34
8.4
)3
.9(3
44
.5)
To
tal
co
mp
reh
en
siv
e i
nc
om
e (
los
s)
for
firs
t h
alf
20
16
----
--(2
8.3
)1
04
.0--
(40
.3)
--3
5.4
29
.76
5.1
Em
plo
ye
e s
ha
re issu
es
74
72
.22
4.9
----
----
--2
7.1
--2
7.1
Pa
ren
t co
mp
an
y d
ivid
en
d d
istr
ibu
tio
n--
----
(21
2.3
)--
----
--(2
12
.3)
--(2
12
.3)
Th
ird
pa
rty s
ha
re in
div
ide
nd
dis
trib
utio
ns o
f
su
bsid
iari
es
----
----
----
----
--(4
7.5
)(4
7.5
)
Sh
are
-ba
se
d p
aym
en
ts--
----
7.9
----
----
7.9
--7
.9A
cq
uis
itio
ns/d
isp
osa
ls o
f tr
ea
su
ry s
ha
res
41
----
1.4
----
--0
.82
.2--
2.2
Acq
uis
itio
n o
f n
on
-co
ntr
olli
ng
in
tere
st
in T
RS
SA
S--
----
(52
.8)
----
----
(52
.8)
(85
.8)
(13
8.6
)O
the
r--
----
3.8
----
1.1
--4
.9(1
.5)
3.4
At
30
Ju
ne
20
16
21
0,9
10
63
5.1
4,0
20
.31
24
.3(1
72
.8)
2.2
(12
6.4
)(2
4.4
)4
,45
8.3
19
0.8
4,6
49
.1
(€ M
illio
n)
Num
be
r o
f
sh
are
s
ou
tsta
nd
ing
(th
ou
sa
nd
s)
Sh
are
ca
pita
l
Pa
id-i
n
su
rplu
s
Reta
ine
d
ea
rnin
gs
Cash
flo
w
he
dg
e
AF
S
inve
st
me
nts
Cum
ula
tive
tra
nsla
tio
n
ad
justm
en
t
Tre
asu
ry
sh
are
s
To
tal
att
rib
. to
sh
are
ho
lde
rs o
f
the
pa
ren
t
co
mp
an
y
Non
co
ntr
olli
ng
inte
rests
To
tal
At
1 J
an
ua
ry 2
01
52
05
,96
46
23
.53
,89
9.9
(42
1.2
)(1
18
.5)
1.6
(13
4.7
)(5
8.9
)3
,78
1.7
29
9.1
4,0
80
.8
Net
inco
me
(lo
ss)
of
the
pe
rio
d--
----
26
6.0
----
----
26
6.0
16
.32
82
.3O
the
r co
mp
reh
en
siv
e in
co
me
(lo
ss)
----
--2
39
.2(1
12
.8)
--5
1.1
--1
77
.5(3
.5)
17
4.0
To
tal
co
mp
reh
en
siv
e i
nc
om
e (
los
s)
for
firs
t h
alf
20
15
----
--5
05
.2(1
12
.8)
--5
1.1
--4
43
.51
2.8
45
6.3
Em
plo
ye
e s
ha
re issu
e2
,32
27
.07
7.8
----
----
--8
4.8
--8
4.8
Pa
ren
t co
mp
an
y d
ivid
en
d d
istr
ibu
tio
n--
----
(16
0.7
)--
----
--(1
60
.7)
--(1
60
.7)
Th
ird
pa
rty s
ha
re in
div
ide
nd
dis
trib
utio
ns o
f
su
bsid
iari
es
----
----
----
----
--(5
1.2
)(5
1.2
)
Sh
are
-ba
se
d p
aym
en
ts--
----
7.5
----
----
7.5
--7
.5A
cq
uis
itio
ns /
dis
po
sa
ls o
f tr
ea
su
ry s
ha
res
(43
)--
--0
.8--
----
(3.0
)(2
.2)
--(2
.2)
Oth
er
----
--1
.3--
----
--1
.30
.21
.5
4,1
55
.94
,41
6.8
At
30
Ju
ne
20
15
20
8,2
43
63
0.5
3,9
67
.7(6
7.1
)(2
31
.3)
1.6
(83
.6)
(61
.9)
4,1
55
.92
06
.94
,41
6.8

-21-
INTERIM CONSOLIDATED BALANCE SHEET (€ Million)
ASSETS Notes 30/06/16 31/12/15
Goodwill, net note 4.1 3,576.5 3,215.9
Other intangible assets, net note 4.2 802.3 862.9
Tangible assets, net note 4.2 1,721.8 1,696.7
Total non-current operating assets 6,100.6 5,775.5
Investment in joint-ventures note 5.1 1,108.5 1,126.4
Investment in associates note 5.2 209.9 359.5
Non consolidated investments 69.0 71.1
Other non-current financial assets 129.2 131.2
Total non-current financial assets 1,516.6 1,688.2
Non-current derivatives - assets note 6.2 33.4 36.2
Deferred tax assets 916.9 967.0
Non-current assets 8,567.5 8,466.9
Inventories and work in progress 2,723.2 2,560.8
Construction contracts assets 2,483.8 2,042.6
Advances to suppliers 377.8 383.0
Accounts, notes and other current receivables 4,366.4 4,404.2
Current derivatives - assets 160.1 154.2
Total current operating assets note 7.1 10,111.3 9,544.8
Current tax receivables 61.0 70.8
Current financial assets 15.2 27.5
Current derivatives - assets 8.5 --
Cash at bank and equivalents 3,523.8 3,450.2
Total current financial assets note 6.2 3,547.5 3,477.7
Current assets 13,719.8 13,093.3
TOTAL ASSETS 22,287.3 21,560.2
EQUITY AND LIABILITIES Notes 30/06/16 31/12/15
Capital, paid-in surplus and other reserves 4,609.1 4,758.3
Cumulative translation adjustment (126.4) (87.2)
Treasury shares (24.4) (25.2)
Total attributable to shareholders of the parent company 4,458.3 4,645.9
Non-controlling interests 190.8 295.9
Total equity note 10.1 4,649.1 4,941.8
Financial debt: long-term note 6.2 1,440.3 837.6
Provisions for pensions and other employee benefits note 8 2,643.5 2,318.9
Deferred tax liabilities 247.0 257.9
Non-current liabilities 4,330.8 3,414.4
Advances received from customers on contracts 4,701.5 4,317.2
Refundable grants 127.2 127.6
Construction contracts liabilities 1,075.2 1,021.0
Reserves for contingencies 996.6 1,022.9
Accounts, notes and other current payables 5,330.1 5,547.6
Current derivatives - liabilities 322.6 405.3
Total current operating liabilities note 7.1 12,553.2 12,441.6
Current tax payables 52.3 63.7
Financial debt: short-term note 6.2 701.9 698.7
Current liabilities 13,307.4 13,204.0
TOTAL EQUITY AND LIABILITIES 22,287.3 21,560.2

-22-
INTERIM CONSOLIDATED STATEMENT OF CASH FLOWS
The Group’s net cash positions and variations are presented in notes 6.2 and 7
First First
half half
(€ Million) Notes 2016 2015 2015
Net income (loss) 409.6 282.3 812.7Add (deduct)
Income tax expense (gain) 80.4 87.9 219.9
Financial interests, net expense (gain) (1.2) (5.0) (3.8)
Share in net (income) loss of equity affiliates (56.0) (46.5) (112.8)
Dividends received from equity-accounted, joint-ventures note 5.1 26.9 28.5 51.8
Dividends received from equity-accounted, associates note 5.2 15.1 19.0 31.6
Depreciation and amortisation of tangible and intangible assets note 4.2 228.2 236.7 492.9
Provisions for pensions and other employee benefits note 8 95.4 79.2 165.9
Loss (gain) on disposals of assets and other (95.3) 3.1 (53.4)
Net allowances to restructuring provisions (13.3) (13.2) (16.8)
Other items 14.1 10.9 54.9
Operating cash flows before working capital changes, interests and tax 703.9 682.9 1,642.9
Change in working capital requirement and in reserves for contingencies note 7.1 (337.3) (696.5) 143.0
Payment of contributions / pensions benefits (defined benefit plans): (96.9) (105.8) (225.1)
- related to reduction of the UK deficit (45.2) (45.9) (101.0)- related to future service (recurrent contributions) (51.7) (59.9) (124.1)
Financial interests paid (11.0) (12.3) (25.3)
Financial interests received 6.5 22.2 34.5
Income tax paid (39.2) (42.0) (102.3)
Net cash flows from operating activities - I - 226.0 (151.5) 1,467.7
Capital expenditure on tangible and intangible assets (230.2) (201.8) (473.4)
Proceeds from disposal of tangible and intangible assets 4.1 3.9 15.1
Net operating investment note 4.2 (226.1) (197.9) (458.3)
Acquisitions of subsidiaries, net note 7.3 (367.8) (32.3) (51.2)
Disposals of subsidiaries, net note 7.3 87.0 12.0 87.8
Decrease (increase) in loans and non-current financial assets (14.3) 20.6 23.3
Decrease (increase) in other current financial assets 12.1 (1.2) 15.2
Net financial investment (283.0) (0.9) 75.1
Net cash flows from investing activities - II - (509.1) (198.8) (383.2)
Parent company dividend distribution note 10 (212.3) (160.7) (234.0)
Third party share in dividend distributions of subsidiaries (47.5) (51.2) (51.3)
Increase in equity (exercise of subscription options) 27.4 74.6 116.2
Purchase / sale of treasury shares 11.6 (2.4) 9.2
Increase in financial debt 622.8 63.6 40.4
Repayment of financial debt (50.2) (17.5) (2.5)
Net cash flows from financing activities - III - 351.8 (93.6) (122.0)
Effect of exchange rate changes and other - IV - 4.9 15.6 6.3
Total increase (decrease) in cash at bank and equivalents I+II+III+IV 73.6 (428.3) 968.8
Cash at bank and equivalents at beginning of period 3,450.2 2,481.4 2,481.4
Cash at bank and equivalent at end of period 3,523.8 2,053.1 3,450.2
Full year

-23-
NOTES TO THE CONSOLIDATED FINANCIAL STATEMENTS
All monetary amounts included in these notes are expressed in € million.
1. ACCOUNTING POLICIES On July 21
st 2016, the Board of Directors approved and authorised for issue Thales’ condensed interim
consolidated financial statements for the six months ended 30 June 2016.
Thales Parent Company is a listed French société anonyme, registered with the Nanterre commercial registrary (Registre du Commerce et des Sociétés de Nanterre) under the number 552 059 024.
BASIS OF PREPARATION OF THE CONDENSED INTERIM CONSOLIDATED FINANCIAL 1.1STATEMENTS
The condensed interim consolidated financial statements for the six months ended 30 June 2016 have been prepared in accordance with IAS 34 “Interim financial reporting” and with the International Financial Reporting Standards (IFRS) as adopted by the European Union at 30 June 2016
1.
The condensed interim consolidated financial statements have been prepared using the same accounting policies as those used to prepare the full-year financial statements at 31 December 2015, as detailed in the Registration Document 2015 (see notes 1 and 14 of the consolidated financial statements). In particular, the new mandatory standards applicable as from 1 January 2016 (annual improvements for 2010-2012, then 2012-2014 cycles, amendments to IAS 16 and IAS 38, amendments to IFRS 11 and amendments to IAS 19) have no impact on the Group’s financial statements. The specific provisions relating to the preparation of interim financial statements are described hereafter.
a) Measurement procedures used for the condensed interim consolidated financial statements
Pensions and other long-term benefits
Pension costs for interim periods are recognized based on the actuarial valuations performed at the end of the prior year. When appropriate, these valuations are adjusted to take into account curtailments, settlements or other major non-recurring events that occurred during the period. In addition, pensions and other long-term benefits liabilities are updated in order to reflect material changes impacting the yield on investment-grade corporate bonds in the concerned geographic area (the benchmark used to determine the discount rate), the inflation rate and the actual return on plan assets.
Income taxes
Current and deferred income tax expense for interim periods is calculated at each tax entity level by applying the average estimated annual effective tax rate for the current year to the income for the period. When required, this amount is adjusted to take into account the tax effects of specific events of the period.
Goodwill
Impairment tests are performed for each annual closing, and whenever there is an indication of impairment (note 4.1). Impairment that would be recognised in the first half of the year is not reversible.
b) Seasonality of business
In accordance with accounting policies, revenues are recognised, as at year end, over the period of their realisation. In previous years the level of business has been higher in the last quarter, and particularly in December. Revenues and income from operations have been generally lower in the first half of the year due to the seasonality of business. The company has noted that this phenomenon is of a recurring nature, even though its extent varies from year to year.
1 Available at the following internet address : http://ec.europa.eu/internal_market/accounting/ias/index_en.htm.

-24-
c) Conversion rates
The main closing and average exchange rates for the periods used are the following:
30 June 2016 30 June 2015 31 December 2015
Euros Closing Average Closing Average Closing Average
Australian Dollar 1.4929 1.5116 1.4550 1.4349 1.4897 1.4837
Pound Sterling 0.8265 0.7850 0.7114 0.7272 0.7340 0.7242
Dollar U.S. 1.1102 1.1142 1.1189 1.1113 1.0887 1.1046
NEW IFRS STANDARDS MANDATORILY APPLICABLE AFTER 30 JUIN 2016 1.2
New standards and interpretations issued by the IASB, but not yet mandatorily applicable, are described in the “Accounting standards framework” note to the consolidated financial statements of the 2015 Registration Document. In addition, the following standards have been published during the first six months of 2016:
- amendment for clarification to IFRS 15 (revenue recognition) in April 2016; - amendment to IAS 12 (income tax) in January 2016; - amendment to IAS 7 (cash flow statement) in January 2016.
2. SEGMENT INFORMATION
Operating segments
The operating segments presented by the Group are the following:
§ The Aerospace operating segment combines the “Avionics” and “Space” Global Business Units that develop on-board systems, solutions and services both with governmental (States, Civil Security Organisations, Space agencies) and non-governmental (aircraft manufacturers, airlines, satellite operators) customer bases;
§ The Transport operating segment comprises the “Ground Transportation Systems” Global Business Unit that develops systems and services for an exclusively civil customer base of ground transportation infrastructure operators;
§ The Defence and Security operating segment combines the “Secure Communications and Information Systems”, “Land and Air Systems” and “Defence Mission Systems” Global Business Units that develop equipments, systems and services for the armed and security forces as well as the protection of networks and infrastructures, with an almost exclusively governmental customer base (States, public agencies);
Adjusted income
In order to facilitate better monitoring of its financial and operating performance, the Group’s executives regularly consider two main non-GAAP indicators determined as follows:
§ The EBIT corresponds to income from operations, plus the share in net income of equity affiliates, before the amortisation of intangible assets acquired (purchase price allocation, “PPA”) recorded as part of business combinations. From 1 January 2016, it also excludes other expenses recorded in the income from operations, and directly related to these business combinations, which by their nature are unusual (expenses of € 7.1 million of first half of 2016, nil in 2015). § The adjusted net income, considered as relevant by the Group because it enables non-recurring items to be excluded, corresponds to the consolidated net income attributable to shareholders of the parent company, excluding the following items, net of the corresponding tax effects:
- amortisation of acquired intangible assets (PPA) recorded as part of business combinations ; - other expenses recognised in the income from operations, that are directly related to these business
combinations, which by their nature are unusual; - disposal of assets, changes in scope of consolidation and other ; - changes in fair value of foreign exchange derivatives, recorded in « other financial income » ; - actuarial gains and losses on long-term employee benefits, included in « financial income on pensions
and other employee benefits ».
Reconciliation of these indicators with published financial statements is presented in note 2.2.

-25-
2.1 INFORMATION BY BUSINESS SEGMENT
2016 First half Aerospace TransportDefence &
Security
Oth. elim
and non
allocated
Thales
Consolidated order backlog 9,280.8 4,489.5 16,528.9 74.9 30,374.1
Consolidated new orders 2,218.3 507.1 2,665.2 32.7 5,423.3
Consolidated sales 2,667.3 717.3 3,421.0 40.0 6,845.6
Inter-segment sales 43.8 3.4 137.6 (184.8) --
Total sales 2,711.1 720.7 3,558.6 (144.8) 6,845.6
EBIT 238.7 (11.7) 335.2 (11.0) 551.2
of which share in DCNS -- -- -- 19.6 19.6
of which DCNS excluded 238.7 (11.7) 335.2 (30.6) 531.6
2015 First half restated Aerospace TransportDefence &
Security
Oth. elim
and non
allocated
Thales
Consolidated order backlog 8,200.3 4,333.0 15,070.6 64.4 27,668.3
Consolidated new orders 1,850.6 1,197.0 3,150.4 26.0 6,224.0
Consolidated sales 2,512.4 568.9 3,227.7 37.6 6,346.6
Inter-segment sales 44.7 3.6 117.1 (165.4) --
Total sales 2,557.1 572.5 3,344.8 (127.8) 6,346.6
EBIT 223.6 (39.2) 301.0 (12.4) 473.0
of which share in DCNS -- -- -- 9.6 9.6
of which DCNS excluded 223.6 (39.2) 301.0 (22.0) 463.4
2015 restatedAerospace Transport
Defence &
Security
Oth. elim
and non
allocated
Thales
Consolidated order backlog 9,778.6 4,841.5 17,598.9 73.1 32,292.1
Consolidated new orders 6,281.3 2,826.0 9,701.2 71.4 18,879.9
Consolidated sales 5,387.2 1,519.2 7,078.5 78.3 14,063.2
Inter-segment sales 81.9 10.4 252.9 (345.2) --
Total sales 5,469.1 1,529.6 7,331.4 (266.9) 14,063.2
EBIT 517.8 (36.9) 760.1 (25.3) 1,215.7
of which share in DCNS -- -- -- 21.9 21.9
of which DCNS excluded 517.8 (36.9) 760.1 (47.2) 1,193.8
2015 figures have been restated to take into account activity transfer between two business segments.
Backlog, Order intake and Sales included in "Other, elim and non allocated" column relate to corporate activities (Thales parent company, Thales Global Services, Group R&D centers, facilities management), and to the elimination of transactions between the business segments.
The non-allocated EBIT includes Group’s share (35%) in the net income of DCNS, Corporate income from operations which is not charged back to the segments and the cost of vacant premises. Other costs (mainly results from foreign holding companies which are not charged back and the share-based payments cost) are reallocated to business segments proportionally to their respective ex-Group sales.

-26-
2.2 ADJUSTED RESULTS
2016 first
half
published
Amort. of
acquired
intangible
assets
Oth. expenses
directly related
to business
combinations
(note 3.1)
Disposal
of assets
and other
Change in
fair value/
dérivatives
Actuarial
gains &
losses/other
long-term
benefits
2016 first
half
adjusted
Income from operations 435.1 39.7 7.1 -- -- -- 481.9
Share in net income (loss) of equity aff iliates 56.0 13.3 -- -- -- -- 69.3
EBIT 551 .2
Disposal of assets and other 95.3 -- -- (95.3) -- -- --
Net f inancial interests 1.2 -- -- -- -- -- 1.2
Other f inancial income (expense) (49.3) -- -- -- 45.7 -- (3.6)
Finance costs / pension & oth.employee benefits (48.3) -- -- -- -- 14.7 (33.6)
Income tax (80.4) (13.5) (2.5) 0.1 (15.7) (5.0) (117.0)
Effective tax rate 26.2%
Less, non-controlling interests’ income (25.8) (4.8) -- -- (0.6) -- (31.2)
Net income (expense), Group 383.8 34.7 4.6 (95.2) 29.4 9.7 367.0
Average number of shares outstanding 210,547 210,547Net income (expense) per share, Group 1.82 1.74
2015 first
half
published
Amort. of
acquired
intangible assets
Disposal of
assets and
other
Change in
fair value/
dérivatives
Actuarial gains &
losses/other long-
term benefits
2015 first
half
adjusted
Income from operations 360.3 52.8 -- -- -- 413.1
Share in net income (loss) of equity aff iliates 46.5 13.4 -- -- -- 59.9
EBIT 473.0
Disposal of assets and other (3.1) -- 3.1 -- -- --
Net f inancial interests 5.0 -- -- -- -- 5.0
Other f inancial income (expense) (13.2) -- -- 14.9 -- 1.7
Finance costs / pension & oth.employee benefits (25.3) -- -- -- (10.0) (35.3)
Income tax (87.9) (17.9) (1.1) (5.1) 3.4 (108.6)
Effective tax rate 28.3%
Less, non-controlling interests’ income (16.3) (6.2) -- (0.7) 0.5 (22.7)
Net income (expense), Group 266.0 42.1 2.0 9.1 (6.1) 313.1
Average number of shares outstanding 207,141 207,141Net income (expense) per share, Group 1.28 1.51
2015
published
Amort. of
acquired
intangible assets
Disposal of
assets and
other
Change in
fair value/
dérivatives
Actuarial gains &
losses/other long-
term benefits
2015
adjusted
Income from operations 964.5 111.6 -- -- -- 1,076.1
Share in net income (loss) of equity aff iliates 112.8 26.8 -- -- -- 139.6
EBIT 1,215.7
Disposal of assets and other 53.4 -- (53.4) -- -- --
Net f inancial interests 3.8 -- -- -- -- 3.8
Other f inancial income (expense) (41.8) -- -- 32.2 -- (9.6)
Finance costs / pension & oth.employee benefits (60.1) -- -- -- (12.4) (72.5)
Income tax (219.9) (38.0) (1.4) (11.1) 4.0 (266.4)
Effective tax rate 26.7%
Less, non-controlling interests’ income (47.6) (12.4) -- (1.7) -- (61.7)
Net income (expense), Group 765.1 88.0 (54.8) 19.4 (8.4) 809.3
Average number of shares outstanding 208,112 208,112
Net income (expense) per share, Group 3.68 3.89

-27-
2.3 INFORMATION BY COUNTRY/REGION OF DESTINATION
Consolidated new orders (direct and indirect) by country/region of destination
2016 first half
2015 first half
2015
France 1,200.7 1,224.9 4,101.9 United Kingdom 463.3 513.4 2,226.6 Rest of Europe 1,304.2 1,030.8 3,483.2 Europe 2,968.2 2,769.1 9,811.7
North America 492.0 563.7 1,364.0
Australia and New Zealand 346.3 399.2 1,525.2
Near and Middle East 755.4 1,687.8 3,726.4 Asia 658.6 665.3 1,982.3 Rest of the world 202.8 138.9 470.3 Emerging markets 1,616.8 2,492.0 6,179.0
Total 5,423.3 6,224.0 18,879.9
Sales (direct and indirect) by country / region of destination 2016 first half
2015 first half
2015
France 1,660.7 1,568.7 3,420.5 United Kingdom 623.2 638.2 1,382.1 Rest of Europe 1,416.8 1,262.6 3,039.8 Europe 3,700.7 3,469.5 7,842.4
North America 779.7 759.3 1,533.4
Australia and New Zealand 375.2 364.9 725.6
Near and Middle East 803.7 646.6 1,430.6 Asia 952.8 841.8 1,898.3 Rest of the world 233.5 264.5 632.9 Emerging markets 1,990.0 1,752.9 3,961.8
Total 6,845.6 6,346.6 14,063.2

-28-
3. IMPACT OF CHANGES IN SCOPE OF CONSOLIDATION
MAIN CHANGES IN SCOPE OF CONSOLIDATION 3.1
a) Main events in 2016 first half
Mid-March 2016, Thales completed the acquisition of Vormetric, a leading provider of data protection solutions, for an amount of $ 408 million (€ 372.4 million). The company is fully consolidated in the Group accounts, and the provisionnal goodwill amounts to $ 409.9 million (€ 374.1 million). The final purchase price allocation will be carried out during 2016 second half, with the assistance of an independent expert. In the context of this transaction, Thales has set up key managers compensation agreements, with service conditions until 2020. These amounts are amortized using the graded vesting method. Corresponding amounts are recognised in income from operations, but excluded from EBIT and from adjusted net income, as they relate to an unusual event by nature (note 2).
At the end of June 2016, Thales signed an agreement with Raytheon to reduce the scope of their joint- venture, Thales-Raytheon Systems, that specializes in air operation command and control systems, surveillance radars, and ground-based weapon-locating radars. As of 1 July 2016, the scope of this joint-venture will be focused solely on NATO customers / programs. In this context, Thales acquired the non-controlling 50% interest of Raytheon in the French company TRS SAS, and sold to Raytheon its 50% interest in the US company, TRS LLC. Thales received a cash payment of $ 90 million (€ 81 million), corresponding to the net balance of these transactions.
In the Thales financial statements, the acquisition of Raytheon’s non-controlling interest in TRS SAS led to a reclassification within equity. The disposal of TRS LLC has resulted in a gain on disposal of €.91.8 million.
The company Thales-Raytheon Systems Air and Missile Defense Command remains jointly-owned and is consolidated under equity method in Group accounts.
b) Main events in 2015
In August 2015, Thales sold to Munich investment holding its 30% stake in ESG Elektroniksystem und Logistik GmbH, for an amount of € 75.2 million. In the consolidated financial statements, the gain on this disposal amounted to € 47.2 million.
DISPOSAL OF ASSETS, CHANGES IN SCOPE OF CONSOLIDATION AND OTHER 3.2
First half
2016
First half
2015
Full year
2015
Disposal of investments : 91.6 (2.4) 42.3
Thales Raytheon Systems LLC (50%) 91.8 -- --
ESG Elektroniksystem-und Logistik GmbH (30%) -- -- 47.2
Other (0.2) (2.4) (4.9)
Disposal of other assets : 3.7 (0.7) 1.0
Real estate assets 3.7 -- 0.7
Equipments -- (0.7) 0.3
Impact of curtailments and settlements of pensions plans
and long-term benefits (note 8) -- -- 10.1
Total 95.3 (3.1) 53.4

-29-
4. TANGIBLE AND INTANGIBLE ASSETS
4.1 GOODWILL
Goodwill is allocated to cash generating units (CGU) or to aggregate CGUs corresponding to the Group’s Global Business Units (GBU). The evolution of goodwill related to fully consolidated subsidiaries is presented hereafter:
O 31/12/15 Acquisi-
tions Disposals
Impairment
Exchange rate changes
and other 30/06/15
Avionics 472.0 -- -- -- (2.3) 469.7
Space 472.7 -- -- -- (1.7) 471.0
Aerospace 944.7 -- -- -- (4.0) 940.7 Transport 875.3 -- -- -- -- 875.3 Secure Communication and Information Systems 625.1 374.1* -- -- (9.4) 989.8
Land and Air Systems 309.8 -- -- -- -- 309.8
Defense Mission Systems 461.0 -- -- -- (0.1) 460.9
Defense and Security 1,395.9 374.1 -- -- (9.5) 1,760.5
Total 3,215.9 374.1 -- -- (13.5) 3,576.5
31/12/14 Acquisi-
tions Disposals
Impairment
Exchange rate
changes and other
31/12/15
Avionics 456.7 3.6 -- -- 11.7 472.0
Space 467.0 5.2 -- -- 0.5 472.7
Aerospace 923.7 8.8 -- -- 12.2 944.7 Transport 875.3 -- -- -- -- 875.3 Secure Communication and Information Systems 642.5 (19.0)** -- -- 1.6 625.1
Land and Air Systems 309.9 -- -- -- (0.1) 309.8
Defense Mission Systems 461.2 -- -- -- (0.2) 461.0
Defense and Security 1,413.6 (19.0) -- -- 1.3 1,395,9
Total 3,212.6 (10.2) -- -- 13.5 3,215.9
* related to Vormetric, before purchase price allocation ** allocation related to Cyber security services and secure communications activities.
Goodwill is subject to annual impairment tests in accordance with the budget calendar of the Group. In the context of the interim closing, the cash generating units (CGU) for which there is an indication of impairment, in particular a decrease in activity and profitability forecasts against the budget, are subject to new tests including the effects of recent events known at the closing date.
On 30 June 2016, the Group conducted a review of impairment indications relating to goodwill allocated to cash-generating units (CGU) or group of CGU for which sensitivity tests were presented in the consolidated financial statements at 31 December 2015. This review confirmed the absence of impairment to be recognized at 30 June 2016.

-30-
4.2 TANGIBLE AND INTANGIBLE ASSETS
31/12/15
Acquisitions
&
Activations
Disposals Depreciation Impairment
Exchange
rate
changes
and other
30/06/16
Intangible assets acquired (PPA) 649.2 -- -- (39.7) -- (3.7) 605.8
Development costs 123.3 4.1 -- (20.3) -- (2.9) 104.2
Other 90.4 16.9 -- (18.6) -- 3.6 92.3
Intangible assets 862.9 21.0 -- (78.6) -- (3.0) 802.3
Tangible assets 1,696.7 209.2 (4.1) (149.6) -- (30.4) 1,721.8
Total 2,559.6 230.2 (4.1) (228.2) -- (33.4) 2,524.1
01/01/15
Acquisitions
&
Activations
Disposals Depreciation Impairment
Exchange
rate
changes
and other
31/12/15
Intangible assets acquired (PPA) 715.5 -- -- (111.6) -- 45.3 649.2
Development costs 147.2 15.0 -- (42.0) -- 3.1 123.3
Other 83.5 54.9 -- (38.2) -- (9.8) 90.4
Intangible assets 946.2 69.9 -- (191.8) -- 38.6 862.9
Tangible assets 1,557.0 403.5 (15.1) (301.1) -- 52.4 1,696.7
Total 2,503.2 473.4 (15.1) (492.9) -- 91.0 2,559.6
5. INVESTMENTS IN JOINT VENTURES AND ASSOCIATES
5.1 JOINT VENTURES
a) Group's share in net equity and net income (loss) of joint ventures
30/06/16 31/12/15First half
2016
First half
2015
Full year
2015
DCNS (35%) 686.4 680.9 7.0 (3.0) (3.5)
Other joint-ventures * 422.1 445.5 22.9 17.9 59.3
Total 1,108.5 1,126.4 29.9 14.9 55.8
* Separately not significant, the value of each investment representing less than 10% of the total value.
b) Change in investment in joint ventures
30/06/16 31/12/15
Investment in joint ventures at opening 1,126.4 1,104.2
Share in net income (loss) of joint-ventures 29.9 55.8
Items of comprehensive income (loss) to be subsequently reclassified to P&L (7.6) 12.4
Other items of comprehensive income (loss) that will not be reclassified to P&L -- 5.1
Total comprehensive income (loss) 22.3 73.3
Dividends paid (26.9) (51.8)
Effect exchange rate changes and other (13.3) 0.7
Investment in joint venture at closing 1,108.5 1,126.4

-31-
c) DCNS summarized financial information
Summarized Balance Sheet at 100% * 30/06/16 31/12/15
Non-current assets 2,412.8 2,599.4
Current assets 7,385.6 7,527.4
Total asset 9,798.4 10,126.8
Restated equity, attrib. to the shareholders of the Company 1,126.7 1,111.2
Non-controlling interests 15.9 22.4
Non-current liabilities 708.6 710.7
Current liabilities 7,947.2 8,282.5
Total equity and liabilities 9,798.4 10,126.8
Net Cash 2,698.3 2,527.7
Integration in Thales accounts: 30/06/16 31/12/15
Restated equity, attrib. to the shareholders of the Company 1 126.7 1,111.2
% of Thales' interests 35% 35%
Thales' share 394.4 388.9
Goodwill 292.0 292.0
Share in net assets of the joint venture 686.4 680.9
Summarized income statement at 100% *First half
2016
First half
2015
Full year
2015
Sales 1,440.8 1,463.6 3,038.8
Income from operating activities after impact of equity affiliates* (1.8) (29.5) (51.0)
Financial income, net 21.1 13.7 20.8
Tax (6.2) 5.4 10.3
Restated net income 13.1 (10.4) (19.9)
Of which, attributable to the shareholders of the company 20.1 (8.6) (9.9)
Of which, non-controlling interests (7.0) (1.8) (10.0)
Integration in Thales accounts:First half
2016
First half
2015
Full year
2015
Restated net income, attrib. to the shareholders of the company 20.1 (8.6) (9.9)
% of Thales' interest 35% 35% 35%
Share in net income of the jonit venture 7.0 (3.0) (3.5)
Less PPA impact 12.6 12.6 25.4
Share in net income before PPA 19.6 9.6 21.9
Dividends received from the joint venture -- -- -- *After Thales restatements (mainly on acquired intangible assets)
5.2 INVESTMENTS IN ASSOCIATES
30/06/16 31/12/15
Investment in associates at opening 359.5 385.5
Share in net income of associates 26.1 57.0
Items of comprehensive income (loss) to be subsequently reclassified to P&L (33.1) 11.1
Other items of comprehensive income (loss) that will not be reclassified to P&L 0.5 (1.9)
Total comprehensive income (loss) (6.5) 66.2
Dividends paid (15.1) (31.6)
Dividends voted, not yet paid (0.2) (2.2)
Changes in scope (TRS LLC in 2014 and Cloudwatt in 2015) (127.8) (58.5)
Others -- 0.1
Investment in associates at closing 209.9 359.5

-32-
6 FINANCING AND FINANCIAL INSTRUMENTS
6.1 OTHER FINANCIAL INCOME (EXPENSE)
First half
2016
First half
2015
Full year
2015
Foreign exchange gains (losses) (4.1) 5.9 4.4
Change in fair value of derivative exchange instruments * (45.7) (14.9) (32.2)
Cash flow hedge inefficiency / foreign exchange instruments 0.7 (4.1) (6.9)
Net foreign exchange gains (losses) (49.1) (13.1) (34.7)
Dividends received 2.1 4.5 5.0
Net financial costs on operating loans / debts 0.4 0.3 1.8
Impairment of investments in shares (0.4) (0.6) --
Depreciation of loans and financial assets -- -- (7.9)
Expenses related to confirmed credit line, not used (1.0) (1.2) (2.2)
Other (1.3) (3.1) (3.8)
Total (49.3) (13.2) (41.8)
* Includes the variation of forward points fair value (€ -30.6 million in first half 2016, € -11.4 million in first half 2015 and € -15.5 million in 2015) and the time value of the hedge accounting derivatives (€ -5,1 million in first half 2016, € -3.6 million in first half 2015 and € -6.3 million in 2015), and also includes the variation of the fair value of derivatives non qualified for hedge accounting.
6.2 NET CASH (NET DEBT)
· Net cash (net debt) at closing
30/06/16 31/12/15
Current financial assets 15.2 27.5
Cash at bank and equivalents 3,523.8 3,450.2
Cash and other short-term financial assets (I) 3,539.0 3,477.7
Long-term financial debt 1,440.3 837.6
Short-term financial debt 701.9 698.7
Fair value of interest rate derivatives - non current (33.4) (36.2)
Fair value of interest rate derivatives - current (8.5) --
Total gross financial debt (II) 2,100.3 1,500.1
Net cash (I – II) 1,438.7 1,977.6
· Gross financial debt
30/06/16 31/12/15
Bond maturity June 2023* 600.0 --
Bond maturity March 2021 319.6 314.0
Bond maturity March 2018 504.5 504.3
Bond maturity October 2016 601.7 605.6
Other borrowings 74.5 76.2
Gross financial debt 2,100.3 1,500.1
* € 600 million fixed-rate bond with a 7-year maturity and a 0.75% coupon, of which € 400 million swapped at variable rate. This issue wil be used to refinance the € 600 million bond maturing in October 2016. It forms part of the active Group liquidity management and enables to maintain Thales financial flexibilty and extend the maturity of its financial resources.

-33-
6.3 SUMMARY OF FINANCIAL ASSETS AND LIABILITIES
a) Financial assets
At 30 June 2016:
Through
P&L
Available
for sale
Hedge
accounting
Not
qualified for
hedge
accounting
Non-current financial assets:
Available-for-sale investments -- -- 69.0 -- -- 69.0
Loans and financial assets, non-current 109.8 19.4 -- -- -- 129.2
Non-current derivatives, asset -- -- -- 33.4 -- 33.4
Current financial assets:
Current derivatives, asset: exchange -- -- -- 149.7 10.4 160.1
Current derivatives, asset: rate -- -- -- 8.5 -- 8.5
Current financial assets 15.2 -- -- -- -- 15.2
Cash at bank and equivalents 2,656.8 867.0 -- -- -- 3,523.8
Total financial assets 886.4 69.0 191.6 10.4
Methods used to measure fair value:
Valuation at cost -- 69.0 -- -- 69.0
Quoted prices in active markets
(level 1) 867.0-- -- --
867.0
Based on observable market data
(level 2) 19.4--
191.6 10.4 221.4
At 31 December 2015:
Through
P&L
Available
for sale
Hedge
accounting
Not
qualified for
hedge
accounting
Non current financial assets:
Available-for-sale investments -- -- 71.1 -- -- 71.1
Loans and financial assets, non-current 111.8 19.4 -- -- -- 131.2
Non-current derivatives, asset -- -- -- 36.2 -- 36.2
Current financial assets:
Current derivatives, asset -- -- -- 134.7 19.5 154.2
Current financial assets 27.5 -- -- -- -- 27.5
Cash at bank and equivalents 2,260.1 1,190.1 3,450.2
Total financial assets 1,209.5 71.1 170.9 19.5
Methods used to measure fair value:
Valuation at cost -- 71.1 -- -- 71.1
Quoted prices in active markets
(level 1) 1,190.1 -- -- -- 1,190.1
Based on observable market data
(level 2) 19.4 -- 170.9 19.5 209.8
Loans and
receivables at
amortised
cost
At fair value
Total
DerivativesFinancial assets
Loans and
receivables at
amortised
cost
At fair value
Total
DerivativesFinancial assets

-34-
b) Financial liabilities
At 30 June 2016:Hedge
accounting
Not qualified for
hedge
accounting
Non-current financial liabilities:
Financial debt-long-term 1,406.9 33.4 -- -- 1,440.3
Current financial liabilities:
Current derivatives, liability -- -- 308.4 14.2 322.6
Financial debt-short-term 693.4 8.5 -- -- 701.9
Total financial liabilities 41.9 308.4 14.2
Methods used to measure fair value
Valuation based on observable market data
(level 2)41.9 308.4 14.2 364.5
At fair value
DerivativesAt
amortised
cost
TotalFinancial
liabilities
At 31 December 2015:Hedge
accounting
Not qualified for
hedge
accounting
Non-current financial liabilities:
Financial debt-long-term 809.6 28.0 -- -- 837.6
Current financial liabilities:
Current derivatives, liability -- -- 392.7 12.6 405.3
Financial debt-short-term 690.5 8.2 -- -- 698.7
Total financial liabilities 36.2 392.7 12.6
Methods used to measure fair value
Valuation based on observable market data
(level 2)36.2 392.7 12.6 441.5
At
amortised
cost
At fair value
TotalFinancial
liabilities
Derivatives
The fair value of debt obligation is measured on the basis of prices quoted (Level 1). The fair value of other financial debts is determined for each loan by discounting future cash flows with the Euribor interest rate at the balance sheet date, adjusted for the Group's credit risk (Level 2). On this basis, the fair value of the financial debt amounts to € 2,157.6 million at 30 June 2016 and € 1,545.2 million at 31 December 2015.

-35-
7. CHANGE IN NET CASH (NET DEBT) First half
2016
First half
2015
Full year
2015
Net cash (debt) at 1 January 1,977.6 1,006.3 1,006.3
Operating cash-flow before WCR, interest and taxes 703.9 682.9 1,642.9
Changes in WCR and reserves for contingencies (337.3) (696.5) 143.0
Pensions recurrent contributions, interests and tax paid (95.4) (92.0) (217.2)
Net operating investments (226.1) (197.9) (458.3)
Free operating cash-flow 45.1 (303.5) 1,110.4
Acquisitions of subsidiaries and shares (367.8) (32.3) (51.2)
Disposals of subsidiaries and shares 87.0 12.0 87.8
Reduction of UK pension deficits (45.2) (45.9) (101.0)
Variation of loans (14.3) 20.6 23.3
Dividends paid (212.3) (160.7) (234.0)
Third party share in dividend distributions of subsidiaries (47.5) (51.2) (51.3)
Treasury shares and exercise of subscription options 39.0 72.2 125.4
Exchange rate changes: translation and financing operations (30.1) 61.8 26.6
Debt / investments in shares (available-for-sale) and other 7.2 34.2 35.3
Net cash (debt) at closing 1,438.7 613.5 1,977.6
7.1 CHANGES IN WORKING CAPITAL REQUIREMENTS
Current operating assets and liabilities include the elements of working capital requirements (WCR) and reserves for contingencies. Their evolution is presented below. Contracts under IAS 11 are subject to a specific classification in the consolidated balance sheet: for each contract, the balances of unbilled sales, work-in-progress, and provisions for risk and charges are presented in the assets or liabilities in the "Construction Contracts" caption. The Group may sell trade receivables, mainly from the French State and commercial paper. At 30 June 2016, the sold receivables amounted to € 124.8 million (€ 103.7 million at 31 December 2015).
31/12/15
Changes in
WCR and
provisions
Scope impacts,
exch. rate
changes and
reclass.
30/06/16
Inventories and work in progress 2,560.8 181.8 (19.4) 2,723.2
Construction contracts assets 2,042.6 457.4 (16.2) 2,483.8
Advances to suppliers 383.0 (3.5) (1.7) 377.8
Accounts, notes and other receivables 4,404.2 (19.3) (18.5) 4,366.4
Current derivatives - assets 154.2 5.8 0.1 160.1
Current operating assets 9,544.8 622.2 (55.7) 10,111.3
Advances received from customers on contracts (4,317.2) (427.2) 42.9 (4,701.5)
Refundable grants (127.6) 0.6 (0.2) (127.2)
Construction contracts liabilities (1,021.0) (59.3) 5.1 (1,075.2)
Reserves for contingencies (1,022.9) 13.8 12.5 (996.6)
Accounts, notes and other payables (5,547.6) 200.5 17.0 (5,330.1)
Current derivatives - liabilities (405.3) -- 82.7 (322.6)
Current operating liabilities (12,441.6) (271.6) 160.0 (12,553.2)
Restructuring provisions * 116.3 (13.3) (5.7) 97.3
Increase (decrease) in WCR and reserves for
contingencies337.3
* To be excluded from reserves for contingencies

-36-
7.2 RESERVES FOR CONTINGENCIES (EXCLUDING CONSTRUCTION CONTRACTS)
31/12/15 Increase Utilisation Reversal
Scope,
exch.rates
changes and
other
30/06/16
Restructuring 116.3 25.2 (37.5) (1.0) (5.7) 97.3
Litigations 127.7 9.9 (9.5) (2.8) 1.3 126.6
Guarantees 239.7 34.5 (31.1) (3.9) (5.5) 233.7
Losses at completion 76.1 30.2 (9.6) (1.9) (2.8) 92.0
Provisions on contracts 147.4 11.8 (11.3) (3.5) 2.6 147.0
Other * 315.7 22.3 (26.3) (4.8) (6.9) 300.0
Total 1,022.9 133.9 (125.3) (17.9) (17.0) 996.6
31/12/14 Increase Utilisation Reversal
Scope, exch.
rates
changes
and other
30/06/15
Restructuring 134.2 38.4 (50.2) (1.4) 2.5 123.5
Litigations 142.5 8.9 (18.4) (0.3) 5.4 138.1
Guarantees 230.9 34.7 (25.7) (4.2) 5.3 241.0
Losses at completion 69.1 20.8 (15.7) (0.6) 2.3 75.9
Provisions on contracts 171.6 14.2 (25.8) (1.1) (12.4) 146.5
Other * 289.7 23.0 (17.0) (2.8) 9.1 302.0
Total 1,038.0 140.0 (152.8) (10.4) 12.2 1,027.0
* Includes technical provisions of insurance companies, provisions for tax and social risks, liability guarantees, environment and other.
7.3 NET FINANCIAL INVESTMENT
Acquisitions of subsidiariesFirst half
2016
First half
2015
Full year
2015
Vormetric (372.4) -- --
Visionix additional price -- (12.9) (12.9)
Tronics stake (19.7%) -- (10.3) (10.3)
Capital increase of a real estate company -- -- (7.4)
Other (2.4) (9.1) (20.6)
Gross investment (374.8) (32.3) (51.2)
Less cash of acquired companies 7.0 -- --
Net investment (367.8) (32.3) (51.2)
Disposals of subsidiariesFirst half
2016
First half
2015
Full year
2015
Equalization payment / Thales-Raytheon Systems 81.0 -- --
ESG Eletroniksystem-und Logistik GmbH (30%) -- -- 75.2
Thales Geodis Freight & Logistics(50%) 5.7 -- --
Other 0.3 12.0 12.6
Gross disposals 87.0 12.0 87.8
Less cash of companies sold -- -- --
Net disposals 87.0 12.0 87.8
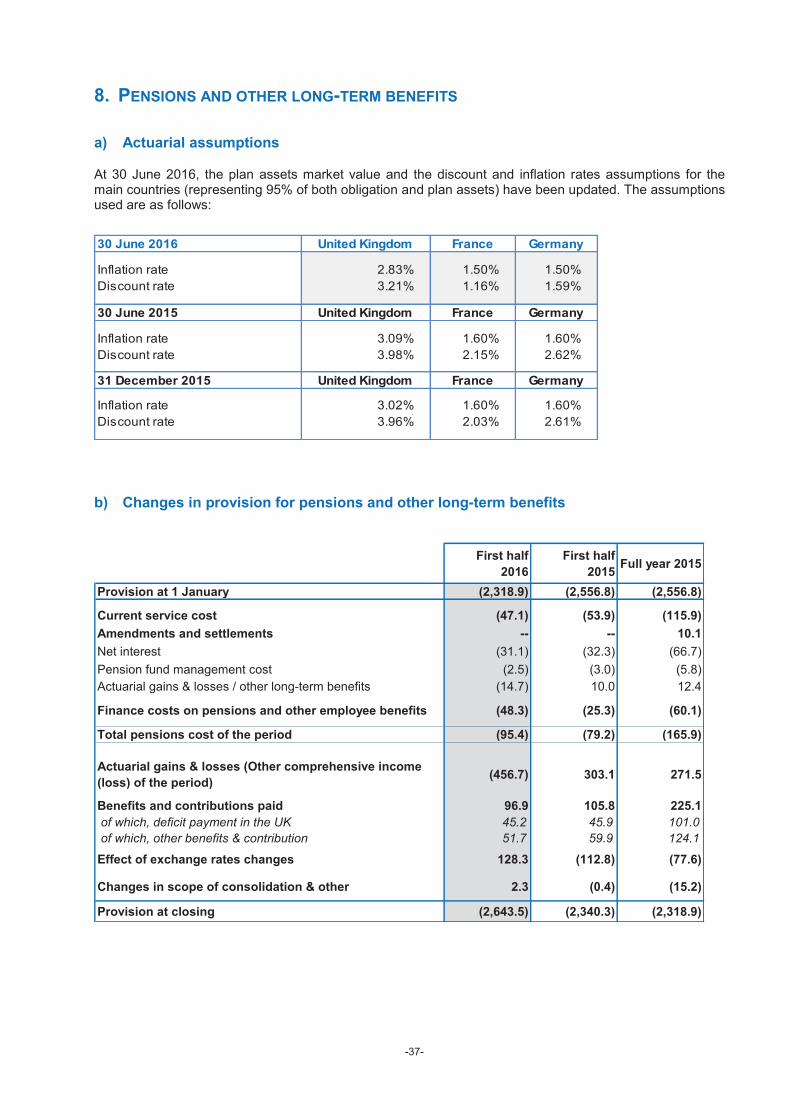
-37-
8. PENSIONS AND OTHER LONG-TERM BENEFITS
a) Actuarial assumptions
At 30 June 2016, the plan assets market value and the discount and inflation rates assumptions for the main countries (representing 95% of both obligation and plan assets) have been updated. The assumptions used are as follows:
30 June 2016 United Kingdom France Germany
Inflation rate 2.83% 1.50% 1.50%
Discount rate 3.21% 1.16% 1.59%
30 June 2015 United Kingdom France Germany
Inflation rate 3.09% 1.60% 1.60%
Discount rate 3.98% 2.15% 2.62%
31 December 2015 United Kingdom France Germany
Inflation rate 3.02% 1.60% 1.60%
Discount rate 3.96% 2.03% 2.61%
b) Changes in provision for pensions and other long-term benefits
First half
2016
First half
2015Full year 2015
Provision at 1 January (2,318.9) (2,556.8) (2,556.8)
Current service cost (47.1) (53.9) (115.9)
Amendments and settlements -- -- 10.1
Net interest (31.1) (32.3) (66.7)
Pension fund management cost (2.5) (3.0) (5.8)
Actuarial gains & losses / other long-term benefits (14.7) 10.0 12.4
Finance costs on pensions and other employee benefits (48.3) (25.3) (60.1)
Total pensions cost of the period (95.4) (79.2) (165.9)
Actuarial gains & losses (Other comprehensive income
(loss) of the period)(456.7) 303.1 271.5
Benefits and contributions paid 96.9 105.8 225.1
of which, deficit payment in the UK 45.2 45.9 101.0
of which, other benefits & contribution 51.7 59.9 124.1
Effect of exchange rates changes 128.3 (112.8) (77.6)
Changes in scope of consolidation & other 2.3 (0.4) (15.2)
Provision at closing (2,643.5) (2,340.3) (2,318.9)
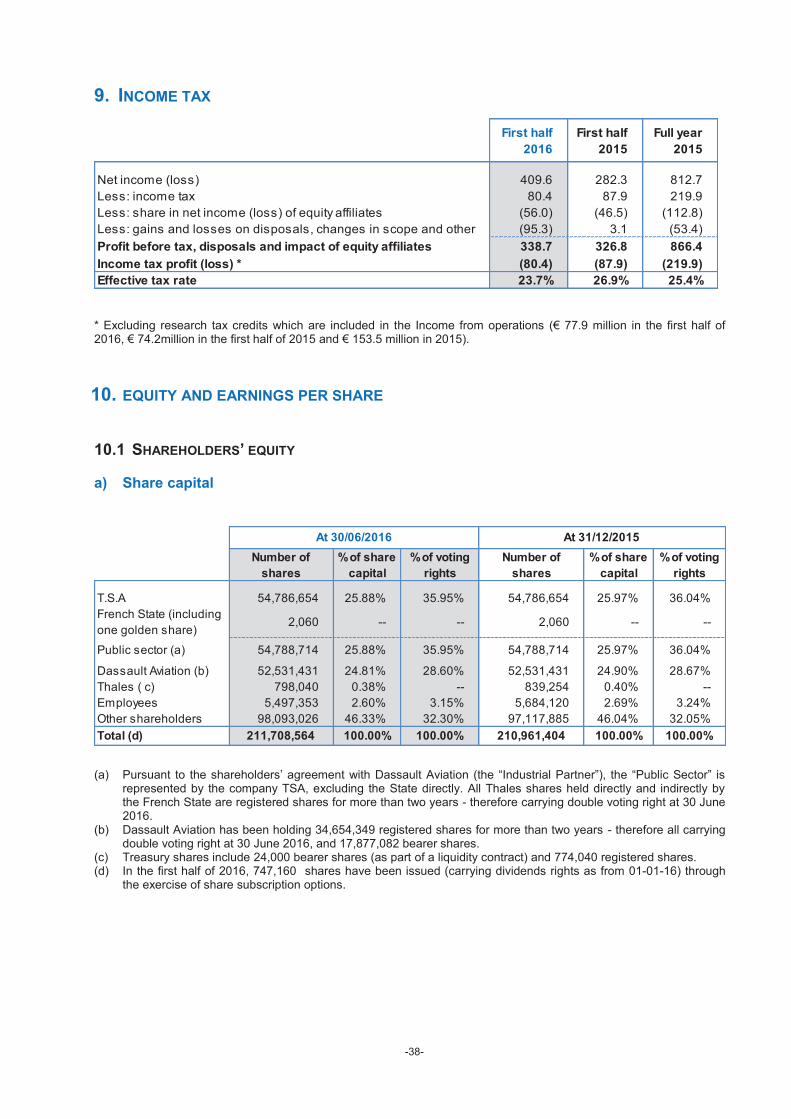
-38-
9. INCOME TAX
First half
2016
First half
2015
Full year
2015
Net income (loss) 409.6 282.3 812.7
Less: income tax 80.4 87.9 219.9
Less: share in net income (loss) of equity affiliates (56.0) (46.5) (112.8)
Less: gains and losses on disposals, changes in scope and other (95.3) 3.1 (53.4)
Profit before tax, disposals and impact of equity affiliates 338.7 326.8 866.4
Income tax profit (loss) * (80.4) (87.9) (219.9)
Effective tax rate 23.7% 26.9% 25.4%
* Excluding research tax credits which are included in the Income from operations (€ 77.9 million in the first half of 2016, € 74.2million in the first half of 2015 and € 153.5 million in 2015).
10. EQUITY AND EARNINGS PER SHARE
10.1 SHAREHOLDERS’ EQUITY
a) Share capital
Number of
shares
% of share
capital
% of voting
rights
Number of
shares
% of share
capital
% of voting
rights
T.S.A 54,786,654 25.88% 35.95% 54,786,654 25.97% 36.04%
French State (including
one golden share)2,060 -- -- 2,060 -- --
Public sector (a) 54,788,714 25.88% 35.95% 54,788,714 25.97% 36.04%
Dassault Aviation (b) 52,531,431 24.81% 28.60% 52,531,431 24.90% 28.67%
Thales ( c) 798,040 0.38% -- 839,254 0.40% --
Employees 5,497,353 2.60% 3.15% 5,684,120 2.69% 3.24%
Other shareholders 98,093,026 46.33% 32.30% 97,117,885 46.04% 32.05%
Total (d) 211,708,564 100.00% 100.00% 210,961,404 100.00% 100.00%
At 30/06/2016 At 31/12/2015
(a) Pursuant to the shareholders’ agreement with Dassault Aviation (the “Industrial Partner”), the “Public Sector” is represented by the company TSA, excluding the State directly. All Thales shares held directly and indirectly by the French State are registered shares for more than two years - therefore carrying double voting right at 30 June 2016.
(b) Dassault Aviation has been holding 34,654,349 registered shares for more than two years - therefore all carrying double voting right at 30 June 2016, and 17,877,082 bearer shares.
(c) Treasury shares include 24,000 bearer shares (as part of a liquidity contract) and 774,040 registered shares. (d) In the first half of 2016, 747,160 shares have been issued (carrying dividends rights as from 01-01-16) through
the exercise of share subscription options.

-39-
b) Treasury shares
Thales Parent Company held 798,040 of its own shares at 30 June 2016. They are accounted for as a € 24.4 million decrease from the consolidated equity.
In accordance with the authorisations given to the board of Directors at the Annual General Meeting, the Company did the following operations:
First half
2016
First half
2015
Full year
2015
Treasury shares at 1 January 839,254 1,876,732 1,876,732
Purchases as part of the liquidity contracts 182,561 604,183 807,144
Sales as part of the liquidity contracts (167,561) (541,183) (822,144)
Transfer to employees as part of the employee share
purchase offering (41,714) -- (457,596)
Delivery of free shares (100) (1,280) (535,532)
Exercise of share purchase options (14,400) (18,500) (29,350)
Treasury shares at closing 798,040 1,919,952 839,254
c) Parent Company dividend distribution
Dividends per share amounted respectively to € 1.12 and € 1.36 in 2014 and 2015. Dividends paid in 2015 and 2016 are described below:
Full
yearApproved by Description
Dividend
per share
(euros)
Payout date Paid in
Total
(millions
of euros)
2016Shareholders' meeting on 18
May 2016Balance for 2015 € 1.01 1 June 2016 Cash 212.3
212.3
Board of Directors meeting
on 17 September 2015
2015 interim
dividend€ 0.35 11 December 2015 Cash 73.3
Shareholders' meeting on 13
May 2015Balance for 2014 € 0.78 29 May 2015 Cash 160.7
234.0
2015
Total dividends paid in first half 2016
Total dividends paid in 2015
d) Non-controlling interests
This item principally includes Leonardo’s (former Finmeccanica) share in the sub-group Thales Alenia Space (33%), as well as Siemens’ and Philips Medical Systems International’s interests in the company Trixell SAS (49%) and, up to 30 June 2016, Raytheon’s interests in Thales-Raytheon Systems Company SAS (50%).
On 30 June 2016, considering the transaction described in note 3.1, Raytheon interests have been reclassified in equity, Group share.
The contribution of these minority shareholders in the main financial figures of the Group is individually not significant.
The treasury of these three companies is exclusively placed with the Corporate Treasury Department of Thales, without restriction of use.
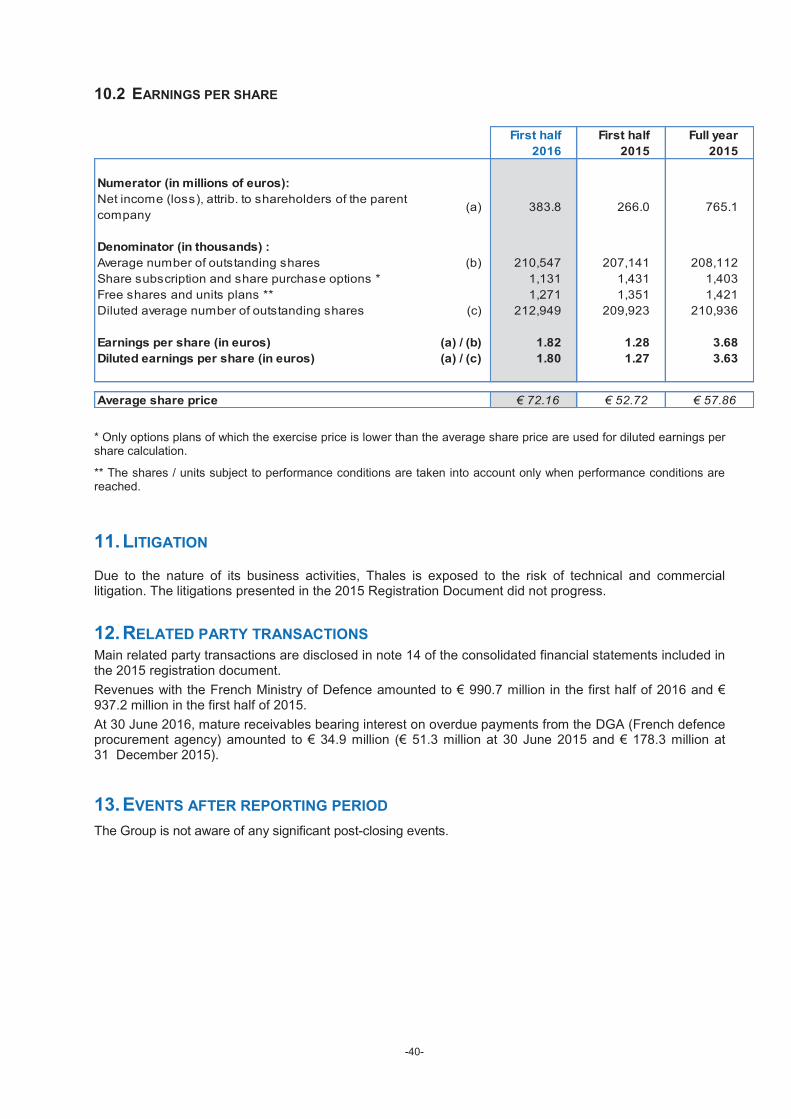
-40-
10.2 EARNINGS PER SHARE
First half
2016
First half
2015
Full year
2015
Numerator (in millions of euros):
Net income (loss), attrib. to shareholders of the parent
company (a) 383.8 266.0 765.1
Denominator (in thousands) :
Average number of outstanding shares (b) 210,547 207,141 208,112
Share subscription and share purchase options * 1,131 1,431 1,403
Free shares and units plans ** 1,271 1,351 1,421
Diluted average number of outstanding shares (c) 212,949 209,923 210,936
Earnings per share (in euros) (a) / (b) 1.82 1.28 3.68
Diluted earnings per share (in euros) (a) / (c) 1.80 1.27 3.63
Average share price € 72.16 € 52.72 € 57.86
* Only options plans of which the exercise price is lower than the average share price are used for diluted earnings per share calculation.
** The shares / units subject to performance conditions are taken into account only when performance conditions are reached.
11. LITIGATION
Due to the nature of its business activities, Thales is exposed to the risk of technical and commercial litigation. The litigations presented in the 2015 Registration Document did not progress.
12. RELATED PARTY TRANSACTIONS Main related party transactions are disclosed in note 14 of the consolidated financial statements included in the 2015 registration document.
Revenues with the French Ministry of Defence amounted to € 990.7 million in the first half of 2016 and € 937.2 million in the first half of 2015.
At 30 June 2016, mature receivables bearing interest on overdue payments from the DGA (French defence procurement agency) amounted to € 34.9 million (€ 51.3 million at 30 June 2015 and € 178.3 million at 31 December 2015).
13. EVENTS AFTER REPORTING PERIOD
The Group is not aware of any significant post-closing events.

THALES
Statutory auditors’ review report on the half-yearly financial information
For the period from January 1 to June 30, 2016
This is a free translation into English of the statutory auditors’ review report on the half-yearly financial information issued in French and it is
provided solely for the convenience of English speaking users. This report should be read in conjunction with and construed in accordance
with French law and professional auditing standards applicable in France.
ERNST & YOUNG Audit MAZARS
ERNST & YOUNG Audit
1 / 2, PLACE DES SAISONS – 92400 COURBEVOIE – PARIS-LA DEFENSE 1
COMMISSAIRE AUX COMPTES – MEMBRE DE LA COMPAGNIE REGIONALE DE VERSAILLES
S.A.S. A CAPITAL VARIABLE – 344 366 315 NANTERRE
MAZARS
61, RUE HENRI REGNAULT – 92400 COURBEVOIE
SOCIETE ANONYME D’EXPERTISE COMPTABLE ET DE COMMISSARIAT AUX COMPTES
CAPITAL DE 8 320 000 EUROS – RCS NANTERRE B 784 84 153
THALES
Statutory auditors’ review report on the half-yearly financial information
For the period from January 1 to June 30, 2016
ERNST & YOUNG Audit MAZARS

Statutory auditors’ review report on the half-yearly financial information
To the Shareholders, In compliance with the assignment entrusted to us by your annual general meetings and in accordance with article L. 451-1-2 III of the French monetary and financial code (Code monétaire et financier), we hereby report to you on:
- the review of the accompanying condensed half-yearly consolidated financial statements of Thales, for the period from January 1 to June 30, 2016,
- the verification of the information presented in the half-yearly management report. These condensed half-yearly consolidated financial statements are the responsibility of the board of directors. Our role is to express a conclusion on these financial statements based on our review. I - Conclusion on the financial statements We conducted our review in accordance with professional standards applicable in France. A review of interim financial information consists of making inquiries, primarily of persons responsible for financial and accounting matters, and applying analytical and other review procedures. A review is substantially less in scope than an audit conducted in accordance with professional standards applicable in France and consequently does not enable us to obtain assurance that we would become aware of all significant matters that might be identified in an audit. Accordingly, we do not express an audit opinion. Based on our review, nothing has come to our attention that cause us to believe that the accompanying condensed half-yearly consolidated financial statements are not prepared, in all material respects, in accordance with IAS 34, standard of the IFRS as adopted by the European Union applicable to interim financial information.
II - Specific verification We have also verified the information presented in the half-yearly management report on the condensed half-yearly consolidated financial statements subject to our review. We have no matters to report as to its fair presentation and consistency with the condensed half-yearly consolidated financial statements. Paris-La Défense and Courbevoie, July 21, 2016 The statutory auditors
French original signed by ERNST & YOUNG Audit
PHILIPPE DIU
SERGE POTTIEZ
MAZARS
JEAN-MARC DESLANDES
ANNE-LAURE ROUSSELOU

Thales
Tour Carpe Diem
31 Place des Corolles – CS 20001
92098 Paris La Défense
France
Tél : +33 (0)1 57 77 80 00
www.thalesgroup.com
Recommended


