SD 9.17.09
Chromium, Copper, Iron, Lead, Nickel,
PTA wishes to gratefully acknowledge the technical assistance provided for this program by Mrs J McGuire, ChemCentreAssociates (USA) for the supply of samples and to Global Proficiency Pty Ltd (Australia) for distributing the samples.
SD 9.17.09
Waters Proficiency Testing
Chromium, Copper, Iron, Lead, Nickel,
PTA wishes to gratefully acknowledge the technical assistance provided for this program by Mrs J McGuire, ChemCentreAssociates (USA) for the supply of samples and to Global Proficiency Pty Ltd (Australia) for distributing the samples.
PO Box 7507
Report No
Waters Proficiency Testing
Round
Chromium, Copper, Iron, Lead, Nickel,
PTA wishes to gratefully acknowledge the technical assistance provided for this program by Mrs J McGuire, ChemCentre Associates (USA) for the supply of samples and to Global Proficiency Pty Ltd (Australia) for distributing the samples.
© Copyright
PO Box 7507
Report No
Waters Proficiency Testing
Round
- MetalsChromium, Copper, Iron, Lead, Nickel,
Thallium, Zinc
June 2015
Acknowledgments
PTA wishes to gratefully acknowledge the technical assistance provided for this program by (Australia). Also our thanks go to the Environmental Resource
Associates (USA) for the supply of samples and to Global Proficiency Pty Ltd (Australia) for
© Copyright Proficiency Testing Australia
PO Box 7507 SILVERWATER
Report No
Waters Proficiency Testing
Round No.
MetalsChromium, Copper, Iron, Lead, Nickel,
Thallium, Zinc
June 2015
Acknowledgments
PTA wishes to gratefully acknowledge the technical assistance provided for this program by (Australia). Also our thanks go to the Environmental Resource
Associates (USA) for the supply of samples and to Global Proficiency Pty Ltd (Australia) for
Proficiency Testing Australia
SILVERWATER NSW
Report No . 917
Waters Proficiency Testing
o. 179
Metals - Chromium, Copper, Iron, Lead, Nickel,
Thallium, Zinc
June 2015
Acknowledgments
PTA wishes to gratefully acknowledge the technical assistance provided for this program by (Australia). Also our thanks go to the Environmental Resource
Associates (USA) for the supply of samples and to Global Proficiency Pty Ltd (Australia) for
Proficiency Testing Australia
NSW 2128
917
Waters Proficiency Testing
179
Chromium, Copper, Iron, Lead, Nickel, Thallium, Zinc
PTA wishes to gratefully acknowledge the technical assistance provided for this program by (Australia). Also our thanks go to the Environmental Resource
Associates (USA) for the supply of samples and to Global Proficiency Pty Ltd (Australia) for
Proficiency Testing Australia , 2015
2128, Australia
Waters Proficiency Testing
Chromium, Copper, Iron, Lead, Nickel,
PTA wishes to gratefully acknowledge the technical assistance provided for this program by (Australia). Also our thanks go to the Environmental Resource
Associates (USA) for the supply of samples and to Global Proficiency Pty Ltd (Australia) for
2015
, Australia
Chromium, Copper, Iron, Lead, Nickel,
PTA wishes to gratefully acknowledge the technical assistance provided for this program by (Australia). Also our thanks go to the Environmental Resource
Associates (USA) for the supply of samples and to Global Proficiency Pty Ltd (Australia) for

SD 9.17.09
CONTENTS
1. Foreword ............................................................................................................................ 1
2. Program Features and Design ........................................................................................... 1
3. Statistical Format ............................................................................................................... 2
4. PTA and Technical Adviser's Comments ........................................................................... 4
5. Outlier Results ................................................................................................................. 35
6. Reference ........................................................................................................................ 35
APPENDIX A – Results and Data Analysis
Chromium .............................................................................................................................. A1
Copper ................................................................................................................................... A4
Iron ........................................................................................................................................ A7
Lead .................................................................................................................................... A10
Nickel ................................................................................................................................... A13
Thallium ............................................................................................................................... A16
Zinc ...................................................................................................................................... A18
APPENDIX B – Sample Homogeneity and Stability
Homogeneity and Stability Testing ........................................................................................ B1
APPENDIX C – Documentation
Instructions to Participants .................................................................................................... C1
Method Codes ....................................................................................................................... C3
Digestion Codes .................................................................................................................... C4
Results Sheet ........................................................................................................................ C5
1
SD 9.17.09
1. Foreword
This report summarises the results of a proficiency testing program on the determination of metals (Chromium, Copper, Iron, Lead, Nickel, Thallium and Zinc) in waters. This is round 179 in a planned series of programs involving the analysis of chemical and physical parameters of waters. The exercise was conducted in April 2015 by Proficiency Testing Australia (PTA). The main aim of the program was to assess laboratories’ abilities to competently perform the prescribed analyses. The Program Coordinator was Mrs D Mihaila and the Technical Adviser was Mrs J McGuire, ChemCentre (Australia). This report was authorised by Mrs F Watton, PTA Quality – Business Development Manager.
2. Program Features and Design 2.1 Each laboratory was randomly allocated a unique code number for the program to
ensure confidentiality of results. Reference to each laboratory in this report is by code number only. Please note that a number of laboratories reported more than one set of results and, therefore, their code numbers (with letter) could appear several times in the same data set.
2.2 Laboratories were provided with the "Instructions to Participants" and "Results Sheet"
(see Appendix C). Laboratories were requested to perform the tests according to their routine methods.
2.3 Participants were provided with a sealed vial (labelled R179) containing solutions of
metals (Chromium, Copper, Iron, Lead, Nickel, Thallium and Zinc). 2.4 A total of 47 laboratories received samples, comprising:
- 36 Australian participants; and
- 11 overseas participants, including:
- Brunei Darussalam (1), Indonesia (2), Kenya (1), Kingdom of Bahrain (1), Malaysia (3), New Zealand (1), Russia (1), Tanzania (1).
Of these 47 laboratories, two were unable to submit results by the due date. 2.5 Results (as reported by participants) with corresponding summary statistics (i.e.
number of results, median, normalised interquartile range, uncertainty of the median, robust coefficient of variation, minimum, maximum and range) are presented in Appendix A (for each of the analyses performed).
2.6 A robust statistical approach, using z-scores, was utilised to assess laboratories’
testing performance (see Section 3). Robust z-scores and ordered z-score charts relevant to each test are presented in Appendix A. The document entitled Guide to Proficiency Testing Australia, 2014 (reference [1]) defines the statistical terms and details the statistical procedures referred to in this report.
2
SD 9.17.09
2.7 A tabulated listing of laboratories (by code number) identified as having outlier results can be found on page 35.
2.8 Prior to sample distribution, a number of randomly selected samples were analysed
for homogeneity and stability. Based on the results of this testing (see Appendix B) it was considered that the samples utilised for this program were homogeneous and stable. As such, any results later identified as outliers could not be attributed to any notable sample variability.
3. Statistical Format
For each test, where appropriate, the following information is given:
- a table of results and calculated z-scores;
- a list of summary statistics; and
- ordered z-score charts.
3.1 Outlier Results and Z-scores In order to assess laboratories’ testing performance, a robust statistical approach,
using z-scores, was utilised. Z-scores give a measure of how far a result is from the consensus value (i.e. the median), and gives a "score" to each result relative to the other results in the group.
A z-score with an absolute value less than or equal to 2.0 is considered to be satisfactory, whereas, a z-score with an absolute value greater than or equal to 3.0 is considered to be an outlier and is marked by the symbol “§”. Laboratories are also encouraged to review results which have an absolute z-score value between 2.0 and 3.0 (i.e. 2.0 < |z-score| < 3.0). These results are considered to be questionable results.
Each determination was examined for outliers with all methods pooled. The table on
page 35 summarises the outlier results detected. 3.2 Results Tables and Summary Statistics The tables in Appendix A contain the results returned by each laboratory, including
the code number for the method used and the robust z-score calculated for each result.
Results have been entered exactly as reported by participants. That is, laboratories
which did not report results to the precision (i.e. number of decimal places) requested on the Results Sheet have not been rounded to the requested precision before being included in the statistical analysis.
3
SD 9.17.09
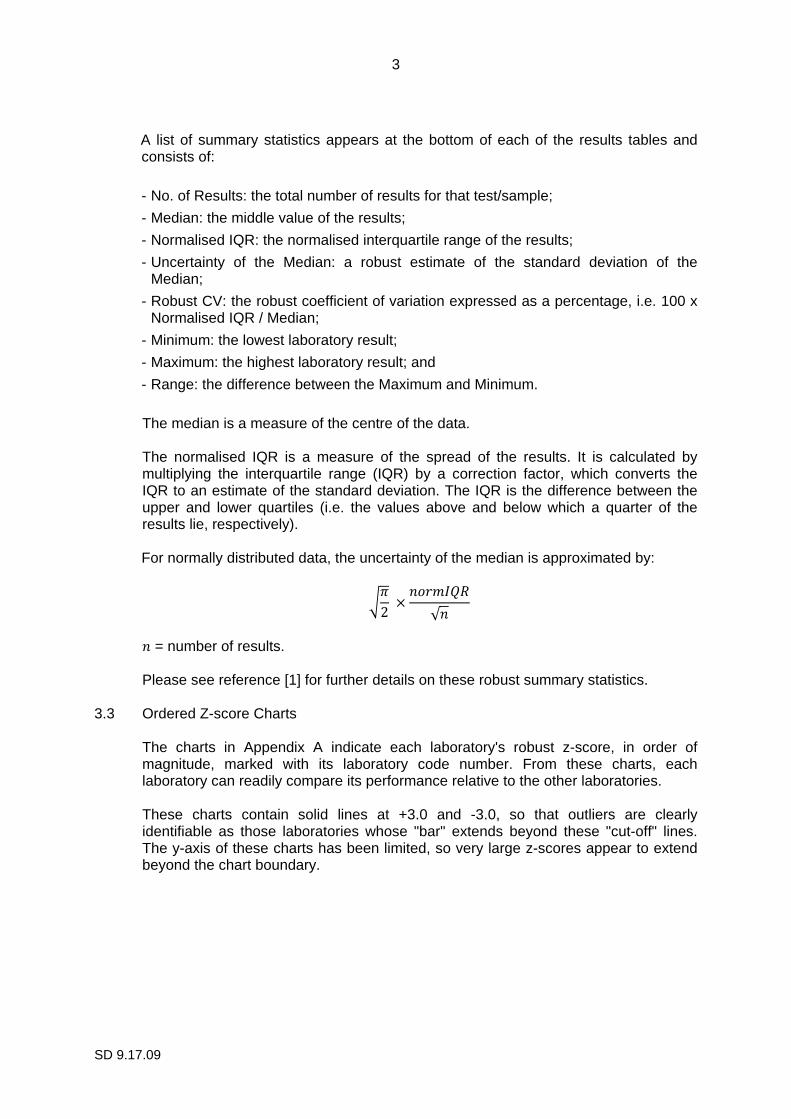
A list of summary statistics appears at the bottom of each of the results tables and consists of:
- No. of Results: the total number of results for that test/sample;
- Median: the middle value of the results;
- Normalised IQR: the normalised interquartile range of the results;
- Uncertainty of the Median: a robust estimate of the standard deviation of the Median;
- Robust CV: the robust coefficient of variation expressed as a percentage, i.e. 100 x Normalised IQR / Median;
- Minimum: the lowest laboratory result;
- Maximum: the highest laboratory result; and
- Range: the difference between the Maximum and Minimum.
The median is a measure of the centre of the data. The normalised IQR is a measure of the spread of the results. It is calculated by multiplying the interquartile range (IQR) by a correction factor, which converts the IQR to an estimate of the standard deviation. The IQR is the difference between the upper and lower quartiles (i.e. the values above and below which a quarter of the results lie, respectively). For normally distributed data, the uncertainty of the median is approximated by:
��2 ������
√�
� = number of results. Please see reference [1] for further details on these robust summary statistics.
3.3 Ordered Z-score Charts The charts in Appendix A indicate each laboratory's robust z-score, in order of
magnitude, marked with its laboratory code number. From these charts, each laboratory can readily compare its performance relative to the other laboratories.
These charts contain solid lines at +3.0 and -3.0, so that outliers are clearly
identifiable as those laboratories whose "bar" extends beyond these "cut-off" lines. The y-axis of these charts has been limited, so very large z-scores appear to extend beyond the chart boundary.
4
SD 9.17.09
4. PTA and Technical Adviser’s Comments 4.1 Metrological Traceability and Measurement Uncertainty of Assigned Values
Consensus values (median) derived from participants’ results are used in this program. These values are not metrologically traceable to an external reference.
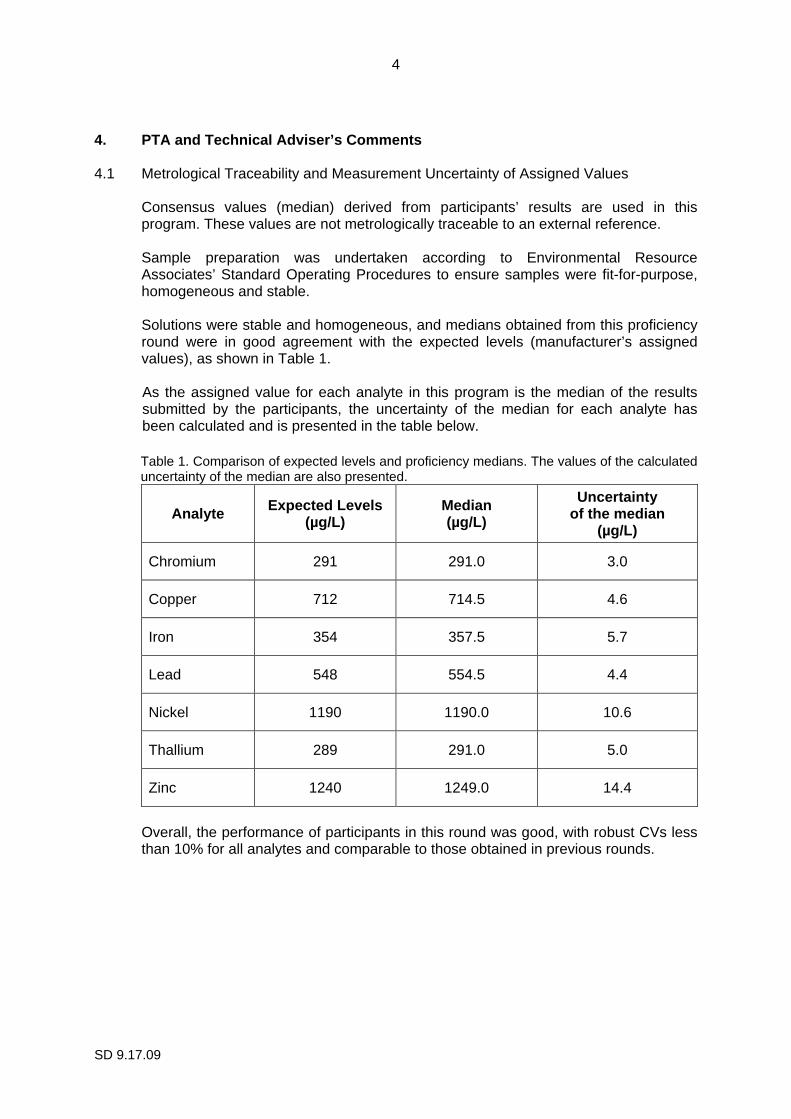
Sample preparation was undertaken according to Environmental Resource Associates’ Standard Operating Procedures to ensure samples were fit-for-purpose, homogeneous and stable. Solutions were stable and homogeneous, and medians obtained from this proficiency round were in good agreement with the expected levels (manufacturer’s assigned values), as shown in Table 1. As the assigned value for each analyte in this program is the median of the results submitted by the participants, the uncertainty of the median for each analyte has been calculated and is presented in the table below. Table 1. Comparison of expected levels and proficiency medians. The values of the calculated uncertainty of the median are also presented.
Analyte Expected Levels (µg/L)
Median (µg/L)
Uncertainty of the median
(µg/L)
Chromium 291 291.0 3.0
Copper 712 714.5 4.6
Iron 354 357.5 5.7
Lead 548 554.5 4.4
Nickel 1190 1190.0 10.6
Thallium 289 291.0 5.0
Zinc 1240 1249.0 14.4
Overall, the performance of participants in this round was good, with robust CVs less than 10% for all analytes and comparable to those obtained in previous rounds.

5
SD 9.17.09
4.2 Analysis of Round 179 Results 4.2.1 Chromium Table 2 compares the Chromium median and robust CV from this round to those obtained in previous PTA rounds. Table 2. Comparison of current round variability and proficiency median of Chromium testing with the results of the previous two rounds.
Round Sample Median (µg/L) Robust CV (%) Participan ts
This study R179 291.0 5.2 39
Report 862 R165 854.0 4.4 38
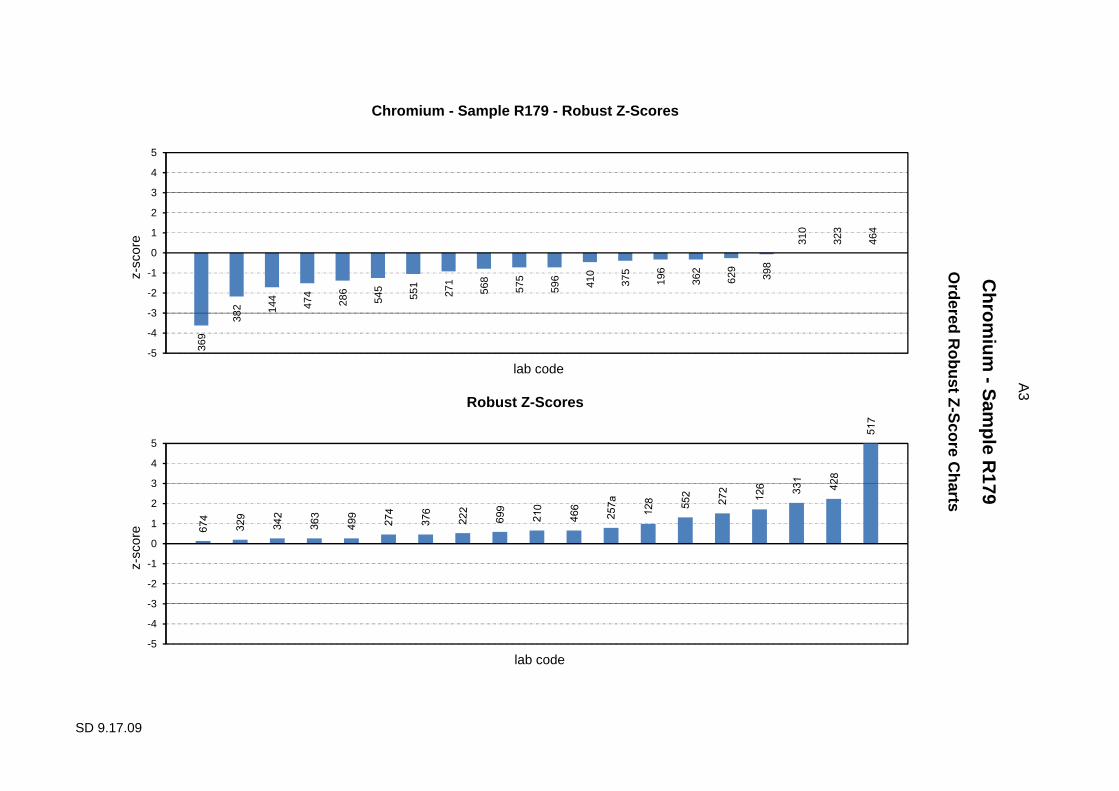
Report 805 R152 273.0 4.6 41 Bias / Accuracy The Chromium testing was successfully performed, with satisfactory results (|z-score| ≤ 2.0) ranging between 261 – 321 µg/L. Out of 39 participants, three questionable results (2.0 < |z-score| < 3.0) were reported (laboratories 331, 382 and 428). Two outlier results (|z-score| ≥ 3.0) were obtained, requiring follow-up action by laboratories 369 and 517. Figure 1 exhibits the spread of results and the methods used for Chromium testing in this round.
Figure 1. Spread of results for Chromium testing of sample R179, with a median of 291.0 µg/L.
0
2
4
6
8
10
12
14
16
18
195 210 225 240 255 270 285 300 315 330 345 360 375 390
Fre
quen
cy
Results (µg/L)
Chromium - Sample R179
APHA 3111 B
APHA 3120 B
APHA 3125 B
US EPA 0200.7
US EPA 0200.8
US EPA 6020 A
Other

6
SD 9.17.09
The data set formed an approximately normal distribution with no significant bias attributable to any one method. There was a large variety of methods used (Figure 1), with approximately 43.6% of participants using the method APHA 3120 B (Inductively Coupled Plasma / Atomic Emission Spectrometry). The remaining participants used other APHA methods (20.6%), US EPA methods (23.1%) or other methods (12.8%). Measurement Uncertainty (MU) The MU reported by participants can be seen in Figure 2. Out of 39 participants, 31 (79%) submitted MU information. Many of the stated MUs did not accurately reflect the difference between the median and the participant’s result for this proficiency sample.
Figure 2. MU for Chromium testing of sample R179, as reported by participants, compared with 95% confidence interval for overall reproducibility, ± 31.5 µg/L in this round, shown as a dashed line. A t-test of all the results (outliers removed), indicated that the overall reproducibility for Chromium testing was 291.0 ± 31.5 µg/L for sample R179 (95% CI). Laboratories 144, 272, 369, 382, 466 and 545 may wish to re-examine their MU calculations, as their result was further from the median than their stated MU, as shown in Figure 3 below.
0
1
2
3
4
5
6
7
8
0 10 20 30 40 50 60 70 80 90 100 110 120 130
Fre
quen
cy
Measurement Uncertainty (µg/L)
Chromium ± MU - Sample R179
APHA 3111 B
APHA 3120 B
APHA 3125 B
US EPA 0200.7
US EPA 0200.8
US EPA 6020 A
Other

7
SD
9.17.09
Results of sam
ple R179, including M
U, com
pared to the m
edian
Chrom
ium - S
ample R
179
Figure 3. Chromium - Results of sample R179, including MU, compared to the median.
190
215
240
265
290
315
340
365
390
126
128
144
196
210
222
257
a
271
272
274
286
310
323
329
363
369
375
376
382
398
410
428
464
466
499
545
551
568
596
629
674
Re
sults
(µg/
L)
Laboratory Code
Chromium - Sample R179
Result ± MU Median Uncertainty of the Median
8
SD 9.17.09
4.2.2 Copper Table 3 compares the Copper median and robust CV from this round to those obtained in previous PTA rounds. Table 3. Comparison of current round variability and proficiency median of Copper testing with the results of the previous two rounds.
Round Sample Median (µg/L) Robust CV (%) Participan ts
This study R179 714.5 3.4 44
Report 862 R165 775.5 4.0 44
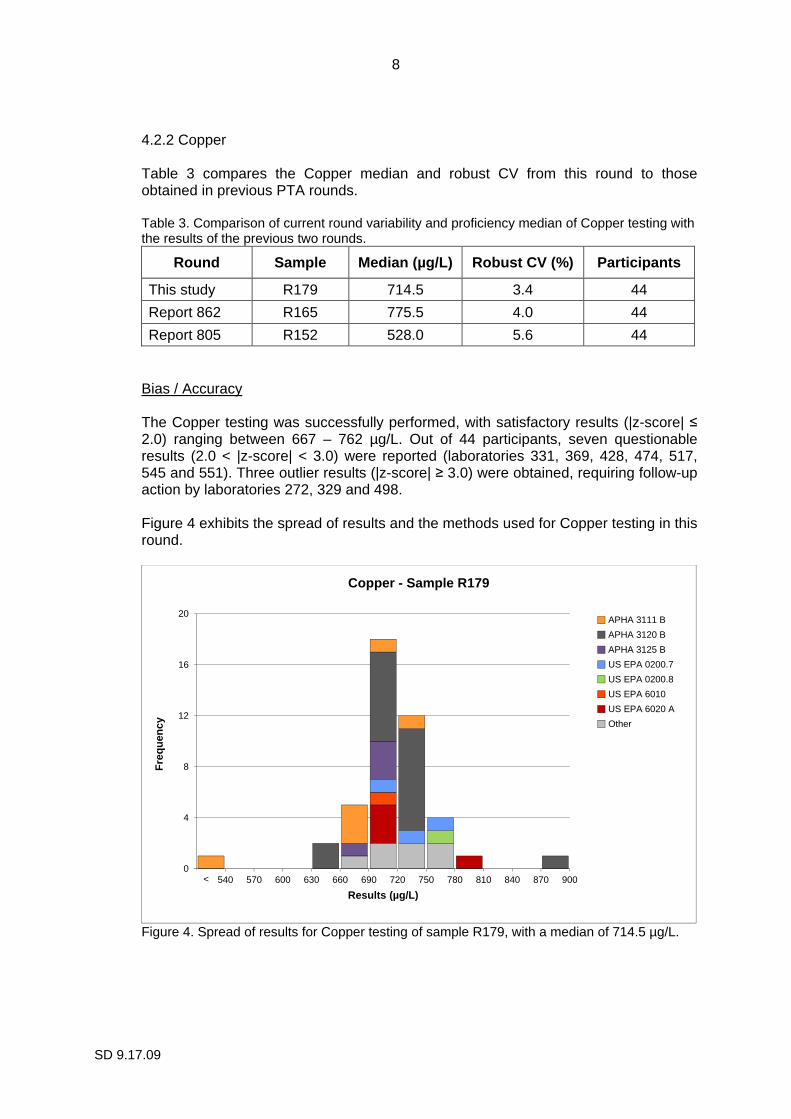
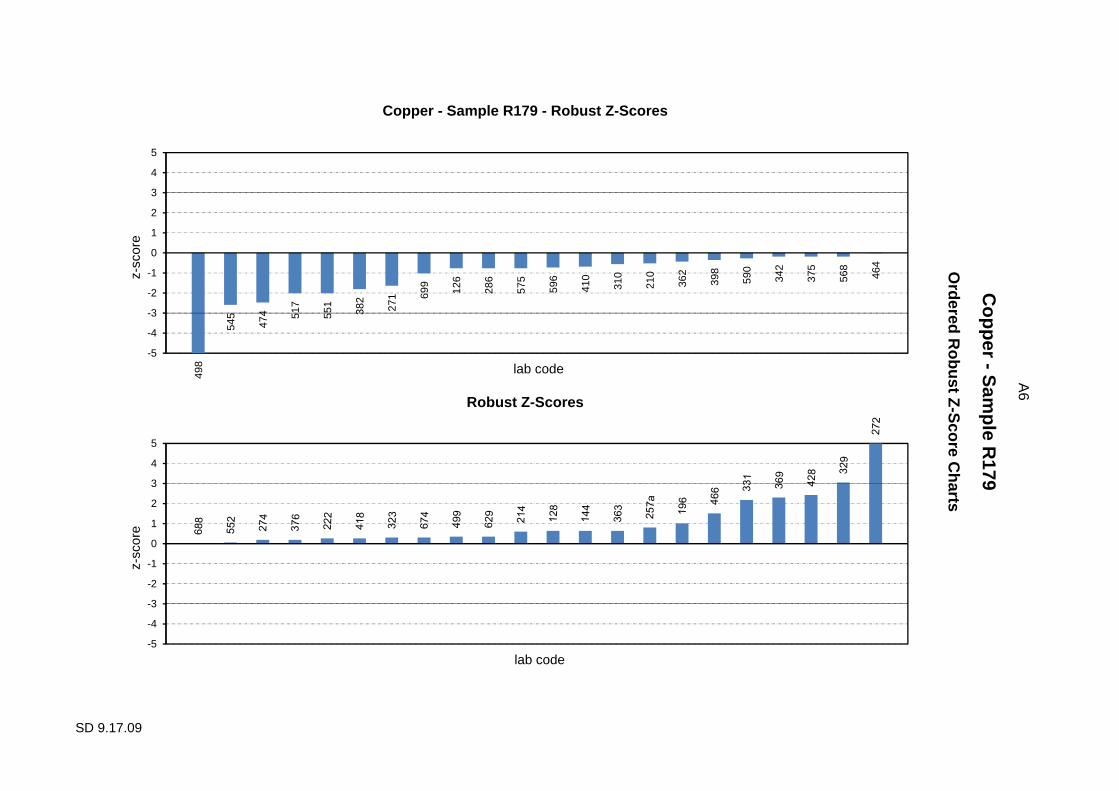
Report 805 R152 528.0 5.6 44 Bias / Accuracy The Copper testing was successfully performed, with satisfactory results (|z-score| ≤ 2.0) ranging between 667 – 762 µg/L. Out of 44 participants, seven questionable results (2.0 < |z-score| < 3.0) were reported (laboratories 331, 369, 428, 474, 517, 545 and 551). Three outlier results (|z-score| ≥ 3.0) were obtained, requiring follow-up action by laboratories 272, 329 and 498. Figure 4 exhibits the spread of results and the methods used for Copper testing in this round.
Figure 4. Spread of results for Copper testing of sample R179, with a median of 714.5 µg/L.
0
4
8
12
16
20
510 540 570 600 630 660 690 720 750 780 810 840 870 900
Fre
quen
cy
Results (µg/L)
Copper - Sample R179
APHA 3111 B
APHA 3120 B
APHA 3125 B
US EPA 0200.7
US EPA 0200.8
US EPA 6010
US EPA 6020 A
Other
<
9
SD 9.17.09
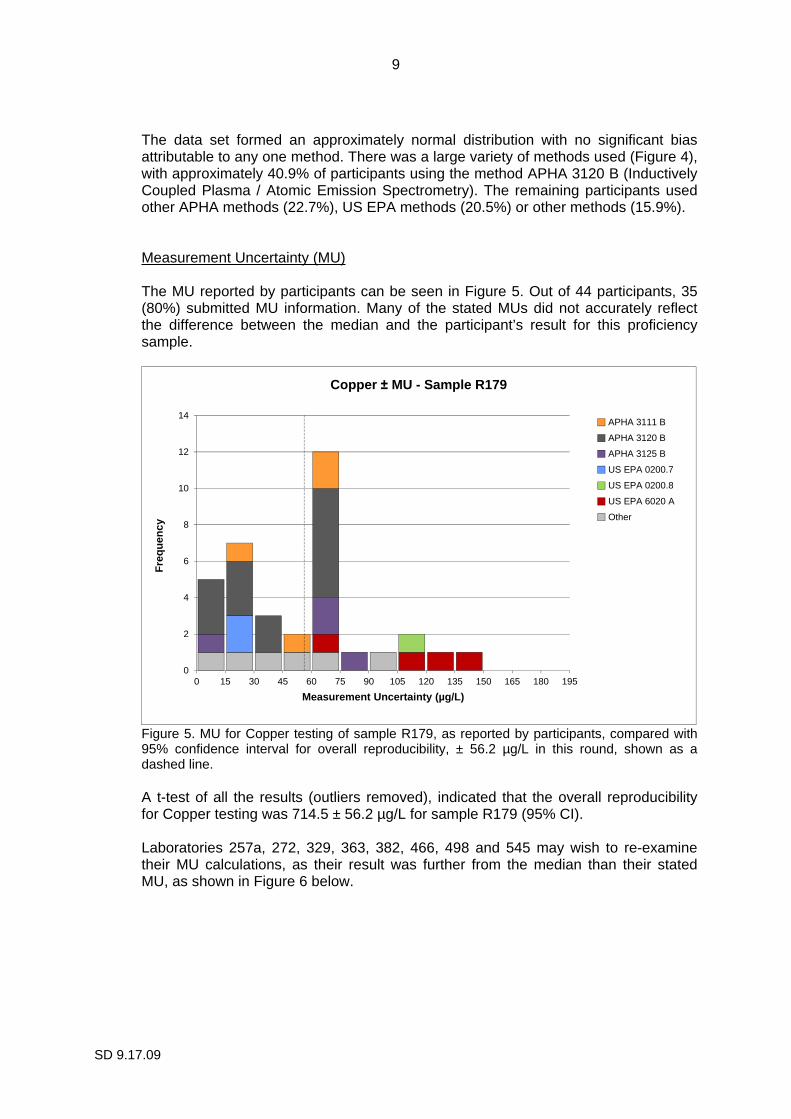
The data set formed an approximately normal distribution with no significant bias attributable to any one method. There was a large variety of methods used (Figure 4), with approximately 40.9% of participants using the method APHA 3120 B (Inductively Coupled Plasma / Atomic Emission Spectrometry). The remaining participants used other APHA methods (22.7%), US EPA methods (20.5%) or other methods (15.9%). Measurement Uncertainty (MU) The MU reported by participants can be seen in Figure 5. Out of 44 participants, 35 (80%) submitted MU information. Many of the stated MUs did not accurately reflect the difference between the median and the participant’s result for this proficiency sample.
Figure 5. MU for Copper testing of sample R179, as reported by participants, compared with 95% confidence interval for overall reproducibility, ± 56.2 µg/L in this round, shown as a dashed line. A t-test of all the results (outliers removed), indicated that the overall reproducibility for Copper testing was 714.5 ± 56.2 µg/L for sample R179 (95% CI). Laboratories 257a, 272, 329, 363, 382, 466, 498 and 545 may wish to re-examine their MU calculations, as their result was further from the median than their stated MU, as shown in Figure 6 below.
0
2
4
6
8
10
12
14
0 15 30 45 60 75 90 105 120 135 150 165 180 195
Fre
quen
cy
Measurement Uncertainty (µg/L)
Copper ± MU - Sample R179
APHA 3111 B
APHA 3120 B
APHA 3125 B
US EPA 0200.7
US EPA 0200.8
US EPA 6020 A
Other
10
SD
9.17.09
Results of sam
ple R179, including M
U, com
pared to the m
edian
Copper - S
ample R
179
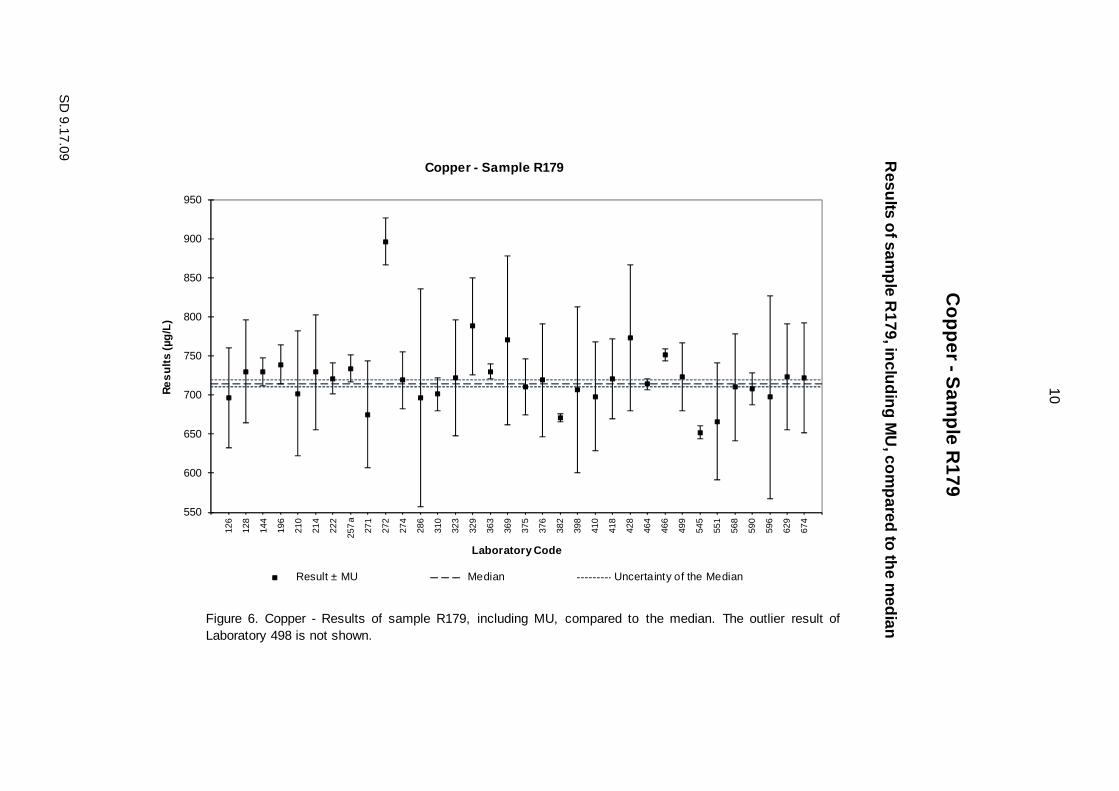
Figure 6. Copper - Results of sample R179, including MU, compared to the median. The outlier result ofLaboratory 498 is not shown.
550
600
650
700
750
800
850
900
950
126
128
144
196
210
214
222
257
a
271
272
274
286
310
323
329
363
369
375
376
382
398
410
418
428
464
466
499
545
551
568
590
596
629
674
Re
sults
(µg/
L)
Laboratory Code
Copper - Sample R179
Result ± MU Median Uncertainty of the Median
11
SD 9.17.09
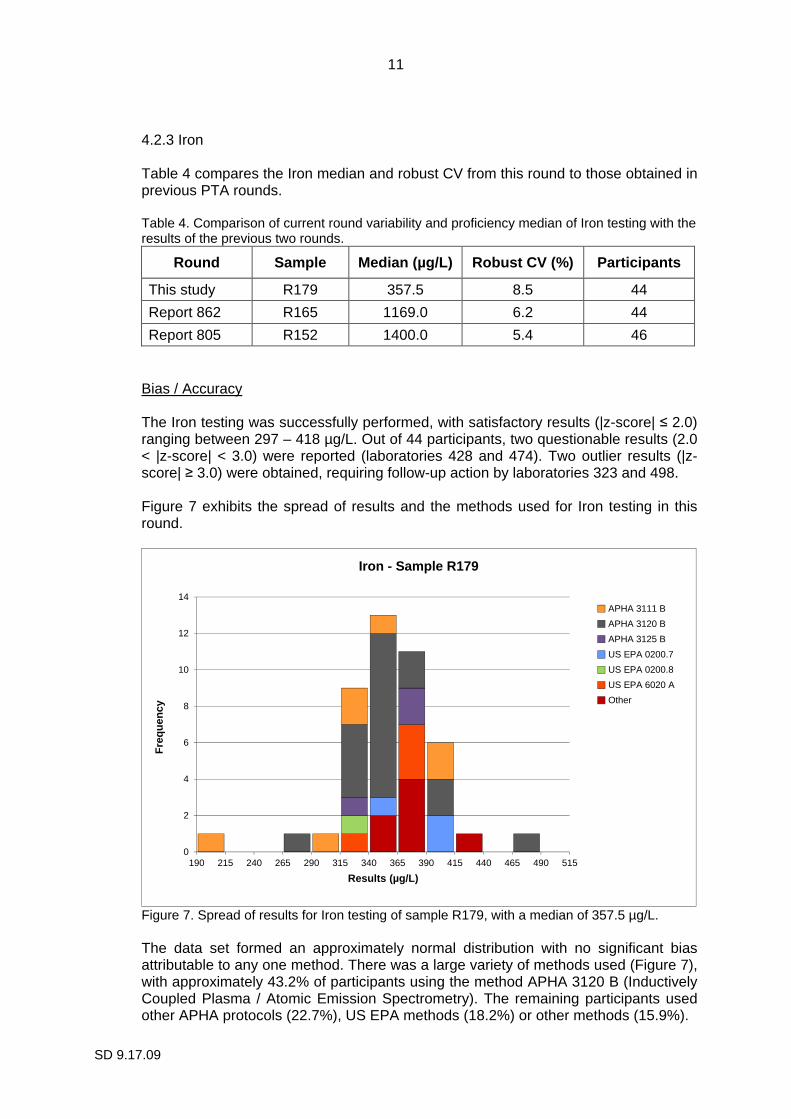
4.2.3 Iron Table 4 compares the Iron median and robust CV from this round to those obtained in previous PTA rounds. Table 4. Comparison of current round variability and proficiency median of Iron testing with the results of the previous two rounds.
Round Sample Median (µg/L) Robust CV (%) Participan ts
This study R179 357.5 8.5 44
Report 862 R165 1169.0 6.2 44
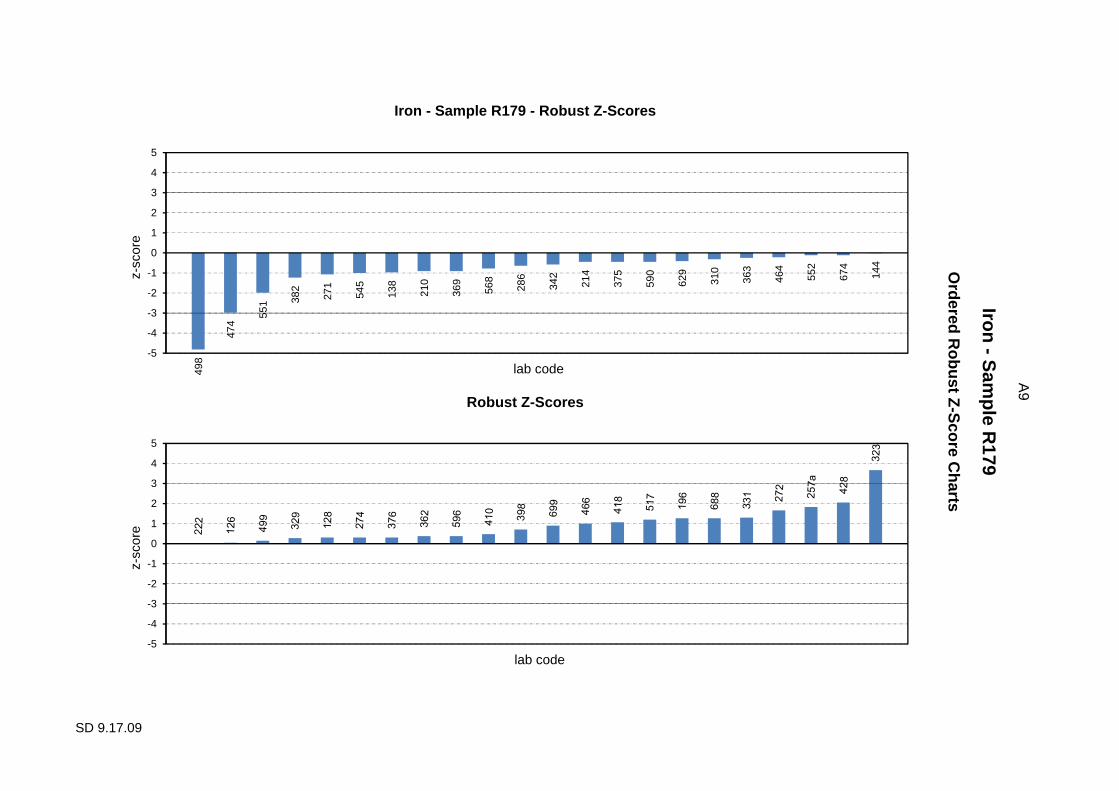
Report 805 R152 1400.0 5.4 46 Bias / Accuracy The Iron testing was successfully performed, with satisfactory results (|z-score| ≤ 2.0) ranging between 297 – 418 µg/L. Out of 44 participants, two questionable results (2.0 < |z-score| < 3.0) were reported (laboratories 428 and 474). Two outlier results (|z-score| ≥ 3.0) were obtained, requiring follow-up action by laboratories 323 and 498. Figure 7 exhibits the spread of results and the methods used for Iron testing in this round.
Figure 7. Spread of results for Iron testing of sample R179, with a median of 357.5 µg/L. The data set formed an approximately normal distribution with no significant bias attributable to any one method. There was a large variety of methods used (Figure 7), with approximately 43.2% of participants using the method APHA 3120 B (Inductively Coupled Plasma / Atomic Emission Spectrometry). The remaining participants used other APHA protocols (22.7%), US EPA methods (18.2%) or other methods (15.9%).
0
2
4
6
8
10
12
14
190 215 240 265 290 315 340 365 390 415 440 465 490 515
Fre
quen
cy
Results (µg/L)
Iron - Sample R179
APHA 3111 B
APHA 3120 B
APHA 3125 B
US EPA 0200.7
US EPA 0200.8
US EPA 6020 A
Other
12
SD 9.17.09
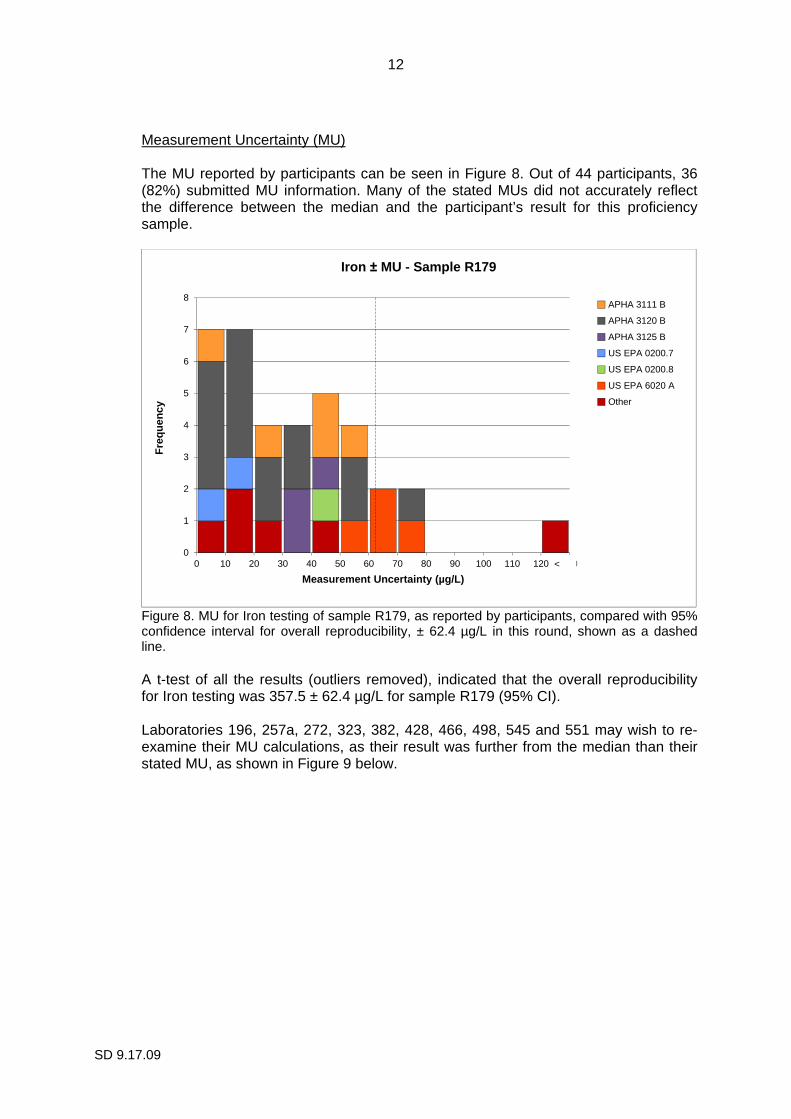
Measurement Uncertainty (MU) The MU reported by participants can be seen in Figure 8. Out of 44 participants, 36 (82%) submitted MU information. Many of the stated MUs did not accurately reflect the difference between the median and the participant’s result for this proficiency sample.
Figure 8. MU for Iron testing of sample R179, as reported by participants, compared with 95% confidence interval for overall reproducibility, ± 62.4 µg/L in this round, shown as a dashed line. A t-test of all the results (outliers removed), indicated that the overall reproducibility for Iron testing was 357.5 ± 62.4 µg/L for sample R179 (95% CI). Laboratories 196, 257a, 272, 323, 382, 428, 466, 498, 545 and 551 may wish to re-examine their MU calculations, as their result was further from the median than their stated MU, as shown in Figure 9 below.
0
1
2
3
4
5
6
7
8
0 10 20 30 40 50 60 70 80 90 100 110 120 130
Fre
quen
cy
Measurement Uncertainty (µg/L)
Iron ± MU - Sample R179
APHA 3111 B
APHA 3120 B
APHA 3125 B
US EPA 0200.7
US EPA 0200.8
US EPA 6020 A
Other
<
13
SD
9.17.09
Results of sam
ple R179, including M
U, com
pared to the m
edian
Iron - Sam
ple R179
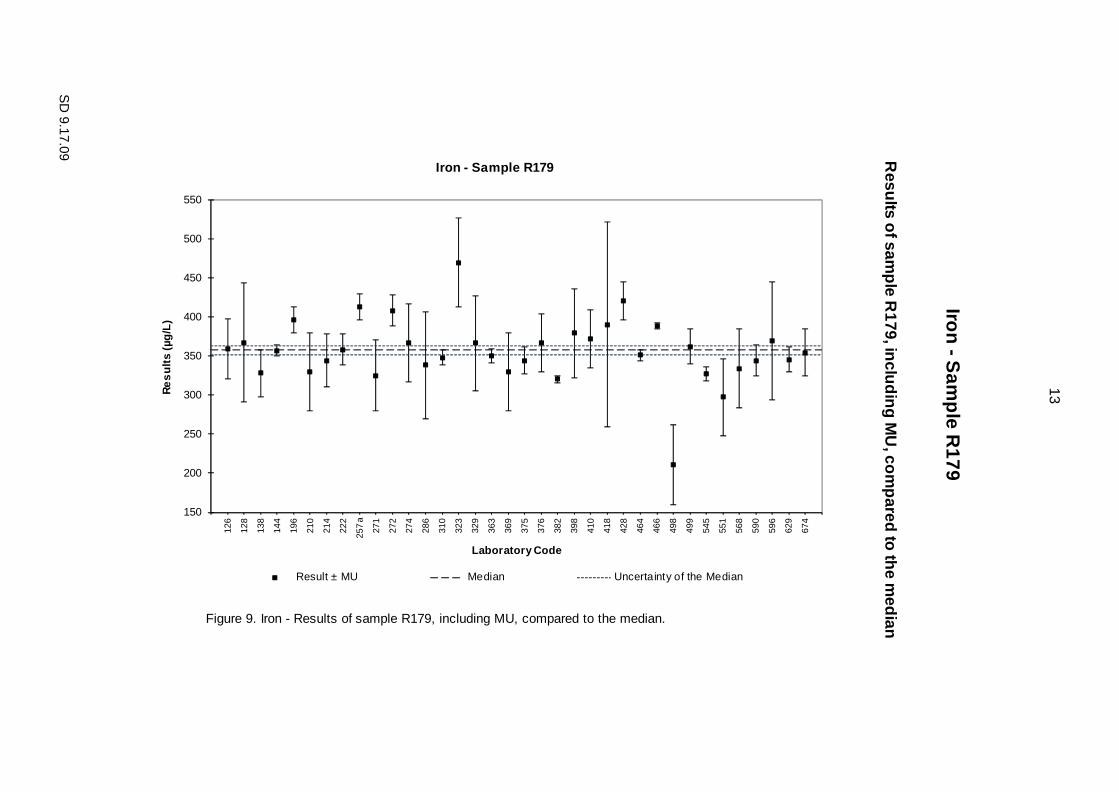
Figure 9. Iron - Results of sample R179, including MU, compared to the median.
150
200
250
300
350
400
450
500
550
126
128
138
144
196
210
214
222
257
a
271
272
274
286
310
323
329
363
369
375
376
382
398
410
418
428
464
466
498
499
545
551
568
590
596
629
674
Re
sults
(µg/
L)
Laboratory Code
Iron - Sample R179
Result ± MU Median Uncertainty of the Median
14
SD 9.17.09
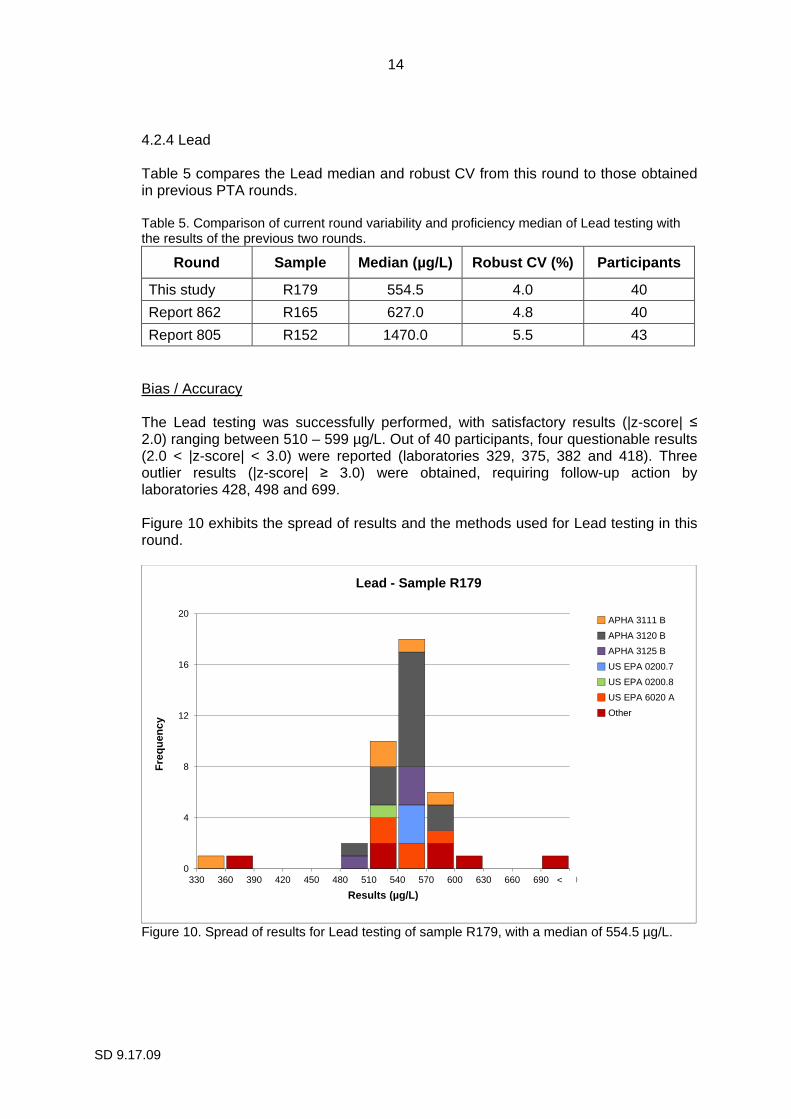
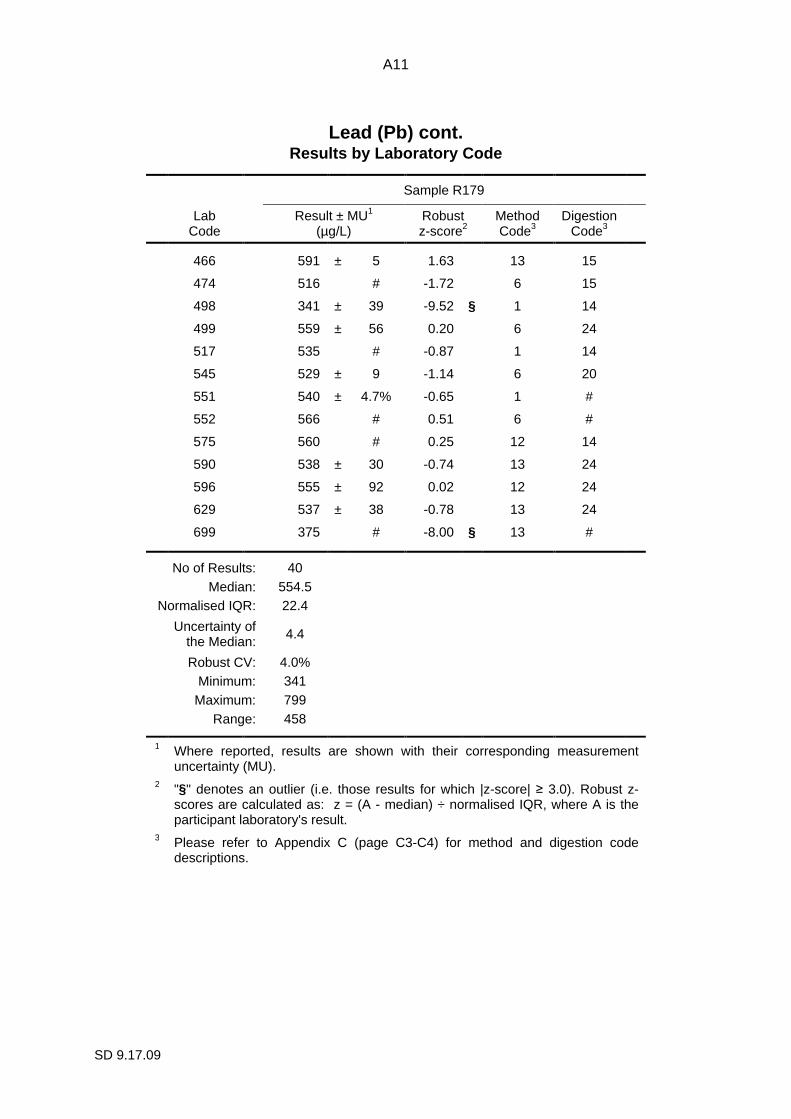
4.2.4 Lead Table 5 compares the Lead median and robust CV from this round to those obtained in previous PTA rounds. Table 5. Comparison of current round variability and proficiency median of Lead testing with the results of the previous two rounds.
Round Sample Median (µg/L) Robust CV (%) Participan ts
This study R179 554.5 4.0 40
Report 862 R165 627.0 4.8 40
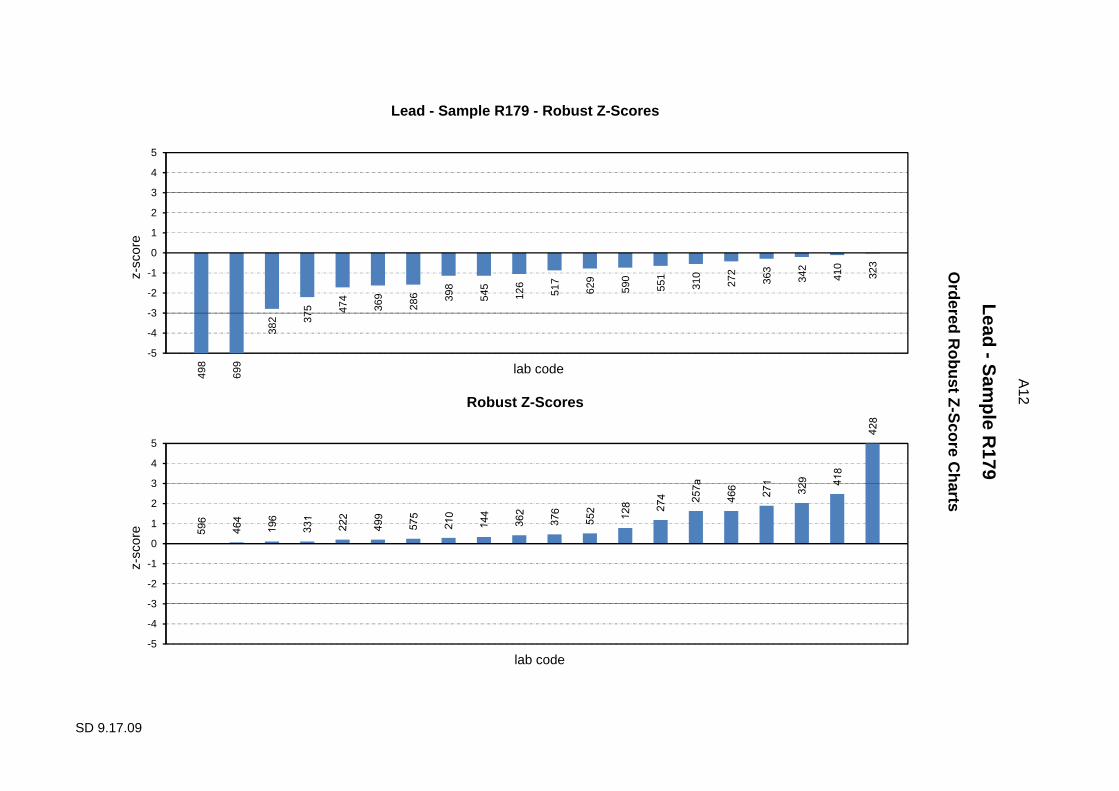
Report 805 R152 1470.0 5.5 43 Bias / Accuracy The Lead testing was successfully performed, with satisfactory results (|z-score| ≤ 2.0) ranging between 510 – 599 µg/L. Out of 40 participants, four questionable results (2.0 < |z-score| < 3.0) were reported (laboratories 329, 375, 382 and 418). Three outlier results (|z-score| ≥ 3.0) were obtained, requiring follow-up action by laboratories 428, 498 and 699. Figure 10 exhibits the spread of results and the methods used for Lead testing in this round.
Figure 10. Spread of results for Lead testing of sample R179, with a median of 554.5 µg/L.
0
4
8
12
16
20
330 360 390 420 450 480 510 540 570 600 630 660 690 720
Fre
quen
cy
Results (µg/L)
Lead - Sample R179
APHA 3111 B
APHA 3120 B
APHA 3125 B
US EPA 0200.7
US EPA 0200.8
US EPA 6020 A
Other
<

15
SD 9.17.09
The data set formed an approximately normal distribution with no significant bias attributable to any one method. There was a large variety of methods used (Figure 10), with approximately 37.5% of participants using the method APHA 3120 B (Inductively Coupled Plasma / Atomic Emission Spectrometry). The remaining participants used other APHA protocols (22.5%), US EPA methods (22.5%) or other methods (17.5%). Measurement Uncertainty (MU) The MU reported by participants can be seen in Figure 11. Out of 40 participants, 32 (80%) submitted MU information. Many of the stated MUs did not accurately reflect the difference between the median and the participant’s result for this proficiency sample.
Figure 11. MU for Lead testing of sample R179, as reported by participants, compared with 95% confidence interval for overall reproducibility, ± 53.2 µg/L in this round, shown as a dashed line. A t-test of all the results (outliers removed), indicated that the overall reproducibility for Lead testing was 554.5 ± 53.2 µg/L for sample R179 (95% CI). Laboratories 257a, 375, 382, 428, 466, 498 and 545 may wish to re-examine their MU calculations, as their result was further from the median than their stated MU, as shown in Figure 12 below.
0
1
2
3
4
5
6
7
8
9
10
0 20 40 60 80 100 120 140 160 180 200 220 240 260
Fre
quen
cy
Measurement Uncertainty (µg/L)
Lead ± MU - Sample R179
APHA 3111 B
APHA 3120 B
APHA 3125 B
US EPA 0200.7
US EPA 0200.8
US EPA 6020 A
Other

16
SD
9.17.09
Results of sam
ple R179, including M
U, com
pared to the m
edian
Lead - Sam
ple R179
Figure 12. Lead - Results of sample R179, including MU, compared to the median.
250
350
450
550
650
750
850
126
128
144
196
210
222
257
a
271
272
274
286
310
323
329
363
369
375
376
382
398
410
418
428
464
466
498
499
545
551
590
596
629
Re
sults
(µg/
L)
Laboratory Code
Lead - Sample R179
Result ± MU Median Uncertainty of the Median

17
SD 9.17.09
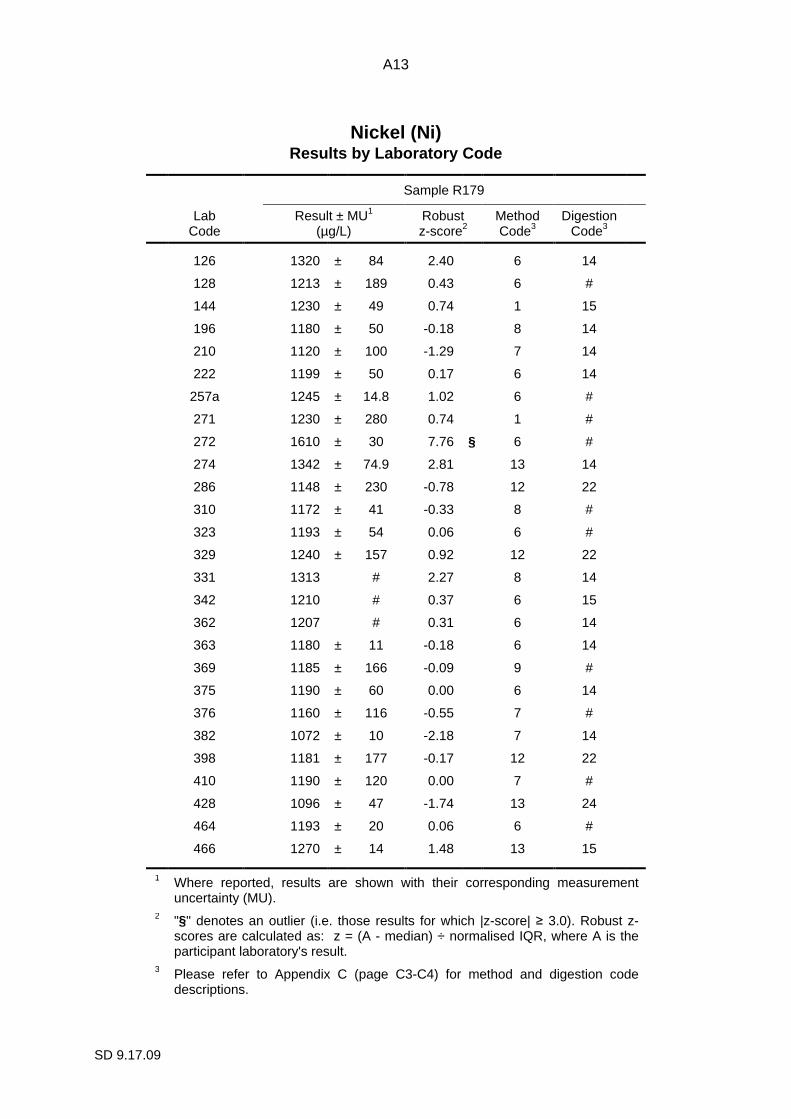
4.2.5 Nickel Table 6 compares the Nickel median and robust CV from this round to those obtained in previous PTA rounds. Table 6. Comparison of current round variability and proficiency median of Nickel testing with the results of the previous two rounds.
Round Sample Median (µg/L) Robust CV (%) Participan ts
This study R179 1190.0 4.5 41
Report 862 R165 1280.0 3.5 40
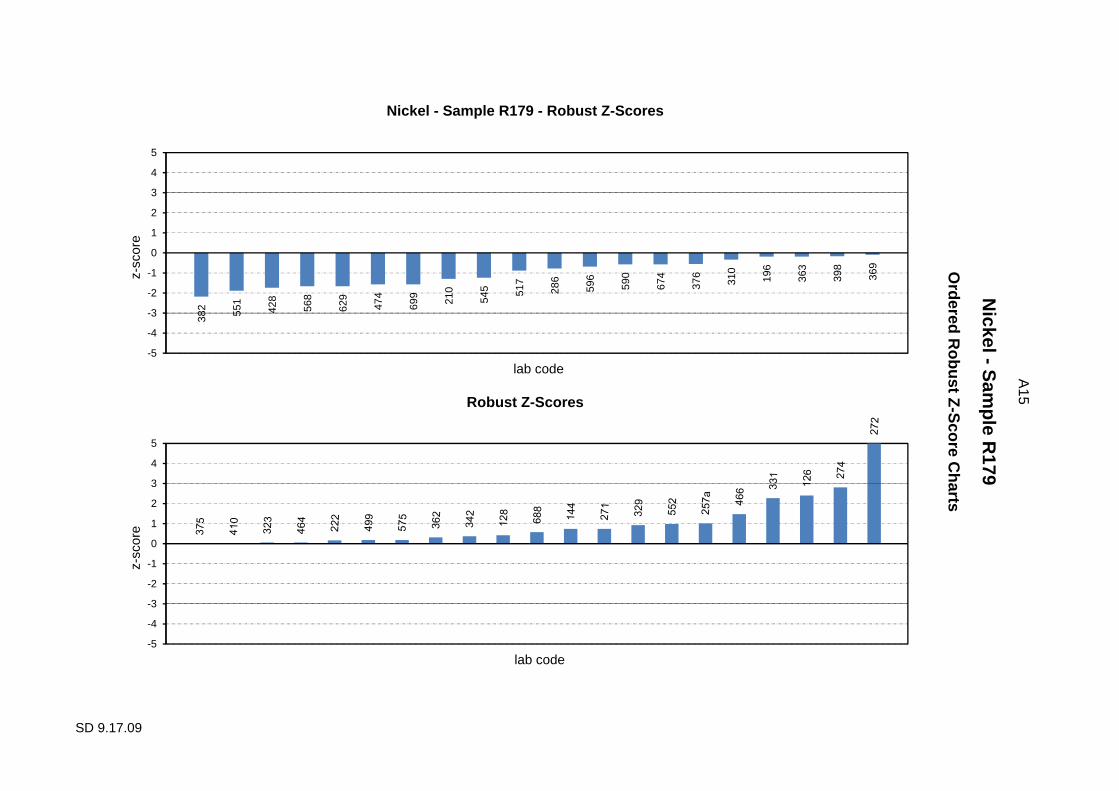
Report 805 R152 1360.0 6.3 43 Bias / Accuracy The Nickel testing was successfully performed, with satisfactory results (|z-score| ≤ 2.0) ranging between 1082 – 1298 µg/L. Out of 41 participants, four questionable results (2.0 < |z-score| < 3.0) were reported (laboratories 126, 274, 331 and 382). One outlier result (|z-score| ≥ 3.0) was obtained, requiring follow-up action by laboratory 272. Figure 13 exhibits the spread of results and the methods used for Nickel testing in this round.
Figure 13. Spread of results for Nickel testing of sample R179, with a median of 1190.0 µg/L.
0
2
4
6
8
10
12
14
955 1000 1045 1090 1135 1180 1225 1270 1315 1360 1405 1450 1495 1540
Fre
quen
cy
Results (µg/L)
Nickel - Sample R179
APHA 3111 B
APHA 3120 B
APHA 3125 B
US EPA 0200.7
US EPA 0200.8
US EPA 6020 A
Other
<

18
SD 9.17.09
The data set formed an approximately normal distribution with no significant bias attributable to any one method. There was a large variety of methods used (Figure 13), with approximately 41.5% of participants using the method APHA 3120 B (Inductively Coupled Plasma / Atomic Emission Spectrometry). The remaining participants used other APHA protocols (22.0%), US EPA methods (21.9%) or other methods (14.6%). Measurement Uncertainty (MU) The MU reported by participants can be seen in Figure 14. Out of 41 participants, 32 (78%) submitted MU information. Many of the stated MUs did not accurately reflect the difference between the median and the participant’s result for this proficiency sample.
Figure 14. MU for Nickel testing of sample R179, as reported by participants, compared with 95% confidence interval for overall reproducibility, ± 128.1 µg/L in this round, shown as a dashed line. A t-test of all the results (outliers removed), indicated that the overall reproducibility for Nickel testing was 1190.0 ± 128.1 µg/L for sample R179 (95% CI). Laboratories 126, 257a, 272, 274, 382, 428, 466, 545 and 629 may wish to re-examine their MU calculations, as their result was further from the median than their stated MU, as shown in Figure 15 below.
0
1
2
3
4
5
6
7
8
0 25 50 75 100 125 150 175 200 225 250 275 300 325
Fre
quen
cy
Measurement Uncertainty (µg/L)
Nickel ± MU - Sample R179
APHA 3111 B
APHA 3120 B
APHA 3125 B
US EPA 0200.7
US EPA 0200.8
US EPA 6020 A
Other
19
SD
9.17.09
Results of sam
ple R179, including M
U, com
pared to the m
edian
Nickel - S
ample R
179
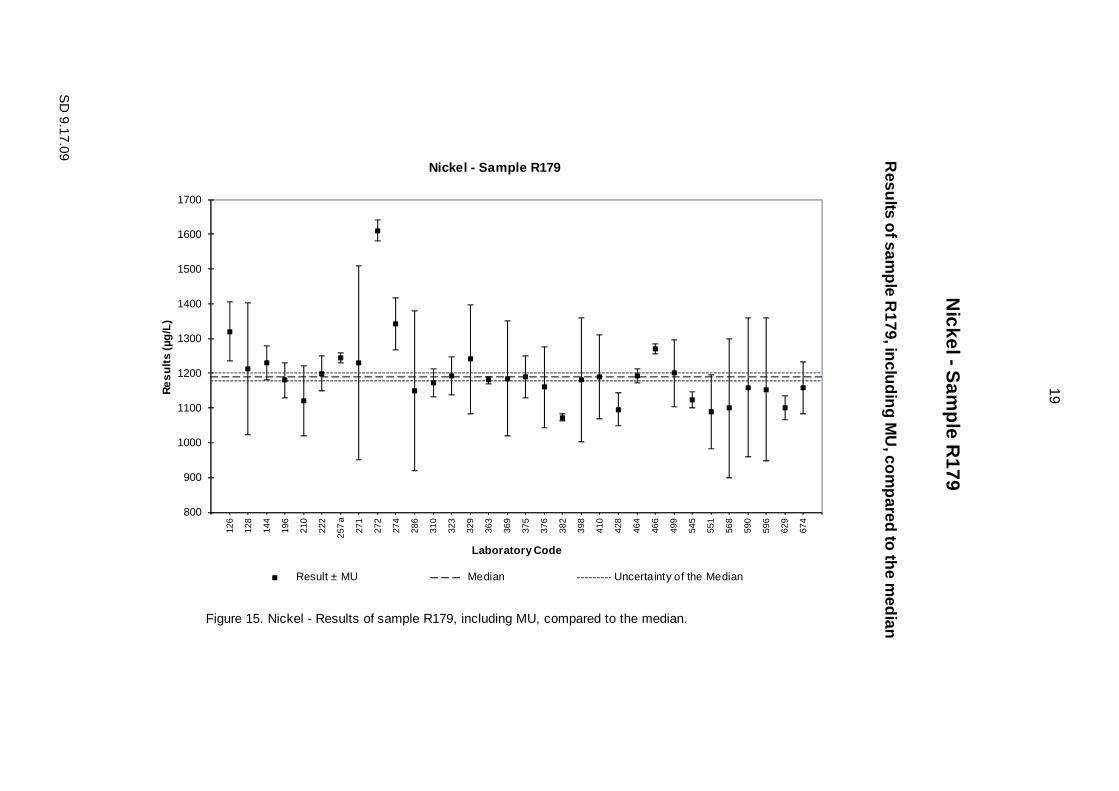
Figure 15. Nickel - Results of sample R179, including MU, compared to the median.
800
900
1000
1100
1200
1300
1400
1500
1600
1700
126
128
144
196
210
222
257
a
271
272
274
286
310
323
329
363
369
375
376
382
398
410
428
464
466
499
545
551
568
590
596
629
674
Re
sults
(µg/
L)
Laboratory Code
Nickel - Sample R179
Result ± MU Median Uncertainty of the Median
20
SD 9.17.09
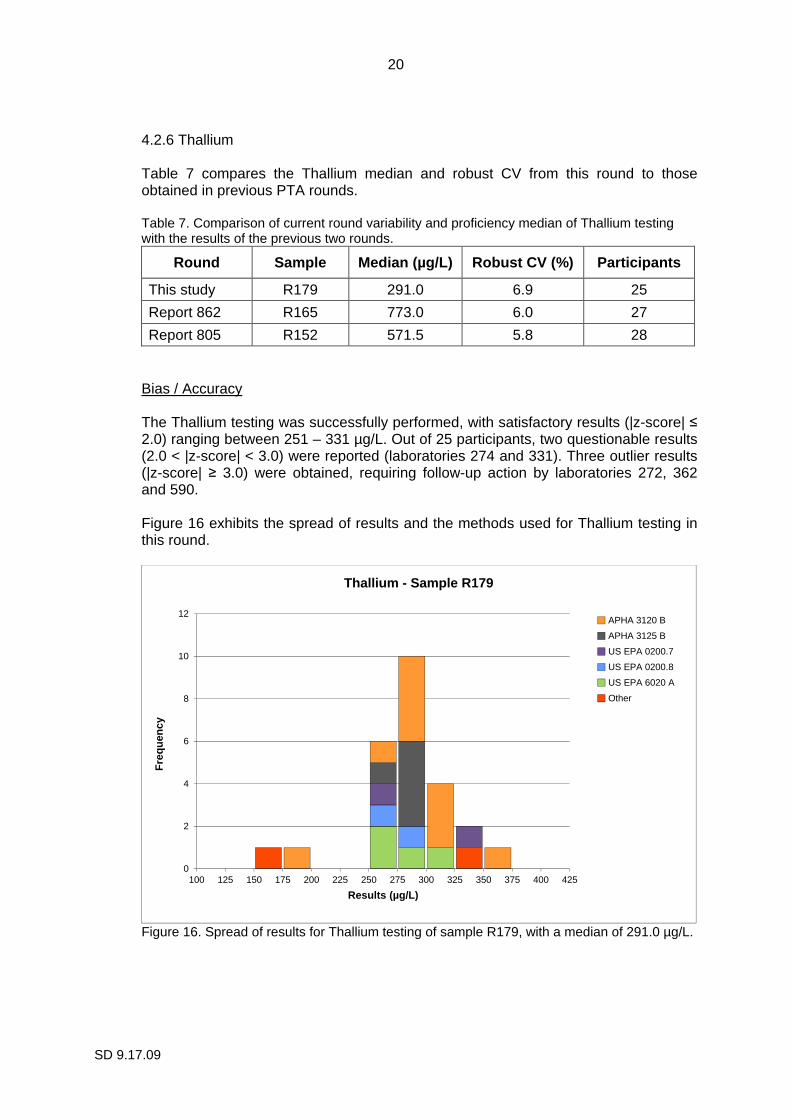
4.2.6 Thallium Table 7 compares the Thallium median and robust CV from this round to those obtained in previous PTA rounds. Table 7. Comparison of current round variability and proficiency median of Thallium testing with the results of the previous two rounds.
Round Sample Median (µg/L) Robust CV (%) Participan ts
This study R179 291.0 6.9 25
Report 862 R165 773.0 6.0 27
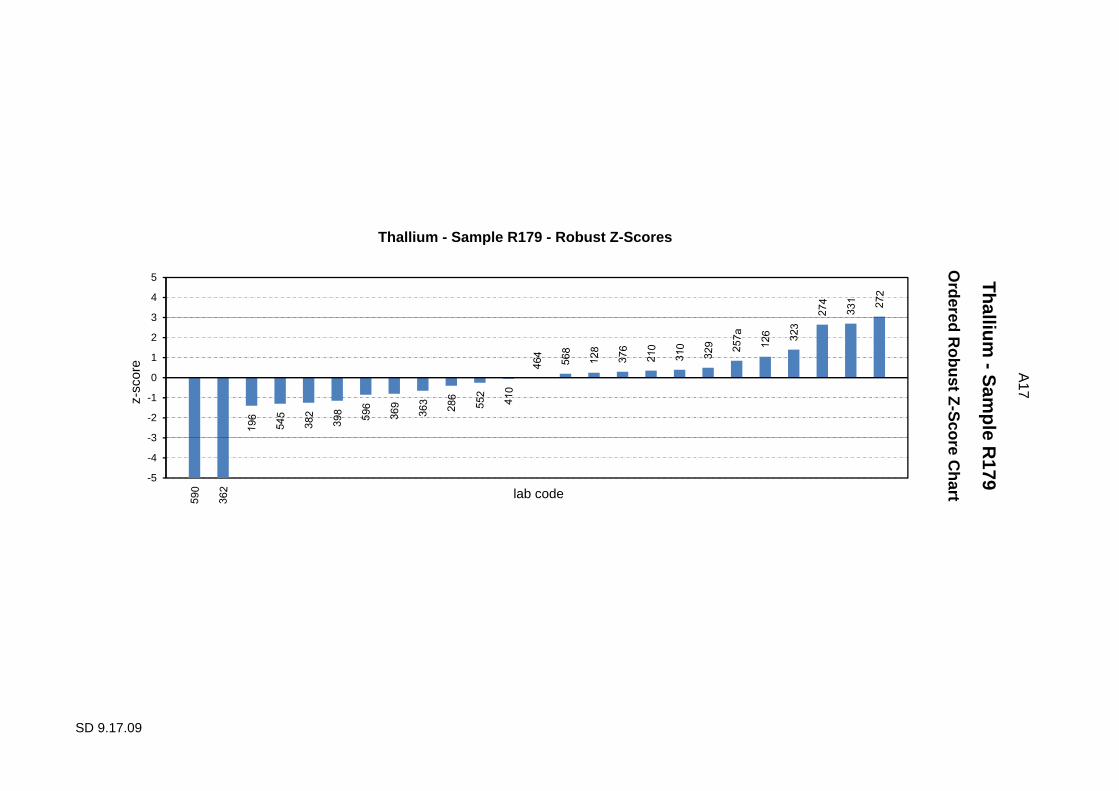
Report 805 R152 571.5 5.8 28 Bias / Accuracy The Thallium testing was successfully performed, with satisfactory results (|z-score| ≤ 2.0) ranging between 251 – 331 µg/L. Out of 25 participants, two questionable results (2.0 < |z-score| < 3.0) were reported (laboratories 274 and 331). Three outlier results (|z-score| ≥ 3.0) were obtained, requiring follow-up action by laboratories 272, 362 and 590. Figure 16 exhibits the spread of results and the methods used for Thallium testing in this round.
Figure 16. Spread of results for Thallium testing of sample R179, with a median of 291.0 µg/L.
0
2
4
6
8
10
12
100 125 150 175 200 225 250 275 300 325 350 375 400 425
Fre
quen
cy
Results (µg/L)
Thallium - Sample R179
APHA 3120 B
APHA 3125 B
US EPA 0200.7
US EPA 0200.8
US EPA 6020 A
Other

21
SD 9.17.09
The data set formed an approximately normal distribution with no significant bias attributable to any one method. There was a large variety of methods used (Figure 16), with approximately 40.0% of participants using the method APHA 3120 B (Inductively Coupled Plasma / Atomic Emission Spectrometry) and 20.0% using APHA Part 3125 B (Inductively Coupled Plasma / Mass Spectrometry). The remaining participants used US EPA methods (32.0%) or other methods (8.0%). Measurement Uncertainty (MU) The MU reported by participants can be seen in Figure 17. Out of 25 participants, 22 (88%) submitted MU information. Many of the stated MUs did not accurately reflect the difference between the median and the participant’s result for this proficiency sample.
Figure 17. MU for Thallium testing of sample R179, as reported by participants, compared with 95% confidence interval for overall reproducibility, ± 47.2 µg/L in this round, shown as a dashed line. A t-test of all the results (outliers removed), indicated that the overall reproducibility for Thallium testing was 291.0 ± 47.2 µg/L for sample R179 (95% CI). Laboratories 196, 272, 274, 382, 545 and 590 may wish to re-examine their MU calculations, as their result was further from the median than their stated MU, as shown in Figure 18 below.
0
1
2
3
4
5
6
0 10 20 30 40 50 60 70 80 90 100 110 120 130
Fre
quen
cy
Measurement Uncertainty (µg/L)
Thallium ± MU - Sample R179
APHA 3120 B
APHA 3125 B
US EPA 0200.7
US EPA 0200.8
US EPA 6020 A
Other
22
SD
9.17.09
Results of sam
ple R179, including M
U, com
pared to the m
edian
Thallium
- Sam
ple R179
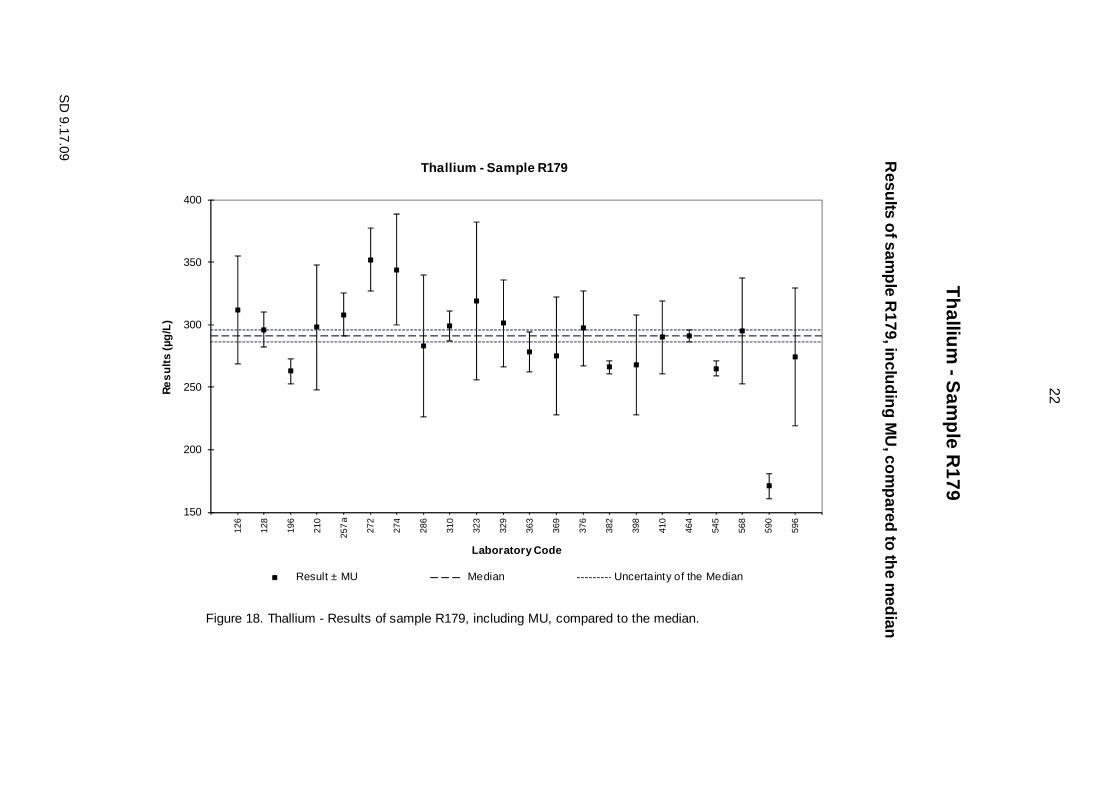
Figure 18. Thallium - Results of sample R179, including MU, compared to the median.
150
200
250
300
350
400
126
128
196
210
257
a
272
274
286
310
323
329
363
369
376
382
398
410
464
545
568
590
596
Re
sults
(µg/
L)
Laboratory Code
Thallium - Sample R179
Result ± MU Median Uncertainty of the Median

23
SD 9.17.09
4.2.7 Zinc Table 8 compares the Zinc median and robust CV from this round to those obtained in previous PTA rounds. Table 8. Comparison of current round variability and proficiency median of Zinc testing with the results of the previous two rounds.
Round Sample Median (µg/L) Robust CV (%) Participan ts
This study R179 1249.0 6.1 44
Report 862 R165 830.0 4.5 45
Report 805 R152 1304.0 6.3 47 Bias / Accuracy The Zinc testing was successfully performed, with satisfactory results (|z-score| ≤ 2.0) ranging between 1098 – 1400 µg/L. Out of 44 participants, five questionable results (2.0 < |z-score| < 3.0) were reported (laboratories 274, 369, 474, 517 and 575). Five outlier results (|z-score| ≥ 3.0) were obtained, requiring follow-up action by laboratories 210, 272, 323, 428 and 498. Figure 19 exhibits the spread of results and the methods used for Zinc testing in this round.
Figure 19. Spread of results for Zinc testing of sample R179, with a median of 1249.0 µg/L.
0
4
8
12
16
20
24
500 600 700 800 900 1000 1100 1200 1300 1400 1500 1600 1700 1800
Fre
quen
cy
Results (µg/L)
Zinc - Sample R179
APHA 3111 B
APHA 3120 B
APHA 3125 B
US EPA 0200.7
US EPA 0200.8
US EPA 6010
US EPA 6020 A
Other
24
SD 9.17.09
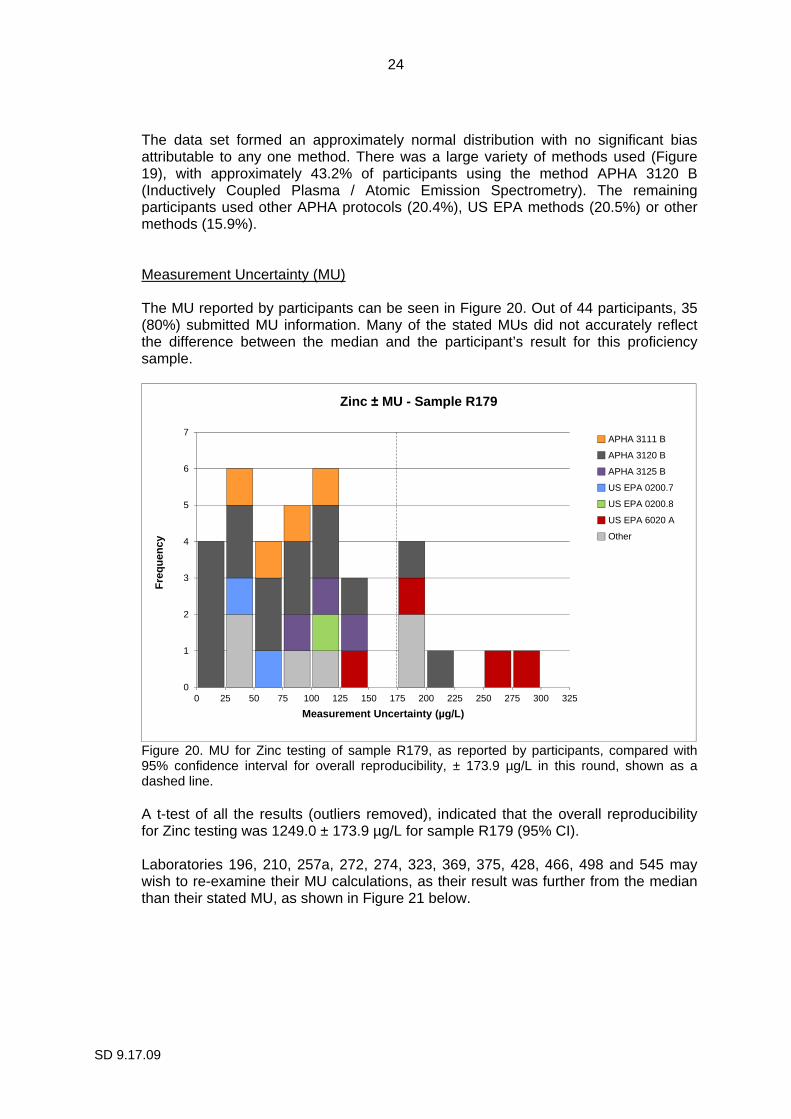
The data set formed an approximately normal distribution with no significant bias attributable to any one method. There was a large variety of methods used (Figure 19), with approximately 43.2% of participants using the method APHA 3120 B (Inductively Coupled Plasma / Atomic Emission Spectrometry). The remaining participants used other APHA protocols (20.4%), US EPA methods (20.5%) or other methods (15.9%). Measurement Uncertainty (MU) The MU reported by participants can be seen in Figure 20. Out of 44 participants, 35 (80%) submitted MU information. Many of the stated MUs did not accurately reflect the difference between the median and the participant’s result for this proficiency sample.
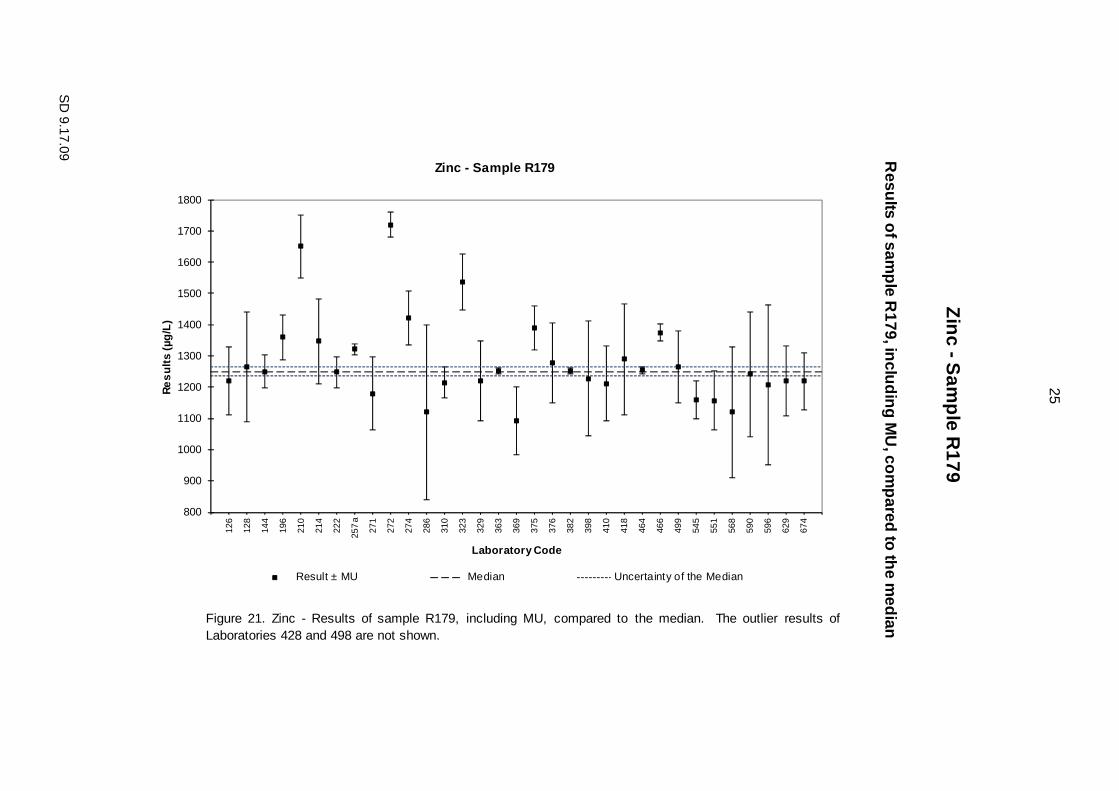
Figure 20. MU for Zinc testing of sample R179, as reported by participants, compared with 95% confidence interval for overall reproducibility, ± 173.9 µg/L in this round, shown as a dashed line. A t-test of all the results (outliers removed), indicated that the overall reproducibility for Zinc testing was 1249.0 ± 173.9 µg/L for sample R179 (95% CI). Laboratories 196, 210, 257a, 272, 274, 323, 369, 375, 428, 466, 498 and 545 may wish to re-examine their MU calculations, as their result was further from the median than their stated MU, as shown in Figure 21 below.
0
1
2
3
4
5
6
7
0 25 50 75 100 125 150 175 200 225 250 275 300 325
Fre
quen
cy
Measurement Uncertainty (µg/L)
Zinc ± MU - Sample R179
APHA 3111 B
APHA 3120 B
APHA 3125 B
US EPA 0200.7
US EPA 0200.8
US EPA 6020 A
Other
25
SD
9.17.09
Results of sam
ple R179, including M
U, com
pared to the m
edian
Zinc - S
ample R
179
Figure 21. Zinc - Results of sample R179, including MU, compared to the median. The outlier results ofLaboratories 428 and 498 are not shown.
800
900
1000
1100
1200
1300
1400
1500
1600
1700
1800
126
128
144
196
210
214
222
257
a
271
272
274
286
310
323
329
363
369
375
376
382
398
410
418
464
466
499
545
551
568
590
596
629
674
Re
sults
(µg/
L)
Laboratory Code
Zinc - Sample R179
Result ± MU Median Uncertainty of the Median
26
SD 9.17.09
4.3 Analysis of Results by Method Groups
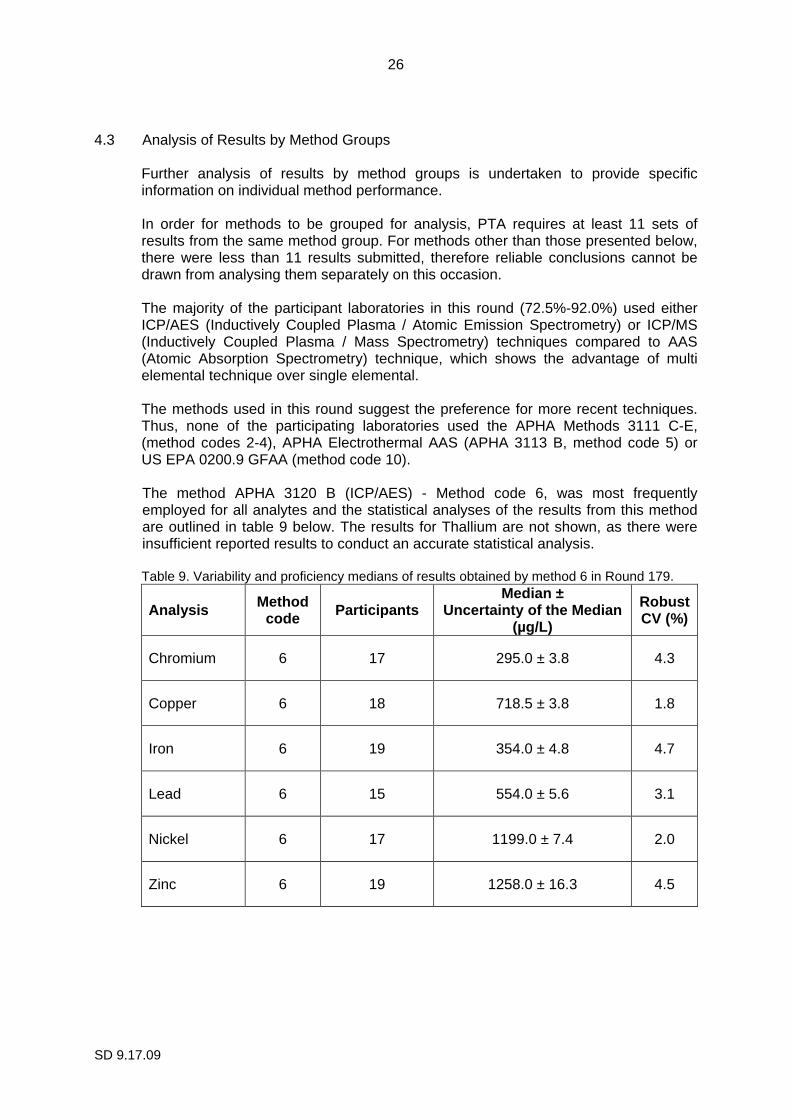
Further analysis of results by method groups is undertaken to provide specific information on individual method performance. In order for methods to be grouped for analysis, PTA requires at least 11 sets of results from the same method group. For methods other than those presented below, there were less than 11 results submitted, therefore reliable conclusions cannot be drawn from analysing them separately on this occasion. The majority of the participant laboratories in this round (72.5%-92.0%) used either ICP/AES (Inductively Coupled Plasma / Atomic Emission Spectrometry) or ICP/MS (Inductively Coupled Plasma / Mass Spectrometry) techniques compared to AAS (Atomic Absorption Spectrometry) technique, which shows the advantage of multi elemental technique over single elemental. The methods used in this round suggest the preference for more recent techniques. Thus, none of the participating laboratories used the APHA Methods 3111 C-E, (method codes 2-4), APHA Electrothermal AAS (APHA 3113 B, method code 5) or US EPA 0200.9 GFAA (method code 10). The method APHA 3120 B (ICP/AES) - Method code 6, was most frequently employed for all analytes and the statistical analyses of the results from this method are outlined in table 9 below. The results for Thallium are not shown, as there were insufficient reported results to conduct an accurate statistical analysis. Table 9. Variability and proficiency medians of results obtained by method 6 in Round 179.
Analysis Method code Participants
Median ± Uncertainty of the Median
(µg/L)
Robust CV (%)
Chromium 6 17 295.0 ± 3.8 4.3
Copper 6 18 718.5 ± 3.8 1.8
Iron 6 19 354.0 ± 4.8 4.7
Lead 6 15 554.0 ± 5.6 3.1
Nickel 6 17 1199.0 ± 7.4 2.0
Zinc 6 19 1258.0 ± 16.3 4.5

27
SD 9.17.09
Seven laboratories indicated the use of other methods than those listed in the Instructions to Participants. Out of these, six laboratories specified their choice method as follows:
• laboratory 274 used the GOST 31870-2012 method for all analytes, • laboratory 418 used an in-house method based on APHA 3111 B for all
elements tested (Copper, Iron, Lead and Zinc), • laboratory 428 used GFAAS (graphite furnace atomic absorption
spectrometry) for all elements tested (Chromium, Copper, Iron, Lead, Nickel and Zinc),
• laboratory 466 used ISO 11885 for all elements tested (Chromium, Copper, Iron, Lead, Nickel and Zinc),
• laboratory 590 used an in-house ICP method for all elements tested (Copper, Iron, Lead, Nickel, Thallium and Zinc), and
• laboratory 699 used FAAS (flame atomic absorption spectrometry) for analysis of Iron and Zinc and GFAAS (graphite furnace atomic absorption spectrometry) for Chromium, Copper, Lead and Nickel.
Most of the digestion methods involved nitric acid or a combination of nitric and hydrochloric acid. One laboratory used a combination of nitric acid, hydrochloric acid and hydrogen peroxide and one laboratory used the microwave in the digestion process. It is worth noting that from the results reported, there is no notable difference between the non-digestion and various digestion methods, most of the laboratories being able to demonstrate competency in controlling the problems of contamination and loss of analyte during the process.
28
SD 9.17.09
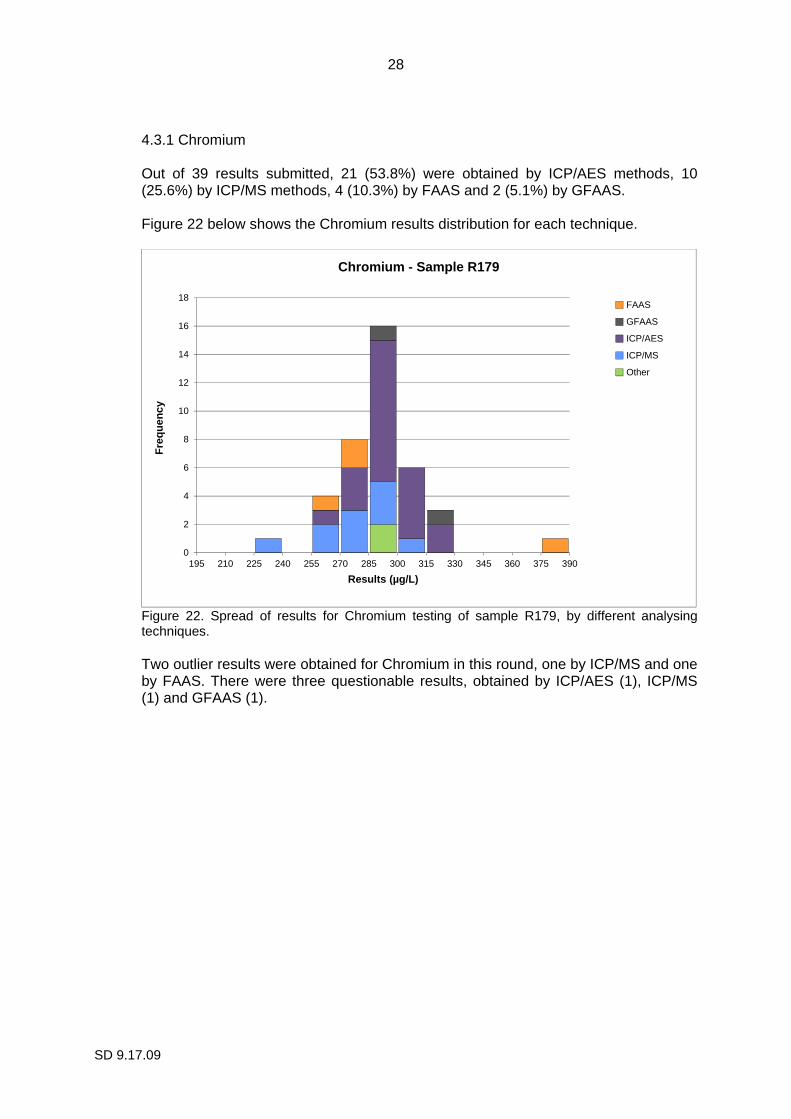
4.3.1 Chromium Out of 39 results submitted, 21 (53.8%) were obtained by ICP/AES methods, 10 (25.6%) by ICP/MS methods, 4 (10.3%) by FAAS and 2 (5.1%) by GFAAS. Figure 22 below shows the Chromium results distribution for each technique.
Figure 22. Spread of results for Chromium testing of sample R179, by different analysing techniques. Two outlier results were obtained for Chromium in this round, one by ICP/MS and one by FAAS. There were three questionable results, obtained by ICP/AES (1), ICP/MS (1) and GFAAS (1).
0
2
4
6
8
10
12
14
16
18
195 210 225 240 255 270 285 300 315 330 345 360 375 390
Fre
quen
cy
Results (µg/L)
Chromium - Sample R179
FAAS
GFAAS
ICP/AES
ICP/MS
Other
29
SD 9.17.09
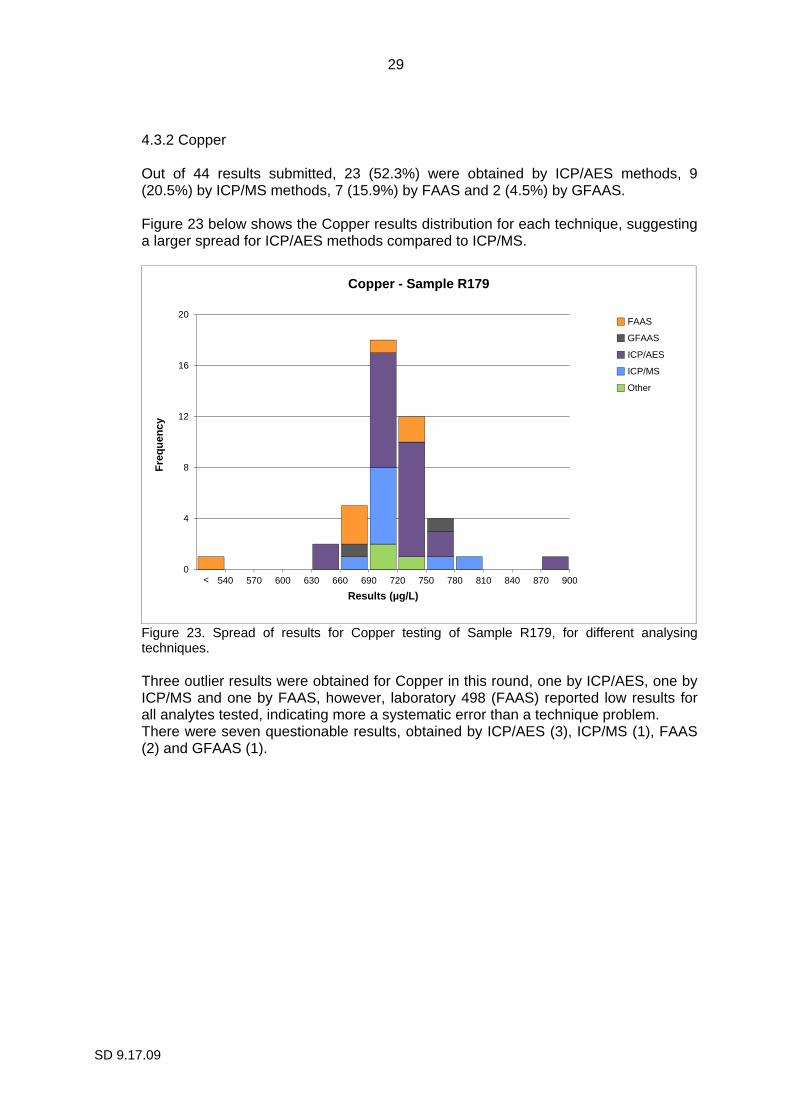
4.3.2 Copper Out of 44 results submitted, 23 (52.3%) were obtained by ICP/AES methods, 9 (20.5%) by ICP/MS methods, 7 (15.9%) by FAAS and 2 (4.5%) by GFAAS. Figure 23 below shows the Copper results distribution for each technique, suggesting a larger spread for ICP/AES methods compared to ICP/MS.
Figure 23. Spread of results for Copper testing of Sample R179, for different analysing techniques. Three outlier results were obtained for Copper in this round, one by ICP/AES, one by ICP/MS and one by FAAS, however, laboratory 498 (FAAS) reported low results for all analytes tested, indicating more a systematic error than a technique problem. There were seven questionable results, obtained by ICP/AES (3), ICP/MS (1), FAAS (2) and GFAAS (1).
0
4
8
12
16
20
510 540 570 600 630 660 690 720 750 780 810 840 870 900
Fre
quen
cy
Results (µg/L)
Copper - Sample R179
FAAS
GFAAS
ICP/AES
ICP/MS
Other
<
30
SD 9.17.09
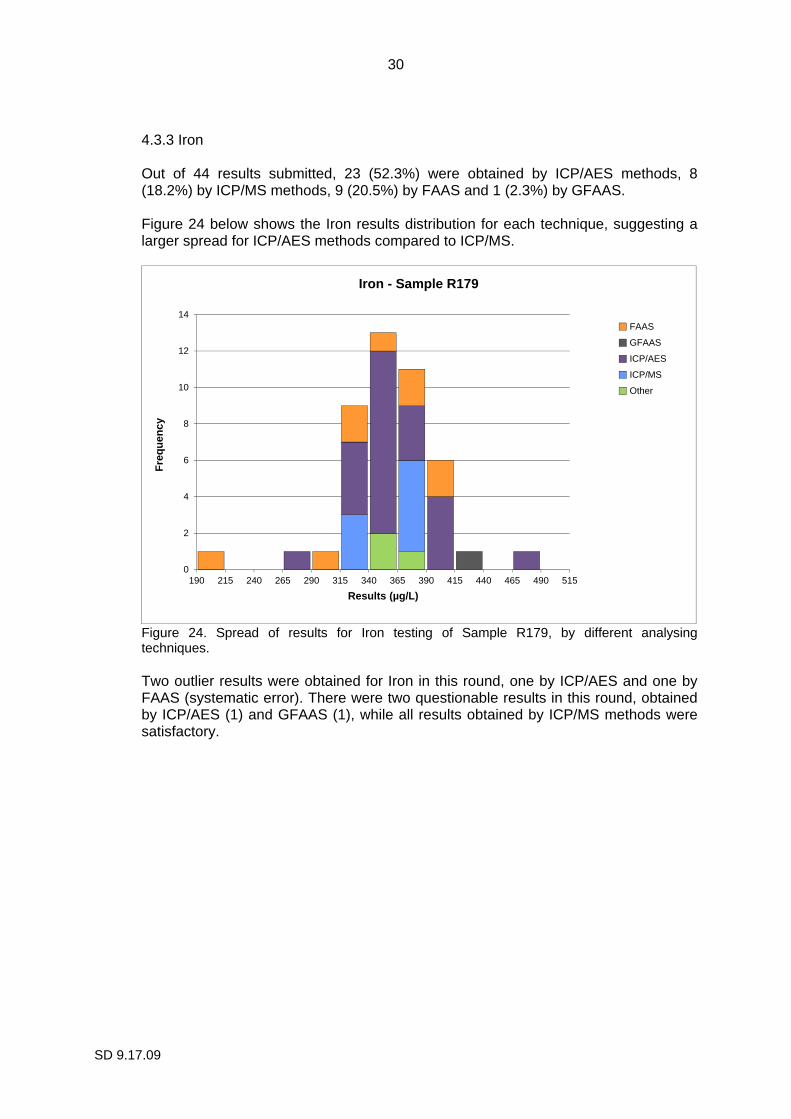
4.3.3 Iron Out of 44 results submitted, 23 (52.3%) were obtained by ICP/AES methods, 8 (18.2%) by ICP/MS methods, 9 (20.5%) by FAAS and 1 (2.3%) by GFAAS. Figure 24 below shows the Iron results distribution for each technique, suggesting a larger spread for ICP/AES methods compared to ICP/MS.
Figure 24. Spread of results for Iron testing of Sample R179, by different analysing techniques. Two outlier results were obtained for Iron in this round, one by ICP/AES and one by FAAS (systematic error). There were two questionable results in this round, obtained by ICP/AES (1) and GFAAS (1), while all results obtained by ICP/MS methods were satisfactory.
0
2
4
6
8
10
12
14
190 215 240 265 290 315 340 365 390 415 440 465 490 515
Fre
quen
cy
Results (µg/L)
Iron - Sample R179
FAAS
GFAAS
ICP/AES
ICP/MS
Other

31
SD 9.17.09
4.3.4 Lead Out of 40 results submitted, 19 (47.5%) were obtained by ICP/AES methods, 10 (25.0%) by ICP/MS methods, 6 (15.0%) by FAAS and 2 (5.0%) by GFAAS. Figure 25 below shows the Lead results distribution for each technique.
Figure 25. Spread of results for Lead testing of Sample R179, by different analysing techniques. Three outlier results were obtained for Lead in this round, one by FAAS (systematic error) and two by GFAAS. There were four questionable results in this round, obtained by ICP/AES (1), ICP/MS (2) and FAAS (1).
0
4
8
12
16
20
330 360 390 420 450 480 510 540 570 600 630 660 690 720
Fre
quen
cy
Results (µg/L)
Lead - Sample R179
FAAS
GFAAS
ICP/AES
ICP/MS
Other
<
32
SD 9.17.09
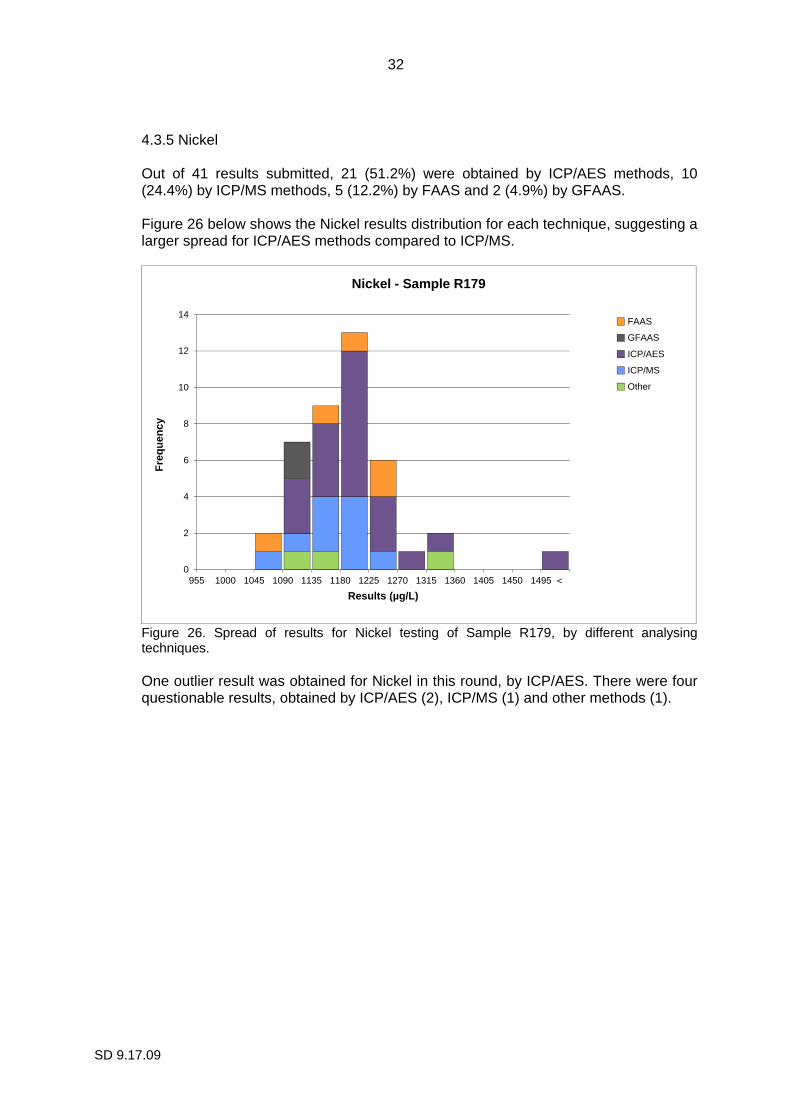
4.3.5 Nickel Out of 41 results submitted, 21 (51.2%) were obtained by ICP/AES methods, 10 (24.4%) by ICP/MS methods, 5 (12.2%) by FAAS and 2 (4.9%) by GFAAS. Figure 26 below shows the Nickel results distribution for each technique, suggesting a larger spread for ICP/AES methods compared to ICP/MS.
Figure 26. Spread of results for Nickel testing of Sample R179, by different analysing techniques. One outlier result was obtained for Nickel in this round, by ICP/AES. There were four questionable results, obtained by ICP/AES (2), ICP/MS (1) and other methods (1).
0
2
4
6
8
10
12
14
955 1000 1045 1090 1135 1180 1225 1270 1315 1360 1405 1450 1495 1540
Fre
quen
cy
Results (µg/L)
Nickel - Sample R179
FAAS
GFAAS
ICP/AES
ICP/MS
Other
<

33
SD 9.17.09
4.3.6 Thallium Out of 25 results submitted, 12 (48.0%) were obtained by ICP/AES methods and 11 (44.0%) by ICP/MS methods. Figure 27 below shows the Thallium results distribution for each technique.
Figure 27. Spread of results for Thallium testing of Sample R179, for different analysing techniques. Three outlier results were obtained for Thallium in this round, two by ICP/AES and one by other methods. There were two questionable results in this round, obtained by ICP/AES (1) and other methods (1), while all results obtained by ICP/MS methods were satisfactory.
0
2
4
6
8
10
12
100 125 150 175 200 225 250 275 300 325 350 375 400 425
Fre
quen
cy
Results (µg/L)
Thallium - Sample R179
ICP/AES
ICP/MS
Other
34
SD 9.17.09
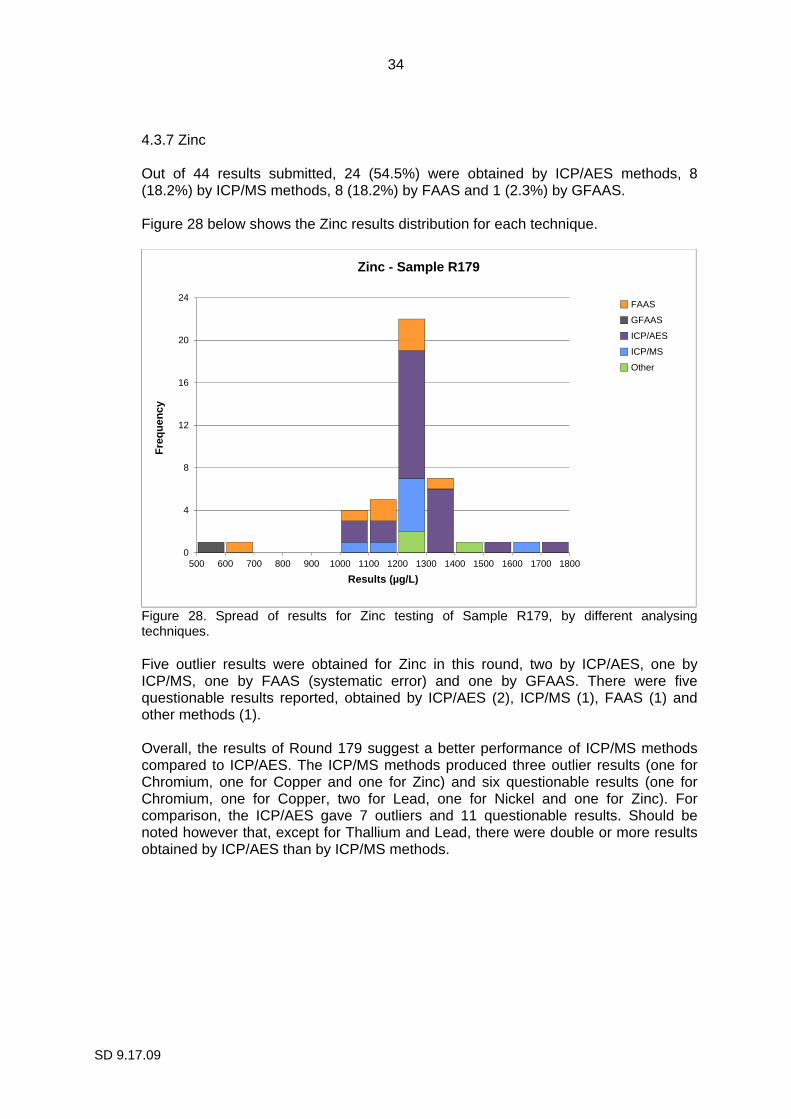
4.3.7 Zinc Out of 44 results submitted, 24 (54.5%) were obtained by ICP/AES methods, 8 (18.2%) by ICP/MS methods, 8 (18.2%) by FAAS and 1 (2.3%) by GFAAS. Figure 28 below shows the Zinc results distribution for each technique.
Figure 28. Spread of results for Zinc testing of Sample R179, by different analysing techniques. Five outlier results were obtained for Zinc in this round, two by ICP/AES, one by ICP/MS, one by FAAS (systematic error) and one by GFAAS. There were five questionable results reported, obtained by ICP/AES (2), ICP/MS (1), FAAS (1) and other methods (1). Overall, the results of Round 179 suggest a better performance of ICP/MS methods compared to ICP/AES. The ICP/MS methods produced three outlier results (one for Chromium, one for Copper and one for Zinc) and six questionable results (one for Chromium, one for Copper, two for Lead, one for Nickel and one for Zinc). For comparison, the ICP/AES gave 7 outliers and 11 questionable results. Should be noted however that, except for Thallium and Lead, there were double or more results obtained by ICP/AES than by ICP/MS methods.
0
4
8
12
16
20
24
500 600 700 800 900 1000 1100 1200 1300 1400 1500 1600 1700 1800
Fre
quen
cy
Results (µg/L)
Zinc - Sample R179
FAAS
GFAAS
ICP/AES
ICP/MS
Other
35
SD 9.17.09
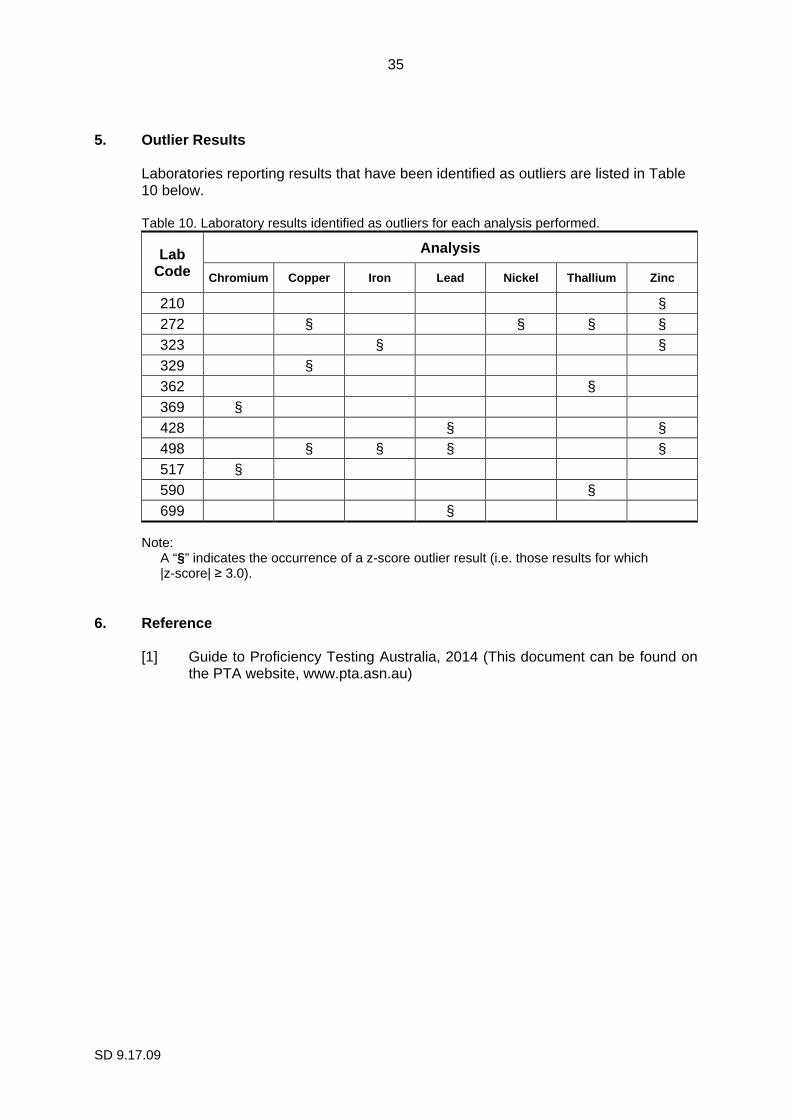
5. Outlier Results
Laboratories reporting results that have been identified as outliers are listed in Table 10 below. Table 10. Laboratory results identified as outliers for each analysis performed.
Lab Code
Analysis
Chromium Copper Iron Lead Nickel Thallium Zinc
210 § 272 § § § § 323 § § 329 § 362 § 369 § 428 § § 498 § § § § 517 § 590 § 699 §
Note:
A “§” indicates the occurrence of a z-score outlier result (i.e. those results for which |z-score| ≥ 3.0).
6. Reference
[1] Guide to Proficiency Testing Australia, 2014 (This document can be found on the PTA website, www.pta.asn.au)
SD 9.17.09
APPENDIX A
Results and Data Analysis Chromium .............................................................................................................................. A1
Copper ................................................................................................................................... A4
Iron ........................................................................................................................................ A7
Lead .................................................................................................................................... A10
Nickel ................................................................................................................................... A13
Thallium ............................................................................................................................... A16
Zinc ...................................................................................................................................... A18
SD 9.17.09
Chromium Results
Sample R179

A1
SD 9.17.09
Chromium (Cr) Results by Laboratory Code
Sample R179
Lab Code Result ± MU1
(µg/L) Robust z-score2
Method Code3
Digestion Code3
126 317 ± 34 1.71 6 14
128 306 ± 34 0.99 6 #
144 265 ± 7 -1.71 1 15
196 286 ± 10 -0.33 8 14
210 301 ± 50 0.66 7 14
222 299 ± 20 0.53 6 14
257a 303 ± 12.0 0.79 6 #
271 277 ± 33 -0.92 1 #
272 314 ± 15 1.51 6 #
274 298 ± 23.5 0.46 13 14
286 270 ± 54 -1.38 12 22
310 291 ± 9 0.00 8 #
323 291 ± 93 0.00 6 #
329 294 ± 29 0.20 12 22
331 322 # 2.04 8 14
342 295 # 0.26 6 15
362 286 # -0.33 6 14
363 295 ± 14 0.26 6 14
369 236 ± 35 -3.62 § 9 #
375 285 ± 14 -0.39 6 14
376 298 ± 30 0.46 7 #
382 258 ± 5 -2.17 7 14
398 290 ± 44 -0.07 12 22
410 284 ± 28 -0.46 7 #
428 325 ± 35 2.24 13 24
464 291 ± 2 0.00 6 #
466 301 ± 3 0.66 13 15
1 Where reported, results are shown with their corresponding measurement
uncertainty (MU). 2 "§" denotes an outlier (i.e. those results for which |z-score| ≥ 3.0). Robust z-
scores are calculated as: z = (A - median) ÷ normalised IQR, where A is the participant laboratory's result.
3 Please refer to Appendix C (page C3-C4) for method and digestion code descriptions.
A2
SD 9.17.09
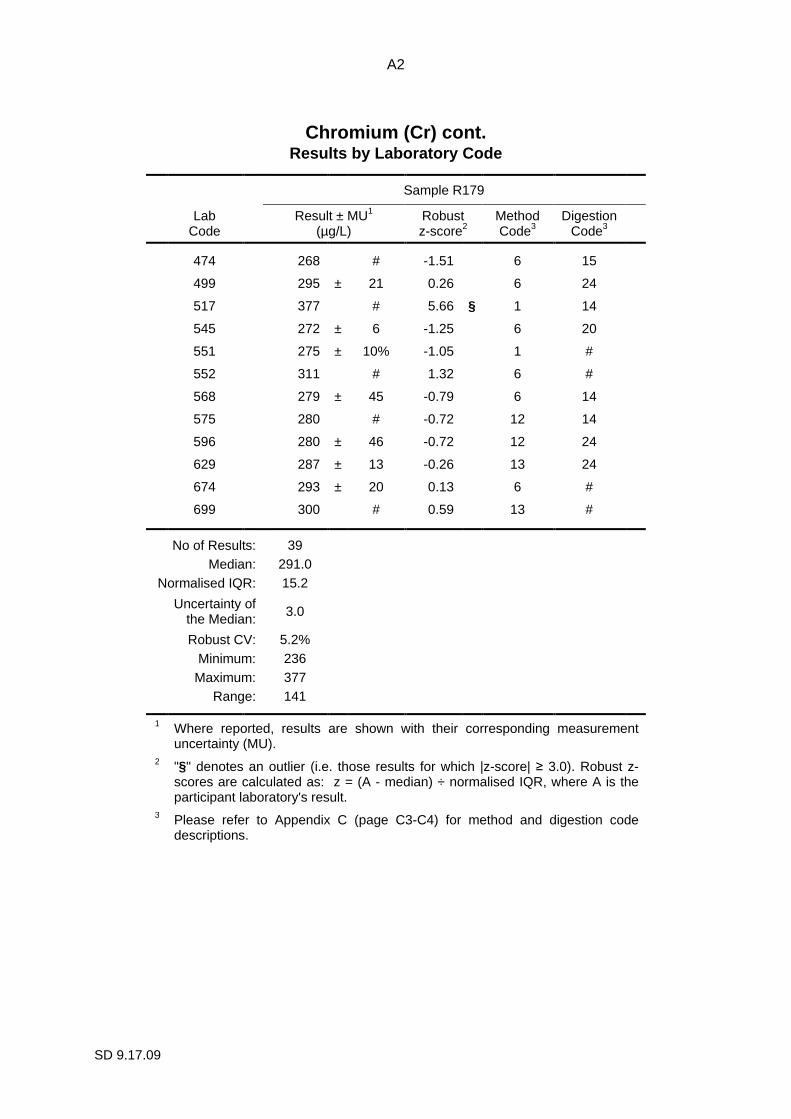
Chromium (Cr) cont. Results by Laboratory Code
Sample R179
Lab Code Result ± MU1
(µg/L) Robust z-score2
Method Code3
Digestion Code3
474 268 # -1.51 6 15
499 295 ± 21 0.26 6 24
517 377 # 5.66 § 1 14
545 272 ± 6 -1.25 6 20
551 275 ± 10% -1.05 1 #
552 311 # 1.32 6 #
568 279 ± 45 -0.79 6 14
575 280 # -0.72 12 14
596 280 ± 46 -0.72 12 24
629 287 ± 13 -0.26 13 24
674 293 ± 20 0.13 6 #
699 300 # 0.59 13 # No of Results: 39
Median: 291.0
Normalised IQR: 15.2
Uncertainty of the Median:
3.0
Robust CV: 5.2%
Minimum: 236
Maximum: 377
Range: 141
1 Where reported, results are shown with their corresponding measurement
uncertainty (MU). 2 "§" denotes an outlier (i.e. those results for which |z-score| ≥ 3.0). Robust z-
scores are calculated as: z = (A - median) ÷ normalised IQR, where A is the participant laboratory's result.
3 Please refer to Appendix C (page C3-C4) for method and digestion code descriptions.
SD 9.17.09
Chromium - Sample R179 - Robust Z-Scores
Ordered R
obust Z-S
core Charts
Chrom
ium - S
ample R
179
A3
Robust Z-Scores
369
382 14
4
474
286
545
551
271
568
575
596
410
375
196
362
629
398
310
323
464
-5
-4
-3
-2
-1
0
1
2
3
4
5
z-sc
ore
lab code
-5
-4
-3
-2
-1
0
1
2
3
4
5
z-sc
ore
lab code
SD 9.17.09
Copper Results
Sample R179

A4
SD 9.17.09
Copper (Cu) Results by Laboratory Code
Sample R179
Lab Code Result ± MU1
(µg/L) Robust z-score2
Method Code3
Digestion Code3
126 696 ± 64 -0.77 6 14
128 730 ± 66 0.64 6 #
144 730 ± 18 0.64 1 15
196 739 ± 25 1.02 8 14
210 702 ± 80 -0.52 7 14
214 729 ± 73 0.60 6 #
222 721 ± 20 0.27 6 14
257a 734 ± 17.2 0.81 6 #
271 675 ± 68 -1.64 1 #
272 896 ± 30 7.53 § 6 #
274 719 ± 36.3 0.19 13 14
286 696 ± 139 -0.77 12 22
310 701 ± 21 -0.56 8 #
323 722 ± 74 0.31 6 #
329 788 ± 62 3.05 § 12 22
331 767 # 2.18 8 14
342 710 # -0.19 6 15
362 704 # -0.44 6 14
363 730 ± 10 0.64 6 14
369 770 ± 108 2.30 9 #
375 710 ± 36 -0.19 6 14
376 719 ± 72 0.19 7 #
382 671 ± 5 -1.81 7 14
398 706 ± 106 -0.35 12 22
410 698 ± 70 -0.68 7 #
418 721 ± 51 0.27 13 14
428 773 ± 93 2.43 13 24
1 Where reported, results are shown with their corresponding measurement
uncertainty (MU). 2 "§" denotes an outlier (i.e. those results for which |z-score| ≥ 3.0). Robust z-
scores are calculated as: z = (A - median) ÷ normalised IQR, where A is the participant laboratory's result.
3 Please refer to Appendix C (page C3-C4) for method and digestion code descriptions.

A5
SD 9.17.09
Copper (Cu) cont. Results by Laboratory Code
Sample R179
Lab Code Result ± MU1
(µg/L) Robust z-score2
Method Code3
Digestion Code3
464 714 ± 7 -0.02 6 #
466 751 ± 8 1.52 13 15
474 655 # -2.47 6 15
498 367 ± 46 -14.42 § 1 14
499 723 ± 43 0.35 6 24
517 666 # -2.01 1 14
545 652 ± 8 -2.59 6 20
551 666 ± 11.2% -2.01 1 #
552 716 # 0.06 6 #
568 710 ± 68 -0.19 6 14
575 696 # -0.77 11 14
590 708 ± 20 -0.27 13 24
596 697 ± 130 -0.73 12 24
629 723 ± 68 0.35 13 24
674 722 ± 70 0.31 6 #
688 715 # 0.02 1 14
699 690 # -1.02 13 # No of Results: 44
Median: 714.5
Normalised IQR: 24.1
Uncertainty of the Median:
4.6
Robust CV: 3.4%
Minimum: 367
Maximum: 896
Range: 529
1 Where reported, results are shown with their corresponding measurement
uncertainty (MU). 2 "§" denotes an outlier (i.e. those results for which |z-score| ≥ 3.0). Robust z-
scores are calculated as: z = (A - median) ÷ normalised IQR, where A is the participant laboratory's result.
3 Please refer to Appendix C (page C3-C4) for method and digestion code descriptions.
SD 9.17.09
Copper - Sample R179 - Robust Z-Scores
Ordered R
obust Z-S
core Charts
Copper - S
ample R
179
A6
Robust Z-Scores
498
545
474 51
7
551
382
271 69
9
126
286
575
596
410
310
210
362
398
590
342
375
568
464
-5
-4
-3
-2
-1
0
1
2
3
4
5
z-sc
ore
lab code
-5
-4
-3
-2
-1
0
1
2
3
4
5
z-sc
ore
lab code

SD 9.17.09
Iron Results
Sample R179

A7
SD 9.17.09
Iron (Fe) Results by Laboratory Code
Sample R179
Lab Code Result ± MU1
(µg/L) Robust z-score2
Method Code3
Digestion Code3
126 359 ± 38 0.05 6 14
128 367 ± 76 0.31 6 #
138 328 ± 30 -0.97 1 14
144 357 ± 7 -0.02 1 15
196 396 ± 17 1.27 8 14
210 330 ± 50 -0.90 7 14
214 344 ± 34 -0.44 6 #
222 358 ± 20 0.02 6 14
257a 413 ± 16.8 1.83 6 #
271 325 ± 45 -1.07 1 #
272 408 ± 20 1.66 6 #
274 367 ± 49.7 0.31 13 14
286 338 ± 68 -0.64 12 22
310 348 ± 10 -0.31 8 #
323 469 ± 57 3.67 § 6 #
329 366 ± 61 0.28 12 22
331 397 # 1.30 8 14
342 340 # -0.58 6 15
362 369 # 0.38 6 14
363 350 ± 9 -0.25 6 14
369 330 ± 50 -0.90 9 #
375 344 ± 17 -0.44 6 14
376 367 ± 37 0.31 7 #
382 320 ± 5 -1.23 6 14
398 379 ± 57 0.71 12 22
410 372 ± 37 0.48 7 #
418 390 ± 131 1.07 13 14
1 Where reported, results are shown with their corresponding measurement
uncertainty (MU). 2 "§" denotes an outlier (i.e. those results for which |z-score| ≥ 3.0). Robust z-
scores are calculated as: z = (A - median) ÷ normalised IQR, where A is the participant laboratory's result.
3 Please refer to Appendix C (page C3-C4) for method and digestion code descriptions.

A8
SD 9.17.09
Iron (Fe) cont. Results by Laboratory Code
Sample R179
Lab Code Result ± MU1
(µg/L) Robust z-score2
Method Code3
Digestion Code3
428 420 ± 24 2.06 13 24
464 351 ± 7 -0.21 6 #
466 388 ± 4 1.00 13 15
474 267 # -2.98 6 15
498 211 ± 51 -4.82 § 1 14
499 362 ± 22 0.15 6 24
517 394 # 1.20 1 14
545 327 ± 9 -1.00 6 20
551 297 ± 16.5% -1.99 1 #
552 354 # -0.12 6 #
568 334 ± 51 -0.77 6 14
575 <500 # na 11 14
590 344 ± 20 -0.44 13 24
596 369 ± 75 0.38 12 24
629 345 ± 16 -0.41 13 24
674 354 ± 30 -0.12 6 #
688 396 # 1.27 1 14
699 385 # 0.90 13 # No of Results: 44
Median: 357.5
Normalised IQR: 30.4
Uncertainty of the Median:
5.7
Robust CV: 8.5%
Minimum: 211
Maximum: 469
Range: 258
1 Where reported, results are shown with their corresponding measurement
uncertainty (MU). 2 "§" denotes an outlier (i.e. those results for which |z-score| ≥ 3.0). Robust z-
scores are calculated as: z = (A - median) ÷ normalised IQR, where A is the participant laboratory's result.
3 Please refer to Appendix C (page C3-C4) for method and digestion code descriptions.
SD 9.17.09
Iron - Sample R179 - Robust Z-Scores
Ordered R
obust Z-S
core Charts
Iron - Sam
ple R179
A9
Robust Z-Scores
498
474
551 38
2
271
545
138
210
369
568
286
342
214
375
590
629
310
363
464
552
674
144
-5
-4
-3
-2
-1
0
1
2
3
4
5
z-sc
ore
lab code
-5
-4
-3
-2
-1
0
1
2
3
4
5
z-sc
ore
lab code

SD 9.17.09
Lead Results
Sample R179

A10
SD 9.17.09
Lead (Pb) Results by Laboratory Code
Sample R179
Lab Code Result ± MU1
(µg/L) Robust z-score2
Method Code3
Digestion Code3
126 531 ± 78 -1.05 6 14
128 572 ± 95 0.78 6 #
144 562 ± 21 0.33 1 14
196 557 ± 23 0.11 8 14
210 561 ± 75 0.29 7 14
222 559 ± 20 0.20 6 14
257a 591 ± 15.2 1.63 6 #
271 597 ± 67 1.90 1 #
272 545 ± 20 -0.42 6 #
274 581 ± 51.2 1.18 13 14
286 519 ± 130 -1.58 12 22
310 542 ± 16 -0.56 8 #
323 554 ± 60 -0.02 6 #
329 600 ± 89 2.03 12 22
331 557 # 0.11 8 14
342 550 # -0.20 6 15
362 564 # 0.42 6 14
363 548 ± 13 -0.29 6 14
369 518 ± 98 -1.63 9 #
375 505 ± 25 -2.21 6 14
376 565 ± 57 0.47 7 #
382 492 ± 5 -2.79 7 14
398 529 ± 79 -1.14 12 22
410 552 ± 55 -0.11 7 #
418 610 ± 214 2.47 13 14
428 799 ± 45 10.90 § 13 24
464 556 ± 17 0.07 6 #
1 Where reported, results are shown with their corresponding measurement
uncertainty (MU). 2 "§" denotes an outlier (i.e. those results for which |z-score| ≥ 3.0). Robust z-
scores are calculated as: z = (A - median) ÷ normalised IQR, where A is the participant laboratory's result.
3 Please refer to Appendix C (page C3-C4) for method and digestion code descriptions.
A11
SD 9.17.09
Lead (Pb) cont. Results by Laboratory Code
Sample R179
Lab Code Result ± MU1
(µg/L) Robust z-score2
Method Code3
Digestion Code3
466 591 ± 5 1.63 13 15
474 516 # -1.72 6 15
498 341 ± 39 -9.52 § 1 14
499 559 ± 56 0.20 6 24
517 535 # -0.87 1 14
545 529 ± 9 -1.14 6 20
551 540 ± 4.7% -0.65 1 #
552 566 # 0.51 6 #
575 560 # 0.25 12 14
590 538 ± 30 -0.74 13 24
596 555 ± 92 0.02 12 24
629 537 ± 38 -0.78 13 24
699 375 # -8.00 § 13 # No of Results: 40
Median: 554.5
Normalised IQR: 22.4
Uncertainty of the Median:
4.4
Robust CV: 4.0%
Minimum: 341
Maximum: 799
Range: 458
1 Where reported, results are shown with their corresponding measurement
uncertainty (MU). 2 "§" denotes an outlier (i.e. those results for which |z-score| ≥ 3.0). Robust z-
scores are calculated as: z = (A - median) ÷ normalised IQR, where A is the participant laboratory's result.
3 Please refer to Appendix C (page C3-C4) for method and digestion code descriptions.
SD 9.17.09
Lead - Sample R179 - Robust Z-Scores
Ordered R
obust Z-S
core Charts
Lead - Sam
ple R179
A12
Robust Z-Scores
498
699
382 37
5 474
369
286 39
8
545
126
517
629
590
551
310
272
363
342
410
323
-5
-4
-3
-2
-1
0
1
2
3
4
5
z-sc
ore
lab code
-5
-4
-3
-2
-1
0
1
2
3
4
5
z-sc
ore
lab code
SD 9.17.09
Nickel Results
Sample R179
A13
SD 9.17.09
Nickel (Ni) Results by Laboratory Code
Sample R179
Lab Code Result ± MU1
(µg/L) Robust z-score2
Method Code3
Digestion Code3
126 1320 ± 84 2.40 6 14
128 1213 ± 189 0.43 6 #
144 1230 ± 49 0.74 1 15
196 1180 ± 50 -0.18 8 14
210 1120 ± 100 -1.29 7 14
222 1199 ± 50 0.17 6 14
257a 1245 ± 14.8 1.02 6 #
271 1230 ± 280 0.74 1 #
272 1610 ± 30 7.76 § 6 #
274 1342 ± 74.9 2.81 13 14
286 1148 ± 230 -0.78 12 22
310 1172 ± 41 -0.33 8 #
323 1193 ± 54 0.06 6 #
329 1240 ± 157 0.92 12 22
331 1313 # 2.27 8 14
342 1210 # 0.37 6 15
362 1207 # 0.31 6 14
363 1180 ± 11 -0.18 6 14
369 1185 ± 166 -0.09 9 #
375 1190 ± 60 0.00 6 14
376 1160 ± 116 -0.55 7 #
382 1072 ± 10 -2.18 7 14
398 1181 ± 177 -0.17 12 22
410 1190 ± 120 0.00 7 #
428 1096 ± 47 -1.74 13 24
464 1193 ± 20 0.06 6 #
466 1270 ± 14 1.48 13 15
1 Where reported, results are shown with their corresponding measurement
uncertainty (MU). 2 "§" denotes an outlier (i.e. those results for which |z-score| ≥ 3.0). Robust z-
scores are calculated as: z = (A - median) ÷ normalised IQR, where A is the participant laboratory's result.
3 Please refer to Appendix C (page C3-C4) for method and digestion code descriptions.
A14
SD 9.17.09
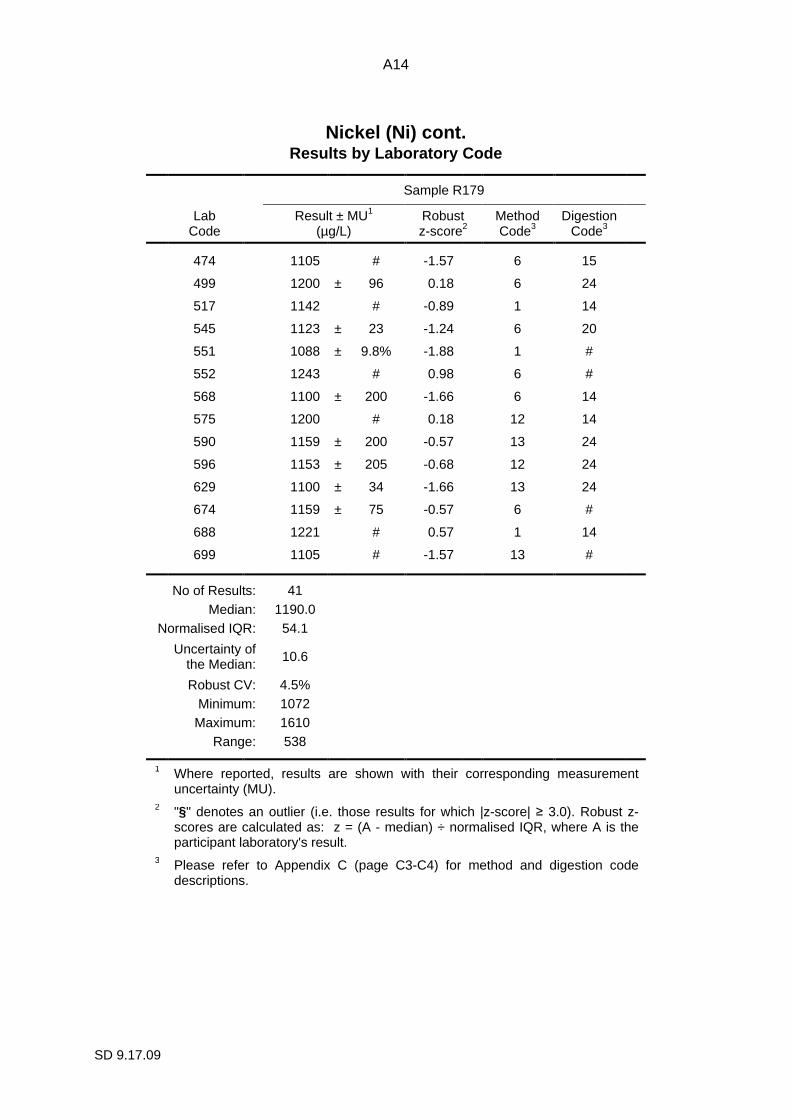
Nickel (Ni) cont. Results by Laboratory Code
Sample R179
Lab Code Result ± MU1
(µg/L) Robust z-score2
Method Code3
Digestion Code3
474 1105 # -1.57 6 15
499 1200 ± 96 0.18 6 24
517 1142 # -0.89 1 14
545 1123 ± 23 -1.24 6 20
551 1088 ± 9.8% -1.88 1 #
552 1243 # 0.98 6 #
568 1100 ± 200 -1.66 6 14
575 1200 # 0.18 12 14
590 1159 ± 200 -0.57 13 24
596 1153 ± 205 -0.68 12 24
629 1100 ± 34 -1.66 13 24
674 1159 ± 75 -0.57 6 #
688 1221 # 0.57 1 14
699 1105 # -1.57 13 # No of Results: 41
Median: 1190.0
Normalised IQR: 54.1
Uncertainty of the Median:
10.6
Robust CV: 4.5%
Minimum: 1072
Maximum: 1610
Range: 538
1 Where reported, results are shown with their corresponding measurement
uncertainty (MU). 2 "§" denotes an outlier (i.e. those results for which |z-score| ≥ 3.0). Robust z-
scores are calculated as: z = (A - median) ÷ normalised IQR, where A is the participant laboratory's result.
3 Please refer to Appendix C (page C3-C4) for method and digestion code descriptions.
SD 9.17.09
Nickel - Sample R179 - Robust Z-Scores
Ordered R
obust Z-S
core Charts
Nickel - S
ample R
179
A15
Robust Z-Scores
382 55
1
428
568
629
474
699
210
545 51
7
286
596
590
674
376
310
196
363
398
369
-5
-4
-3
-2
-1
0
1
2
3
4
5
z-sc
ore
lab code
-5
-4
-3
-2
-1
0
1
2
3
4
5
z-sc
ore
lab code
SD 9.17.09
Thallium Results
Sample R179

A16
SD 9.17.09
Thallium (Tl) Results by Laboratory Code
Sample R179
Lab Code Result ± MU1
(µg/L) Robust z-score2
Method Code3
Digestion Code3
126 312 ± 43 1.05 6 14 128 296 ± 14 0.25 6 # 196 263 ± 10 -1.40 8 14 210 298 ± 50 0.35 7 14 257a 308 ± 17.2 0.85 6 # 272 352 ± 25 3.05 § 6 # 274 344 ± 44.6 2.65 13 14 286 283 ± 57 -0.40 12 22 310 299 ± 12 0.40 9 # 323 319 ± 63 1.40 6 # 329 301 ± 35 0.50 12 22 331 345 # 2.70 8 14 362 190 # -5.05 § 6 14 363 278 ± 16 -0.65 6 14 369 275 ± 47 -0.80 9 # 376 297 ± 30 0.30 7 # 382 266 ± 5 -1.25 7 14 398 268 ± 40 -1.15 12 22 410 290 ± 29 -0.05 7 # 464 291 ± 5 0.00 6 # 545 265 ± 6 -1.30 6 20 552 286 # -0.25 6 # 568 295 ± 42 0.20 7 14 590 171 ± 10 -6.00 § 13 24 596 274 ± 55 -0.85 12 24 No of Results: 25
Median: 291.0
Normalised IQR: 20.0 Uncertainty of
the Median: 5.0
Robust CV: 6.9%
Minimum: 171
Maximum: 352
Range: 181 1 Where reported, results are shown with their corresponding measurement
uncertainty (MU). 2 "§" denotes an outlier (i.e. those results for which |z-score| ≥ 3.0). Robust z-
scores are calculated as: z = (A - median) ÷ normalised IQR, where A is the participant laboratory's result.
3 Please refer to Appendix C (page C3-C4) for method and digestion code descriptions.
SD 9.17.09
Thallium - Sample R179 - Robust Z-Scores
Ordered R
obust Z-S
core Chart
Thallium
- Sam
ple R179
A17
-5
-4
-3
-2
-1
0
1
2
3
4
5
z-sc
ore
lab code
SD 9.17.09
Zinc Results
Sample R179
A18
SD 9.17.09
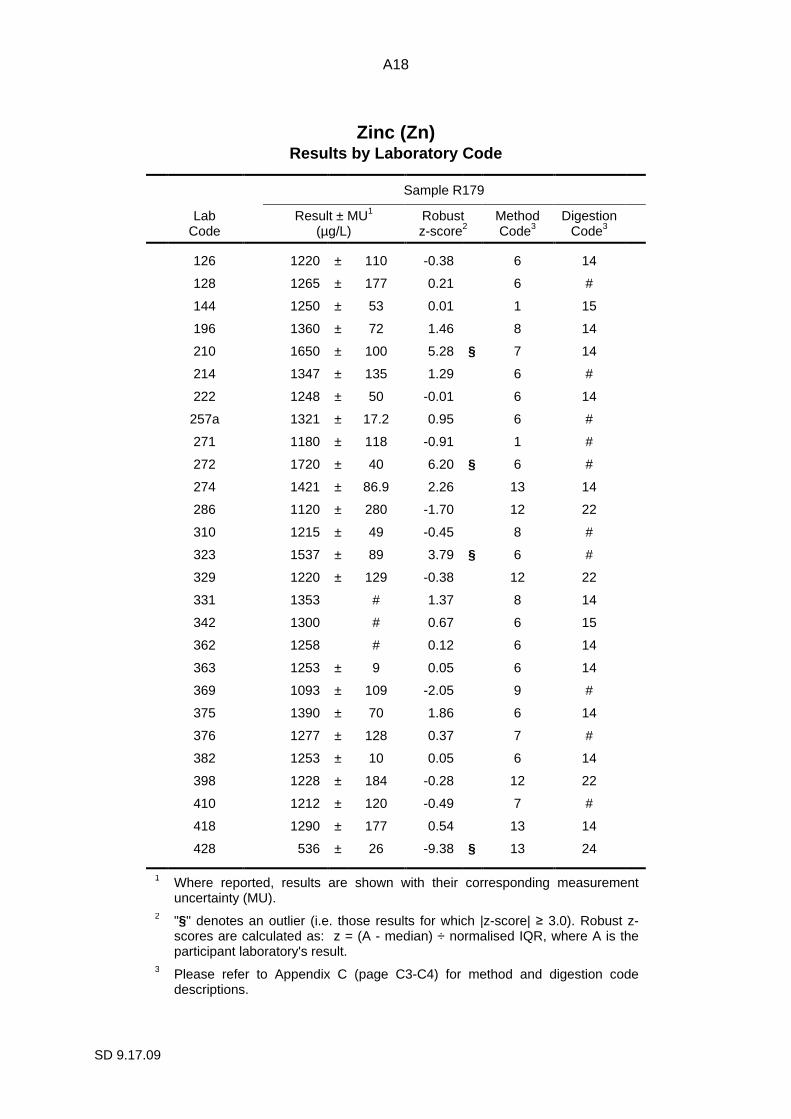
Zinc (Zn) Results by Laboratory Code
Sample R179
Lab Code Result ± MU1
(µg/L) Robust z-score2
Method Code3
Digestion Code3
126 1220 ± 110 -0.38 6 14
128 1265 ± 177 0.21 6 #
144 1250 ± 53 0.01 1 15
196 1360 ± 72 1.46 8 14
210 1650 ± 100 5.28 § 7 14
214 1347 ± 135 1.29 6 #
222 1248 ± 50 -0.01 6 14
257a 1321 ± 17.2 0.95 6 #
271 1180 ± 118 -0.91 1 #
272 1720 ± 40 6.20 § 6 #
274 1421 ± 86.9 2.26 13 14
286 1120 ± 280 -1.70 12 22
310 1215 ± 49 -0.45 8 #
323 1537 ± 89 3.79 § 6 #
329 1220 ± 129 -0.38 12 22
331 1353 # 1.37 8 14
342 1300 # 0.67 6 15
362 1258 # 0.12 6 14
363 1253 ± 9 0.05 6 14
369 1093 ± 109 -2.05 9 #
375 1390 ± 70 1.86 6 14
376 1277 ± 128 0.37 7 #
382 1253 ± 10 0.05 6 14
398 1228 ± 184 -0.28 12 22
410 1212 ± 120 -0.49 7 #
418 1290 ± 177 0.54 13 14
428 536 ± 26 -9.38 § 13 24
1 Where reported, results are shown with their corresponding measurement
uncertainty (MU). 2 "§" denotes an outlier (i.e. those results for which |z-score| ≥ 3.0). Robust z-
scores are calculated as: z = (A - median) ÷ normalised IQR, where A is the participant laboratory's result.
3 Please refer to Appendix C (page C3-C4) for method and digestion code descriptions.

A19
SD 9.17.09
Zinc (Zn) cont. Results by Laboratory Code
Sample R179
Lab Code Result ± MU1
(µg/L) Robust z-score2
Method Code3
Digestion Code3
464 1254 ± 12 0.07 6 #
466 1375 ± 26 1.66 13 15
474 1074 # -2.30 6 15
498 644 ± 34 -7.96 § 1 14
499 1265 ± 114 0.21 6 24
517 1090 # -2.09 1 14
545 1160 ± 61 -1.17 6 20
551 1157 ± 8.2% -1.21 1 #
552 1294 # 0.59 6 #
568 1120 ± 210 -1.70 6 14
575 1090 # -2.09 11 14
590 1241 ± 200 -0.11 13 24
596 1207 ± 255 -0.55 12 24
629 1220 ± 113 -0.38 13 24
674 1219 ± 90 -0.39 6 #
688 1232 # -0.22 1 14
699 1311 # 0.82 13 # No of Results: 44
Median: 1249.0
Normalised IQR: 76.0
Uncertainty of the Median:
14.4
Robust CV: 6.1%
Minimum: 536
Maximum: 1720
Range: 1184
1 Where reported, results are shown with their corresponding measurement
uncertainty (MU). 2 "§" denotes an outlier (i.e. those results for which |z-score| ≥ 3.0). Robust z-
scores are calculated as: z = (A - median) ÷ normalised IQR, where A is the participant laboratory's result.
3 Please refer to Appendix C (page C3-C4) for method and digestion code descriptions.
SD 9.17.09
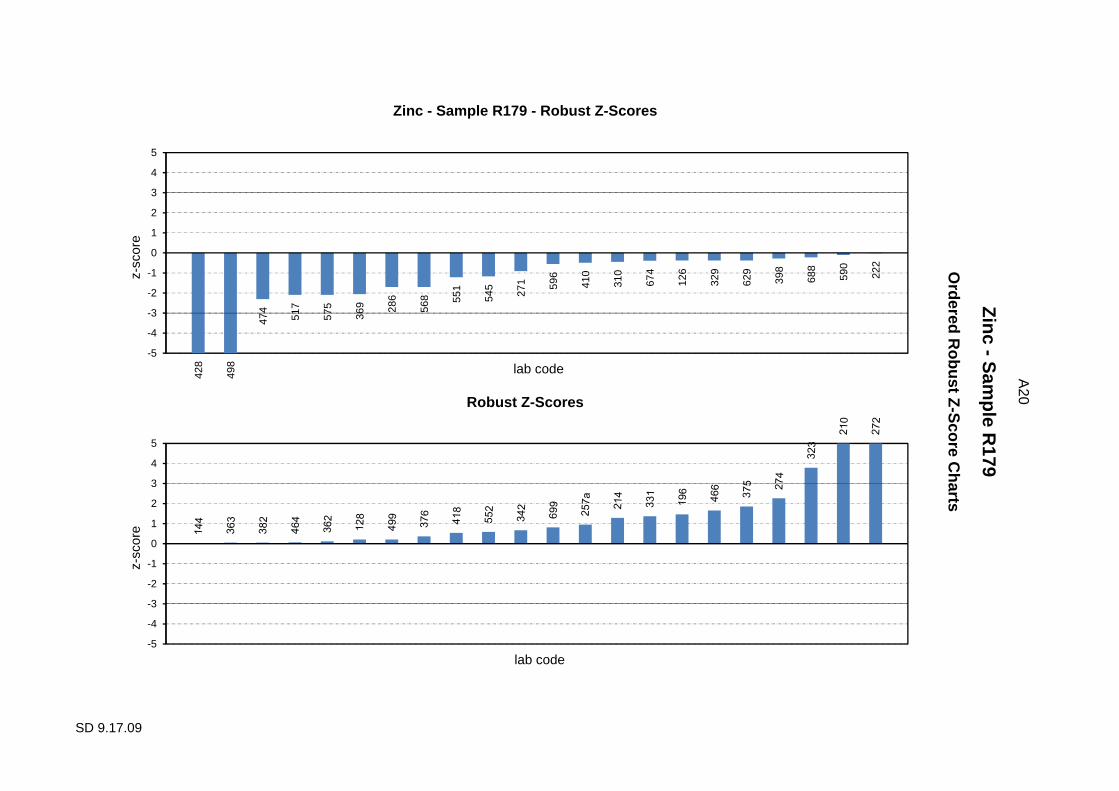
Zinc - Sample R179 - Robust Z-Scores
Ordered R
obust Z-S
core Charts
Zinc - S
ample R
179
A20
Robust Z-Scores
428
498
474
517
575
369 28
6
568 55
1
545
271 59
6
410
310
674
126
329
629
398
688
590
222
-5
-4
-3
-2
-1
0
1
2
3
4
5
z-sc
ore
lab code
-5
-4
-3
-2
-1
0
1
2
3
4
5
z-sc
ore
lab code
SD 9.17.09
APPENDIX B
Sample Homogeneity and Stability Homogeneity and Stability Testing ........................................................................................ B1
B1
SD 9.17.09
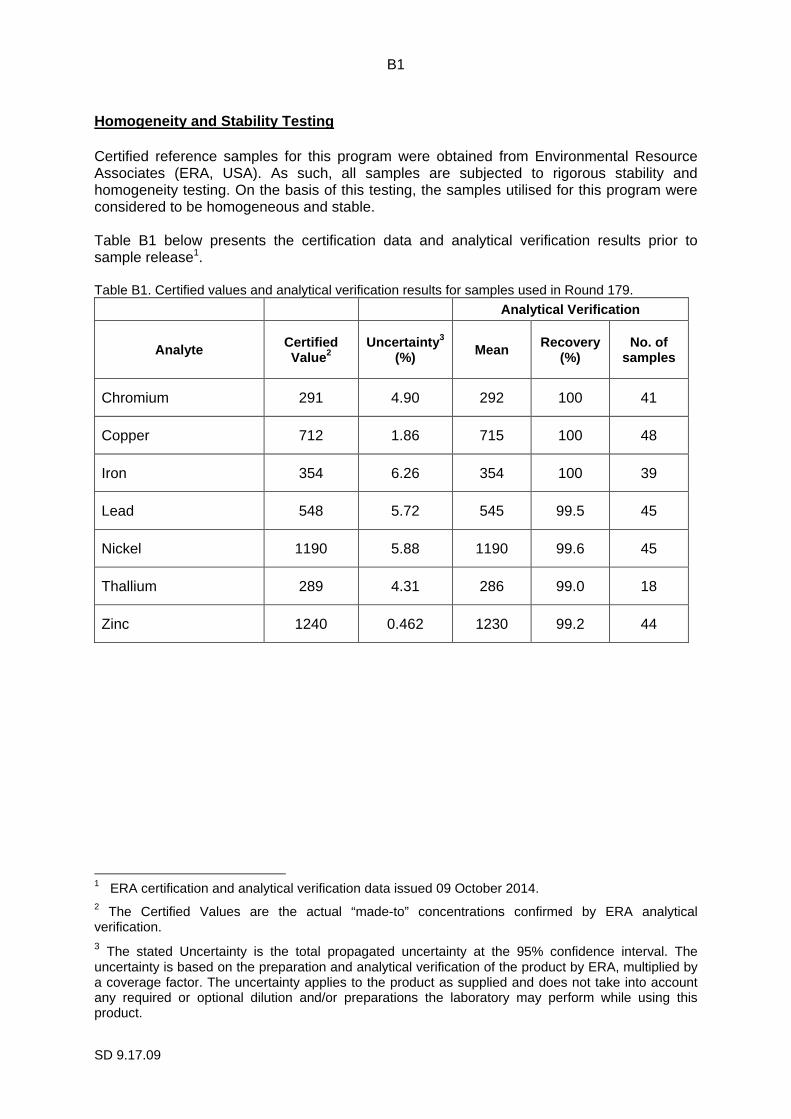
Homogeneity and Stability Testing Certified reference samples for this program were obtained from Environmental Resource Associates (ERA, USA). As such, all samples are subjected to rigorous stability and homogeneity testing. On the basis of this testing, the samples utilised for this program were considered to be homogeneous and stable. Table B1 below presents the certification data and analytical verification results prior to sample release1. Table B1. Certified values and analytical verification results for samples used in Round 179.
Analytical Verification
Analyte Certified Value 2
Uncertainty 3 (%) Mean Recovery
(%) No. of
samples
Chromium 291 4.90 292 100 41
Copper 712 1.86 715 100 48
Iron 354 6.26 354 100 39
Lead 548 5.72 545 99.5 45
Nickel 1190 5.88 1190 99.6 45
Thallium 289 4.31 286 99.0 18
Zinc 1240 0.462 1230 99.2 44
1 ERA certification and analytical verification data issued 09 October 2014. 2 The Certified Values are the actual “made-to” concentrations confirmed by ERA analytical verification. 3 The stated Uncertainty is the total propagated uncertainty at the 95% confidence interval. The uncertainty is based on the preparation and analytical verification of the product by ERA, multiplied by a coverage factor. The uncertainty applies to the product as supplied and does not take into account any required or optional dilution and/or preparations the laboratory may perform while using this product.

SD 9.17.09
APPENDIX C
Documentation Instructions to Participants .................................................................................................... C1
Method Codes ....................................................................................................................... C3
Digestion Codes .................................................................................................................... C4
Results Sheet ........................................................................................................................ C5
SD 9.17.09
CHEMICAL ANALYSIS ROUND 179
Metals (Chromium, Copper, Iron, Lead, Nickel, Thallium, Zinc)
**Please record (on the Results Sheet) the approximat e temperature of the samples upon receipt**
Please note the following before commencing the analysis of the samples. 1. Sample Information
i)
ii) iii) iv) v)
vi)
Please Note:laboratory sample.
2. Sample Preparation
i) ii)
Please read the Caution notes below before this step
iii)
iv) v) vi) vii) viii)ix)
Caution:
� Caution must be taken when analysing corrosive samples.� While technically it is unnecessary to digest the sample prior to analysis,
performed if this is your normal procedure.
� A volume of acid different from the 2order to matrix match calibration standards or meet any other method criteria.
� If analysing usito analysis. If using colorimetric techniques, it is acceptable to omit the addition of the 2nitric acid suggested in
SD 9.17.09
CHEMICAL ANALYSIS ROUND 179Metals (Chromium, Copper, Iron, Lead, Nickel, Thallium, Zinc)
**Please record (on the Results Sheet) the approximat e temperature of the samples upon receipt**
Please note the following before commencing the analysis of the samples.
Sample Information
One sealed vial labelled R179 supplied by Environmental Resource Associates (ERA). The vial contains approximately 14mL of
Please note the temperature of vial on receipt.
The sample has been acidified with approximately 2% (v/v) nitric acid. The sample must be thoroughly mixed prior to analysis.
The vial will require dilution in deionised water below).
The vial may be stored at room temperature.
Please Note: Where possible, the proficiency testing sample should be treated as a routine laboratory sample.
Sample Preparation
Analysis must begin immediately after vial is opened
Prepare sample at 20before opening.
Please read the Caution notes below before this step
Add approximately 100concentrated ni
Mix the vial prior to opening.
Using a dry, clean volumetric pipette, transfer 5.0mL from the vial into the flask. Dilute the flask to the final volume with deionised water.
Stopper and mix by inversion.
viii) Immediately Report your results as µg/L for the diluted sample.
Caution: Caution must be taken when analysing corrosive samples.While technically it is unnecessary to digest the sample prior to analysis, performed if this is your normal procedure.
A volume of acid different from the 2order to matrix match calibration standards or meet any other method criteria.If analysing usito analysis. If using colorimetric techniques, it is acceptable to omit the addition of the 2nitric acid suggested in
PROFICIENCY TESTING AUSTRALIA
WATERS PROFICIENCY
CHEMICAL ANALYSIS ROUND 179Metals (Chromium, Copper, Iron, Lead, Nickel, Thallium, Zinc)
INSTRUCTIONS TO PARTICIPANTS
**Please record (on the Results Sheet) the approximat e temperature of the samples upon receipt**
Please note the following before commencing the analysis of the samples.
Sample Information
One sealed vial labelled R179 supplied by Environmental Resource Associates (ERA). The vial contains approximately 14mL of
Please note the temperature of vial on receipt.
The sample has been acidified with approximately 2% (v/v) nitric acid.The sample must be thoroughly mixed prior to analysis.
The vial will require dilution in deionised water
The vial may be stored at room temperature.
Where possible, the proficiency testing sample should be treated as a routine laboratory sample.
Sample Preparation
Analysis must begin immediately after vial is opened
Prepare sample at 20-22ºC, and allow sufficient time for the vial to reach room temperature before opening.
Please read the Caution notes below before this step
Add approximately 100concentrated nitric acid to a 500mL volumetric flask.
Mix the vial prior to opening.
Using a dry, clean volumetric pipette, transfer 5.0mL from the vial into the flask.Dilute the flask to the final volume with deionised water.
Stopper and mix by inversion.
Immediately analyse the diluted sample by your normal procedures.Report your results as µg/L for the diluted sample.
Caution must be taken when analysing corrosive samples.While technically it is unnecessary to digest the sample prior to analysis, performed if this is your normal procedure.
A volume of acid different from the 2order to matrix match calibration standards or meet any other method criteria.If analysing using colorimetric techniques, it may be necessary to pH adjust the sample prior to analysis. If using colorimetric techniques, it is acceptable to omit the addition of the 2nitric acid suggested in step (iii)
PROFICIENCY TESTING AUSTRALIAWATERS PROFICIENCY
CHEMICAL ANALYSIS ROUND 179 Metals (Chromium, Copper, Iron, Lead, Nickel, Thallium, Zinc)
INSTRUCTIONS TO PARTICIPANTS
**Please record (on the Results Sheet) the approximat e temperature of the samples upon receipt**
Please note the following before commencing the analysis of the samples.
One sealed vial labelled R179 supplied by Environmental Resource Associates (ERA). The vial contains approximately 14mL of
Please note the temperature of vial on receipt.
The sample has been acidified with approximately 2% (v/v) nitric acid.The sample must be thoroughly mixed prior to analysis.
The vial will require dilution in deionised water
The vial may be stored at room temperature.
Where possible, the proficiency testing sample should be treated as a routine
Analysis must begin immediately after vial is opened
22ºC, and allow sufficient time for the vial to reach room temperature
Please read the Caution notes below before this step
Add approximately 100-200mL deionised water followed by 2tric acid to a 500mL volumetric flask.
Mix the vial prior to opening.
Using a dry, clean volumetric pipette, transfer 5.0mL from the vial into the flask.Dilute the flask to the final volume with deionised water.
Stopper and mix by inversion.
analyse the diluted sample by your normal procedures.Report your results as µg/L for the diluted sample.
Caution must be taken when analysing corrosive samples.While technically it is unnecessary to digest the sample prior to analysis, performed if this is your normal procedure.
A volume of acid different from the 2-order to matrix match calibration standards or meet any other method criteria.
ng colorimetric techniques, it may be necessary to pH adjust the sample prior to analysis. If using colorimetric techniques, it is acceptable to omit the addition of the 2
step (iii) .
C1
PROFICIENCY TESTING AUSTRALIAWATERS PROFICIENCY TESTING PROGRAM
Metals (Chromium, Copper, Iron, Lead, Nickel, Thallium, Zinc)
INSTRUCTIONS TO PARTICIPANTS
**Please record (on the Results Sheet) the approximat e temperature of the samples upon receipt**
Please note the following before commencing the analysis of the samples.
One sealed vial labelled R179 supplied by Environmental Resource Associates (ERA). The vial contains approximately 14mL of artificial waste water concentrate.
Please note the temperature of vial on receipt.
The sample has been acidified with approximately 2% (v/v) nitric acid.The sample must be thoroughly mixed prior to analysis.
The vial will require dilution in deionised water (please follow the
The vial may be stored at room temperature.
Where possible, the proficiency testing sample should be treated as a routine
Analysis must begin immediately after vial is opened
22ºC, and allow sufficient time for the vial to reach room temperature
Please read the Caution notes below before this step
200mL deionised water followed by 2tric acid to a 500mL volumetric flask.
Using a dry, clean volumetric pipette, transfer 5.0mL from the vial into the flask.Dilute the flask to the final volume with deionised water.
analyse the diluted sample by your normal procedures.Report your results as µg/L for the diluted sample.
Caution must be taken when analysing corrosive samples.While technically it is unnecessary to digest the sample prior to analysis, performed if this is your normal procedure.
-5mL of nitric acidorder to matrix match calibration standards or meet any other method criteria.
ng colorimetric techniques, it may be necessary to pH adjust the sample prior to analysis. If using colorimetric techniques, it is acceptable to omit the addition of the 2
PROFICIENCY TESTING AUSTRALIATESTING PROGRAM
Metals (Chromium, Copper, Iron, Lead, Nickel, Thallium, Zinc)
INSTRUCTIONS TO PARTICIPANTS
**Please record (on the Results Sheet) the approximat e temperature of the samples upon receipt**
Please note the following before commencing the analysis of the samples.
One sealed vial labelled R179 supplied by Environmental Resource Associates (ERA). The artificial waste water concentrate.
The sample has been acidified with approximately 2% (v/v) nitric acid.The sample must be thoroughly mixed prior to analysis.
(please follow the
Where possible, the proficiency testing sample should be treated as a routine
Analysis must begin immediately after vial is opened.
22ºC, and allow sufficient time for the vial to reach room temperature
Please read the Caution notes below before this step
200mL deionised water followed by 2tric acid to a 500mL volumetric flask.
Using a dry, clean volumetric pipette, transfer 5.0mL from the vial into the flask.Dilute the flask to the final volume with deionised water.
analyse the diluted sample by your normal procedures.Report your results as µg/L for the diluted sample.
Caution must be taken when analysing corrosive samples.While technically it is unnecessary to digest the sample prior to analysis,
nitric acid suggested in order to matrix match calibration standards or meet any other method criteria.
ng colorimetric techniques, it may be necessary to pH adjust the sample prior to analysis. If using colorimetric techniques, it is acceptable to omit the addition of the 2
PROFICIENCY TESTING AUSTRALIA TESTING PROGRAM
INSTRUCTIONS TO PARTICIPANTS
**Please record (on the Results Sheet) the approximat e temperature of the samples upon receipt**
Please note the following before commencing the analysis of the samples.
One sealed vial labelled R179 supplied by Environmental Resource Associates (ERA). The artificial waste water concentrate.
The sample has been acidified with approximately 2% (v/v) nitric acid.
(please follow the Sample Prepar
Where possible, the proficiency testing sample should be treated as a routine
22ºC, and allow sufficient time for the vial to reach room temperature
200mL deionised water followed by 2-5mL of high purity,
Using a dry, clean volumetric pipette, transfer 5.0mL from the vial into the flask.
analyse the diluted sample by your normal procedures.
Caution must be taken when analysing corrosive samples. While technically it is unnecessary to digest the sample prior to analysis,
suggested in step (iii)order to matrix match calibration standards or meet any other method criteria.
ng colorimetric techniques, it may be necessary to pH adjust the sample prior to analysis. If using colorimetric techniques, it is acceptable to omit the addition of the 2
APRIL, 2015
**Please record (on the Results Sheet) the approximat e temperature of the samples upon receipt**
One sealed vial labelled R179 supplied by Environmental Resource Associates (ERA). The
Sample Prepar ation
Where possible, the proficiency testing sample should be treated as a routine
22ºC, and allow sufficient time for the vial to reach room temperature
5mL of high purity,
Using a dry, clean volumetric pipette, transfer 5.0mL from the vial into the flask.
While technically it is unnecessary to digest the sample prior to analysis, digestion should be
step (iii) may be added in order to matrix match calibration standards or meet any other method criteria.
ng colorimetric techniques, it may be necessary to pH adjust the sample prior to analysis. If using colorimetric techniques, it is acceptable to omit the addition of the 2
APRIL, 2015
**Please record (on the Results Sheet) the approximat e temperature of the samples upon receipt**
One sealed vial labelled R179 supplied by Environmental Resource Associates (ERA). The
ation steps
Where possible, the proficiency testing sample should be treated as a routine
22ºC, and allow sufficient time for the vial to reach room temperature
5mL of high purity,
digestion should be
may be added in
ng colorimetric techniques, it may be necessary to pH adjust the sample prior to analysis. If using colorimetric techniques, it is acceptable to omit the addition of the 2-5mL
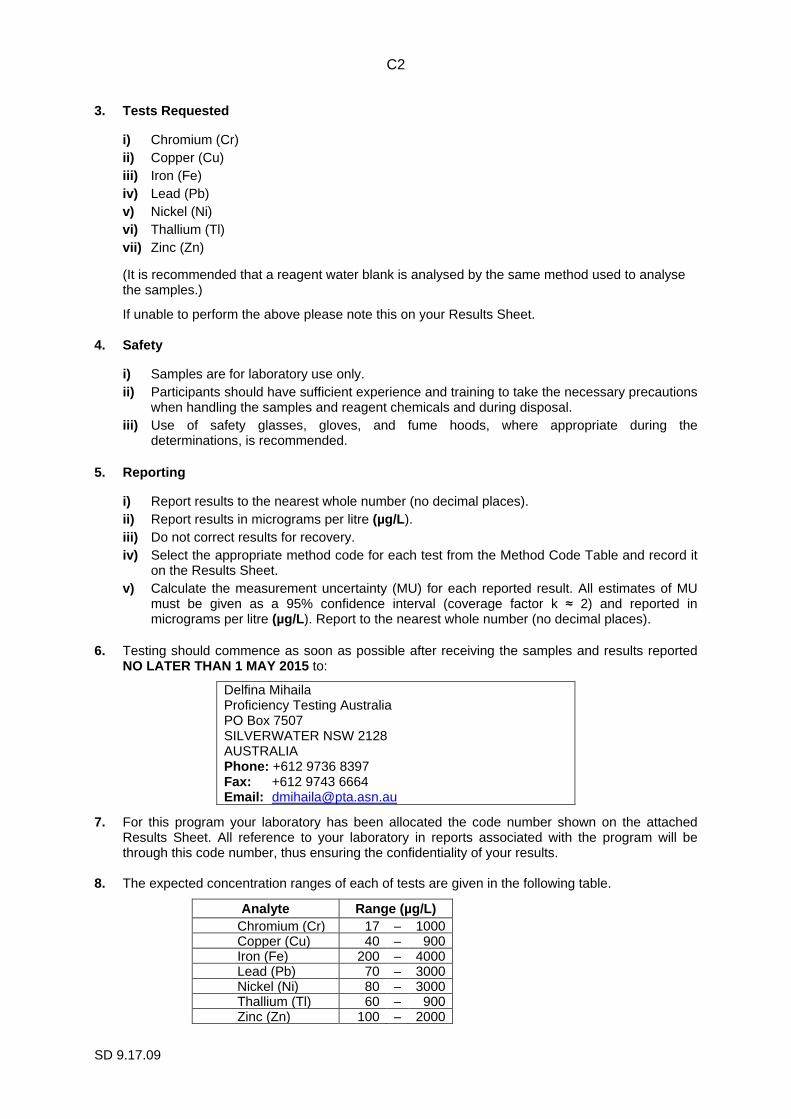
C2
SD 9.17.09
3. Tests Requested
i) Chromium (Cr) ii) Copper (Cu) iii) Iron (Fe) iv) Lead (Pb) v) Nickel (Ni) vi) Thallium (Tl) vii) Zinc (Zn)
(It is recommended that a reagent water blank is analysed by the same method used to analyse the samples.)
If unable to perform the above please note this on your Results Sheet.
4. Safety
i) Samples are for laboratory use only. ii) Participants should have sufficient experience and training to take the necessary precautions
when handling the samples and reagent chemicals and during disposal. iii) Use of safety glasses, gloves, and fume hoods, where appropriate during the
determinations, is recommended. 5. Reporting
i) Report results to the nearest whole number (no decimal places). ii) Report results in micrograms per litre (µg/L ). iii) Do not correct results for recovery. iv) Select the appropriate method code for each test from the Method Code Table and record it
on the Results Sheet. v) Calculate the measurement uncertainty (MU) for each reported result. All estimates of MU
must be given as a 95% confidence interval (coverage factor k ≈ 2) and reported in micrograms per litre (µg/L ). Report to the nearest whole number (no decimal places).
6. Testing should commence as soon as possible after receiving the samples and results reported
NO LATER THAN 1 MAY 2015 to:
Delfina Mihaila Proficiency Testing Australia PO Box 7507 SILVERWATER NSW 2128 AUSTRALIA Phone: +612 9736 8397 Fax: +612 9743 6664 Email: [email protected]
7. For this program your laboratory has been allocated the code number shown on the attached Results Sheet. All reference to your laboratory in reports associated with the program will be through this code number, thus ensuring the confidentiality of your results.
8. The expected concentration ranges of each of tests are given in the following table.
Analyte Range (µg/L) Chromium (Cr) 17 – 1000 Copper (Cu) 40 – 900 Iron (Fe) 200 – 4000 Lead (Pb) 70 – 3000 Nickel (Ni) 80 – 3000 Thallium (Tl) 60 – 900 Zinc (Zn) 100 – 2000
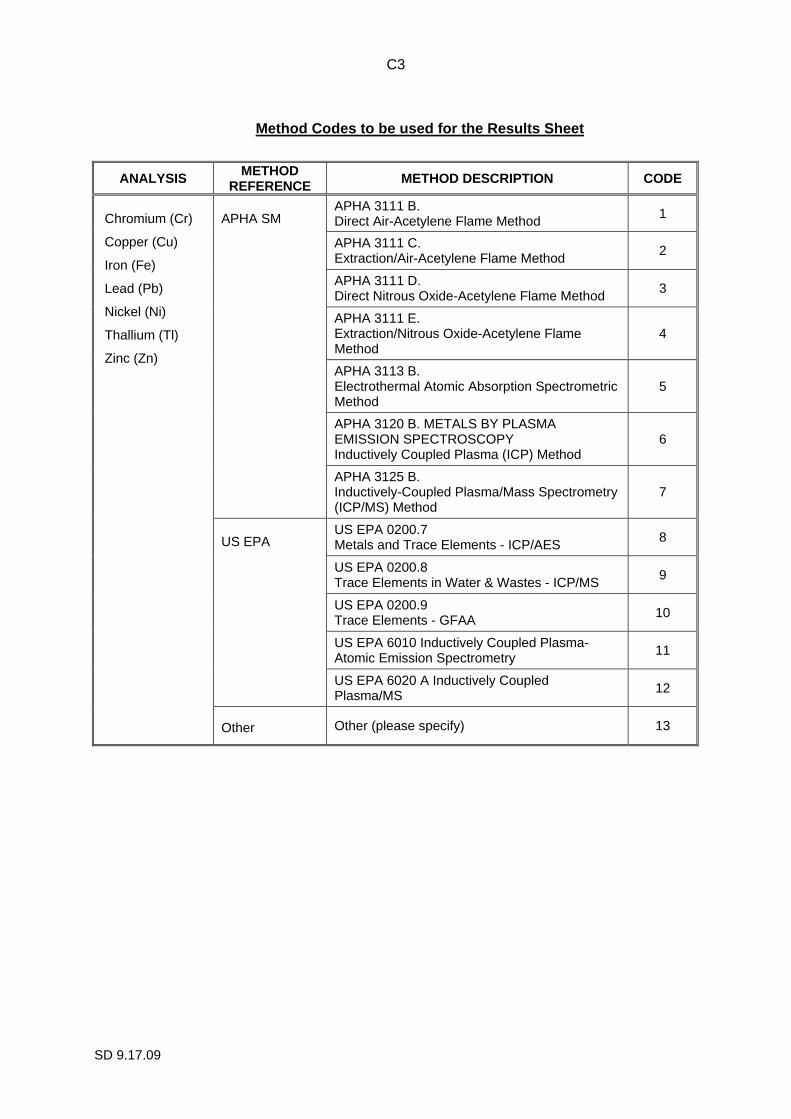
C3
SD 9.17.09
Method Codes to be used for the Results Sheet
ANALYSIS METHOD REFERENCE METHOD DESCRIPTION CODE
Chromium (Cr)
Copper (Cu)
Iron (Fe)
Lead (Pb)
Nickel (Ni)
Thallium (Tl)
Zinc (Zn)
APHA SM
APHA 3111 B. Direct Air-Acetylene Flame Method 1
APHA 3111 C. Extraction/Air-Acetylene Flame Method 2
APHA 3111 D. Direct Nitrous Oxide-Acetylene Flame Method 3
APHA 3111 E. Extraction/Nitrous Oxide-Acetylene Flame Method
4
APHA 3113 B. Electrothermal Atomic Absorption Spectrometric Method
5
APHA 3120 B. METALS BY PLASMA EMISSION SPECTROSCOPY Inductively Coupled Plasma (ICP) Method
6
APHA 3125 B. Inductively-Coupled Plasma/Mass Spectrometry (ICP/MS) Method
7
US EPA
US EPA 0200.7 Metals and Trace Elements - ICP/AES 8
US EPA 0200.8 Trace Elements in Water & Wastes - ICP/MS 9
US EPA 0200.9 Trace Elements - GFAA 10
US EPA 6010 Inductively Coupled Plasma-Atomic Emission Spectrometry 11
US EPA 6020 A Inductively Coupled Plasma/MS 12
Other Other (please specify) 13
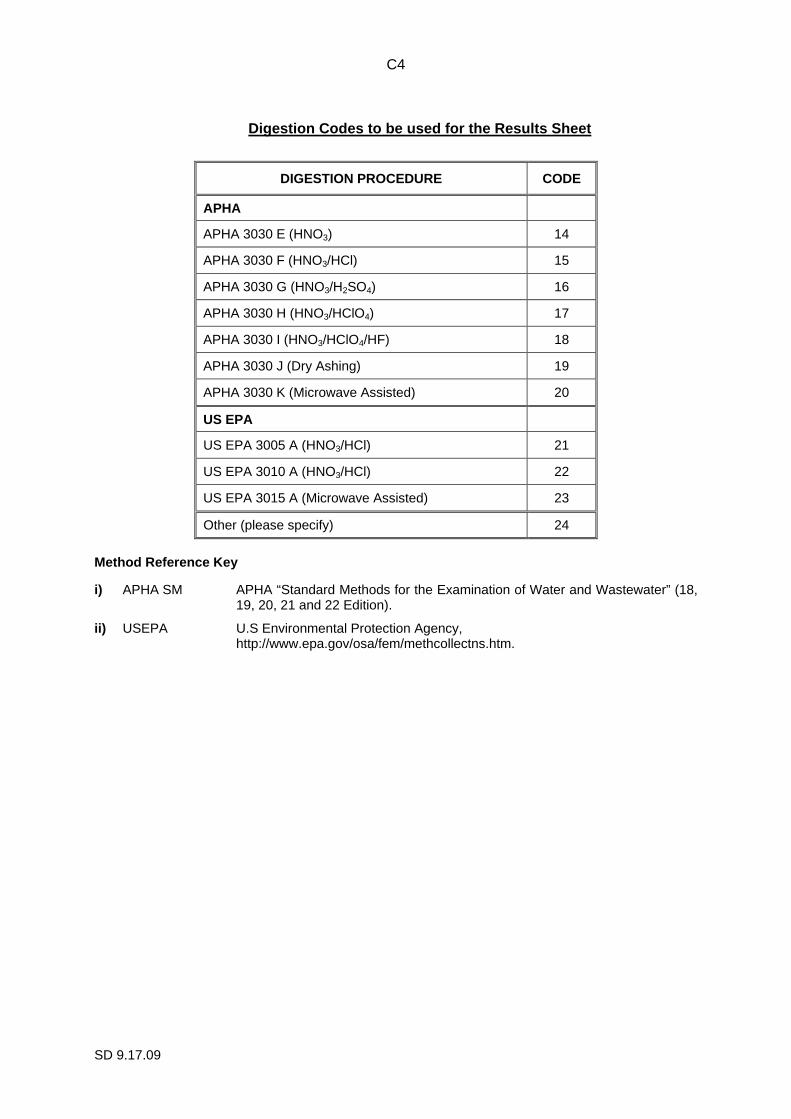
C4
SD 9.17.09
Digestion Codes to be used for the Results Sheet
DIGESTION PROCEDURE CODE
APHA
APHA 3030 E (HNO3) 14
APHA 3030 F (HNO3/HCl) 15
APHA 3030 G (HNO3/H2SO4) 16
APHA 3030 H (HNO3/HClO4) 17
APHA 3030 I (HNO3/HClO4/HF) 18
APHA 3030 J (Dry Ashing) 19
APHA 3030 K (Microwave Assisted) 20
US EPA
US EPA 3005 A (HNO3/HCl) 21
US EPA 3010 A (HNO3/HCl) 22
US EPA 3015 A (Microwave Assisted) 23
Other (please specify) 24
Method Reference Key
i) APHA SM APHA “Standard Methods for the Examination of Water and Wastewater” (18,
19, 20, 21 and 22 Edition).
ii) USEPA U.S Environmental Protection Agency, http://www.epa.gov/osa/fem/methcollectns.htm.
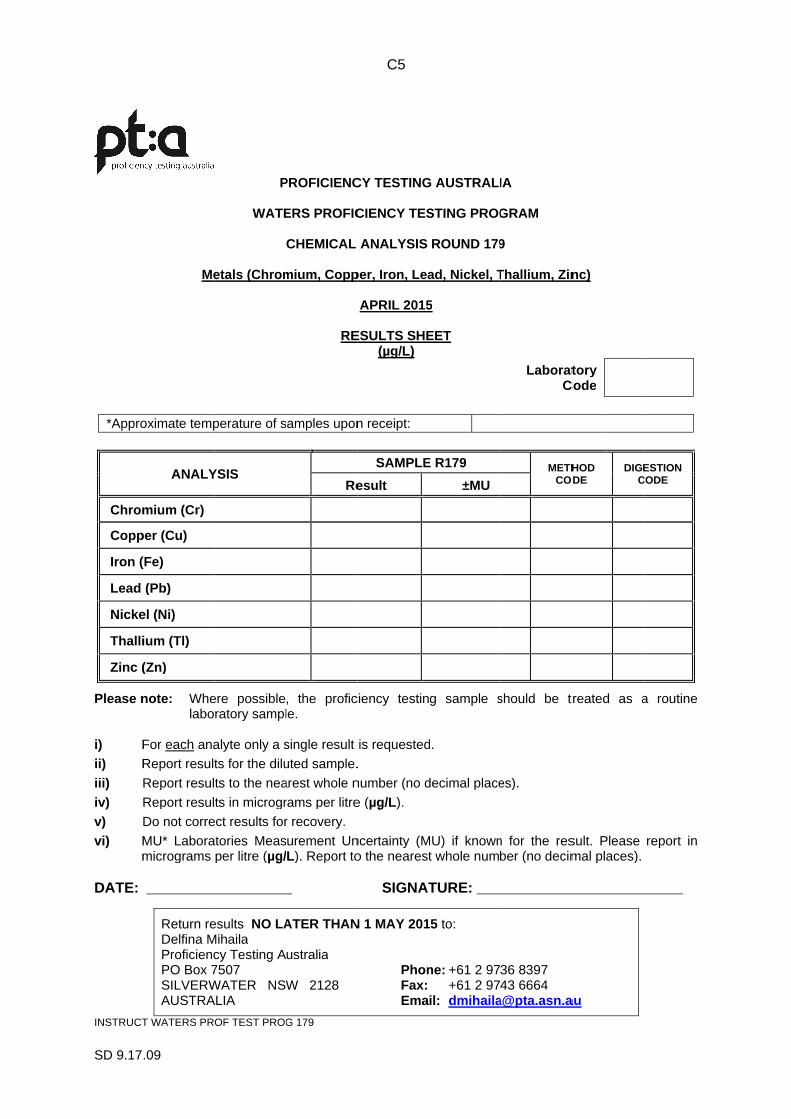
SD 9.17.09
*Approximate temperature of samples upon receipt:
Chromium
Copper (Cu)
Iron (Fe)
Lead (Pb)
Nickel (Ni)
Thallium (Tl)
Zinc (Zn)
Please note:
i) For ii) Report results for the diluted sample.
iii) Report results to the nearest whole number
iv) Report results in micrograms per litre (v) Do not correct results for recovery.
vi) MU* Laboratmicrograms per litre (
DATE:
INSTRUCT WATERS PROF TEST PROG 179
SD 9.17.09
Metals (Chromium, Copper, Iron, Lead, Nickel, Thallium, Zinc)
*Approximate temperature of samples upon receipt:
ANALYSIS
Chromium (Cr)
Copper (Cu)
Iron (Fe)
Lead (Pb)
Nickel (Ni)
Thallium (Tl)
Zinc (Zn)
Please note: Where possible, the proficiency testing sample should be treated as a routine laboratory sample.
For each analyteReport results for the diluted sample.
Report results to the nearest whole number
Report results in micrograms per litre (Do not correct results for recovery.
MU* Laboratmicrograms per litre (
DATE: ______________________
Return results Delfina MihailaProficiency Testing AustraliaPO Box 7507 SILVERWATER NSW 2128 AUSTRALIA
INSTRUCT WATERS PROF TEST PROG 179
PROFICIENCY TESTING AUSTRALIA
WATERS PROFICIENCY TESTING PROGRAM
Metals (Chromium, Copper, Iron, Lead, Nickel, Thallium, Zinc)
*Approximate temperature of samples upon receipt:
ANALYSIS
Where possible, the proficiency testing sample should be treated as a routine laboratory sample.
analyte only a single result is requested.Report results for the diluted sample.
Report results to the nearest whole number
Report results in micrograms per litre (Do not correct results for recovery.
MU* Laboratories Measurement Uncertainty (MU) if known for the result. Please report in micrograms per litre (µg /L
______________________
Return results NO LATER THAN 1 MAY 2015 Delfina Mihaila Proficiency Testing AustraliaPO Box 7507 SILVERWATER NSW 2128 AUSTRALIA
INSTRUCT WATERS PROF TEST PROG 179
PROFICIENCY TESTING AUSTRALIA
WATERS PROFICIENCY TESTING PROGRAM
CHEMICAL ANALYSIS ROUND 179
Metals (Chromium, Copper, Iron, Lead, Nickel, Thallium, Zinc)
RESULTS SHEET
*Approximate temperature of samples upon receipt:
Result
Where possible, the proficiency testing sample should be treated as a routine laboratory sample.
only a single result is requested.Report results for the diluted sample.
Report results to the nearest whole number
Report results in micrograms per litre (Do not correct results for recovery.
ories Measurement Uncertainty (MU) if known for the result. Please report in /L). Report to the nearest whole number
______________________
NO LATER THAN 1 MAY 2015
Proficiency Testing Australia PO Box 7507 SILVERWATER NSW 2128
INSTRUCT WATERS PROF TEST PROG 179
C5
PROFICIENCY TESTING AUSTRALIA
WATERS PROFICIENCY TESTING PROGRAM
CHEMICAL ANALYSIS ROUND 179
Metals (Chromium, Copper, Iron, Lead, Nickel, Thallium, Zinc)
APRIL 2015
RESULTS SHEET(µg/L)
*Approximate temperature of samples upon receipt:
SAMPLE R179
Result
Where possible, the proficiency testing sample should be treated as a routine
only a single result is requested.Report results for the diluted sample.
Report results to the nearest whole number (no decimal places).
Report results in micrograms per litre (µg /L).
ories Measurement Uncertainty (MU) if known for the result. Please report in ). Report to the nearest whole number
SIGNATURE:
NO LATER THAN 1 MAY 2015
PO Box 7507 Phone:SILVERWATER NSW 2128 Fax:
Email:
PROFICIENCY TESTING AUSTRALIA
WATERS PROFICIENCY TESTING PROGRAM
CHEMICAL ANALYSIS ROUND 179
Metals (Chromium, Copper, Iron, Lead, Nickel, Thallium, Zinc)
APRIL 2015
RESULTS SHEET
SAMPLE R179
±MU
Where possible, the proficiency testing sample should be treated as a routine
only a single result is requested.
(no decimal places).
ories Measurement Uncertainty (MU) if known for the result. Please report in ). Report to the nearest whole number
SIGNATURE: _______________________________
NO LATER THAN 1 MAY 2015 to:
Phone: +61 2 9736 8397 +61 2 9743 6664
Email: [email protected]
PROFICIENCY TESTING AUSTRALIA
WATERS PROFICIENCY TESTING PROGRAM
CHEMICAL ANALYSIS ROUND 179
Metals (Chromium, Copper, Iron, Lead, Nickel, Thallium, Zinc)
Laboratory Code
METHODCODE
Where possible, the proficiency testing sample should be treated as a routine
(no decimal places).
ories Measurement Uncertainty (MU) if known for the result. Please report in ). Report to the nearest whole number (no decimal places).
_______________________________
+61 2 9736 8397 +61 2 9743 6664 [email protected]
Metals (Chromium, Copper, Iron, Lead, Nickel, Thallium, Zinc)
Laboratory Code
METHOD CODE
DIGESTIONCODE
Where possible, the proficiency testing sample should be treated as a routine
ories Measurement Uncertainty (MU) if known for the result. Please report in (no decimal places).
_______________________________
DIGESTION CODE
Where possible, the proficiency testing sample should be treated as a routine
ories Measurement Uncertainty (MU) if known for the result. Please report in
_______________________________
SD 9.17.09
- End of Report -
Recommended


![Union Calendar No. 179 CONGRESS S H. R. 823IB Union Calendar No. 179 116TH CONGRESS 1ST SESSION H. R. 823 [Report No. 116–226] To provide for the designation of certain wilderness](https://img.pdfslide.us/doc/110x75/5e7e3e6162d0e80f511f76ad/union-calendar-no-179-congress-s-h-r-823-ib-union-calendar-no-179-116th-congress.jpg)